Article

CO2 Reduction Potential from Efficiency Improvements in China’s Coal-Fired Thermal Power Generation: A Combined Approach of Metafrontier DEA and LMDI

Faculty of Economics, Fukuoka University, Fukuoka 814-0180, Japan
Energies 2022, 15(7), 2430; https://doi.org/10.3390/en15072430
Submission received: 9 March 2022 / Revised: 23 March 2022 / Accepted: 24 March 2022 / Published: 25 March 2022
(This article belongs to the Special Issue Advances in Low Carbon Technologies and Transition Ⅱ)

Abstract

:
Among the G20 countries, China is the only country to experience an increase in electricity generation from coal-fired thermal power plants from 2019 to 2020. This study aims to develop an analytical framework combining metafrontier data envelopment analysis with the logarithmic mean Divisia index for a detailed decomposition analysis of ‘mass-based’ energy-related CO2 reduction potential through efficiency improvements in coal-fired thermal power plants in China. The results show that inefficiency in power generation can be largely attributed to differences in the location of power plants and the production scale. Moreover, the impact of regional heterogeneity on the changes in power generation efficiency is more notable for the small–medium power plants in the northeast region than the large power plants in the western region in China. However, when focusing on the mass-based CO2 reduction potential associated with the regional heterogeneity, its positive effects in the western region for the large power plants are 6.2 times larger than that in the northeast region for the small–medium power plants. These results imply that an analysis that focuses only on the efficiency score would ignore the production scale of coal-fired thermal power plants and thus would fail to properly evaluate the environmental impacts associated with efficiency changes.

1. Introduction

Global energy-related CO2 emissions were estimated to be 31.5 Gt in 2020, declining by 5.8% from 2019, the largest annual percentage drop since World War II [1]. This substantial decline was primarily the result of the COVID-19 pandemic. Most major global emissions were reduced due to economic stagnation; however, in China, the world’s largest CO2 emitter, CO2 emissions increased by 1.7% from 2019 to 2020 [2], largely from the earlier economic recovery of China compared to other countries. Further, China’s electricity generation from coal-fired thermal power plants (CTPPs) increased by ~2% from 2019 to 2020 [3], the only country among the G20 with such an increase over this period.
China’s high coal dependence originates from its abundant domestic resources. Coal production in China was 3690 Mt in 2020, accounting for ≤49.6% of global coal production [4]. On the other hand, the electric power and heat supply sector accounted for ~44% of the total coal consumption in China in 2016 [5]. In recent years, however, China has been rapidly increasing its renewable energy sector, and by the end of 2018, it maintained a renewable energy capacity of 728 GW, ~38% of the country’s total [6]. This accelerated expansion of renewable energy has led to a deficit of CTPPs in China due to their shortened operation hours. To address this problem, in 2017, the government began to reduce the overcapacity of CTPPs and suspended the construction of 104 power plants [7].
In spite of this increase in renewable energy sources over the past few years, the government has reinitiated the promotion of new CTPPs construction to help bolster economic recovery from the COVID-19 pandemic, as the cost of coal power generation is relatively low, and its supply capacity is more stable compared to renewable energy sources. Accordingly, 38.4 GW of newly constructed coal-fired power plants in China were installed in 2020 [8], with a purported addition of 247 GW of coal power capacity under development [9]. Thus, to effectively reduce CO2 emissions, it will be important for the Chinese government to increase the installation capacity of renewable energy sources while simultaneously scrapping existing CTPPs with out-of-date facilities and improving the power generation efficiency of existing CTPPs over the short and medium-term.
Thus far, most previous studies have investigated the power generation efficiency of CTPPs using provincial-level datasets owing to data limitations [10]; however, Yang and Pollitt [11], one of the few previous studies that analyzed the plant-level power generation efficiency of CTPPs, evaluated the environmental efficiency of 221 plants across China in 2002, focusing on SO2 emissions using a data envelopment analysis (DEA). First developed by Charnes et al. [12], DEA is an analytical method for measuring the performance of decision-making units (DMUs) based on the notion of frontier analysis. DEA is a nonparametric method that does not require any assumptions regarding production function type in advance, where the efficiency score for each DMU can be calculated by measuring the relative distance between a DMU and the production possibility frontier, while simultaneously considering multiple inputs and outputs, including both those that are desirable and undesirable [12,13]. Accordingly, DEA has been utilized within the fields of energy and environmental efficiency analyses, yielding results that maintain important implications for addressing corresponding issues [14,15]. Alternatively, stochastic frontier analysis (SFA) is another popular parametric frontier analysis method. In previous studies focused on thermal power plants in China, SFA has been used to evaluate power generation efficiency, as well as calculate the marginal abatement costs of undesirable outputs, such as CO2 and SOx [16,17].
China’s vast size, in combination with the huge spatial disparity in resource endowment and economic development, has directed research toward investigating the regional efficiency gap and its sources via DEAs over recent years [18,19,20]. Yang and Pollitt [21] and Zhang et al. [22] are representative studies that focus on the power generation efficiency of China’s CTPPs using DEA; however, most previous studies, including the two mentioned, do not explore power generation efficiency disparities that results from regional heterogeneity, such as resource endowment and economic development (see also [10,23,24,25,26,27]). Notably, few previous studies evaluate the power generation efficiency of China’s CTPPs with respect to CO2 emissions as a function of coal consumption or how any corresponding plant-level improvements in efficiency would contribute quantitatively to the national Chinese government’s CO2 reduction targets [28]. With these research goals in mind, the present study first quantified the impacts of regional heterogeneity on CTPP power generation efficiency by applying a DEA framework to plant-level data in China. Second, this study further estimated the CO2 reduction potential associated with a reduced coal consumption of CTPPs generated through efficiency improvements. Takayabu et al. [29] and Takayabu [30] point out that focusing only on the efficiency score would ignore the production scale of decision-making units and fail to properly evaluate the environmental impacts associated with efficiency changes. Thus, the present study proposes a detailed analytical framework and focuses on the power generation activities of CTPPs in China.

2. Literature Review

Wang et al. [26] investigated the regional disparity in the power generation efficiency of CTPPs in China, using DEA for assessing the dynamics of coal intensity from 389 power plants in China between 2009 and 2012. The conclusions were that power plants in central China would see the largest levels of improvement, with smaller power plants achieving greater improvements in coal intensity throughout the study period. This research, however, only revealed an ‘average’ effect of regional heterogeneity in addition to differences in production scale on coal intensity, as the DEA framework employed assumed sole frontier technology; thus, the individual and plant-level effects were not quantified.
Nakaishi et al. [28] identified the influential factors of power generation efficiency in thermal power plants using a combined analysis framework of DEA and Tobit models. The authors regarded the DEA efficiency scores as an independent variable, whereas operating rate, capacity utilization rate, production scale, and location of the power plants were considered as explanatory variables. It was found that an increase in operating hours and capacity utilization rate positively affected the efficiency score, and power plants with larger production scales, as well as those located in the eastern region of China, showed greater efficiency; however, these results also only found an average relationship between power generation efficiency and influencing factors.
Originally, DEA was advantageous in that it could calculate individual efficiency scores for each DMU, providing effective strategies for efficiency improvements based on, for example, efficiency scores and reference sets [12,13]. Metafrontier DEA (MDEA), first proposed by O’Donell et al. [31], is a useful method for identifying influential factors of efficiency by exploiting the advantages of DEA. In the MDEA framework, the technology gap between frontiers was quantified, and components of the efficiency score were visualized by measuring the distance between the metafrontier (consisting of all the technologies of DMUs) and group frontiers distinguished by features such as region and company group.
Wang et al. [19], Du et al. [32], and Zhang et al. [20] are seminal studies in this field investigating provincial-level energy and environmental efficiency in China according to MDEA frameworks. All DMUs (i.e., provinces) were divided into east, central, and west regional groups, and the energy and environmental efficiencies were investigated considering regional heterogeneity. Furthermore, Feng et al. [18] and Sun et al. [33] proposed multi-hierarchical MDEA models and evaluated the impacts of differences in industrial structure, time-series factors, and regional heterogeneity on efficiency.
Few studies, however, have investigated regional heterogeneity at the plant level for CTPPs in China. Zhang and Choi [34] evaluated the change in power generation efficiency of CTPPs from 2005 to 2010 using an MDEA model, although their 93-power plant sample size divided into central and local regional groups was limited. Long et al. [35] utilized the data of 192 plants located across the Yangtze River Delta of China, examining the environmental efficiency of power generation according to MDEA. The authors divided the 192 power plants into three regional groups to quantify the impacts of regional heterogeneity on environmental efficiency. The results found that technological spillover among different regions was crucial for improving environmental efficiency; however, their research area was comparatively limited.
Eguchi et al. [10] investigated the power generation efficiency of Chinese CTPPs by utilizing large-scale, national-level sample data and introducing a multi-hierarchical MDEA framework. Focusing on individual power plants by using plant-level data for electricity production, consisting of 1643 pooled CTPPs in China from 2009 to 2011, the dynamics of power generation efficiency during the study period were analyzed, and the technology gap due to regional heterogeneity and differences in production scale were explored. Although it was revealed that changes in power generation efficiency during the period were marginal, the sources of inefficient power generation varied by region and production scale. The authors further discuss the policy for scrapping CTPPs according to the components of power generation inefficiency for individual plants. Although Eguchi et al. [10] conducted a relatively detailed investigation on power generation efficiency and its components, corresponding CO2 emissions and any potential reductions through efficiency improvements associated with the power generation activity of Chinese CTPPs remained unexplored.
Elsewhere, Takayabu et al. [29] estimated the reduction potential of energy-related CO2 emissions using the efficiency score obtained by DEA for 14 metal sectors across 40 countries. The reduction potential of energy-related CO2 emissions was quantified by multiplying the inefficiency scores by energy inputs and CO2 emission factors, ultimately revealing that 354 Mt CO2 (1.4% of the global CO2 emissions) could be reduced by improving production efficiency across all of the metal sectors. The result went on to combine these efficiency scores with the logarithmic mean Divisia index (LMDI), a method of factor decomposition analysis, and proposed a research framework for identifying the factors influencing CO2 reduction potential. LMDI gives a perfect factor decomposition that does not leave any residual terms and was first developed by Ang et al. [36]. It is capable of quantitatively decomposing the influential factors controlling CO2 emissions according to economic scale, industrial structure, and energy intensity [37]. Takayabu [30] modified the LMDI framework and successfully incorporated the DEA efficiency score into the influential components of CO2 reduction potential.
The DEA efficiency score, utilized as a component of change in CO2 reduction potential by Takayabu [30], can be further decomposed using MDEA, yielding a more detailed analysis. Accordingly, the present study aimed to develop an analytical framework combining MDEA with the LMDI for a detailed decomposition analysis of energy-related CO2 reduction potential through efficiency improvements. Based on the developed analytical framework, the present study elucidated the dynamics of CO2 reduction potential resulting from the inefficiency of CTPP power generation in China, quantifying the impacts of differences in production scale, regional heterogeneity, and management gaps in plant operation on the dynamics of CO2 reduction potential, with the potential to inform policy discussions on CO2 reductions derived from CTPPs.
The rest of the paper is organized as follows: Section 3 describes the proposed MDEA and LMDI frameworks; the data used in this study are introduced in Section 4; with the results presented in Section 5. Lastly, the conclusions and policy implications are presented in Section 6.

3. Methodology

3.1. Radial DEA Model

By introducing an input-oriented radial DEA model, the power generation efficiency score θ * t in year t for DMUz was calculated according to Equation (1) [13]:
min   θ * t s . t . θ * x i z t j = 1 J x i j t λ j 0   ( i = 1 , , I ) j = 1 J y r j t λ j y r z t   ( r = 1 , , R ) j = 1 J λ j = 1 λ j   ( j = 1 , 2 , , J )   0
where x i z t and y r z t denote the input and output vectors, respectively; x i j t and y r j t denote the input and output matrices consisting of all DMUs in year t, respectively; J is the number of DMUs; I and R represent the number of inputs and outputs, respectively; λ j is the weight vector endogenously determined by solving Equation (1); θ * t is an efficiency score ranging from 0 (low efficiency) to 1 (high efficiency), interpreted as the maximum radial reduction potential of the inputs without reducing the output level; and DMUz is considered efficient when θ * t = 1 and inefficient when θ * t < 1 . j = 1 J λ j = 1 is a constraint that allows for the variable returns to scale assumption [38].
This study here considered two inputs (I = 2) and one output (R = 1): as inputs, coal consumption and capital, defined as the product of installed capacity and actual operation hours [10,39,40] were used. As an output, net electricity production, defined as the difference in the electricity consumed for the operation of power plants from gross electricity production, was considered. The research years are 2009, 2010, and 2011.
It should also be noted that the radial DEA model has several shortcomings. For example, it ignores the slack variables for inputs and outputs and may overestimate the efficiency score of DMUs [13]; however, the rationale for the present study introducing a radial model rather than a non-radial one is presented in Section 3.4.

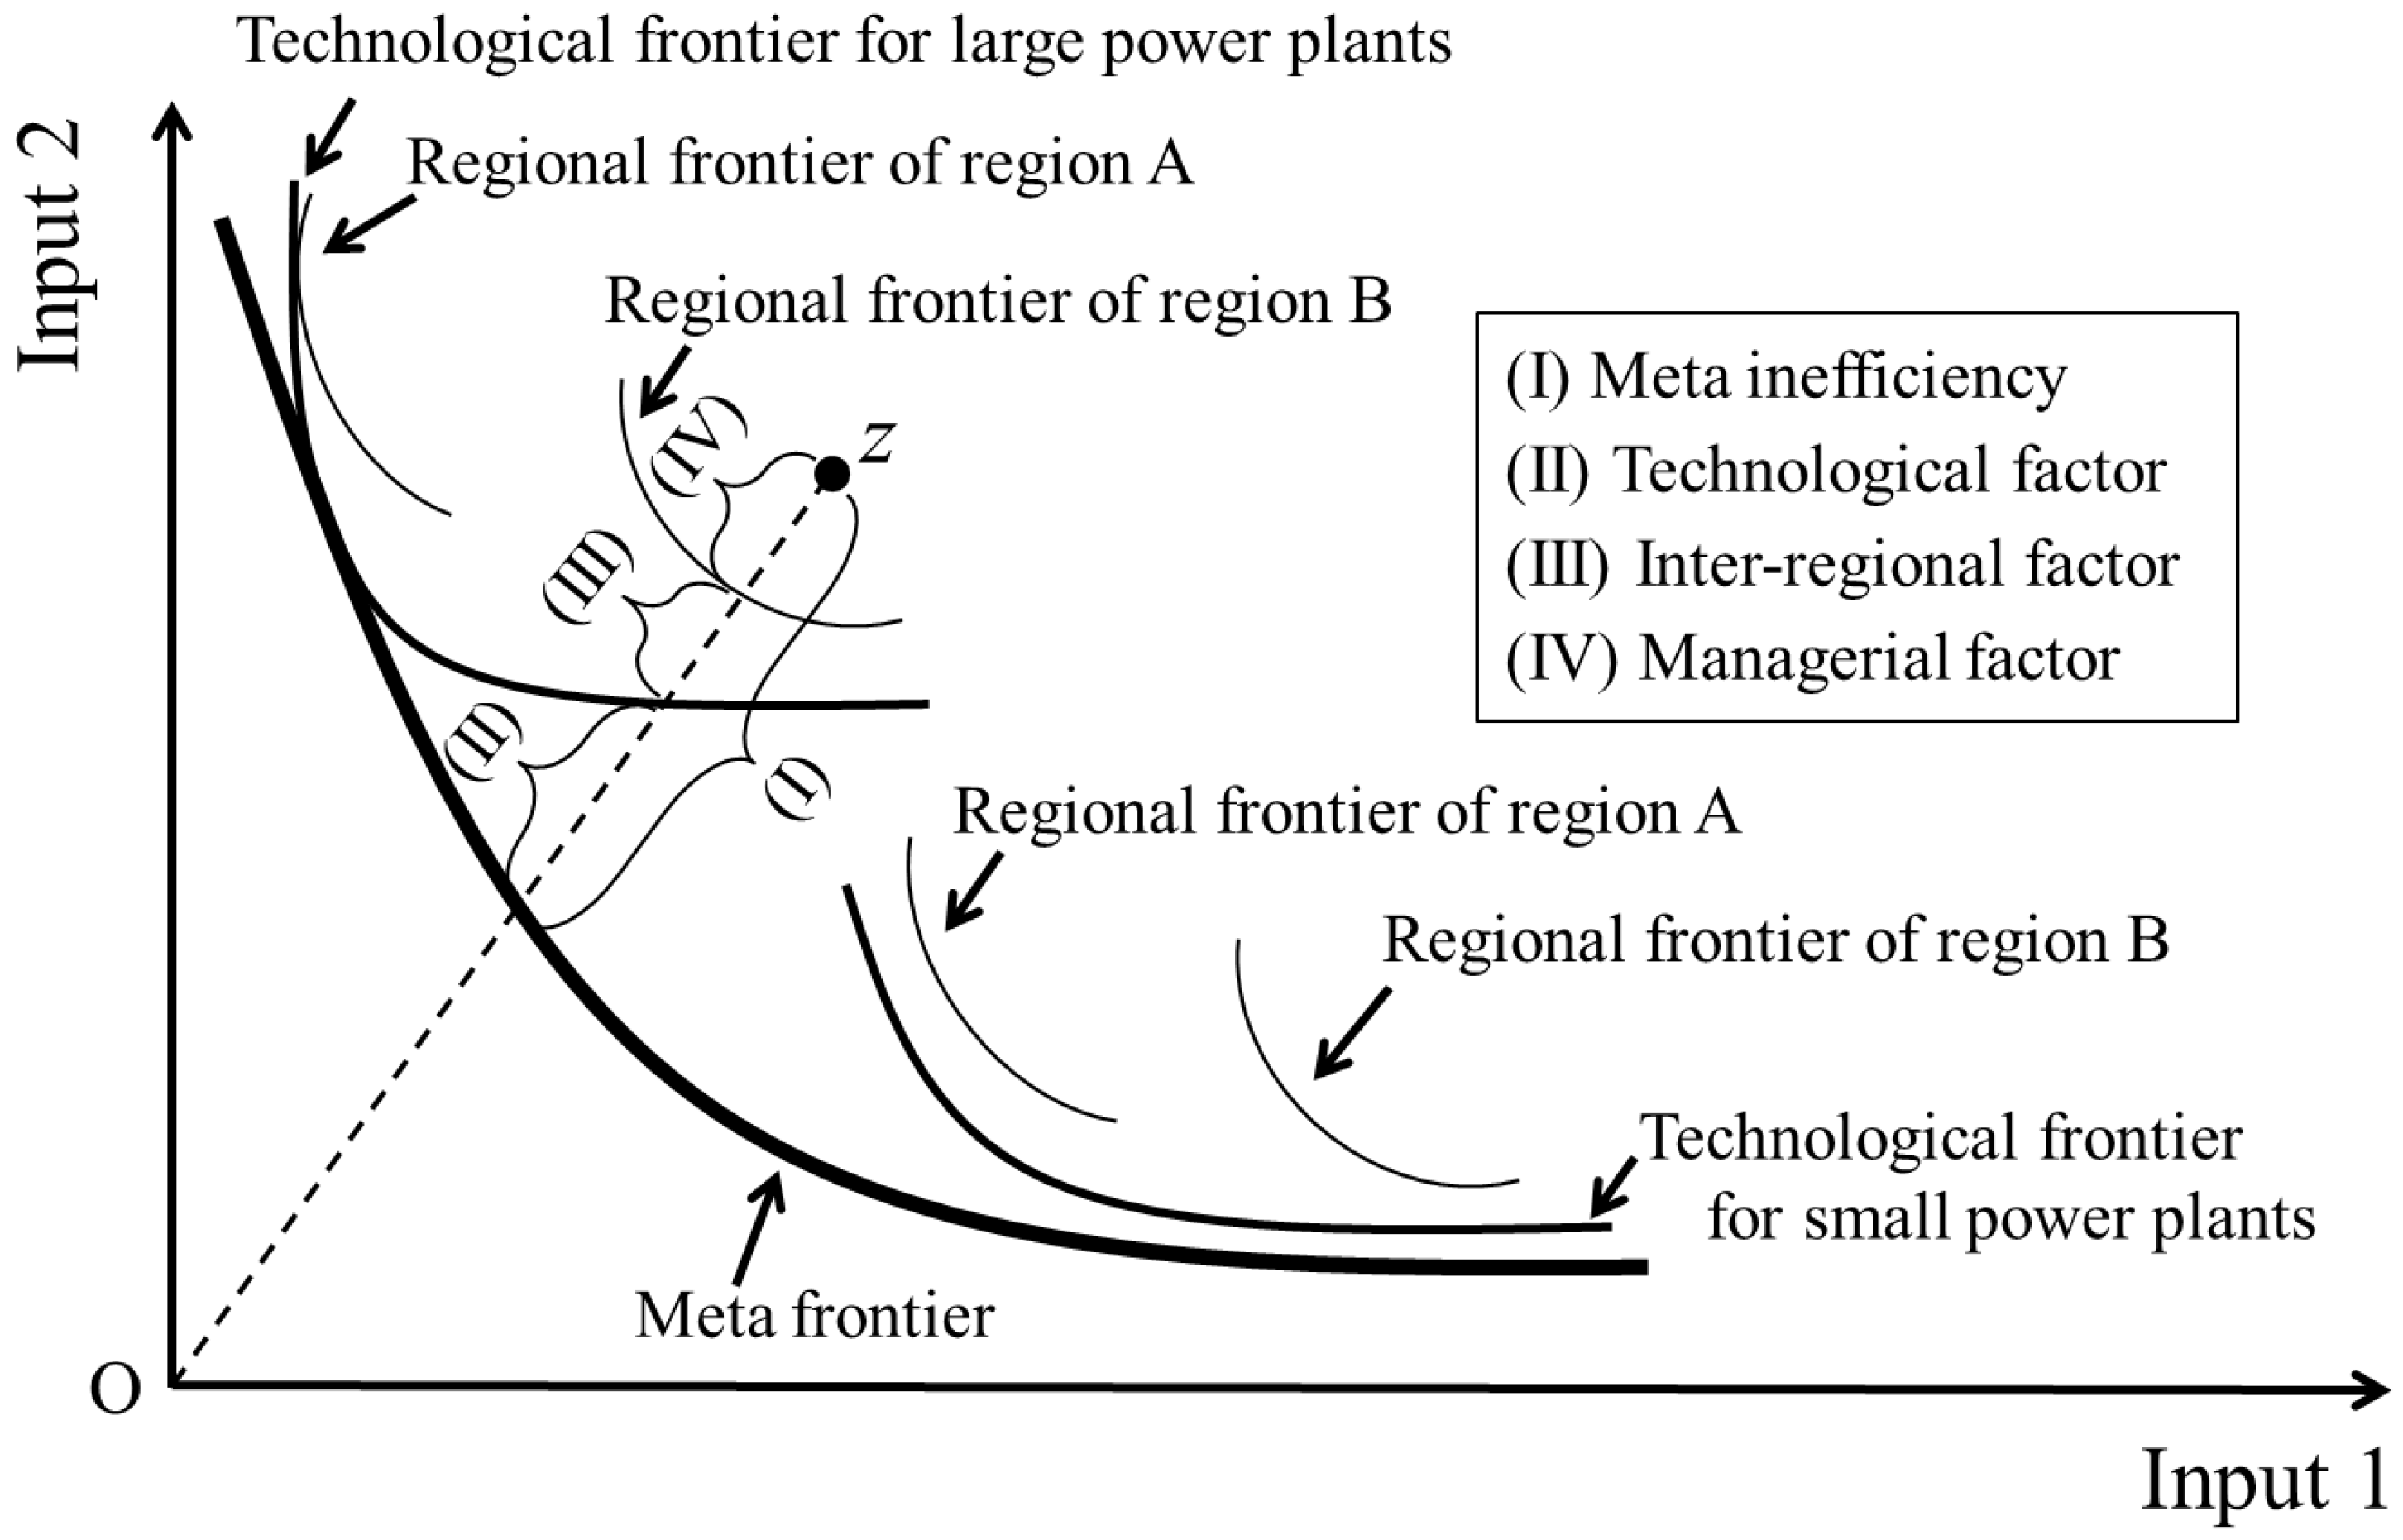
3.2. Metafrontier DEA Model

Figure 1 illustrates the conceptual multi-hierarchical MDEA framework proposed in this study. The meta-frontier consists of all DMU technologies with an efficiency score θ * t = 1 in year t. Therefore, the meta inefficiency in Figure 1 is calculated using the efficiency score θ * t , as shown in Equation (2):
M e t a   i n e f f i c i e n c y z t = 1 θ z * t
Following Eguchi et al. [10], the present study decomposed the meta inefficiency into three components: technological factor due to the differences in production scale of the power plant, inter-regional factor due to the technological disparity between regions, and managerial factor due to the gap in operation management of the power plants. Regarding technological variables, power plant equipment or age could also be considered instead of the production scale; however, this study regarded the production scale as a variable representative of technology due to data availability. We considered the inter-regional factor in this study based on Eguchi et al. [10] and Wang et al. [26], who reported that power generation efficiency and coal intensity of power plants were largely affected by their locational differences.
To calculate the technological factor resulting from the difference in the production scale of the power plants in group n (n = 1, …, N), it was assumed that a unique technological frontier existed for each group, as categorized by the production scale of the power plants. The efficiency score of DMUz in group n in year t was obtained by solving the DEA model in Equation (3):
min   θ * t , n s . t . θ * x i z t j = 1 J n x i j t λ j 0   ( i = 1 , , I ) j = 1 J n y r j t λ j y r z t   ( r = 1 , , R ) j = 1 J n λ j = 1 λ j   ( j = 1 , 2 , , J )   0
where n denotes the number of groups categorized by the production scale, and Jn denotes the number of DMUs in group n. Following Wu et al. [41], coal-fired power plants with an installed capacity >600,000 kW were categorized as LARGE, and those ≤600,000 kW were categorized as small–medium (SM); thus, N = 2. Using Equations (1) and (3), the technological factor of DMUz in group n and year t could be calculated according to Equation (4) [10,18]:
T e c h n o l o g i c a l   f a c t o r z t = θ * t , n θ * t
According to the classification of Wu et al. [26], an installed capacity between 100,000 and 600,000 kW was defined as a medium power plant, and <100,000 kW was considered a small power plant; however, maintaining all three sub-groups would have weakened the discriminatory power of DEA due to the small number of DMUs in each sub-group [42].
Next, the inter-regional factor resulting from the regional gap in power generation efficiency was calculated. This study classified the Chinese provinces into four groups (p = 4): east, central, west, and northeast. Furthermore, by measuring the distances between the technological frontier and individual regional frontiers for group n, the inter-regional factor could be calculated [10,18,20]. Using an input-oriented DEA model, the efficiency score of DMUz in region p (p = 1, …, P) for group n could be computed according to Equation (5):
min   θ * t , n , p s . t . θ * x i z t j = 1 J n , p x i j t λ j 0   ( i = 1 , , I ) j = 1 J n , p y r j t λ j y r z t   ( r = 1 , , R ) j = 1 J n , p λ j = 1 λ j   ( j = 1 , 2 , , J )   0
where Jn,p denotes the number of DMUs belonging to region p in group n. Using Equations (3) and (5), the inter-regional factor of DMUz can be calculated using Equation (6) [10]:
I n t e r - r e g i o n a l   f a c t o r z t = θ * t , n , p θ * t , n
Note that inequality θ * t   θ * t , n   θ * t , n , p always holds true because the technological frontier is a subset of the metafrontier, and the regional frontier is a subset of the technological frontier [10,18].
Lastly, the managerial factor resulting from the gap in operation management of power plants could be calculated according to Equation (7) [10]:
M a n a g e r i a l   f a c t o r z t = 1 θ * t , n , p .
The managerial factor may be further decomposed into constituent factors, such as the difference in equipment and age of power plants; however, the present study could not obtain this information. Furthermore, as mentioned above, assuming more hierarchies in the MDEA framework would lead to a weakened discriminatory power of DEA [42], and both these factors can be considered limitations of the study. In summary, the meta inefficiency of DMUz in year t was decomposed as Equation (8):
M e t a   i n e f f i c i e n c y z t = T e c h n o l o g i c a l   f a c t o r z t + I n t e r - r e g i o n a l   f a c t o r z t + M a n a g e r i a l   f a c t o r z t

3.3. Estimated CO2 Reduction Potential with Improved Efficiency

Using the meta inefficiency score ( 1 θ z * t ) obtained from Equation (2), the coal saving potential (CSP) of DMUz in year t can be defined according to Equation (9) [29,30]:
C S P z t =   ( 1 θ z * t )   ×   x c o a l , z t
where x c o a l , z t denotes the coal consumption of DMUz in year t. Thus, the CSP was interpreted as the coal saving potential when the inefficiency (i.e., meta inefficiency) related to the electricity production of DMUz was fully improved. Furthermore, if we let f be the CO2 emissions factor of coal, then the CO2 reduction potential (CRP) associated with the improved efficiency related to the electricity production of DMUz can be defined by Equation (10) [29,30]:
C R P z t =   ( 1 θ z * t )   ×   x c o a l , z t × f .
Lignite, bituminous coal, and anthracite are the major types of coal used in CTPP; however, the present study could not identify the components of coal consumed for electricity production in individual power plants. Therefore, the CO2 emissions factor of lignite (1.204 ton CO2/ton), the most common coal type for thermal power generation, was applied to all power plants [43]. In addition, as CRP is measured by the gap in efficiency between the meta-frontier and each DMU, a higher CRP indicates a larger reduction of CO2 emissions compared to the meta-frontier technology for a specific year [30].

3.4. Analysis of CRP Using the LMDI

Meta inefficiency is decomposed into three components: technological, inter-regional, and managerial factors (see Section 3.2); thus, CRP (Equation (10)) can also be transformed via Equation (11):
C R P z t =   ( θ z * t , n θ z * t )   ×   x c o a l , z t × f C R P   f o r   t e c h n o l o g i c a l   f a c t o r +   ( θ z * t , n , p θ z * t , n )   ×   x c o a l , z t × f C R P   f o r   i n t e r r e g i o n a l   f a c t o r + ( 1 θ z * t , n , p ) × x c o a l , z t × f C R P   f o r   m a n a g e r i a l   f a c t o r
here, the inefficient DMUs in Figure 1 are always projected toward the origin of the coordinate axes since a radial DEA model is used. Alternatively, if a non-radial DEA model were used in this study, inefficient DMUs would be projected in a different direction onto the meta and group frontiers due to the existence of non-radial slacks [44]. Accordingly, CRP could not be properly decomposed if CRP was estimated based on the slack variable obtained with a non-radial DEA model.
This study introduced the LMDI method and decomposed the sources of changing CRP throughout the study period. By letting CRP, as calculated according to Equation (11), be CRPTOTAL, CRPTOTAL in year t can be decomposed according to Equation (12):
C R P T O T A L t = C R P T E C H t + C R P I n t e r t + C R P M A N A G E t .
here, C R P T E C H t , C R P I N T E R t , and C R P M A N A G E t represent the CO2 reduction potential for technological, inter-regional, and managerial factors, respectively.
First, by referencing Equation (11), C R P T E C H t was calculated according to Equation (13):
C R P T E C H t = ( θ z * t , n θ z * t ) × x c o a l , z t × f = T E C H t × S C A L E t × f .
where TECHt and SCALEt denote the technological factors and coal consumption (i.e., production scale) in year t, respectively. Subsequently, the change in C R P T E C H t from year t to t + 1 can be described using Equation (14) [36]:
Δ C R P T E C H = C R P T E C H t + 1 C R P T E C H t = Δ T E C H + Δ S C A L E T E C H .
Notably, Equation (14) does not include f (i.e., CO2 emissions factor), as f was held constant across years t and t + 1 in this study. Using the LMDI method, Δ T E C H and Δ S C A L E T E C H were formulated according to Equations (13) and (16), respectively [30,36,37]:
Δ T E C H = ln ( T E C H t + 1 T E C H t ) × ( C R P T E C H t + 1 C R P T E C H t ln C R P T E C H t + 1 ln C R P T E C H t ) .
Δ S C A L E T E C H = ln ( S C A L E t + 1 S C A L E t ) × ( C R P T E C H t + 1 C R P T E C H t ln C R P T E C H t + 1 ln C R P T E C H t ) .
Similarly, the changes in C R P I N T E R t and C R P M A N A G E t from year t to t + 1 were formulated according to Equations (17)–(22):
Δ C R P I N T E R = C R P I N T E R t + 1 C R P I N T E R t = Δ I N T E R + Δ S C A L E I N T E R .
Δ I N T E R = ln ( I N T E R t + 1 I N T E R t ) × ( C R P I N T E R t + 1 C R P I N T E R t ln C R P I N T E R t + 1 ln C R P I N T E R t ) .
Δ S C A L E I N T E R = ln ( S C A L E t + 1 S C A L E t ) × ( C R P I N T E R t + 1 C R P I N T E R t ln C R P I N T E R t + 1 ln C R P I N T E R t ) .
Δ C R P M A N A G E = C R P M A N A G E t + 1 C R P M A N A G E t = Δ M A N A G E + Δ S C A L E M A N A G E .
Δ M A N A G E = ln ( M A N A G E t + 1 M A N A G E t ) × ( C R P M A N A G E t + 1 C R P M A N A G E t ln C R P M A N A G E t + 1 ln C R P M A N A G E t ) .
Δ S C A L E M A N A G E = ln ( S C A L E t + 1 S C A L E t ) × ( C R P M A N A G E t + 1 C R P M A N A G E t ln C R P M A N A G E t + 1 ln C R P M A N A G E t )
Lastly, to readily examine the sources of the change in CRP and inform policy discussion, Equations (15)–(22) were classified into the efficiency change effect ( Δ E F F ), and production scale change effect ( Δ S C A L E ) according to Equations (23) and (24), respectively:
Δ E F F = Δ T E C H + Δ I N T E R + Δ M A N A G E .
Δ S C A L E = Δ S C A L E T E C H + Δ S C A L E I N T E R + Δ S C A L E M A N A G E .
In LMDI, a computational problem occurs when both the efficiency scores in year t and t + 1 take zero values due to the existence of logarithmic terms; therefore, this study replaced zero values with very small numbers when performing calculations [45]. Note that this study estimated the change in CRP between the two years 2009 and 2011 (excluding 2010).

4. Data

This study considered two inputs and one output for evaluating the power generation efficiency of CTPPs. Coal consumption and capital, as defined in Section 3.1, were utilized as the inputs [10,26,39,40], whereas net electricity production was taken as the sole output. Thus, the power generation efficiency in this study comprehensively considered the utilization factor, defined as the ratio of the actual electricity production to the production capacity, as well as the coal intensity, defined as the ratio of the coal consumption to the actual electricity production [10,26,39,40]. Furthermore, CO2 emissions were calculated by multiplying the coal consumption for each plant by the emissions factor of lignite (1.204 ton CO2/ton) [43]. As there is thus a perfect linear correlation between coal consumption and CO2 emissions in this study, direct consideration of CO2 emissions as an undesirable output was avoided, and an investigation into improvement based on power generation efficiency contributions to CO2 emission reductions was carried out instead. Input and output data for this study were collected from the China Electricity Council [46].
The number of DMUs (i.e., the sample size) over the study period from 2009 to 2011 was 398. DMUs with abnormal values were excluded from the dataset by first removing those with operational hours >8760 h (24 h × 365 d) or whose net electricity production was above the capital value. DMUs with coal intensity in the 1.5 interquartile ranges (below the first or above the third quartile) were also removed [10]. LARGE and SM CTTPs were defined following Wu et al. [41], and all power plants were further classified into four regional groups—east (namely Hebei, Shanghai, Jiangsu, Zhejiang, Fujian, Shandong, Guangxi, Guangdong, Tianjin, and Hainan), central (namely Shanxi, Inner Mongolia, Anhui, Henan, and Hubei), west (namely Sichuan, Guizhou, Yunnan, Shaanxi, Gansu, Qinghai, and Xinjiang), and northeast (namely Liaoning, Jilin, and Heilongjiang). Overall, this study considered two technological frontiers, each with four regional frontiers.
Table 1 presents the data used in this study. Focusing on the average value of each factor, from 2009 to 2011, capital, coal consumption, and net electricity production increased by 14.1%, 12.1%, and 16.1%, respectively, implying an overall increase in the scale of coal-fired power plants in China during this period.

5. Results and Discussion

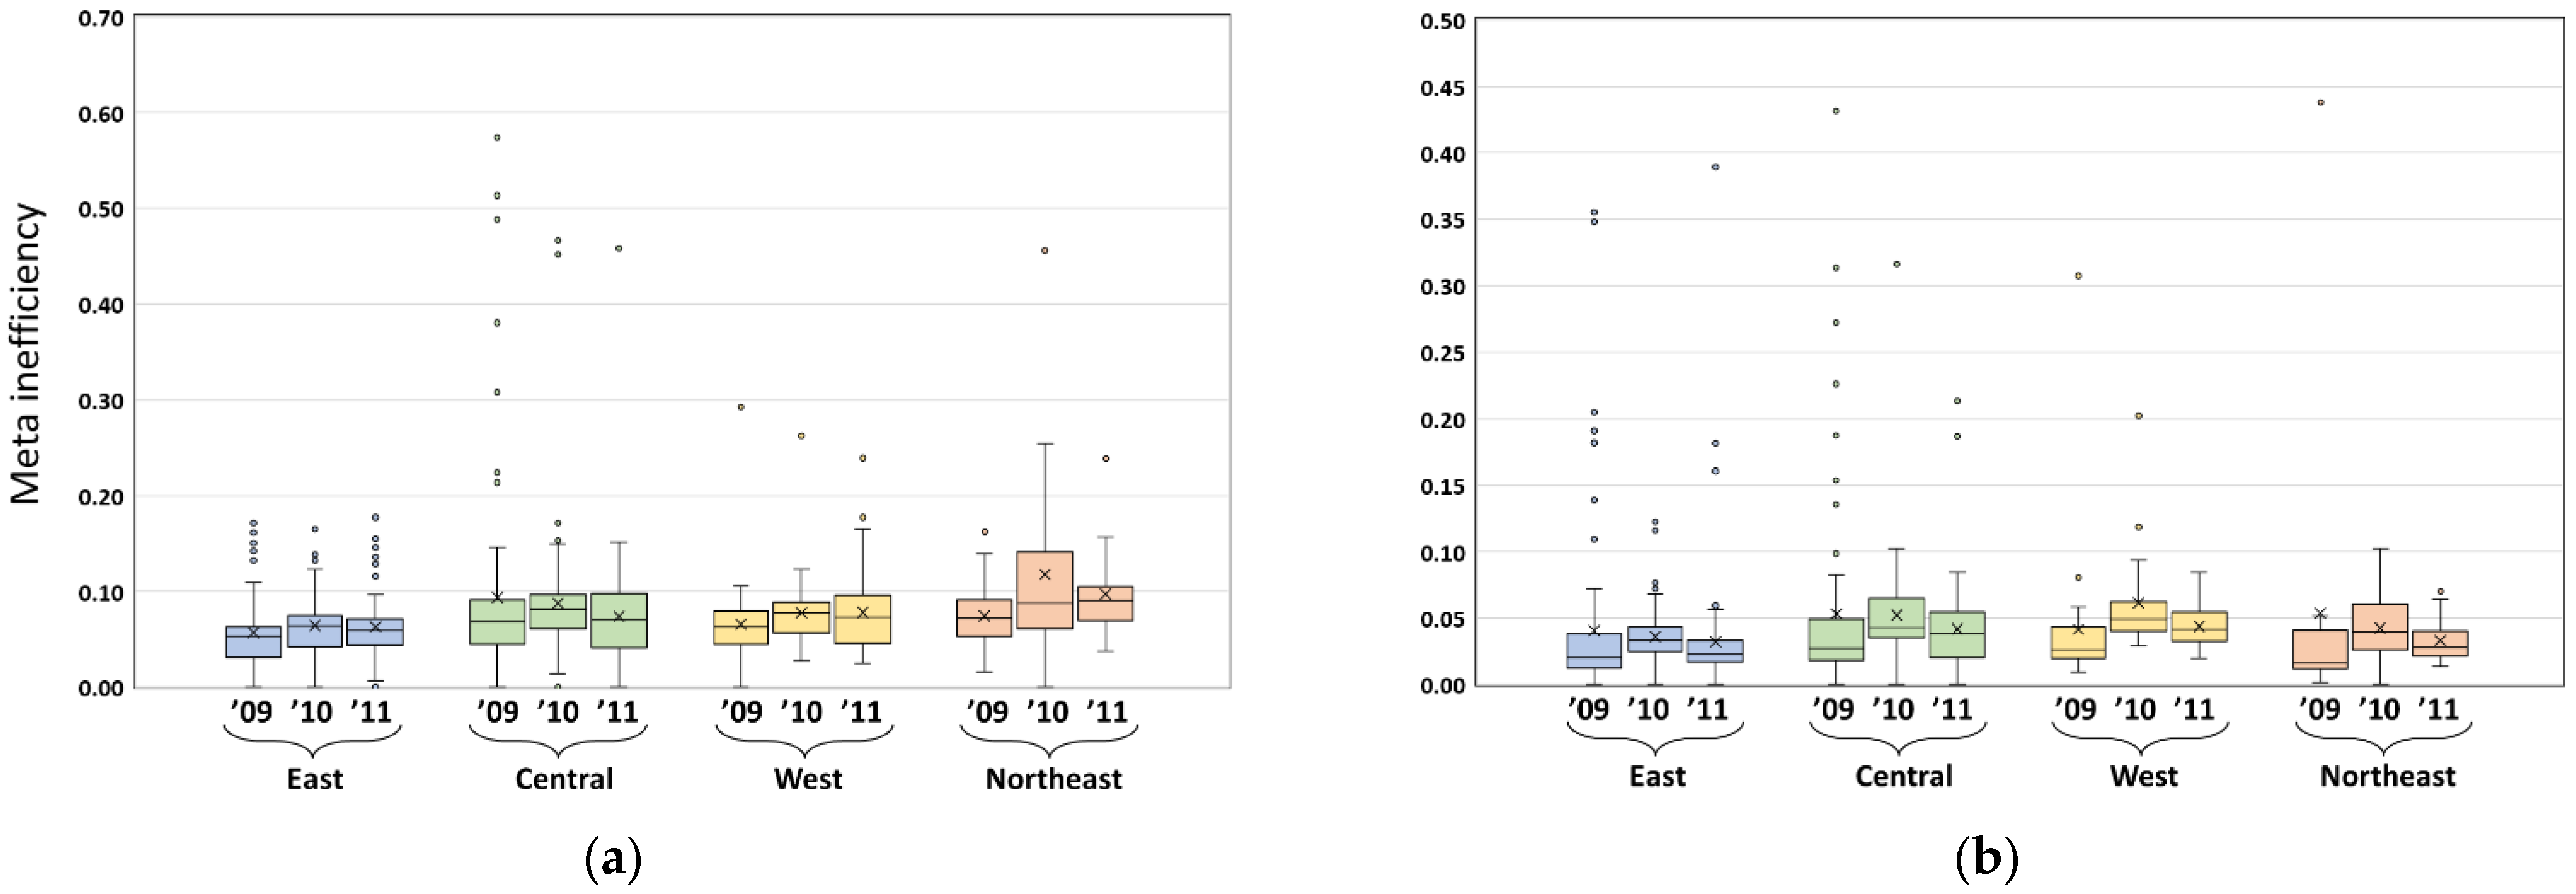
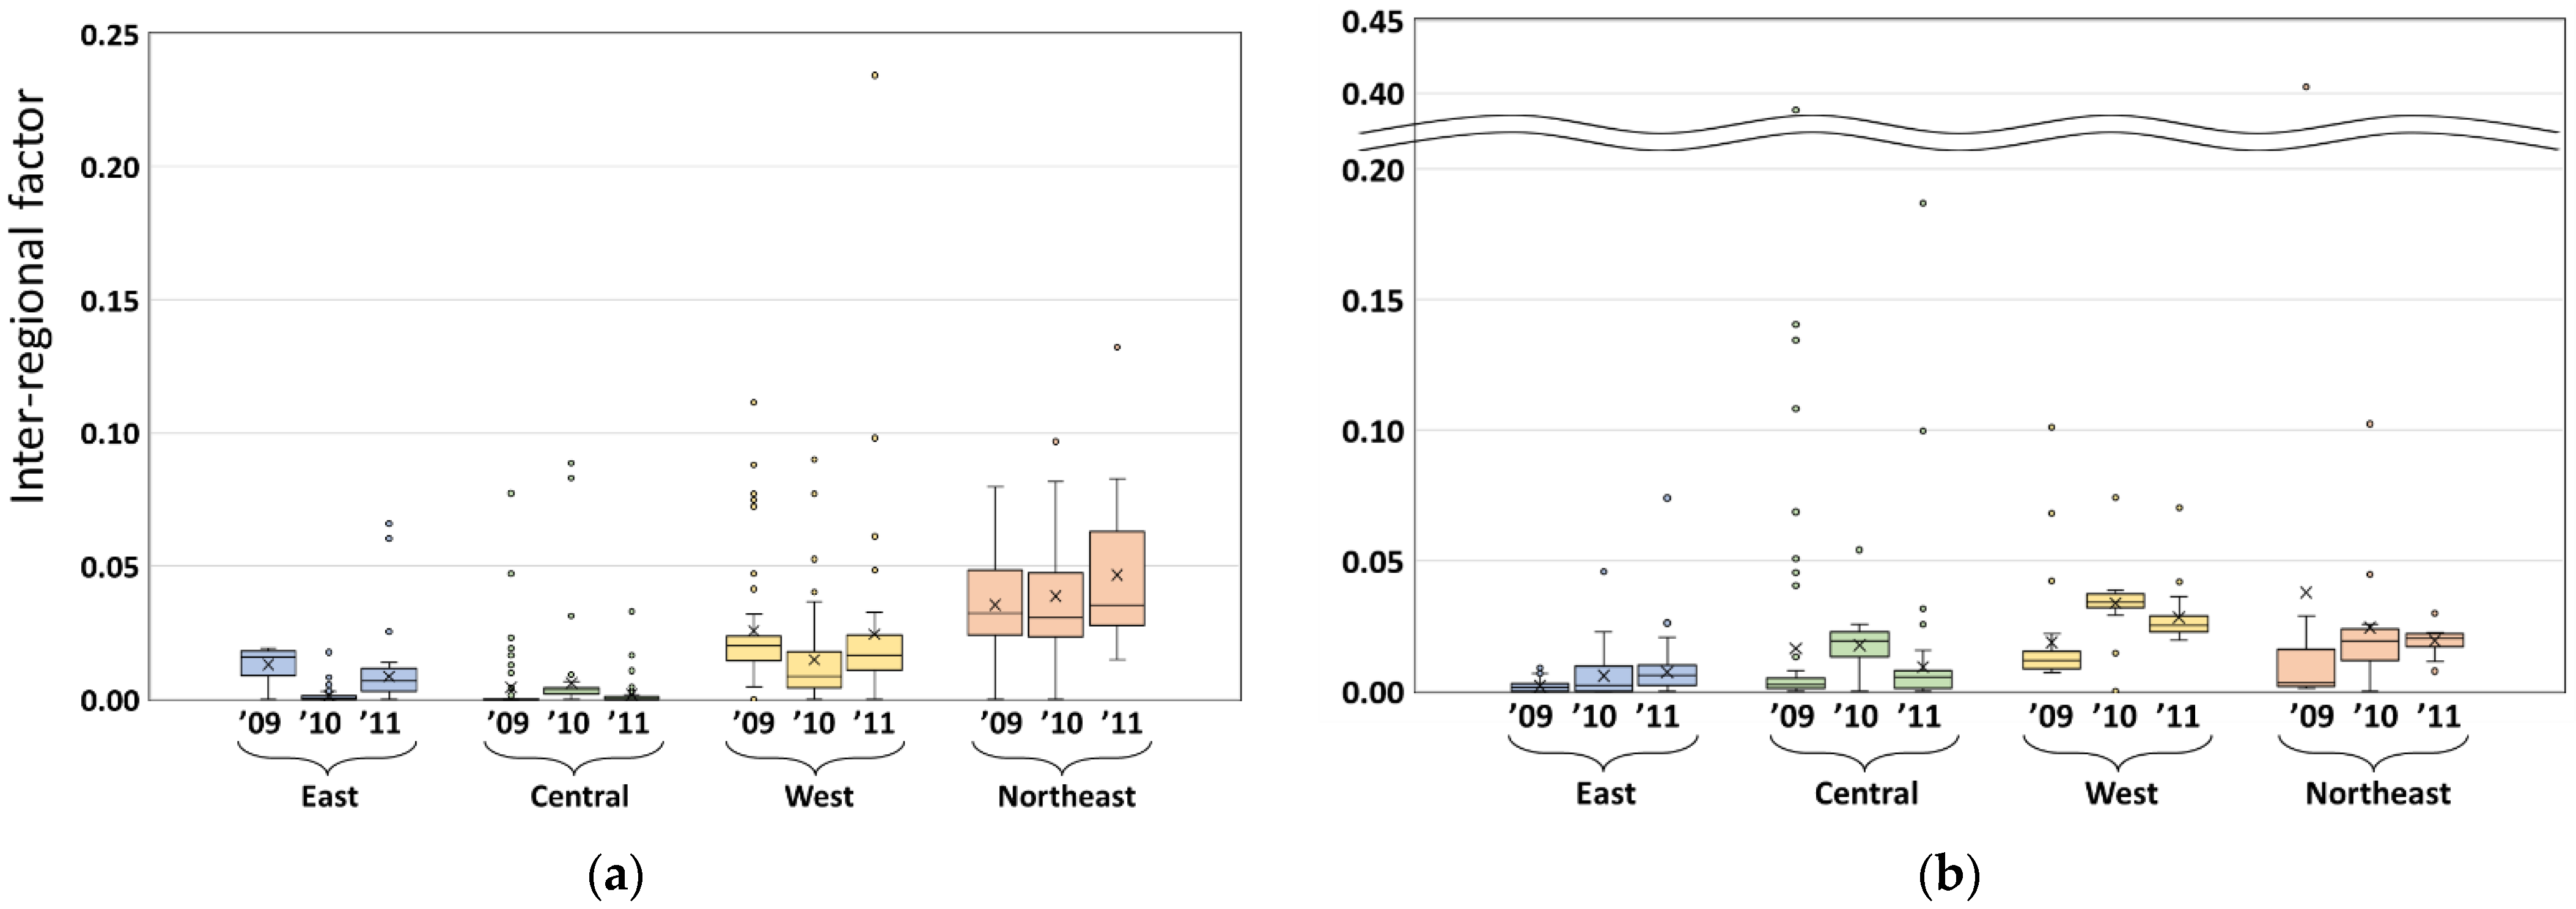
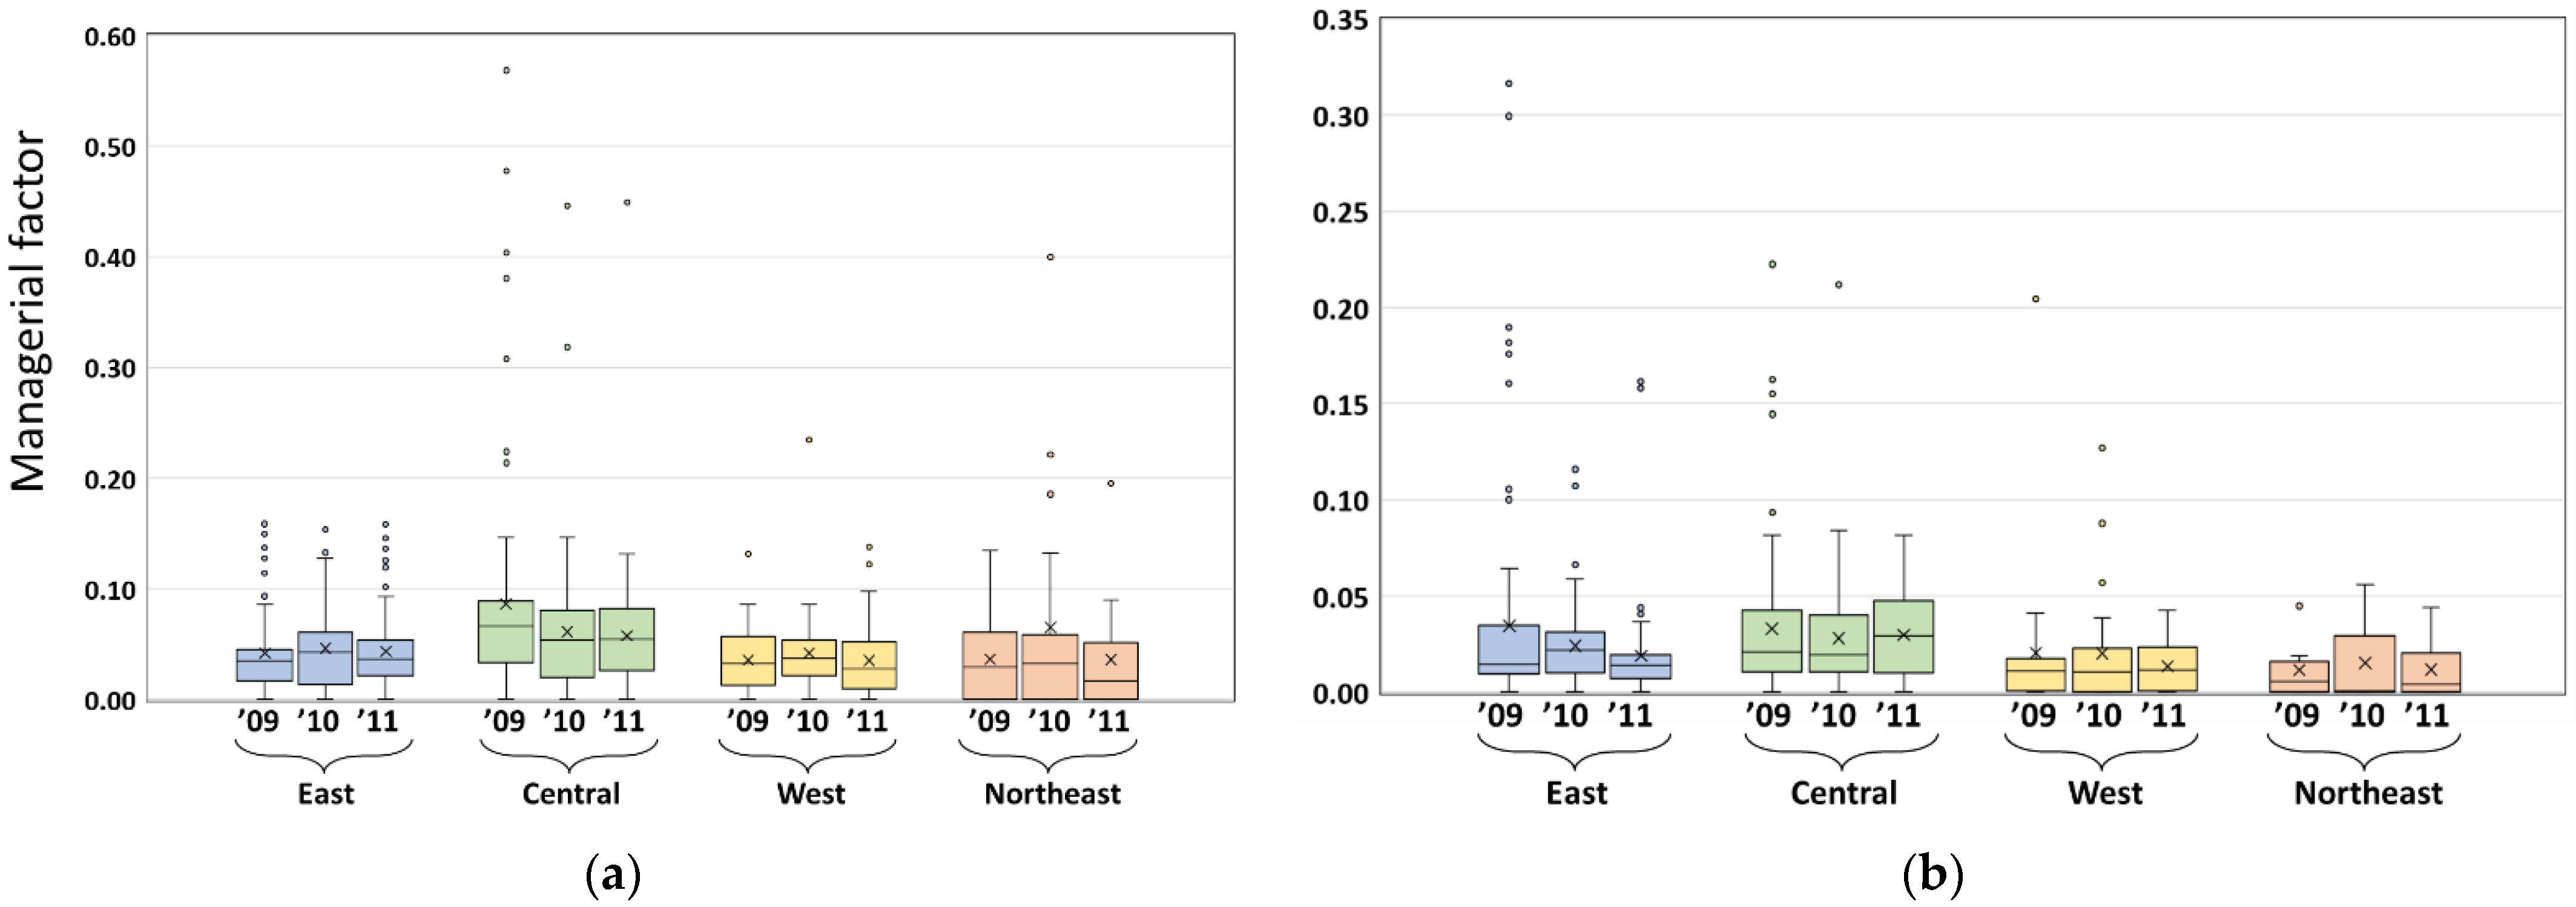
5.1. Changes in Meta Inefficiency

Figure 2a shows a boxplot of the meta inefficiency for the SM group. In 2009, the average meta inefficiency in the east was the lowest (0.057) among the four geographical regions. Conversely, the average meta inefficiency in the central region showed the highest value (0.093) in the same year; however, from 2009 to 2011, the average meta inefficiency in the central region greatly declined from 0.093 to 0.074 and was the second-lowest value (following the eastern region) in 2011. Alternatively, the average meta inefficiency across the other three regions increased from 2009 to 2011.
Figure 2b shows the changes in meta inefficiency for the LARGE group, where across all regions, the average meta inefficiency was smaller than those of corresponding regions in the SM group, indicating that the power generation efficiency of CTPPs belonging to the LARGE group was greater than that of the SM group in most cases, aligning with previous results of Wang et al. [26] and Eguchi et al. [10]. Similar to the SM group, the eastern region’s average also showed the lowest value across all years in the LARGE group. Alternatively, the average meta inefficiency in all regions except for the west declined from 2009 to 2011, contrary to the patterns observed in the SM group.

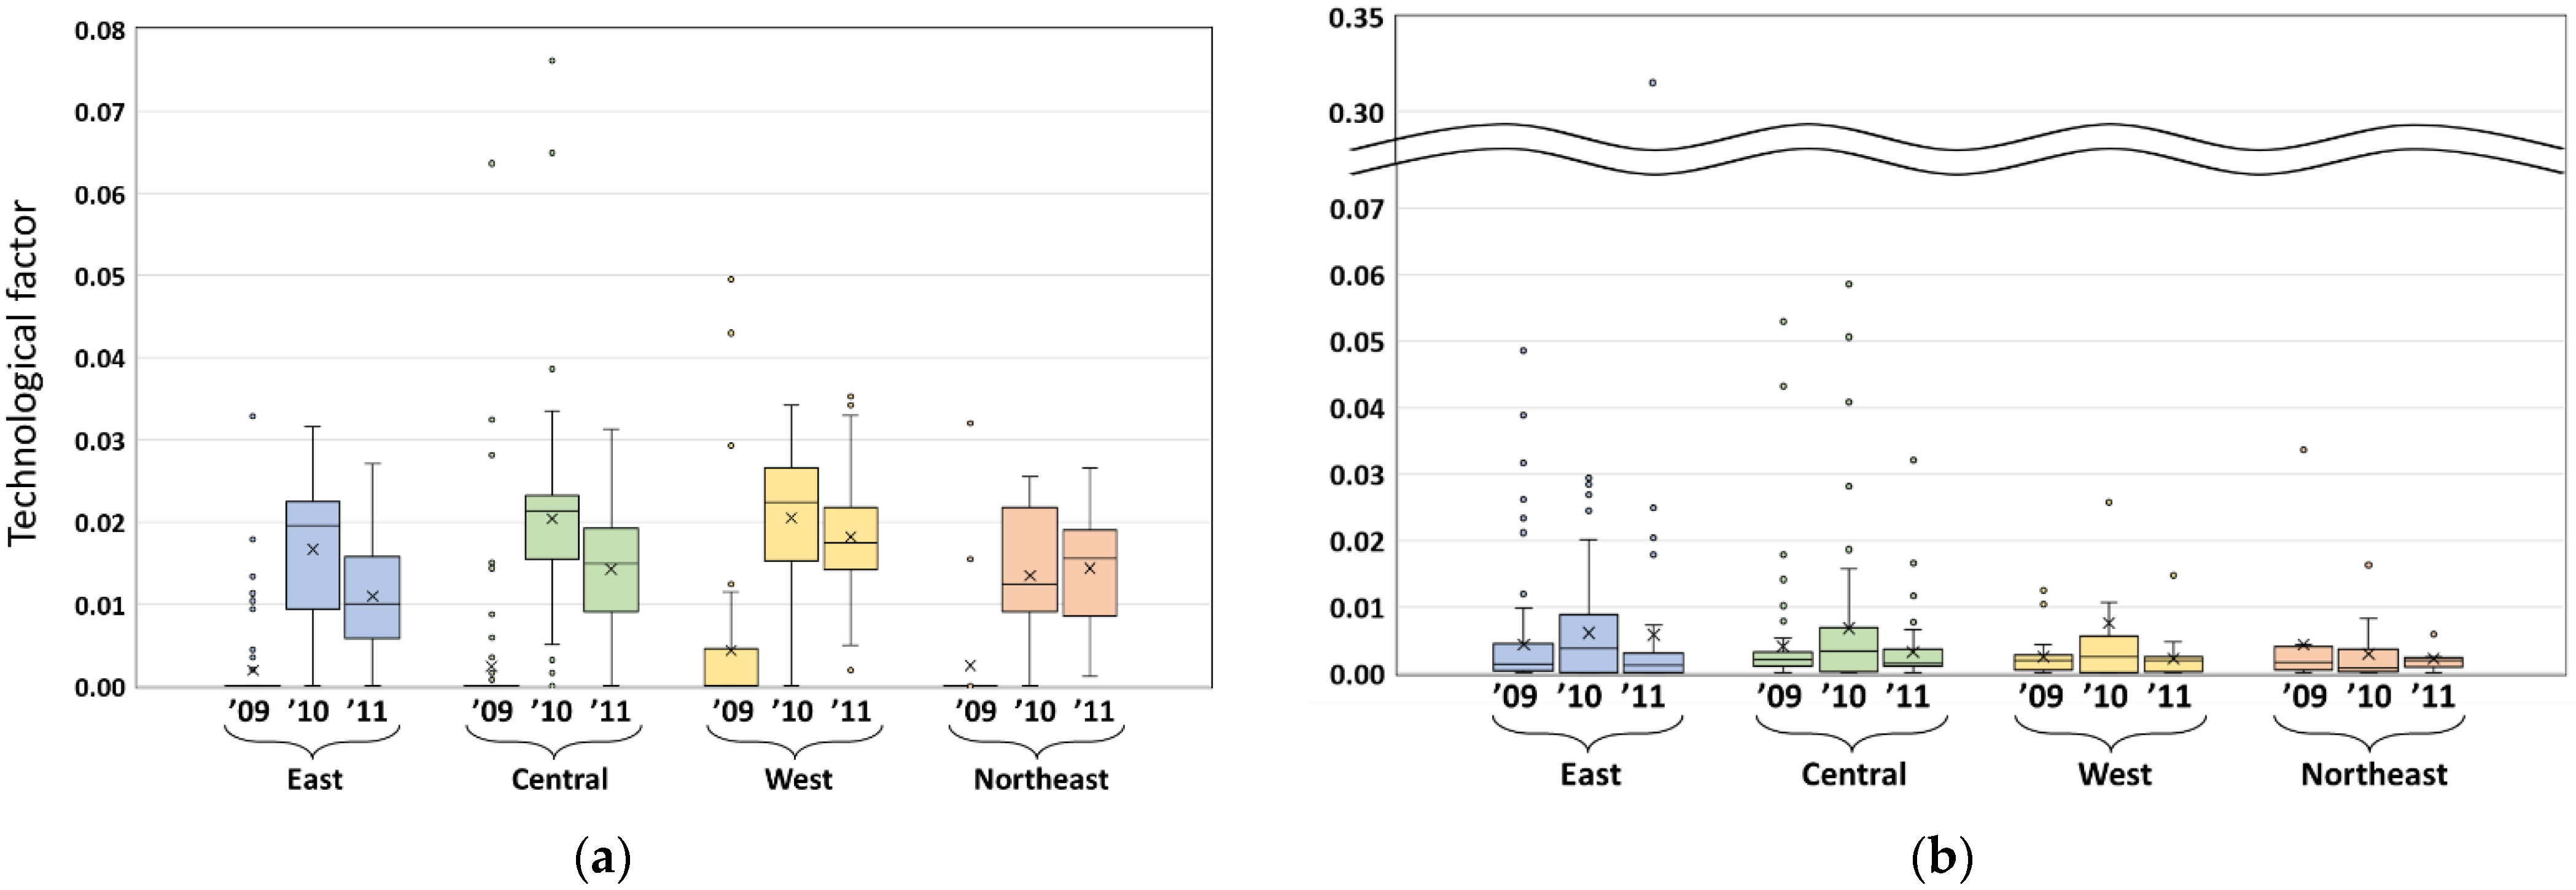
5.2. Metafrontier DEA Decomposition Analysis

Figure 3 shows the changes in technological factors of the SM and LARGE groups over the study period, revealing that in the latter, the change in technological factors was relatively small with time. The average technological factor for all plants belonging to the LARGE group was 0.0040 in 2009 and 0.0042 in 2011. Conversely, between 2009 and 2011, the average technological factor for all SM plants tended to increase, from 0.0027 to 0.0142 (Figure 3a), implying that the technological gap in power generation efficiency resulting from the difference in production scale expanded over the study period. The change in the average utilization ratio for each group should be considered as one of the main reasons for this growing technology gap (Figure 4). Between 2009 and 2011, although the average utilization ratio for the power plants belonging to the LARGE group showed a 2.3% increase (from 90.8% to 93.1%), for the SM group power plants only increased by 0.6%.
Figure 5 describes the changes in inter-regional factors for the SM and LARGE groups. The northeast region showed the highest average inter-regional factor in the SM group (Figure 5a), with an average inter-regional factor of 0.040 across the study period. These results indicate that the northeast region experienced the largest technological gap in the SM group. Elsewhere in the SM group, the average inter-regional factor for the central region was the lowest over this period. When focusing on the LARGE group, the average inter-regional factor for the west and northeast regions was relatively higher (Figure 5b). In the LARGE group, the eastern region showed the lowest average inter-regional factor (0.005) over the study period, thus revealing that the trends in regional heterogeneity in power generation efficiency differed according to production scale.
Regional heterogeneity in economic development is one of the primary reasons for the remarkably lower inter-regional factor in the eastern and central regions compared to the west and northeast. Xie et al. [47] revealed that economic development is a driving force for the construction of CTPPs in China. The eastern and central Chinese regions are more economically developed; thus, the introduction of power plants with leading-edge technology has historically been promoted, contributing to the lower inter-regional factor in these areas.
Boxplots describing the change in managerial factors for the SM and LARGE groups can be seen in Figure 6, revealing that in the SM group, the central region showed the highest average managerial factor (0.069) over the study period (Figure 6a). Combining results of Figure 5a and Figure 6a, it can be concluded that, although the SM-sized CTPPs located in the central region have relatively smaller regional technological gaps in power generation efficiency compared to the west and northeast, their inefficiency is largely attributable to the managerial factor. In the LARGE group, managerial factors for the central region were also relatively high (Figure 6b); whereas the inter-regional factors for the west and northeast regions were higher than that for the east and central regions, and the average managerial factor in 2011 was lower than that in the east and central regions (Figure 5b and Figure 6b). Therefore, it was concluded that the operation management gap in the western and northeast regions was relatively smaller than that in the other two regions for LARGE CTPPs.
Table 2 and Table 3 summarize the changes in average inefficiency factors and their components of meta inefficiency for the SM and LARGE groups, respectively. In 2011, the LARGE group’s overall average of meta inefficiency was 0.037, nearly half of that for the SM group. The main reasons for the observed differences in meta inefficiency between the two groups were the lower average technological and managerial factors for the LARGE group compared to the SM group. Moreover, changes of overall average meta inefficiency for the LARGE group declined by 0.9% from 2009 to 2011; however, the west was the only region that experienced an increase in average meta inefficiency (Table 3), likely due to the increase in inter-regional factors for both the average score and its proportion to meta inefficiency.

5.3. Changes in CRP

The results of the MDEA revealed the changes in meta efficiency in China and its sources of the inefficiency of power generation in CTPPs; however, its impacts on CO2 emissions have not yet been clarified. Accordingly, the corresponding changes in CRP levels during the study period can be explored as well. Table 4 provides the change in CRP for each production scale and the regional group from 2009 to 2011, revealing that the total CRP for the SM group in 2011 was ~13.4 million ton CO2, an increase of 14.5% from 2009 (11.7 million ton CO2). For the SM group, the total CO2 emissions associated with the power generation activity of CTPPs increased by 12.8% from 2009 (192.7 million ton CO2) to 2011 (217.3 million ton CO2); thus, the increasing rate of CRP exceeded that of total CO2 emissions in this group. For the LARGE group, total CRP was ~30.3 million t-CO2 in 2011, an increase of 12.2% from 2009 levels (27.0 million ton CO2; Table 4). Conversely, total CO2 emissions associated with LARGE power plant generation activity increased by ≤23.1% from 2009 (718.2 million ton CO2) to 2011 (884.0 million ton CO2), indicating that the increasing rate of CRP in the LARGE group was slower than that of increasing total CO2 emissions rates, notably different than the pattern observed in the SM group.
Looking at the results obtained for each regional group in Table 4, the western region showed the highest increasing rate of CRP for both the SM and LARGE groups. Conversely, in the central region, although the increasing rate of CRP for the SM group was only 0.6%, the observed rate of increase for the LARGE group was 15.1%; whereas for the LARGE group, the increasing rate of CRP in the eastern region was substantially low.

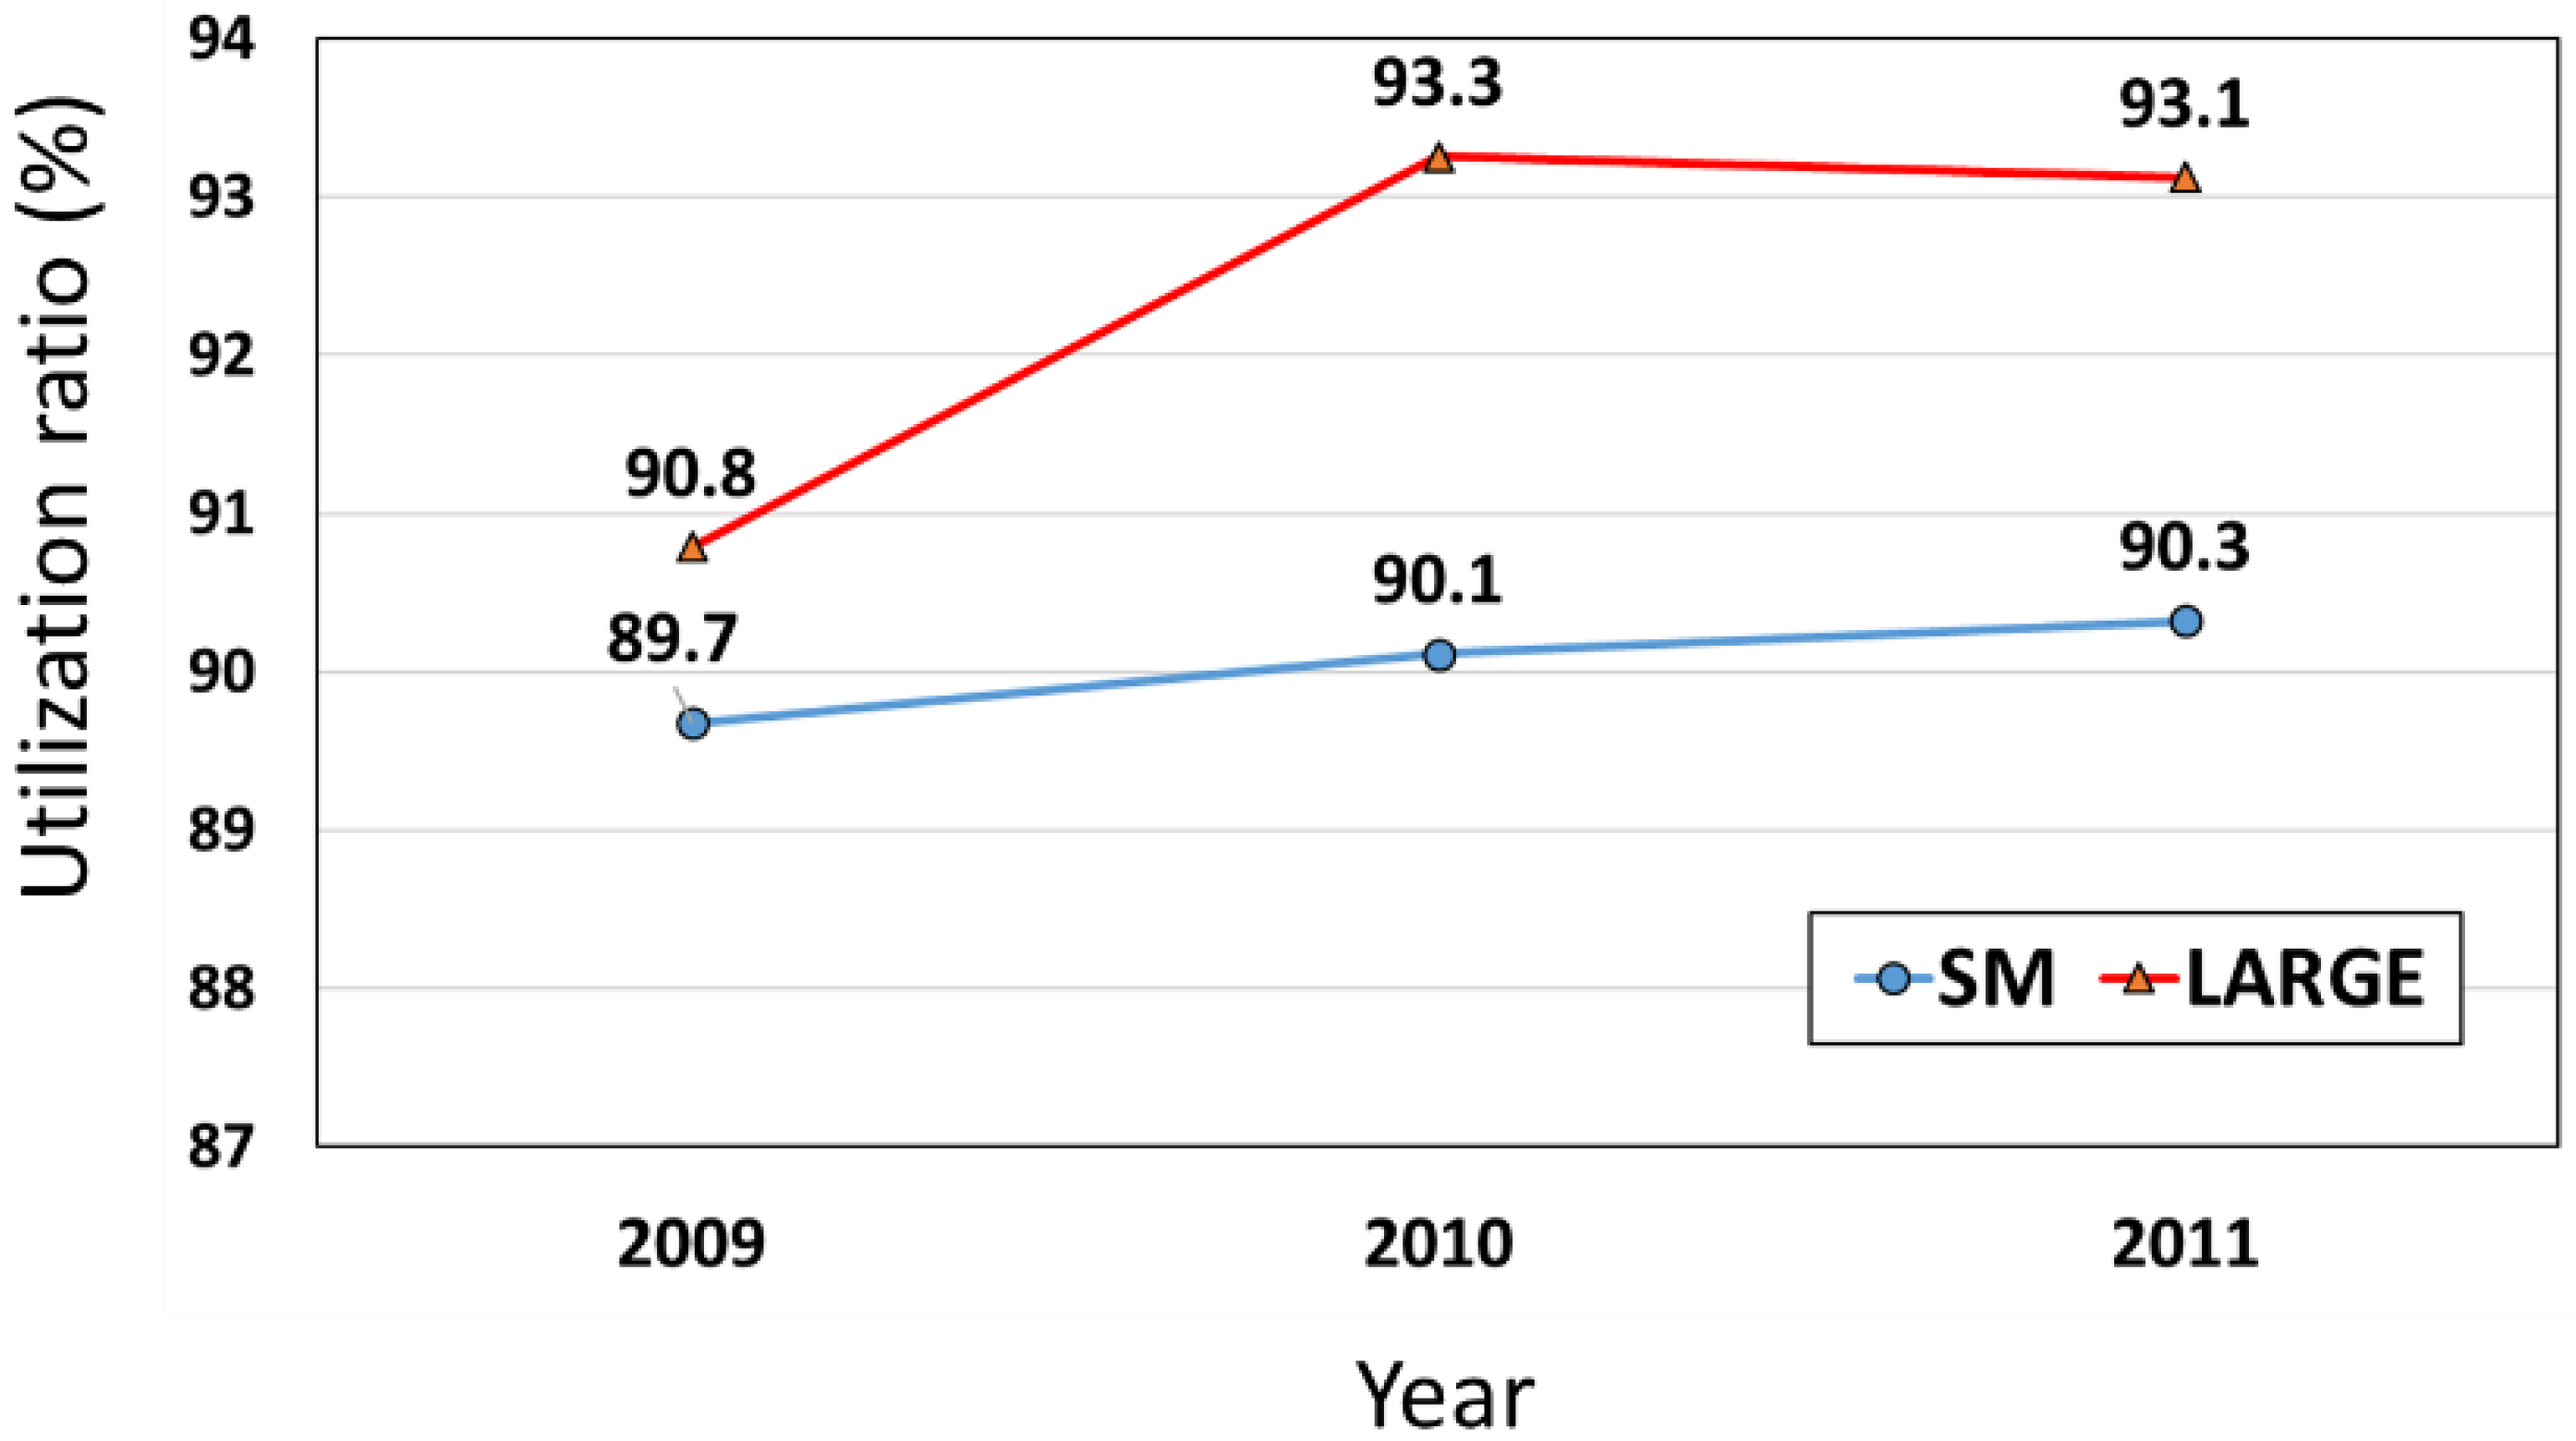
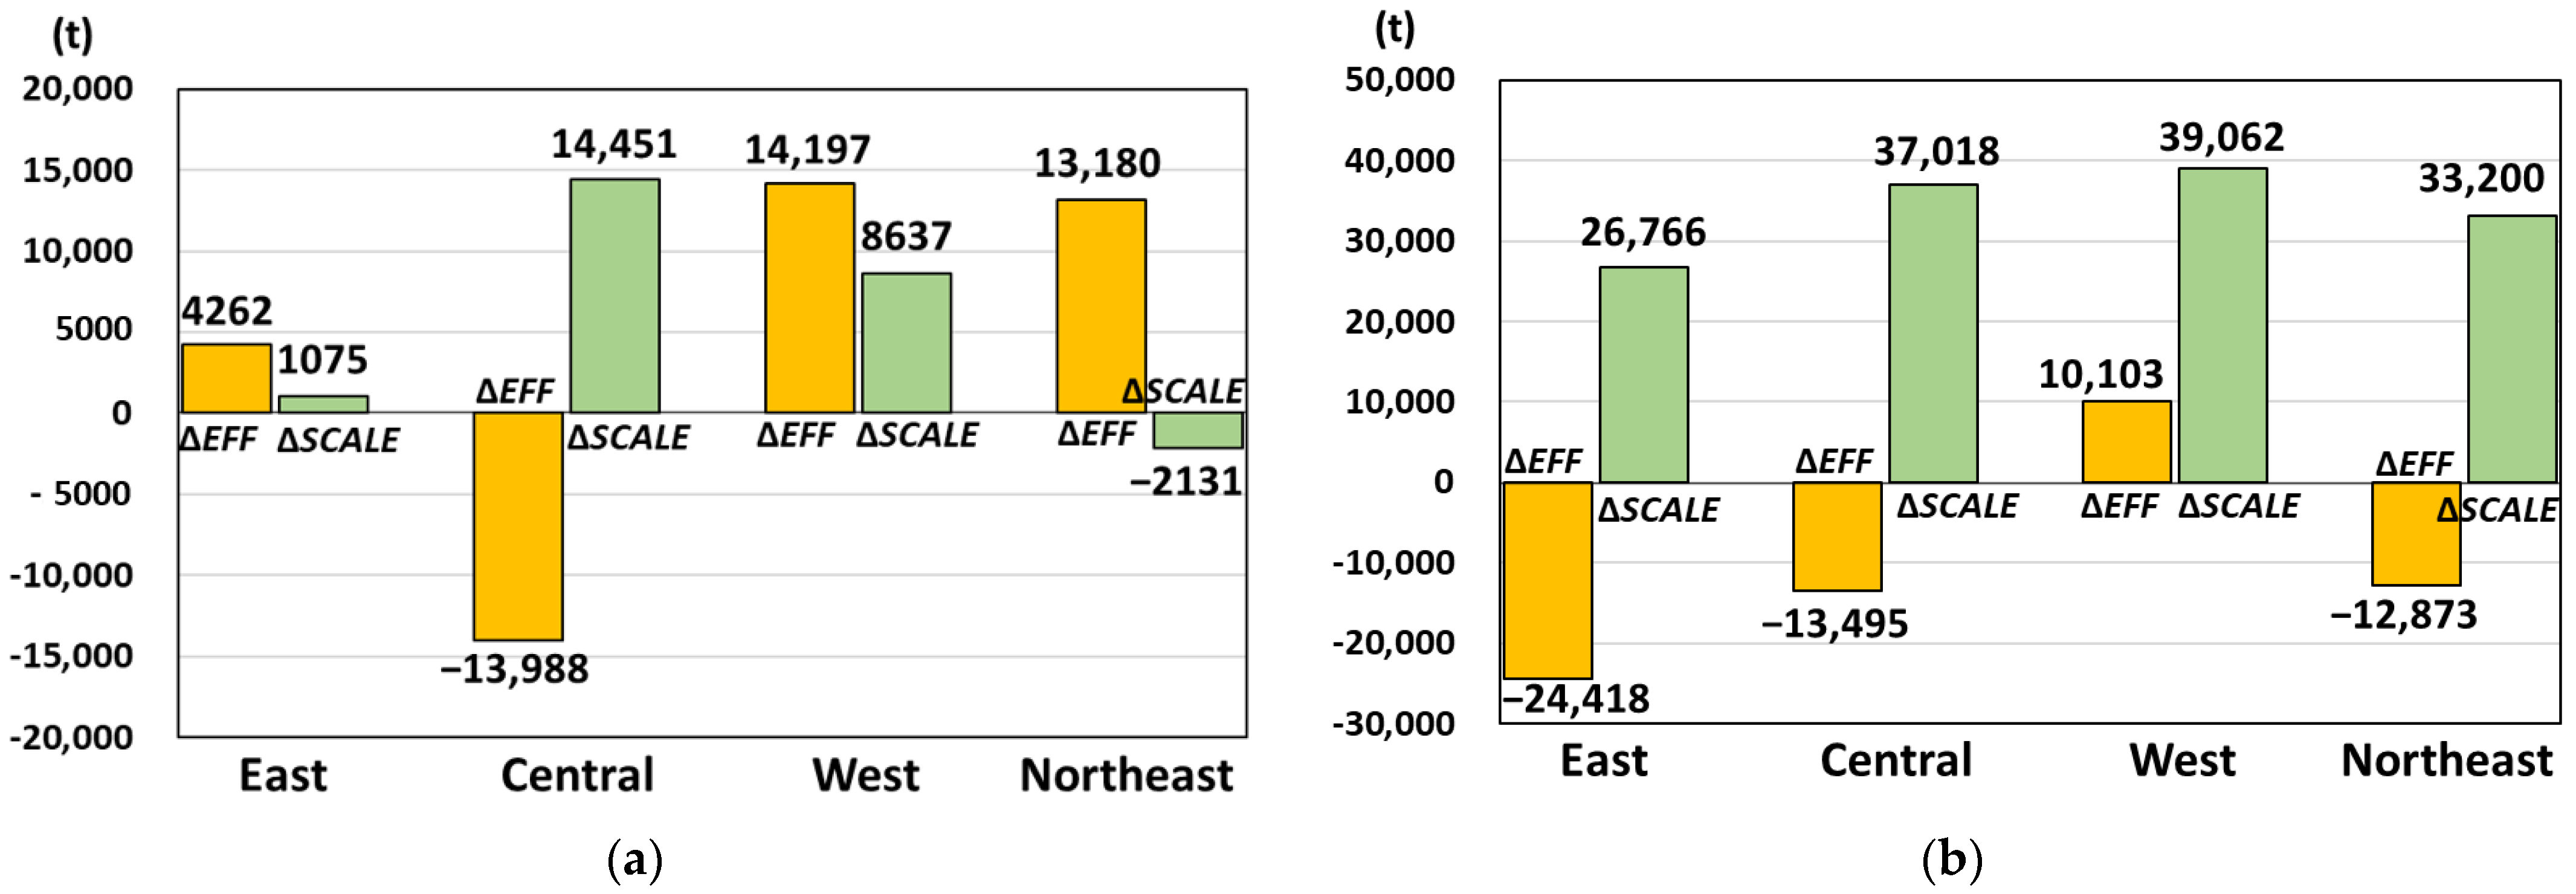
5.4. Comparisons of EFF and SCALE for Each Group

Figure 7 shows the results of the average efficiency change ( Δ E F F ) and scale change effects ( Δ S C A L E ) for each production scale and regional group obtained by the LMDI. For the SM group, Δ E F F increased CRP across all regional groups, except central. In particular, a large positive effect of Δ E F F was observed in the west and northeast regions, meaning that the increment in relative inefficiency in power generation efficiency was an important driver of increasing CRP in these regions over the period analyzed. Conversely, for the LARGE group, Δ E F F contributed to reducing CRP in all regions except the west (Figure 7), indicating that the technology gap between the metafrontier and inefficient CTPPs was essentially eliminated during this period. In particular, the eastern region showed the largest negative effect of Δ E F F , reducing by ~24.4 thousand tons of CRP per power plant during the study period; however, the positive effect of Δ S C A L E within the LARGE group was substantially greater than that in the SM group, indicating that larger production scale CTPPs had taken the initiative in responding to growing electricity demand in China during the study period.

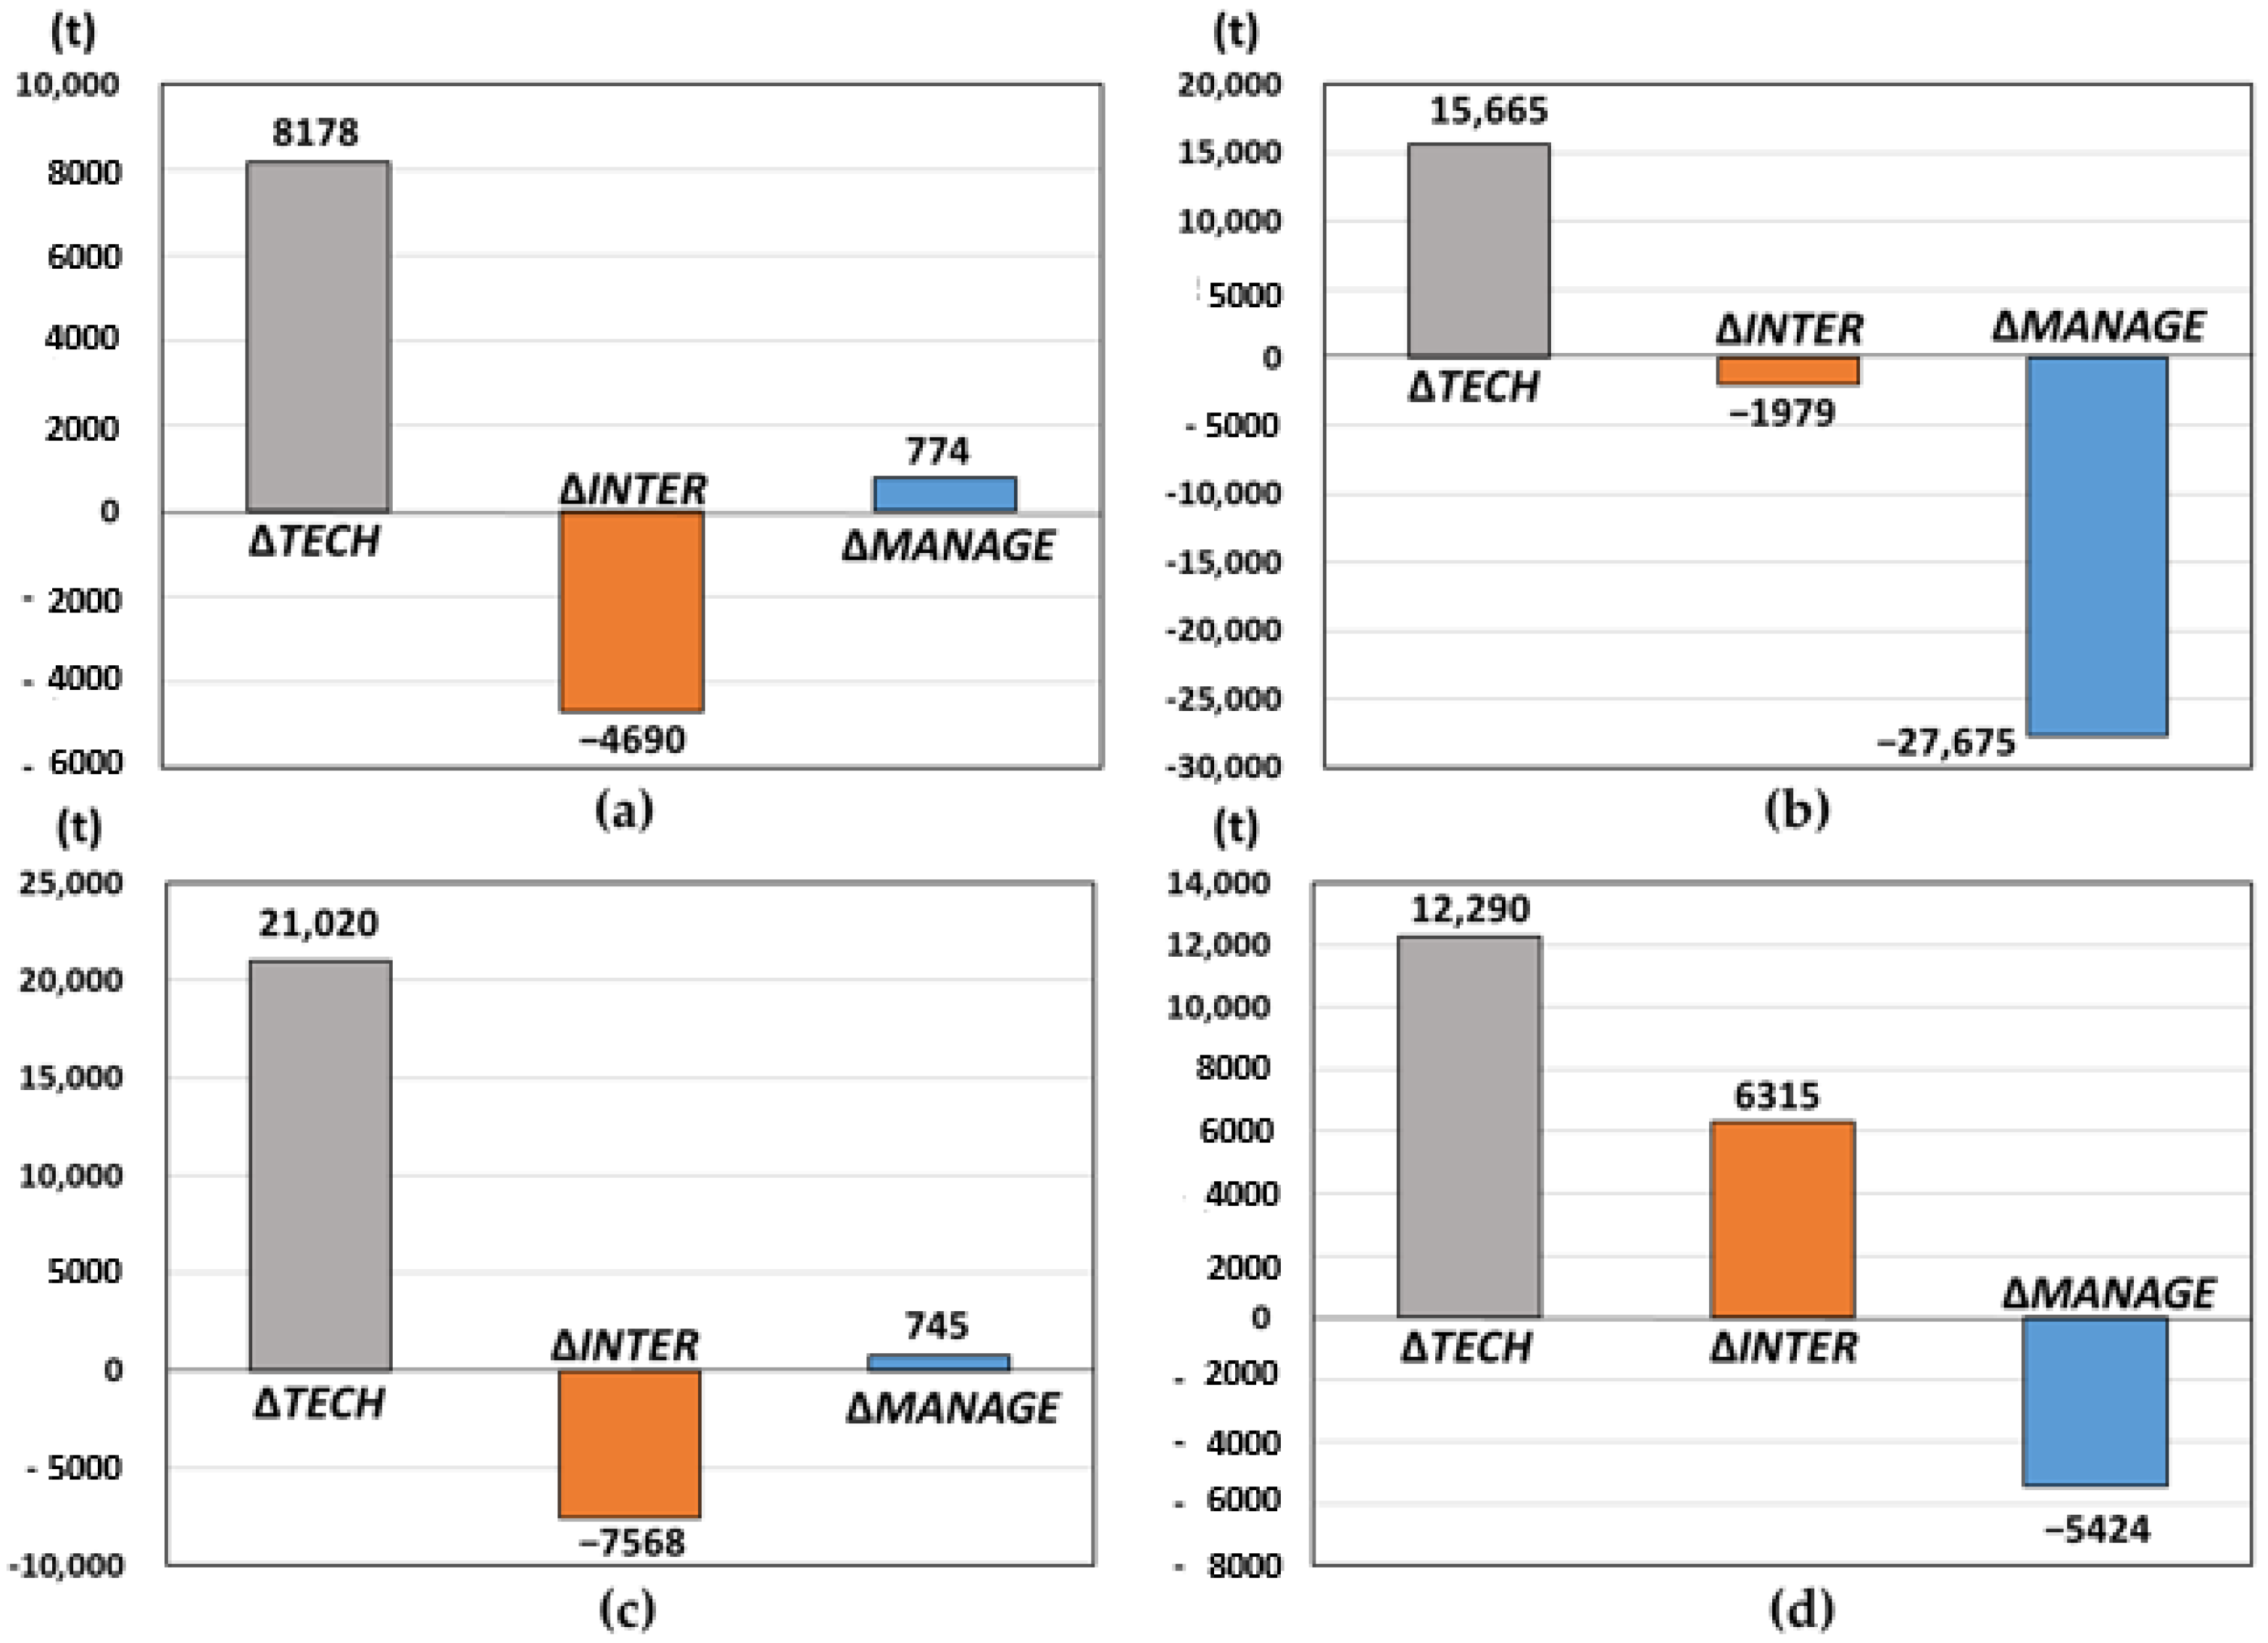
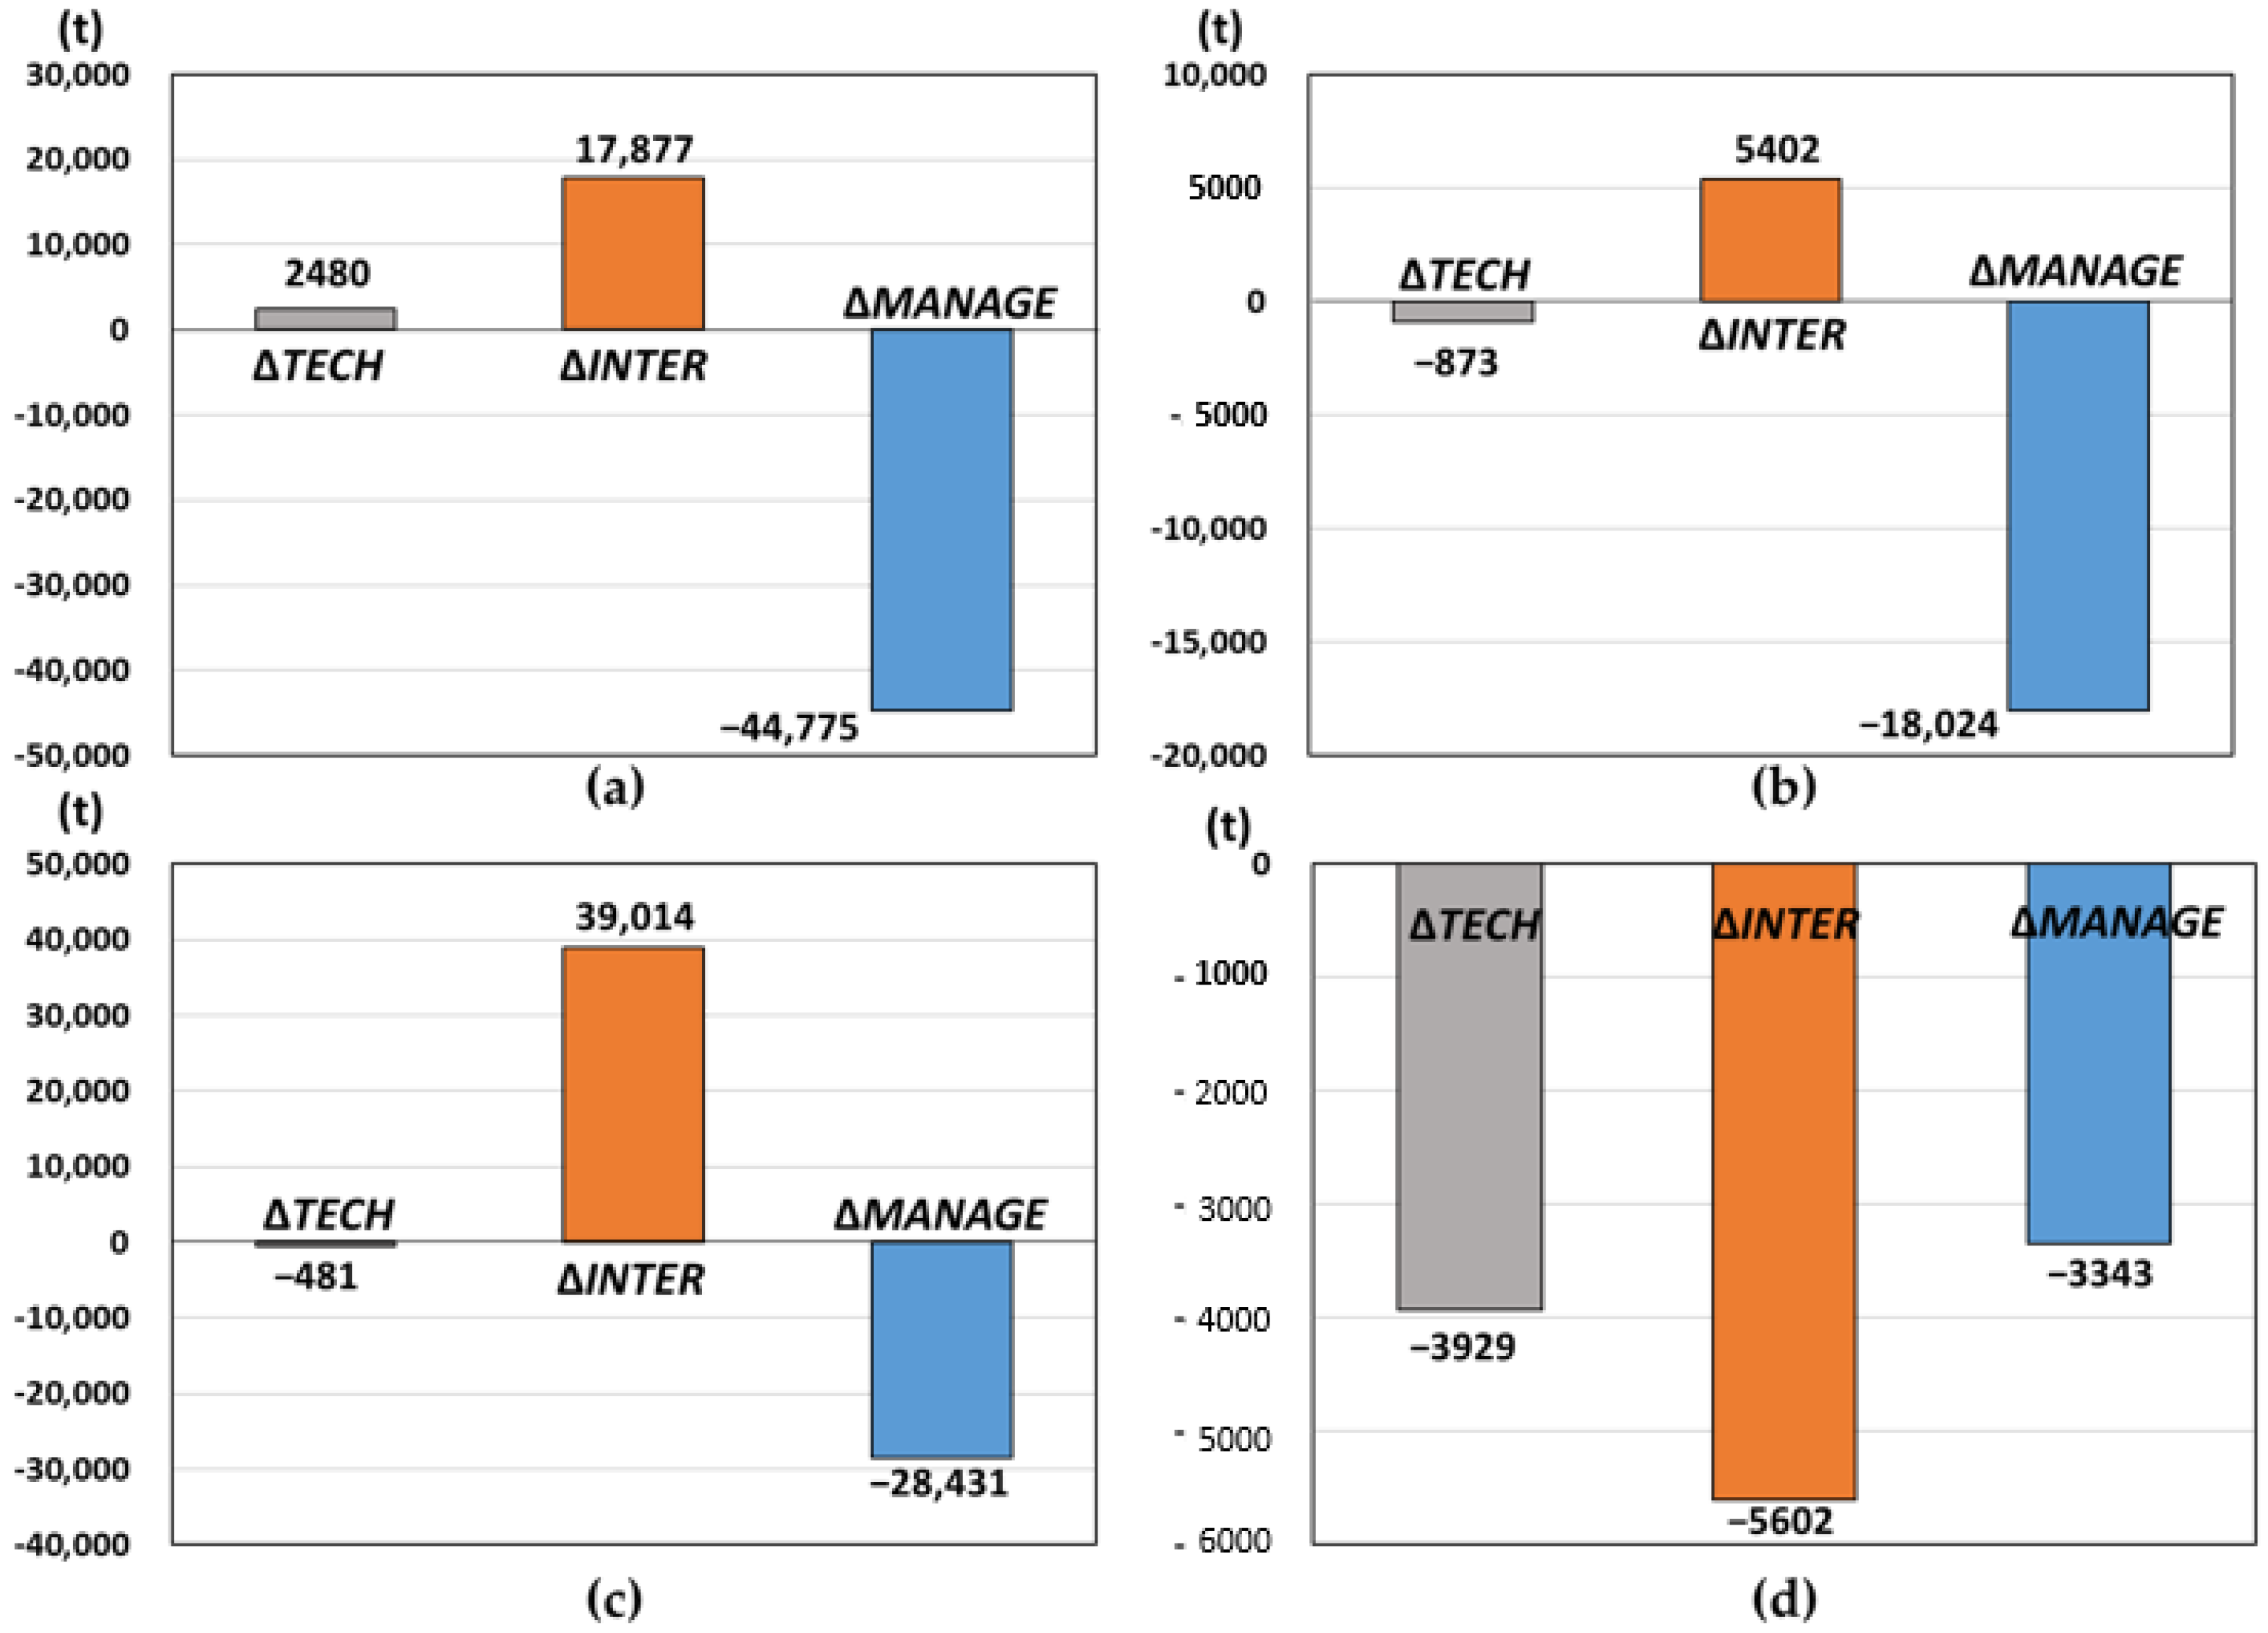
5.5. Breakdown of ΔEFF

Figure 8 shows the average effects of Δ T E C H , Δ I N T E R , and Δ M A N A G E for the SM group. As mentioned in Section 5.2, technological factors largely increased across all regions for the SM group from 2009 to 2011; thus, Δ T E C H also positively affected CRP in each region. Focusing on the central region, the sole location where Δ E F F negatively affected CRP among the SM group, although Δ T E C H increased CRP per power plant by ~15.7 thousand tons, Δ M A N A G E contributed to reducing CRP per power plant by ~27.7 thousand tons during the same period. In the western region, the shrinking regional technology gap (indicated by the negative Δ I N T E R ) reduced ~7.6 thousand tons of CRP per power plant; however, the combined positive effects of Δ T E C H and Δ M A N A G E outperformed the negative effect of Δ I N T E R .
Figure 9 represents the average effects of Δ T E C H , Δ I N T E R , and Δ M A N A G E for the LARGE group. Looking at the eastern region where Δ E F F contributed the most to reducing CRP among the LARGE group, the negative effects of Δ M A N A G E greatly surpassed the combined positive effects of Δ T E C H and Δ I N T E R . The northeast region was the only location where Δ I N T E R negatively affected CRP among the LARGE group; whereas the negative effects of Δ M A N A G E were marginal compared to the other three regions. Moreover, positive and substantial Δ I N T E R was the main factor of the increase in Δ E F F for the western region, increasing CRP per power plant by ~39.0 thousand tons over the study period. Focusing on the changes in average inter-regional factors, it increased from 0.019 in 2009 to 0.028 in 2011 (Figure 5b). Alternatively, the average inter-regional factor in the northeast region for the SM group increased from 0.035 in 2009 to 0.047 in 2011 (Figure 5a), a notably higher rate than that observed in the western region for the LARGE group; however, when focusing on Δ I N T E R , a ‘mass-based’ indicator, its positive effects in the western region for the LARGE group were 6.2 times larger than that in the northeast region for the SM group. Therefore, these results imply that focusing only on efficiency indicators cannot properly evaluate the environmental impacts, potentially misleading environmental and energy policies [29,30]. For reducing the CRP in regions with highly positive Δ I N T E R , technology spillover between regions (e.g., introducing leading-edge technological equipment from other regions) was very significant [5,10].

6. Conclusions and Policy Implications

Based on the results obtained here, a policy discussion for reducing China’s CO2 emissions associated with the electricity production of CTPPs is presented here. First, policymakers should prioritize scrapping SM-group CTPPs, as the CRP for these plants had expanded due to the increment in Δ T E C H , which is notably more difficult to improve compared to the other two inefficiency factors. However, for CTPPs, which are difficult to scrap due to their importance as region-specific power supply bases, policymakers should encourage the managers of these plants to improve coal intensity by improving the usage conditions of the equipment, such as the boilers, turbines, and lighting equipment, particularly in the east and west regions where Δ M A N A G E positively affects CRP. Furthermore, coal scrubbing is known to be a useful, relatively low-cost technology for improving coal quality (~2–3 USD per ton of coal) [48]. Recent technology development for the co-combustion of coal with biomass would also contribute to the improvement for CRP associated with the management factor [49,50]. Alternatively, to reduce the CRP of SM power plants located in the northeast region, it is important to expand the spillover of generational technology among different regions, as Δ I N T E R was the primary source of increasing CRP over the study period. Specifically, the government should coordinate the interactions of production technology between the power plants in the northeast region, and those in the east and west regions where the inter-regional factors were low.
For LARGE power plants, CRP declined due to the effects of Δ M A N A G E in all regions examined. Additionally, technology spillover was key to reducing CRP in all regions except the northeast (Figure 9). In particular, the western region experienced a substantial increase in Δ I N T E R during the study period; therefore, the government and policymakers should consider decommissioning power plants with poor facilities and high inter-regional factors in this region. Eliminating inefficient power plants would facilitate a shift in power output toward renewable energy sources, such as photovoltaic and biomass power generation, by more efficiently utilizing the vast western land area [51,52]. In reality, investment in China’s inter-regional transmission grid has increased in recent years, and inter-provincial electricity flow increased from 325 billion kWh to 1444 billion kWh from 2006 to 2019 [53,54]. Finally, it should be noted that technology improvements by digital solutions, such as virtual power plants, digital twin, and blockchain, would progress the metafrontier technology rather than sub-group frontiers and contribute to a significant reduction in CRP [55].
A key limitation of this study is that the research period was over a decade ago (2009 and 2011), as it remains difficult to collect a sufficient amount of the latest data for coal-fired thermal power generation at the plant level [10]. Nevertheless, this is the first study in which a combined research framework of metafrontier DEA and LMDI has been proposed. Thus, despite the relatively old age of the data employed, this study provides detailed and useful insights into the CO2 reduction potential of Chinese power systems.
In conclusion, this study combined the MDEA framework and the LMDI to discuss the reduction in CO2 emissions from CTPPs in China. Focusing only on efficiency scores would ignore the production scale of DMUs, failing to properly evaluate the environmental impacts associated with efficiency changes. To the best of the author’s knowledge, although several previous studies have conducted detailed analyses on the power generation efficiency of CTPPs in China using MDEA while considering regional heterogeneity, none have quantified the impacts of these dynamics in power generation efficiency on power plant-based CO2 emissions, representing a significant contribution of the present study.

Funding

This research was funded by JSPS KAKENHI, Grant Number JP19K20511.

Institutional Review Board Statement

Not applicable.

Informed Consent Statement

Not applicable.

Data Availability Statement

Not applicable.

Acknowledgments

The author extends gratitude to Hirotaka Takayabu for his helpful comments and suggestions on this paper over regular meetings. The author is also grateful to the editor and anonymous referees for their helpful comments and suggestions.

Conflicts of Interest

The author declares no conflict of interest.

References

  1. IEA. Global Energy Review: CO2 Emissions in 2020. Available online: https://www.iea.org/articles/global-energy-review-co2-emissions-in-2020 (accessed on 21 October 2021).
  2. Rhodium Group. Preliminary 2020 Greenhouse Gas Emissions Estimates for China. Available online: https://rhg.com/research/preliminary-2020-greenhouse-gas-emissions-estimates-for-china/ (accessed on 21 October 2021).
  3. EMBER. Global Electricity Review 2021. Available online: https://ember-climate.org/project/global-electricity-review-2021/ (accessed on 21 October 2021).
  4. IEA. Coal 2020. Available online: https://www.iea.org/reports/coal-2020/supply (accessed on 21 October 2021).
  5. Nakaishi, T.; Takayabu, H.; Eguchi, S. Environmental efficiency analysis of China’s coal-fired power plants considering heterogeneity in power generation company groups. Energy Econ. 2021, 102, 105511. [Google Scholar] [CrossRef]
  6. Renewable Energy World. China’s Renewable Energy Installed Capacity Grew 12 Percent Across All Sources in 2018. Available online: https://www.renewableenergyworld.com/2019/03/06/chinas-renewable-energy-installed-capacity-grew-12-percent-across-all-sources-in-2018/#gref (accessed on 21 October 2021).
  7. Unearthed. China Suspends 104 Planned Coal Power Plants. Available online: https://unearthed.greenpeace.org/2017/01/16/china-coal-power-overcapacity-crackdown/ (accessed on 21 October 2021).
  8. Yale School of the Environment. Despite Pledges to Cut Emissions, China Goes on a Coal Spree. Available online: https://e360.yale.edu/features/despite-pledges-to-cut-emissions-china-goes-on-a-coal-spree (accessed on 21 October 2021).
  9. CREA. China Dominates 2020 Coal Plant Development. Available online: https://globalenergymonitor.org/wp-content/uploads/2021/02/China-Dominates-2020-Coal-Development.pdf (accessed on 21 October 2021).
  10. Eguchi, S.; Takayabu, H.; Lin, C. Sources of inefficient power generation by coal-fired thermal power plants in China: A metafrontier DEA decomposition approach. Renew. Sustain. Energy Rev. 2021, 138, 110562. [Google Scholar] [CrossRef]
  11. Yang, H.; Pollitt, M. Incorporating both undesirable outputs and uncontrollable variables into DEA: The performance of Chinese coal-fired power plants. Eur. J. Oper. Res. 2009, 197, 1095–1105. [Google Scholar] [CrossRef] [Green Version]
  12. Charnes, A.; Cooper, W.W.; Rhodes, E. Measuring the efficiency of decision-making units. Eur. J. Oper. Res. 1978, 2, 429–444. [Google Scholar] [CrossRef]
  13. Cooper, W.W.; Seiford, M.L.; Tone, K. Data Envelopment Analysis—A Comprehensive Text with Models, Applications, References and DEA-Solver Software; Springer: Boston, MA, USA, 2007. [Google Scholar]
  14. Emrouznejad, A.; Yang, G.L. A survey and analysis of the first 40 years of scholarly literature in DEA: 1978–2016. Socio.-Econ. Plann. Sci. 2018, 61, 4–8. [Google Scholar] [CrossRef]
  15. Sueyoshi, T.; Goto, M. World trend in energy: An extension to DEA applied to energy and environment. J. Econ. Struct. 2017, 6, 13. [Google Scholar] [CrossRef]
  16. Kaneko, S.; Fujii, H.; Sawazu, N.; Fujikura, R. Financial allocation strategy for the regional pollution abatement cost of reducing sulfur dioxide emissions in the thermal power sector in China. Energy Policy 2010, 38, 2131–2141. [Google Scholar] [CrossRef]
  17. Nakaishi, T. Developing effective CO2 and SO2 mitigation strategy based on marginal abatement costs of coal-fired power plants in China. Appl. Energy 2021, 294, 116978. [Google Scholar] [CrossRef]
  18. Feng, C.; Zhang, H.; Huang, J.B. The approach to realizing the potential of emissions reduction in China: An implication from data envelopment analysis. Renew. Sustain. Energy Rev. 2017, 71, 859–872. [Google Scholar] [CrossRef]
  19. Wang, Q.; Zhao, Z.; Zhou, P.; Zhou, D. Energy efficiency and production technology heterogeneity in China: A meta-frontier DEA approach. Econ. Modell. 2013, 35, 283–289. [Google Scholar] [CrossRef]
  20. Zhang, N.; Kong, F.; Yu, Y. Measuring ecological total-factor energy efficiency incorporating regional heterogeneities in China. Ecol. Indic. 2015, 51, 165–172. [Google Scholar] [CrossRef]
  21. Yang, H.; Pollitt, M. The necessity of distinguishing weak and strong disposability among undesirable outputs in DEA: Environmental performance of Chinese coal-fired power plants. Energy Policy 2010, 38, 4440–4444. [Google Scholar] [CrossRef]
  22. Zhang, N.; Kong, F.; Choi, Y.; Zhou, P. The effect of size-control policy on unified energy and carbon efficiency for Chinese fossil fuel power plants. Energy Policy 2014, 70, 193–200. [Google Scholar] [CrossRef]
  23. Liu, X.; Wang, B.; Du, M.; Zhang, N. Potential economic gains and emissions reduction on carbon emissions trading for China’s large-scale thermal power plants. J. Clean. Prod. 2018, 204, 247–257. [Google Scholar] [CrossRef]
  24. Mou, D. Understanding China’s electricity market reform from the perspective of the coal-fired power disparity. Energy Policy 2014, 74, 224–234. [Google Scholar] [CrossRef]
  25. Song, C.; Li, M.; Zhang, F.; He, Y.L.; Tao, W.Q. A data envelopment analysis for energy efficiency of coal-fired power units in China. Energy Convers. Manag. 2015, 102, 121–130. [Google Scholar] [CrossRef]
  26. Wang, C.; Cao, X.; Mao, J.; Qin, P. The changes in coal intensity of electricity generation in Chinese coal-fired power plants. Energy Econ. 2019, 80, 491–501. [Google Scholar] [CrossRef]
  27. Yu, Y.; Qian, T.; Du, L. Carbon productivity growth, technological innovation, and technology gap change of coal-fired power plants in China. Energy Policy 2017, 109, 479–487. [Google Scholar] [CrossRef]
  28. Nakaishi, T.; Kagawa, S.; Takayabu, H.; Lin, C. Determinants of technical inefficiency in China’s coal-fired power plants and policy recommendations for CO2 mitigation. Environ. Sci. Pollut. Res. 2021, 28, 52064–52081. [Google Scholar] [CrossRef]
  29. Takayabu, H.; Kagawa, S.; Fujii, H.; Managi, S.; Eguchi, S. Impacts of productive efficiency improvement in the global metal industry on CO2 emissions. J. Environ. Manag. 2019, 248, 109261. [Google Scholar] [CrossRef]
  30. Takayabu, H. CO2 mitigation potentials in manufacturing sectors of 26 countries. Energy Econ. 2020, 86, 104634. [Google Scholar] [CrossRef]
  31. O’Donnell, C.J.; Rao, D.S.P.; Battese, G.E. Metafrontier frameworks for the study of firm-level efficiencies and technology ratios. Empir. Econ. 2008, 34, 231–255. [Google Scholar] [CrossRef]
  32. Du, K.; Lu, H.; Yu, K. Sources of the potential CO2 emission reduction in China: A nonparametric metafrontier approach. Appl. Energy 2014, 115, 491–501. [Google Scholar] [CrossRef]
  33. Sun, C.; Liu, X.; Li, A. Measuring unified efficiency of Chinese fossil fuel power plants: Intermediate approach combined with group heterogeneity and window analysis. Energy Policy 2018, 123, 8–18. [Google Scholar] [CrossRef]
  34. Zhang, N.; Choi, Y. Total-factor carbon emission performance of fossil fuel power plants in China: A metafrontier non-radial Malmquist index analysis. Energy Econ. 2013, 40, 549–559. [Google Scholar] [CrossRef]
  35. Long, X.; Wu, C.; Zhang, J.; Zhang, J. Environmental efficiency for 192 thermal power plants in the Yangtze River Delta considering heterogeneity: A metafrontier directional slacks-based measure approach. Renew. Sustain. Energy Rev. 2018, 82, 3962–3971. [Google Scholar] [CrossRef]
  36. Ang, B.W.; Zhang, F.Q.; Choi, K.H. Factorizing changes in energy and environmental indicators through decomposition. Energy 1998, 23, 489–495. [Google Scholar] [CrossRef]
  37. Ang, B.W. Decomposition analysis for policymaking in energy: Which? Energy Policy 2004, 32, 1131–1139. [Google Scholar] [CrossRef]
  38. Banker, R.D.; Charnes, A.; Cooper, W.W. Some models for estimating technical and scale inefficiencies in data envelopment analysis. Manag. Sci. 1984, 30, 1078–1092. [Google Scholar] [CrossRef] [Green Version]
  39. Munisamy, S.; Arabi, B. Eco-efficiency change in power plants: Using a slacks-based measure for the meta-frontier Malmquist-Luenberger productivity index. J. Clean. Prod. 2015, 105, 218–232. [Google Scholar] [CrossRef]
  40. Shanmugam, K.R.; Kulshreshtha, P. Efficiency analysis of coal-based thermal power generation in India during post-reform era. Int. J. Glob. Energy Issues 2005, 23, 15–28. [Google Scholar] [CrossRef]
  41. Wu, C.; Oh, K.; Long, X.; Zhang, J. Effect of installed capacity size on environmental efficiency across 528 thermal power stations in North China. Environ. Sci. Pollut. Res. 2019, 26, 29822–29833. [Google Scholar] [CrossRef] [PubMed]
  42. Banker, D.R.; Charnes, A.; Cooper, W.W.; Swarts, J.; Thomas, A.D. An introduction to data envelopment analysis with some of its models and their uses. Res. Gov. Non-Profit Acc. 1989, 5, 125–163. [Google Scholar]
  43. Garg, A.; Kainou, K.; Pulles, T. Chapter 1. IPCC Guidelines for National Greenhouse Gas Inventories, in: Energy, 2. Available online: https://www.ipcc-nggip.iges.or.jp/public/2006gl/vol2.html (accessed on 8 March 2022).
  44. Wang, Q.; Su, B.; Zhou, P.; Chiu, C.R. Measuring total-factor CO2 emission performance and technology gaps using a non-radial directional distance function: A modified approach. Energy Econ. 2016, 56, 475–482. [Google Scholar] [CrossRef]
  45. Ang, B.W.; Choi, K.H. Decomposition of aggregate energy and gas emission intensities for industry: A refined divisia index method. Energy J. 1997, 18, 59–73. [Google Scholar] [CrossRef]
  46. China Electricity Council. Statistical Data Compilation of the Electric Power Industry; SDX Joint Publishing Company: Beijing, China, 2014. [Google Scholar]
  47. Xie, L.; Huang, Y.; Qin, P. Spatial distribution of coal-fired power plants in China. Envir. Dev. Econ. 2018, 23, 495–515. [Google Scholar] [CrossRef]
  48. Miura, K. Advanced Clean Coal Technologies in Japan; CMC Publishing: Tokyo, Japan, 2014. (In Japanese) [Google Scholar]
  49. Sahu, S.G.; Chakraborty, N.; Sarker, P. Coal–biomass co-combustion: An overview. Renew. Sustain. Energy Rev. 2014, 39, 575–586. [Google Scholar] [CrossRef]
  50. Osman, A.I.; Mehta, N.; Elgarahy, A.M.; Al-Hinai, A.; Al-Muhtaseb, A.H.; Rooney, D.W. Conversion of biomass to biofuels and life cycle assessment: A review. Environ. Chem. Lett. 2021, 19, 4075–4118. [Google Scholar] [CrossRef]
  51. Yang, Q.; Huang, T.; Wang, S.; Li, J.; Dai, S.; Wright, S.; Wang, Y.; Peng, H. A GIS-based high spatial resolution assessment of large-scale PV generation potential in China. Appl. Energy 2019, 247, 254–269. [Google Scholar] [CrossRef]
  52. Borowski, P.F. Management of Energy Enterprises in Zero-Emission Conditions: Bamboo as an Innovative Biomass for the Production of Green Energy by Power Plants. Energies 2022, 15, 1928. [Google Scholar] [CrossRef]
  53. Li, Y.; Lukszo, Z.; Weijnen, M. The impact of inter-regional transmission grid expansion on China’s power sector decarbonization. Appl. Energy 2016, 183, 853–873. [Google Scholar] [CrossRef] [Green Version]
  54. Ma, L. Inter-Provincial Power Transmission and Its Embodied Carbon Flow in China: Uneven Green Energy Transition Road to East and West. Energies 2022, 15, 176. [Google Scholar] [CrossRef]
  55. Borowski, P.F. Digitization, Digital Twins, Blockchain, and Industry 4.0 as Elements of Management Process in Enterprises in the Energy Sector. Energies 2021, 14, 1885. [Google Scholar] [CrossRef]
Figure 1. Conceptual illustration of the MDEA framework proposed in this study.
Energies 15 02430 g001
Figure 2. Boxplots of meta inefficiency in (a) the small–medium (SM) group and (b) the LARGE group by year and region. ’09, ’10, and ’11 refer to the years 2009, 2010, and 2011, respectively. “×” and “°” stand for the average value and outliers, respectively.
Energies 15 02430 g002
Figure 3. Boxplots of technological factor in (a) the SM group and (b) the LARGE group by year and region. ’09, ’10, and ’11 refer to the years 2009, 2010, and 2011, respectively. “×” and “°” stand for the average value and outliers, respectively.
Energies 15 02430 g003
Figure 4. Change in average utilization ratio for SM and LARGE groups.
Energies 15 02430 g004
Figure 5. Boxplots of inter-regional factor in (a) the SM group and (b) the LARGE group by year and region. ’09, ’10, and ’11 refer to the years 2009, 2010, and 2011, respectively. “×” and “°” stand for the average value and outliers, respectively.
Energies 15 02430 g005
Figure 6. Boxplots of managerial factors in (a) the SM group and (b) the LARGE group by year and region. ’09, ’10, and ’11 refer to the years 2009, 2010, and 2011, respectively. “×” and “°” stand for the average value and outliers, respectively.
Energies 15 02430 g006
Figure 7. Comparison between average efficiency and scale change effects in (a) the SM group and (b) the LARGE group across the four regions.
Energies 15 02430 g007
Figure 8. Breakdown of efficiency change effects for the SM group in the (a) east, (b) central, (c), west, and (d) northeast regions.
Energies 15 02430 g008
Figure 9. Breakdown of efficiency change effects for the LARGE group in the (a) east, (b) central, (c), west, and (d) northeast regions.
Energies 15 02430 g009
Table 1. Descriptive statistics for the inputs and output of this study.
InputOutput
YearStatisticCapital (Million kWh)Coal Consumption (Thousand ton)Net Electricity Production (Million kWh)
2009Avg.4112.51900.33740.4
Max.26,232.013,658.925,077.9
Min.11.23.69.3
2010Avg.4428.92123.34100.4
Max.26,611.213,649.925,466.3
Min.1.61.71.3
2011Avg.4691.92297.74344.3
Max.29,505.615,653.128,236.9
Min.0.81.30.7
Table 2. Summary of the changes for each inefficiency factor and its components in the SM group. The percentage in parentheses represents the proportion of each factor to meta inefficiency.
Technological FactorInter-Regional FactorManagerial FactorMeta Inefficiency
2009East0.002 (3.4%)0.013 (23.0%)0.042 (73.6%)0.057
Central0.002 (2.6%)0.004 (4.7%)0.087 (92.8%)0.093
West0.004 (6.6%)0.026 (39.2%)0.036 (54.2%)0.066
Northeast0.002 (3.4%)0.035 (47.5%)0.037 (49.1%)0.074
Overall average0.003 (3.7%)0.015 (20.5%)0.056 (75.8%)0.074
2011East0.011 (17.4%)0.009 (13.6%)0.043 (69.0%)0.063
Central0.014 (19.3%)0.002 (2.3%)0.058 (78.3%)0.074
West0.018 (23.3%)0.024 (31.3%)0.035 (45.4%)0.078
Northeast0.014 (14.8%)0.047 (48.1%)0.036 (37.1%)0.097
Overall average0.014 (19.3%)0.013 (18.3%)0.046 (62.4%)0.074
Table 3. Summary of the changes for each inefficiency factor and its components in the LARGE group. The percentage in parentheses represents the proportion of each factor to meta inefficiency.
Technological FactorInter-Regional FactorManagerial FactorMeta Inefficiency
2009East0.004 (10.5%)0.002 (4.9%)0.034 (84.7%)0.041
Central0.004 (7.5%)0.016 (30.5%)0.033 (62.0%)0.053
West0.002 (5.9%)0.019 (44.6%)0.021 (49.4%)0.042
Northeast0.004 (7.9%)0.038 (70.3%)0.012 (21.8%)0.054
Overall average0.004 (8.5%)0.012 (25.0%)0.031 (66.4%)0.046
2011East0.006 (18.1%)0.007 (22.8%)0.019 (59.1%)0.032
Central0.003 (7.5%)0.009 (21.8%)0.030 (70.7%)0.042
West0.002(4.9%)0.028 (64.1%)0.014 (31.0%)0.044
Northeast0.002 (6.5%)0.019 (57.8%)0.012 (35.7%)0.033
Overall average0.004 (11.1%)0.011 (30.5%)0.022 (58.3%)0.037
Table 4. Change in CRP for each production-scale and regional group.
(Unit: Million ton)20092011Rate of Increase (%)Sample Size
SMEast2.032.3616.663
Central5.365.390.673
West3.474.5932.349
Northeast0.831.0425.219
Total11.6913.3914.5204
LARGEEast10.8311.041.987
Central10.9012.5515.170
West3.584.7632.924
Northeast1.651.9116.013
Total26.9730.2612.2194
Publisher’s Note: MDPI stays neutral with regard to jurisdictional claims in published maps and institutional affiliations.

