
Prediction of Pressure Increase during Waste Water Injection to Prevent Seismic Events

Abstract
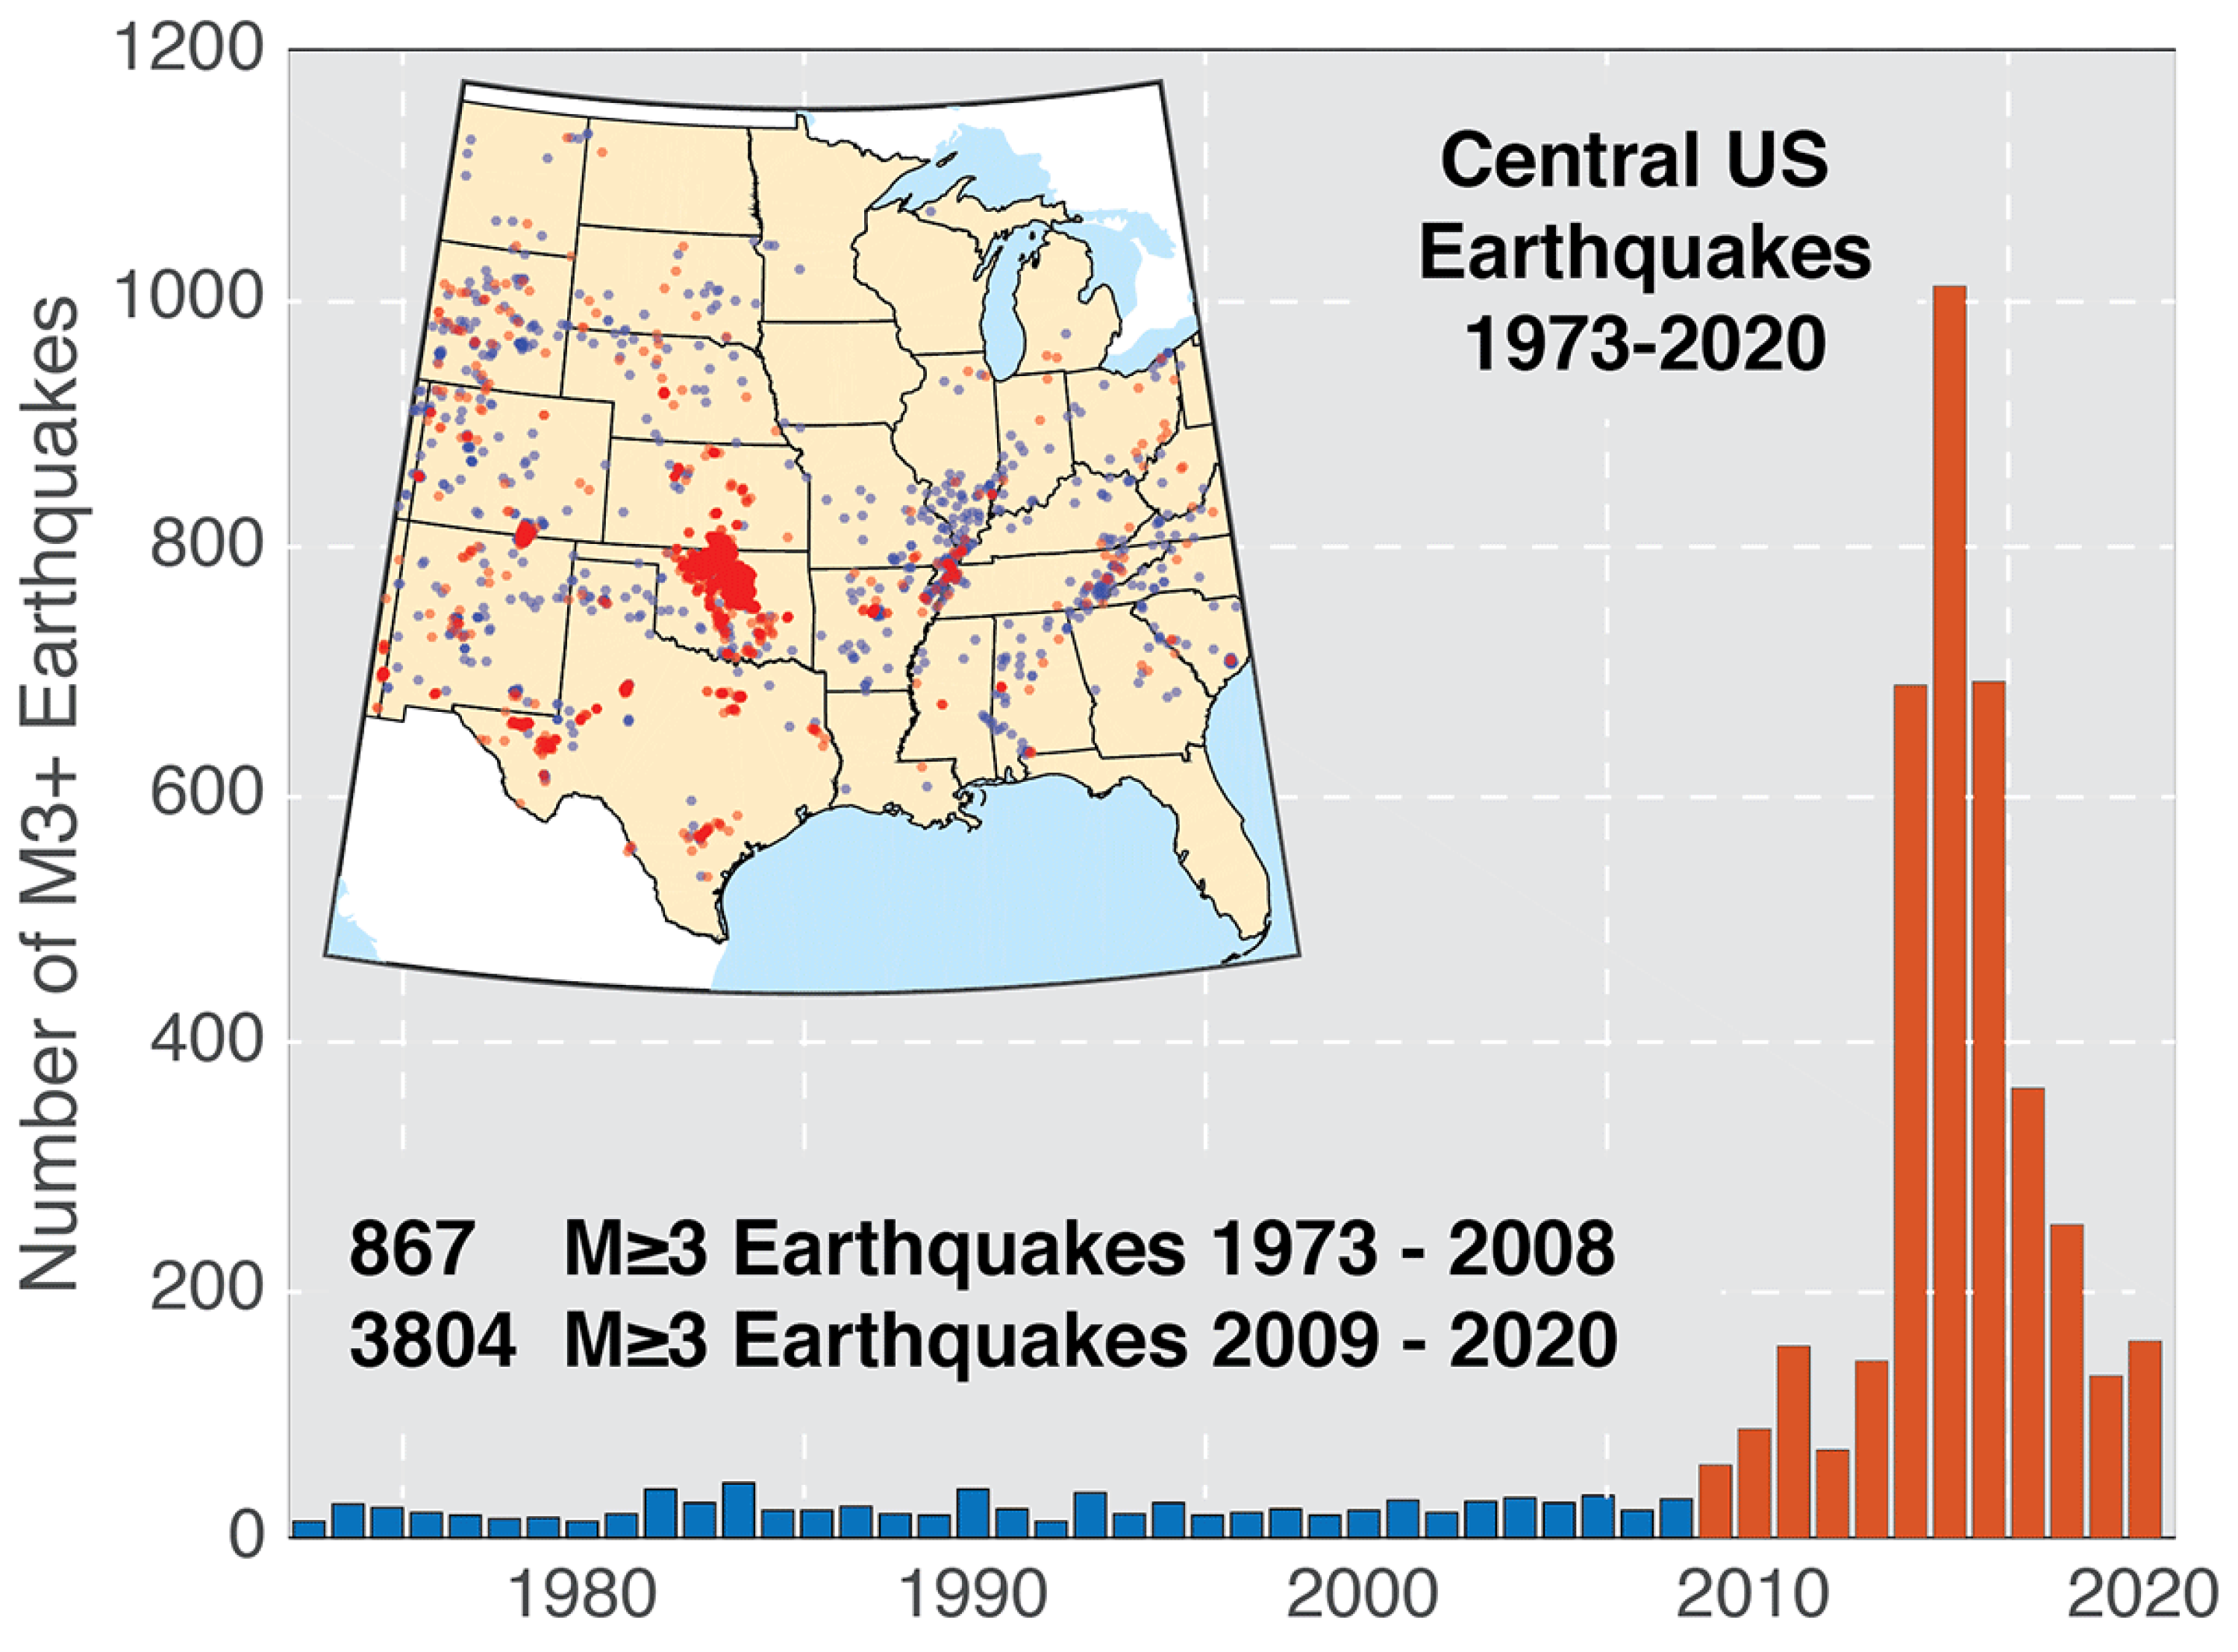
:1. Introduction
2. Research Gaps and Objectives
3. Research Methodology
3.1. Mechanisms of Injection-Caused Seismicity
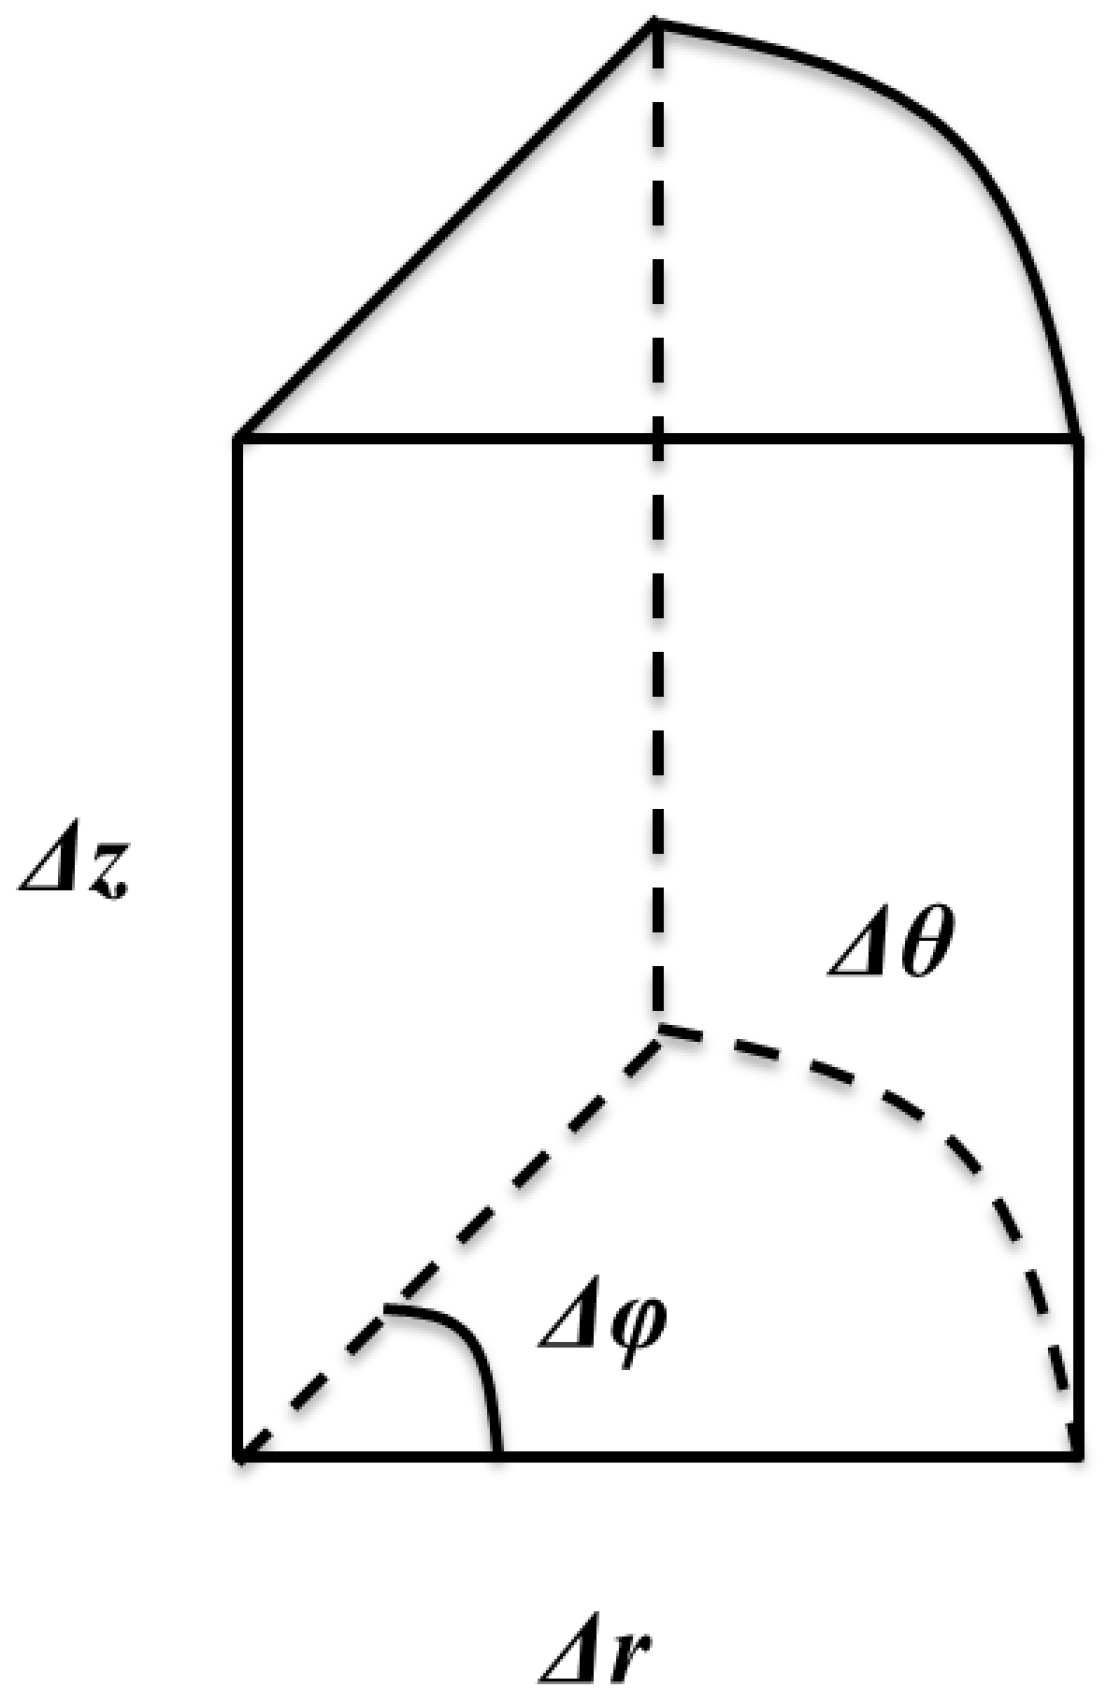
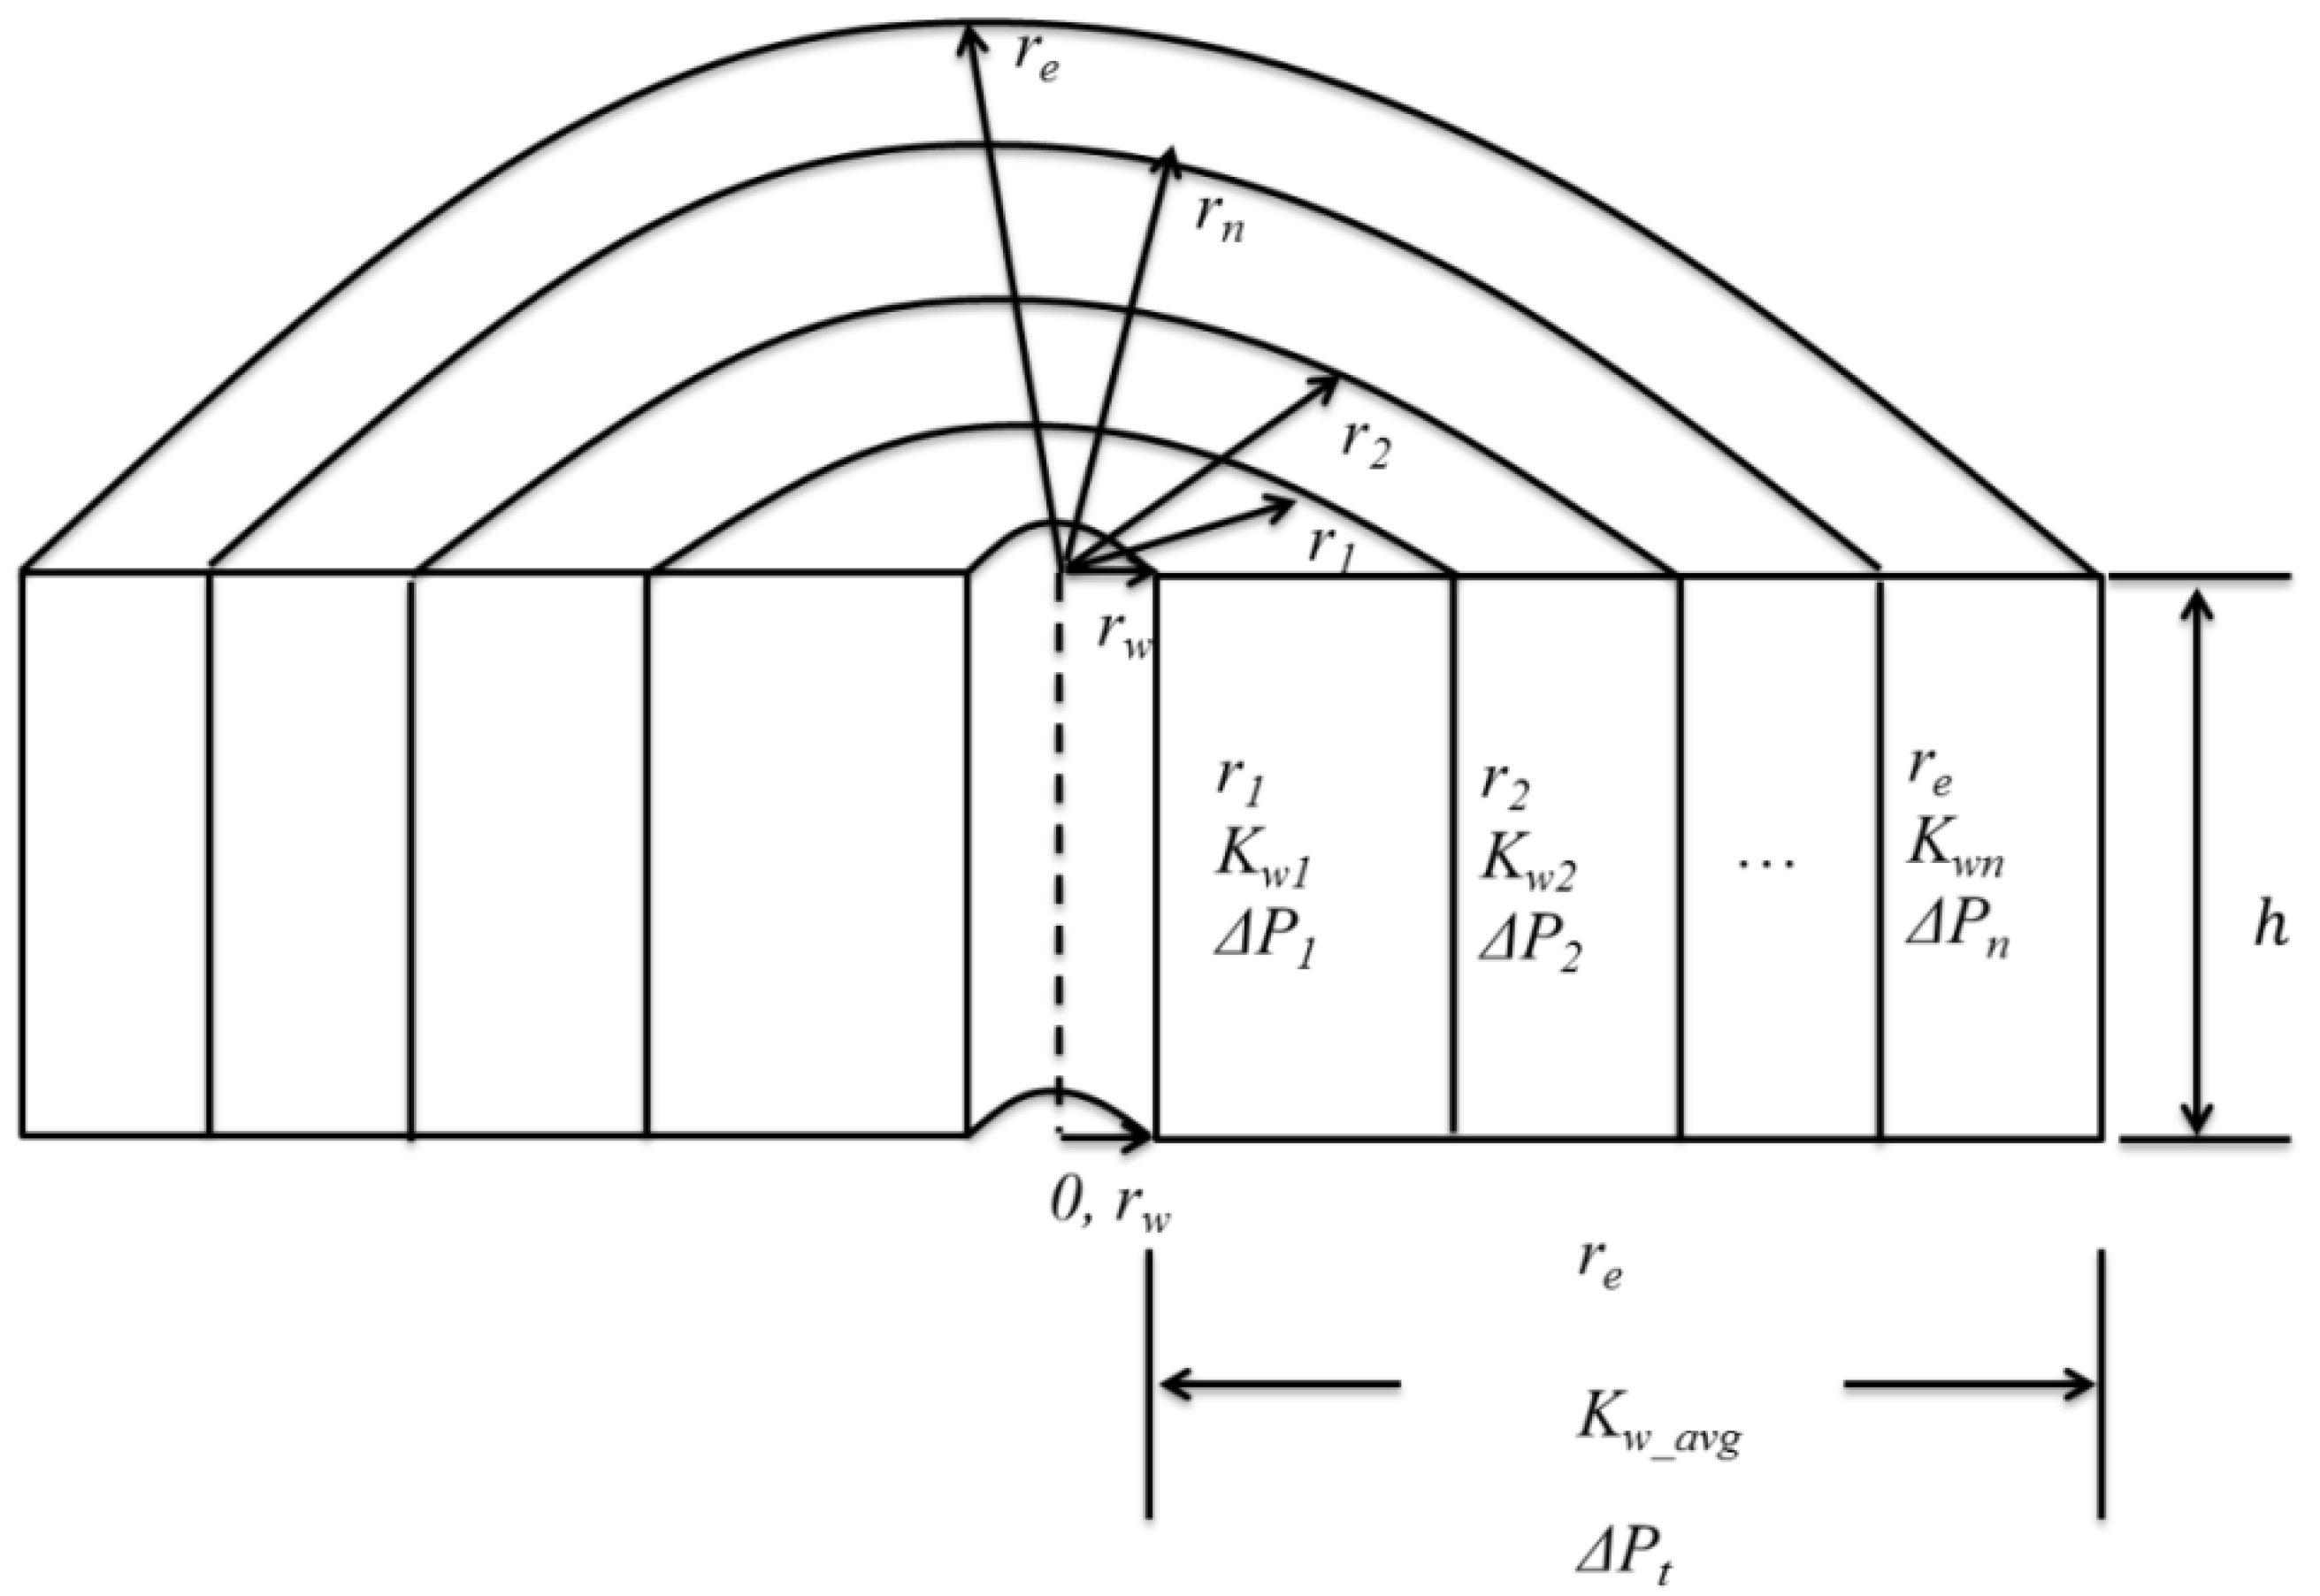
3.2. Analytical Modeling of Injectivity Decline
- The rock is homogeneous and no fines migration happens in the injection process;
- The oil droplets and pore throats are log-normally distributed;
- Oil droplet is the only contaminant, there are no solid particles in the injection water;
- Oil droplets are stable and their sizes are constant in the water before being injected into the rock;
- The oily water is injected into the rock at a constant flow rate;
- No oil is generated or disappeared in the process.
3.3. Skin Factor of Injectivity Decline
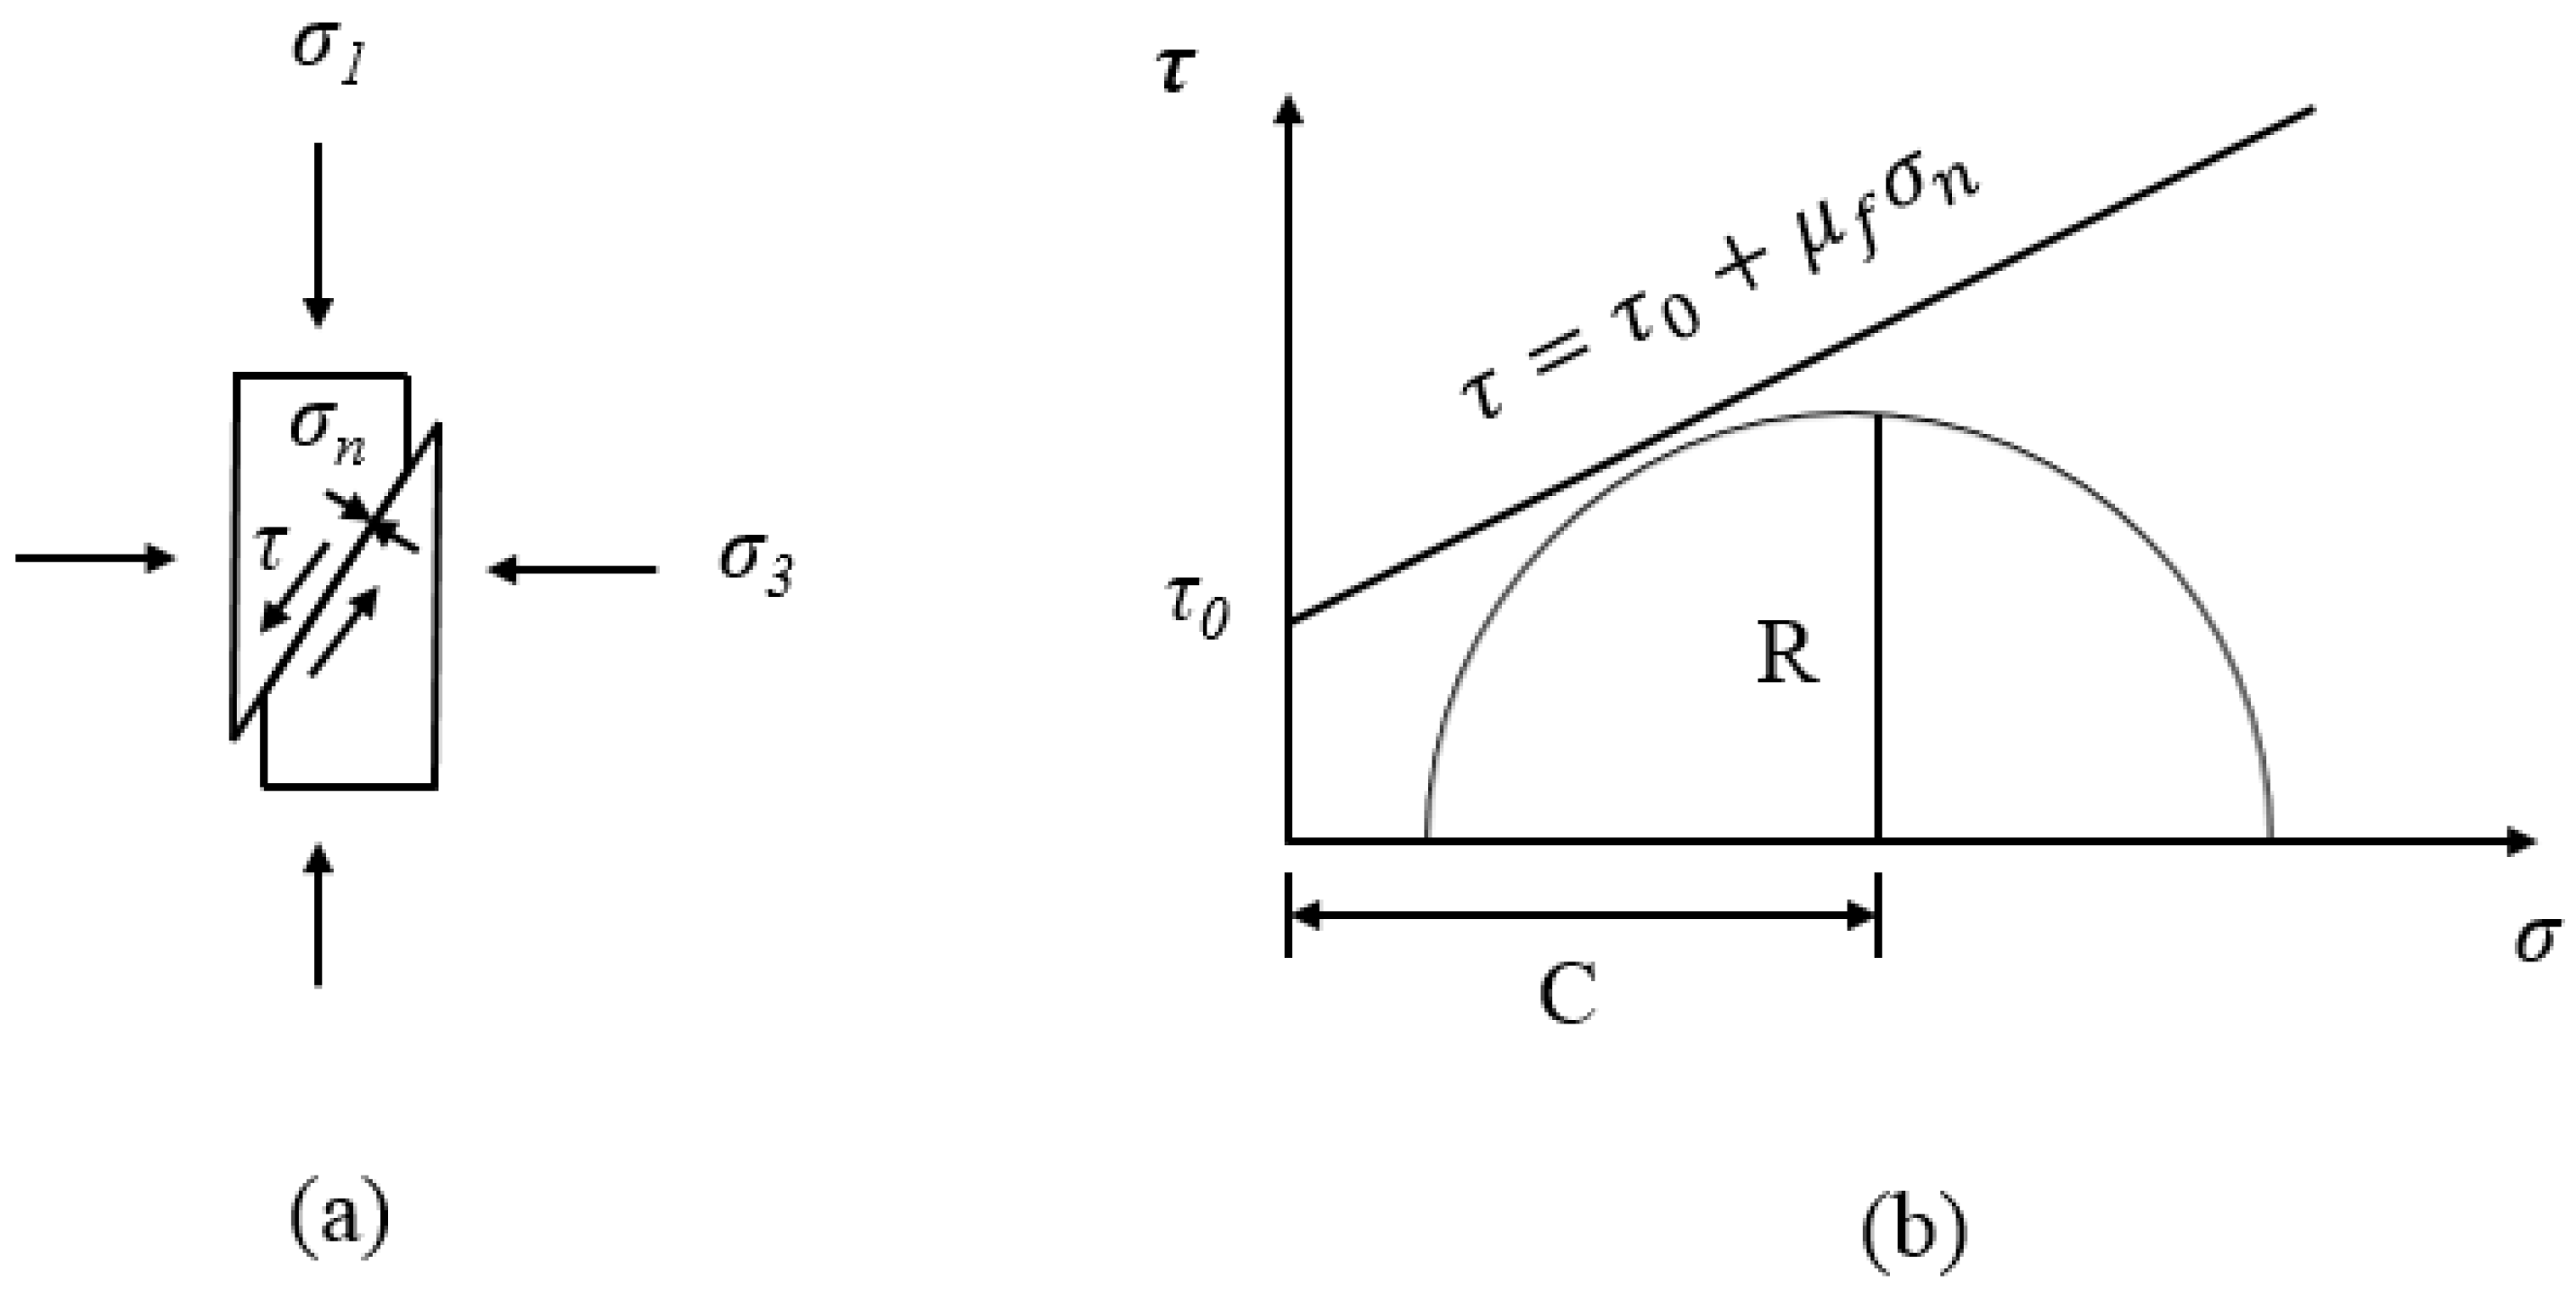
3.4. Geomechanical Model of Rock Failure
4. Case Study
5. Discussion
6. Conclusions
- All the studies show that injection of oily water would cause a rapid initial increase of pressure due well’s injectivity decline when an equilibrium oil saturation develops in the near-wellbore region. In the Entrada formation, even a low oil concentration of 500 ppm in the injection water would generate a positive skin factor in less than 30 days;
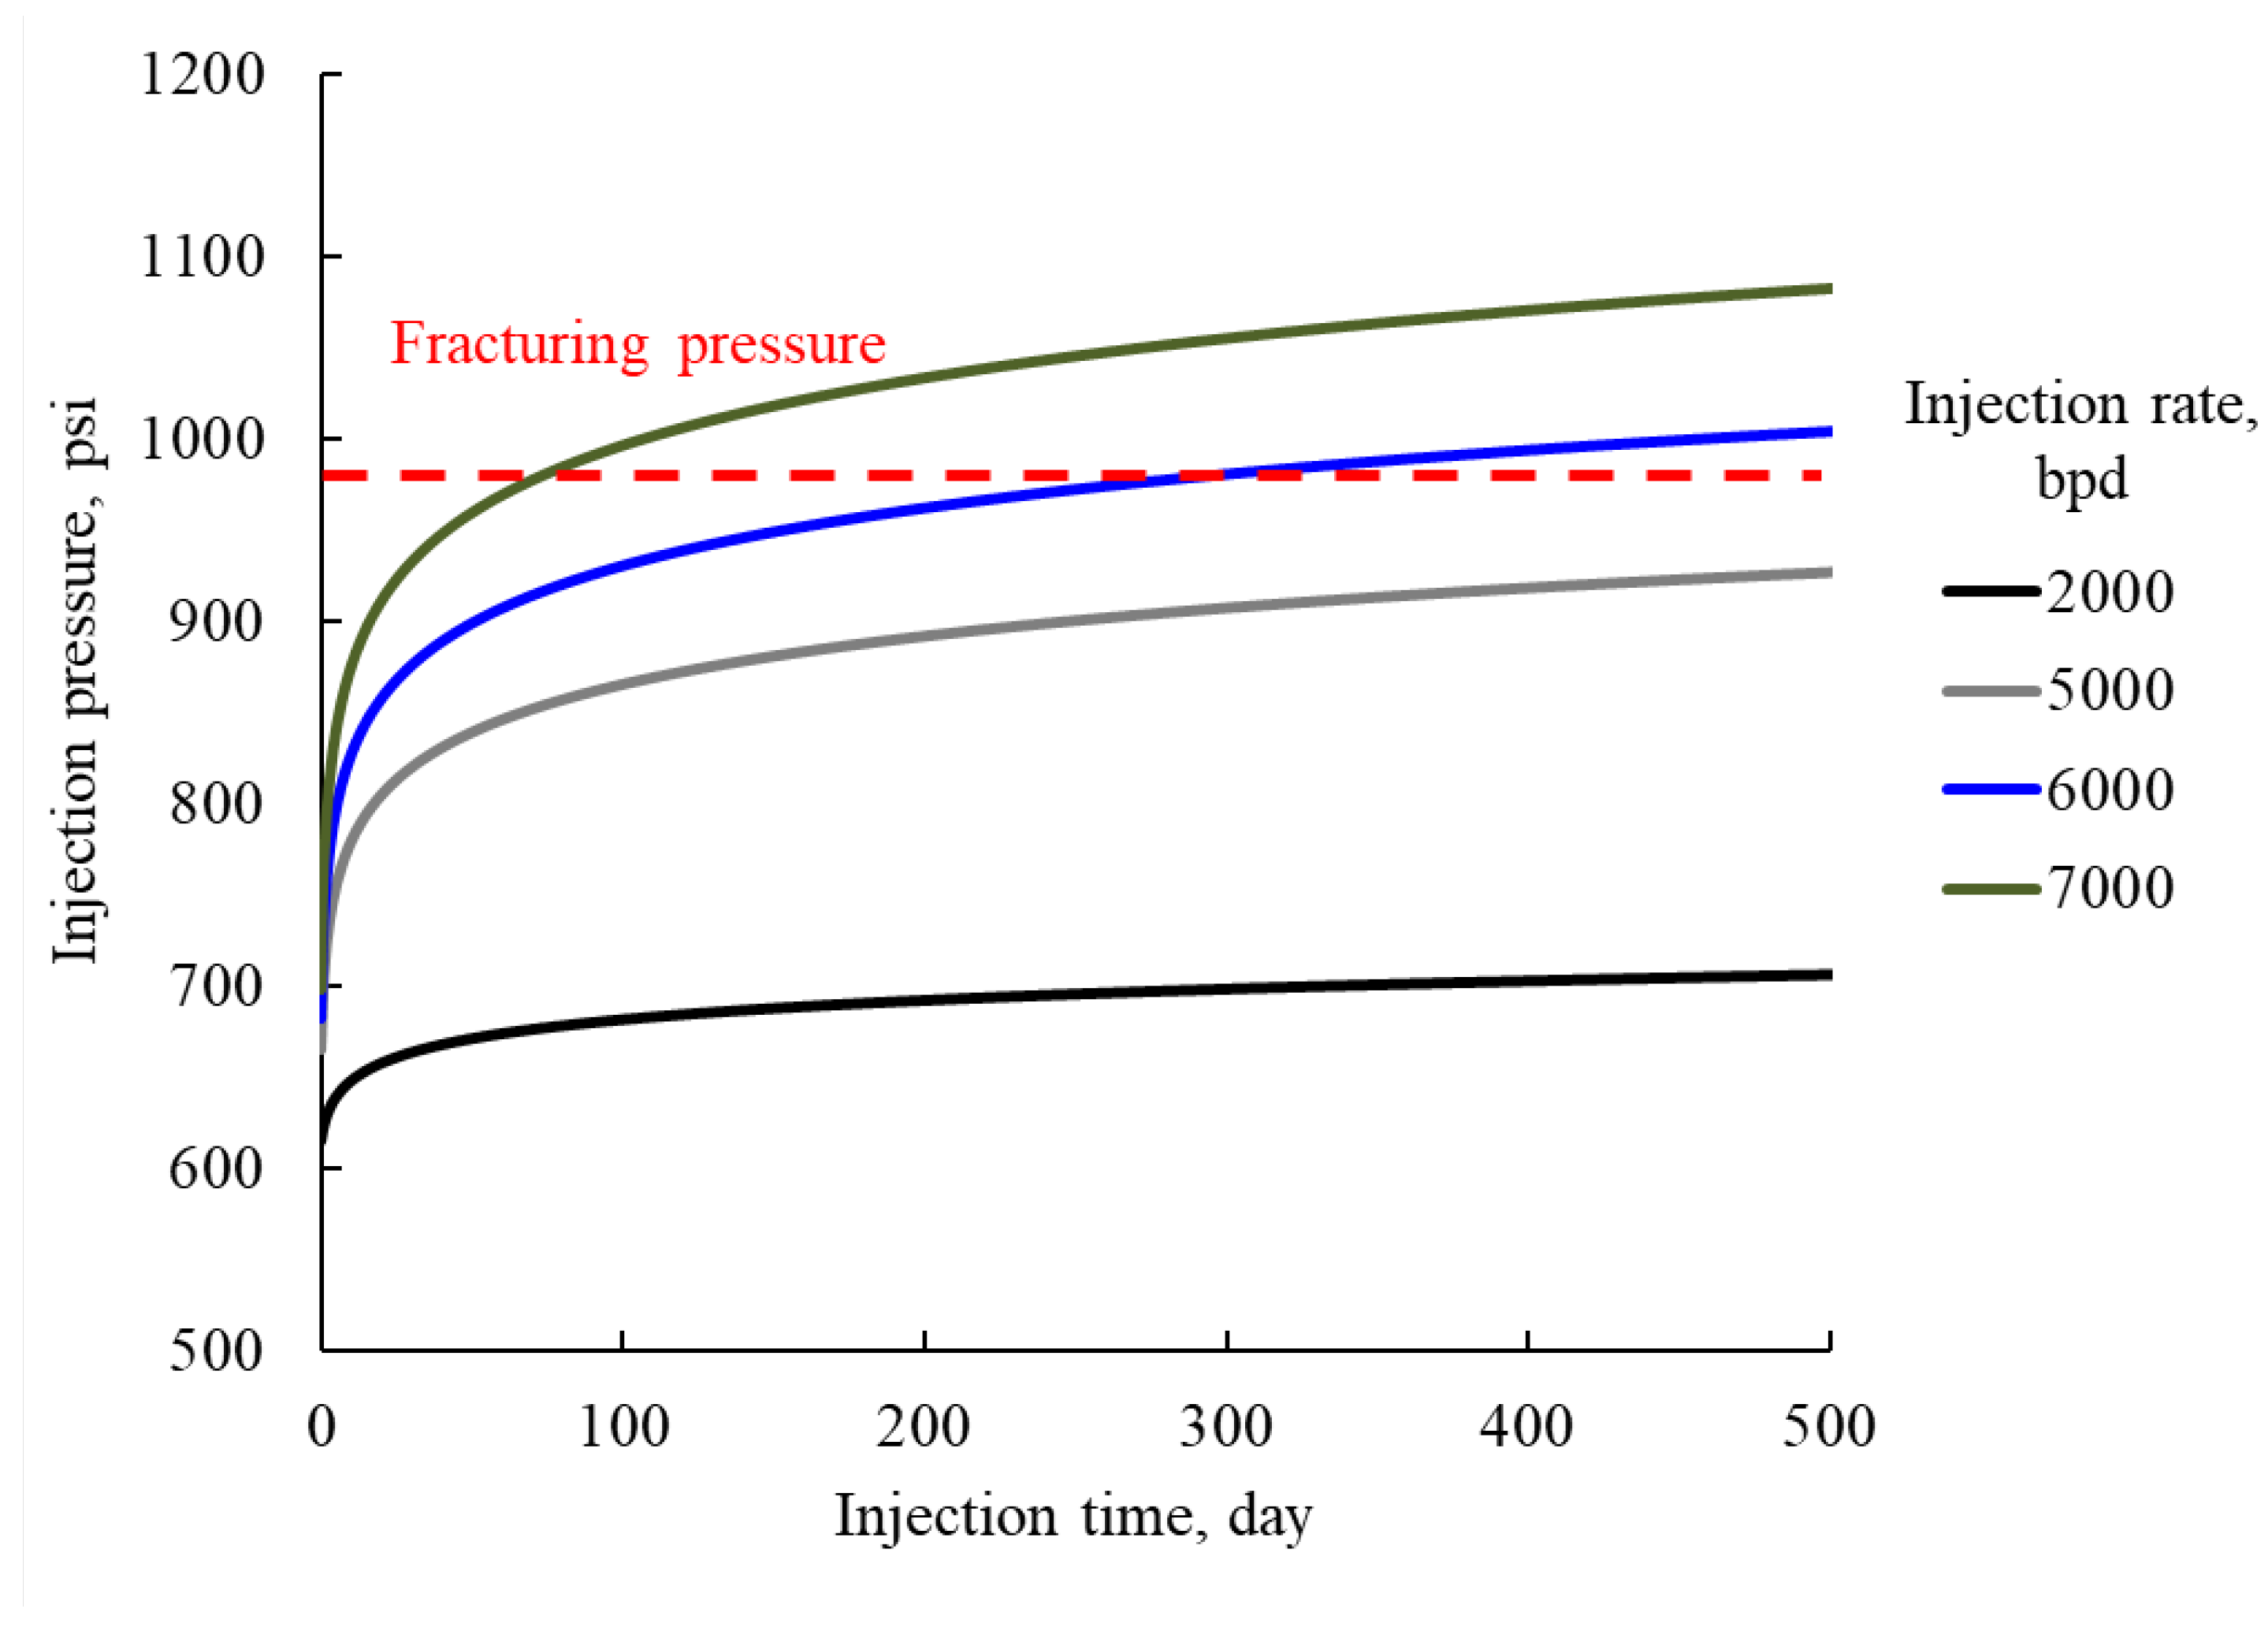
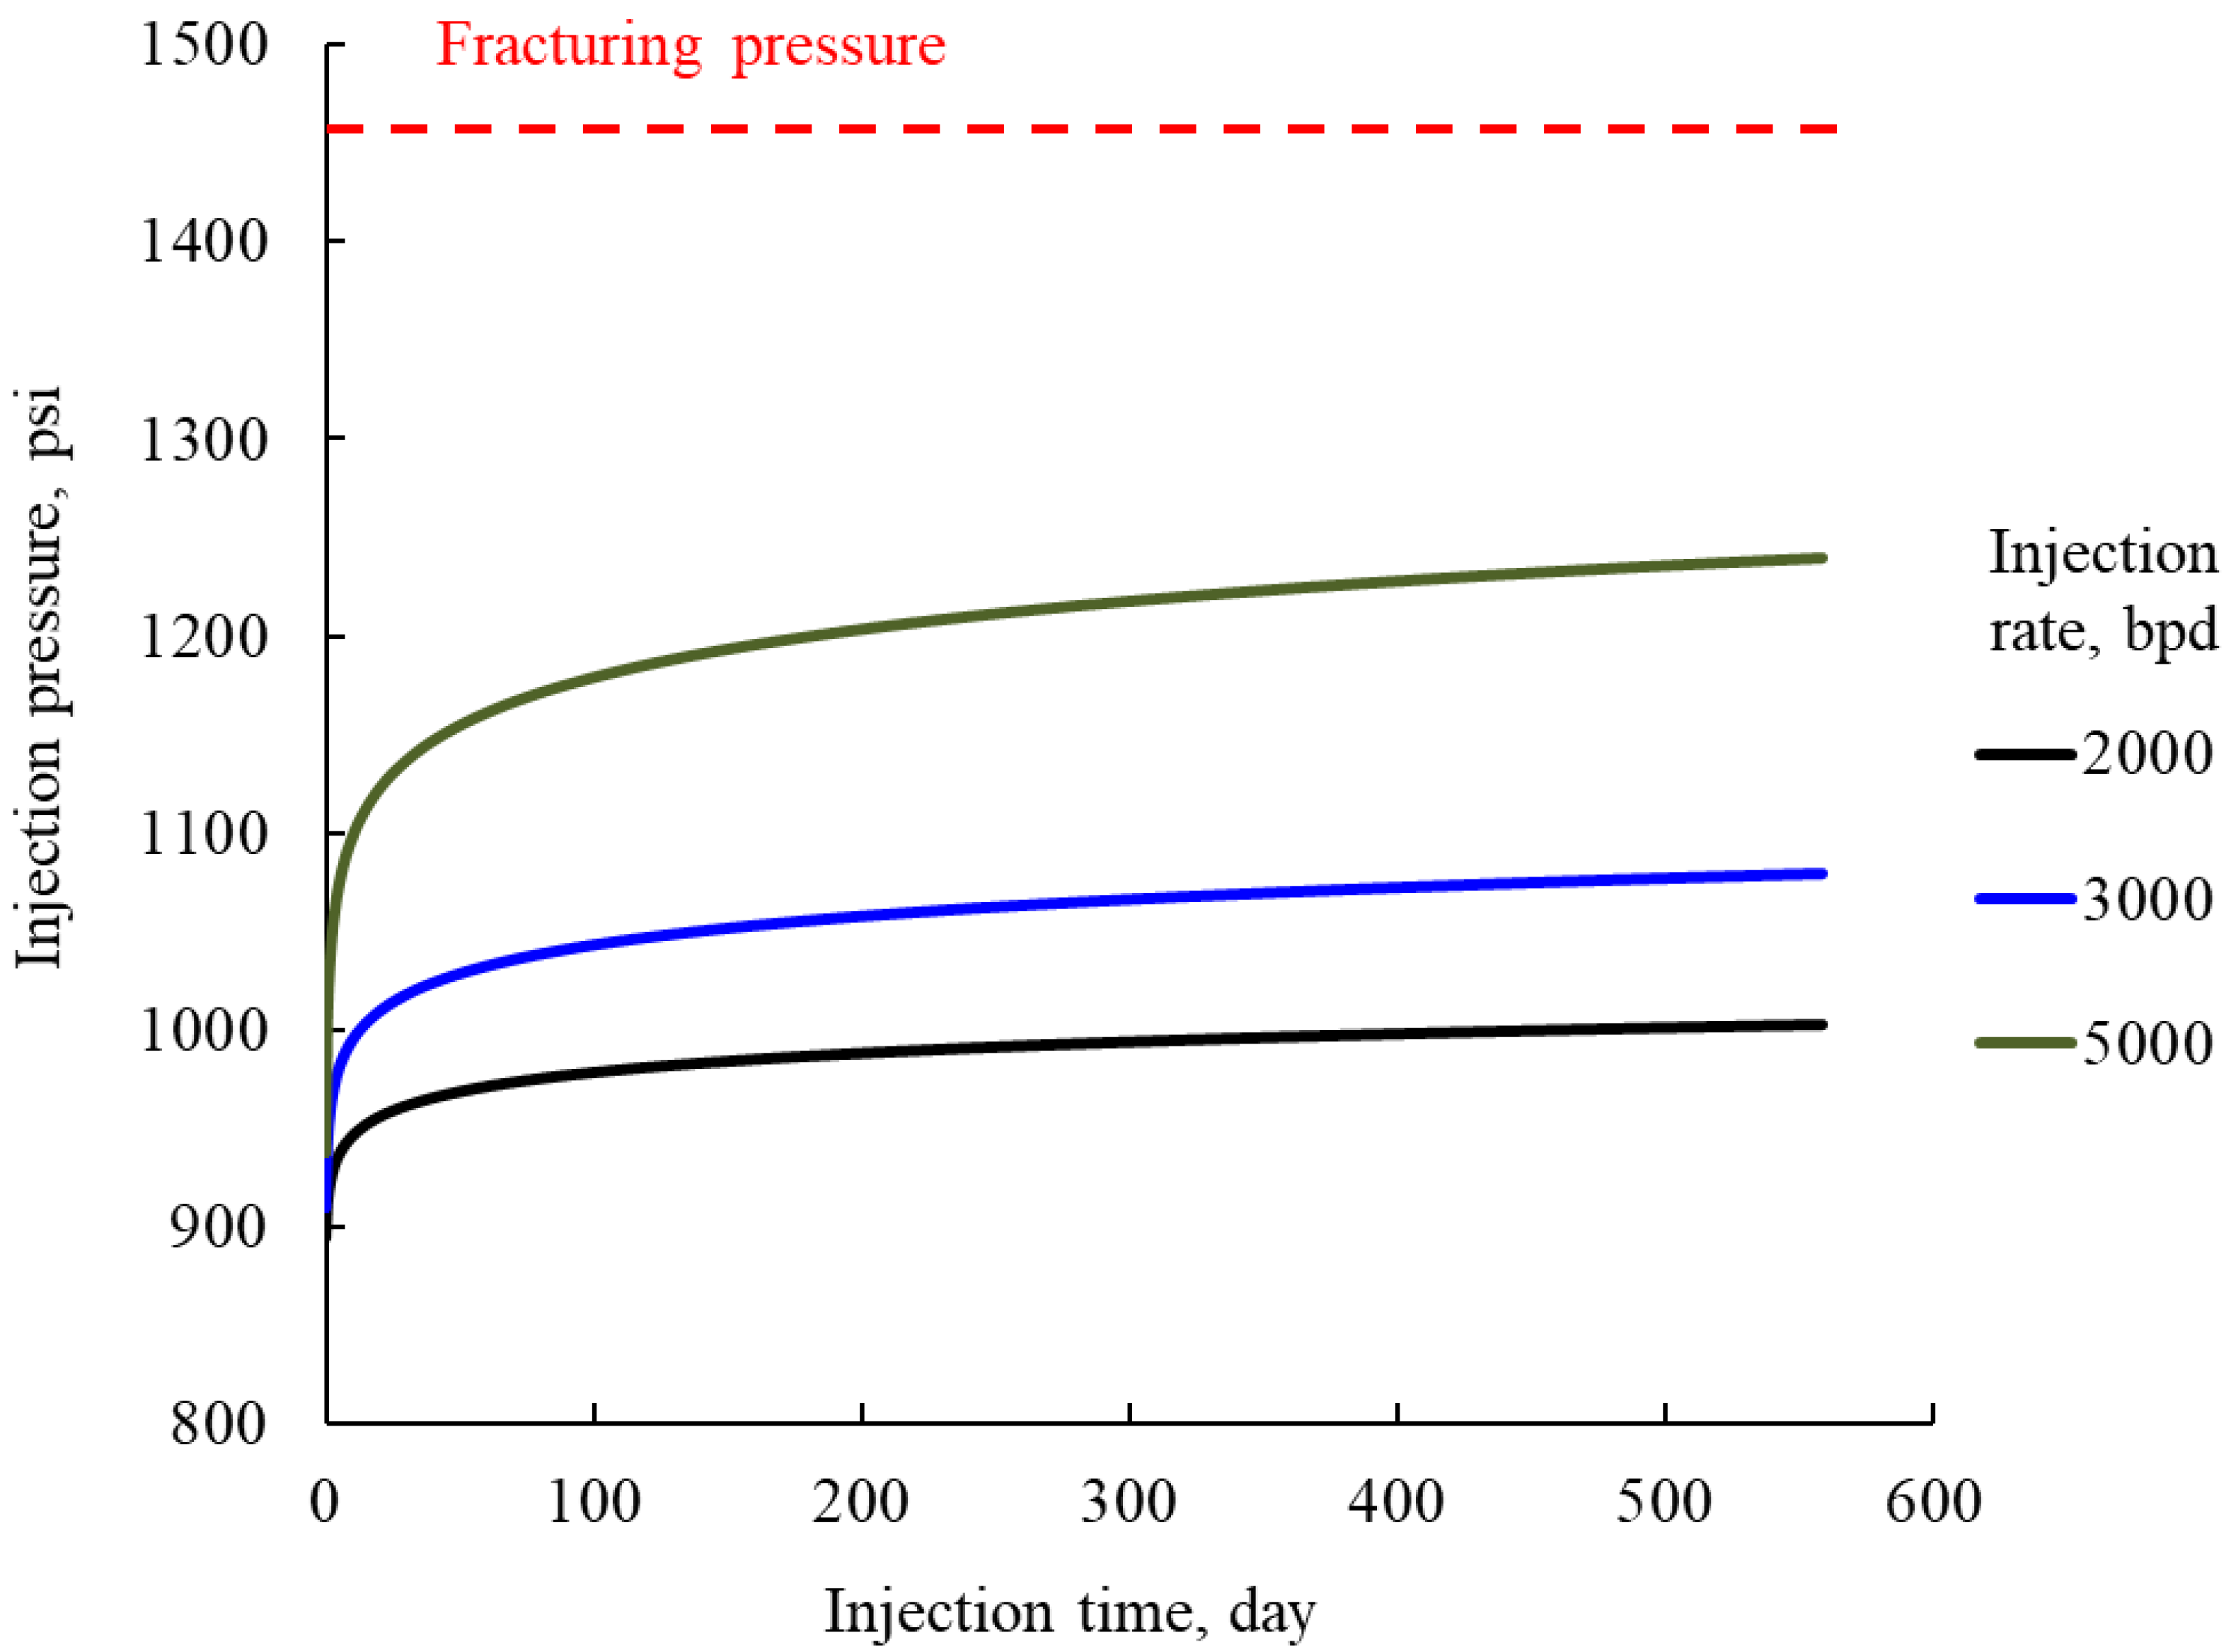
- The strong effect of excessive oil concentration on early pressure increase could only be controlled by reducing the rate of injection to assure continuing long-time operation as is the case in the M field. This may be important in designing a water disposal system in oilfields with a large volume of produced water where the number and cost of designated injection wells have to be weighed against the frequency (and cost) of well stimulations needed to control injectivity damage;
- Formations with high initial permeability (>3000 mD [3.0 × 10⁻¹² m2]) are favorable for oily water injection. A loss of 30% water injectivity caused by oily water injection may not harm the overall injection performance;
- Water injection is not likely to induce seismic events when the injected formation has high permeability and high fracturing pressure, especially when injectors are far away from faults. However, for formations with low permeability (<25 mD [2.5 × 10⁻¹⁴ m2]) assuming the other properties are the same as shown in Table A1 even a small injection rate (300 bpd [48 m3/d]) could trigger a series of seismic events string with rock fracture due to rapid injection pressure increase in the near-wellbore region and possibly followed by slippage of the nearby fault or unstable strike-slip rock structure.
- The case studies show different long-time patterns of injection pressure increase: a flat pattern with practically no pressure increase in the Entrada formation, and a progressive–pattern with continuous pressure increase in the M and the Nebo-Hemphill oilfields–particularly at higher injection rates. The two patterns may result from different mechanisms of oil capture inside the rock with the flat pattern representing local near-well permeability damage due to local oil capture, and the progressive pattern indicating radial expansion of oil capture–as implied by Equation (20).
Author Contributions
Funding
Data Availability Statement
Acknowledgments
Conflicts of Interest
Appendix A. Field Data for Case Study

| Parameter | Value | Unit | Value | Unit |
|---|---|---|---|---|
| Water injection rate () | 2000~10,000 | bpd | 318~1590 | m3/d |
| Absolute permeability () | 256 | mD | 2.5 × 10⁻¹³ | m2 |
| Porosity () | 0.212 | fraction | 0.212 | fraction |
| Well radius () | 0.292 | ft | 0.089002 | m |
| Formation radius () | 1000 | ft | 304.8 | m |
| Formation depth () | 5914 | ft | 1797 | m |
| Formation thickness () | 15 | ft | 4.572 | m |
| Formation pressure () | 2560 | psi | 17,656 | kpa |
| Formation fracturing pressure () | 4334 | psi | 29,882 | kpa |
| Oil density () | 7.18 | lbm/ft3 | 860 | kg/m3 |
| Water viscosity () | 1 | cp | 1 | cp |
| Oil viscosity () | 6.11 | cp | 6.11 | cp |
| Water relative permeability exponent () | 4 | dimensionless | 4 | dimensionless |
| Oil relative permeability exponent () | 6 | dimensionless | 6 | dimensionless |
| Connate water saturation () | 0.068 | fraction | 0.068 | fraction |
| Residual oil saturation () | 0 | fraction | 0 | fraction |
| Oil concentration () | 500 | ppm | 500 | ppm |
| Equilibrium oil saturation () | 0.08 | fraction | 0.08 | fraction |
| Oil-water interfacial tension () | 35 | dyne/cm | 35 | dyne/cm |
| Critical capillary number () | 10−4 | dimensionless | 10−4 | dimensionless |
| Bump rate constant () | 5 | dimensionless | 5 | dimensionless |
| Size ratio () | 0.152 | dimensionless | 0.152 | dimensionless |
| Poison’s Ratio (v) | 0.311 | dimensionless | 0.311 | dimensionless |
| Vertical principal stress | 5914 | psi | 40,775 | kPa |
| Horizontal maximum principal stress | 5396 | psi | 37,204 | kPa |
| Horizontal minimumprincipal stress | 3997 | psi | 27,558 | kPa |
| 1200 | psi | 8273 | kPa | |
| Friction coefficient | 0.6 | dimensionless | 0.6 | dimensionless |
| Parameter | Value | Unit | Value | Unit |
|---|---|---|---|---|
| Water injection rate () | 2000~7000 | bpd | 318–1113 | m3/d |
| Absolute permeability () | 1218 | mD | 1.2 × 10⁻¹² | m2 |
| Porosity () | 0.28 | fraction | 0.28 | fraction |
| Well radius () | 0.292 | ft | 0.089002 | m |
| Oil zone thickness () | 65.6 | ft | 20 | m |
| Aquifer radius () | 1000 | ft | 304.8 | m |
| Aquifer depth () | 1345 | ft | 410 | m |
| Aquifer thickness () | 295 | ft | 90 | m |
| Drainage completion length () | 20 | ft | 6 | m |
| Injection completion length () | 20 | ft | 6 | m |
| Aquifer outer boundary pressure () | 582.5 | psi | 4016 | kpa |
| Formation fracturing pressure () | 986 | psi | 6798 | kpa |
| Oil density () | 58.68 | lbm/ft3 | 940 | kg/m3 |
| Water viscosity () | 0.7 | cp | 0.7 | cp |
| Oil viscosity () | 230 | cp | 230 | cp |
| Water relative permeability exponent () | 7 | dimensionless | 7 | dimensionless |
| Oil relative permeability exponent () | 5 | dimensionless | 5 | dimensionless |
| Connate water saturation () | 0.224 | fraction | 0.224 | fraction |
| Residual oil saturation () | 0 | fraction | 0 | fraction |
| Oil concentration () | 500 | ppm | 500 | ppm |
| Equilibrium oil saturation () | 0.34 | fraction | 0.34 | fraction |
| Oil-water interfacial tension () | 50 | dyne/cm | 50 | dyne/cm |
| Critical capillary number () | 10−4 | dimensionless | 10−4 | dimensionless |
| Bump rate constant () | 5 | dimensionless | 5 | dimensionless |
| Size ratio () | 0.5 | dimensionless | 0.5 | dimensionless |
| Parameter | Value | Unit | Value | Unit |
|---|---|---|---|---|
| 2000~5000 | bpd | 318–795 | m3/d | |
| 3500 | mD | 3.5 × 10⁻¹² | m2 | |
| 0.3 | fraction | 0.3 | fraction | |
| ) | 0.292 | ft | 0.089002 | m |
| ) | 18 | ft | 5.486 | m |
| ) | 850 | ft | 259 | m |
| ) | 2000 | ft | 607.6 | m |
| ) | 64 | ft | 19.5 | m |
| ) | 12 | ft | 3.66 | m |
| ) | 12 | ft | 3.66 | m |
| ) | 866 | psi | 5971 | kpa |
| ) | 1466 | psi | 10108 | kpa |
| ) | 58.058 | lbm/ft3 | 930 | kg/m3 |
| ) | 1 | cp | 1 | cp |
| ) | 17 | cp | 17 | cp |
| ) | 7 | dimensionless | 7 | dimensionless |
| ) | 4 | dimensionless | 4 | dimensionless |
| ) | 0.2 | fraction | 0.2 | fraction |
| ) | 0 | fraction | 0 | fraction |
| ) | 500 | ppm | 500 | ppm |
| ) | 0.29 | fraction | 0.29 | fraction |
| ) | 30 | dyne/cm | 30 | dyne/cm |
| ) | 10−4 | dimensionless | 10−4 | dimensionless |
| 5 | dimensionless | 5 | dimensionless | |
| ) | 0.4 | dimensionless | 0.4 | dimensionless |
References
- Al-Ghouti, M.A.; Al-Kaabi, M.A.; Ashfaq, M.Y.; Da’na, D.A. Produced water characteristics, treatment and reuse: A review. J. Water Process Eng. 2019, 28, 222–239. [Google Scholar] [CrossRef]
- Veil, J.U.S. Produced Water Volumes and Management Practices in 2017. February 2020. Report for Ground Water Protection Council (GWPC). Available online: https://www.gwpc.org/sites/gwpc/uploads/documents/publications/pw_report_2017___final.pdf (accessed on 5 February 2022).
- Horner, R.M.; Harto, C.B.; Jackson, R.B.; Lowry, E.R.; Brandt, A.R.; Yeskoo, T.W.; Murphy, D.J.; Clark, C.E. Water Use and Management in the Bakken Shale Oil Play in North Dakota. Environ. Sci. Technol. 2016, 50, 3275–3282. [Google Scholar] [CrossRef] [PubMed]
- Jin, L.; Wojtanowicz, A.K.; Ge, J. An Analytical Model Predicts Pressure Increase during Waste Water Injection to Prevent Fracturing and Seismic Events. In Proceedings of the SPE Health, Safety, Security, Environment, & Social Responsibility Conference-North America, New Orleans, LA, USA, 18–20 April 2017. [Google Scholar]
- Kondash, A.J.; Lauer, N.E.; Vengosh, A. The intensification of the water footprint of hydraulic fracturing. Sci. Adv. 2018, 4, eaar5982. [Google Scholar] [CrossRef] [PubMed] [Green Version]
- U.S. Environmental Protection Agency. EPA Hydraulic Fracturing Study Technical Workshop #4. Available online: https://www.epa.gov/sites/default/files/documents/09_Mantell_-_Reuse_508.pdf (accessed on 5 February 2022).
- Jin, L.; Wojtanowicz, A.K.; Hughes, R.G. An Analytical Model for Water Coning Control Installation in Reservoir with Bottomwater. J. Can. Pet. Technol. 2010, 49, 65–70. [Google Scholar] [CrossRef]
- Jin, L.; Wojtanowicz, A.K. Performance Analysis of Wells with Downhole Water Loop Installation for Water Coning Control. J. Can. Pet. Technol. 2010, 49, 38–45. [Google Scholar] [CrossRef]
- Jin, L.; Wojtanowicz, A.K. Minimum Produced Water from Oil Wells with Water-Coning Control and Water-Loop Installations. In Proceedings of the SPE Americas E&P Health, Safety, Security, and Environmental Conference, Houston, TX, USA, 21–23 March 2011. SPE 143715. [Google Scholar]
- Scanlon, B.R.; Reedy, R.C.; Male, F.; Walsh, M. Water Issues Related to Transitioning from Conventional to Unconventional Oil Production in the Permian Basin. Environ. Sci. Technol. 2017, 51, 10903–10912. [Google Scholar] [CrossRef] [PubMed]
- Pena Castro, A.F.; Dougherty, S.L.; Harrington, R.M.; Cochran, E.S. Delayed dynamic triggering of disposal-induced earthquakes observed by a dense array in northern Oklahoma. J. Geophys. Res. Solid Earth 2019, 124, 3766–3781. [Google Scholar] [CrossRef]
- Horton, S. Disposal of Hydrofracking Waste Fluid by Injection into Subsurface Aquifers Triggers Earthquake Swarm in Central Arkansas with Potential for Damaging Earthquake. Seismol. Res. Lett. 2012, 83, 250–260. [Google Scholar] [CrossRef] [Green Version]
- Davis, S.D.; Frohlich, C. Did (Or Will) Fluid Injection Cause Earthquakes?—Criteria for a Rational Assessment. Seismol. Res. Lett. 1993, 64, 207–224. [Google Scholar] [CrossRef]
- Rubinstein, J.L.; Mahani, A.B. Myths and Facts on Wastewater Injection, Hydraulic Fracturing, Enhanced Oil Recovery, and Induced Seismicity. Seismol. Res. Lett. 2015, 86, 1060–1067. [Google Scholar] [CrossRef]
- USGS. Induced Earthquakes. Available online: https://www.usgs.gov/programs/earthquake-hazards/induced-earthquakes (accessed on 18 December 2021).
- McGarr, A.; Bekins, B.; Burkardt, N.; Dewey, J.; Earle, P.; Ellsworth, W.; Ge, S.; Hickman, S.; Holland, A.; Majer, E.; et al. Coping with Earthquakes Induced by Fluid Injection. Science 2015, 347, 830–831. [Google Scholar] [CrossRef] [PubMed]
- Wang, K.; Ellsworth, W.; Beroza, G.C. Revisiting the Timpson Induced Earthquake Sequence: A System of Two Parallel Faults. Geophys. Res. Lett. 2020, 47, e2020GL089192. [Google Scholar] [CrossRef]
- Frohlich, C. Two-year survey comparing earthquake activity and injection-well locations in the Barnett Shale, Texas. Proc. Natl. Acad. Sci. USA 2012, 109, 13934–13938. [Google Scholar] [CrossRef] [Green Version]
- Folger, P.; Tiemann, M. Human-Induced Earthquakes from Deep-Well Injection: A Brief Overview; Congressional Research Service: Washington, DC, USA, 2014. [Google Scholar]
- Van der Zwaag, C.; Øyno, L. Comparison of Injectivity Prediction Models to Estimate Ula Field Injector Performance for Produced Water Reinjection. Environ. Sci. Res. 1996, 52, 521–532. Available online: https://jglobal.jst.go.jp/en/detail?JGLOBAL_ID=200902161456566079 (accessed on 29 December 2021).
- Underground Injection Control Program. Available online: https://www.ecfr.gov/current/title-40/chapter-I/subchapter-D/part-144 (accessed on 5 February 2022).
- Lund Snee, J.E.; Zoback, M.D. Multiscale variations of the crustal stress field throughout North America. Nat. Commun. 2020, 11, 1951. [Google Scholar] [CrossRef] [Green Version]
- Obe, I.; Fashanu, T.A.; Idialu, P.O.; Akintola, T.O.; Abhulimen, K.E. Produced water re-injection in a non-fresh water aquifer with geochemical reaction, hydrodynamic molecular dispersion and adsorption kinetics controlling: Model development and numerical simulation. Appl. Water Sci. 2017, 7, 1169–1189. [Google Scholar] [CrossRef] [Green Version]
- Cox, S. The application of failure mode diagrams for exploring the roles of fluid pressure and stress states in controlling styles of fracture-controlled permeability enhancement in faults and shear zones. Geofluids 2010, 10, 217–233. [Google Scholar]
- Dvory, N.Z.; Zoback, M.D. Assessing Fault Slip Potential in A Continuously Varying Stress Field–Application in the Delaware Basin. In Proceedings of the 55th US Rock Mechanics/Geomechanics Symposium, Online, 18–21 June 2021. [Google Scholar]
- Alhosani, A.; Scanziani, A.; Lin, Q.; Foroughi, S.; Alhammadi, A.M.; Blunt, M.J.; Bijeljic, B. Dynamics of water injection in an oil-wet reservoir rock at subsurface conditions: Invasion patterns and pore-filling events. Phys. Rev. E 2020, 102, 023110. [Google Scholar] [CrossRef] [PubMed]
- Mathias, S.A.; De Miguel, G.J.G.M.; Thatcher, K.E.; Zimmerman, R.W. Pressure Buildup During CO2 Injection into a Closed Brine Aquifer. Transp. Porous Media 2011, 89, 383–397. [Google Scholar] [CrossRef]
- Mathias, S.A.; McElwaine, J.N.; Gluyas, J.G. Heat transport and pressure buildup during carbon dioxide injection into depleted gas reservoirs. J. Fluid Mech. 2014, 756, 89–109. [Google Scholar] [CrossRef] [Green Version]
- Noirot, J.C.; Van den Hoek, P.J.; Zwarts, D.; Bjoerndal, H.P.; Stewart, G.; Drenth, R.; Al-Masfry, R.; Was-sing, B.; Saeby, J.; Al-Masroori, M.; et al. Water injection and water flooding under fracturing conditions. In Proceedings of the Middle East Oil Show, Manama, Bahrain, 9–12 June 2003. [Google Scholar]
- Lyu, W.; Zeng, L.; Chen, M.; Qiao, D.; Fan, J.; Xia, D. An approach for determining the water injection pressure of low-permeability reservoirs. Energy Explor. Exploit. 2018, 36, 1210–1228. [Google Scholar] [CrossRef] [Green Version]
- Abbaszadeh, M.; Kamal, M. Pressure-Transient Testing of Water-Injection Wells. SPE Reserv. Eng. 1989, 4, 115–124. [Google Scholar] [CrossRef]
- Coulibaly, K.M.; Borden, R.C. Impact of edible oil injection on the permeability of aquifer sands. J. Contam. Hydrol. 2004, 71, 219–237. [Google Scholar] [CrossRef] [PubMed]
- Khan, N.A.; Engle, M.; Dungan, B.; Holguin, F.; Xu, P.; Carroll, K.C. Volatile-organic molecular characterization of shale-oil produced water from the Permian Basin. Chemosphere 2016, 148, 126–136. [Google Scholar] [CrossRef]
- Ohen, H.A.; Nnabuihe, L.; Felber, B.J.; Ososanwo, D.; Holmgren, C.M. A Systematic Laboratory Core and Fluid Analysis Program for the Design of a Cost-Effective Treatment and Cleanup Guidelines for a Produced Water Disposal Scheme. In Proceedings of the SPE/DOE Improved Oil Recovery Symposium, Tulsa, OK, USA, 21–24 April 1996. SPE 35369. [Google Scholar]
- Veil, J.A.; Quinn, J.J. Downhole Separation Technology Performance: Relationship to Geologic Condition; Report for U.S. DOE; National Energy Technology Laboratory: Pittsburgh, PA, USA, 2004. [Google Scholar]
- Palsson, B.; Davies, D.R.; Todd, A.C.; Somerville, J.M. The Water Injection Process A Technical and Economic Integrated Approach. Chem. Eng. Res. Des. 2003, 81 Pt A, 333–341. [Google Scholar] [CrossRef]
- Bennion, D.; Thomas, F.; Bietz, R. Injection Water Quality-A Key Factor to Successful Waterflooding. J. Can. Pet. Technol. 1998, 37, 53–62. [Google Scholar] [CrossRef]
- Nicholson, C.; Wesson, R.L. Earthquake Hazard Associated with Deep Well Injection: A Report to the U.S. Environmental Protection Agency; U.S. Geological Survey: Reston, VA, USA, 1990; Volume 1951. [Google Scholar]
- Jin, L.; Wojtanowicz, A. Experimental and theoretical study of counter-current oil–water separation in wells with in-situ water injection. J. Pet. Sci. Eng. 2013, 109, 250–259. [Google Scholar] [CrossRef]
- Jin, L. A Feasibility Study of Multi-Functional Wells for Water Coning Control and Disposal. Ph.D. Dissertation, Louisiana State University, Baton Rouge, LA, USA, December 2013. [Google Scholar]
- Soo, H.; Radke, C.J. Flow mechanism of dilute, stable emulsions in porous media. Ind. Eng. Chem. Fundam. 1984, 23, 342–347. [Google Scholar] [CrossRef]
- Soo, H.; Williams, M.; Radke, C. A filtration model for the flow of dilute, stable emulsions in porous media—II. Parameter evaluation and estimation. Chem. Eng. Sci. 1986, 41, 273–281. [Google Scholar] [CrossRef]
- Jin, L.; Wojtanowicz, A.K. Development of Injectivity Damage due Oily Waste Water in Linear Flow. In Proceedings of the SPE International Symposium and Exhibition on Formation Damage Control, Lafayette, LA, USA, 26–28 February 2014. SPE 168130. [Google Scholar]
- Jin, L.; Wojtanowicz, A.K. Progression of injectivity damage with oily waste water in linear flow. Pet. Sci. 2014, 11, 550–562. [Google Scholar] [CrossRef] [Green Version]
- Bear, J. Dynamics of Fluids in Porous Media; Elsevier Publishing Co., Inc.: New York, NY, USA, 1972; pp. 665–727. [Google Scholar]
- Lake, L.W. Enhanced Oil Recovery; Prentice Hall: Hoboken, NJ, USA, 1989. [Google Scholar]
- Saripalli, K.; Sharma, M.; Bryant, S. Modeling injection well performance during deep-well injection of liquid wastes. J. Hydrol. 2000, 227, 41–55. [Google Scholar] [CrossRef]
- Brooks, R.H.; Corey, A.T. Properties of Porous Media Affecting Fluid Flow. J. Irrig. Drain. Div. 1966, 92, 61–88. [Google Scholar] [CrossRef]
- Sharma, M.M.; Pang, S.; Wennberg, K.E.; Morgenthaler, L.N. Injectivity Decline in Water-Injection Wells: An Offshore Gulf of Mexico Case Study; SPE Production & Facilities: Richardson, TX, USA, 2000; Volume 15. [Google Scholar]
- Ge, J.; Ghassemi, A. Stimulated Reservoir Volume by Hydraulic Fracturing in Naturally Fractured Shale Gas Reservoirs. In Proceedings of the 46th U.S. Rock Mechanics Symposium, Chicago, IL, USA, 24–27 June 2012. [Google Scholar]
- Swisher, M.D.; Wojtanowicz, A.K. New Dual Completion Method Eliminates Bottom Water Coning. In Proceedings of the SPE ATCE, Dallas, TX, USA, 22–25 October 1995. SPE 30697. [Google Scholar]
- Swisher, M.; Wojtanowicz, A. In Situ-Segregated Production of Oil and Water—A Production Method with Environmental Merit: Field Application. SPE Adv. Technol. Ser. 1996, 4, 51–58. [Google Scholar] [CrossRef]


| Time | Category | ||
|---|---|---|---|
| Oil, Million bbl/yr (Million m3/yr) | Gas, Million cf/yr (Million m3/yr) | Water, Million bbl/yr (Million m3/yr) | |
| 2007 | 1750 (278) | 24,374,000 (69,016) | 20,195 (3211) |
| 2012 | 2264 (360) | 29,730,220 (841,868) | 21,181 (3368) |
| 2017 | 3405 (541) | 35,005,078 (991,235) | 24,395 (3878) |
Publisher’s Note: MDPI stays neutral with regard to jurisdictional claims in published maps and institutional affiliations. |
© 2022 by the authors. Licensee MDPI, Basel, Switzerland. This article is an open access article distributed under the terms and conditions of the Creative Commons Attribution (CC BY) license (https://creativecommons.org/licenses/by/4.0/).
Share and Cite
Jin, L.; Wojtanowicz, A.K.; Ge, J. Prediction of Pressure Increase during Waste Water Injection to Prevent Seismic Events. Energies 2022, 15, 2101. https://doi.org/10.3390/en15062101
Jin L, Wojtanowicz AK, Ge J. Prediction of Pressure Increase during Waste Water Injection to Prevent Seismic Events. Energies. 2022; 15(6):2101. https://doi.org/10.3390/en15062101
Chicago/Turabian StyleJin, Lu, Andrew K. Wojtanowicz, and Jun Ge. 2022. "Prediction of Pressure Increase during Waste Water Injection to Prevent Seismic Events" Energies 15, no. 6: 2101. https://doi.org/10.3390/en15062101