1. Introduction
Due to worldwide climate change caused by CO
2 emissions from fossil fuels, there is an urgency to change energy systems towards 100% renewable energy, as explained in [
1]. An energy hub is a possible system concept to reach this goal and is defined in [
2,
3] as a local production, conversion, storage and consumption system with different energy carriers, i.e., electricity, heat and fuel(s). Within an energy hub, locally or regionally generated renewable electricity from solar or wind is often the input in countries such as the Netherlands, while in other countries inputs may additionally include hydropower, tidal or geothermal energy. Outputs of the energy hub are electric, thermal and fuel demands of the built environment (houses, offices), industry and mobility. Hydrogen is one of the possible fuel outputs of an energy hub and is a valuable molecule for chemical industries, as fuel for industrial high temperature processes, mobility or heat for the built environment, as explained in [
4,
5]. Hydrogen can also be stored for longer periods of time at high pressures or as a liquid fuel, e.g., ammonia or methanol, according to [
6]. These properties make hydrogen an almost ideal energy carrier and storage medium within an energy hub, for instance, to solve a seasonal imbalance between high amounts of renewable energy generation from solar PV during the summer months and high energy demands during the winter months, as demonstrated in [
7]. Green hydrogen is produced either by conversion of electricity from renewable sources with an electrolyser or by conversion of biomass sources, according to [
8]. Large scale inputs of solar PV and wind energy into energy hubs lead to considerable overproduction at times and underproduction at other times. Hence, there is a need for electricity grid flexibility. The authors of [
9] list the following possibilities: batteries, heat conversion and storage and hydrogen conversion and storage. To exploit these options, proper management is necessary by smart control systems as introduced in [
10].
The complex nature of energy hubs requires a careful planning process, explained in [
11] which often starts with scenario analysis in which stakeholders (consumers, network operators, energy producers, municipal and civil stakeholders) participate. The scenario analysis includes important steps such as defining relevant scenarios, value case development for participating stakeholders and, finally, the development of a feasible business case. A business case for an energy hub contains detailed information on exploitation costs and benefits in relation to energy demand and supply. Therefore, insights into energy flows are necessary in relation to system capacities (production and storage units), equipment and (time related) energy demand and prices. A model of the energy hub is required to obtain such interrelated insights. The purpose of this paper is to develop insights into how business case analysis of energy hubs can be supported by a model with reduced complexity.
The contribution of this paper is a model and method which can generally be used to analyse business case scenario analyses of energy hubs that include hydrogen and for which no advanced modelling experience is needed by the user. We also show application of the model and method for a specific case.
The paper is structured as follows. In
Section 2, the general problem statement and an overview of related work is given. In
Section 3 the methodology is introduced, and equations and algorithms are derived for the energy system analysis. In
Section 4, the method is applied in a case study. In
Section 5, the results are discussed and in
Section 6, conclusions are formulated, and an outlook is given on further application and future work.
2. Related Work and Problem Statement
Realisation of an energy hub of significant local or regional scale requires a complex planning process involving multiple stakeholders, explained in [
11,
12,
13]. There are many types of energy hubs, depending on the scale (required system capacities), customer profile (e.g., district or industrial site), renewable energy generation technologies (e.g., wind or solar PV), storage and conversion technologies, energy carriers and networks, demand profiles, energy markets and the possibility of market-based smart control. The planning process is driven by the business case of the energy hub. This involves CAPEX and OPEX of the required assets and possible revenues following from demand supply and offering flexibility on energy markets [
14]. Other revenues such as reducing CO
2 emissions and strengthening local energy communities may also be valued in the business case.
Recently, green hydrogen energy hubs have attracted a lot of attention of regions in the Netherlands, as shown in [
15,
16], as hydrogen is estimated to play an important role in replacing natural gas and fossil fuel consumption for industry and transportation. Moreover, the magnitude of renewable energy generation within local or regional energy hubs is such that existing power networks are showing congestion problems, as shown in [
17], and this frustrates further and rapid development of energy hubs throughout the Netherlands, as argued in [
18]. Smart storage and conversion to hydrogen are seen as part of the solution to overcome this.
Hydrogen storage is a promising option suitable for long-term seasonal storage of excess power generated by variable renewable energy sources, as explained in [
19]. The surplus power is converted to hydrogen as an energy carrier, which can be further converted to methane, methanol or other synthetic fuels. Moreover, the stored hydrogen can be used for power generation via fuel cells when the electricity supply does not meet the demand, as shown in [
20]. It is reported in [
21] that coupling the hydrogen production and hydrogen storage systems within systems with a share of renewables of up to 80% would decrease the required capacity of renewable resources including wind and solar power by 23% and at the same time significantly reduce the curtailment by 87%.
The economic benefits of such systems highly depend on the operating time of the components, the efficiency of the installations and the investment costs, as explained in [
22]. An important financial issue for hydrogen customers is the resulting price of hydrogen in relation to their application and the impact that the hydrogen price has on the customer’s business. At this stage, electrolysers are still costly which implies that they should be operated with a relatively high number of operating hours per year in order to produce hydrogen for an affordable price, as shown in [
23]. The price of hydrogen significantly depends on the energy source and its cost. For example, the price of hydrogen production would be decreased significantly if the electrolyser system operates on hydropower or biomass.
On the other hand, producing hydrogen is often not the only function of an energy hub. Most of the renewable energy may be supplied directly to all kinds of electric demand from a connected district or an industrial area. Hence, a complex evaluation is necessary of how the energy within the energy hub should be scheduled to which customer, storage or conversion asset, and what level of supply security can be reached for green electricity and green hydrogen, as explained in [
24]. Therefore, a model is needed that provides relevant information to evaluate preliminary business cases of scenarios, and such models are often complex, as shown in [
25]. The model should include the following functionalities:
Generation, storage, conversion and demand specifics which allow configuration of the model to represent the energy hub.
Realistic data inputs of electricity and hydrogen demand in relation to scenarios.
Logic rules and algorithms to schedule energy flows throughout the energy hub.
Capacities of assets in relation to calculation of CAPEX values as output.
Energy flows in time in relation to calculation of OPEX values as output.
In general, from literature we identify three types of modelling tools available to support business case analysis of energy hubs, listed in
Table 1. The type of tool to be used depends on the circumstances, such as the available expertise. In an educational setting, projects are often much different from each other, and emphasis is often on learning objectives with a focus on analysis methods and programming. Hence, the first and third types (
Table 1) are then often used. In a specialist setting, more projects of a similar nature are executed, and the second type is then more efficient.
When it concerns application of tools beyond the scope of planning the energy hub, for instance to perform control studies and development of a control system, then the first type has the advantage that the algorithms can also be used as (rule-based) control algorithms, or some of the algorithms can be incorporated as heuristics into a mathematical optimization method as part of smart control. Examples are given in [
39,
40,
41]. This is more difficult with the second and third types, because in that case, an integration with these tools and the control system should be made. This can be difficult in case of a lack of open data exchange, the exception to this being tools such as MATLAB-Simulink for which there are many API’s available for data exchange.
The scientific problem we address is the lack of an easy-to-use analysis tool to perform business case scenario analysis and grid congestion analysis of energy hub systems that include renewable power generation, hydrogen conversion and storage and supply of electric and hydrogen demands. The available tools require either specialist training (second type) or advanced modelling expertise (third type). The purpose of this paper is to develop insights into how business case scenario analyses of energy hubs can be supported by a model, and to develop a model that is relatively easy to use. The purpose is further to define a set of logical rules for the model which can also be applied for future rule-based smart control purposes. To align with the expertise of business case analysts, we have chosen to implement the model in a spreadsheet tool (first type) however, the model presented can also be implemented in other software (type 3).
The model requires relevant input data to evaluate the yearly costs and benefits. For this, we need a whole year of data. The selection of the time interval length (e.g., daily, hourly or quarter hourly average data) is important. The shorter the time interval, the more data there is to process and the more difficult it is to obtain relevant data from practice. An hourly time interval gives sufficient insight to study variations over time of energy demand and generation and of storage charging and discharging flows. However, smaller time intervals are possible if there is an interest in analysing short term peak energy flows. In the following Section we develop and describe the method for the functionalities described above
Table 1.
3. Methods
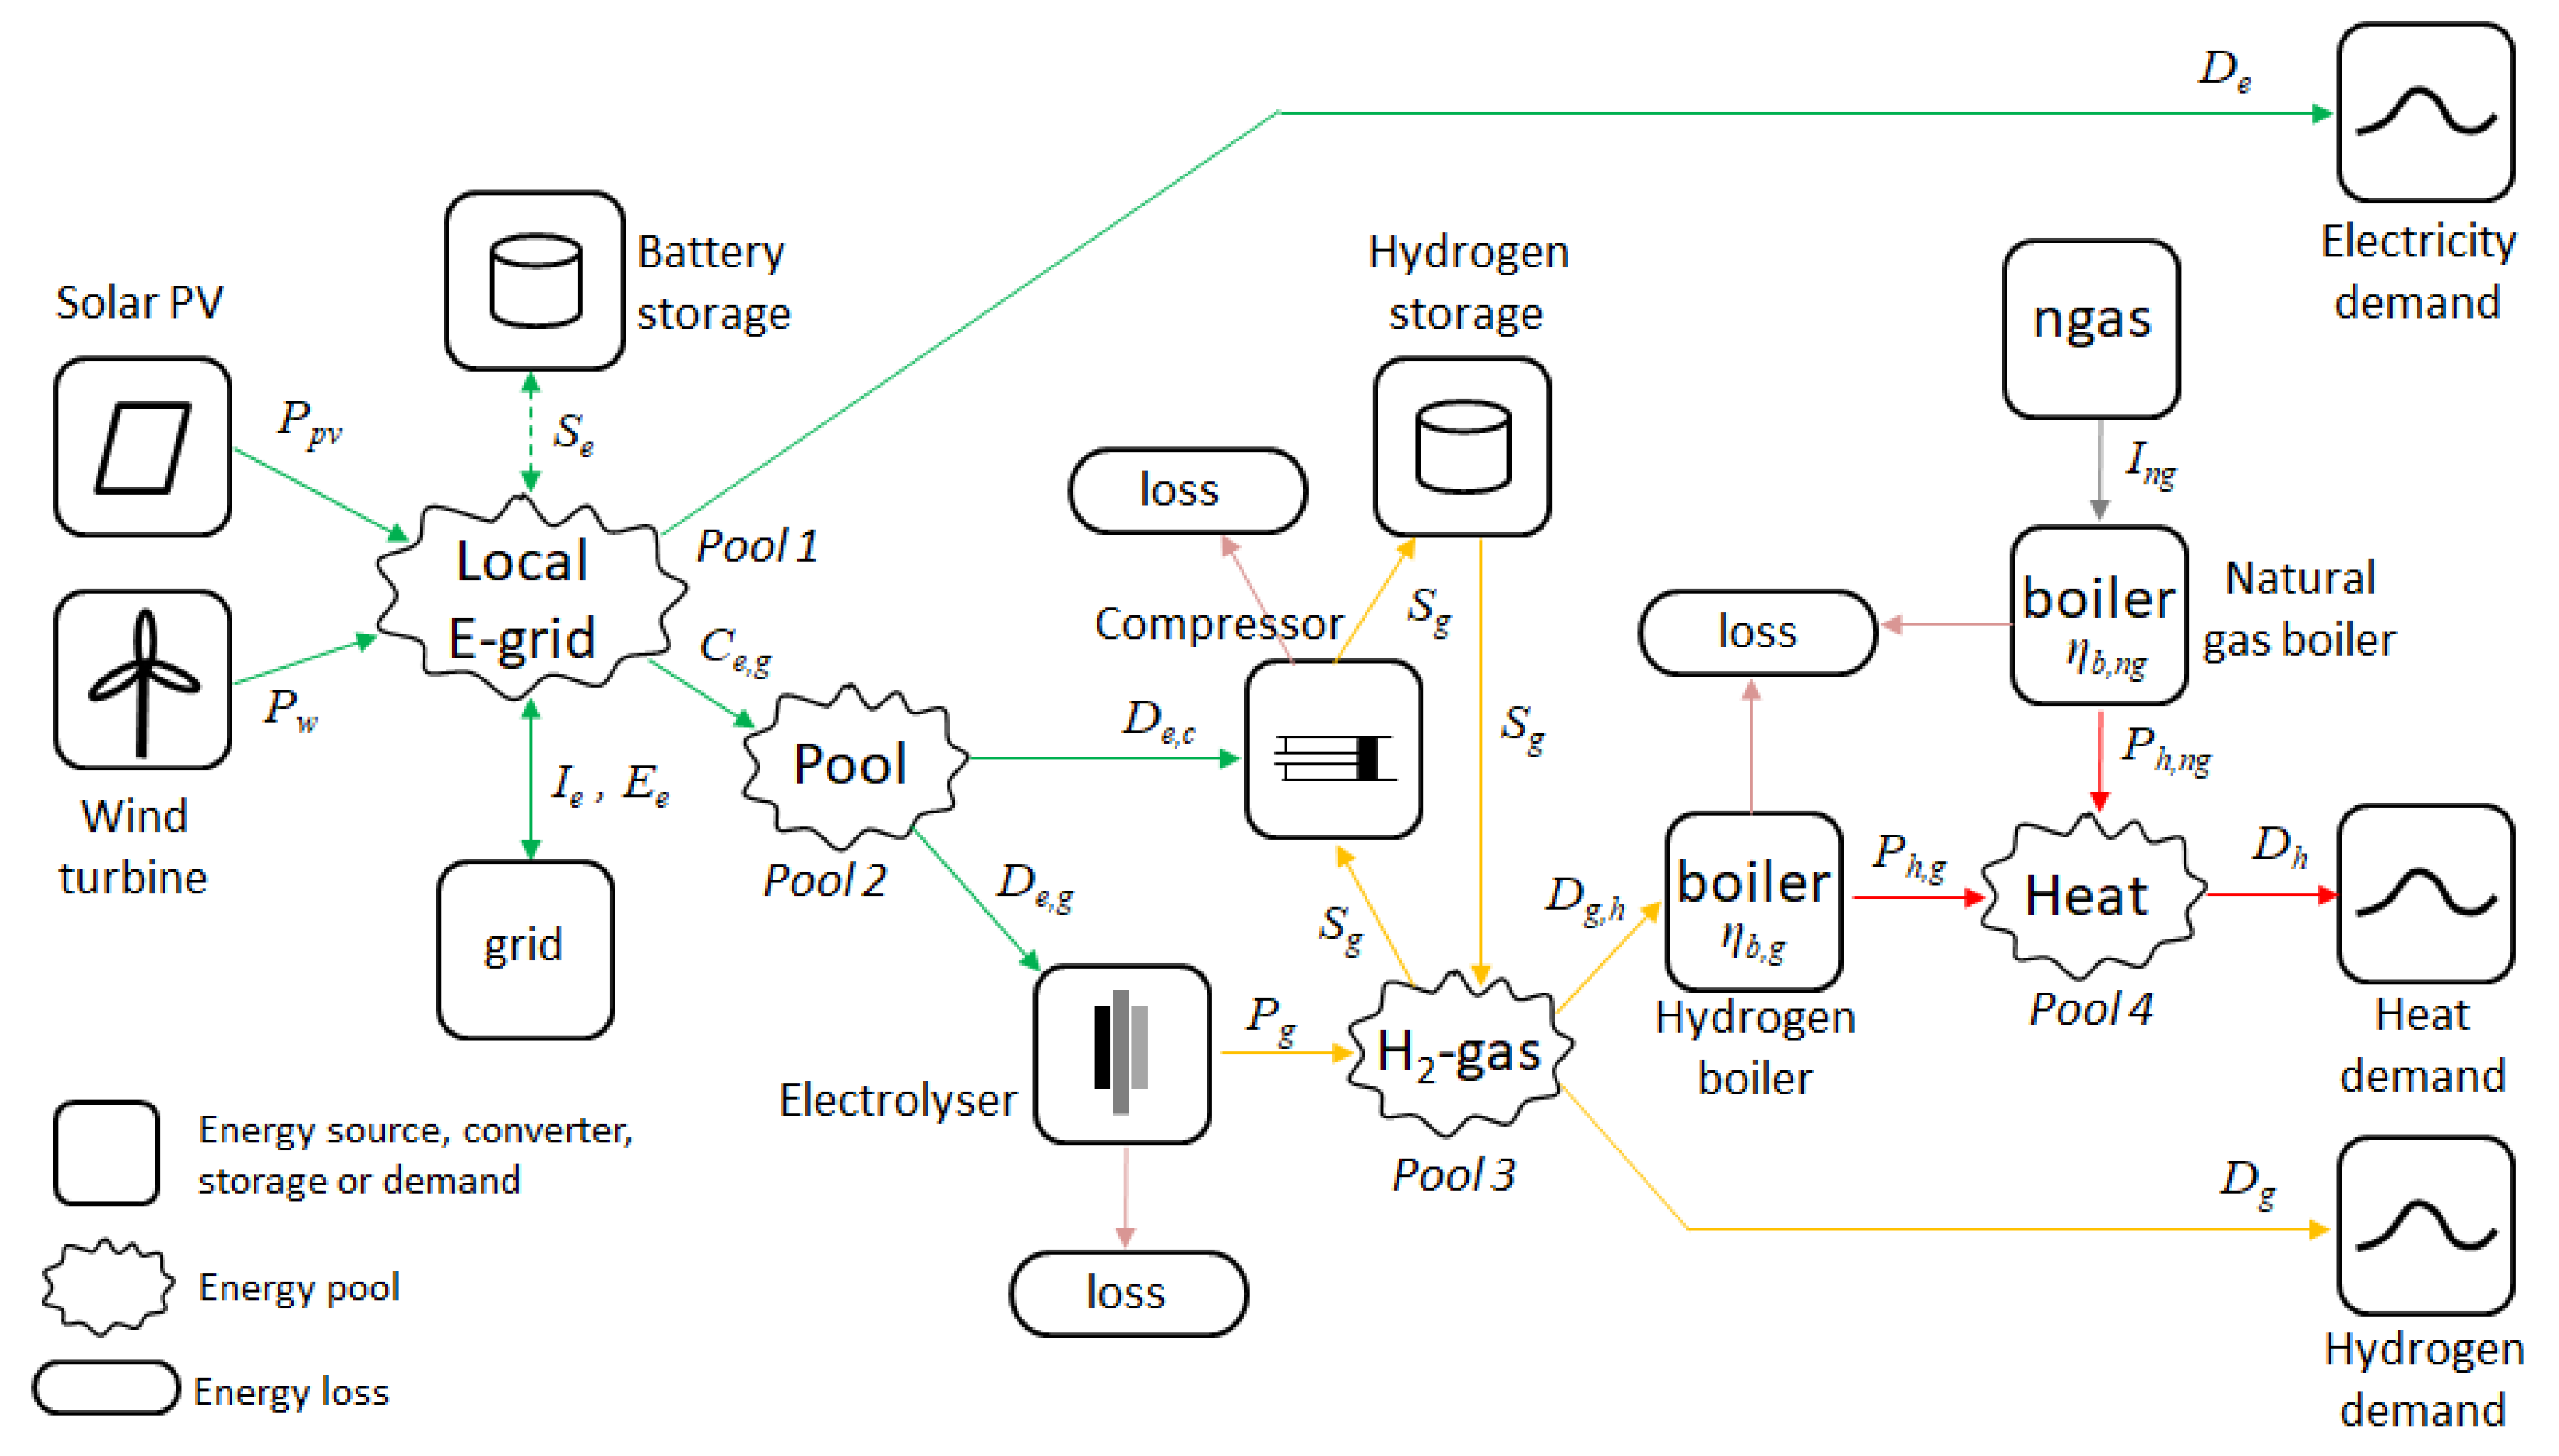
A general system schematic of an energy hub which produces, stores and supplies hydrogen is shown in
Figure 1 with explanation of nomenclature in
Table 2. The three types of boxes used in the schematic are explained on the lower left side of
Figure 1. Renewable energy generation systems are shown on the left side, and they are connected to a local electricity distribution grid pool 1. The local grid is connected to the main electricity grid for imports or exports of electricity. At electricity pool 1, a battery is shown as a possibility, e.g., for peak-shaving purposes or to support constant operation of the hydrogen converter. For this paper we assume negligible size of this storage. Inclusion of a battery as part of the hydrogen energy hub and it’s optimal sizing and control is a subject for future work. Pool 1 is connected to pool 2 from which electricity flows to a hydrogen electrolyser and hydrogen compressor.
The electrolyser, compressor and hydrogen storage are connected to hydrogen pool 3. From this pool, hydrogen can either flow to a hydrogen boiler or directly to a hydrogen demand on the lower right side of the schematic. The hydrogen boiler produces heat for building heating purposes and is connected to heat pool 4. This pool is also connected to a supporting natural gas boiler, and pool 4 is connected to heat demand. Building cooling demand is outside the scope of the model while cooling is usually produced by a building-integrated cooling system which requires electrical energy. The electrical energy demand of building cooling systems may be part of the electrical energy demand to be supplied by the energy hub. We have chosen hydrogen compression as storage method, following the demand for hydrogen by the energy hub customers. There are other possibilities, such as the production and storage of ammonia, as explained in [
42].
Each converter (electrolyser, compressor or boiler) is modelled as a single, static equation between the input and output and this is shown in the algorithms in this paper. Hence, complex dynamic behaviour of the converters is not part of our model. In the design phase of a project, interest is more aimed at system behaviour. For the design of the electrolyser, a much more elaborate process model is then needed, for which there are many examples shown in [
43,
44,
45]. The hydrogen storage is modelled without energy loss. In the following, we explain the logic rules of the model and the conversion equations.
We start with energy generation on the left of the schematic (Pool 1, Local E-grid). When renewable energy is produced, the first priority for its allocation is given to supply the main demand for electricity (De). The logic for this is that this priority leads to the least energy conversion losses and least destruction of exergy. We consider this demand to be non-controllable; it has to be supplied, if not from renewable sources within the energy hub, then from the main grid.
The second priority for the allocation of renewable electricity is to produce hydrogen if there is a hydrogen demand. Either in the form of heat (Dh) or as a fuel (Dg), e.g., for a car filling station. Priority is given to hydrogen fuel demand. This priority leads to less exergy destruction than the supply of heat and it also has a higher expected market value than the supply of heat.
The third priority, when the electrolyser still has capacity left, the hydrogen storage has leftover capacity and there is still renewable electricity available, then both the electrolyser and the compressor consume electricity and produce and store hydrogen.
After evaluating these priorities, if there is insufficient renewable electricity available, the demand for hydrogen may be partly or fully supplemented by the hydrogen storage. If the heat demand is higher than the amount that the hydrogen boiler can supply, a natural gas boiler supplements the supply of heat (Pool 4, Heat).
When all these options are evaluated and there is excess renewable electricity, the excess amount is exported to the main grid (Pool 1, Local E-grid). To steer energy flows within the network, we developed a set of logical rules which are explained in the following section. The approach contains two steps:
Distribute the generated renewable energy within the energy hub for supplying electricity demand and for conversion to hydrogen.
Additionally, calculate the possible import of electrical energy from the main grid according to rules on price limits in order to increase production and supply of hydrogen.
The second step is introduced to increase operational hours of the electrolyser and improve security of supplying the hydrogen demand. However, import of electricity from the main grid has a consequence for the level of sustainability of the produced hydrogen. In the following sections, we develop algorithms for both steps.
3.1. Step 1: Distribution of Renewable Local Energy
The calculation variables introduced in
Figure 1 and
Table 2 are discrete variables in time and the equations derived in the following are assumed to be applicable at each time interval. Parameters such as
hg,
ηg,
ηb and
wc are assumed to be constant. The modelling approach is quasi-static. The following energy balance equation applies for pool 1 (excluding import of electricity during step 1):
Some conditions have to be introduced for
Ce,g,
Se and
Ee to determine if electricity is converted, charged, discharged, imported or exported. Moreover, the maximum amount for
Ce,g is limited by the maximum capacity of the hydrogen converter:
De,g,max and compressor:
De,c,max. The minimum amount for
Ce,g is limited by the minimum capacity of the hydrogen converter:
De,g,min. Hence, for the upper and lower boundaries of
Ce,g we write:
The possibility to produce hydrogen depends on the balance between
De and
Ppv + Pw. If the production is larger than
De then electricity may either be converted into hydrogen for demand supply or storage, stored in the battery or exported (in this priority order). For this paper, we assume that the capacity of the electricity storage is insignificant compared to the hydrogen conversion, therefore:
Se = 0. The following Algorithm 1 now constrains the energy flow
Ce,g.
| Algorithm 1 |
| If Ppv + Pw > De and Ppv + Pw − De > De,g,min then |
| Ce,g =min{Ce,g,max; Ppv + Pw − De} |
| Else |
| Ce,g = 0 |
| End |
In this Algorithm, min{arguments} is a function and it signifies the minimum value of the arguments. Production of hydrogen by the converter (and thereby consumption of electricity) is further limited by the leftover storage capacity and the hydrogen demand. To determine Ce,g, it first has to be evaluated which hydrogen production is possible.
For the hydrogen storage, the following relation (in kg) applies:
and for
Pg the boundary conditions are:
In which we assume that all heat demand Dh could be produced by the hydrogen boiler. To produce hydrogen, the following relations determine the associated electricity consumption by the hydrogen converter:
to produce Dg, the associated electricity consumption is:
to produce Dh, the associated electricity consumption is:
to produce: SCt, the associated electricity consumption is:
Hence, condition [
5] can be reformulated into the following condition for electricity consumption:
Combining this condition with Algorithm 1 leads to Algorithm 2 which we define as the main algorithm.
After execution of Algorithm 2, the grid electricity export is calculated by reformulation of Equation (1), taking into account that
Se = 0:
Using Algorithm 2 and Equation (7), unknown energy flows
Ce,g and
Ee can be calculated from known input values for
Ppv,
Pw,
De and
Dg and
Dh. In the
Appendix A, detailed algorithms are given for Cases 1, 2 and 3. Import of electricity is related to price in the following section.
| Algorithm 2 (main) |
| A = {electric energy balance} |
| B = {maximum electric energy consumption of hydrogen system} |
| |
| C1 = maximum possible electrolyser electric energy consumption to supply demand and storage |
| C2 = associated compressor electric energy consumption in case of storage |
| |
|
| |
|
| |
|
| |
| C = C1 + C2 |
| |
| then |
| then |
| Case = 1 |
| {hydrogen is produced, and possibly stored, renewable energy is fully consumed} |
| Else |
| Case = 2 |
| {excess renewable energy, hydrogen is produced and possibly stored} |
| End |
| Else |
| Case = 3 |
| {hydrogen is not produced, hydrogen storage discharge may be possible} |
| End |
3.2. Step 2: Electricity Import
For a local hydrogen system, import of electricity may be needed for various reasons:
Insufficient operating hours of the electrolyser for economic operation are possible with only local, renewable energy sources;
A more constant operation of the electrolyser is desired for reliability reasons instead of fluctuating operation according to available local, renewable energy sources,
The possible production of hydrogen from a given local, renewable energy system may be insufficient in relation to the demand.
Of consideration is how much electricity should be imported and how this can be managed by certain criteria. The import of electricity may add to grid congestion problems and in today’s energy system it causes CO2 emissions. Hence, we conclude that import of electricity is less desired than the use of local, renewable energy. In future energy systems, however, electricity imports could cause lower CO2 emissions than today due to more renewable energy inputs, so this argument may change in time. The negative effects of associated costs due to grid congestion and CO2 emission in relation to imported electricity may be expressed by a certain price level. As a basis, the price level could be recent data of market prices. On top of that, a significant grid congestion and CO2 tax may be included, the latter depending on the share of fossil fuels within the electricity grid and government rules. In this way, a price for electricity import is a good indicator for the sustainability.
In the model we include the energy price level as part of an import energy management approach. The price level for electricity imports is signified by P which is variable in time. Two fixed boundary price levels P1 and P2 (€/kWh) are defined for which a decision algorithm is developed, as follows:
- 1.
if then electricity import is restricted to supply the remaining electricity demand. The price is too high to be attractive to produce hydrogen.
- 2.
if then electricity import is restricted to supply the remaining electricity and hydrogen demand. Production of hydrogen for storage purposes is undesired in this price range.
- 3.
if then electricity import is possible without restrictions.
In this way, the boundary levels P1 and P2 determine when electricity will be imported and for which purpose. It is then possible to investigate the effects of changing P1 and P2 on the amount of hydrogen production and the business case.
The second step is executed after the first step presented in
Section 3.1 which first determines the possible production from local, renewable energy sources. Algorithm A4 (
Appendix A) is developed and determines the additional energy flows (signified by the symbol Δ) relative to the flows calculated as a result of step 1. These flows are signified as
(<flow>)1. Algorithm A4 also determines the electricity import. The energy flows that are calculated by Algorithm A4 are to be added to the flows calculated by the algorithms of step 1. Here we also introduce the use of an asterisk * to signify the part of the demand that is supplied by the energy hub. As an example, the part of the electricity demand,
De that is supplied by the energy hub,
De* is the sum of the energy supply calculated by step 1 (
De*)
1 and the additional energy calculated by step 2 due to imports Δ
De*, as follows:
3.3. Addition of Business Case Parameters
With the previous formulated algorithms, the effects of different asset capacities and price boundaries for electricity imports can be analysed on the energy flows. To analyse the effects on the business case, CAPEX and OPEX of the energy hub system should be calculated from the defined capacities and the model’s output energy flows.
Yearly CAPEX of the energy hub is expressed as a linear relation between cost parameters and system capacities, as follows for the electrolyser, compressor, hydrogen storage, PV and wind turbine generation system:
In which {
c1, …
c5} are capital cost parameters, e.g., yearly depreciation and interest cost per unit capacity (kW for converters and kg for hydrogen storage). The hydrogen and natural gas boilers are not included because normally they are not owned by the energy hub but by the consumer. For the assets concerned, in general, smaller units are relatively more expensive than larger units, i.e., the cost parameters decrease with increasing capacities, because for smaller units, indirect costs such as construction and engineering costs are relatively larger. In cost analysis research, it is common to use a power function. Finding power functions is outside the scope of this paper. However, for a range of system sizes (e.g., electrolyser size range 0.5–10 MWe) the non-linear effects are small and a fixed cost parameter and linear relation for CAPEX is sufficiently accurate for scenario analysis. We define such values in relation to a case study in
Section 4.
For yearly OPEX we use a similar model and include only energy costs, which is expressed as:
In which {o1, …o4} are cost or benefit parameters which express market energy prices per unit of energy. Parameters o1 and o2 may include a penalty for CO2 emissions. All parameters may have different values in time in relation to varying market prices. T is total time considered in the analysis and t is a respective, discrete time interval. Equation (10) may also include OPEX of the same equipment as Equation (9), e.g., for maintenance and insurance costs. Usually, fixed percentages of equipment CAPEX are taken for this. Mathematically, this may be included in the capital cost parameters.
3.4. Implementation and Validation of the Model
The model developed in
Section 3.1,
Section 3.2 and
Section 3.3 has been programmed in Microsoft Excel, using formulas and cell relations. An hourly time step is used as hourly data is fairly easy to obtain from various sources. The model and this application case are made available under creative commons license (BY-NC) here [
46]. Validation of the model results is performed theoretically, by studying:
Correctness of results due to switching system options on and off: yes or no solar PV, wind energy, hydrogen storage and compression.
Correctness of results due to extreme values for the inputs: high and low renewable energy generation, large and small electrolyser and hydrogen storage capacities, large and small hydrogen and heat demand.
Energy balances (per hour and yearly sum) of the energy pools and the overall system energy balance: the sum of all energy flows (in and out of the pool or the overall system) should always be zero.
For a number of practical cases: expected results due to variations of electrolyser and hydrogen storage size.
The studied validation cases show logic and correct outcomes. In
Section 4 we show results for one case for which the results are discussed in
Section 5. Further validation of the model is part of future work and may include comparison with literature results in which other models were used. Validation with practical data is difficult at this stage because in the Netherlands there are no existing energy hubs with hydrogen production and storage yet, although a number of projects have reached the planning phase and data may become available in the near future.
3.5. Determining Optimal Energy Hub Asset Capacities
It is common to determine optimal capacities of an energy system by mathematical optimization [
25]. With the modelling approach that is introduced in the previous section, the economic optimum is found by minimizing yearly CAPEX + OPEX, in which the capacities within the CAPEX, Equation (9), are treated as variables and minimum and maximum values for these variables are defined as constraints. The following issues complicate this optimization and its application:
The model equations and algorithms introduce non-linearity and non-convexity within the optimization problem. A suitable non-linear solving method is required, and it is likely that much computational time is needed to find an optimum.
The importance of a single mathematical optimum during scenario analysis may be limited. It is often more interesting to investigate how the results for a scenario are influenced by changes that could take place during the lifetime of the energy hub project. For instance, the demand for hydrogen may increase after some years, new technology may lower the cost of hydrogen production and legislation or energy market prices may change, leading to different costs for importing or exporting energy. It is often more relevant to investigate the sensitivity of the business case as a result of these changes than to aim at finding a single optimum situation for a narrowly defined case, which is often based on predictions with a level of uncertainty.
At this stage of hydrogen development, artificial penalties for CO2 emissions should be included in relation to natural gas and electricity imports, otherwise the conversion into hydrogen is still often the most expensive option and the optimization has no meaning. If the penalties are artificial, the optimization loses relation with reality. In scenario analysis, there is more need to evaluate the influence of penalties on the price of hydrogen.
The revenues associated with excess PV and wind turbine energy may be such that very large PV and wind turbine systems are found as optimum. To avoid this, size constraints should be introduced, or costs associated with strengthening the grid.
With these issues it becomes a challenging exercise to find a mathematical optimum for scenario analysis purposes. Therefore, in the following section we use a manual approach to evaluate the use of the model with a practical case study.
4. Case Study Application
The model introduced in
Section 3 is developed for scenario analysis and requirements for the model are based on recent energy hub development projects in the Netherlands (Grohw [
47], H2hub [
48], GLDH2 [
49]) which share the following principles depicted by the scheme of
Figure 1:
Connection of a hydrogen conversion and storage system to a large generation facility for renewable electricity, primarily by solar PV.
Supply of hydrogen to a hydrogen vehicle filling station and industries that use hydrogen for high temperature heat processes.
Possible supply of oxygen for wastewater treatment processes and supply of waste heat for building heating. The oxygen and waste heat are produced by the hydrogen conversion and compressor. Oxygen and waste heat flows can be post-calculated from the hydrogen and energy flows that are calculated with the model developed in
Section 3.
A project in the city of Deventer in the Netherlands [
47], aims to examine how green hydrogen can be used to improve sustainability in the region in an affordable way, while not overloading the local electricity grid. This project is taken as case study to demonstrate application of the model. During the first phase of this project, the possible hydrogen, oxygen and waste heat demand by the various stakeholders is determined, as well as the solar PV generation capacity. During the next phase the project goals and key performance indicators (KPIs) were established. Among these, a competitive price of hydrogen and a high degree of certainty to supply all the demand with green hydrogen were ranked as the KPIs to focus on.
To determine CAPEX and OPEX values, an important part of the preliminary research was to estimate values for the factors
c1 until
c5 and
o1 until
o4. The estimation is performed by combining information from quotations and discussions with experts in the field. However, the values depend on the country, the scale of the project and on time, due to expected changes in costs and legislation in the years to come. For the case application, the values shown in
Table 3 for the parameters are used:
The case considers only hydrogen demand and renewable electricity input by a solar PV field. Import of green electricity is possible from an external utility company. Hence, the operational boundary considers input solar PV energy, electricity imports and hydrogen demand from a number of industrial consumers, mainly for high temperature heating purposes. Supply of electricity demand (De) is not part of the operational boundary, the industrial companies to which hydrogen is supplied have their own contract with an external utility company which supplies the electricity. Relevant data for this case are obtained from partners of the national research project Release. For the business case, the relation between security of supply, required hydrogen storage and electrolyser size and solar PV generation capacity is investigated, in relation to hydrogen price, operational hours of the electrolyser and storage utilisation. In this paper we present results with the model and with one set of data for the year 2019 to illustrate the application of the model. Data on the energy production by the PV system was obtained from a solar PV calculation tool which contains the Perez solar model. The original weather data is from Dutch weather station Heino.
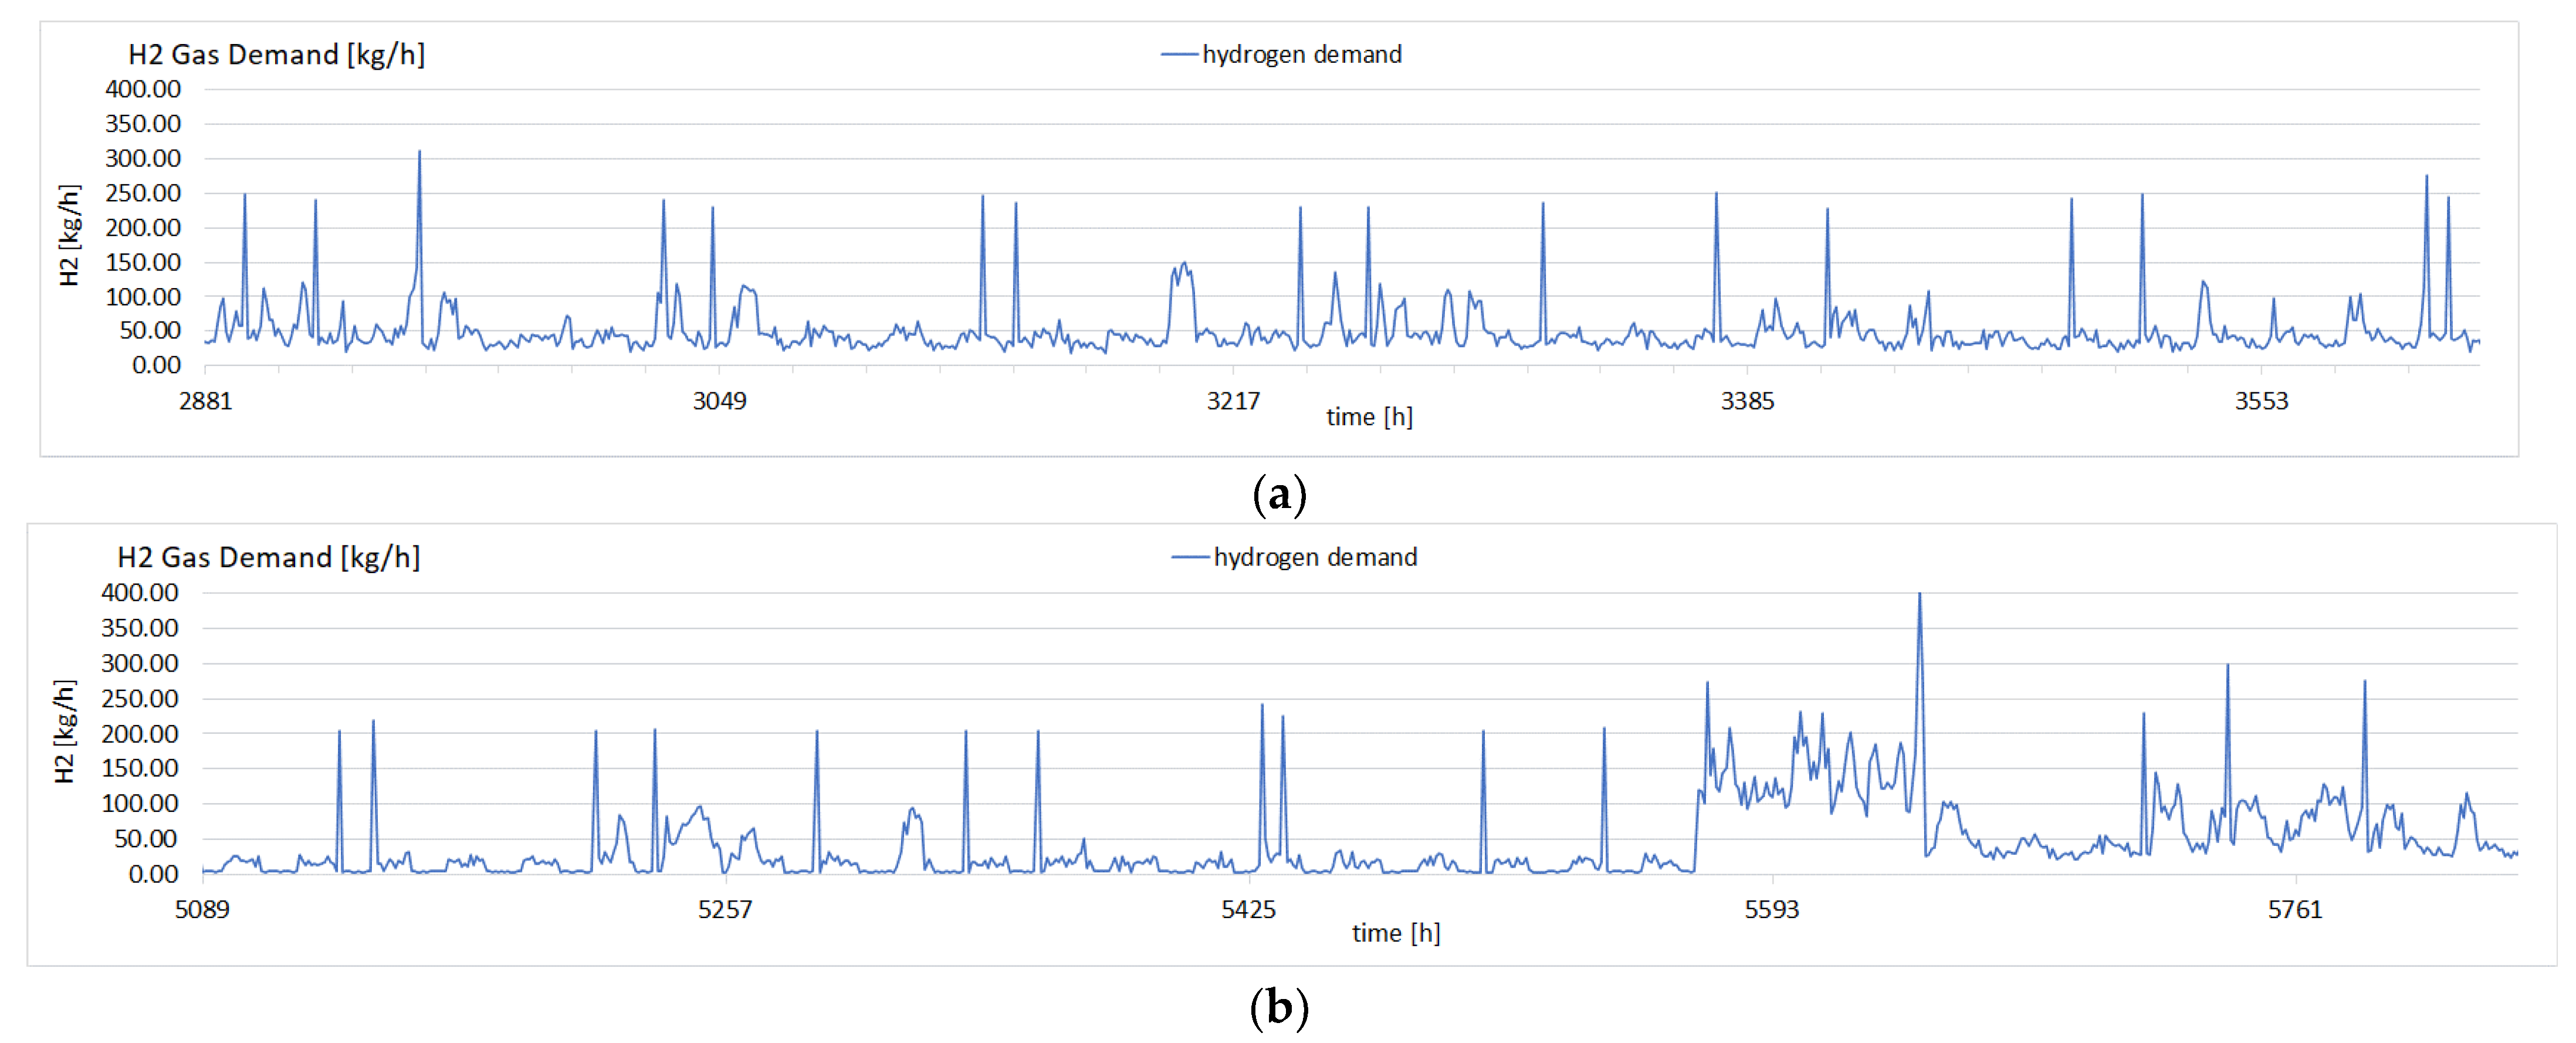
To illustrate the use of the model, we first consider the hydrogen demand in
Figure 2, including
Figure 2a, the month of May, which represents most months of the year with a similar demand, and
Figure 2b, the month of August which has an atypical demand peak for part of one week. The next step is to determine suitable values for the size of the electrolyser and hydrogen storage, which is carried out by manual variation of these values and verifying the results graphically. The yearly total supply of hydrogen should be as close as possible to the yearly demand, the size values should be as small as possible and the number of operational hours of the electrolyser should be as large as possible. To enable a relatively large amount of electricity import in order to reach these goals, values for
P1 and
P2 are preliminarily chosen equal at 0.07 €/kWh, while the electricity price data ranges between values of 0 and 0.14 €/kWh with an average at 0.056 €/kWh. The resulting capacities are shown in
Table 4. The electrolyser and storage size are self-defined; the size of the PV system is given and the compressor power requirement is calculated by the model.
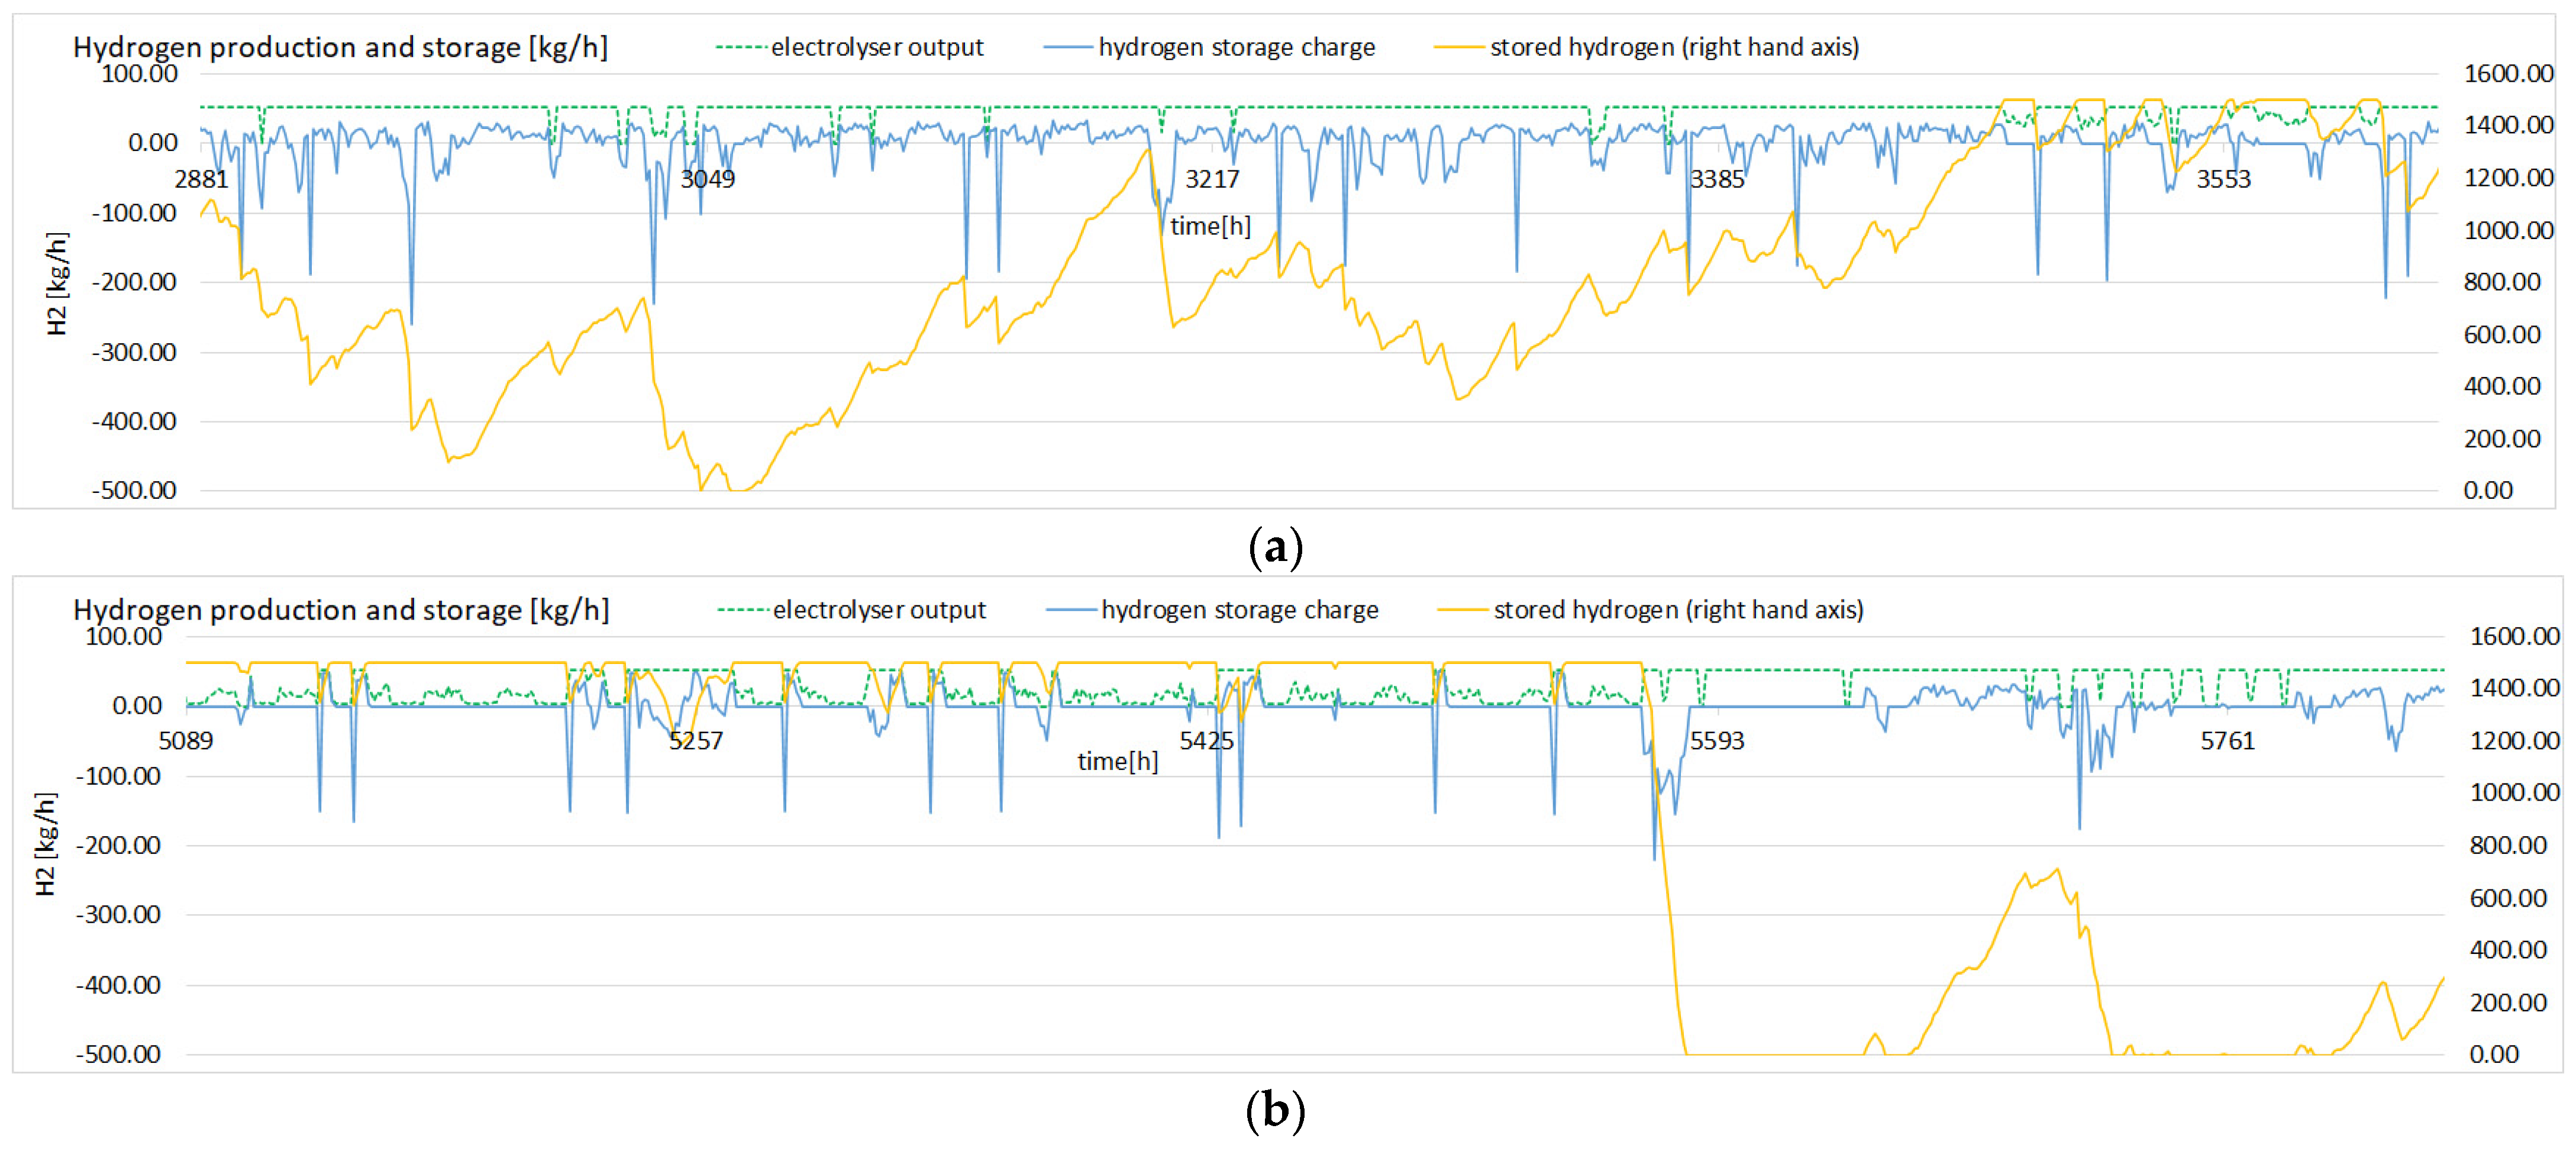
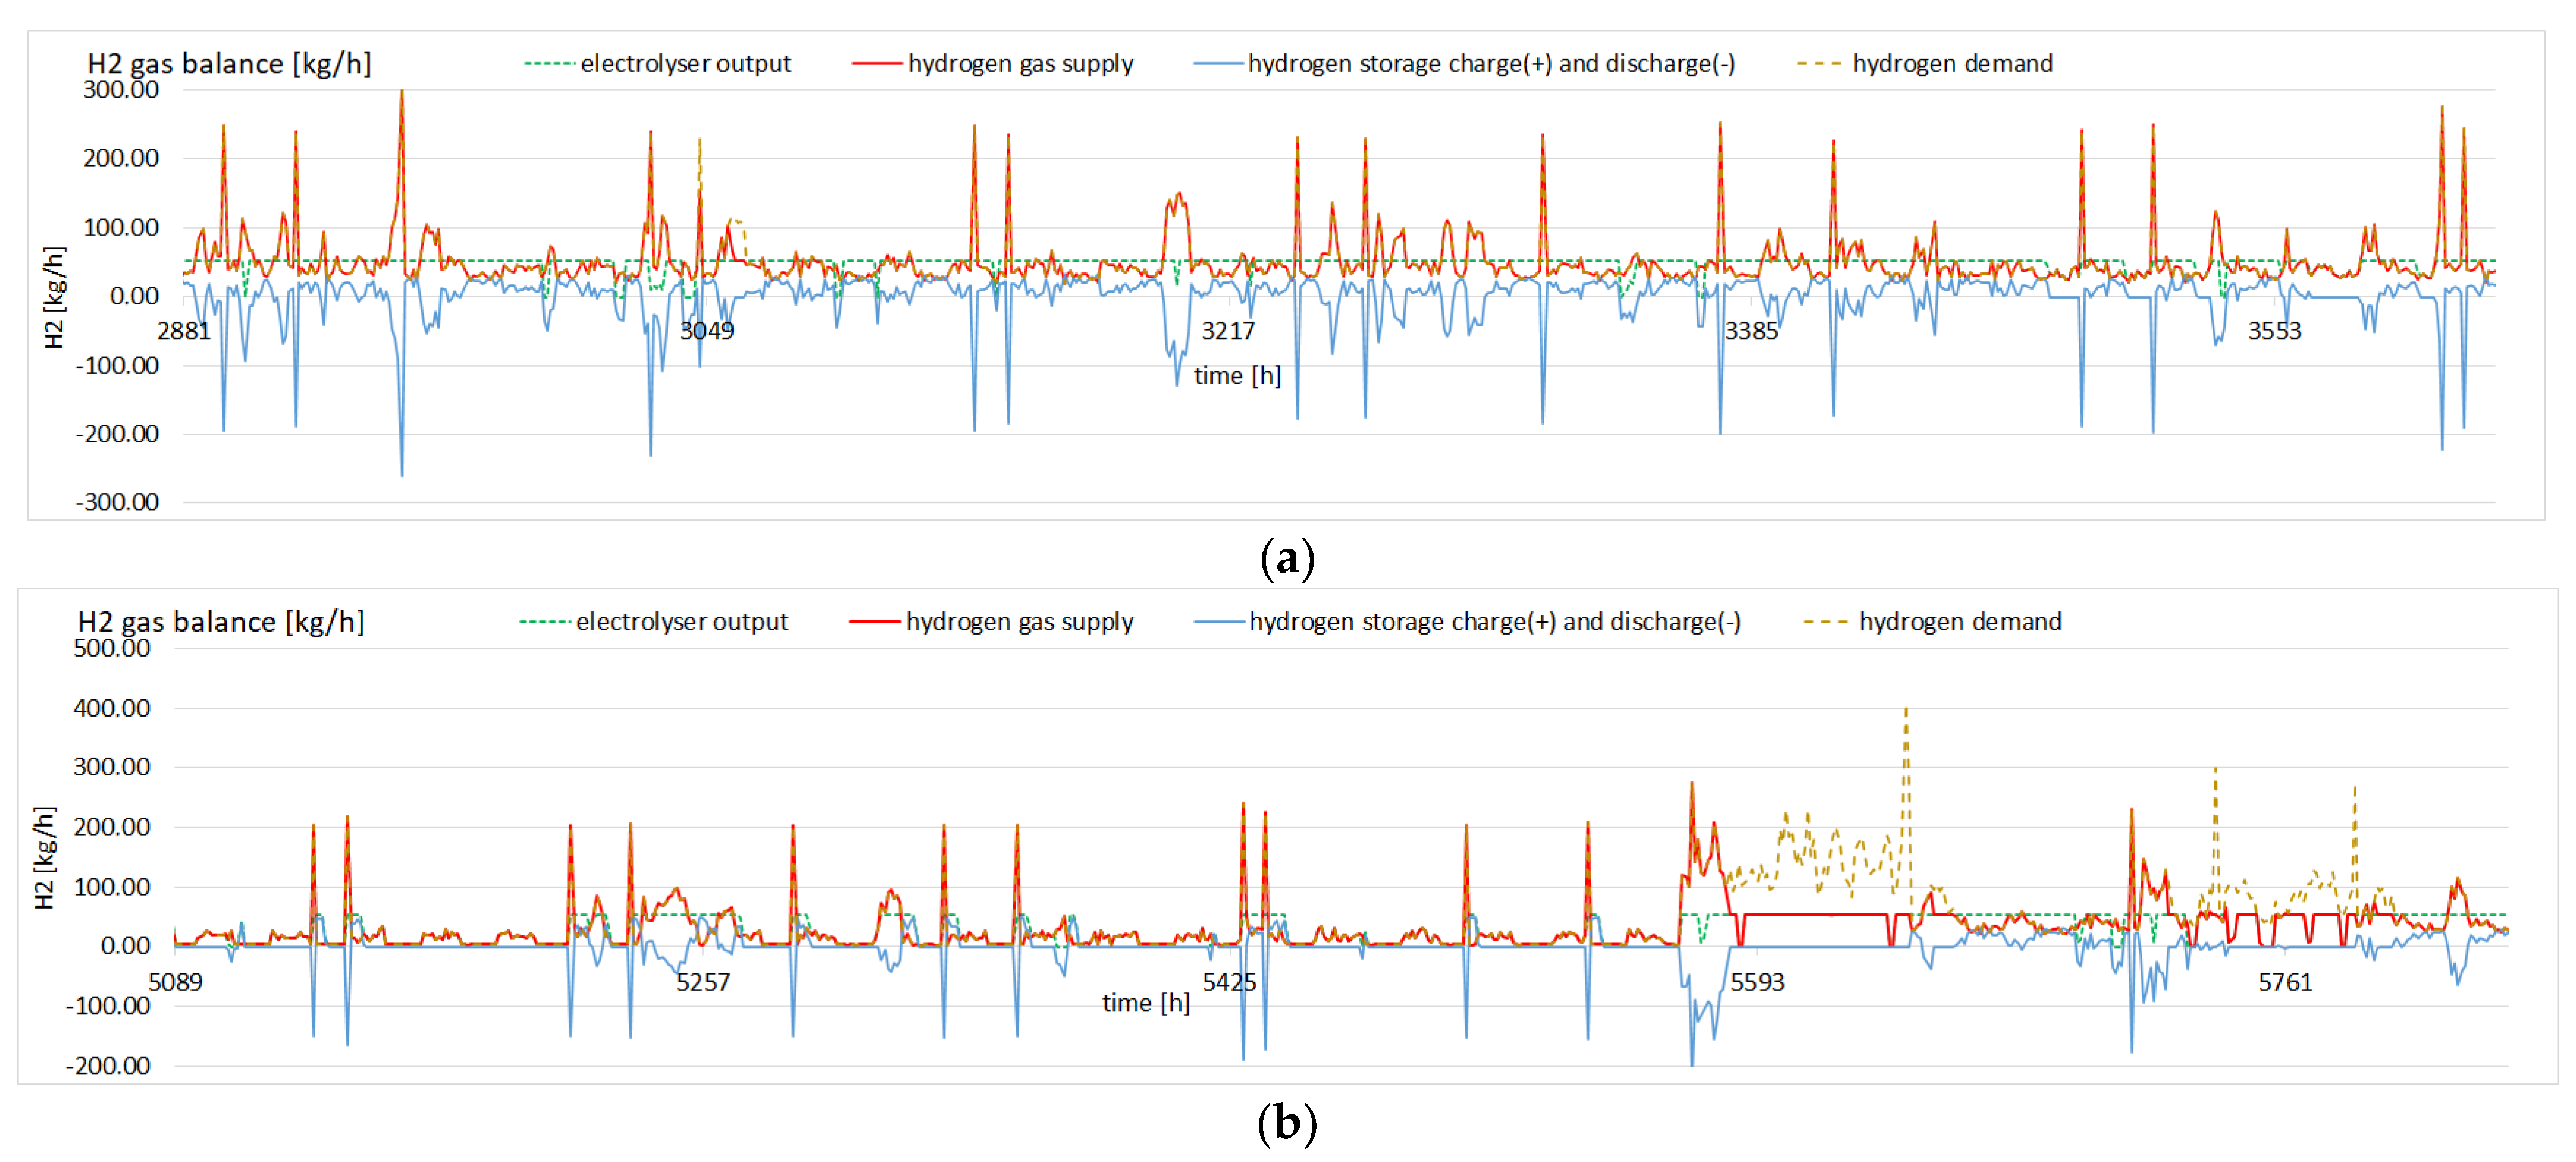
Figure 3 shows hydrogen flows as a result of the electrolyser operation and hydrogen storage.
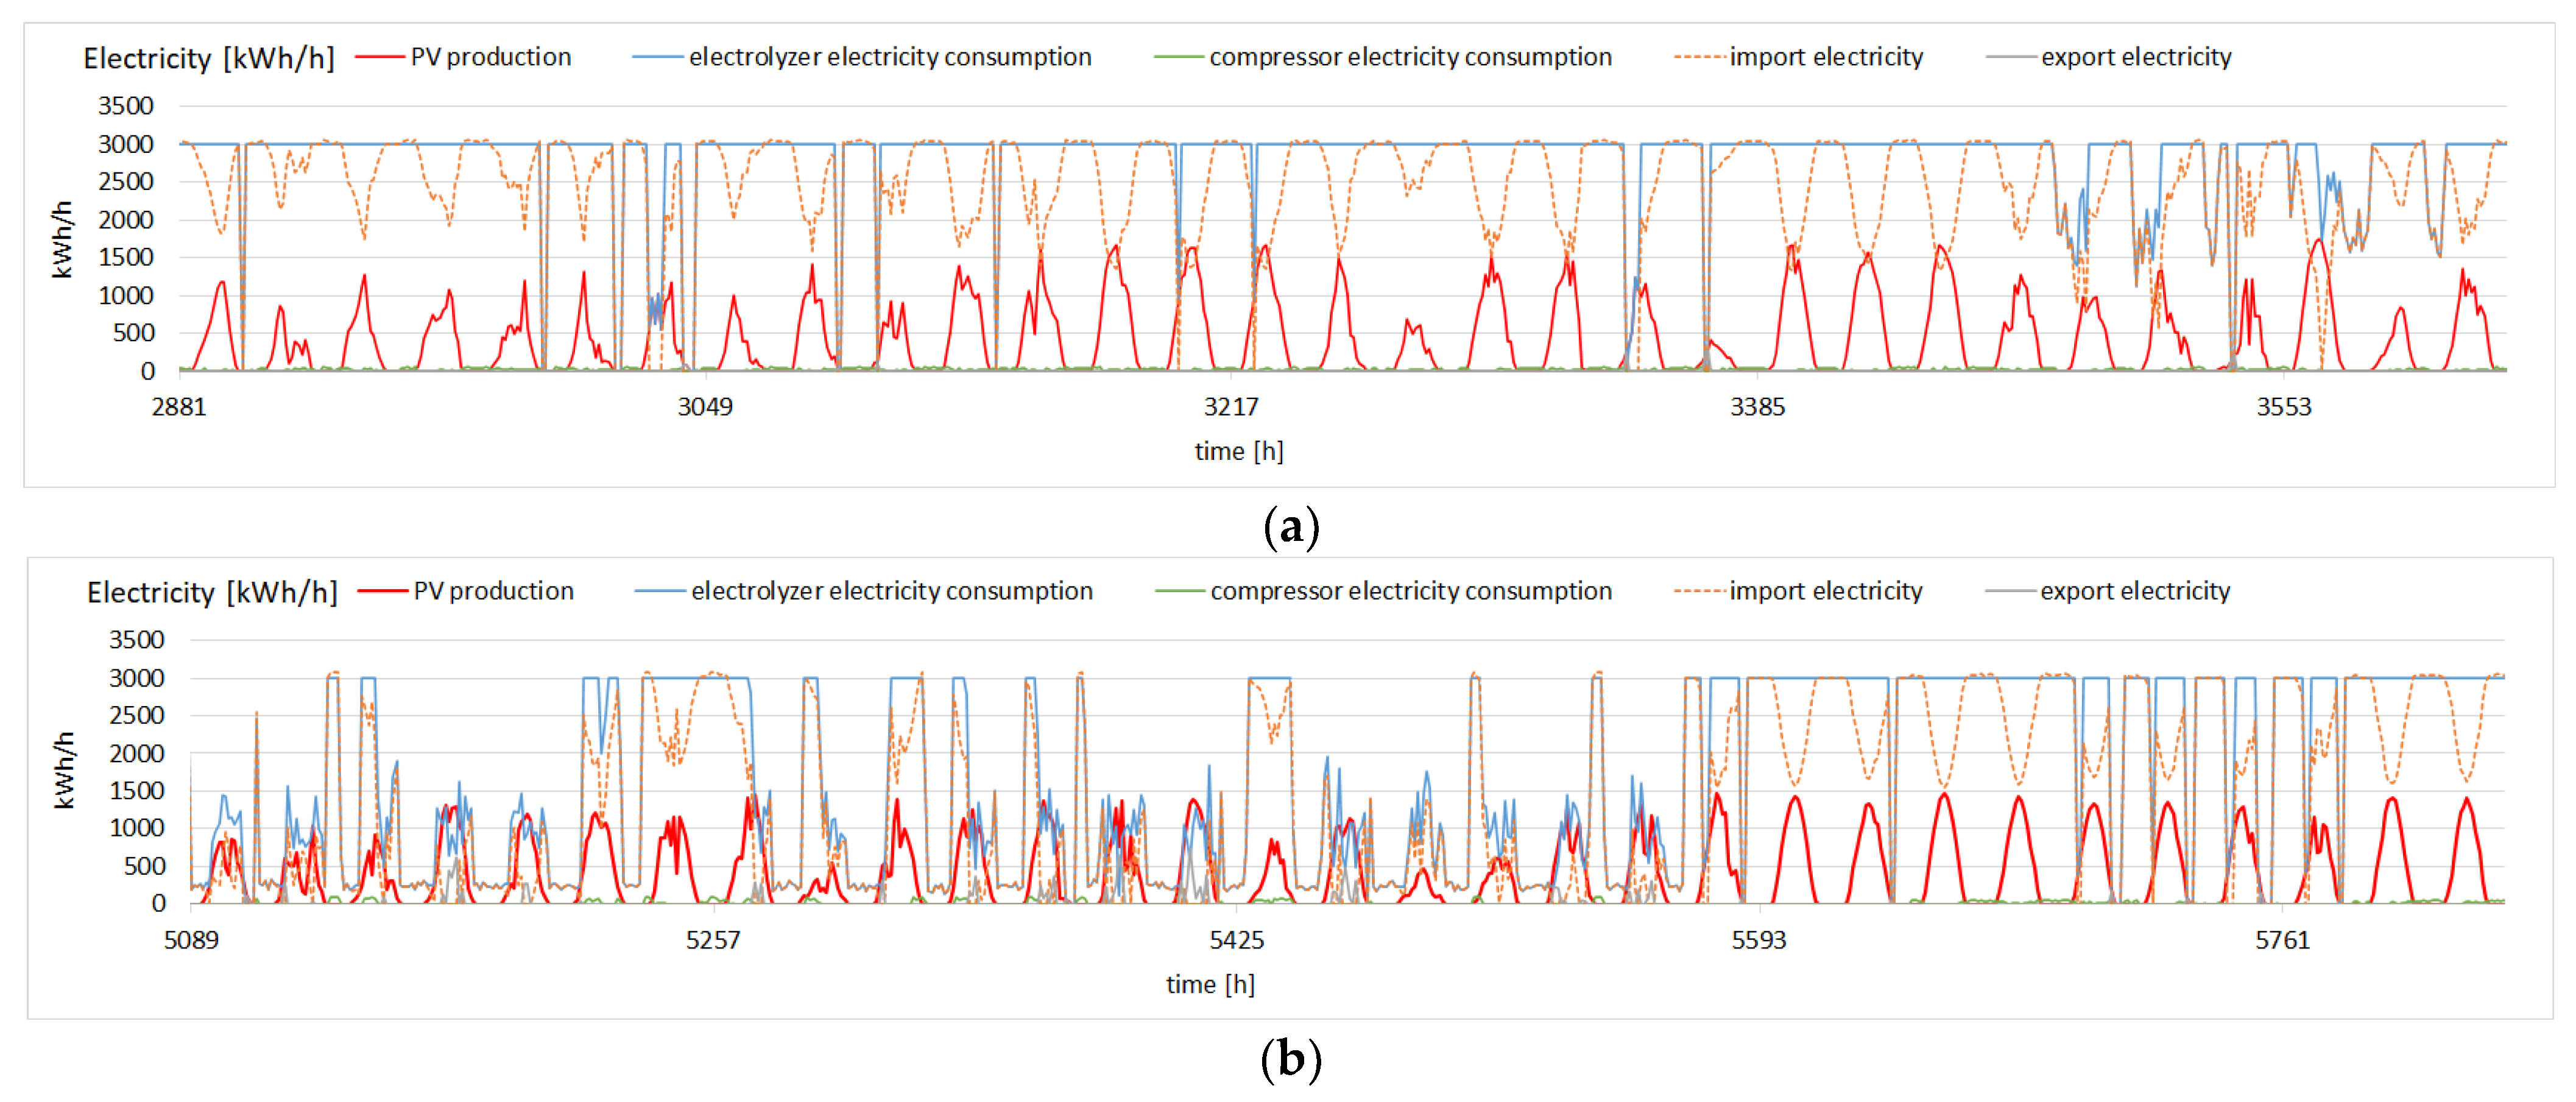
Figure 4 shows the electric energy flows, i.e., solar PV generation, electrolyser and storage compressor consumption.
Figure 5 shows the hydrogen flows, i.e., electrolyser output, storage charge/discharge flows, supplied flows and demand. The difference between the demand and the supplied hydrogen needs to be imported from external sources.
Table 5 shows yearly totals of the energy and hydrogen flows, which are calculated by the model. The results are discussed in the following section.
5. Discussion
In this Section we discuss the correctness and optimality of the results. Correctness of the results is concluded from the pool energy balances (the sum of energy flows should be zero at all times), and further by studying relations between
Figure 3,
Figure 4 and
Figure 5. For instance, the moments when hydrogen is produced and stored in relation to the hydrogen demand (
Figure 3). Or the relation between solar PV production, electrolyser production and import or export of electricity. The first weeks of
Figure 4b show that PV production and import of electricity support each other. The last two weeks show moments where there is not enough hydrogen being produced or stored to supply the high demand for hydrogen during those weeks. This may be improved by a larger electrolyser and hydrogen storage, but this will increase system costs.
From
Figure 4 we conclude that the electric energy from the solar PV system in both months is almost fully consumed by the electrolyser. As these months are relatively sunny compared to other months during the winter, the solar PV system in total has only a minor contribution to the total electric energy required.
The minor contribution of solar PV is also observed from
Table 5. The amount of yearly produced PV energy (
Ppv) is only 9.2% of the required electric energy for electrolysis (
De,g) and compression (
De,c). The difference is imported (
Ie) and a small part of PV energy is exported (
Ee).
Optimality of the size of the electrolyser and hydrogen storage is verified as follows:
- (a)
Most of the hydrogen demand can be supplied at all times.
Figure 3 shows that this is almost fully accomplished in May but that the higher peaks in August cannot be supplied.
Table 5 shows that 84.7% of the total hydrogen demand (
Dg) is supplied by the system (
Dg*).
- (b)
The electrolyser has a large number of operational hours. From
Figure 4 it can be deduced that the electrolyser is operated almost non-stop at full capacity during May and for more than 50% in August. When a 3000 kW electrolyser is operated 8760 h per year, it can produce 458,873 kg hydrogen per year. Compared with the value for
Dg* in
Table 5, the electrolyser is operational for 87% of this time, i.e., 7621 h per year.
- (c)
The storage is small enough to be used intensively but large enough to compensate for times when the electrolyser’s production of hydrogen is insufficient.
Figure 3 shows that the storage supports the continuous operation of the electrolyser very well in May. In August, the demand is quite low during the first part of the month, and this leads to a longer period with completely filled storage. However, when the week occurs with a high demand, the storage is emptied quite fast and the electrolyser also runs at full capacity. The choice could be made for either a larger storage or a larger electrolyser; however, this would also increase system costs and lower the overall utilization of the system.
For the system analysed, the total yearly costs are determined by taking the cost parameters of
Table 3 into account. These costs add up to yearly €2,478,975. The production price of hydrogen is then €6.21 per kg which compares well with current references on price levels for green hydrogen, refer to [
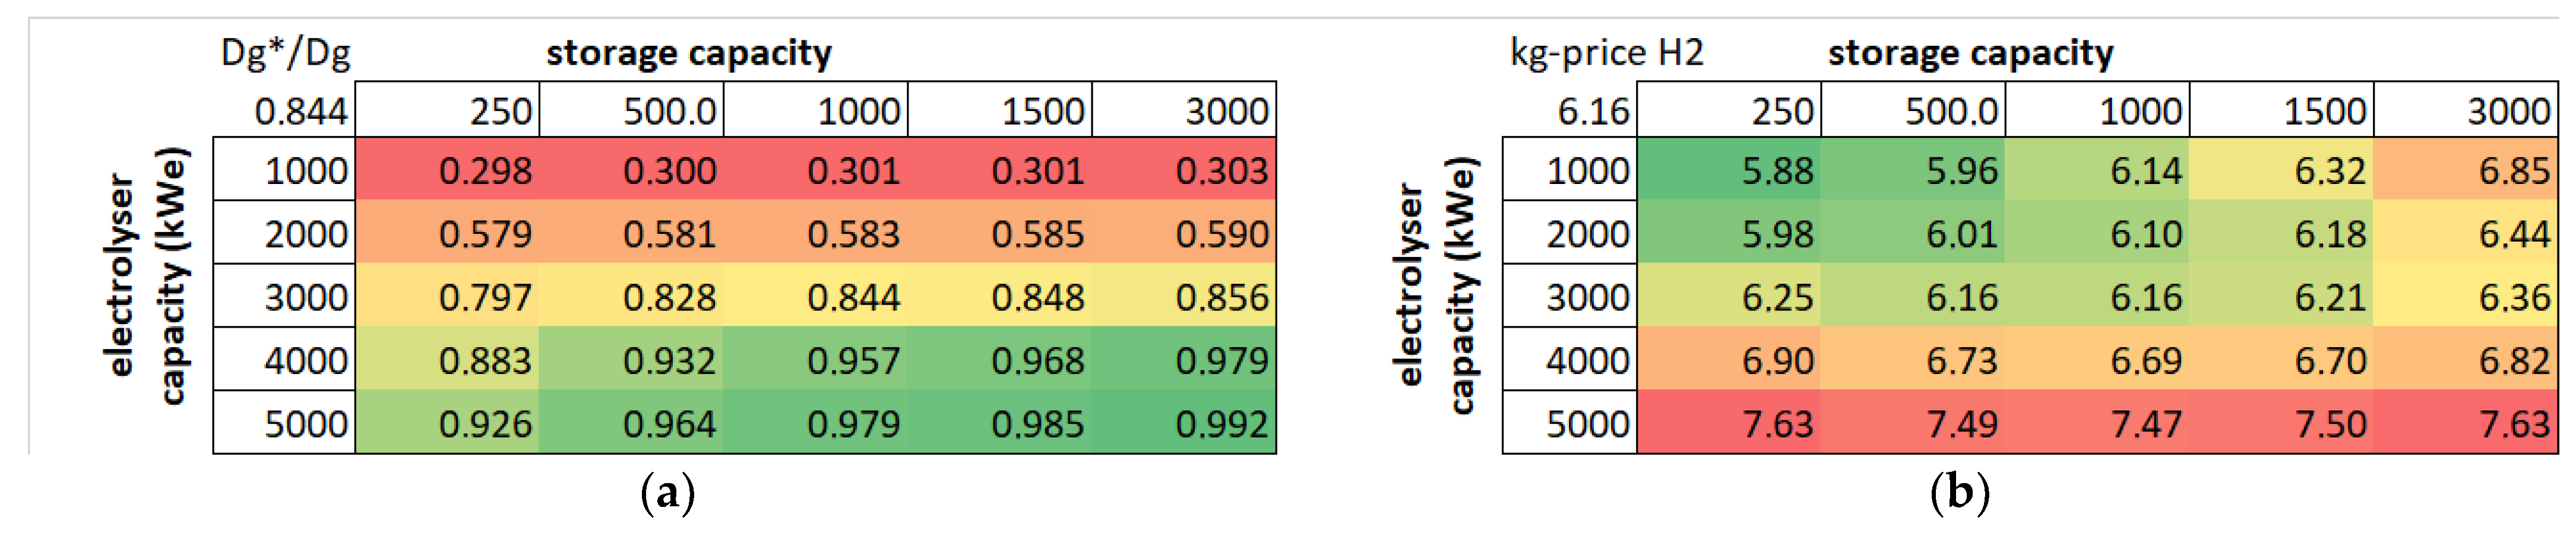
59]. With the model and Microsoft Excel’s ability to perform “what-if” analysis, it is relatively easy to perform capacity scenario analysis. In
Figure 6a the influence of a range of electrolyser and hydrogen storage capacities on supply security values, defined as the supplied amount of hydrogen divided by the total hydrogen demand (
Dg*/
Dg) is shown. In
Figure 6b the influence of the same range on hydrogen price is shown. Computational time needed for this analysis is in the order of seconds.
Figure 6 indicates that the storage capacity chosen could be smaller at 500 or 1000 kg. This would decrease the price of hydrogen to 6.16 €/kg while the security of supply stays high at 83% and 84% respectively. The price of hydrogen decreases further when smaller electrolyser and storage capacities are used. However, this has a strong negative effect on the security of supply. For the remainder of this section we chose a hydrogen storage size of 1000 kg.
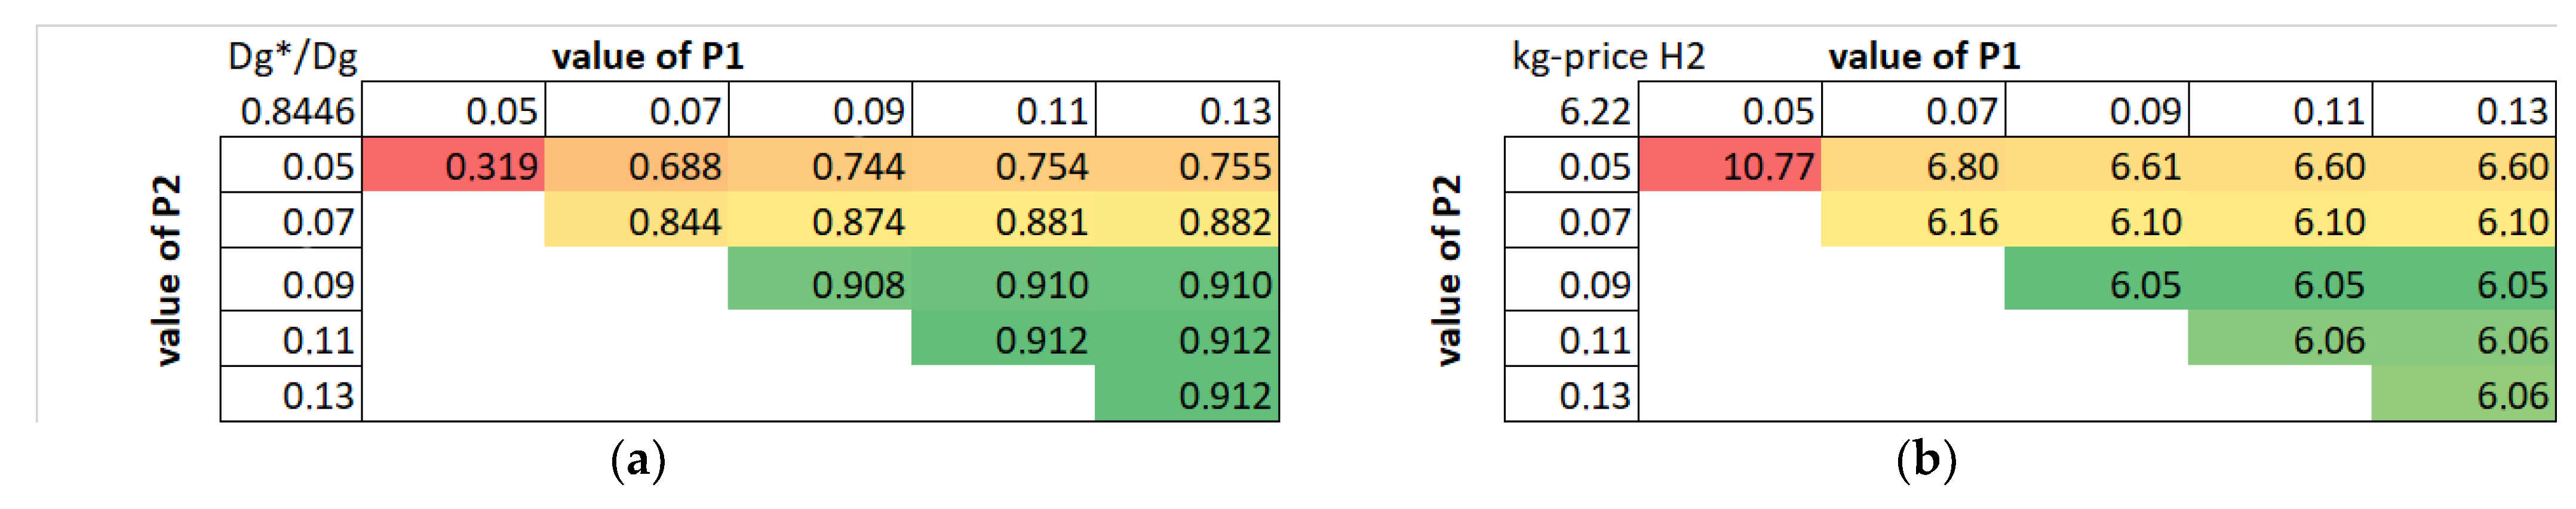
It is interesting to evaluate the influence of import price levels P1 and P2. Changing these to lower values than the preliminary choice decreases the possible import of electricity and therefore also decreases production by the electrolyser which leads to more import of hydrogen from external sources. The value of P2 determines how often electricity can be imported to produce hydrogen for storage purposes.
We evaluate for the case dataset and for the selected size of the electrolyser (3000 kWe) and hydrogen storage (1000 kg), the relation between
P1 and
P2 and the resulting supply security (
Figure 7a) and price of hydrogen (
Figure 7b).
Figure 7 should be read per column, for each value of
P1, the influence on either supply security or hydrogen price can be evaluated for different values of
P2, which is always lower than the value of
P1.
When P1 and P2 increase, more electricity to produce hydrogen will be imported, hence supply security increases. The influence on hydrogen cost is more complex. When P1 and P2 increase, first the hydrogen cost decreases, mainly because of more operating hours and more hydrogen produced by the electrolyser, which decreases the large influence of the yearly capital costs of the electrolyser within the price per kg. However, when P2 is increased above 0.09 €/kWh, a minor increase in hydrogen cost is observed caused by higher electricity costs, mainly to produce hydrogen for the storage.
Similar figures can be drawn for different combinations of electrolyser and hydrogen storage sizes. From
Figure 6 and
Figure 7 we conclude that there is a trade-off between supply security and hydrogen price which is influenced by electrolyser and hydrogen storage size and the electricity import price levels that we wish to set.
These choices also determine the flexibility that the system offers to solve congestion problems for the electricity grid when electricity prices are related to the need for flexibility. If such price levels are negotiated between the energy hub operator and the connected grid operator, then the model and algorithms in this paper can provide valuable insights on the influence of price control for the energy hub system on grid congestion and the business case. However, when development of the energy hub proceeds after analysing the business case, further research is necessary to investigate optimal control of the electrolyser and hydrogen storage, while the control offered by the algorithms does not take (near) future situations into consideration and will therefore sometimes make suboptimal control decisions. A review on more advanced smart grid control methods including hydrogen conversion and storage is given in [
60]. Part of future work is to include hydrogen conversion and storage in the DEMKit smart grid control toolkit, as introduced in [
61].
6. Conclusions and Outlook
In this paper a model was developed to analyse energy hubs which include renewable energy generation, an electrolyser, hydrogen storage and demand for electricity, heat and hydrogen. The model can be used together with cost parameters as part of a method to study business case scenarios during the feasibility phase of energy hub projects. The paper details model equations and algorithms and these are worked out into a spreadsheet tool which is made available for research purposes. Working with the model is straightforward and fast. It requires a set of demand data, manual selection of which assets are part of the system and definition of equipment capacities and efficiency and cost factors. The most complicated part is to analyse the results and to vary capacities and electricity import cost parameters in order to work towards the most desired operational situation for all stakeholders. We explain that due to counteracting practicalities, it is hard to develop a uniform, mathematical optimisation method for practical situations.
A case application shows the capabilities of the spreadsheet model to evaluate the performance of the energy hub system on a yearly and hourly level. Experience with such cases so far has demonstrated the robustness of the algorithms to come up with logical results even when extreme data or parameters are chosen.
We show the practical use and ease of use of the model for scenario analysis, leading to a preliminary business case in which the trade-off between electrolyser size, hydrogen storage size and import price level boundaries on supply security and hydrogen price is evaluated in order to make decisions for the design of the energy hub. The model also enables analysis of flexibility offered by the energy hub to solve grid congestion problems. A more detailed business case analysis is outside the scope of this paper and is part of future work. In future, it will also be interesting to investigate if different types of tools in which energy hubs can be modelled, lead to comparable results. Finally, validation of model results with real operational data of energy hubs from practice is also in the scope of future work, when such energy hubs become operational in the Netherlands.


 ,
, 


