Article

Research on Low-Voltage AC Series Arc-Fault Detection Method Based on Electromagnetic Radiation Characteristics

1
College of Mechanical and Electrical Engineering, Kunming University of Science and Technology, Kunming 650504, China
2
College of Science, Kunming University of Science and Technology, Kunming 650504, China
*
Author to whom correspondence should be addressed.
Energies 2022, 15(5), 1829; https://doi.org/10.3390/en15051829
Submission received: 30 January 2022 / Revised: 18 February 2022 / Accepted: 24 February 2022 / Published: 2 March 2022
(This article belongs to the Topic Power Distribution Systems)

Abstract

:
Arc fault is an important cause of electrical fire. At present, the arc-fault detection method based on current and voltage is vulnerable to the influence of a nonlinear load and switching operation in the line, resulting in misjudgment and omission. Therefore, an arc-fault detection method based on the characteristics of electromagnetic radiation is proposed. A low-voltage AC series arc-fault simulation platform is built, and a simple annular antenna is designed to receive an electromagnetic radiation signal. It is proved by experiments that electromagnetic radiation signals have similar characteristic frequencies (13.6–14.2 MHz) under different currents, loads, arc positions and arc occurrence times. At the same time, the electromagnetic radiation signal of a low-voltage AC series arc and normal switching operations are compared. The pulse oscillation time of the radiation signals of the operating arc (2 μs) is far shorter than that of the faulty arc (4 μs), and the characteristic frequency of the radiation signal generated by the switching operation (9.35 MHz) is significantly lower than that of the series arc radiation signal (14 MHz). Compared with the existing methods, this method does not need to consider the influence of current, nonlinear load and other factors in the line, and can accurately distinguish the operating arc and faulty arc.

1. Introduction

A faulty arc can easily cause electrical fire, and has a strong destructive ability. An arc current of 0.5 A may cause electrical fire, and local high temperature will be generated above 2 A, leading to major accidents [1,2]. Factors such as aging or breakage of wire insulation, loose connection position, poor contact, and a fracture in wire bundle may cause arc fault [3]. According to the different positions of the fault arc in the line, the arc can be divided into series arc, parallel arc, and grounding arc [4,5]. The current in the line is large when the parallel arc and grounding arc occur, and the traditional circuit breaker can realize line protection. However, the current in series arc discharge is small, and it has strong randomness and intermittence, so the circuit breaker cannot provide protection [6,7].
Arc extinguishing is an important means to avoid electrical fire. Unlike DC arc, AC arc will naturally extinguish at zero crossing. When the voltage reaches the breakdown voltage again, if there is still enough ionization gas in the arc gap, the arc will continue to burn. Therefore, the arc-extinguishing method is mainly divided into two types. One is to change the nature of the arc-burning gap media, such as GIS being filled with SF6 gas to stop the arc. However, for the low-voltage AC line studied in this paper, the arc location is not fixed, and this method is not applicable. The second method is to limit the voltage in the circuit, that is, to disconnect the line switch, which requires accurate detection of the arc in the line to avoid the occurrence of false jumps. Therefore, it is of great significance to find an effective series arc detection method.
When the fault arc occurs, the voltage and current in the line will be distorted compared with the normal state. Using the characteristics of voltage and current changes to identify the fault arc is the most commonly used method at present. Domestic and foreign scholars have proposed a large number of detection methods based on arc voltage and current. Among them, Artale et al. used the time-domain and frequency-domain characteristics of current to identify the fault arc [8,9,10,11]. Zhao et al. used time–frequency analysis methods such as wavelet transform to extract the time–frequency-domain characteristics of arc current and realize the identification of the fault arc [12,13,14]. In Ref. [15], a series fault-detection method based on the mean of voltage waveform difference at the load end was proposed. The detection of series fault arcs can be achieved by the ignition of the fault arc and extinguishing the harmonics generated in the voltage [16]. These methods based on voltage and current change have a certain effect, are not limited by the fault arc’s position, and are also easy to carry out. At present, power lines are becoming more and more complex. The current of many electrical appliances is similar to that of some electrical appliances when arc fault occurs, which is difficult to distinguish. Siegel et al. used more advanced machine learning algorithms to identify the arc voltage and current, and achieved good results [17,18,19]. However, the calculation of this method is relatively complex, and it puts forward higher requirements for hardware. At present, it cannot be applied to engineering practice.
In addition, a series of physical phenomena will be generated in the process of arc fault, including sound, light, heat and electromagnetic radiation. Based on the above phenomena, many detection methods have been proposed. Among them, arc sound detection can detect the early occurrence of arc fault and predict the arc [20]. This method has high sensitivity, but it is vulnerable to external noise interference. Arc detection is based on the luminescence phenomenon in the arc process to judge the fault arc [21], but this method is susceptible to external light interference. Many scholars use electromagnetic radiation phenomenon to detect arc. Among them, Kim received the electromagnetic radiation of the fault arc by using ring antenna and rod antenna [22]. However, it only measured the kHz signal, and did not analyze the radiation source. In [23,24,25], electromagnetic radiation was also used to realize the detection of the arc fault, but they did not analyze the influence of various factors in the line.
Therefore, a 220 V AC arc-fault generation platform is built in this paper, and the arc fault is generated under different test conditions. The electromagnetic radiation signal is received by the designed loop antenna. The amplitude and characteristic frequency of the received signal are analyzed, and compared with the electromagnetic radiation signal of normal switching operation. An arc-fault diagnosis method based on the pulse time and characteristic frequency of the electromagnetic radiation signal is proposed.

2. Method and Experimental System

2.1. Theoretical Analysis

Arc discharge is generally accompanied by electromagnetic radiation process, but due to the randomness of discharge, the electromagnetic radiation generated is also uncertain, and there is a big difference between each two radiation signals. The behavior of electromagnetic radiation in the arc process has long been a hot topic in theoretical and experimental studies [22,26,27,28].
Electromagnetic radiation signals are generally caused by changes in current. Reference [22] gave the electric field expression at the distance R from the discharge position as follows:
E ( R , t ) = sin θ 4 π c 0 Rc 2 0 l dI dt dx  
where θ is the angle between the current direction and the field component direction, and c is the speed of light. If the arc position is regarded as the point source, the above equation can be simplified as:
E arc ( t ) = 1 4 π ε D c 2 dI arc dt = k · dI arc dt  
where k is a constant. It can be seen from Equation (2) that the electromagnetic radiation of arc is mainly related to the derivative of arc current and is proportional to the change rate of arc current.
When an arc fault occurs, the contact resistance R exists before the separation of the two electrodes, and the contact resistance includes the contraction resistance Rc of each electrode and the film resistance R m , which can be expressed as
R = 2 R c + R m
The film resistance Rm can be expressed as:
R m = ρ 2 a  
in the formula, ρ is the resistivity of electrode material, a is the radius of conductive point. Before the arc fault occurs, the current in the circuit is determined by the resistance when the applied voltage U is applied. The current can be expressed as:
I = U R 1 + R e + R  
among them, R 1 is the load resistance, R e is the electrode resistance, R is the contact resistance. At the moment of arc generation, the contact resistance becomes 0 at the moment, and the change rate of line current can be expressed as:
dI dt = U R 1 + R e + R U R 1 + R e dt
From Equation (6), it can be seen that the amplitude of the electric field radiation signal is related to the load resistance, electrode resistance and contact resistance. As the load resistance decreases, the current in the line increases, and the rate of change of the current increases accordingly.
Ref. [26] demonstrated that the frequency with the maximum amplitude in the spectrum of the electromagnetic radiation signal is
f 0 = ω 2 π = 1 2 π R a C s
Assuming that the arc resistivity is ρ , the arc equivalent resistance can be estimated by the following equation:
R a = ρ l S  
where l is the length of the arc, S is the average cross-sectional area of the arc section. The equivalent capacitance of arc can be estimated as:
C s = ε 0 S l
According to Formulas (7)–(9), the characteristic frequency of electromagnetic radiation signal can be obtained as follows:
f 0 = 1 2 π ρ ε 0
As can be seen from the equation, the characteristic frequency of electromagnetic radiation depends on the arc resistivity and air dielectric constant. The dielectric constant of the medium is a constant value in general, but in the arc process, the dielectric constant changes because the arc generates high temperature, and the arc resistivity cannot be calculated or measured in real time, so it is difficult to accurately calculate the characteristic frequency of the electromagnetic radiation signal by the above equation, and the arc resistivity generally does not change much without changing the material of the discharge electrode [29]. Therefore, the characteristic frequency of the electromagnetic radiation signal should also be within a certain range.
According to the above derivation, the electromagnetic radiation signal amplitude will be affected by the current in the line, while the characteristic frequency of is not affected by the current received in the line and other factors. Therefore, the characteristic frequency of electromagnetic radiation signal can be used to identify the fault arc, and the following experiments aim to verify the method.

2.2. Experimental System

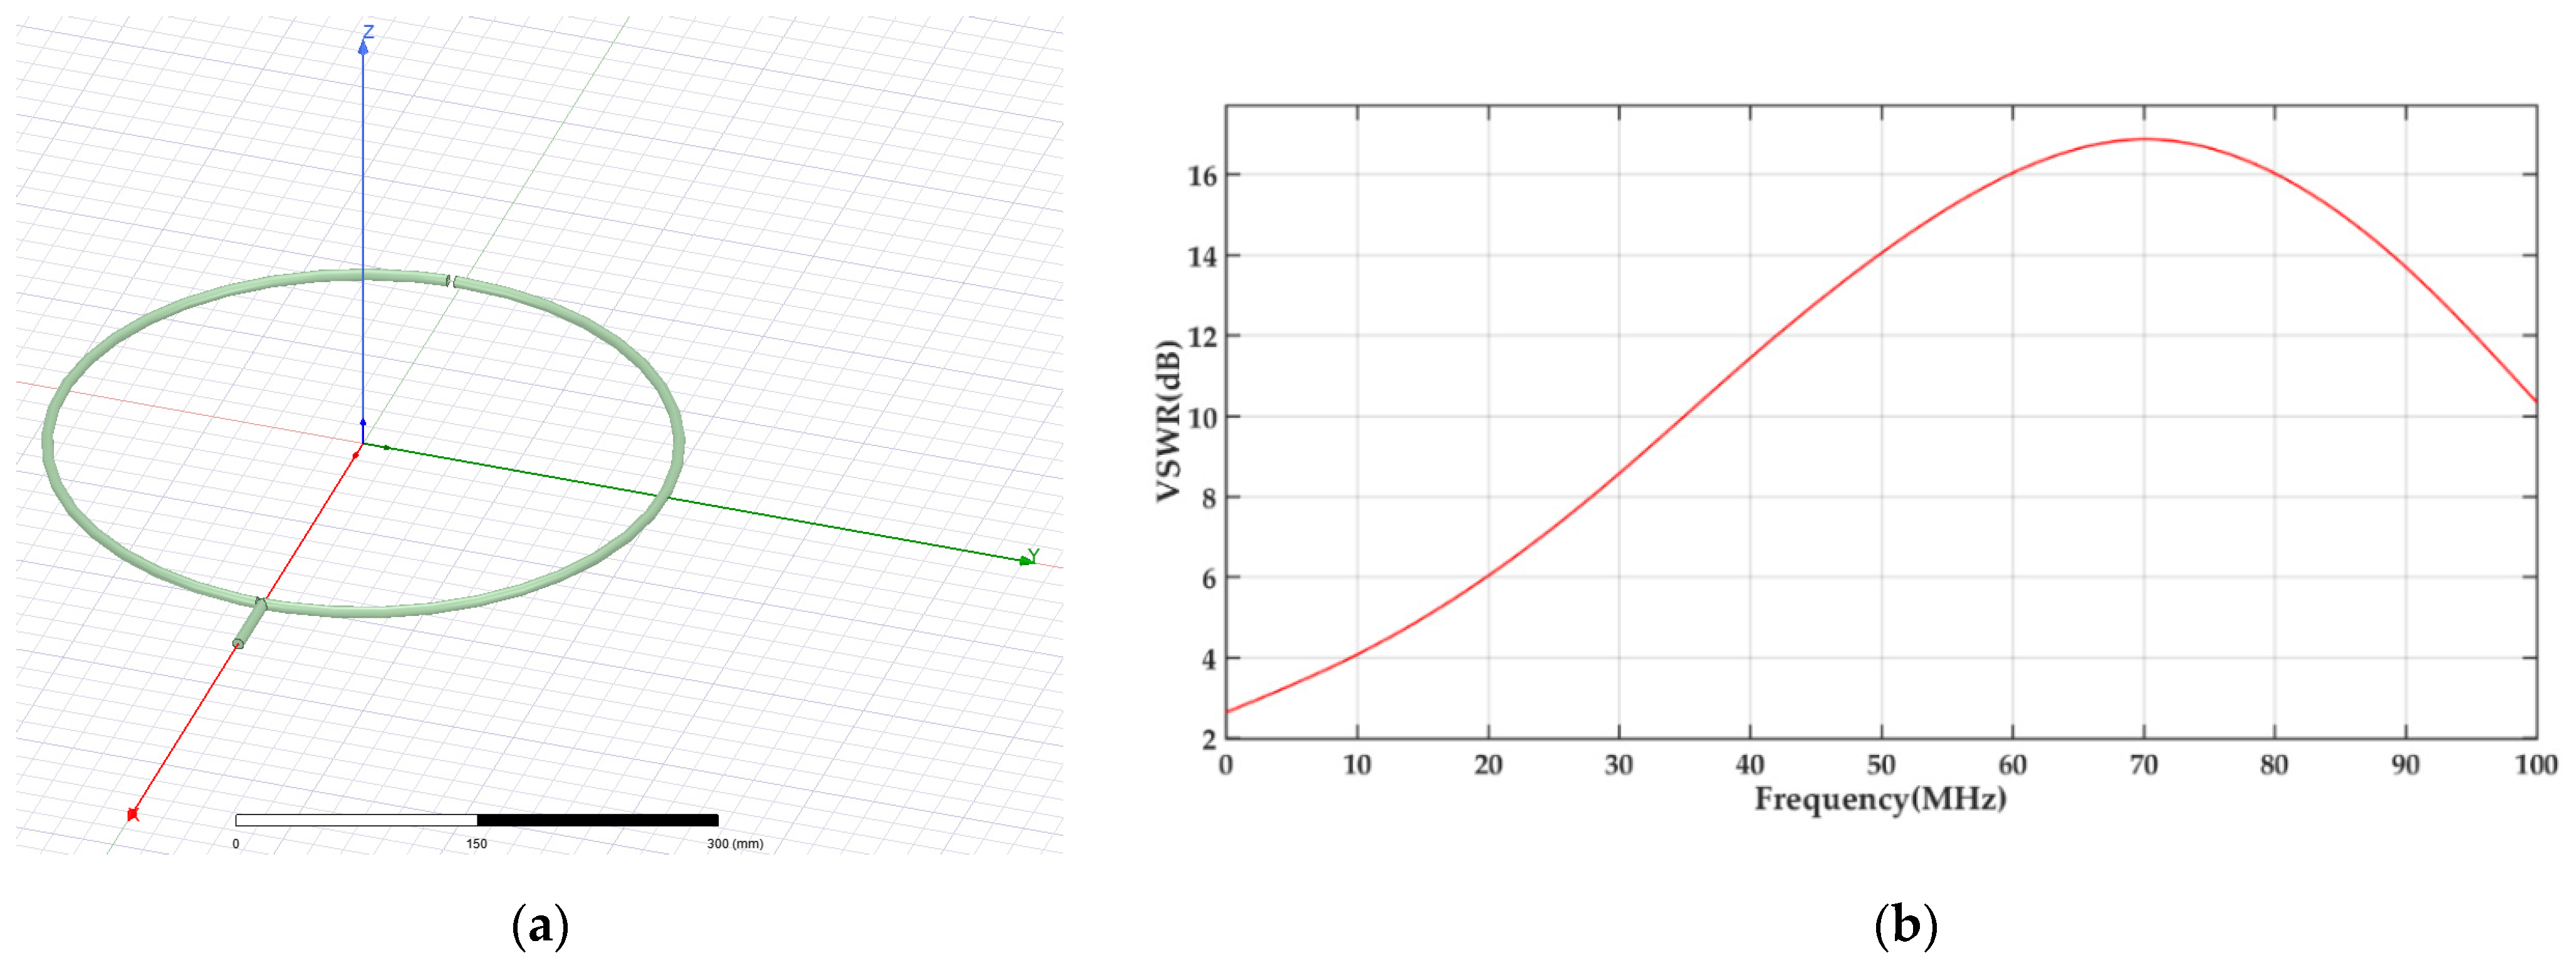
2.2.1. Design of Receiving Antenna

As a receiving device, the performance of the antenna directly affects the acquisition accuracy of the arc electromagnetic radiation signal. In the design indexes of antenna, voltage standing wave ratio (VSWR), input return loss (S11), pattern, efficiency, and gain can be used to measure the performance of antenna. Since the main purpose of this paper is to maximize the acquisition of the electromagnetic radiation signal generated by the fault arc, according to Reference [26], the frequency of arc electromagnetic radiation can reach 10 MHz, so the designed antenna bandwidth must be greater than 10 MHz, so that the high-frequency part of the signal will not be ignored. Therefore, this paper mainly considers the gain and bandwidth of the antenna. The loop antenna has the characteristics of simple structure, high gain, good directivity, and wide frequency band. In addition, in order to suppress external interference, a loop antenna with shielded resonant structure is adopted. Through HFSS simulation analysis, the optimal antenna diameter is 22 cm, and there is a 2 cm gap at the top of the ring. Figure 1 shows the structure of the ring antenna and the voltage standing wave ratio curve of the antenna obtained by simulation.
Figure 1b shows the voltage standing wave ratio curve of the antenna in 100 MHz. According to the antenna theory, when the VSWR is less than 10 dB, the transmission efficiency of the antenna can exceed 33%. As can be seen from Figure 1, the antenna has good transmission efficiency in the frequency range of 30 MHz, which meets the measurement standard of arc fault electromagnetic radiation signal.

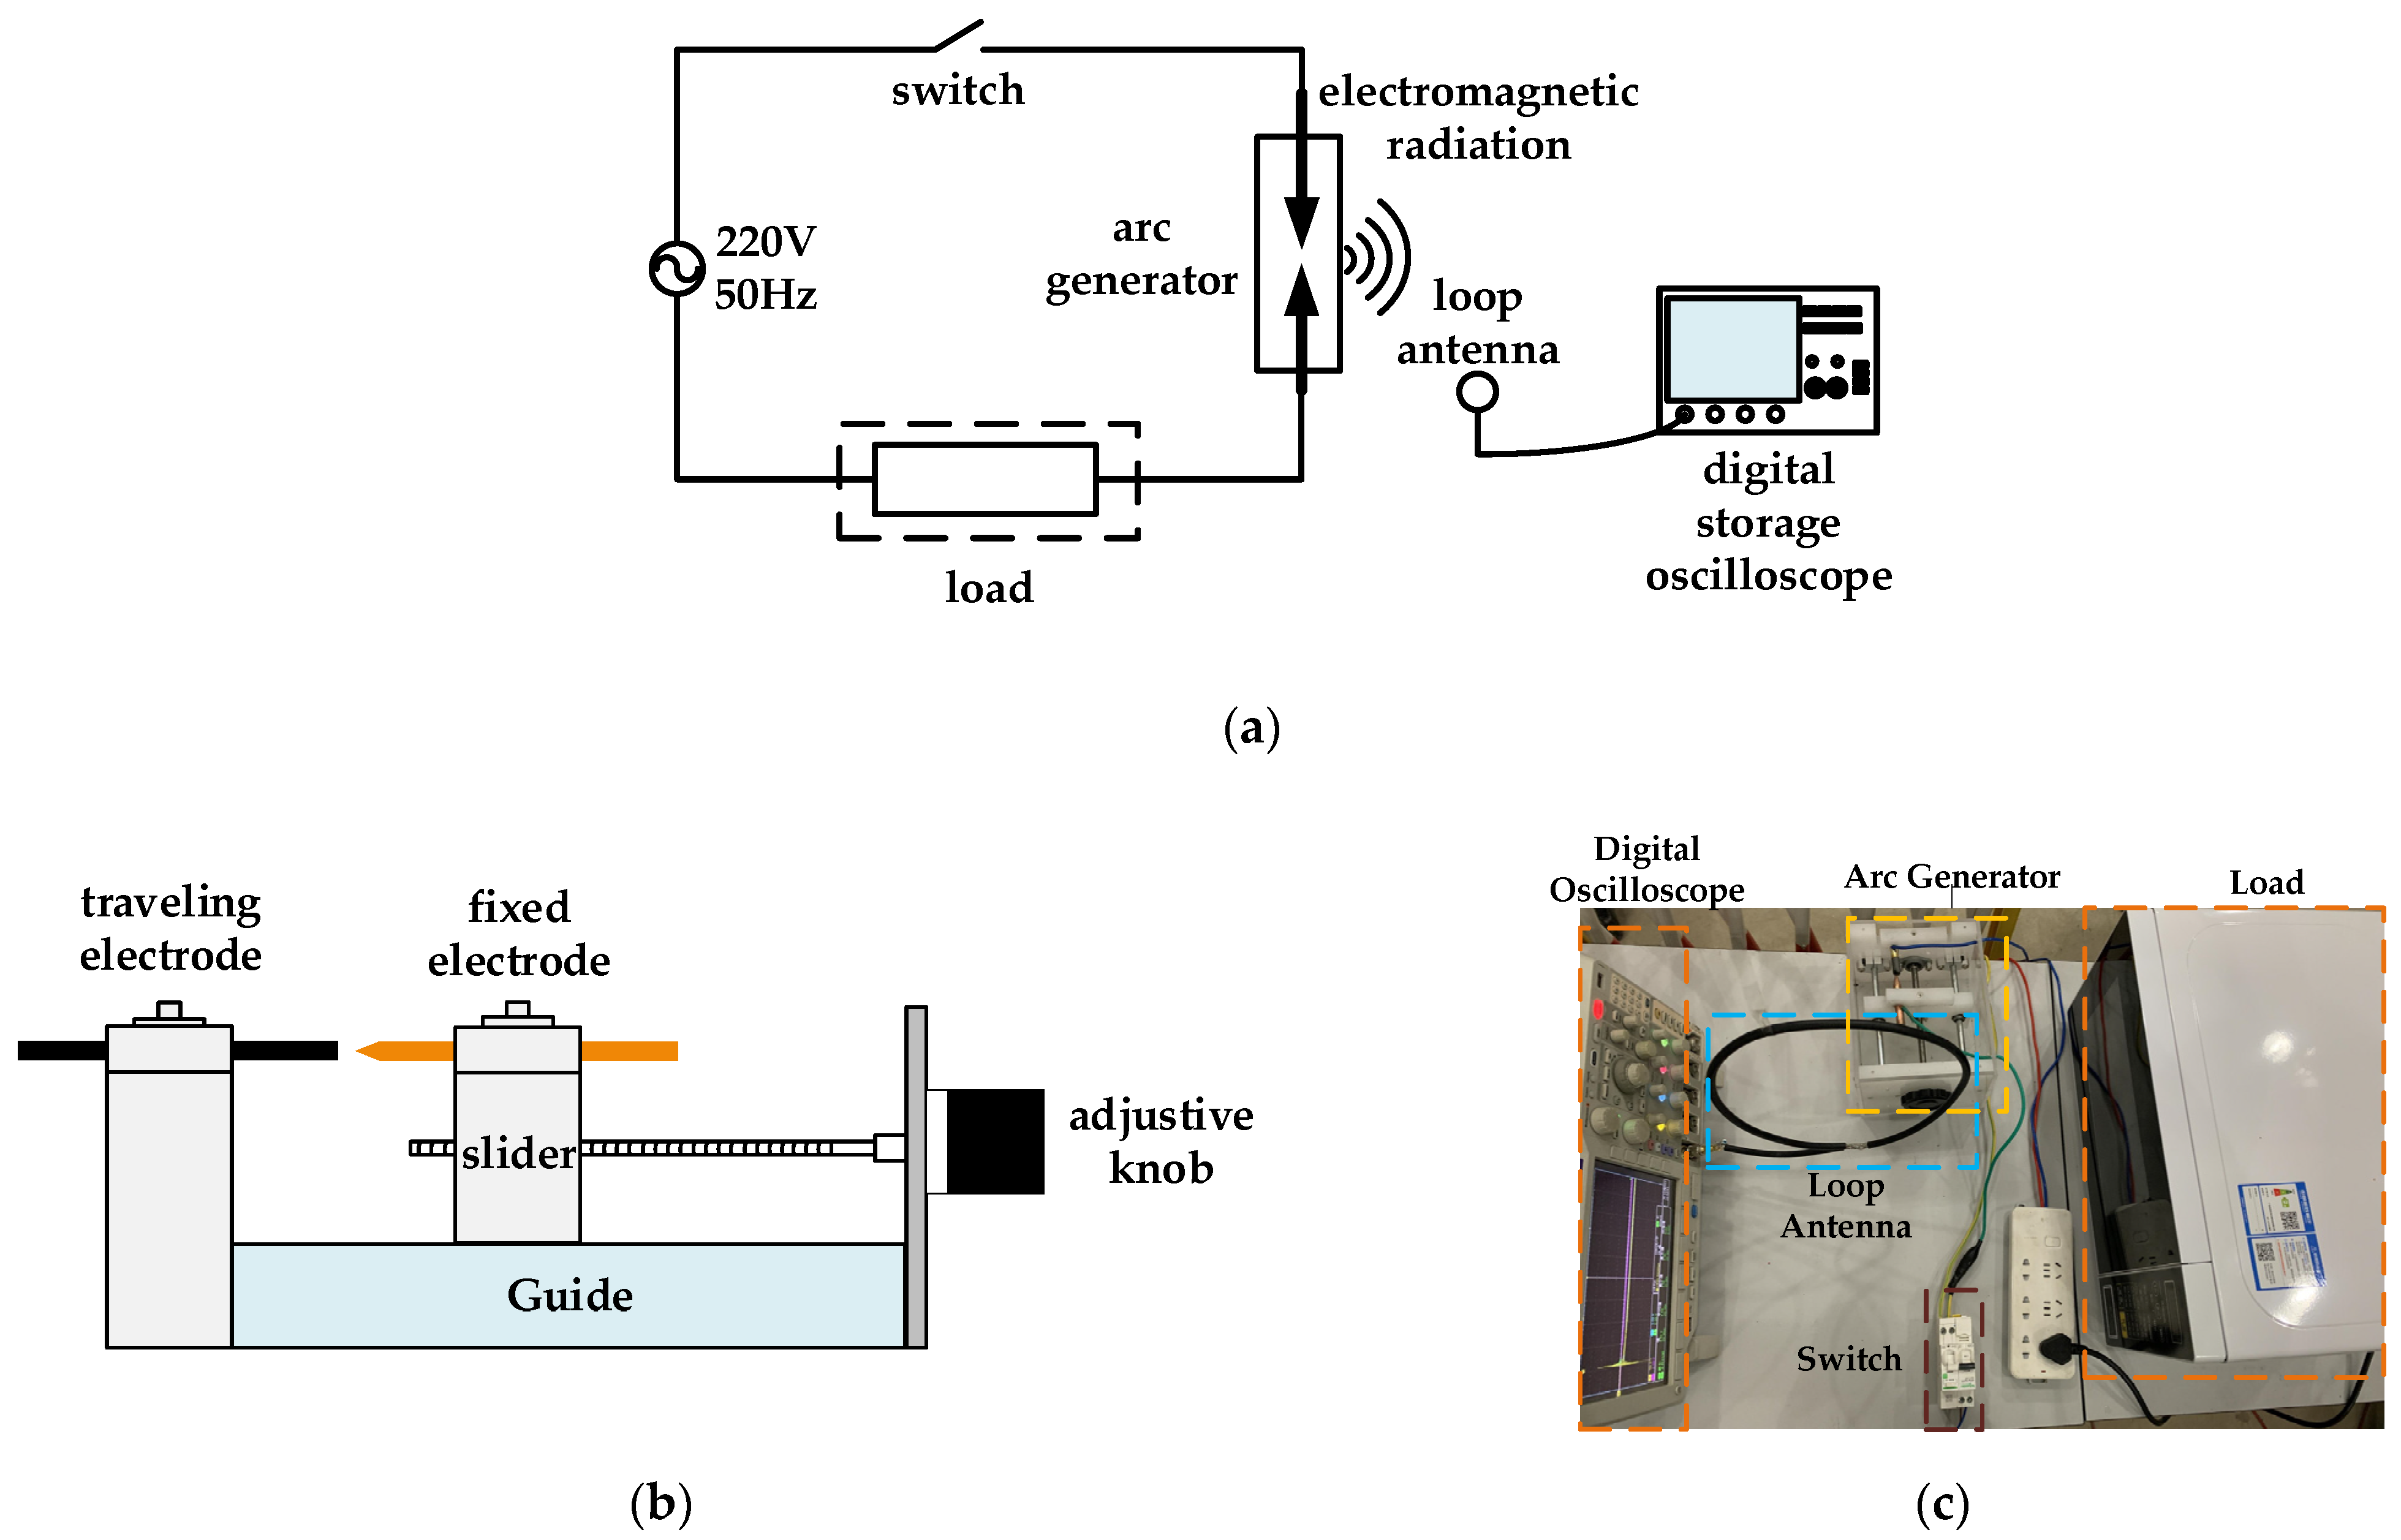
2.2.2. Arc Generation and Measurement Platform

AC series arc generation system consists of power supply, arc generation device, load, receiving antenna, and digital oscilloscope. Among them, the power supply is household 220 V/50 Hz AC power supply. The arc generator is shown in Figure 2; it is made according to UL1699 standard [30], which is composed of a fixed carbon electrode with a diameter of 6 mm and a copper electrode with a diameter of 6 cm with a tip. The copper electrode is fixed on the movable slider, and the position of the slider can be adjusted by a knob. The device can simulate the arc phenomenon caused by loose connector or partial disconnection in the harness in the transmission line; the digital oscilloscope is used to collect the signal received by the antenna. Its bandwidth is 200 MHz and the maximum sampling rate is 2 GS/s.
In order to verify the characteristics of electromagnetic radiation under different loads, several typical loads are selected, including linear load and nonlinear load. The specific loads used will be described in detail in Section 3.

3. Experimental Results and Analysis

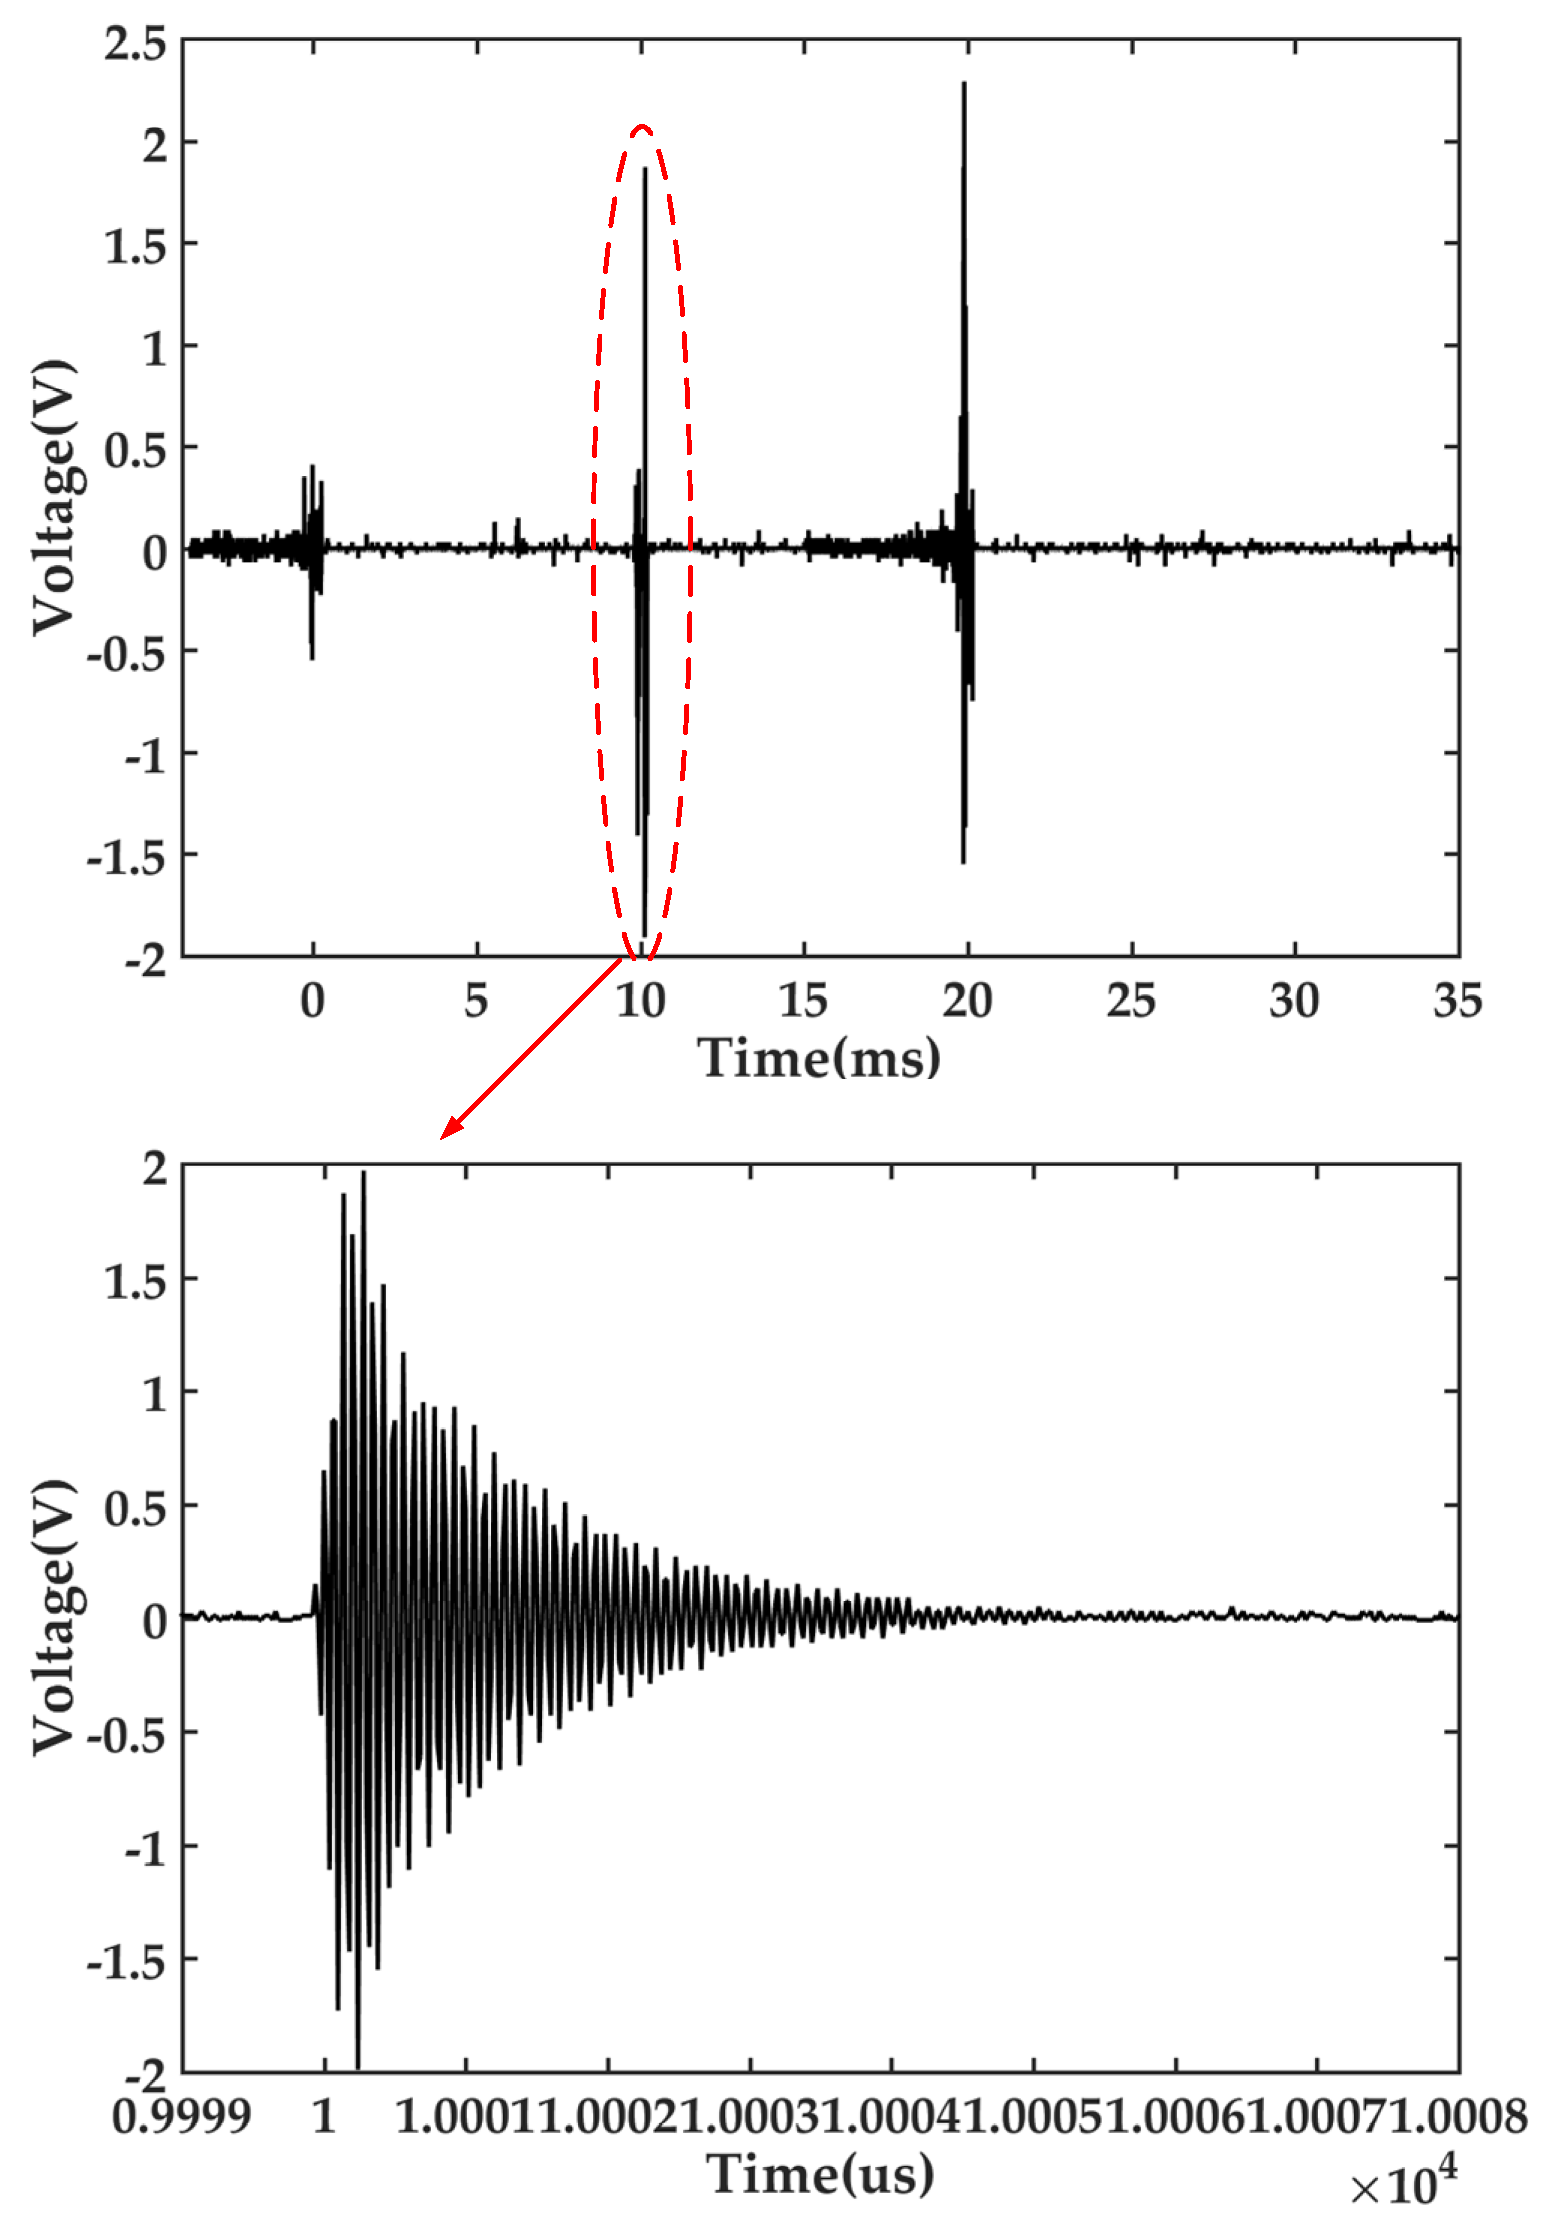
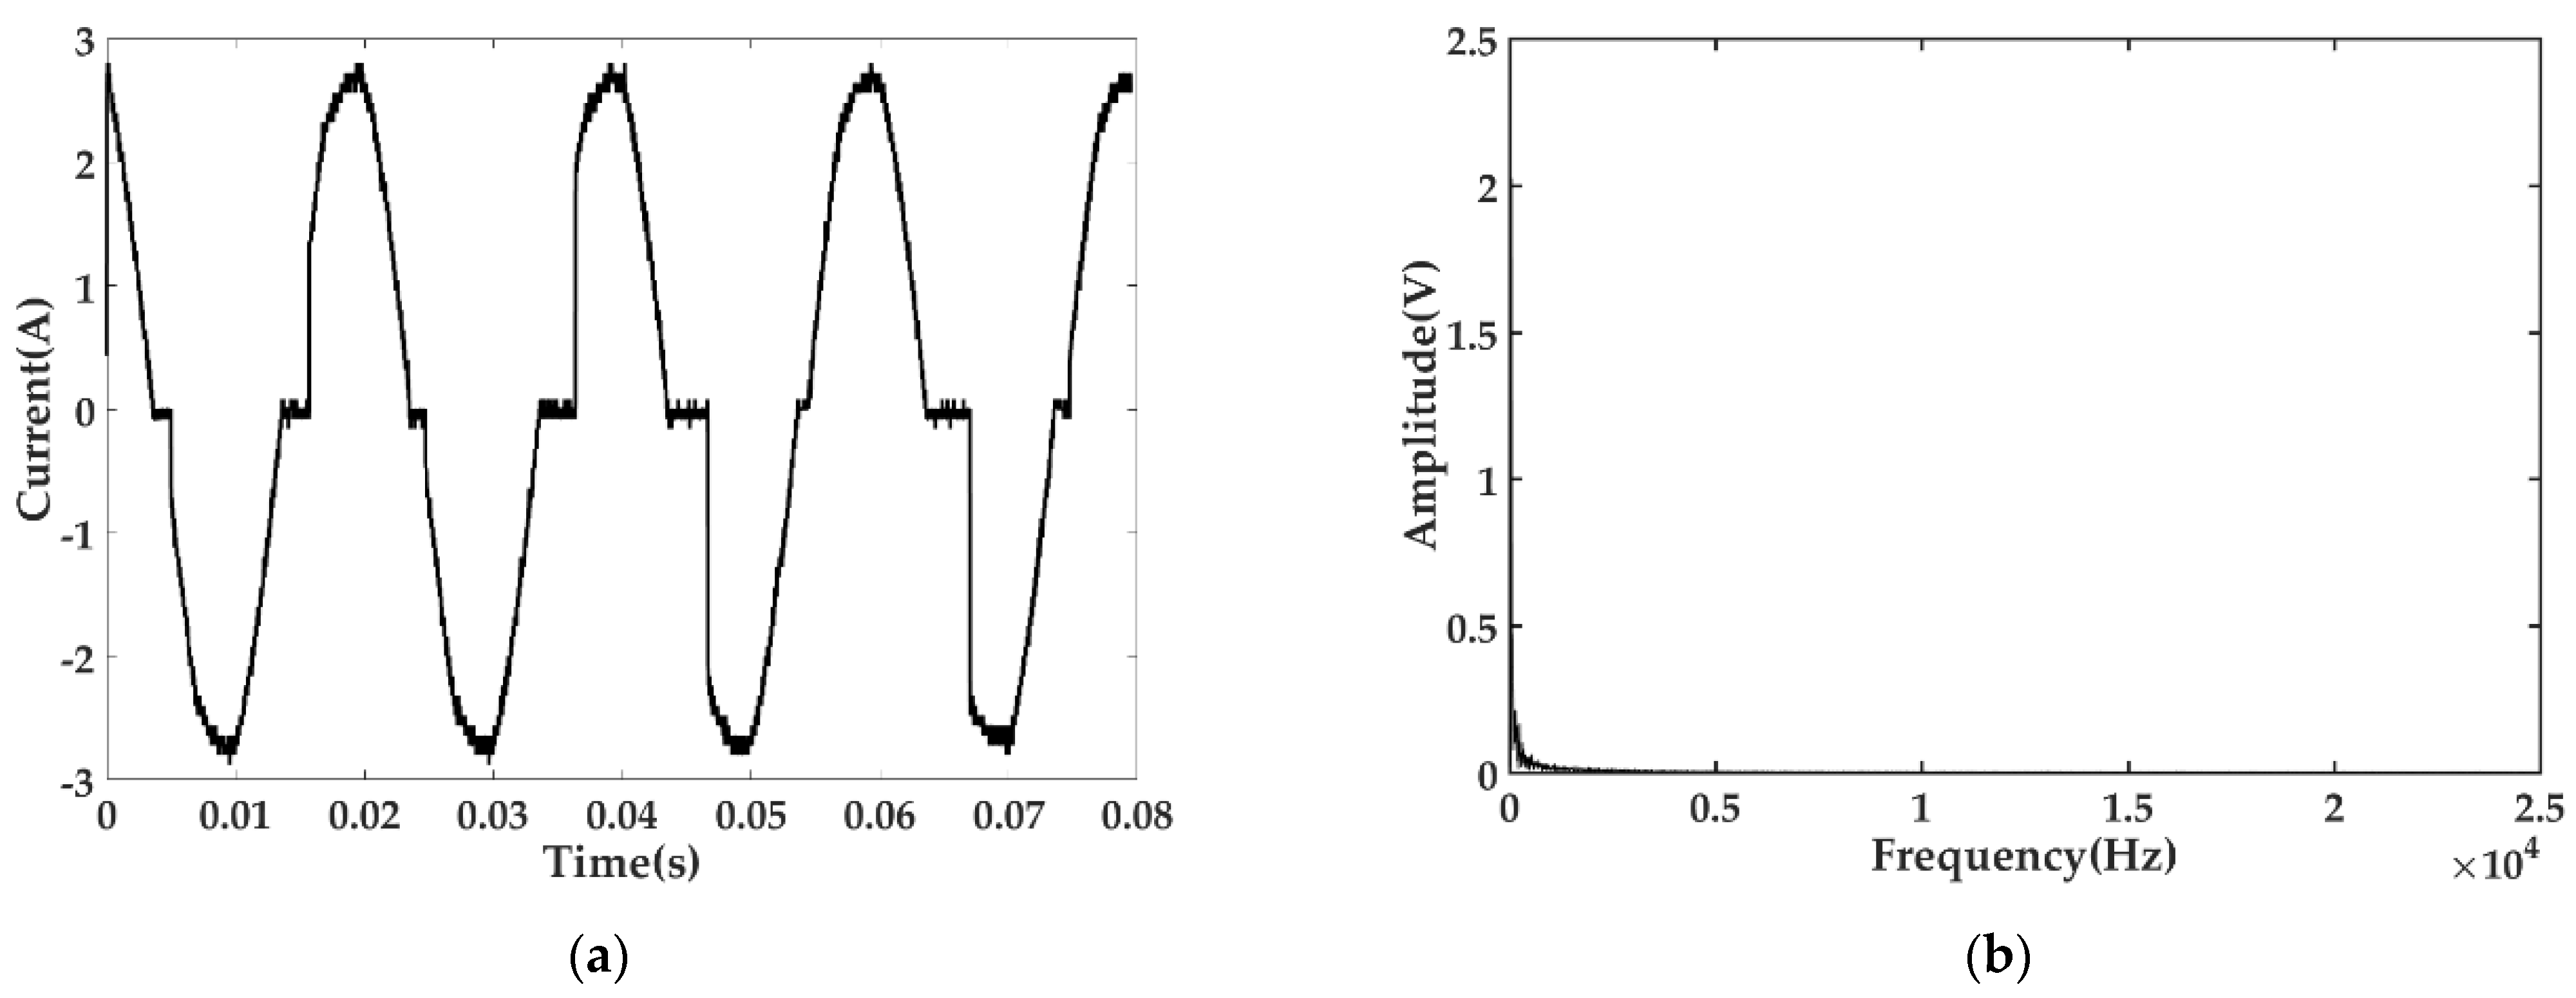
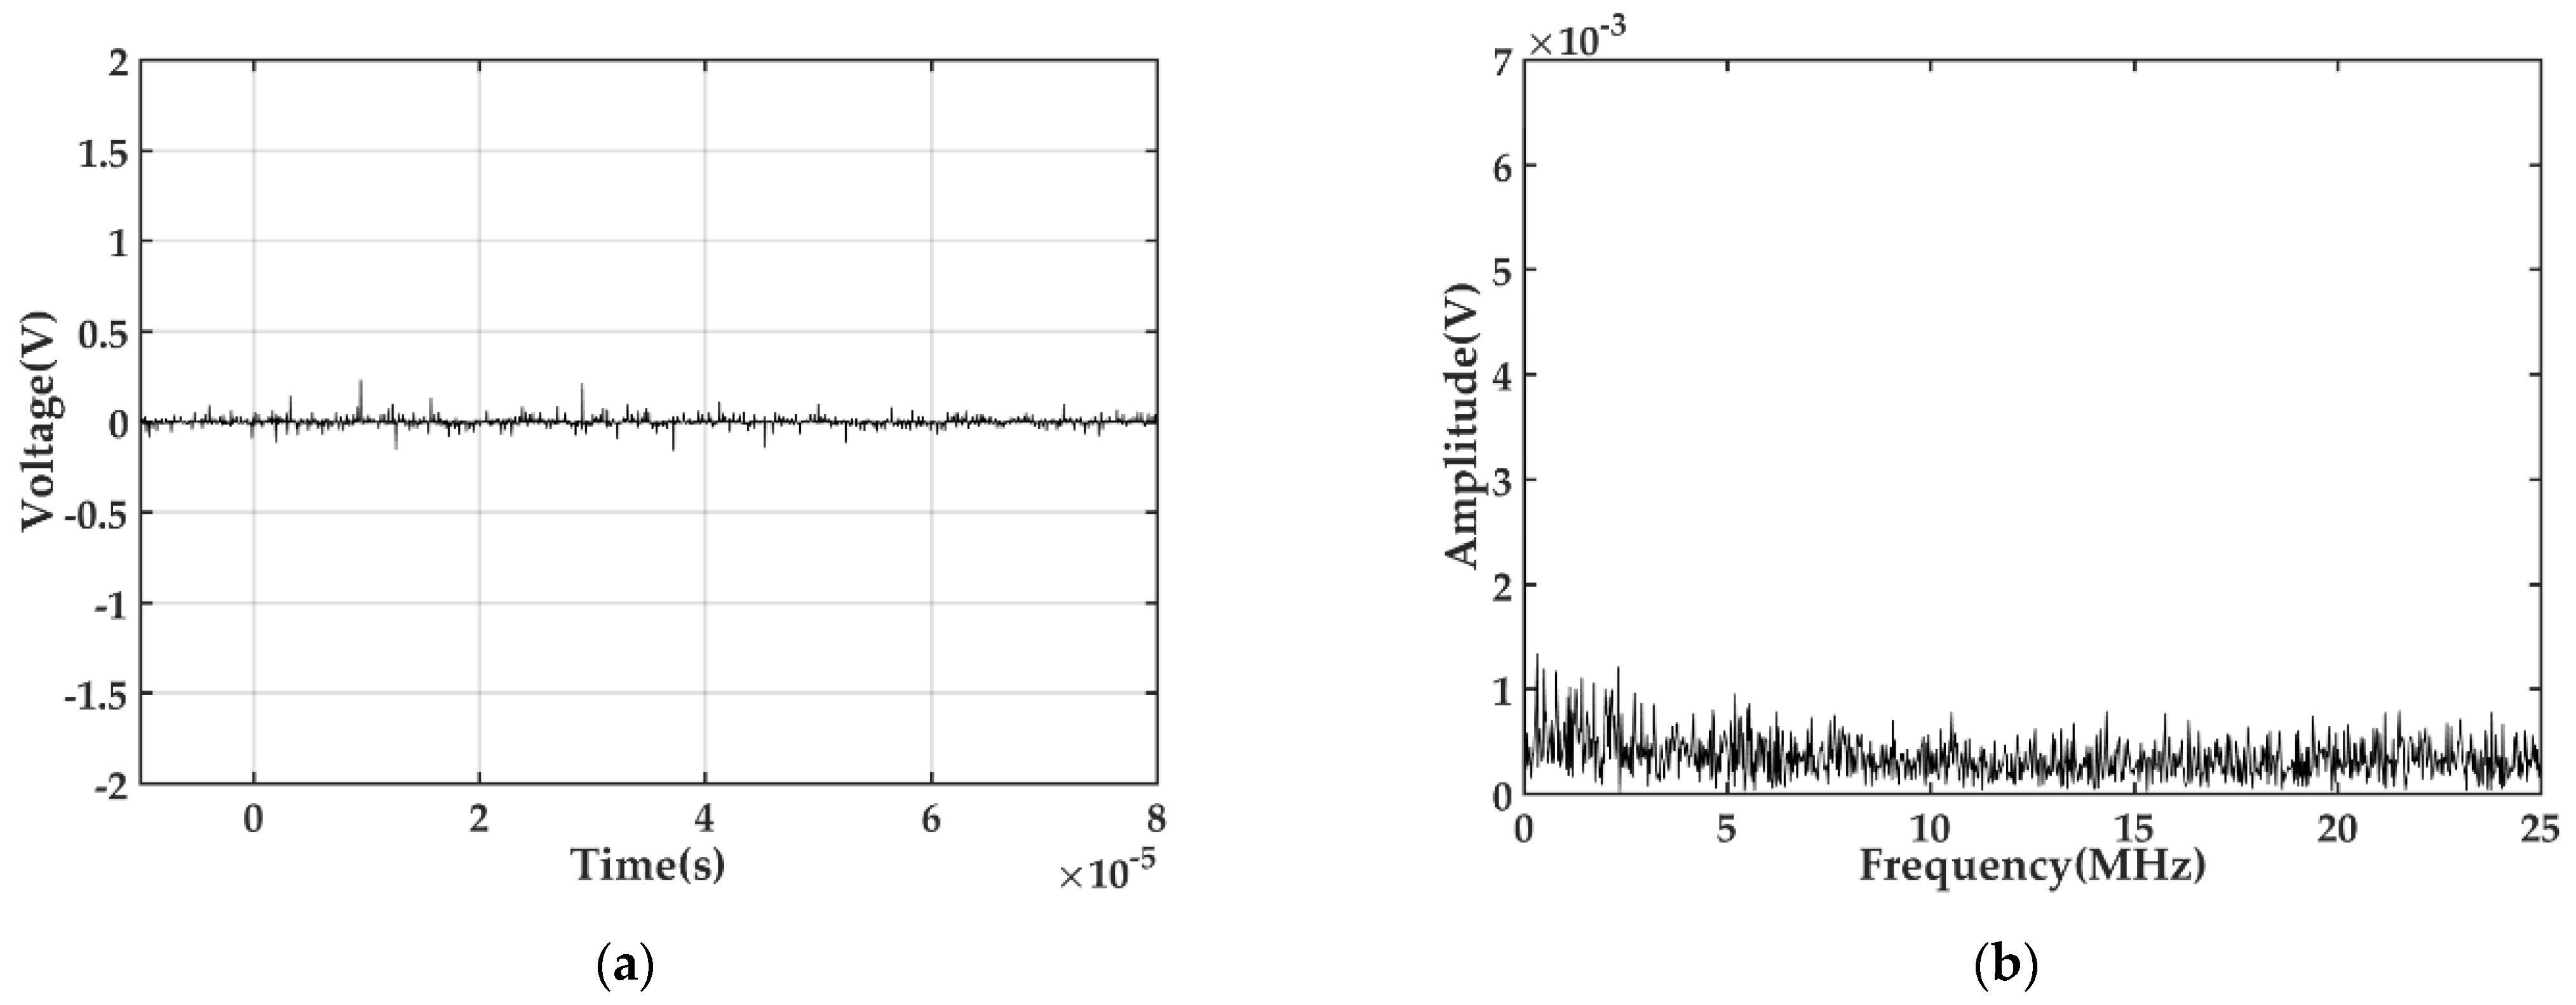
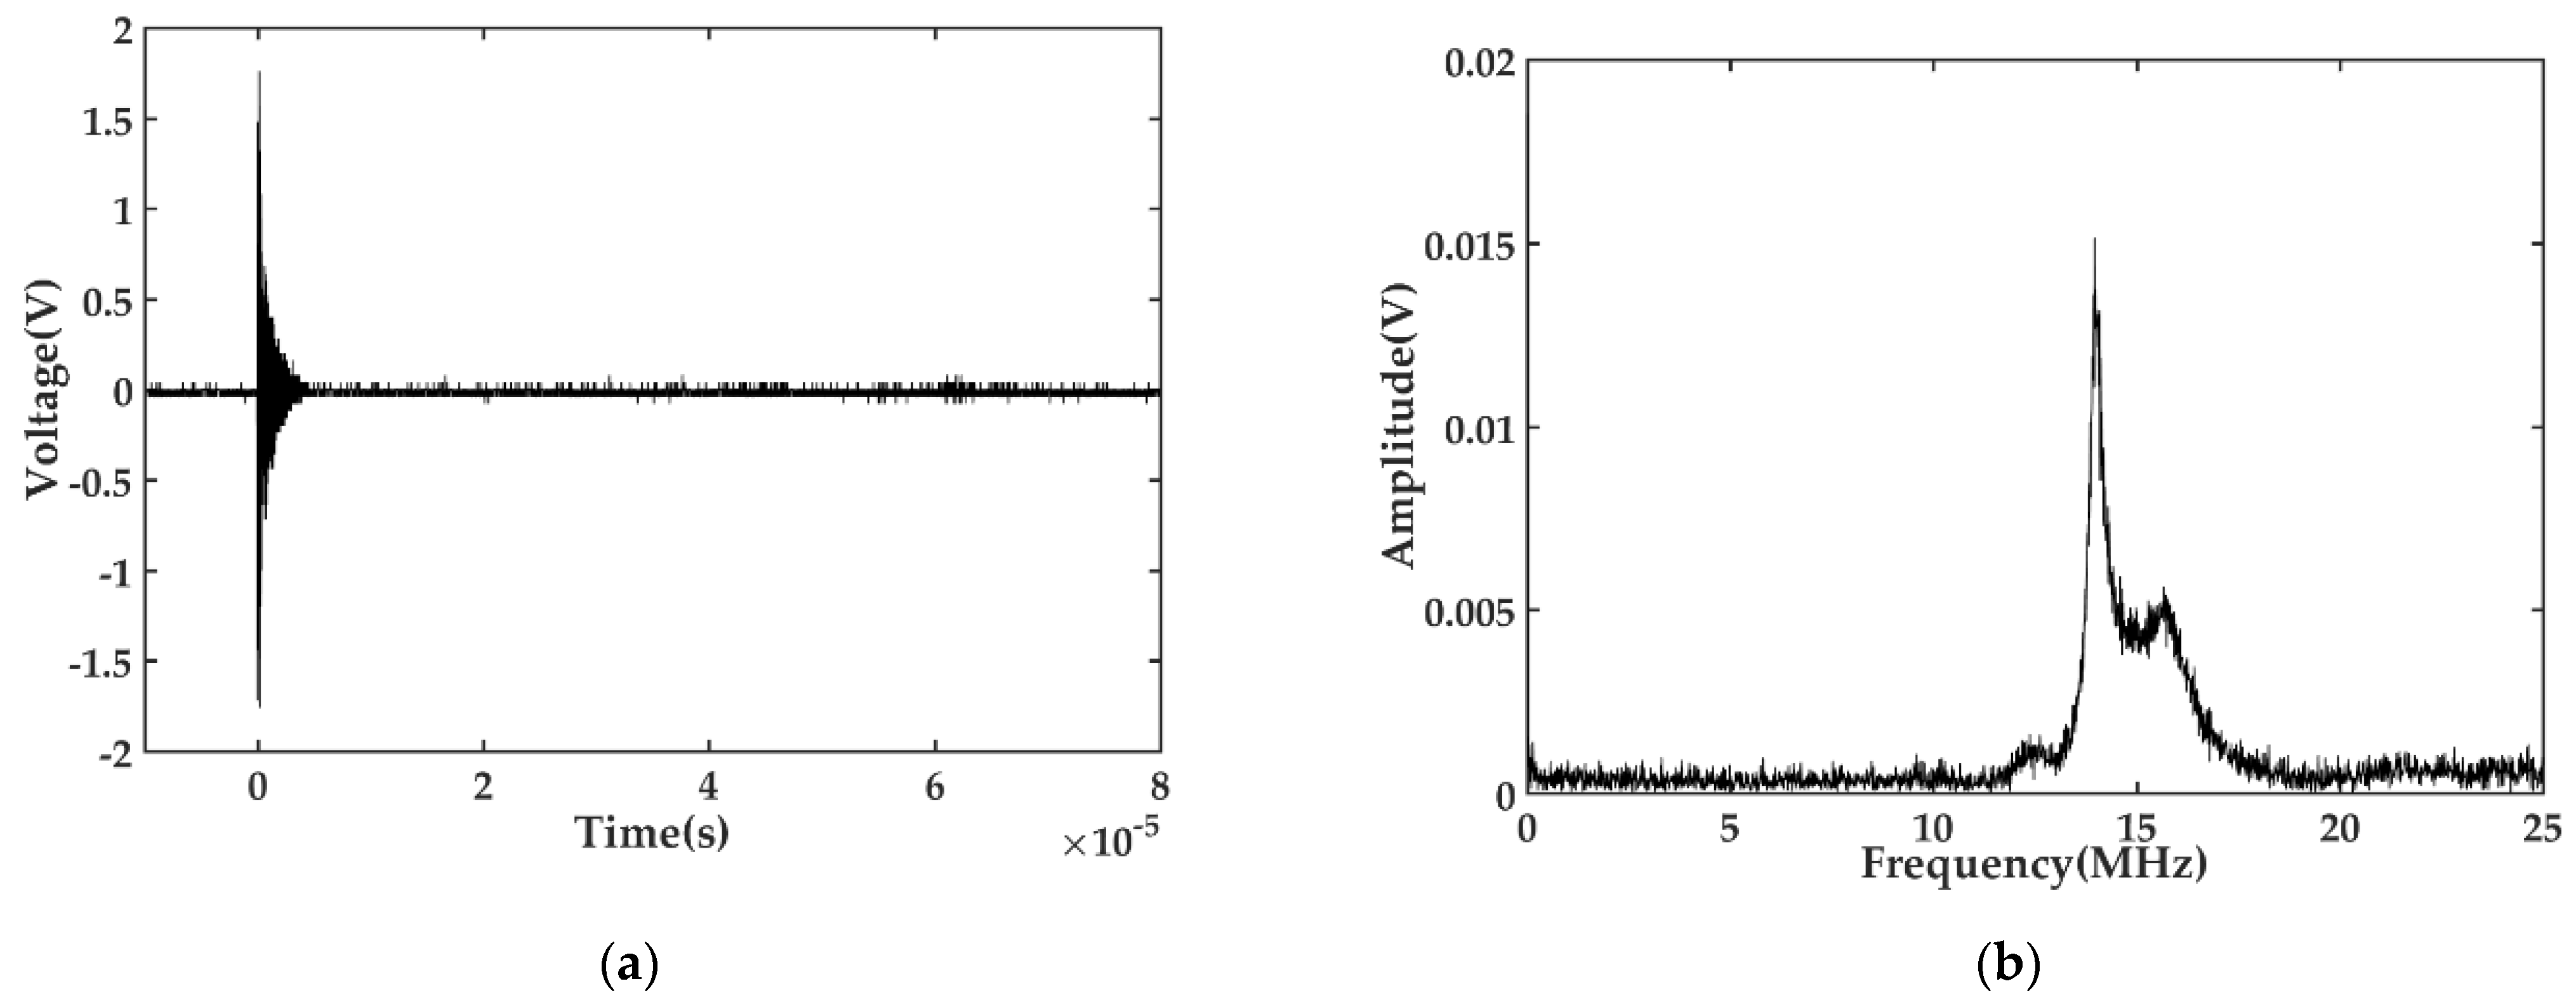
3.1. Radiation Signal Characteristic Analysis

The load is 100 Ω resistance, the current in the line is 2.2 A, the sampling rate of the oscilloscope is set to 50 MHz, and the electromagnetic radiation of 5 fault arcs are collected. In the laboratory environment, the ambient noise without arc is collected, and the maximum pulse amplitude is 80 mV, which is far less than that when the arc occurs. Therefore, the radiation signal can be used as the basis for detecting the arc fault. Figure 3 shows the time-domain waveform collected at one time. It can be seen from the figure that when an arc fault occurs, the antenna receives multiple groups of pulse signals and amplifies one group of pulse signals. It can be seen that the radiation signal fluctuates within 5 μs.
The spectrum of the radiated signal is obtained by FFT transformation of the five groups of signals respectively, as shown in Figure 4. It can be seen from the figure that the amplitude of the radiation signal is different, but the characteristic frequency of the signal is always in the range of 13.96–14.02 MHz.

3.2. Factors Affecting Radiation Characteristics

Due to the complexity of low-voltage AC power consumption, in order to explore the characteristics of electromagnetic radiation of the fault arc under different power consumption conditions and verify the effectiveness of electromagnetic radiation in series arc-fault detection, the electromagnetic radiation under various power consumption environments are analyzed in this paper.

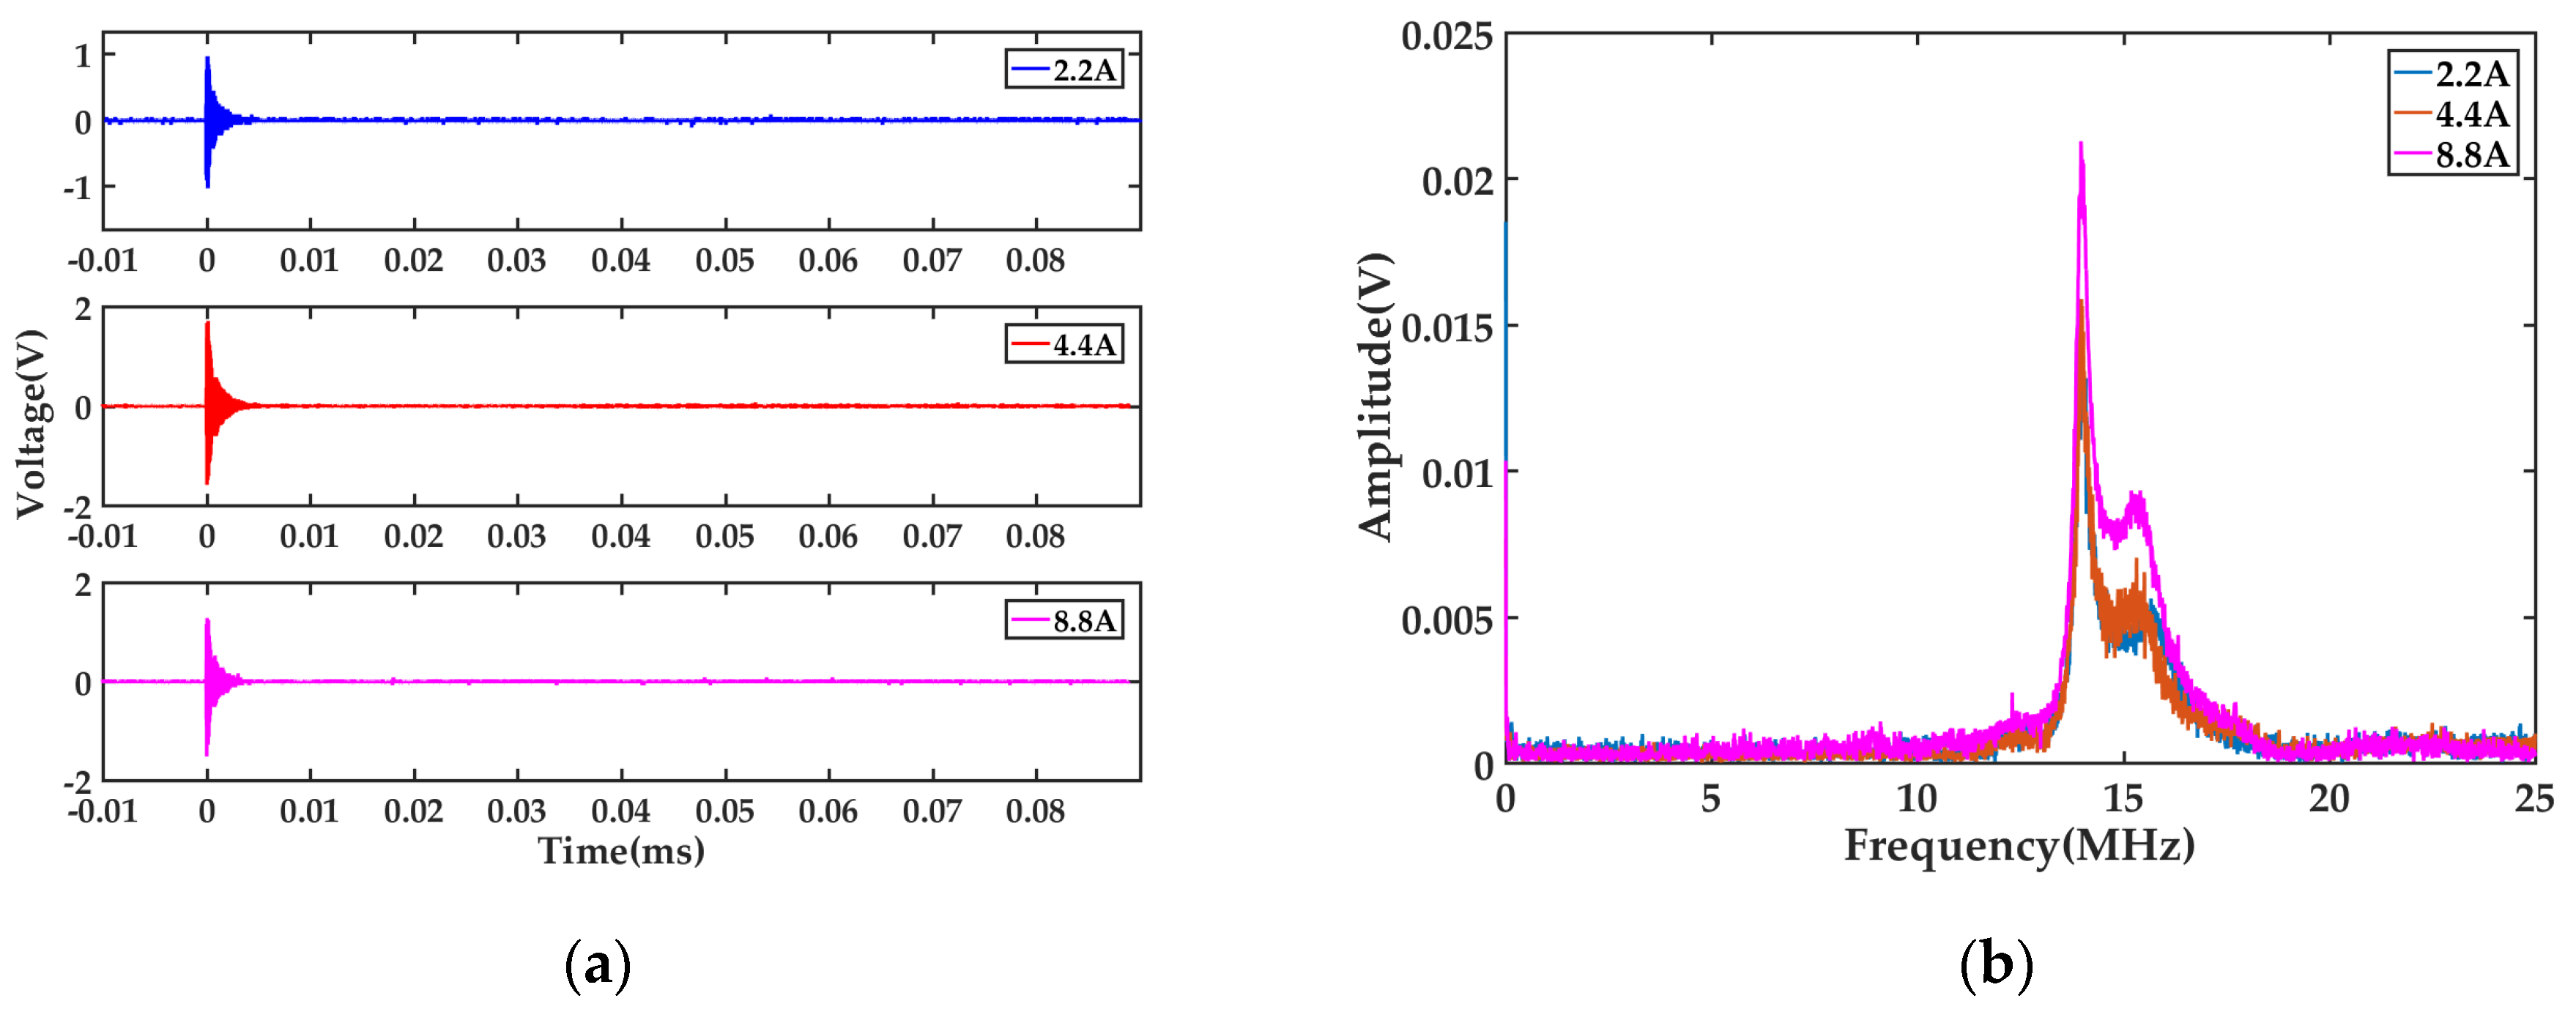
3.2.1. The Influence of Current

In order to explore the influence of current value on the amplitude and characteristic frequency of the arc radiation signal, experiments were carried out at 2.2 A, 4.4 A and 8.8 A, respectively. Figure 5a is the time domain waveform of arc electromagnetic radiation signal measured under three kinds of currents. It can be seen from the figure that the arc electromagnetic radiation signal amplitude is different under different current, but the oscillation time is 4–5 μs. Figure 5b is the electromagnetic radiation signal spectrum obtained by FFT transform of the time domain waveform in Figure 5a. It can be seen from the figure that the arc electromagnetic radiation signal has obvious frequency characteristics under three kinds of current.
To prove the repeatability of the experiment, five experiments were carried out under three currents. The amplitude and characteristic frequency of the signal measured by each experiment are shown in Table 1.
It can be seen from the experimental results that the amplitude of the radiation signal is different under different currents, but due to the randomness of discharge, there is no obvious correlation between the amplitude of electromagnetic radiation signal of AC series fault arc and the current size. However, the frequency distributions of the signals generated at different current values are similar, and the main frequencies are concentrated in the range of 13.96–14.04 MHz.

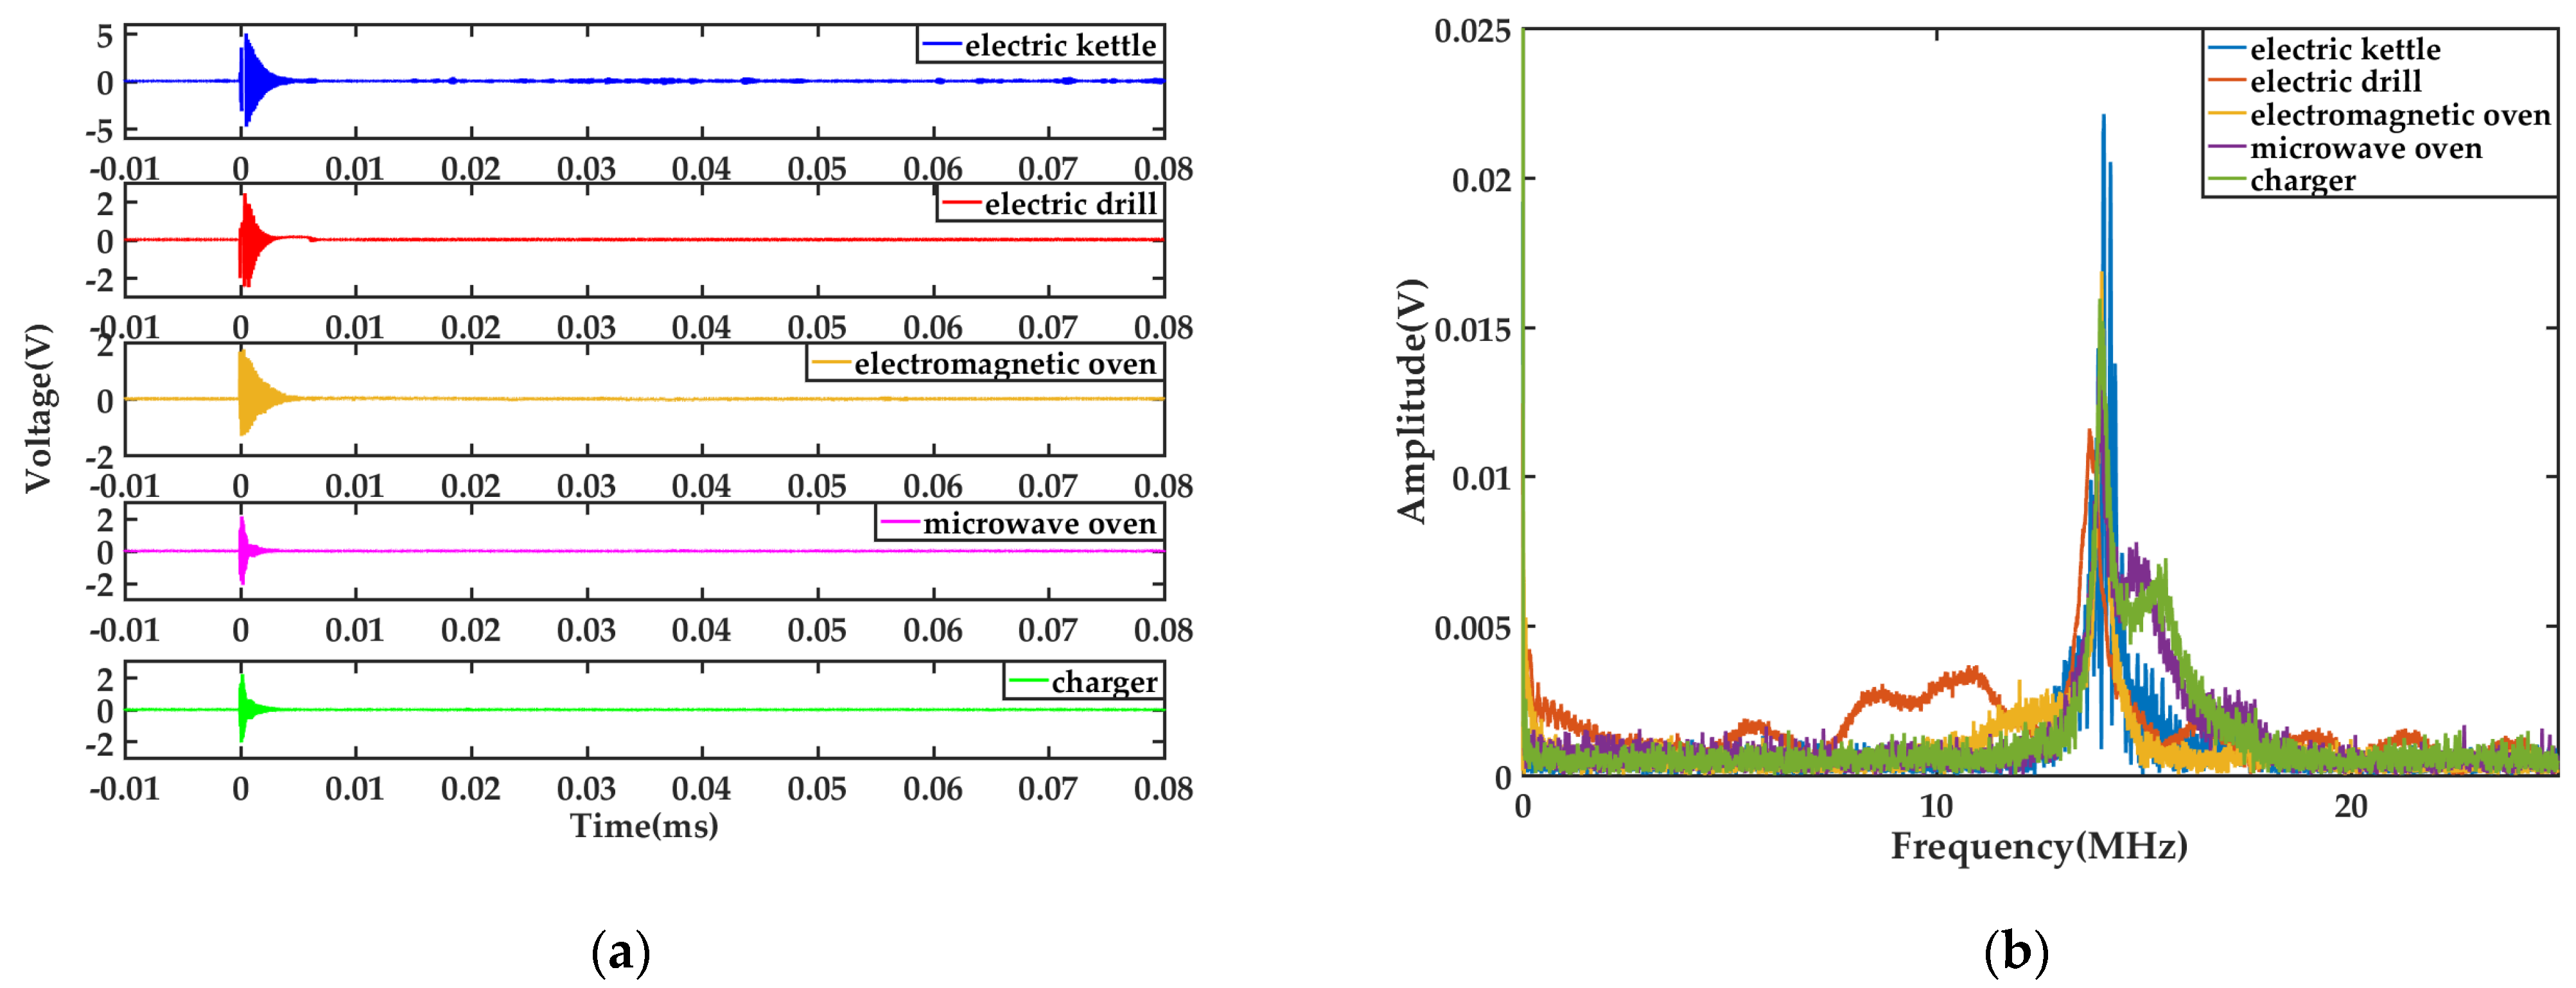
3.2.2. The Influence of Load Type

Low-voltage AC lines are generally for family users, and the load situation is very complex. Five different types shown in Table 2 are used to simulate the actual load in the family, to verify the ability of the radiation signal to distinguish the fault arc in the actual low voltage line.
Figure 6 is the time-domain waveform of the arc electromagnetic radiation signal measured under five different loads and the spectrum after FFT transformation. Table 3 shows five groups of experiments under different loads, and the electromagnetic radiation signal amplitude and characteristic frequency of each group of experiments are obtained.
It can be seen that under the five tested loads, the amplitude of electromagnetic radiation signal received by the antenna is slightly different, but there is no clear change rule. The characteristic frequency span of electromagnetic radiation signal is larger than that of different current conditions (13.65–14.07 MHz), but still changes around 14 MHz.

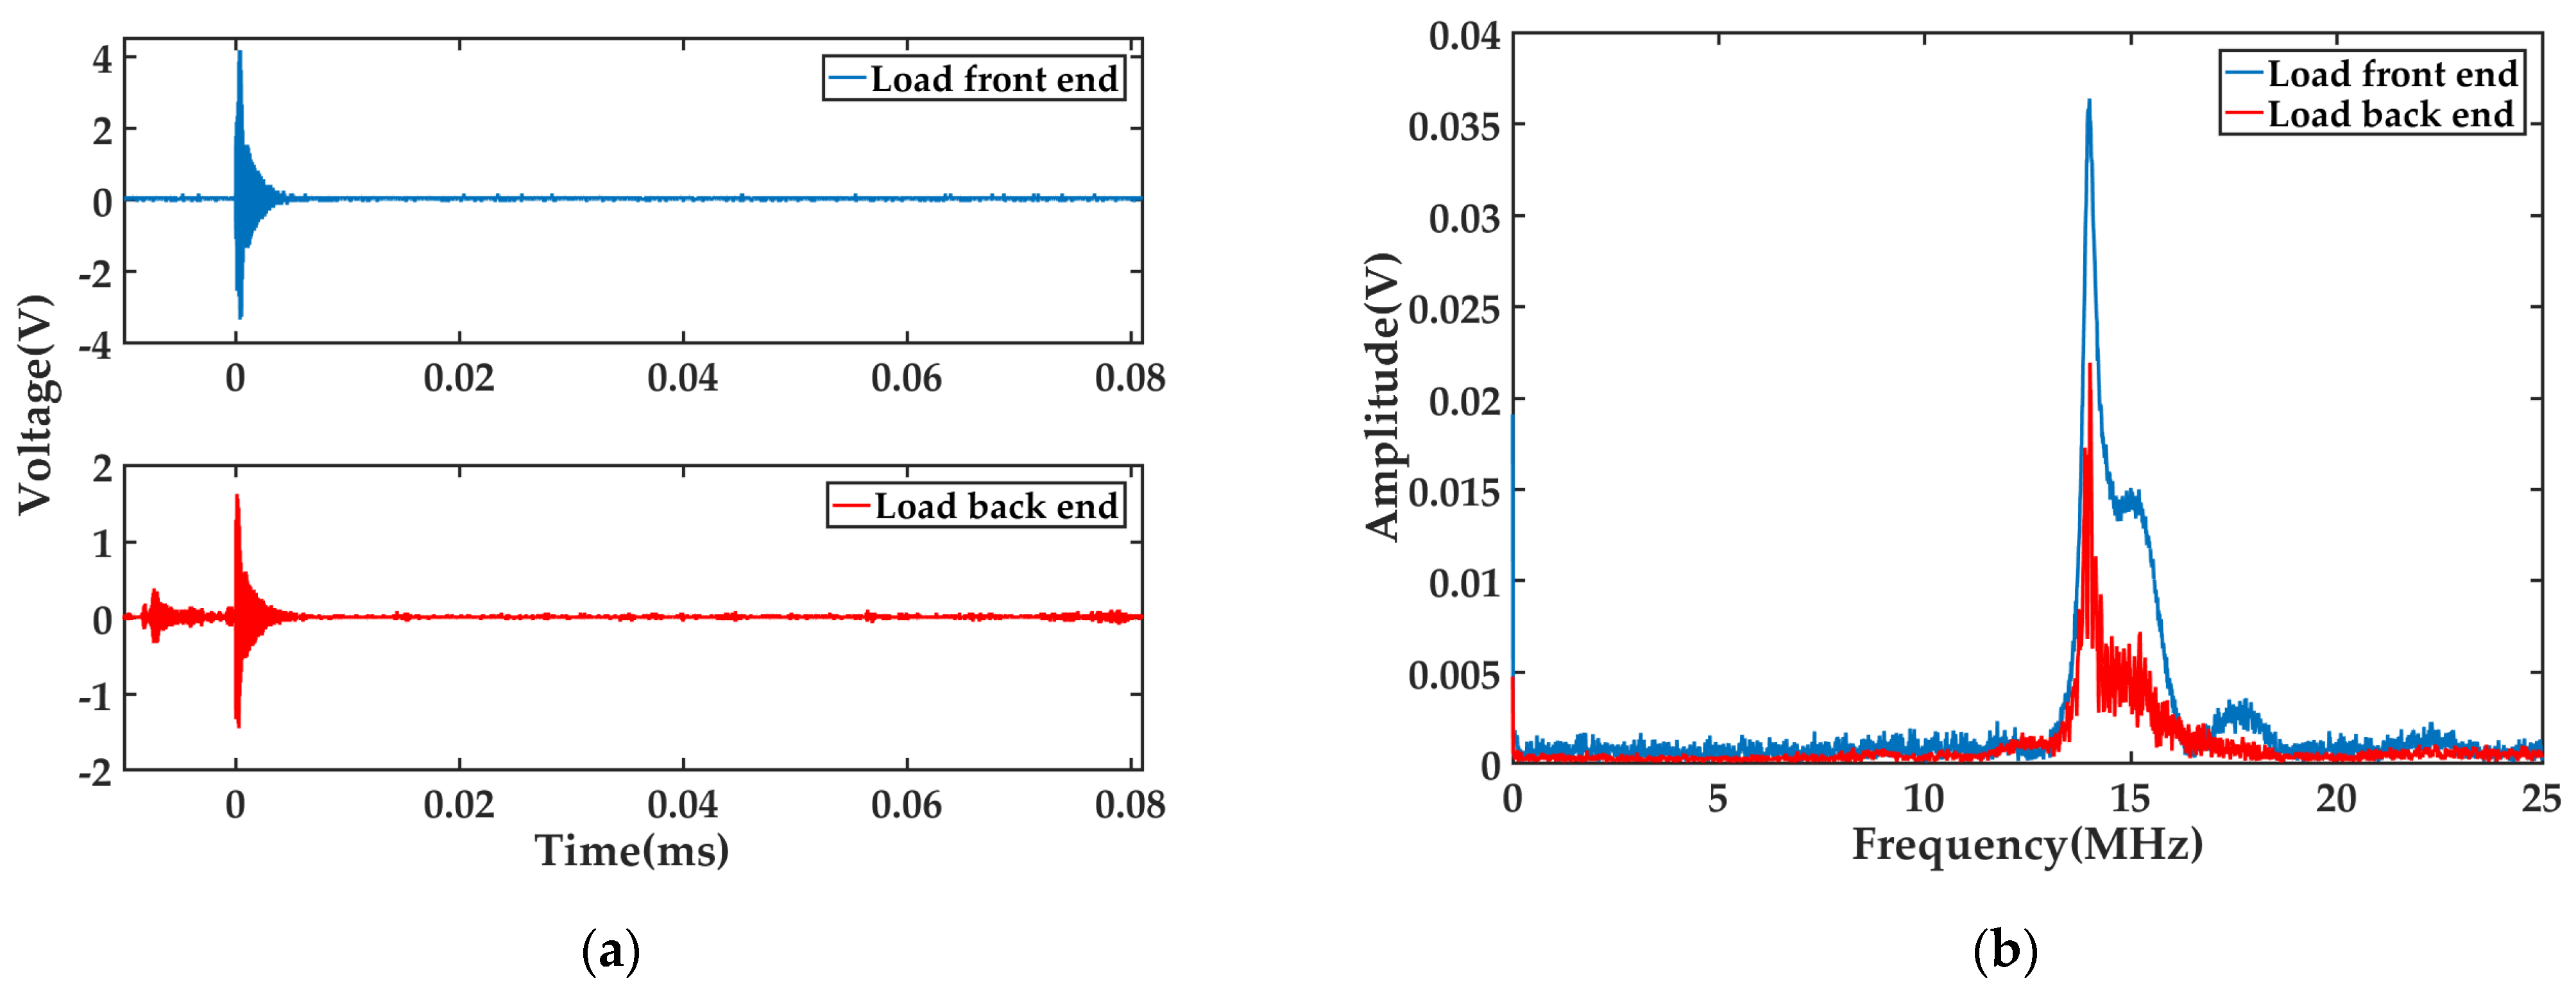
3.2.3. The Influence of Arc Position

Due to the uncertainty of the arc position in the actual situation, the radiation signal received by the antenna is analyzed considering the two cases of fault arc before and after the load. Figure 7a is the time-domain waveform comparison in two cases, and Figure 7b is the frequency spectrum obtained after the FFT transform of the radiation signal in two cases. In the same two cases, five groups of experiments were carried out, and the signal amplitude and characteristic frequency of each group were obtained as shown in Table 4.
It can be seen from the table that the waveform amplitudes of the signals in the two cases are quite different, though this is caused by the randomness of discharge, but the characteristic frequency of the signal is still concentrated at about 14 MHz.

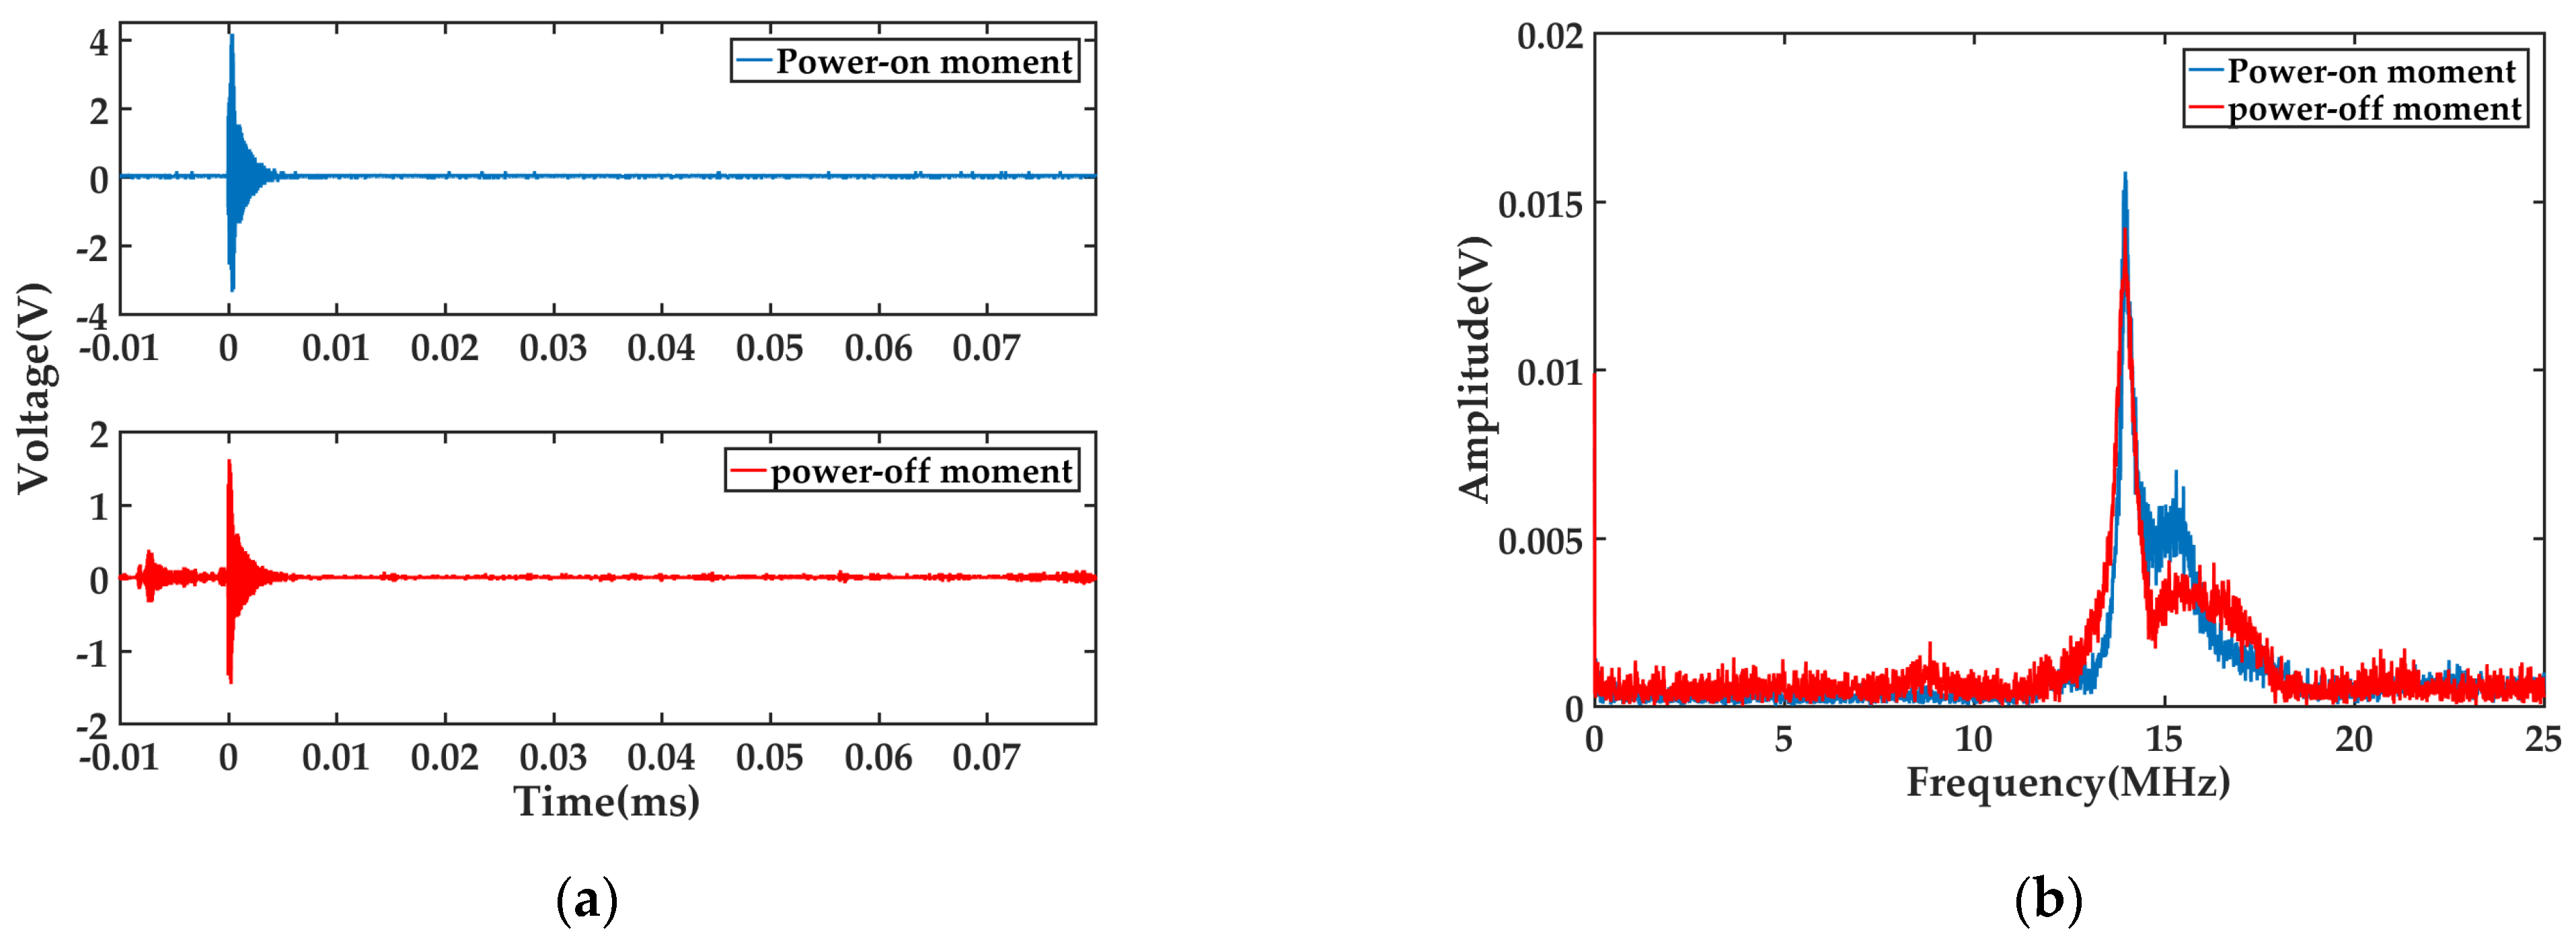
3.2.4. The Influence of Discharge Moment

In practice, part of the arc is generated at the moment of power supply, and the arc fault is an intermittent fault caused by joint loosening or cable breakdown under normal power supply. Therefore, in order to study whether these two arc faults can be effectively identified through electromagnetic radiation signals, We simulated the arc fault generated in the instant of power supply and the arc fault generated in the normal working contact disconnection in a laboratory environment. Figure 8a shows the time-domain waveforms at different arc moments, and Figure 8b shows the frequency spectrum obtained by FFT transformation of the time-domain waveforms of the radiation signals at different arc moments. Table 5 shows the comparison of electromagnetic radiation signal amplitude and characteristic frequency of five groups of data.
According to the data given in Table 5, it can be seen that the amplitude of the electromagnetic radiation signal of the arc fault generated at the electrified time is relatively larger than that of the arc fault generated in normal work. However, in terms of characteristic frequency, the characteristic frequency of electromagnetic radiation signal remains at about 14 MHz when the arc fault is generated in two cases.
It can be seen from the experimental results that under the influence of the conditions set in this paper, the amplitude of the electromagnetic radiation signal of the arc fault will be affected to some extent, and there is no obvious rule to speak of. From Equation (6), the amplitude of electromagnetic radiation signal is only affected by the load resistance, electrode resistance, and contact resistance, which is not consistent with the actual results. This is because the AC arc and DC arc is different, and the instantaneous voltage value is uncertain and random when the arc occurs. As for metal electrodes, the inorganic film is easily formed on the electrode surface. As a part of the contact resistance, the film resistance also affects the change rate of the current, and the temperature is the key factor for the growth of the film. A large amount of light and heat will be released during the arc process. In addition, the roughness of the electrode surface will also randomly affect the contact resistance. Therefore, under the influence of various uncertain factors, the amplitude of electromagnetic radiation signal has strong randomness, and does not increase monotonously with the increase of current.
The characteristic frequency of the electromagnetic radiation signal of the fault arc is not greatly affected under the conditions set in this paper. According to the Formula (10), the characteristic frequency of the radiation signal is affected by the arc resistivity and the air dielectric constant. During the experiment, the medium does not change so that the air dielectric constant almost does not change. At the same time, the electrode that produces the arc is not changed, and the arc resistivity will not change greatly, which is consistent with the results in Formula (10).

3.3. Radiation Characteristics of Switch Operation

The arc in the line is divided into operation arc and fault arc, also known as “good arc” and “bad arc” [31]. The good arc is generally generated by the normal operation of the switch or the normal operation of the electrical appliance, and the bad arc is generated due to the poor contact or insulation damage in the line. Distinguishing between operating arc and fault arc is also a major difficulty in arc detection. In order to prevent the electromagnetic radiation signal generated when the normal operation switch will affect the judgment of the fault arc, this paper analyzes the difference between the electromagnetic radiation signal received when the switch is closed and opened and the radiation signal received when the fault arc occurs in the circuit.
The operating switch is Schneider Electric A9 air switch. When the switch is disconnected and closed, experiments are carried out for two situations. The electromagnetic radiation time domain waveform is shown in Figure 9. It can be seen from the figure that the oscillation duration of the received electromagnetic radiation signal is in the range of 1–2 μs when switching. The oscillation duration is only for half of the fault arc, and many groups of experiments have been carried out in the following. Therefore, the oscillation duration can be used as a basis to distinguish between operating arc and fault arc. In addition, these two cases have strong randomness in signal amplitude and no obvious law.
Figure 10 shows the frequency domain waveform after Fourier transform of electromagnetic radiation signal generated when switching. It can be seen that there is an obvious frequency component in the frequency spectrum of both the closed switch and the open switch, which is about 9.35 MHz, and its frequency is significantly smaller than the characteristic frequency of the fault arc. The characteristic frequency can be used to distinguish the operating arc and the fault arc.

3.4. Comparative Experiment

Since the load situation in the actual line is complex and changeable, and the fault arc has strong randomness, in order to verify the advantages of the proposed method, this paper sets a typical application scenario, and compares the proposed method with the most commonly used current-based fault arc detection method. Because there are many arc-fault detection methods based on current, it is limited to choose one of them for correct rate experiment. This paper will display the time domain and frequency domain waveform of current and electromagnetic radiation signal, and make the most intuitive comparison. The experimental circuit is shown in Figure 11.
On the basis of Figure 2, the current probe is added to the experimental circuit to measure the current waveform in the circuit when the arc fault occurs. The current probe model used is Tektronix TCP0030A, its range is 5 A/30 A adjustable. The bandwidth is DC-120 MHz. Under the various conditions set in the article, it is observed that the current waveforms of different loads are different when they are working normally, and there is no clear law of the current waveform in the line when the fault arc occurs, as well as in the frequency domain. However, the electromagnetic radiation signal has obvious frequency characteristics when the arc fault occurs, but not in normal work, which can accurately determine the occurrence of a fault arc. Figure 12 shows the time domain and frequency domain curves of the current when the charger works normally. Figure 13 shows the time domain and frequency domain curves of the current when the arc fault occurs when the resistance is connected to electric heater.
It can be clearly seen from the above figure that when the charger works normally, the current waveform in the line has similar time-domain characteristics to that when the arc occurs when the electric heater is connected, and there is no obvious difference in the frequency domain, so the fault arc cannot be distinguished by simple calculation. Figure 14 is the time-domain and frequency-domain curve of electromagnetic radiation signal when the charger works normally. Figure 15 is connected to the electric heater when the arc fault occurs when the electromagnetic radiation signal time domain, frequency domain curve.
It can be seen from the diagram that the electromagnetic radiation signal has obvious difference in time-domain and frequency-domain waveform when the line works normally and the arc fault occurs. Without complex algorithm, the fault arc can be accurately identified. Therefore, the method proposed in this paper has obvious advantages.

4. Conclusions

(1)
In this paper, a low voltage AC fault arc experimental platform is built to simulate the arc fault. The electromagnetic radiation signal of the arc is received by the self-made loop antenna, and the amplitude of the signal is far greater than that of the surrounding environmental interference signal, which can be used as the basis for fault-arc identification;
(2)
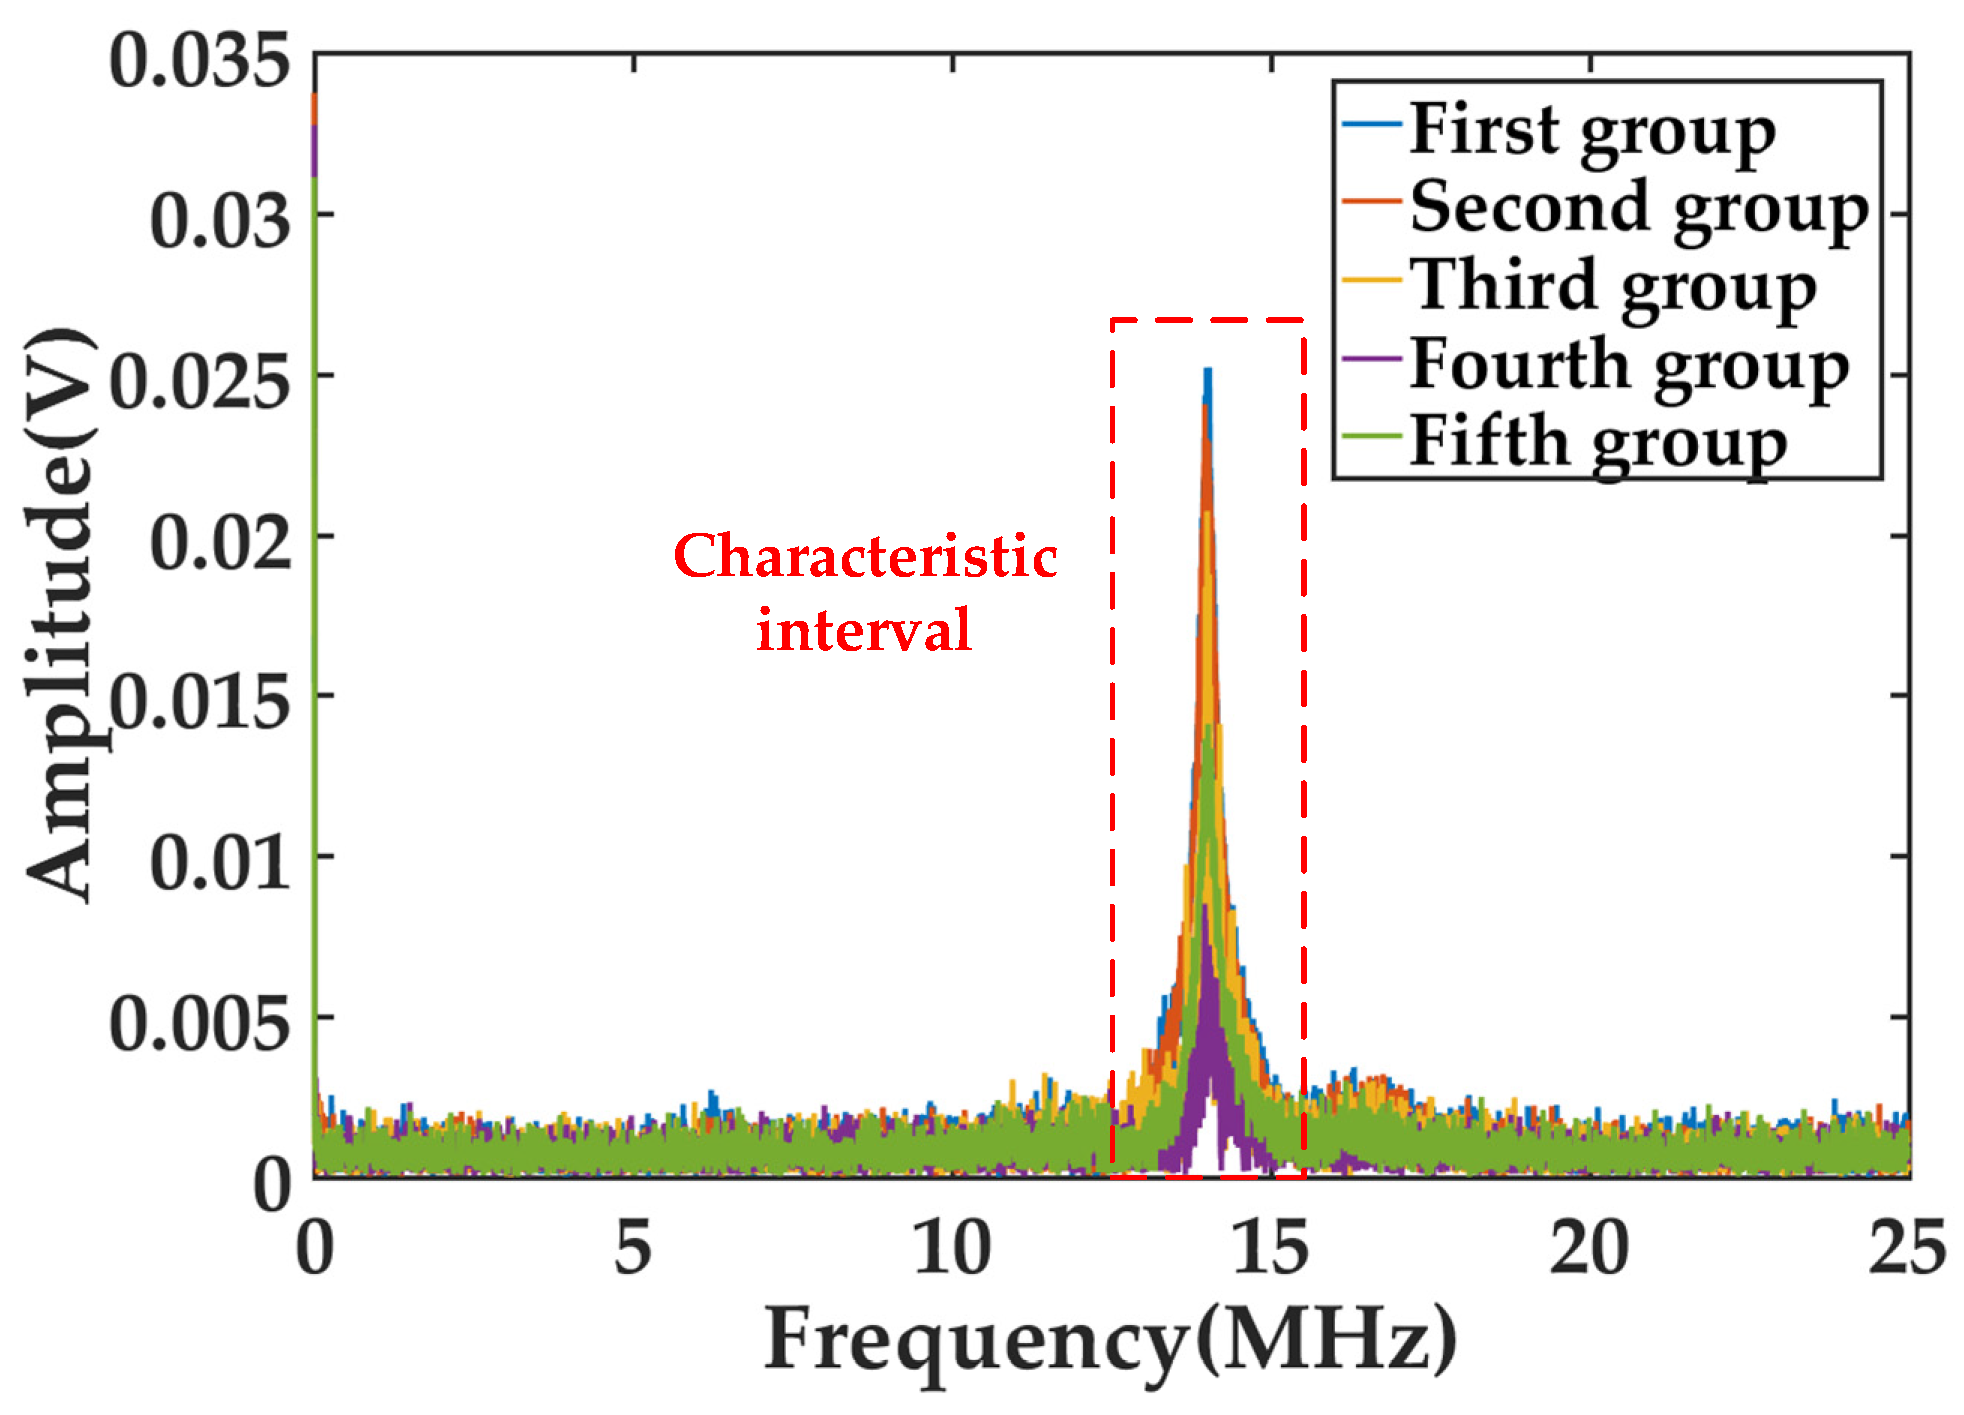
By analyzing the arc electromagnetic radiation signal at different currents, different loads, different discharge positions, and different arc moments, the amplitude of the signal does not have an obvious change pattern, but the characteristic frequency of the signal is distributed between 13–15 MHz. The next step will consider the influence of other factors such as discharge simulation device, temperature, and pressure to simulate a more realistic fault arc;
(3)
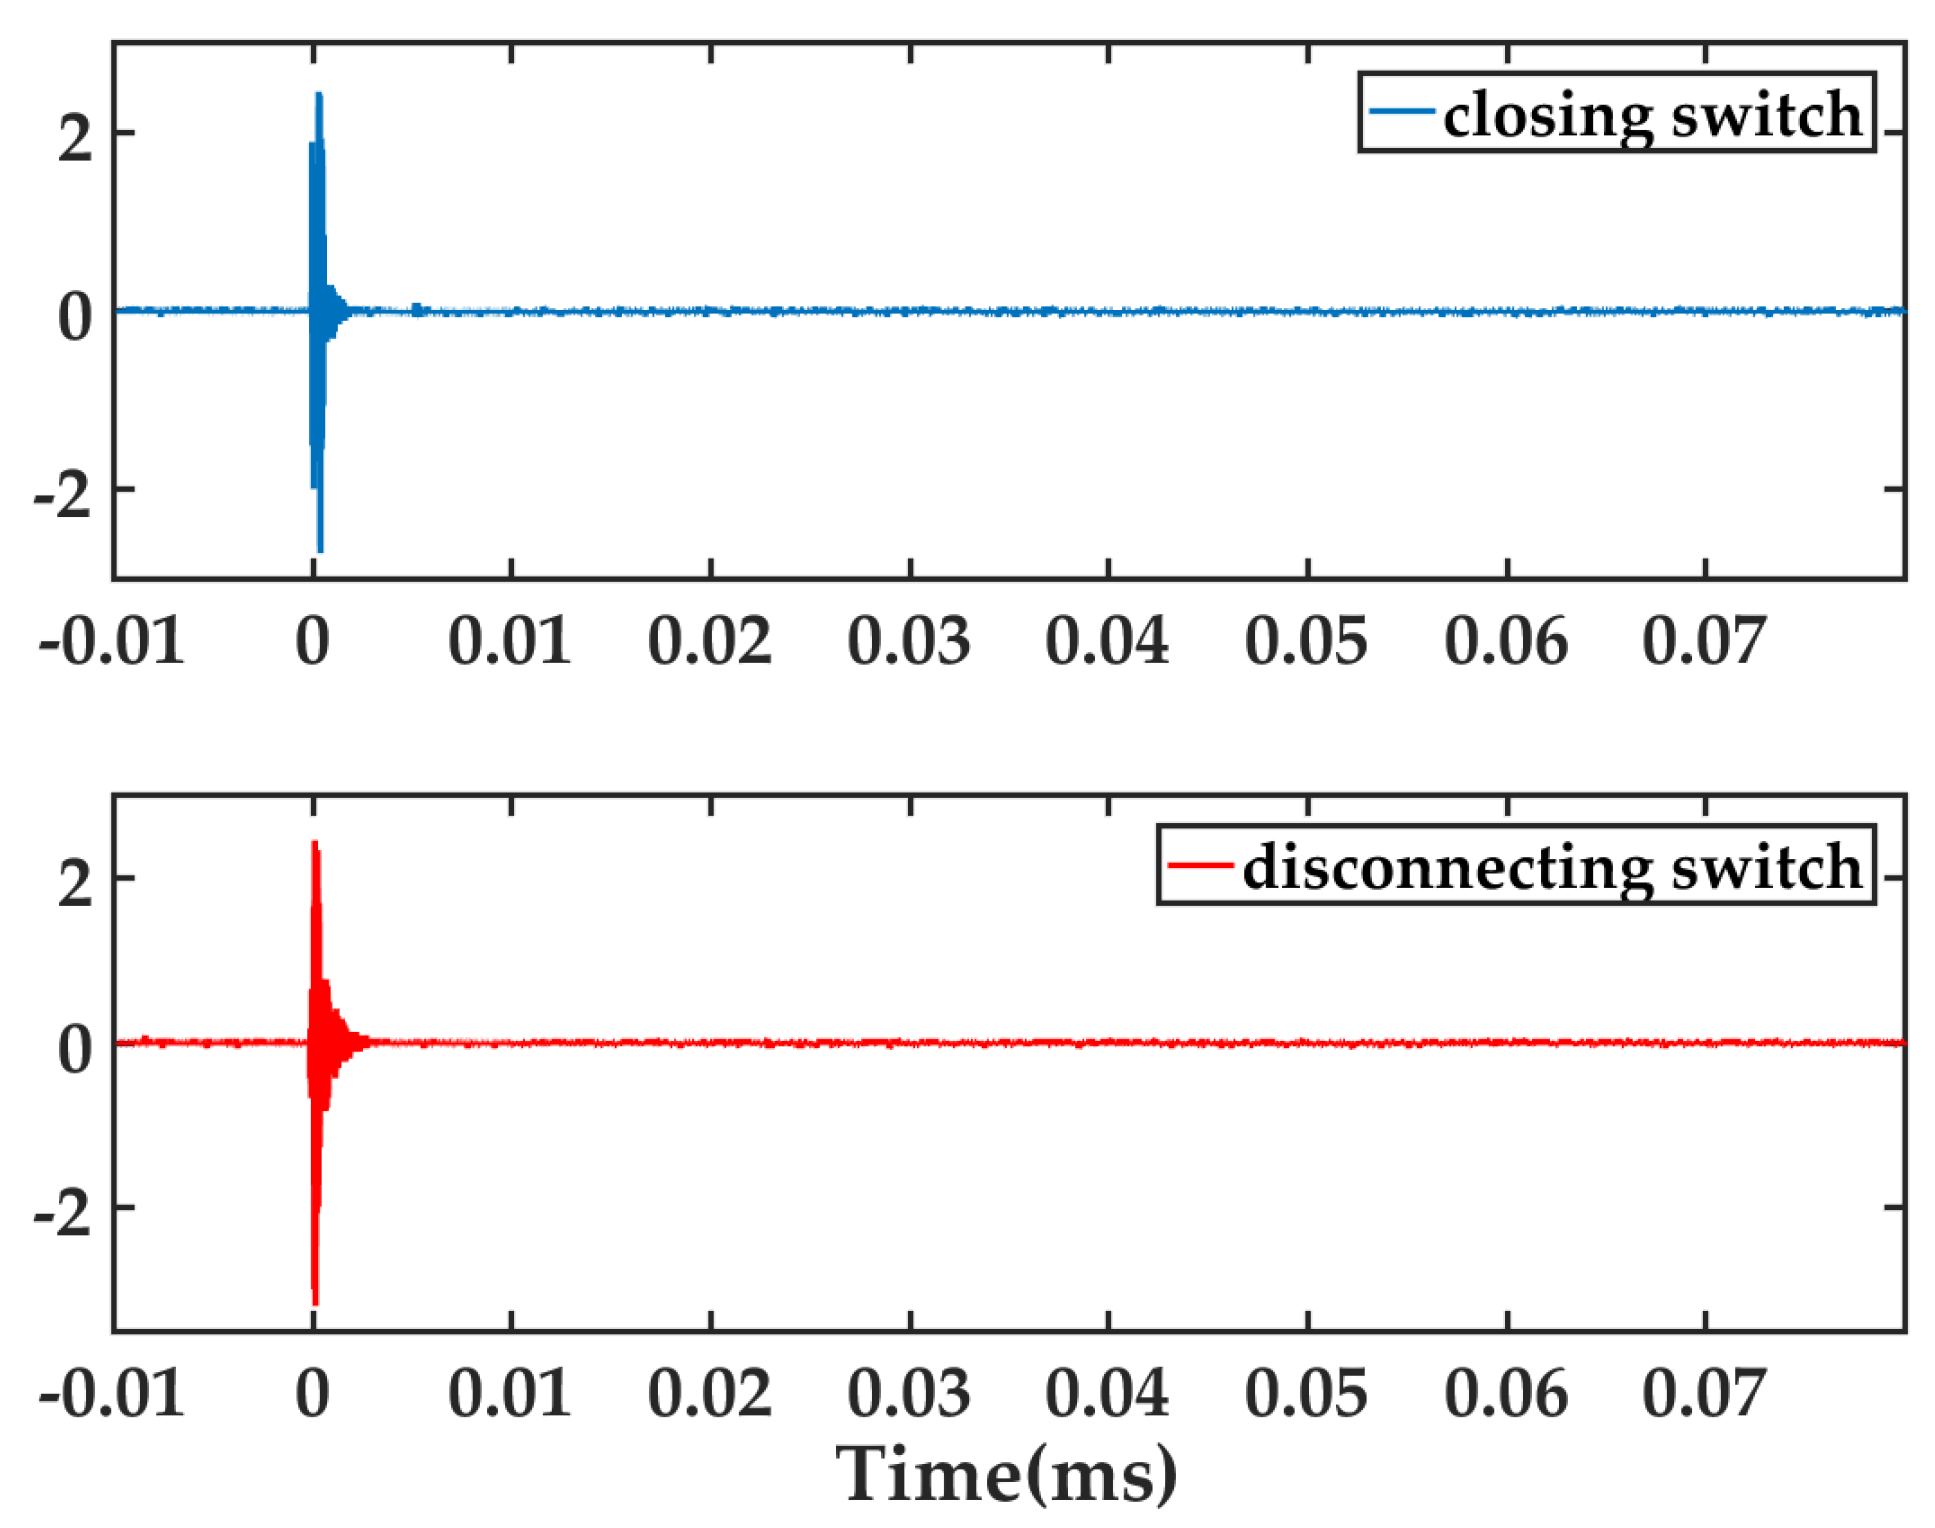
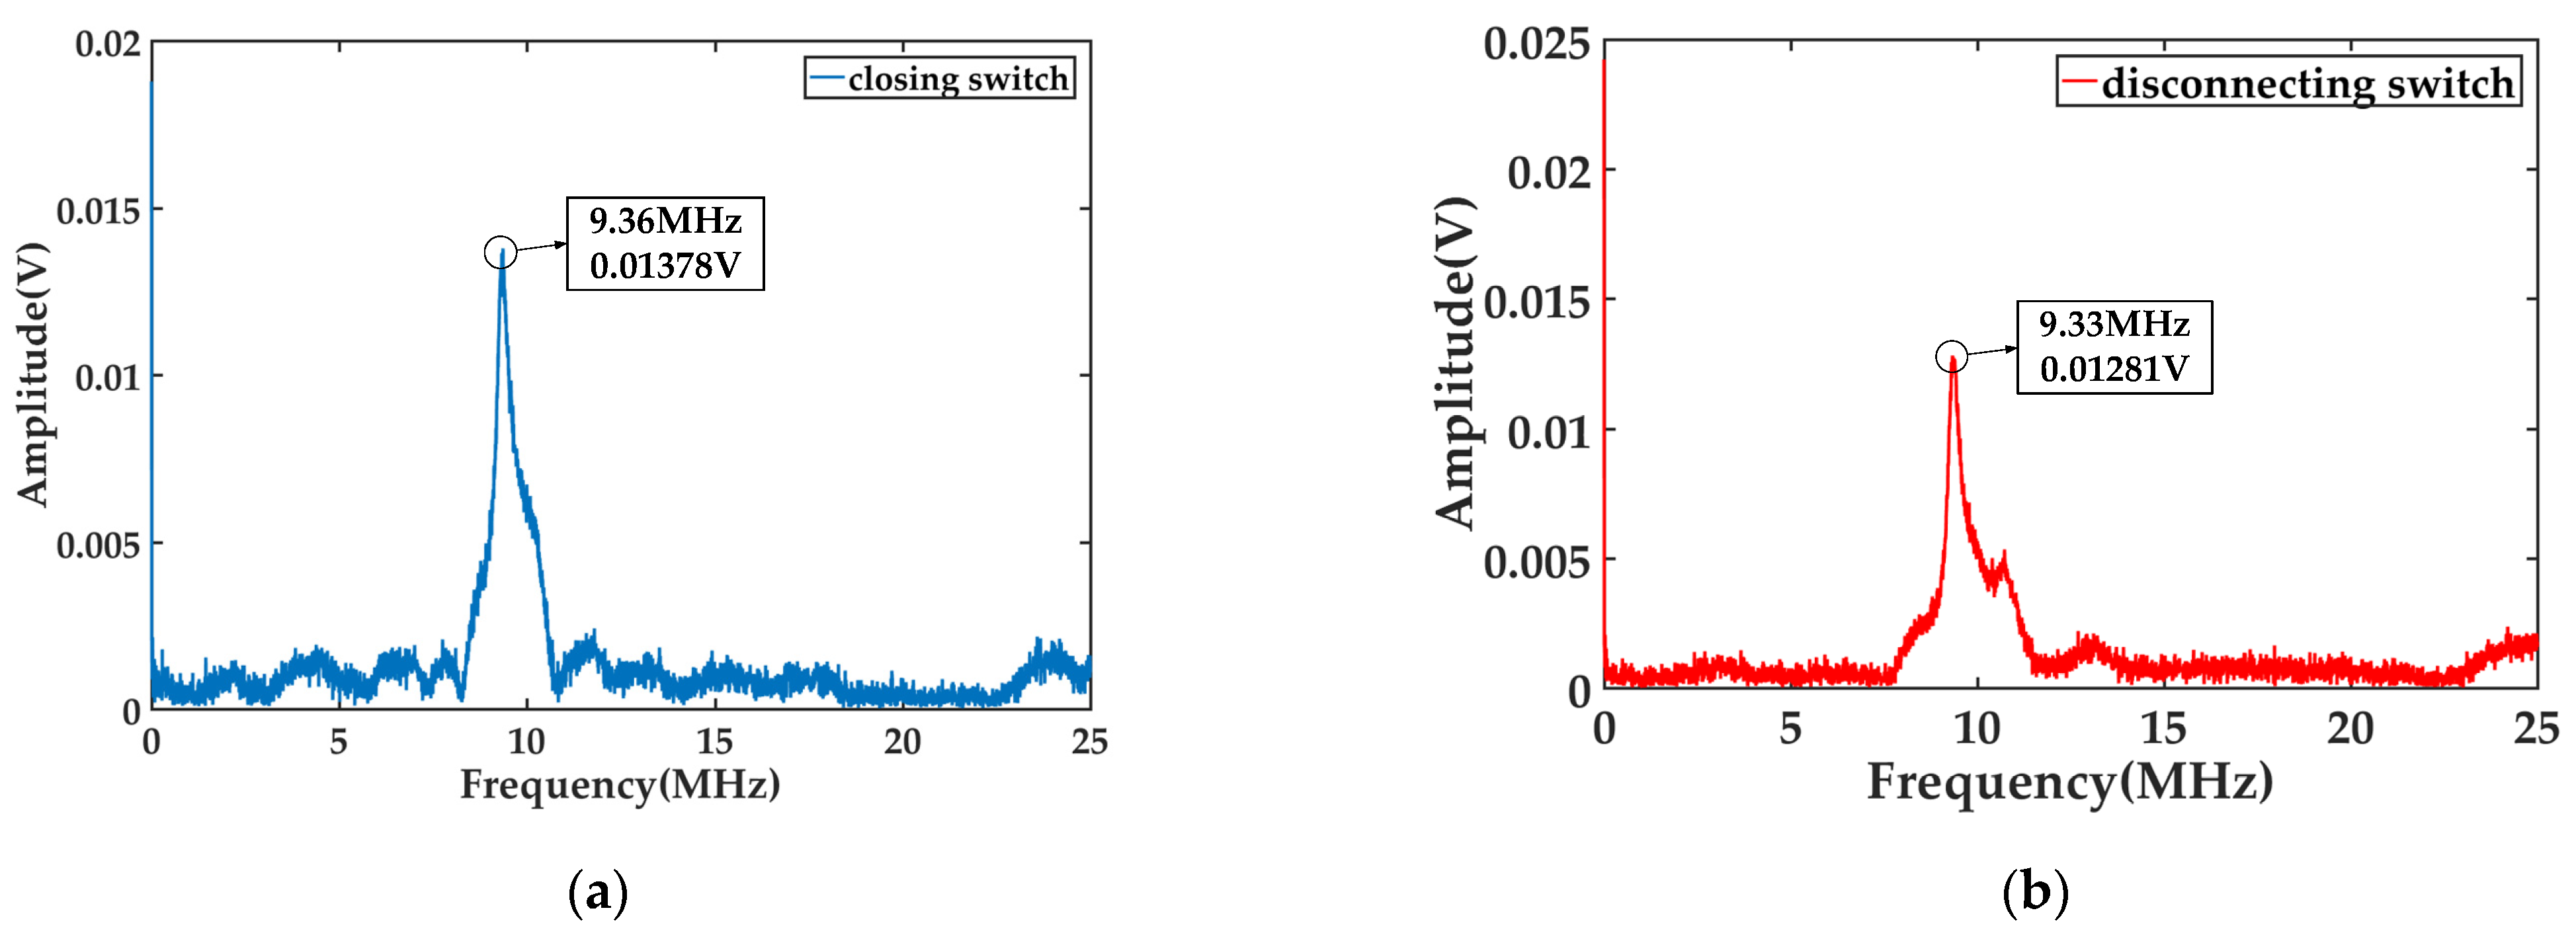
By comparing the electromagnetic radiation signals of the switching operation and fault arc, it is found that there is no obvious difference in amplitude between the switching operation electromagnetic radiation signal and the fault arc electromagnetic radiation signal, but the oscillation time is only half of the oscillation time when the arc occurs. Regarding frequency, the electromagnetic radiation signal characteristic frequency generated by the switch is about 9.35 MHz, which is significantly less than the fault arc characteristic frequency of 14 MHz. Therefore, the operating arc and fault arc can be distinguished by oscillation time and characteristic frequency of electromagnetic radiation signal;
(4)
Through the analysis of this paper, a fault-arc detection method based on electromagnetic radiation characteristics is proposed. This method does not need to consider the influence of current, nonlinear load, and other factors in the line, and can accurately distinguish the operating arc versus the fault arc. However, the feasibility of this method to detect a low-voltage AC fault arc is only verified. The next step will summarize the method and propose a complete fault-arc detection algorithm;
(5)
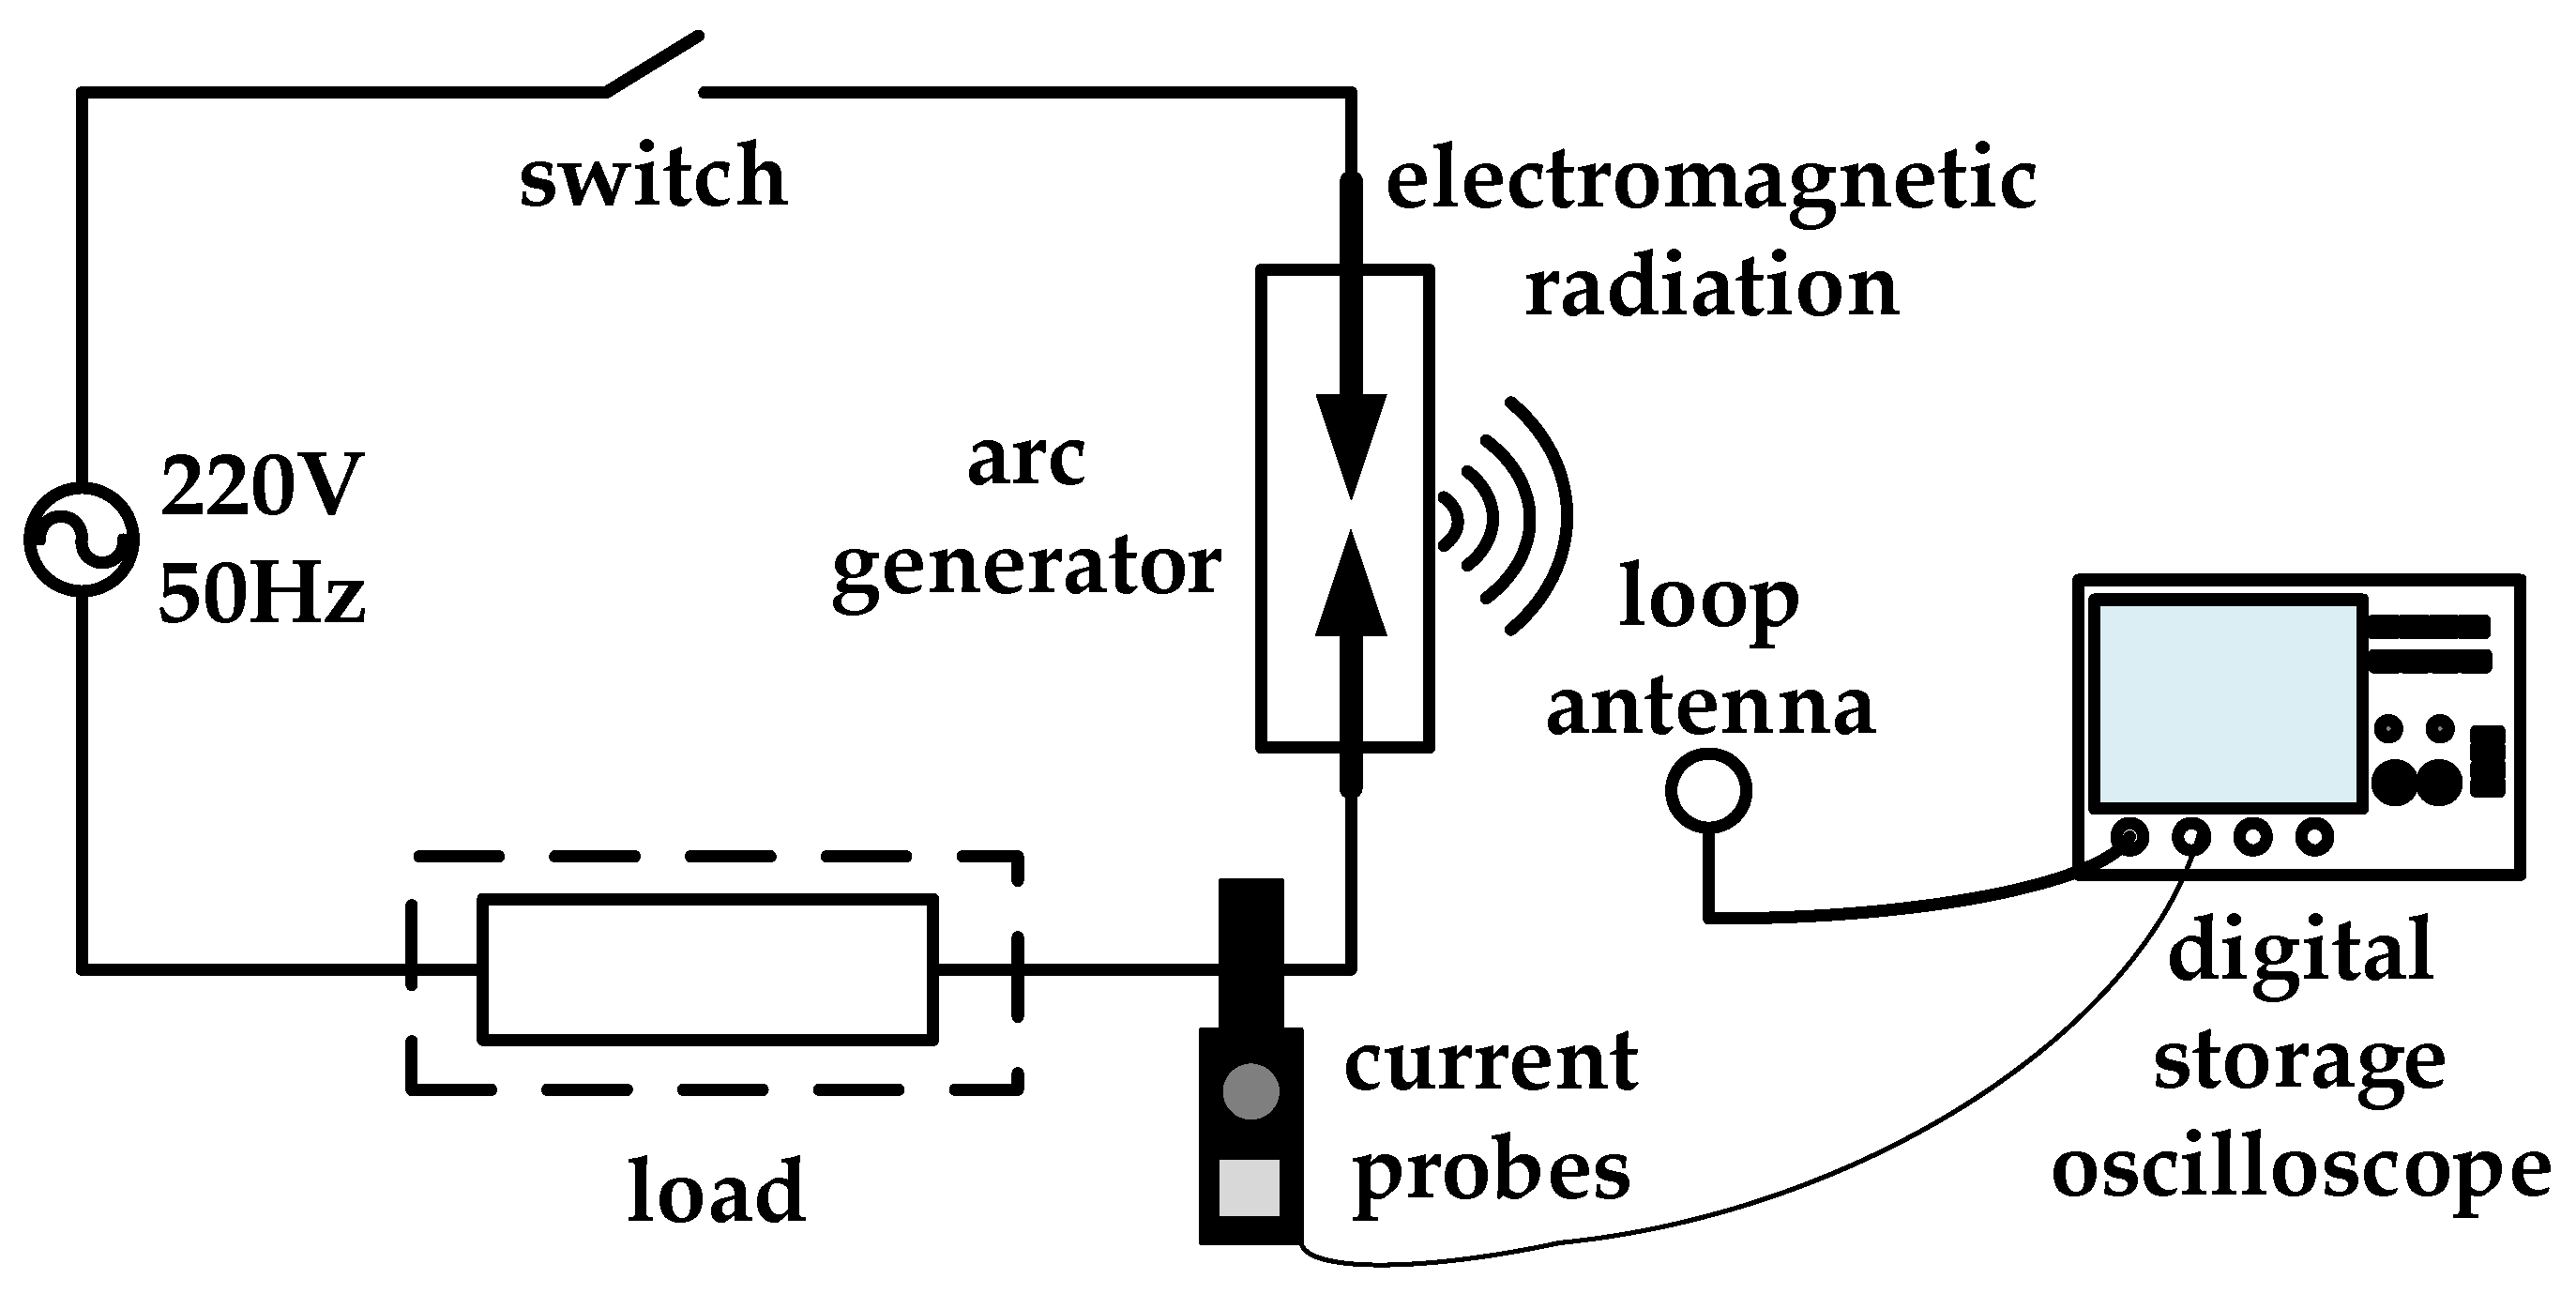
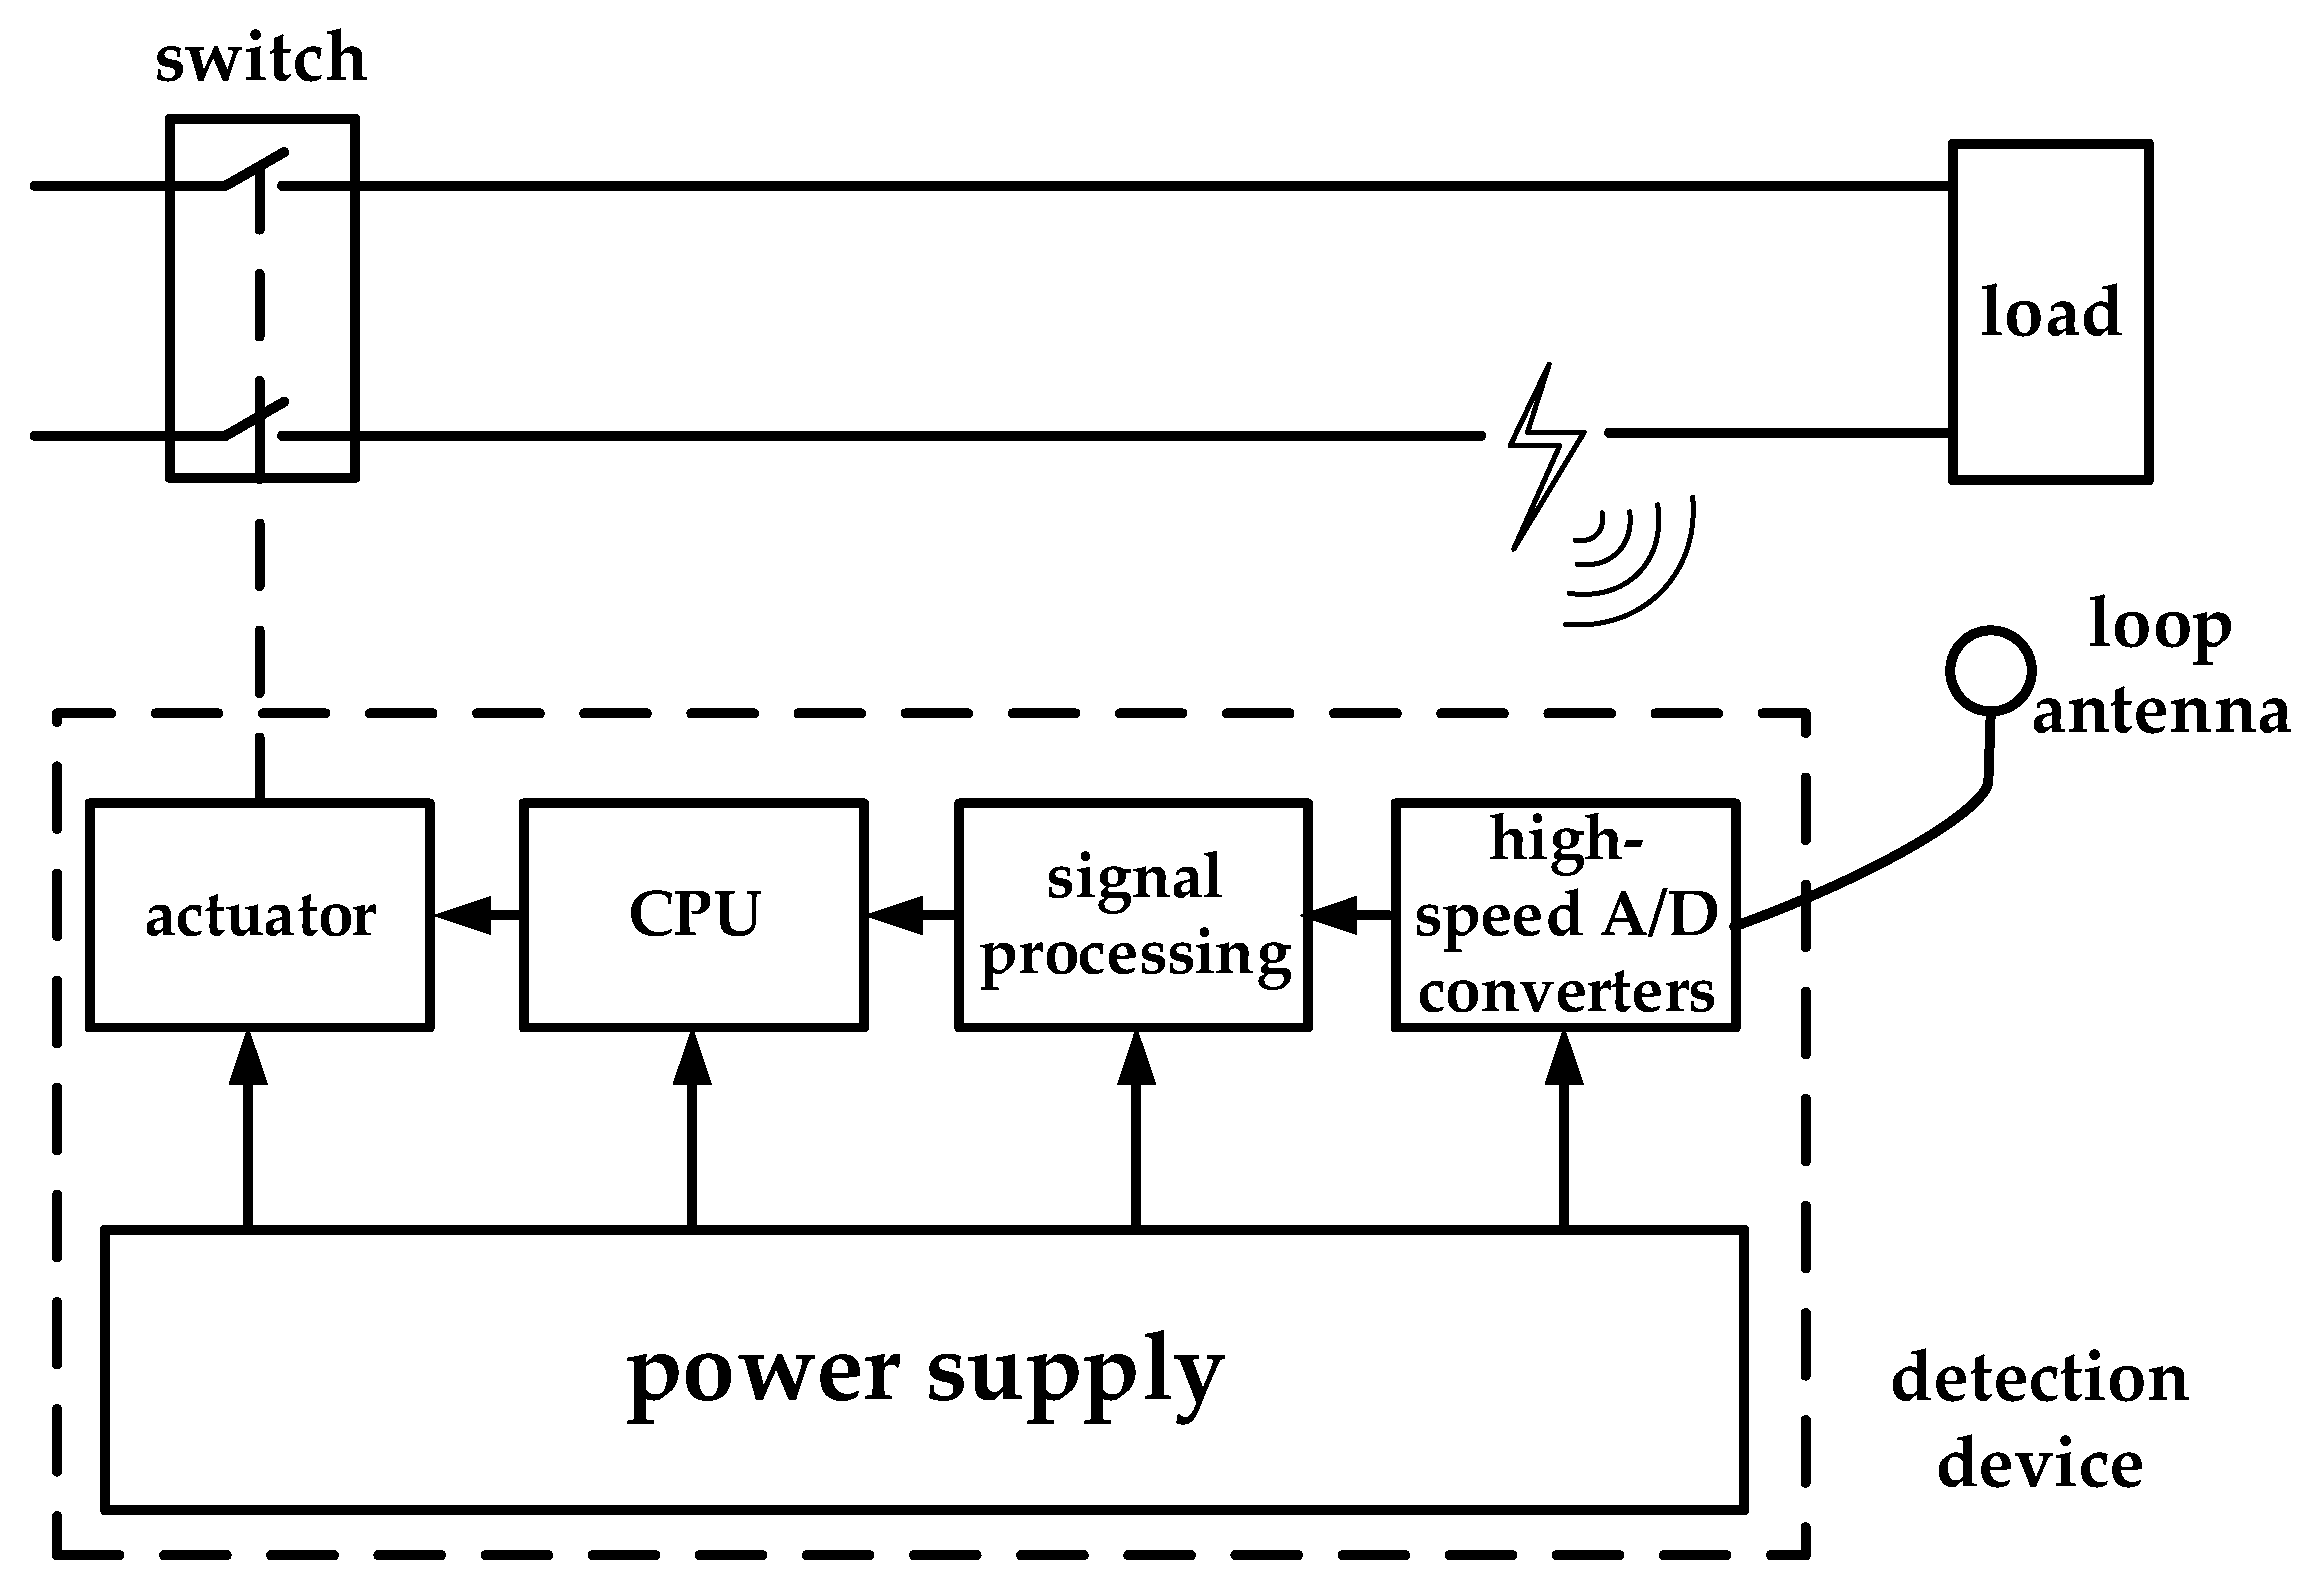
In order to better apply this method to practice, this paper proposes the detection device, and the device structure is shown in the Figure 16. The loop antenna is used to receive electromagnetic radiation signals. According to the experimental test, the antenna designed in this paper can detect the electromagnetic radiation signal within 2 m, which is suitable for indoor fault-arc detection. The loop antenna is connected to a high-speed A/D converter, followed by a signal processing circuit, including signal filtering and amplification. The signal is sent to the CPU after processing, which may be DSP or FPGA. After FFT of the signal through the high-speed processor, the time-domain and frequency domain-features are compared separately. After the fault arc discrimination results are obtained, the actuator action is controlled to disconnect the line and avoid the occurrence of electrical accidents.

Author Contributions

Conceptualization, W.Z. and C.S.; methodology, Y.K. and Y.W.; software, Y.W. and Y.R.; validation, Y.K. and Y.W.; formal analysis, Y.K.; investigation, Y.K., Y.W. and Y.R.; resources, W.Z. and C.S.; data curation, Y.K., Y.W. and Y.R.; writing—original draft preparation, Y.K. and Y.W.; writing—review and editing, Y.K. and Y.R.; supervision, W.Z. and C.S.; project administration, W.Z. and C.S. All authors have read and agreed to the published version of the manuscript.

Funding

This research was supported by the “Research and development of new smart sensor technology to promote the development of green energy” (202104BN050011).

Institutional Review Board Statement

Not applicable.

Informed Consent Statement

Not applicable.

Data Availability Statement

Not applicable.

Conflicts of Interest

The authors declare no conflict of interest.

References

  1. Land, H.B.; Gammon, T. Addressing Arc-Flash Problems in Low-Voltage Switchboards: A Case Study in Arc Fault Protection. Ind. Appl. IEEE Trans. 2015, 51, 1897–1908. [Google Scholar] [CrossRef]
  2. Por, C.S.; Choo, K.L.; Jian, L.Y. A Study of Arc Fault Current in Low Voltage Switchboard. In Proceedings of the 2012 IEEE Conference on Sustainable Utilization and Development in Engineering and Technology (STUDENT), Kuala Lumpur, Malaysia, 6–9 October 2012; pp. 52–56. [Google Scholar]
  3. Ferraz, R.G.; Iurinic, L.U.; Filomena, A.D.; Gazzana, D.S.; Bretas, A.S. Arc fault location: A nonlinear time varying fault model and frequency domain parameter estimation approach. Int. J. Electr. Power Energy Syst. 2016, 80, 347–355. [Google Scholar] [CrossRef]
  4. Zhan, Y.X.; Zhang, R.C.; Yang, J.H. Fault Diagnosis Method of Series Arc Based on Camberra Distance. Power Syst. Prot. Control 2014, 12, 30–36. [Google Scholar]
  5. Restrepo, C.E. Arc Fault Detection and Discrimination Methods. In Proceedings of the 53rd IEEE Holm Conference on Electrical Contacts, Pittsburgh, PA, USA, 16–19 September 2007; pp. 115–122. [Google Scholar]
  6. Abdullah, Y.; Hu, B.; Wei, Z. Adaptivedetection of DC Arc faults based on hurst exponentsand current envelope. In Proceedings of the 2018 IEEE Applied Power Electronics Conference and Exposition, San Antonio, TX, USA, 4–8 March 2018; pp. 3392–3397. [Google Scholar]
  7. Yu, Q.F.; Hu, Y.Q.; Yang, Y. Identification Method for Series Arc Faults Based on Wavelet Transform and Deep Neural Network. Energies 2020, 13, 142. [Google Scholar] [CrossRef] [Green Version]
  8. Artale, G.; Cataliotti, A.; Cosentino, V. Arc fault detection method based on CZT low-frequency harmonic current analysis. IEEE Trans. Instrum. Meas. 2017, 66, 888–896. [Google Scholar] [CrossRef]
  9. Wang, Y.; Wei, Q.Q.; Ge, L.J. Detection Method of Series AC Arc Fault Based on High Frequency Component of Arc Current. Electr. Power Autom. Equip. 2017, 7, 191–197. [Google Scholar]
  10. Liu, X.M.; Xu, Y.F.; Liu, T. Arc Fault Detection Based on Short Time Zero-crossing Rate of Current Signal. Trans. China Electrotech. Soc. 2015, 13, 125–133. [Google Scholar]
  11. Ding, X.; Zhu, H.W.; Yin, H.N. Fast detection method of AC electrical arc based on fast Fourier transform (FFT). Electr. Energy Manag. Technol. 2015, 21, 8–12. [Google Scholar]
  12. Zhao, Y.Q.; Zhang, X.B.; Dong, Y.J. Characteristics Analysis and Detection of AC Arc Fault in SSPC based on Wavelet Transform. In Proceedings of the 2016 IEEE/CSAA International Conference on Aircraft Utility Systems (AUS), Beijing, China, 10–12 October 2016; pp. 476–481. [Google Scholar]
  13. Tang, J.C.; Mou, X.R.; Zhang, L.P. Current-type series arc fault detection. J. Fuzhou Univ. (Nat. Sci. Ed.) 2013, 5, 869–874. [Google Scholar]
  14. Duan, P.Y.; Xu, L.P.; Ding, X.D. An arc fault diagnostic method for low voltage lines using the difference of wavelet coefficients. In Proceedings of the 2014 9th IEEE Conference on Industrial Electronics and Applications, Hangzhou, China, 9–11 June 2014; pp. 401–405. [Google Scholar]
  15. Zhao, Y.; Zhang, G.Y.; Wang, Y.; Gu, Q.L. Series Arc Fault Detection Method Based on the Analysisof Load Voltage. Electr. Energy Manag. Technol. 2016, 15, 74–78. [Google Scholar]
  16. Kim, J.C.; Neacsu, D.O.; Lehman, B. Series AC arc fault detection using only voltage waveforms. In Proceedings of the Conference Proceedings—IEEE Applied Power Electronics Conference and Exposition—APEC, Anaheim, CA, USA, 17–21 March 2019; pp. 2385–2389. [Google Scholar]
  17. Siegel, J.E.; Pratt, S.; Sun, Y. Real-time deepneural networks for internet-enabled arc-faultdetection. Eng. Appl. Artif. 2018, 74, 35–42. [Google Scholar] [CrossRef] [Green Version]
  18. Caldron-Mendoza, E.; Schweitzer, P.; Weber, S. Kalman filter and a fuzzy logic processor for seriesarcing fault detection in a home electrical network. Int. J. Electr. Power Energy Syst. 2019, 107, 251–263. [Google Scholar] [CrossRef] [Green Version]
  19. Wang, Y.; Zhang, F.; Zhang, S. A new methodologyfor identifying arc fault by sparse representation andneural network. IEEE Trans. Instrum. Meas. 2018, 67, 2526–2537. [Google Scholar] [CrossRef]
  20. Lan, H.L.; Zhang, R.C.; Li, K.N. Arc sound identification method of fault arc based on wavelet frequency band energy. Comput. Meas. Control 2013, 21, 532–534. [Google Scholar]
  21. Wu, Z.Y.; Xiao, D.M. Design of New Arc Protection Device. Electr. Eng. 2014, 5, 5–11. [Google Scholar]
  22. Kim, C.; Sowah, R. Arcing Fault Detection with Experimental Veri cation using Antenna for Signal Capture of Radiated Electromagnetic Energy. In Proceedings of the 10th Aging Aircraft Conference, Palm Spring, CA, USA, 16–19 April 2009; pp. 1–8. [Google Scholar]
  23. Melaty, A.; Mohd, R.A.; Nur, A.M.A.; Azralmukmin, A.; Muhd, H.I.; Hana, A.H.; Muzamir, I.; Syahirah, A.H. Arcing fault diagnosis using first peak arrival of EM radiation signal. J. Phys. Conf. Ser. 2021, 1878, 012041. [Google Scholar]
  24. Chen, Z.; Li, K.; Zhang, Y.Z. Fault Arc Identification Based on Arc electromagnetic radiation. Adv. Technol. Electr. Eng. Energy 2017, 36, 70–74. [Google Scholar]
  25. Chen, Z. Research on Arc Fault Identification Method Based on Nonlinear Load; Hebei University: Tianjin, China, 2016. [Google Scholar]
  26. Damas, M.C.; Robiscoe, R.T. Detection of radio-frequency signals emitted by an arc discharge. J. Appl. Phys. 1988, 64, 566–574. [Google Scholar] [CrossRef]
  27. Andrea, J.; Schweitzer, P.; Tisserand, E. A new DC and AC arc fault electrical model. In Proceedings of the 56th IEEE Holm Conference on Electrical Contacts, Charleston, SC, USA, 4–7 October 2010; pp. 1–6. [Google Scholar]
  28. Liu, Y.L.; Guo, F.Y.; Li, L. Mathematical model of series arc fault. Trans. China Electrotech. Soc. 2019, 34, 2901–2912. [Google Scholar]
  29. Xiong, Q. Series arc fault detection and localization in DC distribution system. IEEE Trans. Instrum. Meas. 2020, 69, 122–134. [Google Scholar] [CrossRef]
  30. Safety for Arc-Fault Circuit-Interrupters; Underwriter Laboratories Inc.: Northbrook, IL, USA, 2008.
  31. Chen, D.J. Low Voltage Arc Fault Circuit Breaker—A New Low Voltage Protection Apparatus. Low Volt. Appar. 2007, 3, 7–9. [Google Scholar]
Figure 1. Antenna simulation diagram: (a) antenna structure; (b) VSWR curve.
Energies 15 01829 g001
Figure 2. Series arc test: (a) arc generation and measurement platform; (b) arc generator; (c) laboratory test platform.
Energies 15 01829 g002
Figure 3. Time-domain waveform of fault arc electromagnetic radiation.
Energies 15 01829 g003
Figure 4. Spectrum of antenna received signal.
Energies 15 01829 g004
Figure 5. Electromagnetic radiation signals under different currents: (a) time-domain signal; (b) frequency-domain signal.
Energies 15 01829 g005
Figure 6. Electromagnetic radiation signal under different loads: (a) time-domain waveform of electromagnetic radiation signal; (b) characteristic frequency.
Energies 15 01829 g006
Figure 7. Electromagnetic radiation signal under different arc positions: (a) time-domain waveform of electromagnetic radiation signal; (b) characteristic frequency.
Energies 15 01829 g007
Figure 8. Electromagnetic radiation signal under different arc moments: (a) time-domain waveform of electromagnetic radiation signal; (b) characteristic frequency.
Energies 15 01829 g008
Figure 9. Time-domain waveform of operation switch.
Energies 15 01829 g009
Figure 10. Signal spectrum generated by operation switch. (a) Closing switch; (b) Disconnecting switch.
Energies 15 01829 g010
Figure 11. Comparative experimental platform.
Energies 15 01829 g011
Figure 12. Normal working current waveform of charger: (a) time-domain signal; (b) frequency-domain signal.
Energies 15 01829 g012
Figure 13. Arc current waveform of 100 Ω resistance fault: (a) time-domain signal; (b) frequency-domain signal.
Energies 15 01829 g013
Figure 14. Electromagnetic radiation signal of charger working normally: (a) time-domain signal; (b) frequency-domain signal.
Energies 15 01829 g014
Figure 15. Electromagnetic radiation signal of fault arc: (a) time-domain signal; (b) frequency-domain signal.
Energies 15 01829 g015
Figure 16. Practical application block diagram.
Energies 15 01829 g016
Table 1. Electromagnetic radiation signal characteristics under different currents.
Magnitude of CurrentPeer GroupSignal Amplitude (V)Signal Characteristic Frequency (MHz)
2.2 A11.0813.96
2313.97
31.6414.02
41.8814
52.8413.99
4.4 A11.7113.98
24.1614.01
33.5214.04
41.8413.98
52.6414.01
8.8 A12.5613.97
21.2814
31.0414.04
41.2813.97
51.214.02
Table 2. The load used in the experiment.
Load NamePowerLoad Type
electric kettle1500 Wresistive linear load
electric drill800 Winductive nonlinear load
electromagnetic oven1500 Winductive nonlinear load
microwave oven700 Winductive nonlinear load
Charger700 Wcapacitive nonlinear load
Table 3. Electromagnetic radiation signal characteristics under different loads.
LoadPeer GroupSignal Amplitude (V)Signal Characteristic Frequency (MHz)
electric kettle17.1614.06
27.1614.07
37.5614.03
47.8814.04
52.214.04
electric drill12.4513.69
24.713.65
34.313.72
41.8613.88
53.113.76
electromagnetic oven13.113.94
24.8213.99
32.2813.96
41.2813.97
50.7613.93
microwave oven12.1214.01
22.5613.95
32.5614
42.5613.98
52.6413.96
charger12.1813.94
21.8614
33.114
42.2613.97
51.8214
Table 4. Electromagnetic radiation signal characteristics under different arc positions.
Arc PositionPeer GroupSignal Amplitude (V)Signal Characteristic Frequency (MHz)
Load front end11.7113.98
24.1614.01
33.5214.04
41.8413.98
52.6414.01
Load front end13.8414.13
23.8414
32.413.9
41.4413.97
52.5613.99
Table 5. Electromagnetic radiation signal characteristics under different arc moments.
Arc MomentPeer GroupSignal Amplitude (V)Signal Characteristic Frequency (MHz)
Power-on moment11.7113.98
24.1614.01
33.5214.04
41.8413.98
52.6414.01
power-off moment11.6214.02
20.6613.97
30.713.99
40.6613.97
5113.99
Publisher’s Note: MDPI stays neutral with regard to jurisdictional claims in published maps and institutional affiliations.

