
Performance Analysis and Comparative Study of a 467.2 kWp Grid-Interactive SPV System: A Case Study

 , , and
Abstract
:1. Introduction
2. Methodology
Performance Parameters of Globally Available SPV System
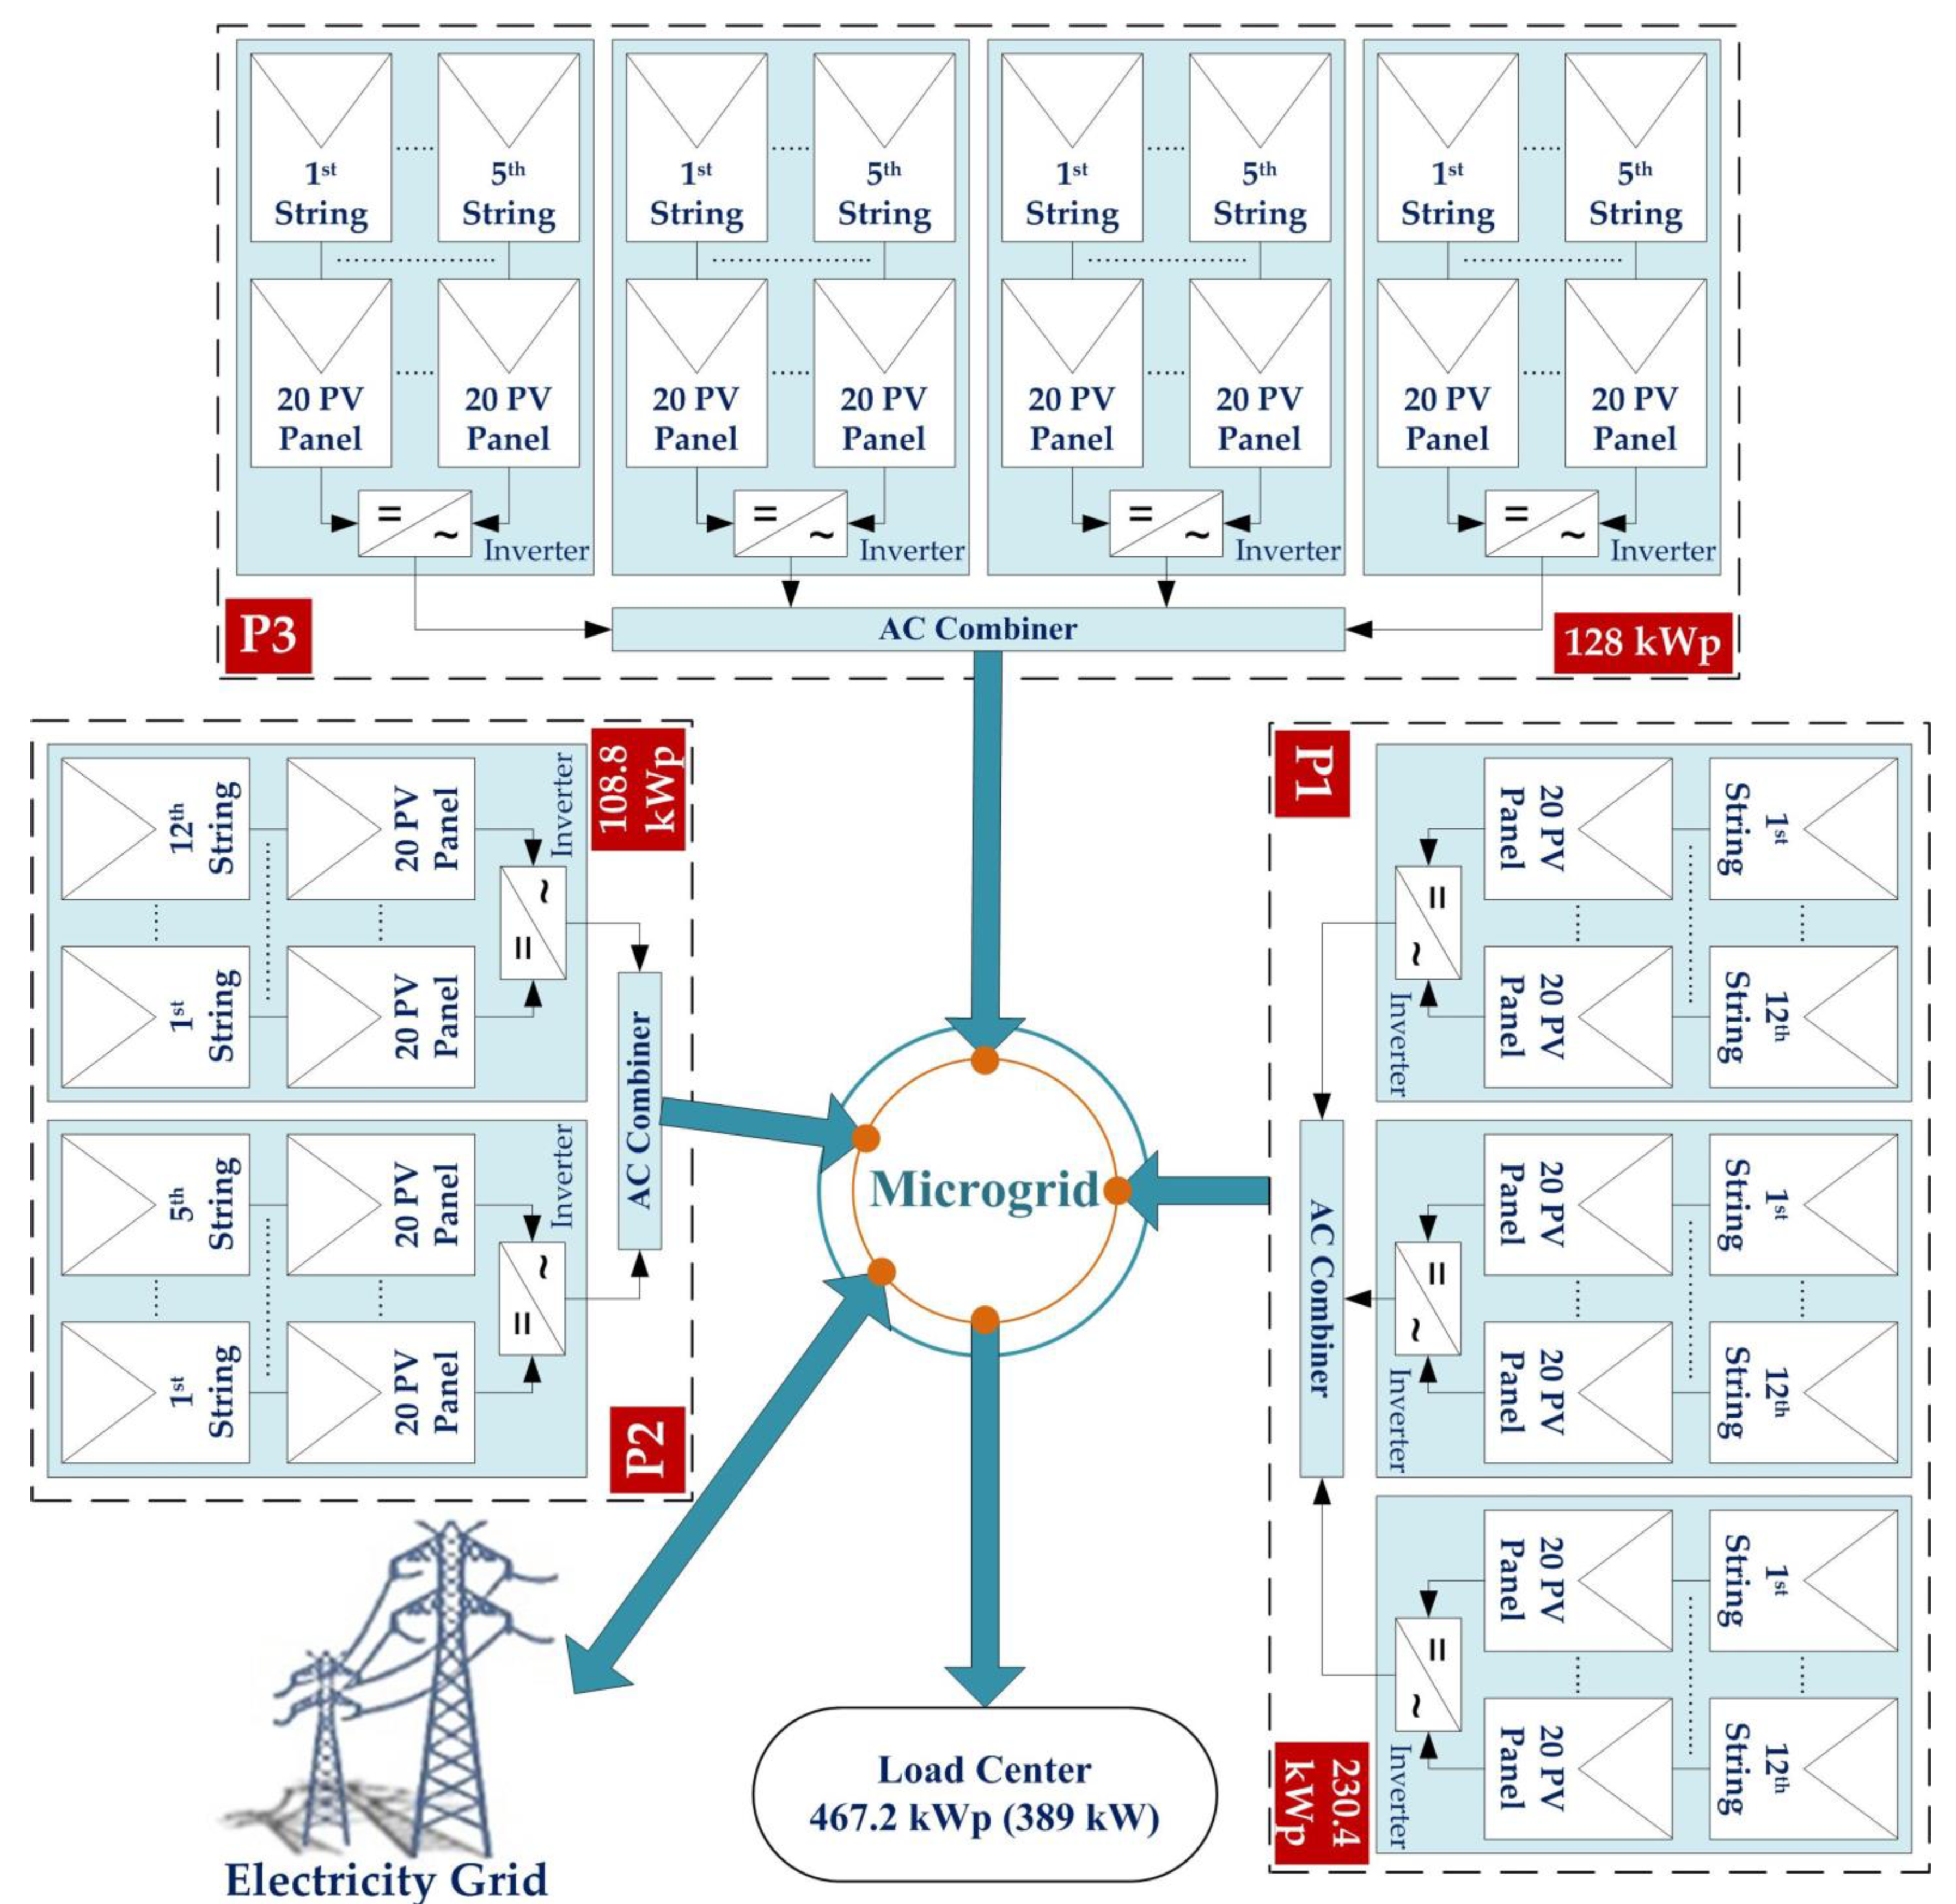
3. Brief Detail of Developed SPV System
4. Result Demonstration and Discussion
5. Conclusions
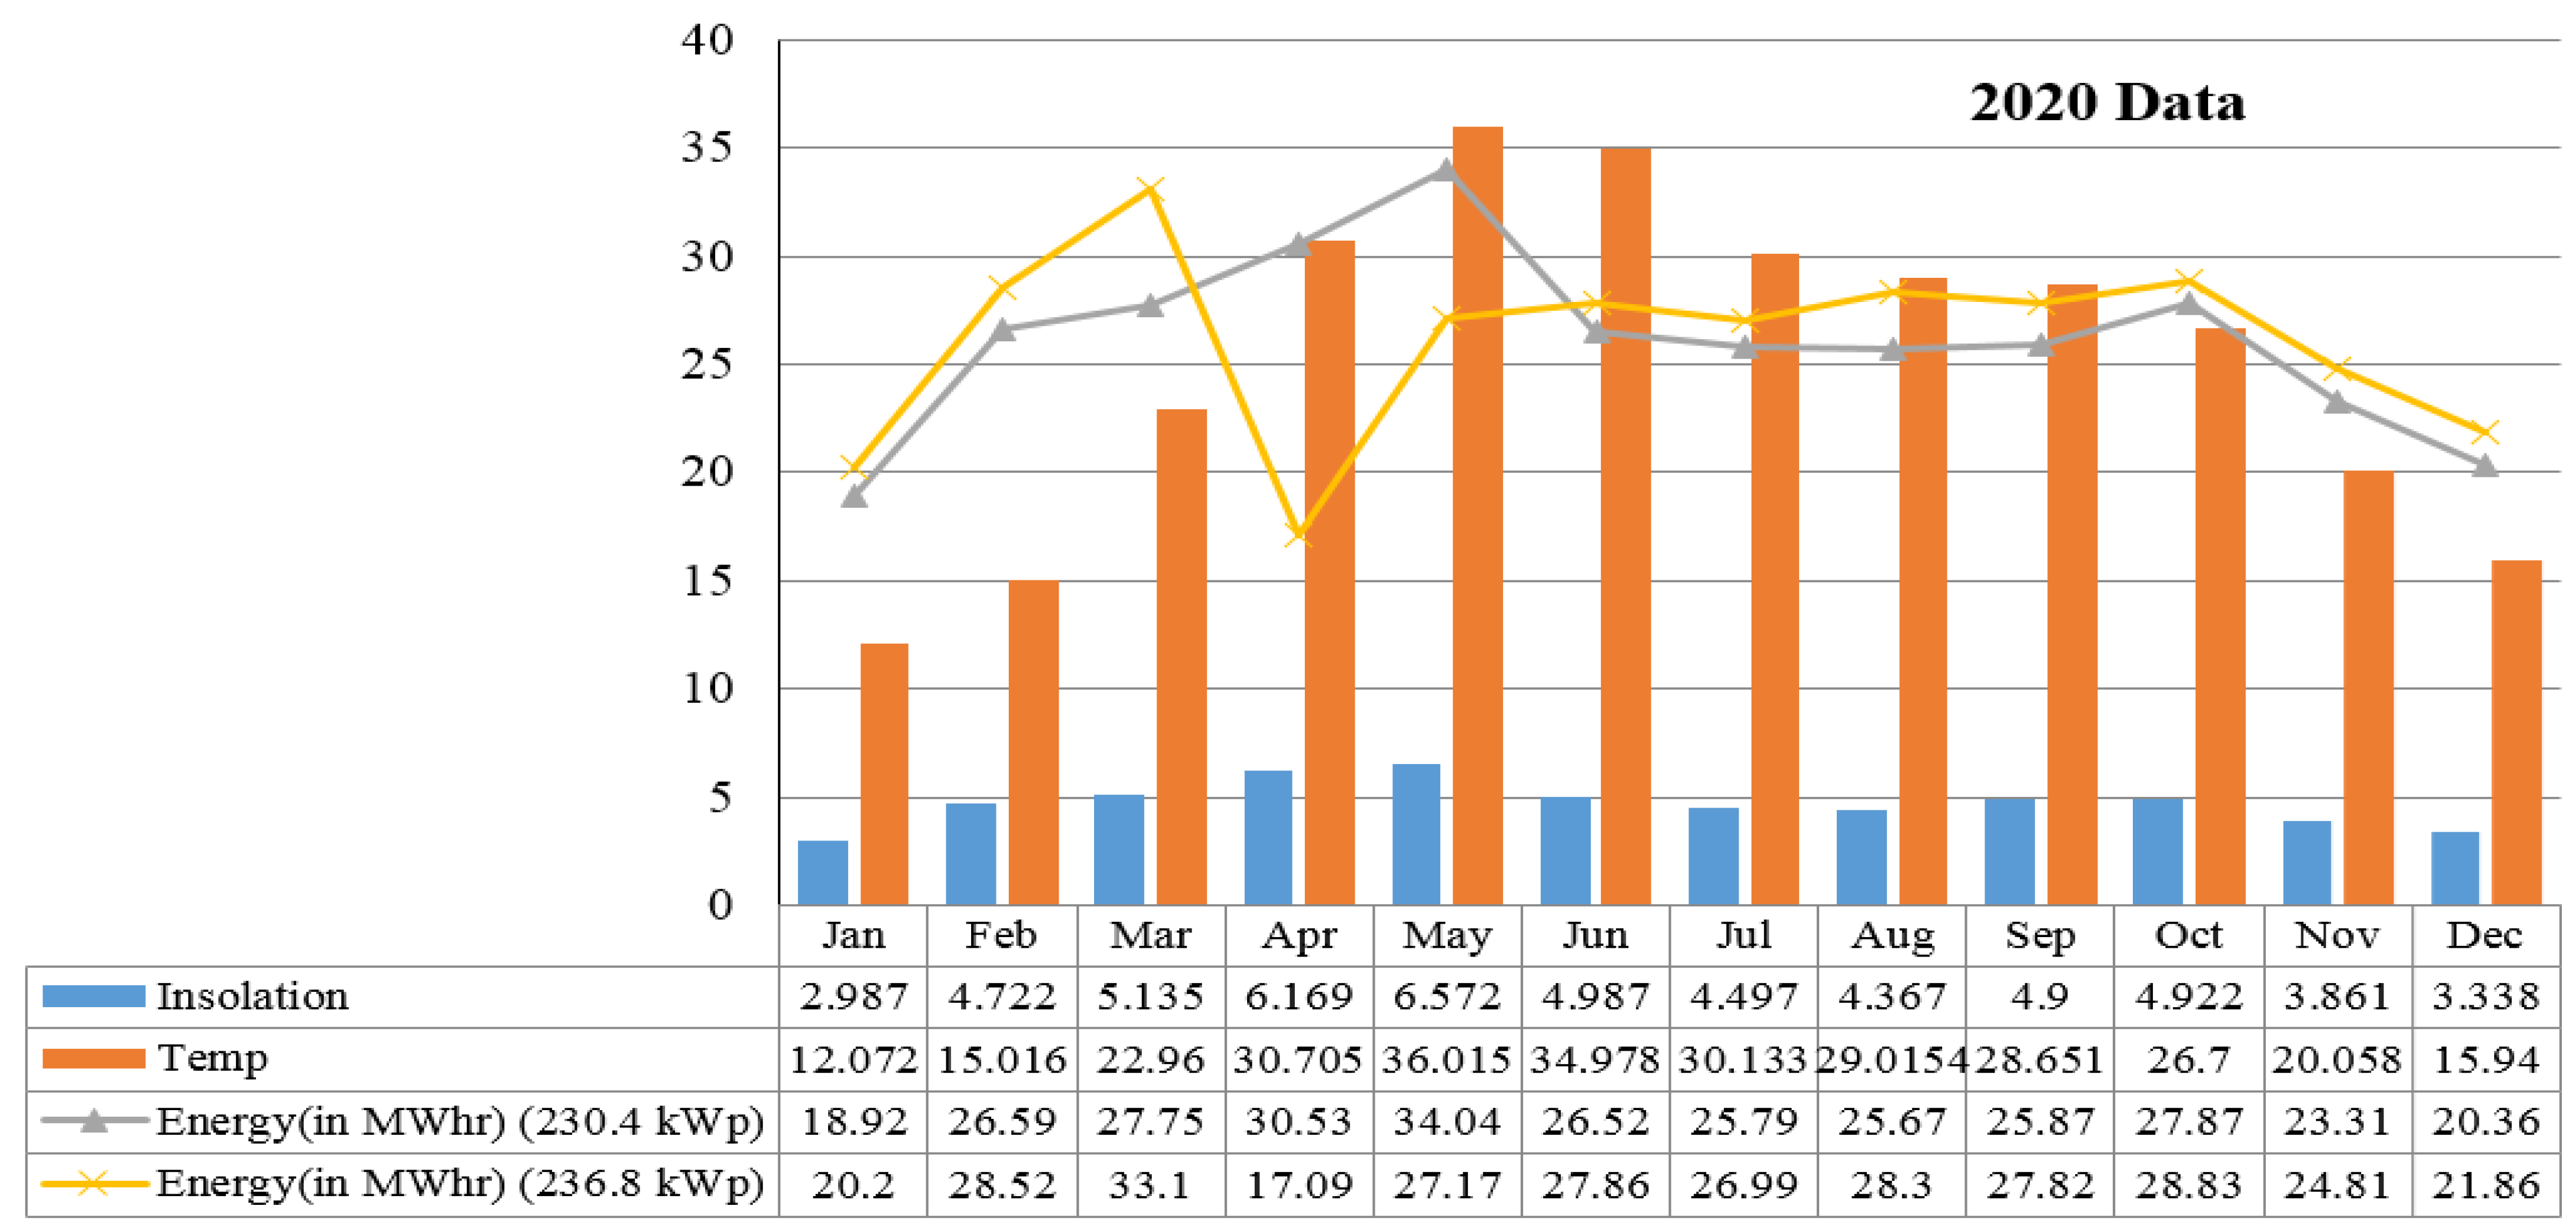
- The comparison of the 230.4 kWp and 236.8 kWp plants is made for the years 2018, 2019, and 2020. It can be seen from Table 5, Table 6, Table 7, and Figure 5, Figure 6, and Figure 7 that the difference in the generated energy is not as much as the installation cost. The difference in the rating of the SPV plant is 6.4 kWp, but the difference in the generation is 9.96 MWHr in 2018, 8.83 MWHr in 2019, and -0.67 MWHr in 2020 (due to a fault in the inverter of one of the buildings taken for study in the month of April 2020)
- A worldwide performance comparison in terms of array efficiency, inverter efficiency, system efficiency, PR, and CUF with the 467.2 kWp (389 kW) plant is reported in Table 10.
Author Contributions
Funding
Institutional Review Board Statement
Informed Consent Statement
Data Availability Statement
Acknowledgments
Conflicts of Interest
References
- Kumar, S.B.; Sudhakar, K. Performance Evaluation of 10MWgrid Connected Solar Photovoltaic Power Plant in India. Energy Rep. 2015, 1, 184–192. [Google Scholar] [CrossRef] [Green Version]
- Bohra, R. Performance Analysis of 1MW SPV Plant: Temperature Corrected PR; Energetica India: Maharashtra, India, 2014; pp. 1–4. [Google Scholar]
- Ahmed, S.; Mahmood, A.; Hasan, A.; Sidhu, G.A.S.; Butt, M.F.U. A Comparative Review of China, India and Pakistan Renewable Energy Sectors and Sharing Opportunities. Renew. Sustain. Energy Rev. 2016, 57, 216–225. [Google Scholar] [CrossRef]
- Erdinc, O.; Uzunoglu, M. Optimum Design of Hybrid Renewable Energy Systems: Overview of Different Approaches. Renew. Sustain. Energy Rev. 2012, 16, 1412–1425. [Google Scholar] [CrossRef]
- Plangklang, B.; Thanomsat, N.; Phuksamak, T. A Verification Analysis of Power Quality and Energy Yield of a Large Scale PV Rooftop. Energy Rep. 2016, 2, 1–7. [Google Scholar] [CrossRef] [Green Version]
- Minai, A.F.; Usmani, T.; Iqbal, A. Performance Evaluation of a 500 KWp Rooftop Grid-Interactive SPV System at Integral University, Lucknow: A Feasible Study Under Adverse Weather Condition. In Studies in Big Data; Springer Science and Business Media LLC: Berlin, Germany, 2021; pp. 389–396. [Google Scholar] [CrossRef]
- Singh, R.; Sharma, M.; Banerjee, C. Field Analysis of Three Different Silicon-Based Technologies in Composite Climatic Condition. Sol. Energy 2019, 182, 102–116. [Google Scholar] [CrossRef]
- Sugathan, V.; John, E.; Sudhakar, K. Recent Improvements in Dye Sensitized Solar Cells: A Review. Renew. Sustain. Energy Rev. 2015, 52, 54–64. [Google Scholar] [CrossRef]
- Ibrik, I.H. Techno-Economic Assessment of on-Grid Solar PV System in Palestine. Cogent Eng. 2020, 7, 1727131. [Google Scholar] [CrossRef]
- Shukla, A.K.; Sudhakar, K.; Baredar, P. Simulation and Performance Analysis of 110 KWp Grid-Connected Photovoltaic System for Residential Building in India: A Comparative Analysis of Various PV Technology. Energy Rep. 2016, 2, 82–88. [Google Scholar] [CrossRef] [Green Version]
- Dhimish, M. Performance Ratio and Degradation Rate Analysis of 10-Year Field Exposed Residential Photovoltaic Installations in the UK and Ireland. Clean Technol. 2020, 2, 170–183. [Google Scholar] [CrossRef]
- Kaplanis, S.; Kaplani, E. Energy Performance and Degradation over 20 years Performance of BP C-Si PV Modules. Simul. Model. Pract. Theory 2011, 19, 1201–1211. [Google Scholar] [CrossRef]
- Kahoul, N.; Houabes, M.; Sadok, M. Assessing the Early Degradation of Photovoltaic Modules Performance in the Saharan Region. Energy Convers. Manag. 2014, 82, 320–326. [Google Scholar] [CrossRef]
- Minai, A.F.; Malik, H. Metaheuristics Paradigms for Renewable Energy Systems: Advances in Optimization Algorithms. In Studies in Computational Intelligence; Springer: Singapore, 2020; Volume 916, pp. 35–61. [Google Scholar] [CrossRef]
- Minai, A.F.; Husain, M.A.; Naseem, M.; Khan, A.A. Electricity Demand Modeling Techniques for Hybrid Solar PV System. Int. J. Emerg. Electr. Power Syst. 2021, 22, 607–615. [Google Scholar] [CrossRef]
- Kumar, N.M.; Gupta, R.P.; Mathew, M.; Jayakumar, A.; Singh, N.K. Performance, Energy Loss, and Degradation Prediction of Roof-Integrated Crystalline Solar PV System Installed in Northern India. Case Stud. Therm. Eng. 2019, 13, 100409. [Google Scholar] [CrossRef]
- Khatib, T.; Mohamed, A.; Sopian, K. A Review of Photovoltaic Systems Size Optimization Techniques. Renew. Sustain. Energy Rev. 2013, 22, 454–465. [Google Scholar] [CrossRef]
- Khatri, R. Design and Assessment of Solar PV Plant for Girls Hostel (GARGI) of MNIT University, Jaipur City: A Case Study. Energy Rep. 2016, 2, 89–98. [Google Scholar] [CrossRef] [Green Version]
- Yadav, S.K.; Bajpai, U. Performance Evaluation of a Rooftop Solar Photovoltaic Power Plant in Northern India. Energy Sustain. Dev. 2018, 43, 130–138. [Google Scholar] [CrossRef]
- Pundir, K.S.S.; Varshney, N.; Singh, G.K. Comparative Study of Performance of Grid Connected Solar Photovoltaic Power System in IIT Roorkee Campus. In Proceedings of the International Conference on Innovative Trends in Science, Engineering and Management, New Delhi, India, 7 January 2017; pp. 423–431. [Google Scholar]
- Ayompe, L.; Duffy, A.; McCormack, S.; Conlon, M. Measured Performance of a 1.72kW Rooftop Grid Connected Photovoltaic System in Ireland. Energy Convers. Manag. 2011, 52, 816–825. [Google Scholar] [CrossRef] [Green Version]
- Juszczyk, O.; Juszczyk, J.; Juszczyk, S.; Takala, J. Barriers for Renewable Energy Technologies Diffusion: Empirical Evidence from Finland and Poland. Energies 2022, 15, 527. [Google Scholar] [CrossRef]
- Cai, X.; Xie, M.; Zhang, H.; Xu, Z.; Cheng, F. Business Models of Distributed Solar Photovoltaic Power of China: The Business Model Canvas Perspective. Sustainability 2019, 11, 4322. [Google Scholar] [CrossRef] [Green Version]
- Simões, M.G.; Farret, F.A.; Khajeh, H.; Shahparasti, M.; Laaksonen, H. Future Renewable Energy Communities Based Flexible Power Systems. Appl. Sci. 2021, 12, 121. [Google Scholar] [CrossRef]
- Mondol, J.D.; Yohanis, Y.; Smyth, M.; Norton, B. Long Term Performance Analysis of a Grid Connected Photovoltaic System in Northern Ireland. Energy Convers. Manag. 2006, 47, 2925–2947. [Google Scholar] [CrossRef]
- Drif, M.; Pérez, P.J.; Aguilera, J.; Almonacid, G.; Gomez, P.; De La Casa, J.; Aguilar, J.D. Univer Project. A Grid Connected Photovoltaic System of at Jaén University. Overview and Performance Analysis. Sol. Energy Mater. Sol. Cells 2007, 91, 670–683. [Google Scholar] [CrossRef]
- Kymakis, E.; Kalykakis, S.; Papazoglou, T.M. Performance Analysis of a Grid Connected Photovoltaic Park on the Island of Crete. Energy Convers. Manag. 2009, 50, 433–438. [Google Scholar] [CrossRef]
- Wittkopf, S.; Valliappan, S.; Liu, L.; Ang, K.S.; Cheng, S.C.J. Analytical Performance Monitoring of a 142.5 KWp Grid-Connected Rooftop BIPV System in Singapore. Renew. Energy 2012, 47, 9–20. [Google Scholar] [CrossRef]
- Chimtavee, A.; Ketjoy, N. PV Generator Performance Evaluation and Load Analysis of the PV Microgrid System in Thailand. Procedia Eng. 2012, 32, 384–391. [Google Scholar] [CrossRef] [Green Version]
- Eke, R.; Demircan, H. Performance Analysis of a Multi Crystalline Si Photovoltaic Module under Mugla Climatic Conditions in Turkey. Energy Convers. Manag. 2013, 65, 580–586. [Google Scholar] [CrossRef]
- Padmavathi, K.; Daniel, S.A. Performance Analysis of a 3MWp Grid Connected Solar Photovoltaic Power Plant in India. Energy Sustain. Dev. 2013, 17, 615–625. [Google Scholar] [CrossRef]
- Sharma, V.; Chandel, S. Performance Analysis of a 190 KWp Grid Interactive Solar Photovoltaic Power Plant in India. Energy 2013, 55, 476–485. [Google Scholar] [CrossRef]
- Emziane, M.; Al Ali, M. Performance Assessment of Rooftop PV Systems in Abu Dhabi. Energy Build. 2015, 108, 101–105. [Google Scholar] [CrossRef]
- Farhoodnea, M.; Mohamed, A.; Khatib, T.; Elmenreich, W. Performance Evaluation and Characterization of a 3-KWp Grid-Connected Photovoltaic System Based on Tropical Field Experimental Results: New Results and Comparative Study. Renew. Sustain. Energy Rev. 2015, 42, 1047–1054. [Google Scholar] [CrossRef]
- Okello, D.; Van Dyk, E.E.; Voster, F.J. Analysis of Measured and Simulated Per- Formance Data of a 3.2 KWp Grid Connected PV System in Port Elizabeth, South Africa. Energy Convers. Manag. 2015, 100, 10–15. [Google Scholar] [CrossRef]
- Adaramola, M.S.; Vågnes, E.E.T. Preliminary Assessment of a Small-Scale Roof-Top PV-Grid Tied in Norwegian Climatic Conditions. Energy Convers. Manag. 2015, 90, 458–465. [Google Scholar] [CrossRef]
- Sundaram, S.; Babu, J.S.C. Performance Evaluation and Validation of 5MWp Grid Connected Solar Photovoltaic Plant in South India. Energy Convers. Manag. 2015, 100, 429–439. [Google Scholar] [CrossRef]
- Sharma, R.; Goel, S. Performance Analysis of a 11.2 KWp Roof Top Grid-Connected PV System in Eastern India. Energy Rep. 2017, 3, 76–84. [Google Scholar] [CrossRef]
- Žnidarec, M.; Šljivac, D.; Došen, D.; Dumnin, B. Performance Assessment of Mono and Poly Crystalline Silicon Photovoltaic Arrays under Pannonian Climate Conditions. In Proceedings of the IEEE EUROCON 2019–18th International Conference on Smart Technologies, Novi Sad, Serbia, 1–4 July 2019; IEEE: Piscataway, NJ, USA, 2019; pp. 1–6. [Google Scholar]
- Imam, A.A.; Al-Turki, Y.A. Techno-Economic Feasibility Assessment of Grid-Connected PV Systems for Residential Buildings in Saudi Arabia—A Case Study. Sustainability 2019, 12, 262. [Google Scholar] [CrossRef] [Green Version]
- Ramanan, P.; Karthick, A. Performance Analysis and Energy Metrics of Grid-Connected Photovoltaic Systems. Energy Sustain. Dev. 2019, 52, 104–115. [Google Scholar]
- Arora, R.; Arora, R.; Sridhara, S.N. Performance Assessment of 186 KWp Grid Interactive Solar Photovoltaic Plant in Northern India. Int. J. Ambient. Energy 2019, 1–14. [Google Scholar] [CrossRef]
- Cubukcu, M.; Gumus, H. Performance Analysis of a Grid-Connected Photovoltaic Plant in Eastern Turkey. Sustain. Energy Technol. Assess. 2020, 39, 100724. [Google Scholar] [CrossRef]
- Aoun, N. Performance Analysis of a 20 MW Grid-Connected Photovoltaic Installation in Adrar, South of Algeria. In Advanced Statistical Modeling, Forecasting, and Fault Detection in Renewable Energy Systems; IntechOpen: London, UK, 2020. [Google Scholar] [CrossRef] [Green Version]
- Nurdiana, E.; Subiyanto, I.; Indarto, A.; Riza; Wibisono, G.; Hudaya, C. Performance Analysis and Evaluation of a 10.6 KWp Grid-Connected Photovoltaic System in Serpong. IOP Conf. Ser. Mater. Sci. Eng. 2020, 909, 012019. [Google Scholar] [CrossRef]
- Zdyb, A.; Gulkowski, S. Performance Assessment of Four Different Photovoltaic Technologies in Poland. Energies 2020, 13, 196. [Google Scholar] [CrossRef] [Green Version]
- Sreenath, S.; Sudhakar, K.; Yusop, A.F.; Solomin, E.; Kirpichnikova, I.M. Solar PV Energy System in Malaysian Airport: Glare Analysis, General Design and Performance Assessment. Energy Rep. 2020, 6, 698–712. [Google Scholar] [CrossRef]
- Med Yahya, A.; Mahmoud, A.K.; Daher, D.H.; Gaillard, L.; Menezo, C.; Youm, I.; Mellit, A. Performance Analysis of a 48kWp Grid-Connected Photovoltaic Plant in the Sahelian Climate Conditions of Nouakchott, Mauritania. Preprints 2021, 2021020275. [Google Scholar] [CrossRef]


| S. No. | Parameters and Its Expression | Reference |
|---|---|---|
| 1. | Array yield (YA) = EA,DC/Po Unit: kWh/kWp/d (or h/d). Where: EA,DC is Output Energy from an SPV array, Po is Rated power output of installed array | [19] |
| 2. | Reference yield (YR) = HT/G0 Unit: kWh/kWp/d (or h/d). Where: HT is In-plane irradiance (Total), G0 is Reference irradiance of PV | [19] |
| 3. | Capacity Utilization Factor (CUF) = YF/24*366 Where: YF is Final yield | [20] |
| 4. | Performance Ratio (PR) = 100 × (YF/YR) (%) Where: YF is Final yield, YR is Reference yield | [21] |
| 5. | Final yield (YF) = EAC/Po Unit: kWh/kWp/d (or h/d). Where: EAC is annually, monthly, or daily Output Energy (EAC) of SPV system, Po is Rated power output of installed array | [21] |
| Building Name | Specifications | |
|---|---|---|
| Academic Block-1 (P1) | Rating | 230.4 kWp |
| No. of SPV Panels | Total PV Panels: 720 Number of strings: 36 | |
| PCU | 3 of 66 kVA, (198 kW) | |
| Earthing | 09 | |
| LA | 01 | |
| AC Box | 01 | |
| Academic Block-4 (P2) | Rating | 108.8 kWp |
| No. of SPV Panels | Total PV Panels: 340 Number of strings: 17 | |
| PCU | 1 of 66 kVA 1 of 25 kVA (91 kW) | |
| Earthing | 09 | |
| LA | 01 | |
| AC Box | 01 | |
| Medical Block Phase-1 (P3) | Rating | 128 kWp |
| No. of SPV Panels | Total PV Panels: 400 Number of Strings: 20 | |
| PCU | 4 of 25 kVA(100 kW) | |
| Earthing | 09 | |
| LA | 01 | |
| AC Box | 01 | |
| Parameter | Specification |
|---|---|
| Make | Vikarm Solar Pvt.Ltd, Kolkata, India |
| Type | Eldora VSP.72.320.03.04. 72 cells, 320 Wp, Polycrystalline Solar PV module |
| Pmpp | 320 W |
| Voc | 46.00 V |
| Isc | 9.03 A |
| Vmpp | 37.70 V |
| Impp | 8.50 A |
| FF | 77.04% |
| η (%) | 16.49% |
| Vmax operating | 1000 V |
| Dimension | 1956 × 992 × 36 mm (77.01 × 39.06 × 1.42 inches) |
| A1 | 3008.0106 inch 2 = 1.941 m2 |
| A1460 | 2833.86 m2 |
| STC | 2833.86 m2 × 1000 W/m2 |
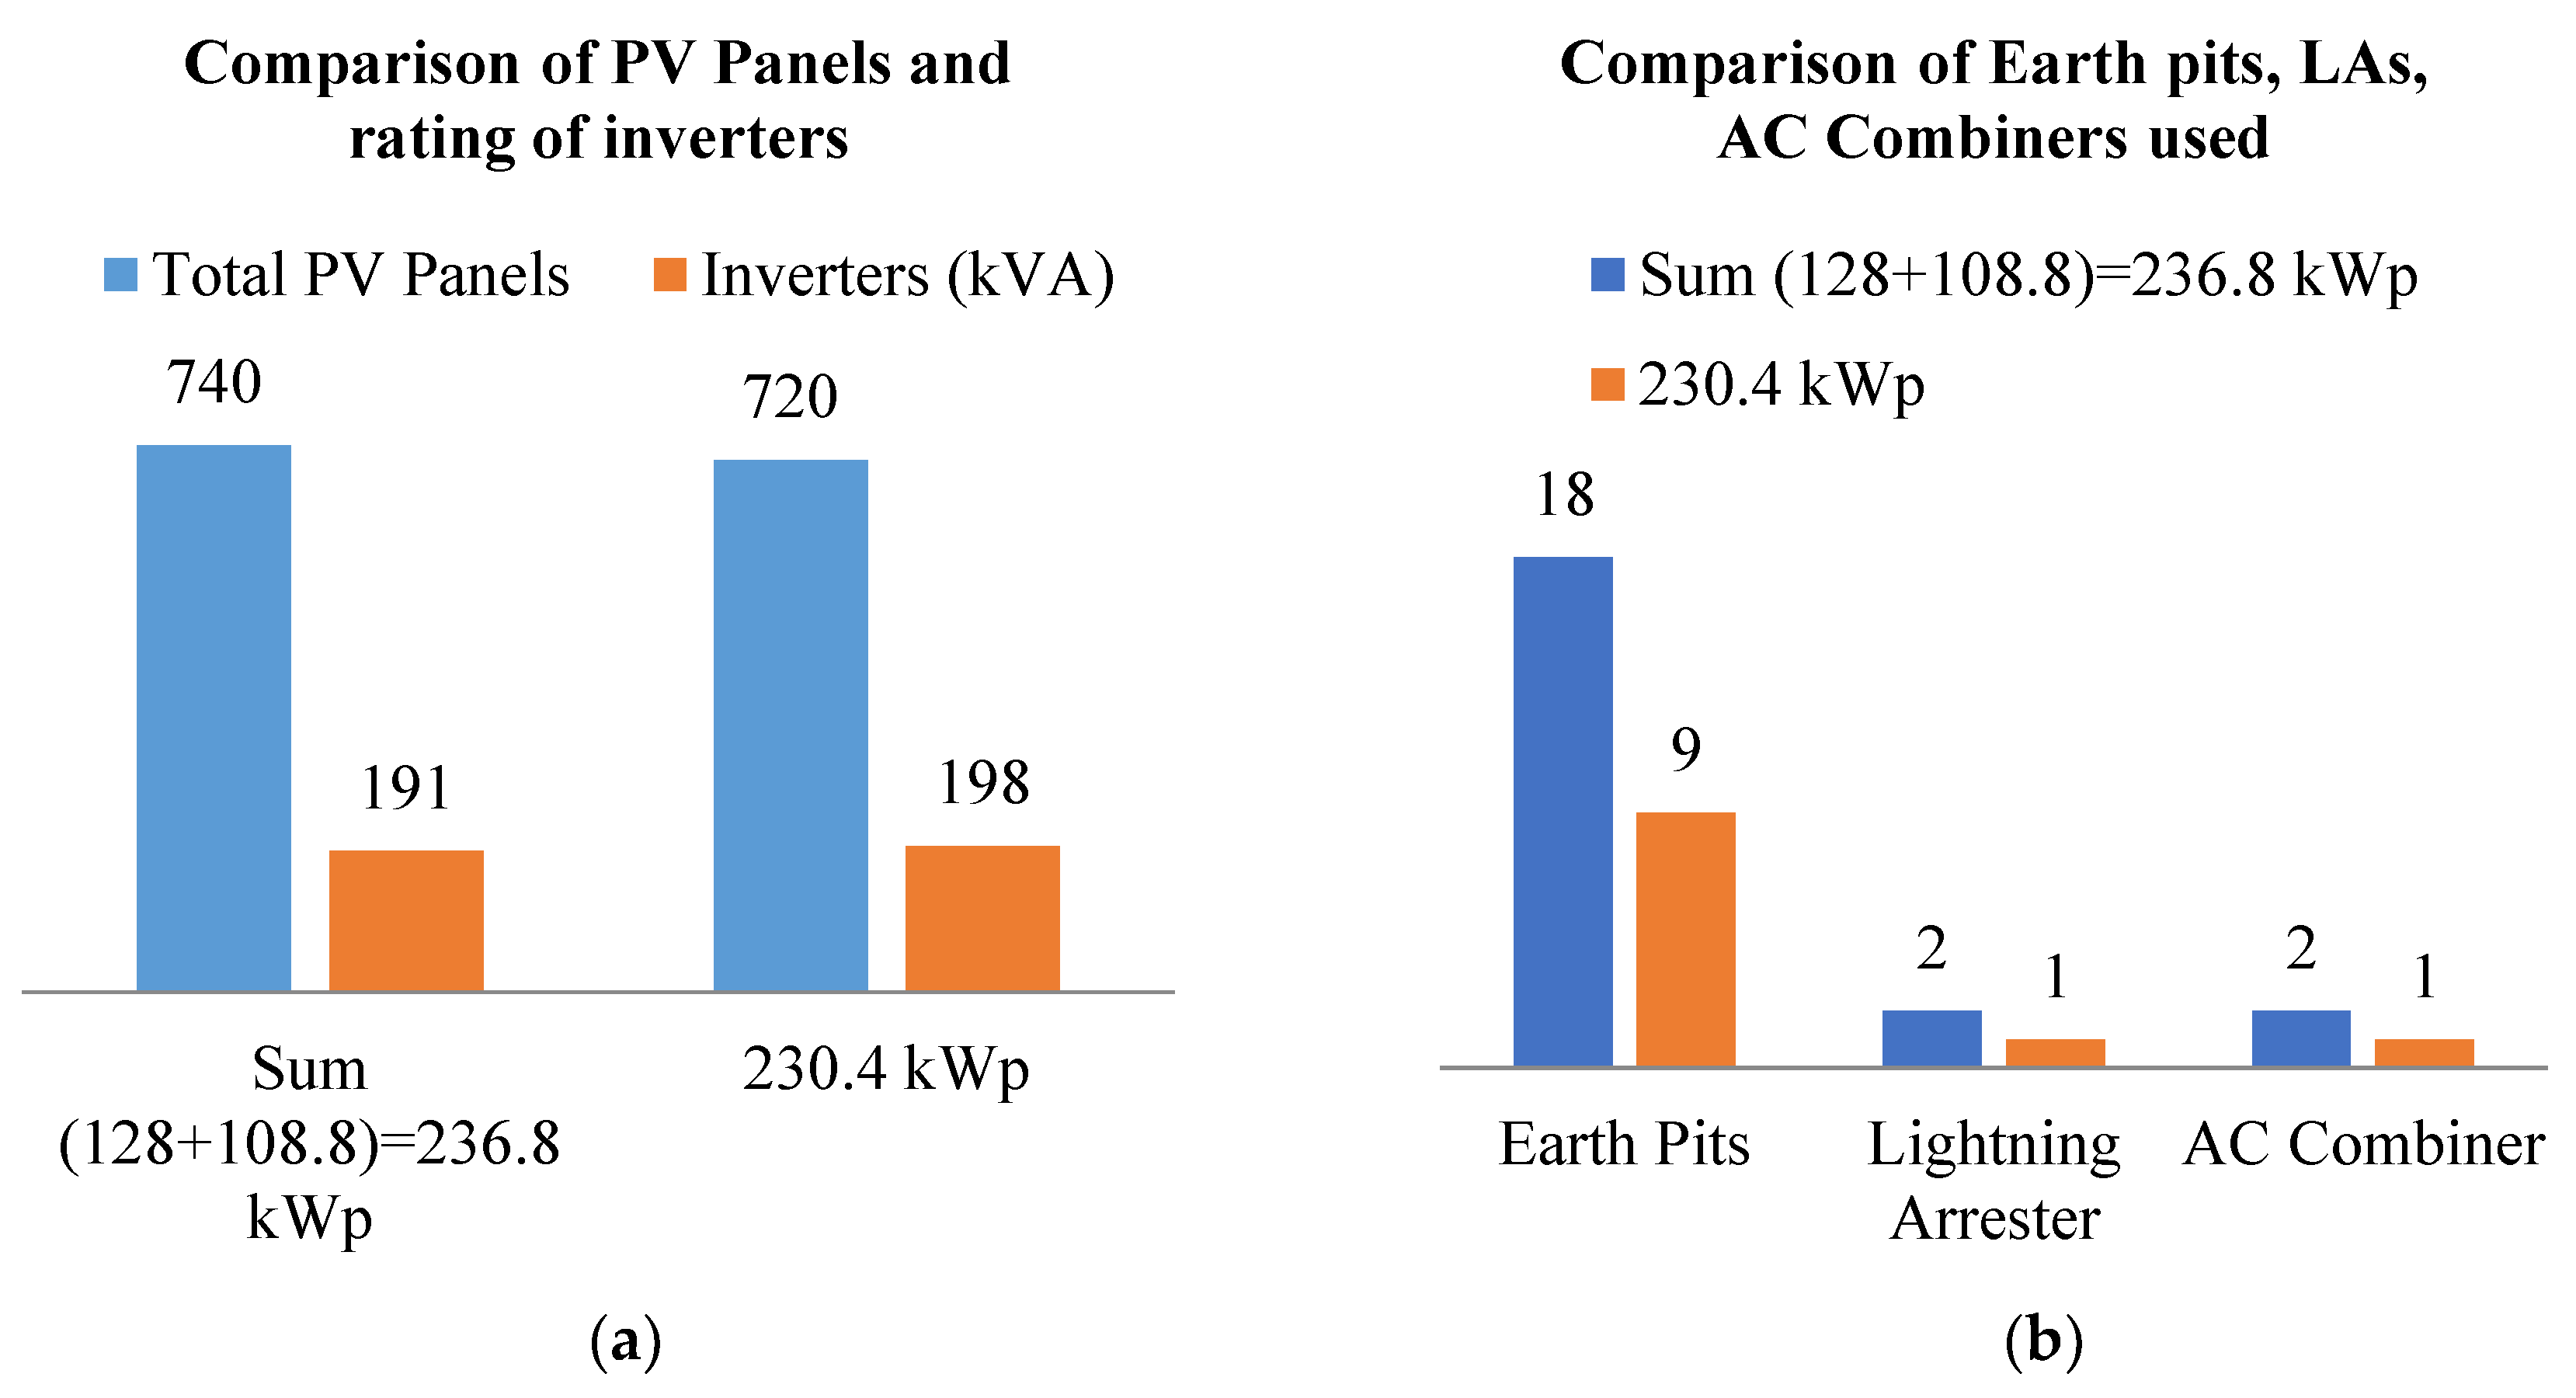
| Specifications | P2 + P3 (kWp) | P1 (kWp) |
|---|---|---|
| Total PV Panels | 740 | 720 |
| Inverters (kVA) | 191 | 198 |
| Earth Pits | 18 | 9 |
| Lightning Arrester | 2 | 1 |
| AC Combiner | 2 | 1 |
| Months (2018) | Insolation (Whr/m2) | Temp (°C) | Energy (in MWhr) (P1) | Energy (in MWhr) (P2 + P3) |
|---|---|---|---|---|
| Jan | 3.548 | 13.531 | 16.65 | 19.1 |
| Feb | 4.293 | 20.72 | 27.27 | 26.78 |
| Mar | 5.888 | 27.725 | 33.68 | 35.06 |
| Apr | 6.373 | 33.307 | 29.89 | 34.86 |
| May | 6.503 | 38.149 | 35.33 | 36.76 |
| Jun | 6.078 | 38.746 | 29.82 | 29.74 |
| Jul | 3.954 | 31.963 | 24.51 | 23.63 |
| Aug | 3.725 | 28.192 | 22.72 | 22.83 |
| Sep | 4.507 | 26.82 | 26.5 | 25.78 |
| Oct | 5.005 | 23.368 | 29.56 | 29.41 |
| Nov | 3.94 | 18.587 | 23.38 | 23.87 |
| Dec | 3.553 | 13.467 | 22.6 | 24.05 |
| Average | 4.78 | 26.21 | - | - |
| Total Energy (in MWhr) | - | - | 321.91 | 331.87 |
| Months (2019) | Insolation (Whr/m2) | Temp (°C) | Energy (in MWhr) (P1) | Energy (in MWhr) (P2 + P3) |
|---|---|---|---|---|
| January | 3.607 | 13.392 | 22.21 | 22.54 |
| February | 4.104 | 17.762 | 22.87 | 20.99 |
| March | 5.716 | 23.786 | 33.17 | 31.45 |
| April | 6.404 | 33.707 | 32.29 | 33.28 |
| May | 6.698 | 38.194 | 36.79 | 37.23 |
| June | 5.873 | 39.918 | 29.78 | 30.95 |
| July | 4.648 | 30.895 | 26.51 | 26.29 |
| August | 4.584 | 28.936 | 27.67 | 29.27 |
| September | 3.575 | 27.353 | 19.84 | 21.24 |
| October | 4.264 | 23.223 | 23.68 | 26.96 |
| November | 3.526 | 19.025 | 19.17 | 21.56 |
| December | 2.733 | 12.341 | 17.58 | 18.63 |
| Average | 4.64 | 25.71 | - | - |
| Total | - | - | 311.56 | 320.39 |
| Months (2020) | Insolation (Whr/m2) | Temp (°C) | Energy (in MWhr) (P1) | Energy (in MWhr) (P2 + P3) |
|---|---|---|---|---|
| Jan | 2.987 | 12.072 | 18.92 | 20.2 |
| Feb | 4.722 | 15.016 | 26.59 | 28.52 |
| Mar | 5.135 | 22.96 | 27.75 | 33.1 |
| Apr | 6.169 | 30.705 | 30.53 | 17.09 |
| May | 6.572 | 36.015 | 34.04 | 27.17 |
| Jun | 4.987 | 34.978 | 26.52 | 27.86 |
| Jul | 4.497 | 30.133 | 25.79 | 26.99 |
| Aug | 4.367 | 29.0154 | 25.67 | 28.3 |
| Sep | 4.9 | 28.651 | 25.87 | 27.82 |
| Oct | 4.922 | 26.7 | 27.87 | 28.83 |
| Nov | 3.861 | 20.058 | 23.31 | 24.81 |
| Dec | 3.338 | 15.94 | 20.36 | 21.86 |
| Average | 4.70 | 25.18 | - | - |
| Total | - | - | 313.22 | 312.55 |
| Months | 2018 | 2019 | 2020 | |||
|---|---|---|---|---|---|---|
| Energy (MWhr) | %PR | Energy (MWhr) | %PR | Energy (MWhr) | %PR | |
| Jan | 35.75 | 70.53 | 44.75 | 85.83 | 39.12 | 93.14 |
| Feb | 54.05 | 98.38 | 43.86 | 81.78 | 55.11 | 86.55 |
| Mar | 68.74 | 81.83 | 64.62 | 78.28 | 60.85 | 82.38 |
| Apr | 64.75 | 73.33 | 65.57 | 73.1 | 47.62 | 55.7 |
| May | 72.09 | 76.58 | 74.02 | 77.44 | 61.21 | 65.02 |
| Jun | 59.56 | 70.82 | 60.73 | 74.71 | 54.38 | 79.18 |
| Jul | 48.14 | 85.23 | 52.8 | 79.25 | 52.78 | 82.83 |
| Aug | 45.55 | 85 | 56.94 | 87.37 | 53.97 | 86.66 |
| Sep | 52.28 | 82.89 | 41.08 | 83.74 | 53.69 | 78.18 |
| Oct | 58.97 | 81.43 | 50.64 | 83.25 | 56.7 | 79.9 |
| Nov | 47.25 | 86.44 | 40.73 | 83.03 | 48.12 | 90.35 |
| Dec | 46.65 | 92.03 | 36.21 | 92.6 | 42.22 | 88.34 |
| Average | - | 82.04 | - | 81.69 | - | 80.68 |
| Total | 653.78 | - | 631.95 | - | 625.77 | - |
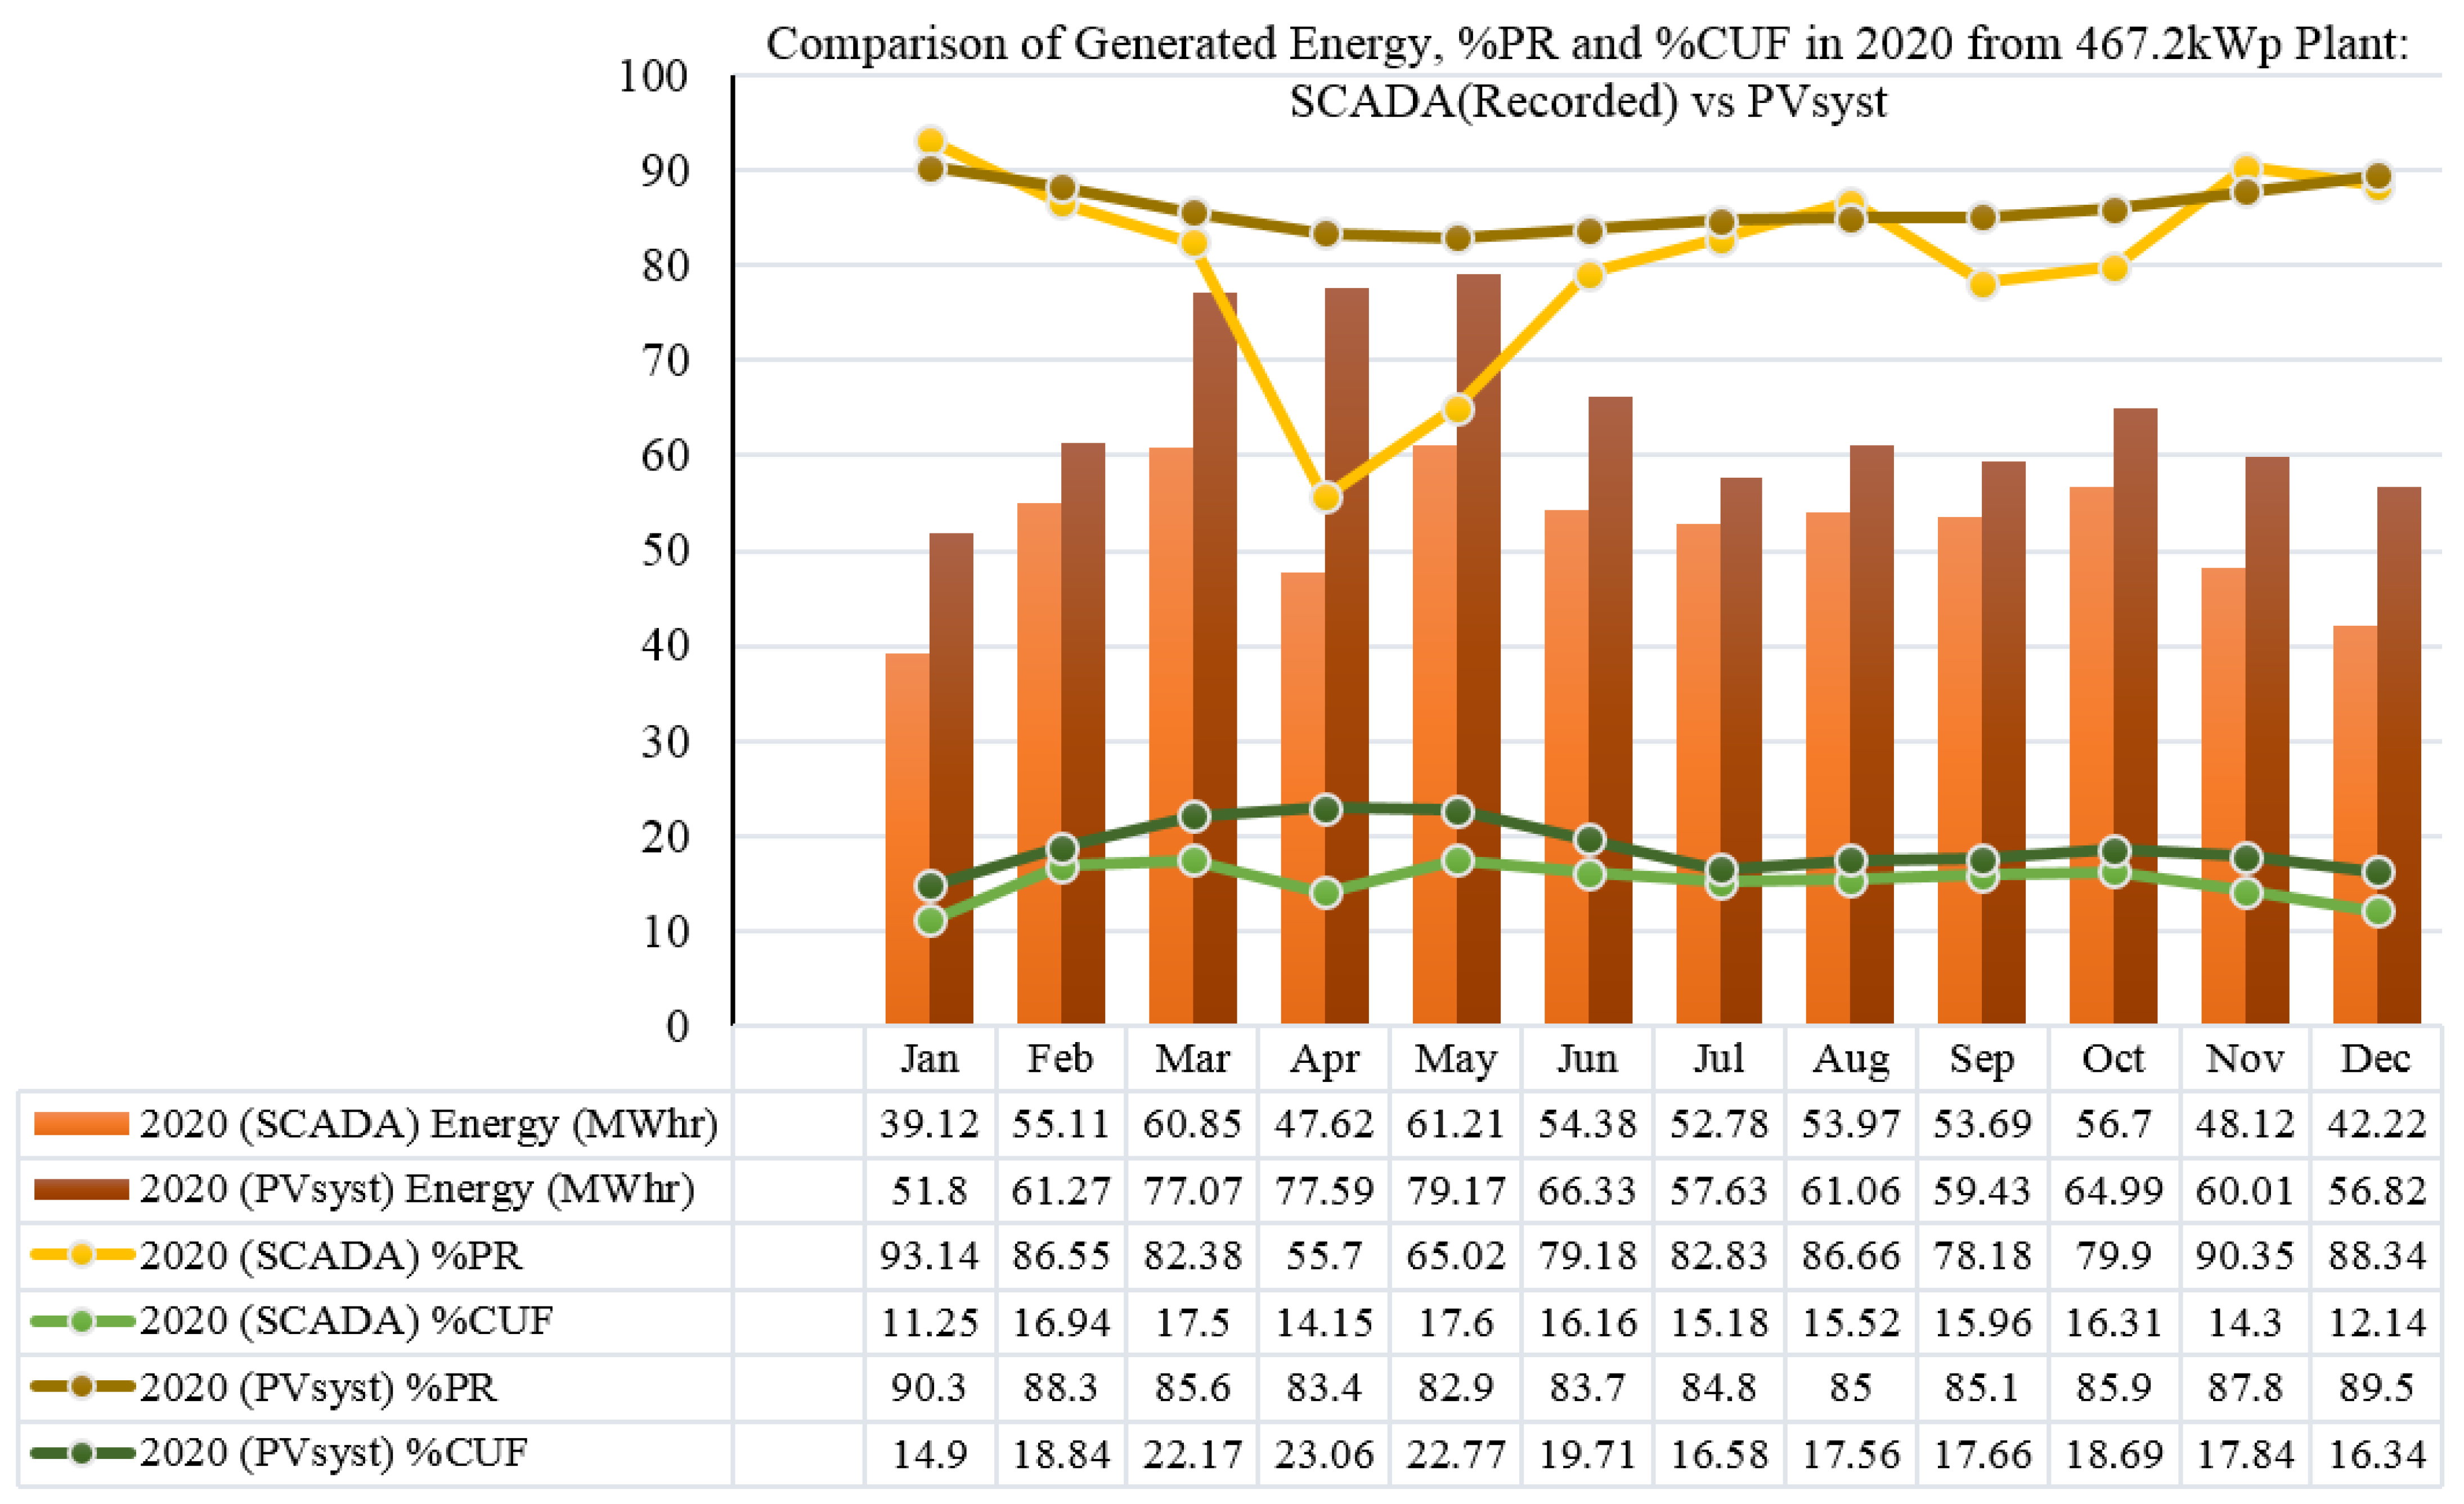
| Months | 2020 (SCADA) | 2020 (PVsyst) | ||||
|---|---|---|---|---|---|---|
| Energy (MWhr) | %PR | %CUF | Energy (MWhr) | %PR | %CUF | |
| Jan | 39.12 | 93.14 | 11.25 | 51.80 | 90.3 | 14.90 |
| Feb | 55.11 | 86.55 | 16.94 | 61.27 | 88.3 | 18.84 |
| Mar | 60.85 | 82.38 | 17.50 | 77.07 | 85.6 | 22.17 |
| Apr | 47.62 | 55.7 | 14.15 | 77.59 | 83.4 | 23.06 |
| May | 61.21 | 65.02 | 17.60 | 79.17 | 82.9 | 22.77 |
| Jun | 54.38 | 79.18 | 16.16 | 66.33 | 83.7 | 19.71 |
| Jul | 52.78 | 82.83 | 15.18 | 57.63 | 84.8 | 16.58 |
| Aug | 53.97 | 86.66 | 15.52 | 61.06 | 85.0 | 17.56 |
| Sep | 53.69 | 78.18 | 15.96 | 59.43 | 85.1 | 17.66 |
| Oct | 56.7 | 79.9 | 16.31 | 64.99 | 85.9 | 18.69 |
| Nov | 48.12 | 90.35 | 14.30 | 60.01 | 87.8 | 17.84 |
| Dec | 42.22 | 88.34 | 12.14 | 56.82 | 89.5 | 16.34 |
| Average | - | 80.68 | 15.25 | - | 86.02 | 18.84 |
| Total | 625.77 | - | 773.23 | - | ||
| Location | PV Type | System Size | Array Eff. (%) | Inverter Eff. (%) | System Eff. (%) | PR (%) | CUF (%) | Reference |
|---|---|---|---|---|---|---|---|---|
| Lucknow | p-si | 5 kWp | 11.34 | 88.38 | 10.02 | 76.97 | 16.39 | [19] 2018 |
| Roorkee | p-si | 1816 kWp | 12 | 97 | 8.7 | 63.68 | 13.85 | [20] 2016 |
| Ireland | p-si | 1.72 kWp | 14.9 | 89.2 | 13.3 | 81.50 | 10.10 | [21] 2011 |
| Ireland | p-si | 13 kWp | 7.5–10 | 87 | 6.0–9.0 | 60–62 | – | [25] 2006 |
| Spain | p-si | 200 kWp | 8.9 | 88.1 | 7.8 | 62.7 | – | [26] 2007 |
| Greece | p-si | 171.36 kWp | 8–11 | 89 | – | 67.36 | 15.26 | [27] 2009 |
| Singapore | p-si | 142.5 kWp | 13.7 | 94.8 | 11.2 | 81 | 15.7 | [28] 2012 |
| Thailand | p-si | 11 kWp | 11.2 | 93 | 10.41 | 73.45 | 14 | [29] 2012 |
| Turkey | p-si | 2.73 kWp | 9.54 | 96.8 | - | 72 | 23.2 | [30] 2013 |
| Karnataka | p-si | 3 MWp | 10.1–13.25 | 97 | – | 72 | 15.69 | [31] 2013 |
| Khatkar Kalan | p-si | 190 kWp | 10–14 | 95 | 8.3 | 74 | 9.27 | [32] 2013 |
| Abu Dhabi, UAE | p-Si p-Si m-Si | 111.4 kWp 50.4 kWp 215.7 kWp | 14.2 14.2 18.4 | 97.3 97.1 96.1 | - | 80 81 70 | - | [33] 2015 |
| Malaysia | p-si | 3 kWp | 10.11 | 95.15 | – | 77.28 | 15.7 | [34] 2015 |
| Algeria | p-si | 3.2 kWp | 13.72 | 88.1 | – | 64.3 | 20.41 | [35] 2015 |
| Norway | p-si | 2.07 kWp | 12.7 | 88.8 | 11.6 | 83.03 | 10.58 | [36] 2015 |
| Shivgangai, TN, India | TFa-Si | 5 MWp | 6.08 | 88.2 | 5.08 | 85.5–92.3 | – | [37] 2015 |
| Bhubaneswar | p-si | 11.2 kWp | 13.42 | 89.83 | 12.5 | 78 | 15.27 | [38] 2017 |
| Ås, Norway | mc-Si | 5 kWp | 11.46 | 98 | - | 74.59 | 12.69 | [39] 2019 |
| Jeddah, Saudi Arabia | mc-Si | 12.25 kWp | 21.49 | 96.318 | - | 78 | 22 | [40] 2019 |
| Kovilpatti, India | p-Si | 1 kWp | 12.14 | 95.6 | 11.07 | 78.48 | 17.99 | [41] 2019 |
| Haryana, India | p-Si | 186 kWp | 14.77 | 93.14 | 13.76 | 82.7 | 17.8 | [42] 2019 |
| Turkey | p-si | 2130.7 kWp | 14.1 | 98.8 | 13.18 | 81.15 | 18.86 | [43] 2020 |
| Adrar, South of Algeria | p-si | 20 MW | 15.1 | 98 | 10.82 | 71.71 | 20.76 | [44] 2020 |
| Serpong, South Tangerang | p-si | 10.6 kWp | 15.29 | 96.63 | 14.77 | 82.42 | 14.07 | [45] 2020 |
| East Poland | p-Si | 21.25 kWp | 15.4 | 97.8 | 14.5 | 80 | - | [46] 2020 |
| Kuantan, Malaysia | mc-Si | 20 MWp | 13–20 | 98 | 11.54 | 76.88 | 15.22 | [47] 2020 |
| Nouakchott, Mauritania | p-Si | 48 kWp | 11.22 | 84.60 | 9.49 | 77.76 | 19 | [48] 2021 |
| Our developed SPV power plant | p-si | 467.2 kWp | 16.49 | 98.7 (66 kVA) 98 (25 kVA) | 15.47 | 80.68 | 15.25 | Present study 2020 |
Publisher’s Note: MDPI stays neutral with regard to jurisdictional claims in published maps and institutional affiliations. |
© 2022 by the authors. Licensee MDPI, Basel, Switzerland. This article is an open access article distributed under the terms and conditions of the Creative Commons Attribution (CC BY) license (https://creativecommons.org/licenses/by/4.0/).
Share and Cite
Minai, A.F.; Usmani, T.; Alotaibi, M.A.; Malik, H.; Nassar, M.E. Performance Analysis and Comparative Study of a 467.2 kWp Grid-Interactive SPV System: A Case Study. Energies 2022, 15, 1107. https://doi.org/10.3390/en15031107
Minai AF, Usmani T, Alotaibi MA, Malik H, Nassar ME. Performance Analysis and Comparative Study of a 467.2 kWp Grid-Interactive SPV System: A Case Study. Energies. 2022; 15(3):1107. https://doi.org/10.3390/en15031107
Chicago/Turabian StyleMinai, Ahmad Faiz, Tahsin Usmani, Majed A. Alotaibi, Hasmat Malik, and Mohammed E. Nassar. 2022. "Performance Analysis and Comparative Study of a 467.2 kWp Grid-Interactive SPV System: A Case Study" Energies 15, no. 3: 1107. https://doi.org/10.3390/en15031107