Article

Study on the Homogeneity of Large-Size Blade Lithium-Ion Batteries Based on Thermoelectric Coupling Model Simulation

1
College of Mechanical Engineering, University of Shanghai for Science and Technology, Shanghai 200093, China
2
State Key Laboratory of Automotive Safety and Energy, Tsinghua University, Beijing 100084, China
3
Institute of Nuclear and New Energy Technology, Tsinghua University, Beijing 100084, China
*
Authors to whom correspondence should be addressed.
Energies 2022, 15(24), 9556; https://doi.org/10.3390/en15249556
Submission received: 9 November 2022 / Revised: 9 December 2022 / Accepted: 12 December 2022 / Published: 16 December 2022
(This article belongs to the Special Issue Advanced Application Technology of Lithium-Ion Batteries)

Abstract

:
To improve the energy density of lithium-ion battery packs, lithium-ion batteries are gradually advancing towards large-size structures, which has become one of the dominant development trends in the battery industry. With large-size blade lithium-ion batteries as the research object, this paper develops a high-precision electro-thermal coupling model based on the relevant parameters obtained through basic performance experiments, explores the mechanism of battery inhomogeneity from a simulation perspective, and further proposes a design management method. First of all, the optimal intervals of capacity and temperature, as well as the characteristics of the inhomogeneity distribution for large-size cells, are determined by essential performance and inhomogeneity tests; subsequently, the electrochemical and thermal characteristics of the large-size battery are described precisely through a 3D thermoelectric coupling mechanism model, and the inhomogeneity of the temperature distribution is obtained through simulation; eventually, the optimized cell connection method and thermal management strategy are proposed based on the validated model. As indicated by the findings, the above solutions effectively ease the inhomogeneity of large-size cells and significantly boost the performance of large-size cells under different operating conditions.

1. Introduction

Characterized by high energy and power densities, lithium-ion batteries are the workhorse currently among new energy vehicles [1,2]. In limited use spaces, such as electric vehicles, electric boats, and energy storage systems, batteries of higher energy density would be preferred [3]. To cater for this need, the energy density of lithium-ion batteries has to be increased. Researchers in the battery field have sought to increase the energy of the battery by developing higher specific energy cell materials [4], such as high nickel cathode materials [5], lithium metal cathode materials [6], silicon-carbon cathode materials [7], and solid electrolytes, as well as by optimizing the cell and pack structures to increase the energy density of monoblocks and battery packs. In recent years, Panasonic has introduced 21,700 and 4680 cylindrical batteries, with a gradual shift in cell diameter and length to larger cell sizes. Due to the peculiarities of large-size cell structures, cells tend to have inhomogeneous properties in the large-size order, which severely impacts the power performance and durability of the batteries. Therefore, it is essential to understand the inhomogeneity mechanism and accurately model it for the state estimation and management of Li-ion batteries.
Inhomogeneity can be found universally in lithium-ion batteries. It is generally present between solid phase particles [8], in the direction of electrode thickness [9] and between the electrode and electrode, triggering inhomogeneous degradation within the battery after a few cycles. Zhang et al. [10] observed that the current distribution is inhomogeneous along the length of the cell, resulting in an inhomogeneous concentration distribution of lithium-ions in phases and inhomogeneous potential distribution [11]. Mühlbaue et al. [12] found that the state of charge (SOC) on the negative surface could vary by up to 10% at larger charging rates. Osswald et al. [13] experimentally demonstrated that the difference in negative electrode potential was up to 515 mV under high magnification discharge conditions, which seriously affected the durability of the battery. The internal and ambient temperature fields of the battery may also exhibit inhomogeneities, due to the inconsistency between internal heat generation and external heat dissipation [14]. As a result of the structure-specific nature of large-size batteries, inhomogeneities in current density, SOC, and temperature, as described above [15], will further affect the homogeneity of mechanical deformation under charge and discharge conditions of large-size Li-ion batteries [16] and lead to the problem of inhomogeneity in the pressure fields within the electrode surface [17]. In general, during the charging and discharging process, physical fields, including pressure, current density, and temperature, will be distributed inhomogeneously. Additionally, this will result in an inhomogeneous distribution of solid-phase and liquid-phase lithium-ion concentrations and potentials, which affects the battery power performance. As the size of the cell structure increases further, the inhomogeneous distribution of multiple physical fields will have a more significant impact on the battery power [18,19].
The durability of the battery is further affected by the uneven degradation within the battery [20]. The rate of the aging decay rate of the battery is closely related to the charge/discharge rate, the internal temperature of the cell, the SOC operating range, and the internal mechanical pressure of the cell [18]. Mussa et al. [21] found that the aging of the positive and negative electrode materials at different locations within the cell was inconsistent through disassembly of the shell battery, with the aging of the electrode materials at the bends being the most severe. The P2D model is one of the most prominent ways to model the mechanism of the lithium-ion battery, which can accurately realize the state of charge and lithium-ion distribution and kinetic processes in lithium-ion batteries, and scholars have conducted a series of studies on this subject [1,2,3]. Based on the results of model simulation, Arunachala et al. [22] developed an electrochemical model and suggested that the current and temperature inhomogeneity would cause local abuse, which, as a result, would worsen the inhomogeneity of the degree of aging within the battery and could eventually cause localized abuse failure over a large area, accelerating the aging process of the battery. Cannarella et al. [23,24] observed, in locally closed-hole regions fabricated on diaphragms, that the lithium precipitation area of the negative graphite electrode increased with cycling due to local concentration of current density. Some scholars constructed two-dimensional models considering the failure behavior of local abuse caused by mechanical–electrochemical–thermal inhomogeneities. Erhard et al. [13] developed a battery thermoelectric coupling model taking into account the spatial distribution to realize the simulation of potential, temperature, and pressure distribution characteristics inside the battery under different operating conditions and identified inhomogeneities of these quantities of states in the spatial distribution. In contrast, Zhu et al. [25] established a simulation model of localized lithium precipitation abuse in batteries triggered by localized temperature hot spots, but the accuracy and robustness of this model lacks experimental verification, due to the absence of intuitive data on the performance of large-size batteries in actual use (that is, the capacity, internal resistance, entropy heat coefficient, specific heat capacity, and thermal conductivity).
In summary, inhomogeneous properties induced by multi-physical fields and different battery structures lead to inhomogenous aging within the battery, even triggering local abuse failure and accelerating the aging process. This problem will become more pronounced as the battery size grows. It emphasizes the necessity to analyze the non-homogeneous characteristics of batteries from multiple perspectives, including experimental tests, mechanism research, and model building. In this paper, conducting basic tests on large commercial batteries, such as the single cell capacity and entropy thermal coefficient, the performance of non-homogeneity of large-size batteries under constant current charge and discharge conditions is highlighted. Meanwhile, the non-homogeneity temperature distribution of large-size batteries is also analyzed and summarized. Based on the pseudo-two-dimensional (P2D) model, a three-dimensional thermoelectric coupling model is constructed, and its accuracy is verified at various temperatures and charge/discharge rates. Based on the verified three-dimensional thermoelectric coupling model, the mechanism of large-size battery inhomogeneity causation and the structural optimization and management methods to alleviate large-size battery inhomogeneity are proposed, and a comparison of the inhomogeneity distribution of the cells before and after optimization is made.

2. Theoretical Analysis

2.1. Pseudo Two-Dimensional (P2D) Model

The mechanistic model used in this paper is built based on the pseudo-two-dimensional (P2D) model developed by Doyle and Newman et al. [26,27]. The P2D model can accurately realize the lithium-ion distribution states and kinetic processes in Li-ion batteries, thus accurately simulating the electrochemical characteristics of Li-ion batteries under different temperatures and C-rate charging. The electrochemical control equations are as follows.
The detailed charge conservation equation in solid and liquid phases is given below. The charge balance equation in the solid phase follows Ohm’s law, as shown in Equation (1). In this equation, σ s e f f is the effective conductivity of the solid phase, ϕ s denotes the potential of the solid phase, as represents the specific interface area of the particle, F is the Faraday constant, and j denotes the current density. The charge balance equation in the liquid phase is demonstrated in Equation (2). In this equation, κ e e f f represents the effective conductivity of the electrolyte, ϕ e is the electrolyte potential, R denotes the gas constant, T is the cell temperature, t+ is the number of lithium-ions transferred, and ce is the lithium-ion concentration in the electrolyte.
x σ s e f f x ϕ s a s F j = 0
x κ e e f f x ϕ e + 2 R T t + 1 F x κ e e f f x ln c e + a s F n = 0
In the solid-liquid two-phase matter conservation equation, the matter conservation of lithium-ions in the active electrode material is described by Fick’s law, as indicated in Equation (3). Cs refers to the solid-phase concentration of lithium-ions in the particles, Ds denotes the solid-phase diffusion coefficient, and r represents the particle radius. The lithium-ion concentration distribution in the electrolyte is presented in Equation (4). In this equation, ε e is the volume fraction of the electrolyte, and D e e f f refers to the effective diffusion coefficient in the electrolyte.
c s t D s r 2 r ( r 2 c s r ) = 0
t ( ε e c e ) = x ( D e eff x c c ) + ( 1 t + ) a s j
In the solid-liquid two-phase lithium-ion concentration distribution equation, the distribution of lithium-ion concentration diffusion process in both solid-liquid phases satisfies Fick’s second law, as shown in Equations (5) and (6). In these two equations, Ds is the solid-phase diffusion coefficient of lithium-ions, ε e represents the volume fraction of electrolyte, and D e e f f refers to the effective diffusion coefficient of the liquid phase.
c s t D s r 2 r ( r 2 c s r ) = 0
t ( ε e c e ) = x ( D e e e f x c e ) + ( 1 t + ) a s j n
In the kinetic equations for the electrochemical reaction at the two-phase interface, for the intercalation reaction of lithium at the cathode and anode, the local current density in the active material region satisfies the Bulter–Volmer (BV) equation, as can be seen in Equation (7). In the equation, i0 refers to the current exchange density, αa and αc stand for the anodic transfer coefficient and cathodic transfer coefficient, respectively, and η represents the reaction overpotential.
j n = i 0 [ exp ( α a F η R T ) exp ( α c F η R T ) ]

2.2. Li-Ion Battery Heat Production and Heat Transfer Model

It can be observed from the P2D model that the equilibrium potential of the battery is strongly influenced by temperature. The charging and discharging process of the battery is accompanied by heat absorption and exothermic phenomena, which affect the performance of the battery potential. Therefore, to establish a more accurate mechanism model to characterize Li-ion batteries under different operating conditions, further coupling of the heat generation and heat transfer equations of the battery is needed.
In the lithium-ion battery heat production equation, according to the literature [28,29,30,31] on the thermal model of lithium-ion batteries, the lithium-ion battery heat production Q is mainly divided into two types, namely reversible heat Qrev and irreversible heat Qirrev, as shown in Equation (8). Reversible heat Qrev is the energy absorbed or released by the lithium intercalation material during lithium intercalation and deintercalation. Its value is proportional to the entropy heat coefficient of the electrode, which is also known as the reaction heat Qrea, as demonstrated in Equation (9). The irreversible heat, on the other hand, is divided into ohmic heat Qohm and polarization heat Qact. The ohmic heat Qohm refers to the heat production when electrons and lithium-ions collide with the transport medium during the internal transport of the battery, as shown in Equation (10).
Q = Q rev + Q irrev = Q rea + ( Q ohm + Q act )
Q rea = a s F j n T d U d T
Q o h m = σ s e f f ( ϕ s x ) 2 + σ e e f f ( ϕ e x ) 2 + 2 σ e e f f R T F ( 1 t + ) ln c e x ϕ e x + I ( t ) R c
Qact, the heat of polarization, then refers to the heat of the activation energy barrier that needs to be broken to change the equilibrium state of the electrode embedded lithium, as shown in Equation (11). Since Equation (11) contains an overpotential term, the heat of polarization is coupled to the BV equation, and the heat of polarization is related to the potential two-phase distribution and the electrochemical reaction at the two-phase interface.
Q act = a s F j n ( ϕ s ϕ c U F j n R SEI )
The heat transfer equation of a lithium-ion battery depends not only on the heat generated by itself, but also on the heat dissipation in the environment, as shown in Equation (12), which is the heat transfer equation of the battery, also known as the energy conservation equation. In this equation, ρ represents the density of the battery, Cp denotes the specific heat capacity of the battery, h is the convective heat transfer coefficient of the battery surface, and Text refers to the ambient temperature. This equation states that the rate of temperature change of the battery is equal to the difference between the rate of heat production and heat dissipation of the battery.
ρ C p T t = Q h A s ( T e x t T )

3. Experimental Setup

In this study, a commercial prismatic power battery with a nominal capacity of 135 Ah was adopted, with LiFPO4 as the cathode and graphite as the negative electrode. In the subsequent basic performance test, the ambient temperature would have to be adjusted according to operating conditions. The SC-360-CC-3 large-size temperature chamber from SANWOOD Technology was applied as the explosion-proof temperature chamber for battery experiments, and the CE-7004-100V300A-R28GC power battery test system produced by Neware was adopted.

3.1. Basic Performance Testing of Large-Size Lithium-Ion Batteries

A total of 12 thermocouples (type GG-KK-36-SLE manufactured by ETA) were arranged on the front and back of the battery to record temperature changes at different locations, as shown in Figure 1. There were 9 thermocouples on the front and back of the battery, namely 2, 3, 9, and 10 near the positive and negative lugs, 8 and 4 at 1/4 and 3/4 of the length of the battery, 5, 6, and 7 at 1/2 of the length of the battery, and 1 and 11 at the center of the positive and negative battery lugs, as shown in Table 1.
In order to study the effect of temperature and multiplier on the capacity of large-size batteries, the experiments in this section included four temperature and six charge-discharge rate conditions, each consisting of a charge capacity test and a discharge capacity test and all adopting constant current (CC) charging and discharging methods, as shown in Table 1.
Following the capacity test, the standard capacity of the battery at each temperature was tested, and the standard capacity test was measured with the 1/3C CC-CV work step.

3.2. Experimental Calibration of Thermoelectric Coupling Model Related Parameters

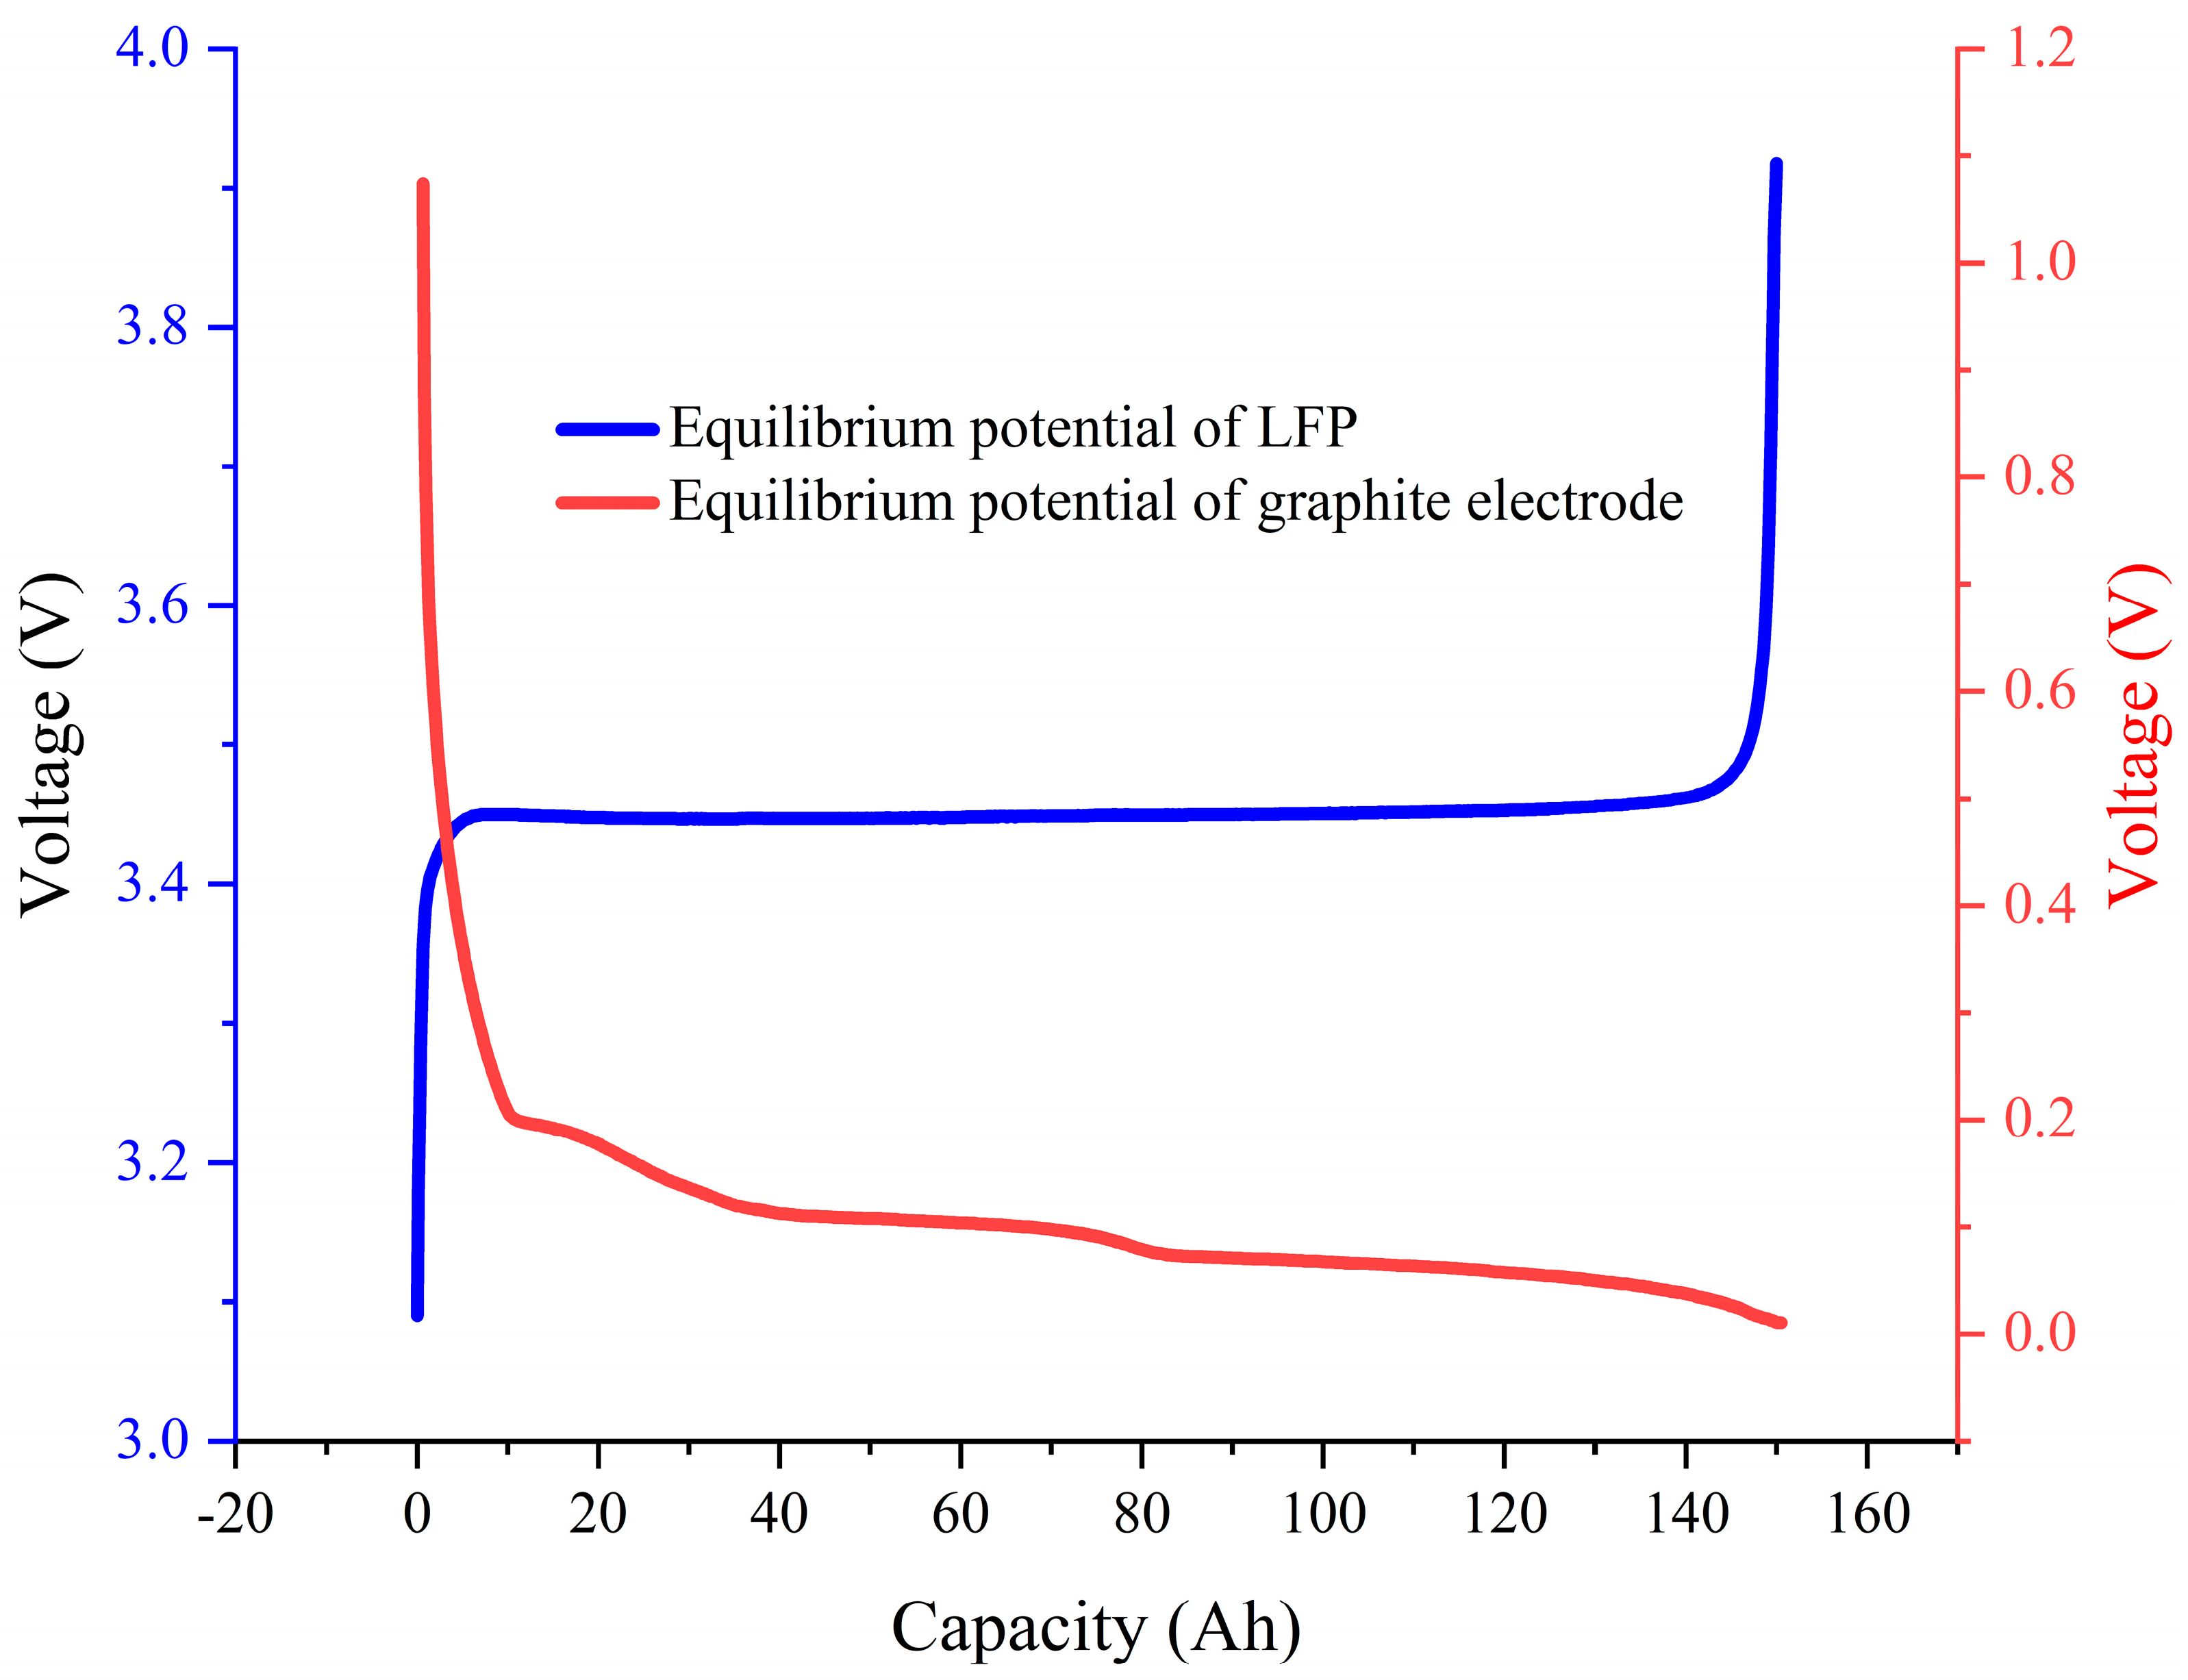
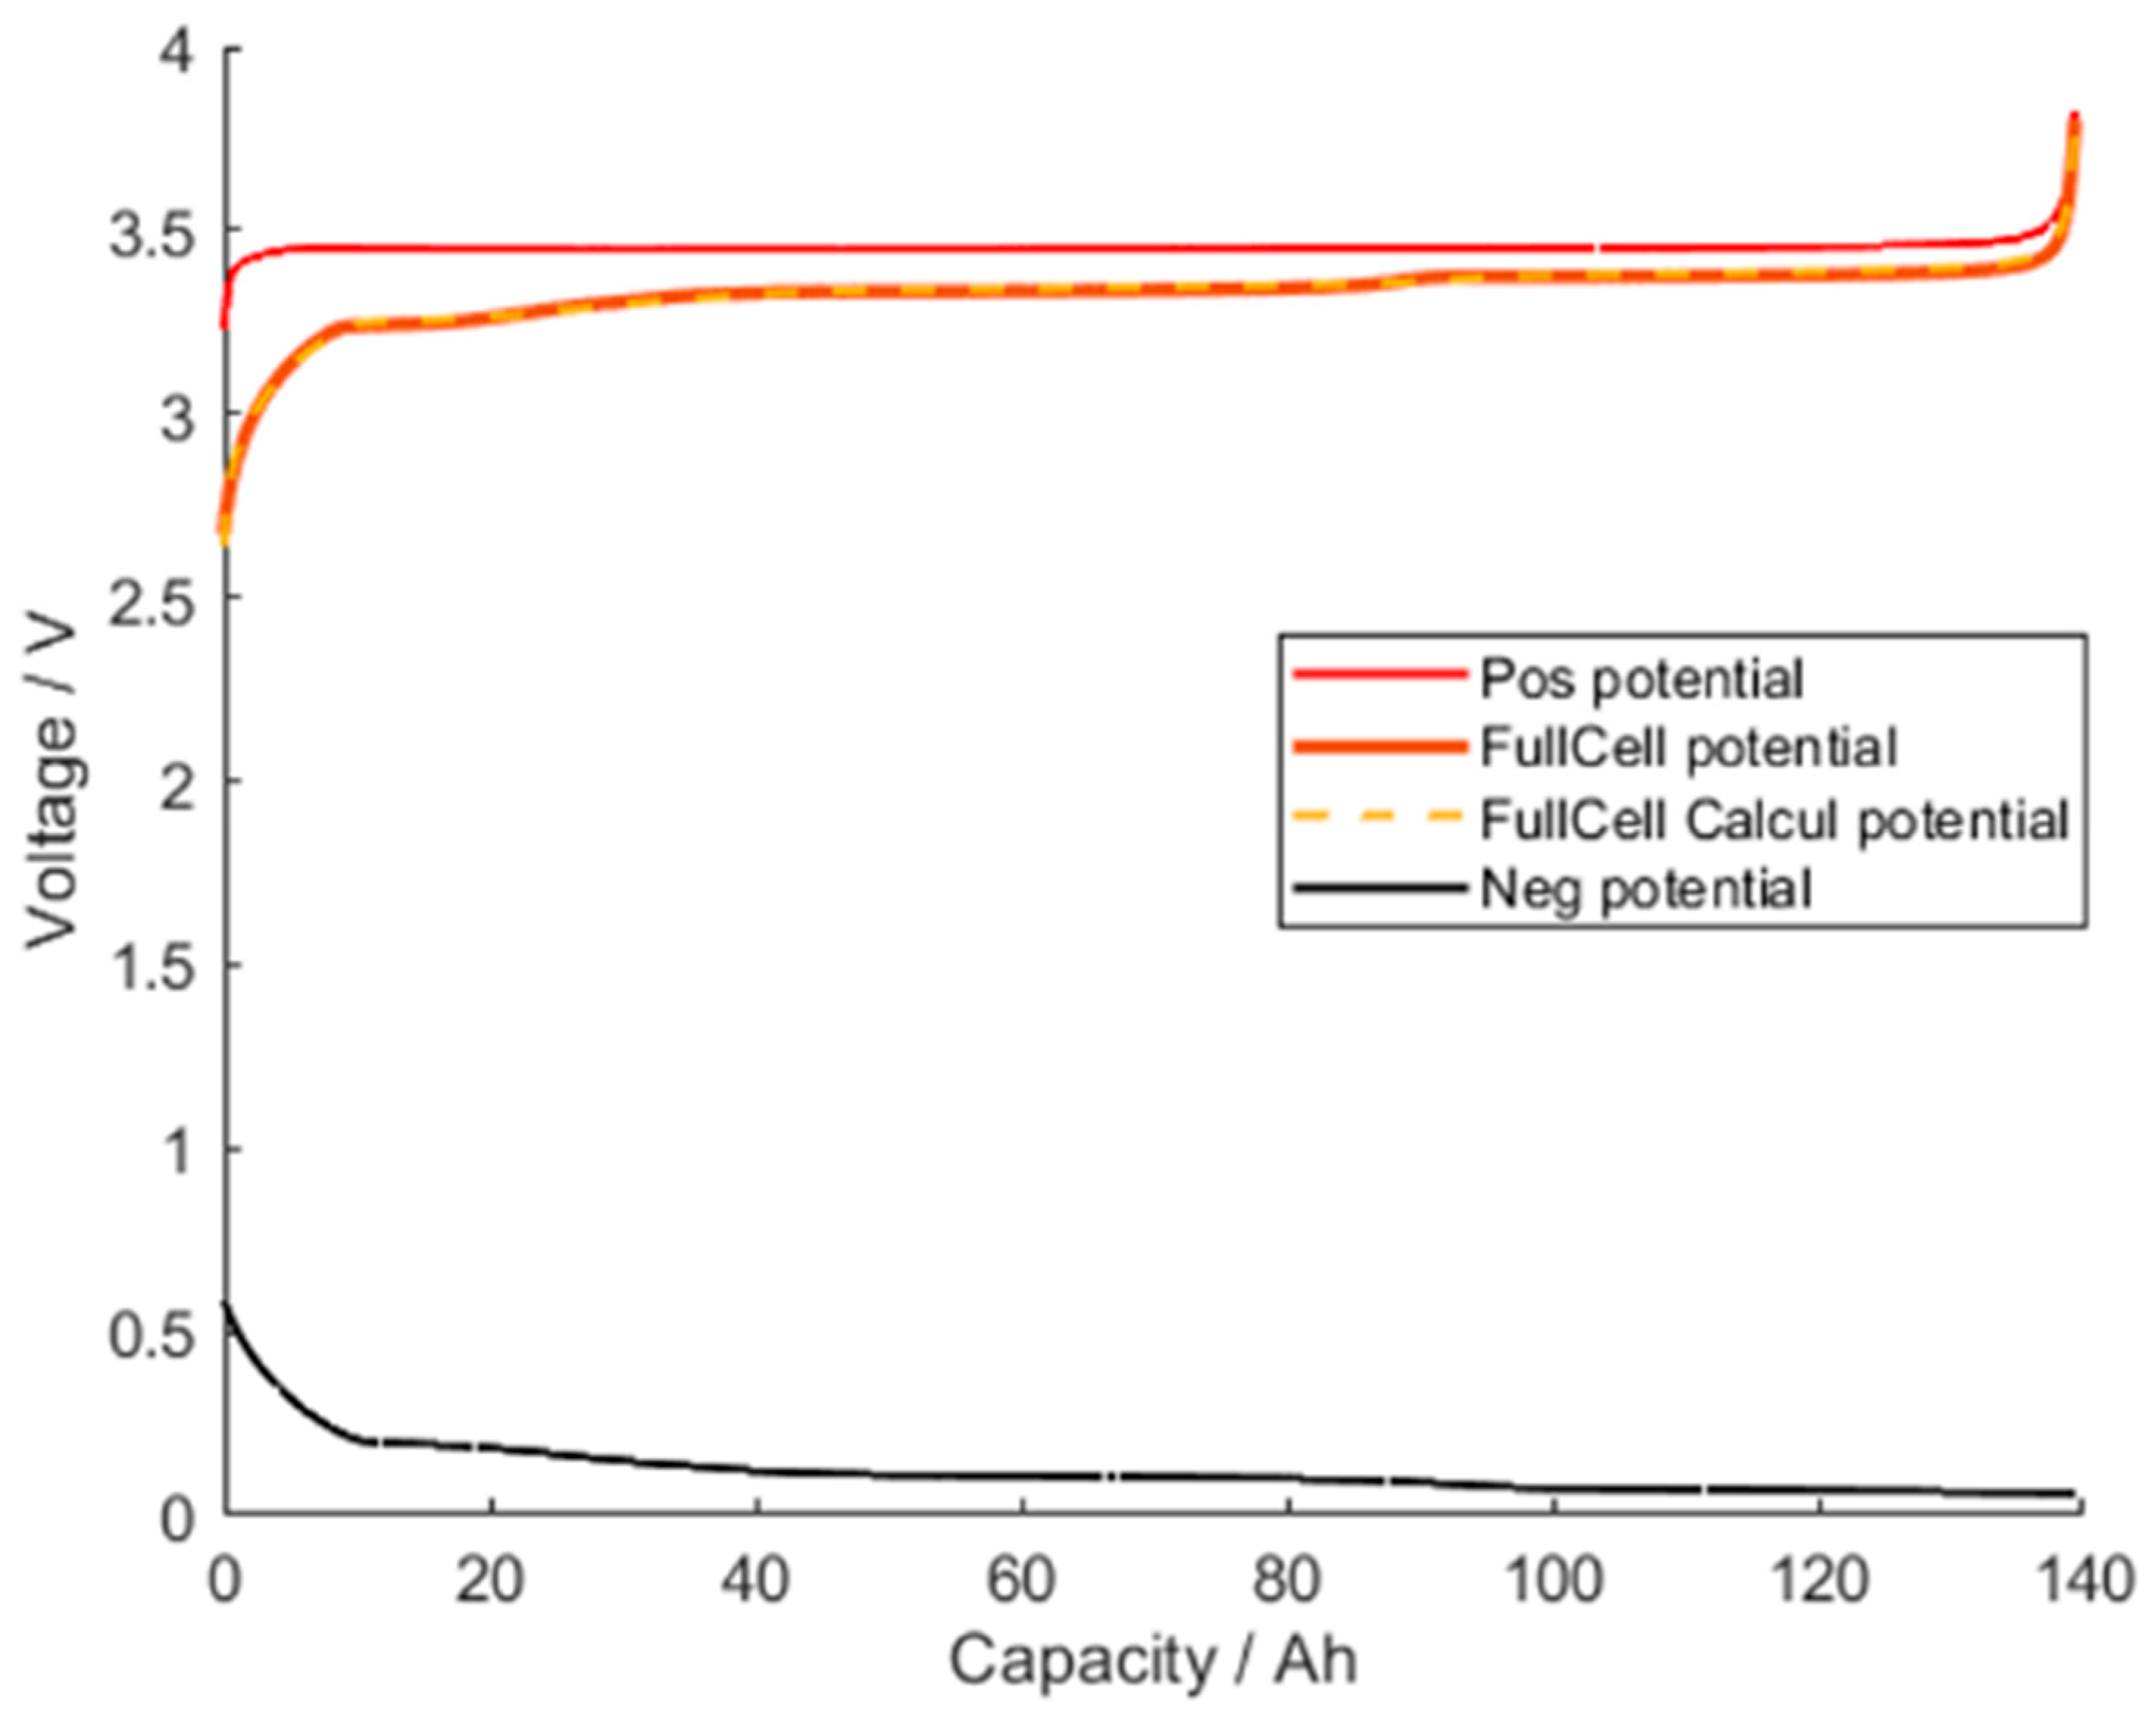
3.2.1. Equilibrium Potential of Positive and Negative Electrodes and Acquisition of Monomer OCV Curve

In order to obtain an equilibrium potential between the positive and negative electrode materials, it is necessary to fabricate positive-lithium metal button cells and negative-lithium metal button cells. Prior to fabrication of the button cells, the electrode sheet and diaphragm were treated as follows. The disassembled positive and negative electrode sheets and fresh PP diaphragms (produced by Clutech) were transferred to an argon environment glove box with a water content of less than 0.1 ppm. The positive and negative plates and the diaphragm on the side with the active substance removal were cut into discs 12 mm and 19 mm in diameter, respectively. To remove lithium salts and impurities from the surface of the electrodes, the punched round electrodes were soaked in a vial of DMC (dimethyl carbonate) solution for 3 to 6 h, which were then removed and dried. The punched round diaphragms were transferred to an oven for 12 h. The treated electrodes and diaphragms were stacked as follows. First of all, the positive/negative electrodes of the large-size cell were placed on top of the positive shell, with an inner diameter of 19 mm, and then the diaphragm was placed on top of the positive electrode. The diaphragm was placed on top of the positive electrode sheet, and 3–5 drops of 1.0 mol LiPF6-EC:EMC: DMC (1:1:1) electrolyte were added. The lithium metal sheet of 16 mm diameter metal sheet-metal spacer-funnel type shrapnel was placed on top of the diaphragm in sequence, and finally, the negative shell was covered and pressed with a press.
The fabricated sets of positive-lithium metal and negative-lithium metal button cells were placed in the button cell test machine at a temperature of 25 °C for more than 12 h to allow the electrolyte to fully infiltrate the active material of the button cell. Afterwards, the positive and negative coin cells were tested with a charge/discharge current of 2 mA (approximately 0.05 C–0.07 C in proportional conversion), and the results of the equilibrium potential of positive and negative materials can be seen shown in Figure 2.

3.2.2. Identification of Electrode Parameters Based on the Dual Water Tank Model

In the subsequently constructed thermoelectric coupling model, the theoretical capacity of the electrode material and the electrode SOC operating interval would be specified, and the cell OCV would be calculated by the model based on the initially set interpolation values, so the above parameters would have to be determined by our previously proposed dual water tank model [32,33].
The capacity of CFullcell as a single cell corresponds to the test data of the single cell in Section 3.1 and to the test data of positive and negative button cells in Section 3.2.1, respectively, with the charging current I set to 1/20C, and the identification results are shown in Figure 3.
The maximum concentration of embedded lithium in the positive and negative materials and the total area of active materials are calculated by Equations (13) and (14), based on the theoretical capacity of the positive and negative materials determined from the dual tank model. In these equations, Capneg/pos is the theoretical capacity of positive and negative electrodes, 3600 refers to the conversion of capacity unit Ah to charge unit Coulomb (C), F denotes the Faraday constant, εs, neg/pos represents the volume fraction of solid phase, and Lneg/pos represents the thickness of active material (as indicated by Table 2). As represents the total area of active material, Wcell and Hcell represents the width of large-size cell, nlayers denotes the number of positive electrodes, and since each electrode has active material on the front and back side, the number of electrodes needs to be multiplied by 2 when calculating the total area of active material.
c s , n e g / p o s , m a x = 3600 · C a n e g / p o s F ε s , n e g / p o s A s L n e g / p o s
A s = 2 W b a t t H b a t t n l a y e r s

3.3. Experiment of Acquiring Parameters of Thermoelectric Coupling Model

3.3.1. Measurement of Basic Parameters of Thermal Physical Properties

The monomer entropy heat factor ΔE/ΔT (mv/K) exerts a significant impact on the cell heat generation model and a test of the monomeric heat coefficient of the large-sized cell is required. Based on the results of our previous work [34], the obtained cell monomer entropy heat coefficients are demonstrated in Figure 4. To accurately address the coupling between the electrochemical and thermal properties in the mechanism model, it is also essential to understand the relationship between the entropy-heat coefficient of the dU/dT electrode material and SOC of the electrode. Since the measurement of material entropy heat coefficients requires a high level of experimental methodology and accuracy, this paper provides the entropy heat coefficients for graphite and LFP materials based on those obtained from the COMSOL Multiphysics®® (version 5.4) large-size battery materials library.
The diffusion coefficients of electrolyte De and electrolyte ion conductivity κe are affected by temperature T and electrolytic lithium-ion concentration c at various points inside the cell. The electrolyte parameters obtained based on references [29,35] and parameters of the material library with suitable modifications are presented in Equations (15) and (16) hereafter.
D e = 10 8.43 54 T 5 × 10 3 × c 299 2.2 × 10 4 × c
κ e = ( 10.5 + 0.074 T 6.96 × 10 5 T 2 + 6.68 × 10 4 c 1.78 × 10 5 c T + 2.8 × 10 8 c T 2 + 4.94 × 10 7 c 2 8.86 × 10 8 c 2 T 2 ) × 10 6 c
In the solid heat transfer model, the monomer, specific heat capacity of each part of the material, thermal conductivity, and heat transfer coefficient can significantly affect heat generation at each point of the cell, and the parameters of this part were calibrated according to Refs. [34,36,37] and the experimental results, as detailed in Table 2.

3.3.2. Electrochemical Model Parameters Determination

According to the P2D model, up to twenty-five parameters from the coupled multi-physics field model have diverse and complex sources. Currently, the main categories are cell design parameters, ion transport characteristics parameters, and interface reaction kinetics parameters. In order to improve the accuracy of the model and the modeling cost, the model parameters should be obtained experimentally whenever possible to reduce the number of post-calibrations. In this paper, the parameters are mainly accessed through disassembly measurements, experimental tests, parameter identification, and literature references. Combined with the previous work [34], the relevant parameters of the electrochemical model can be seen in Table 2.

4. Results and Discussion

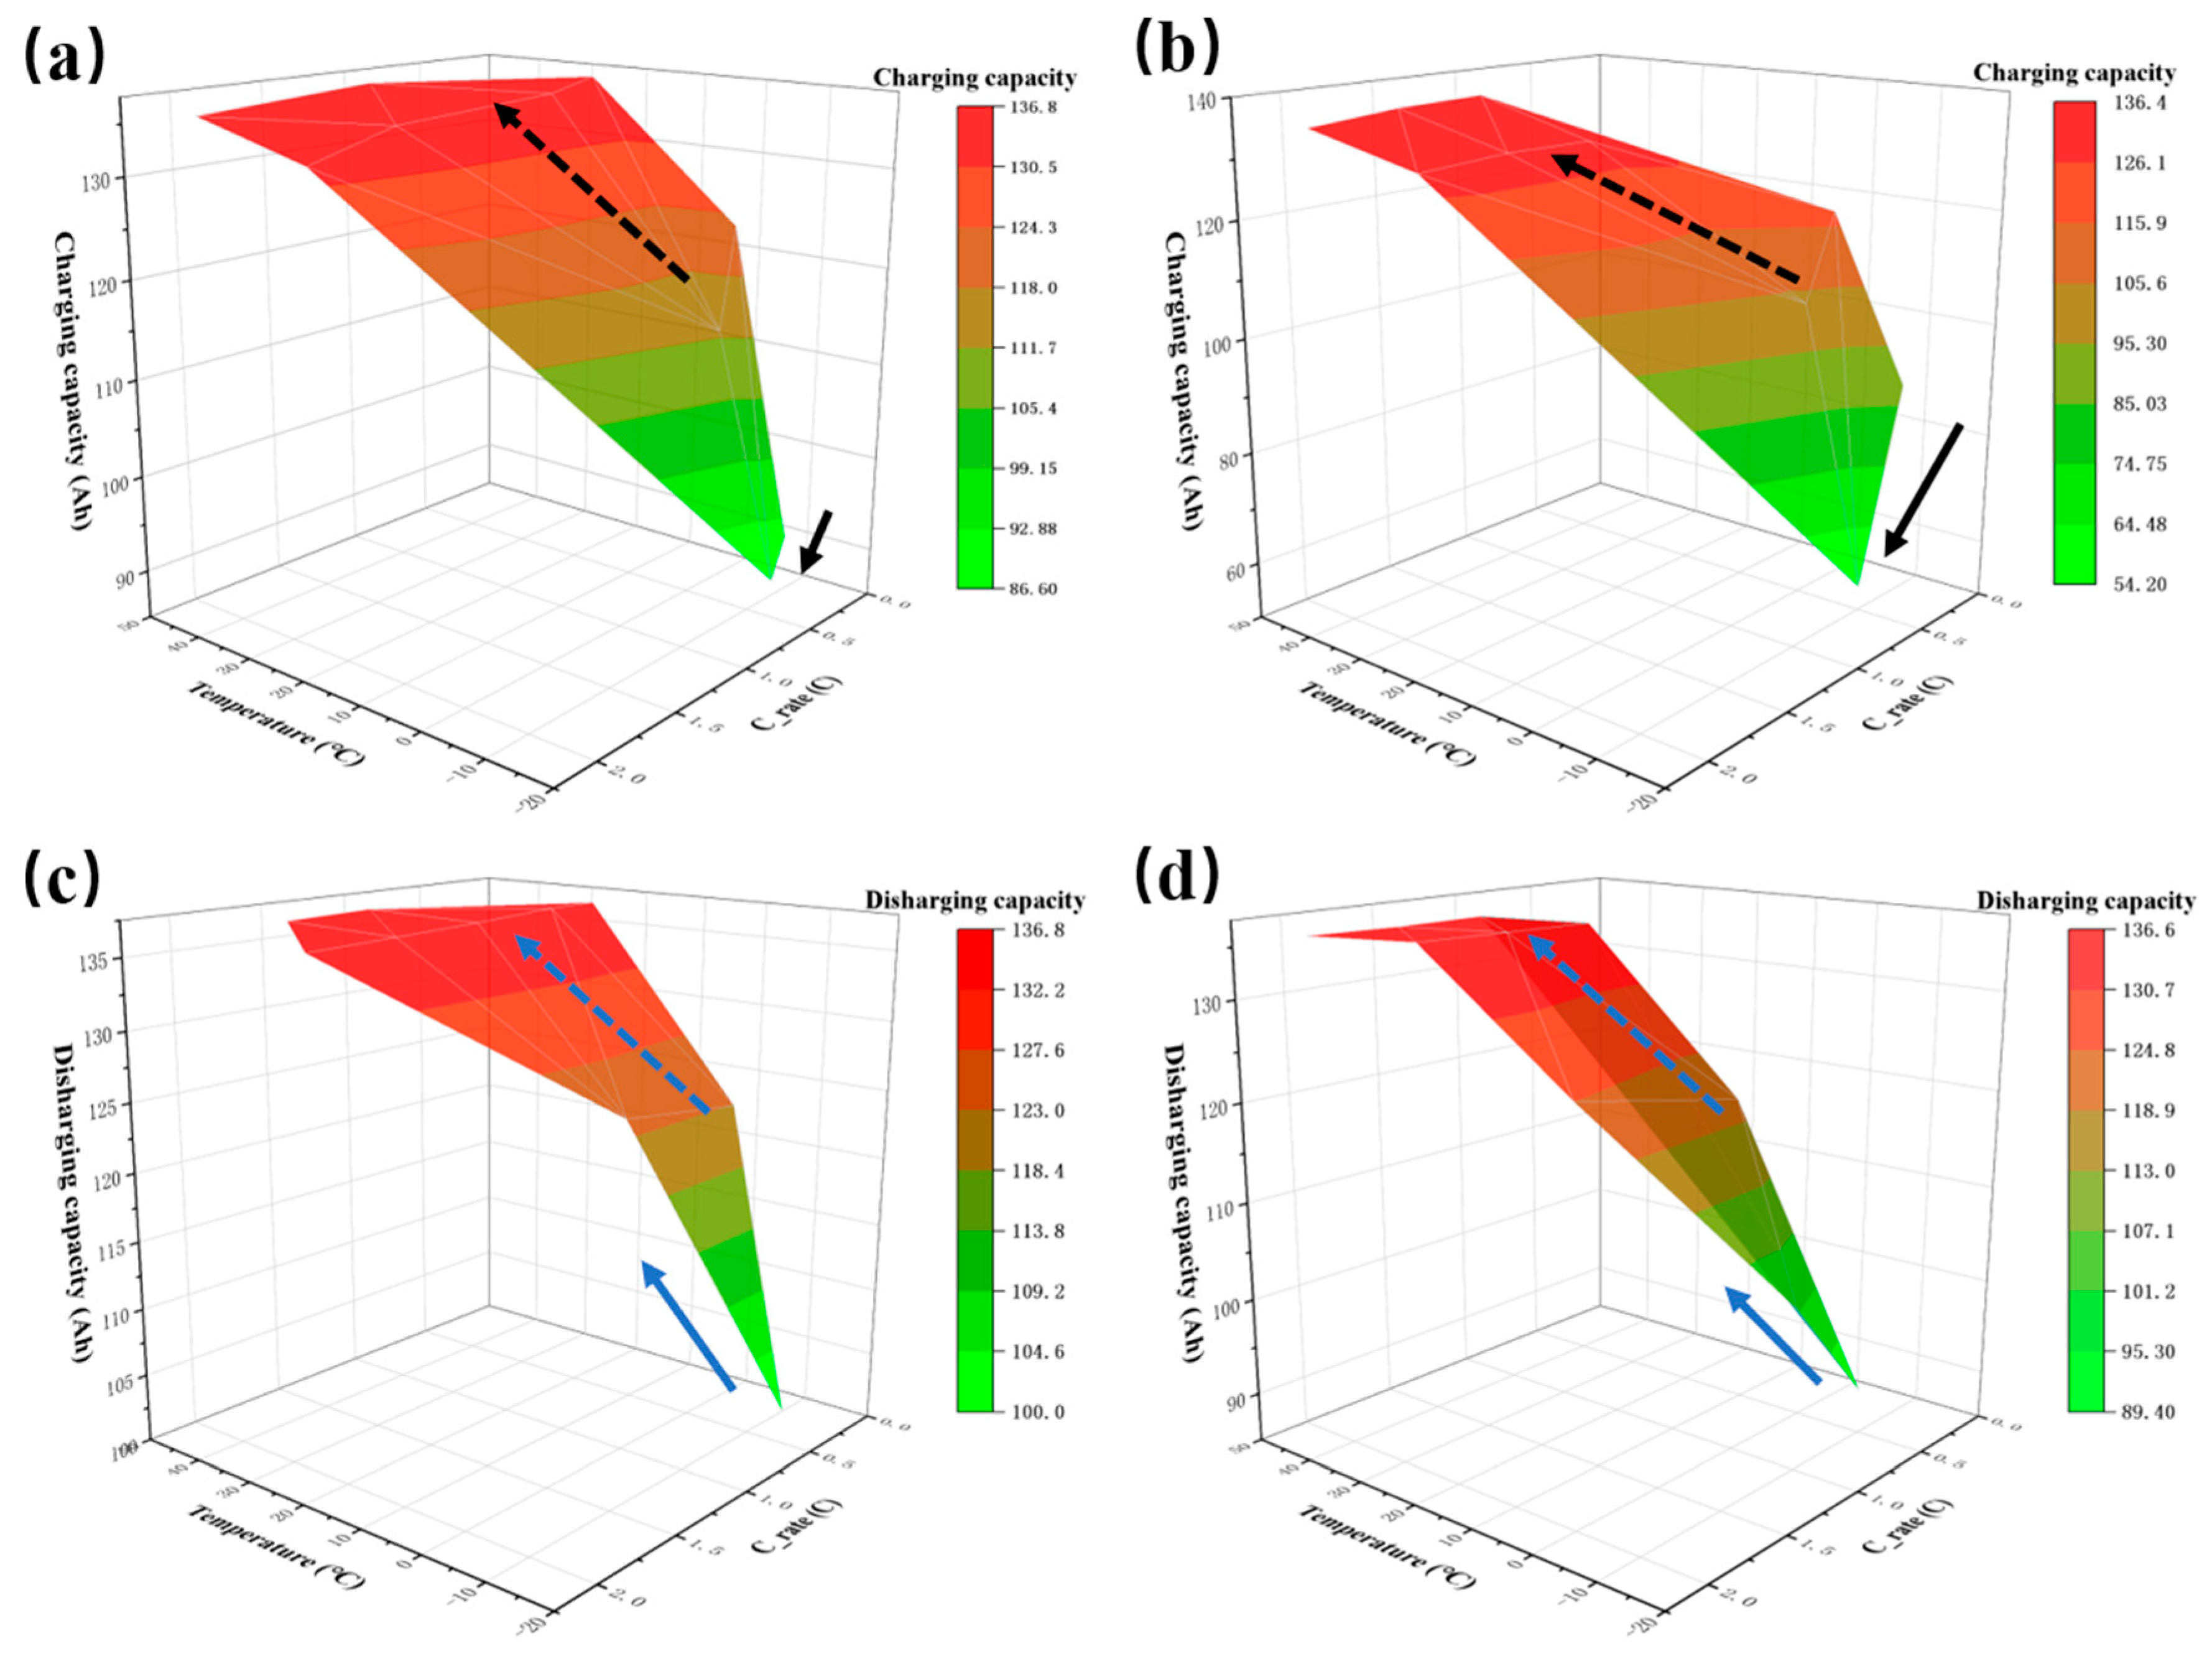
4.1. Experimental Test Results of Basic Performance of Large-Size Batteries

As shown in Figure 5, the results of the two capacity tests in Section 3.1 are graphically presented by a capacity charge/discharge rate temperature 3D plot. Additionally, the findings can be reached as follows.
(1) The influence of temperature on charging and discharging capacity can be substantial, especially when the temperature falls below 0 degrees, and both the discharging and charging capacity are significantly reduced. In contrast, temperatures above 25 °C, such as the room temperature, exert little influence on the capacity of this large-size battery.
(2) Generally, the optimum range of temperature for battery capacity performance is expected to be between 25 °C and 45 °C, while the optimum range of charge/discharge rate is between 0.2 C and 1.5 C.
(3) In addition, it can be found in Figure 5a,b that the charging capacity decreases when the low-temperature charging rate increases (solid black arrows in the figure), while the discharging capacity increases slightly when the low-temperature discharge rate increases in Figure 5c,d (solid blue arrows in the figure). These results indicate that, when designing a low temperature charging strategy for this large-size battery, slow charging at low multiples is preferred and common methods, such as coolant heating, heat pipe heating, and AC heating, to increase the battery temperature should be adopted when large-size batteries have to work in low temperature conditions, as this will help the battery to perform at a higher range.

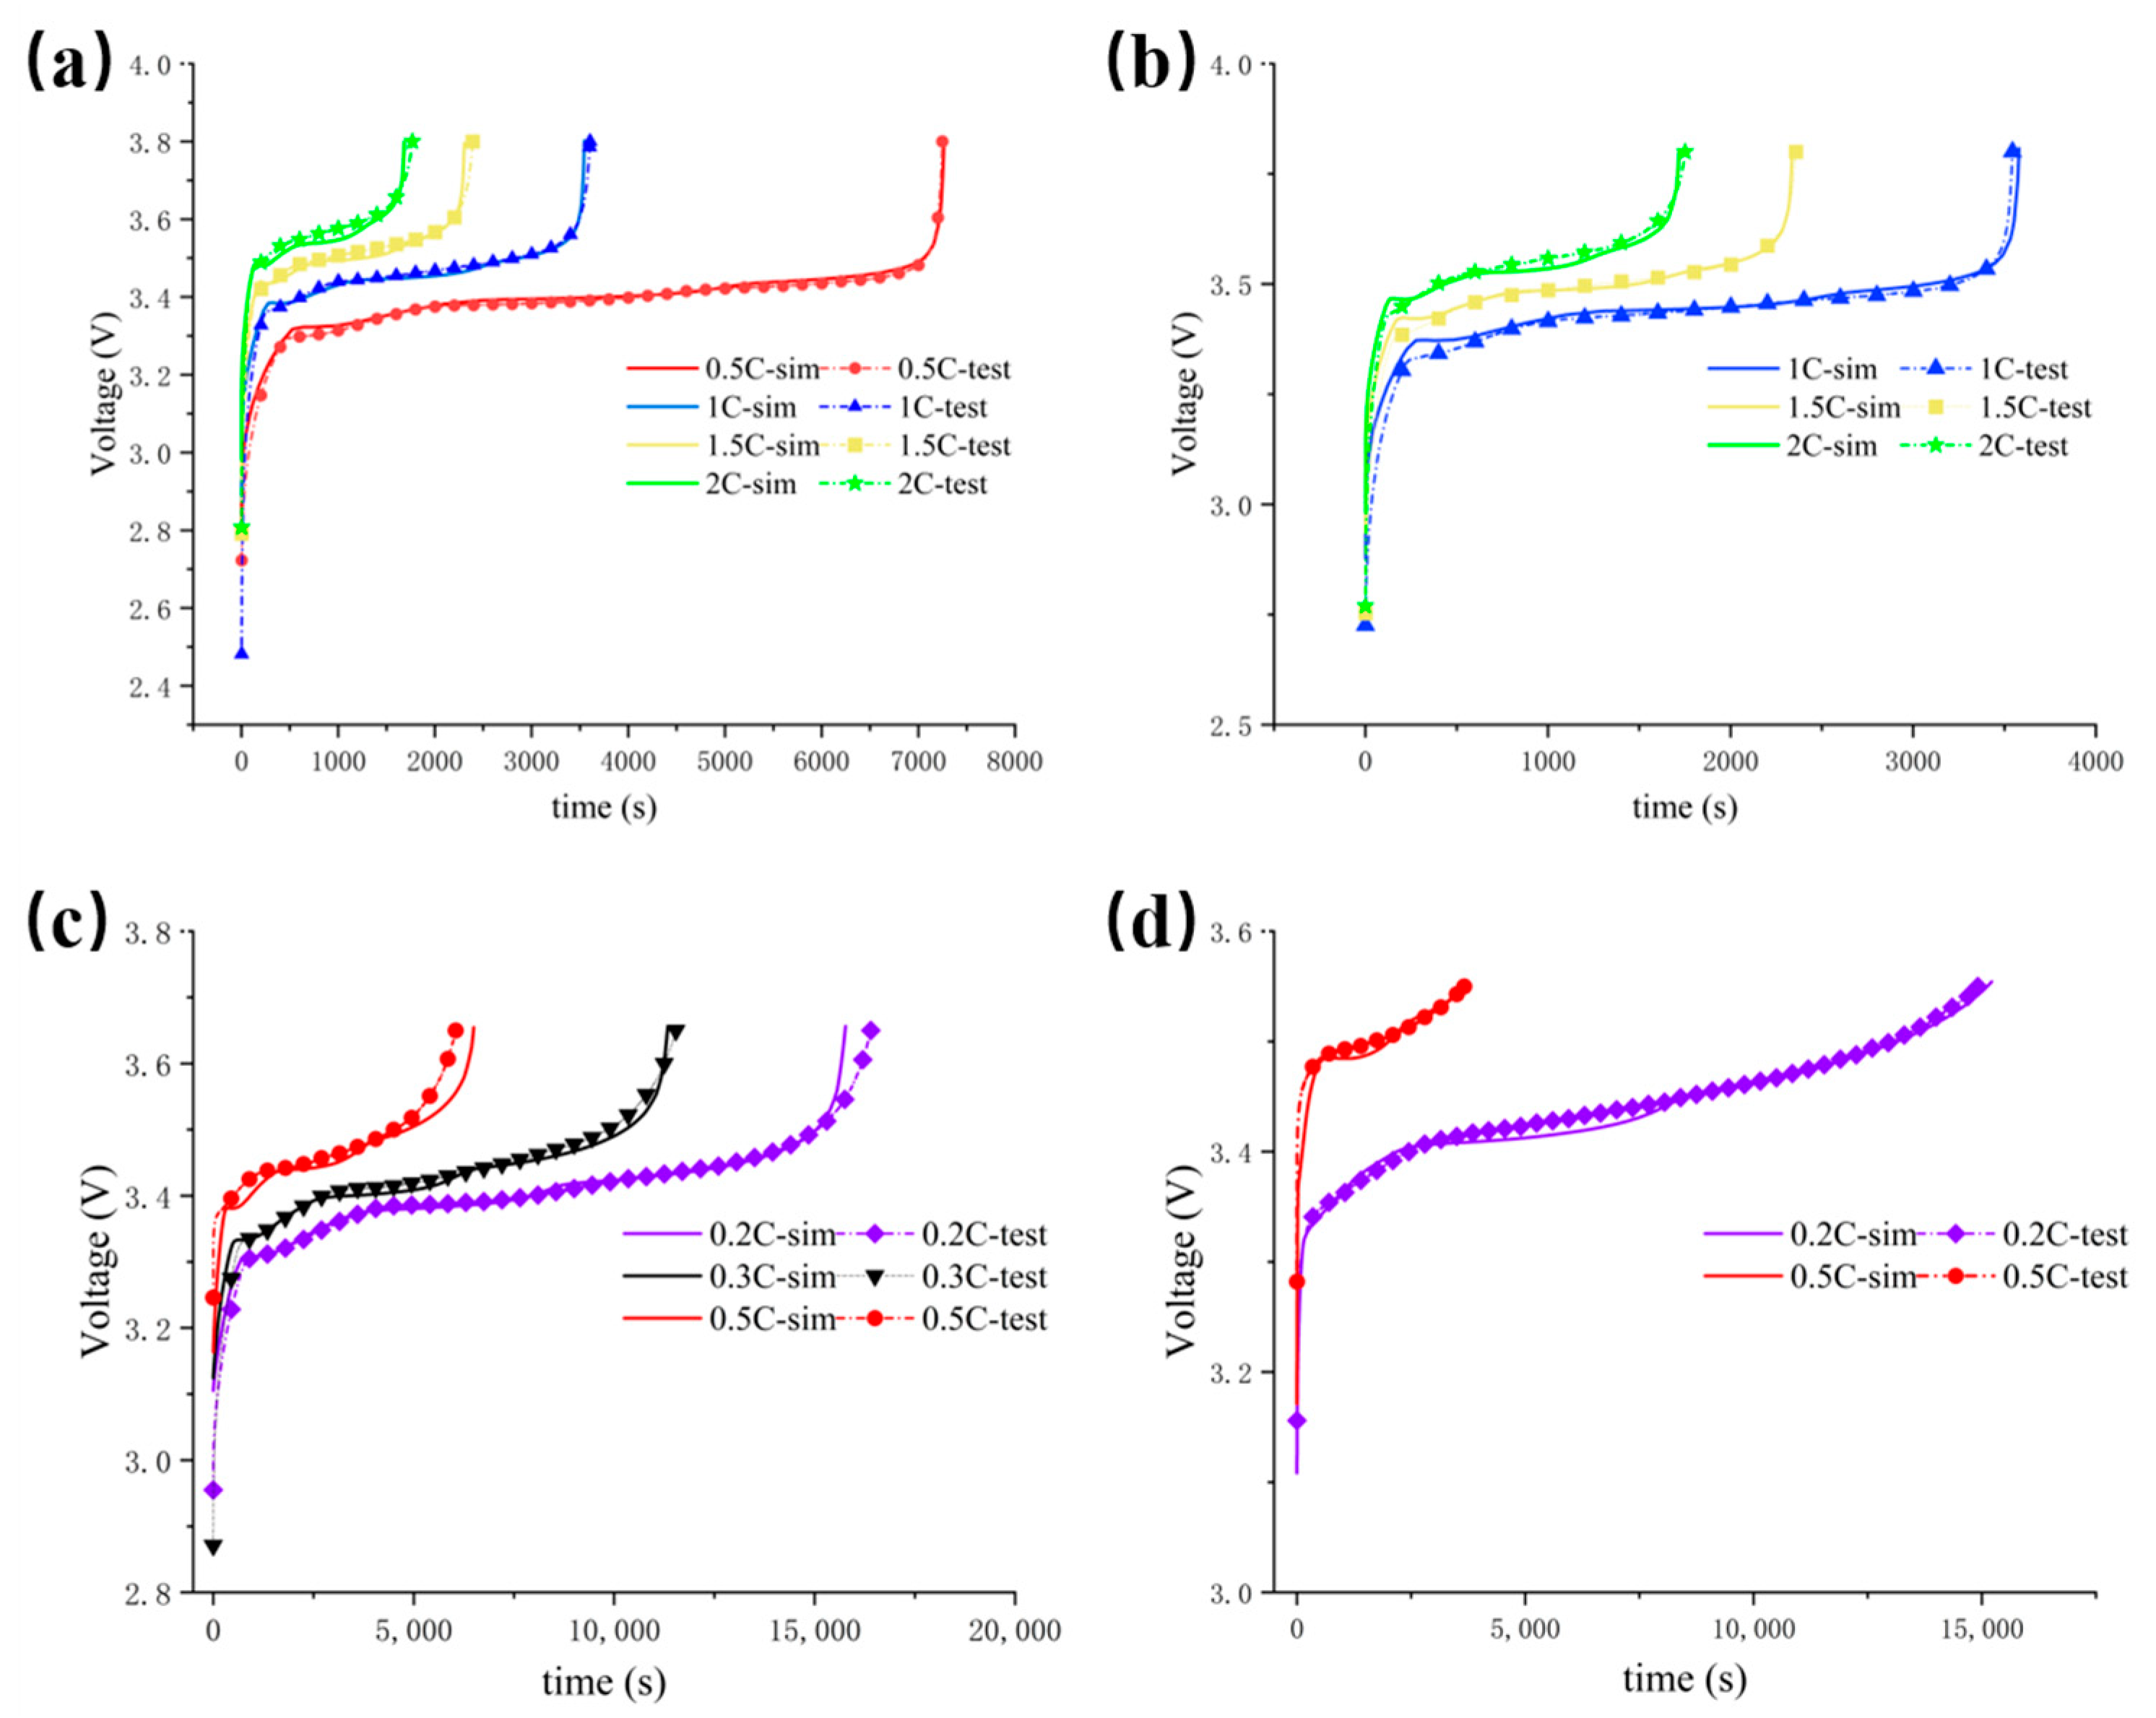
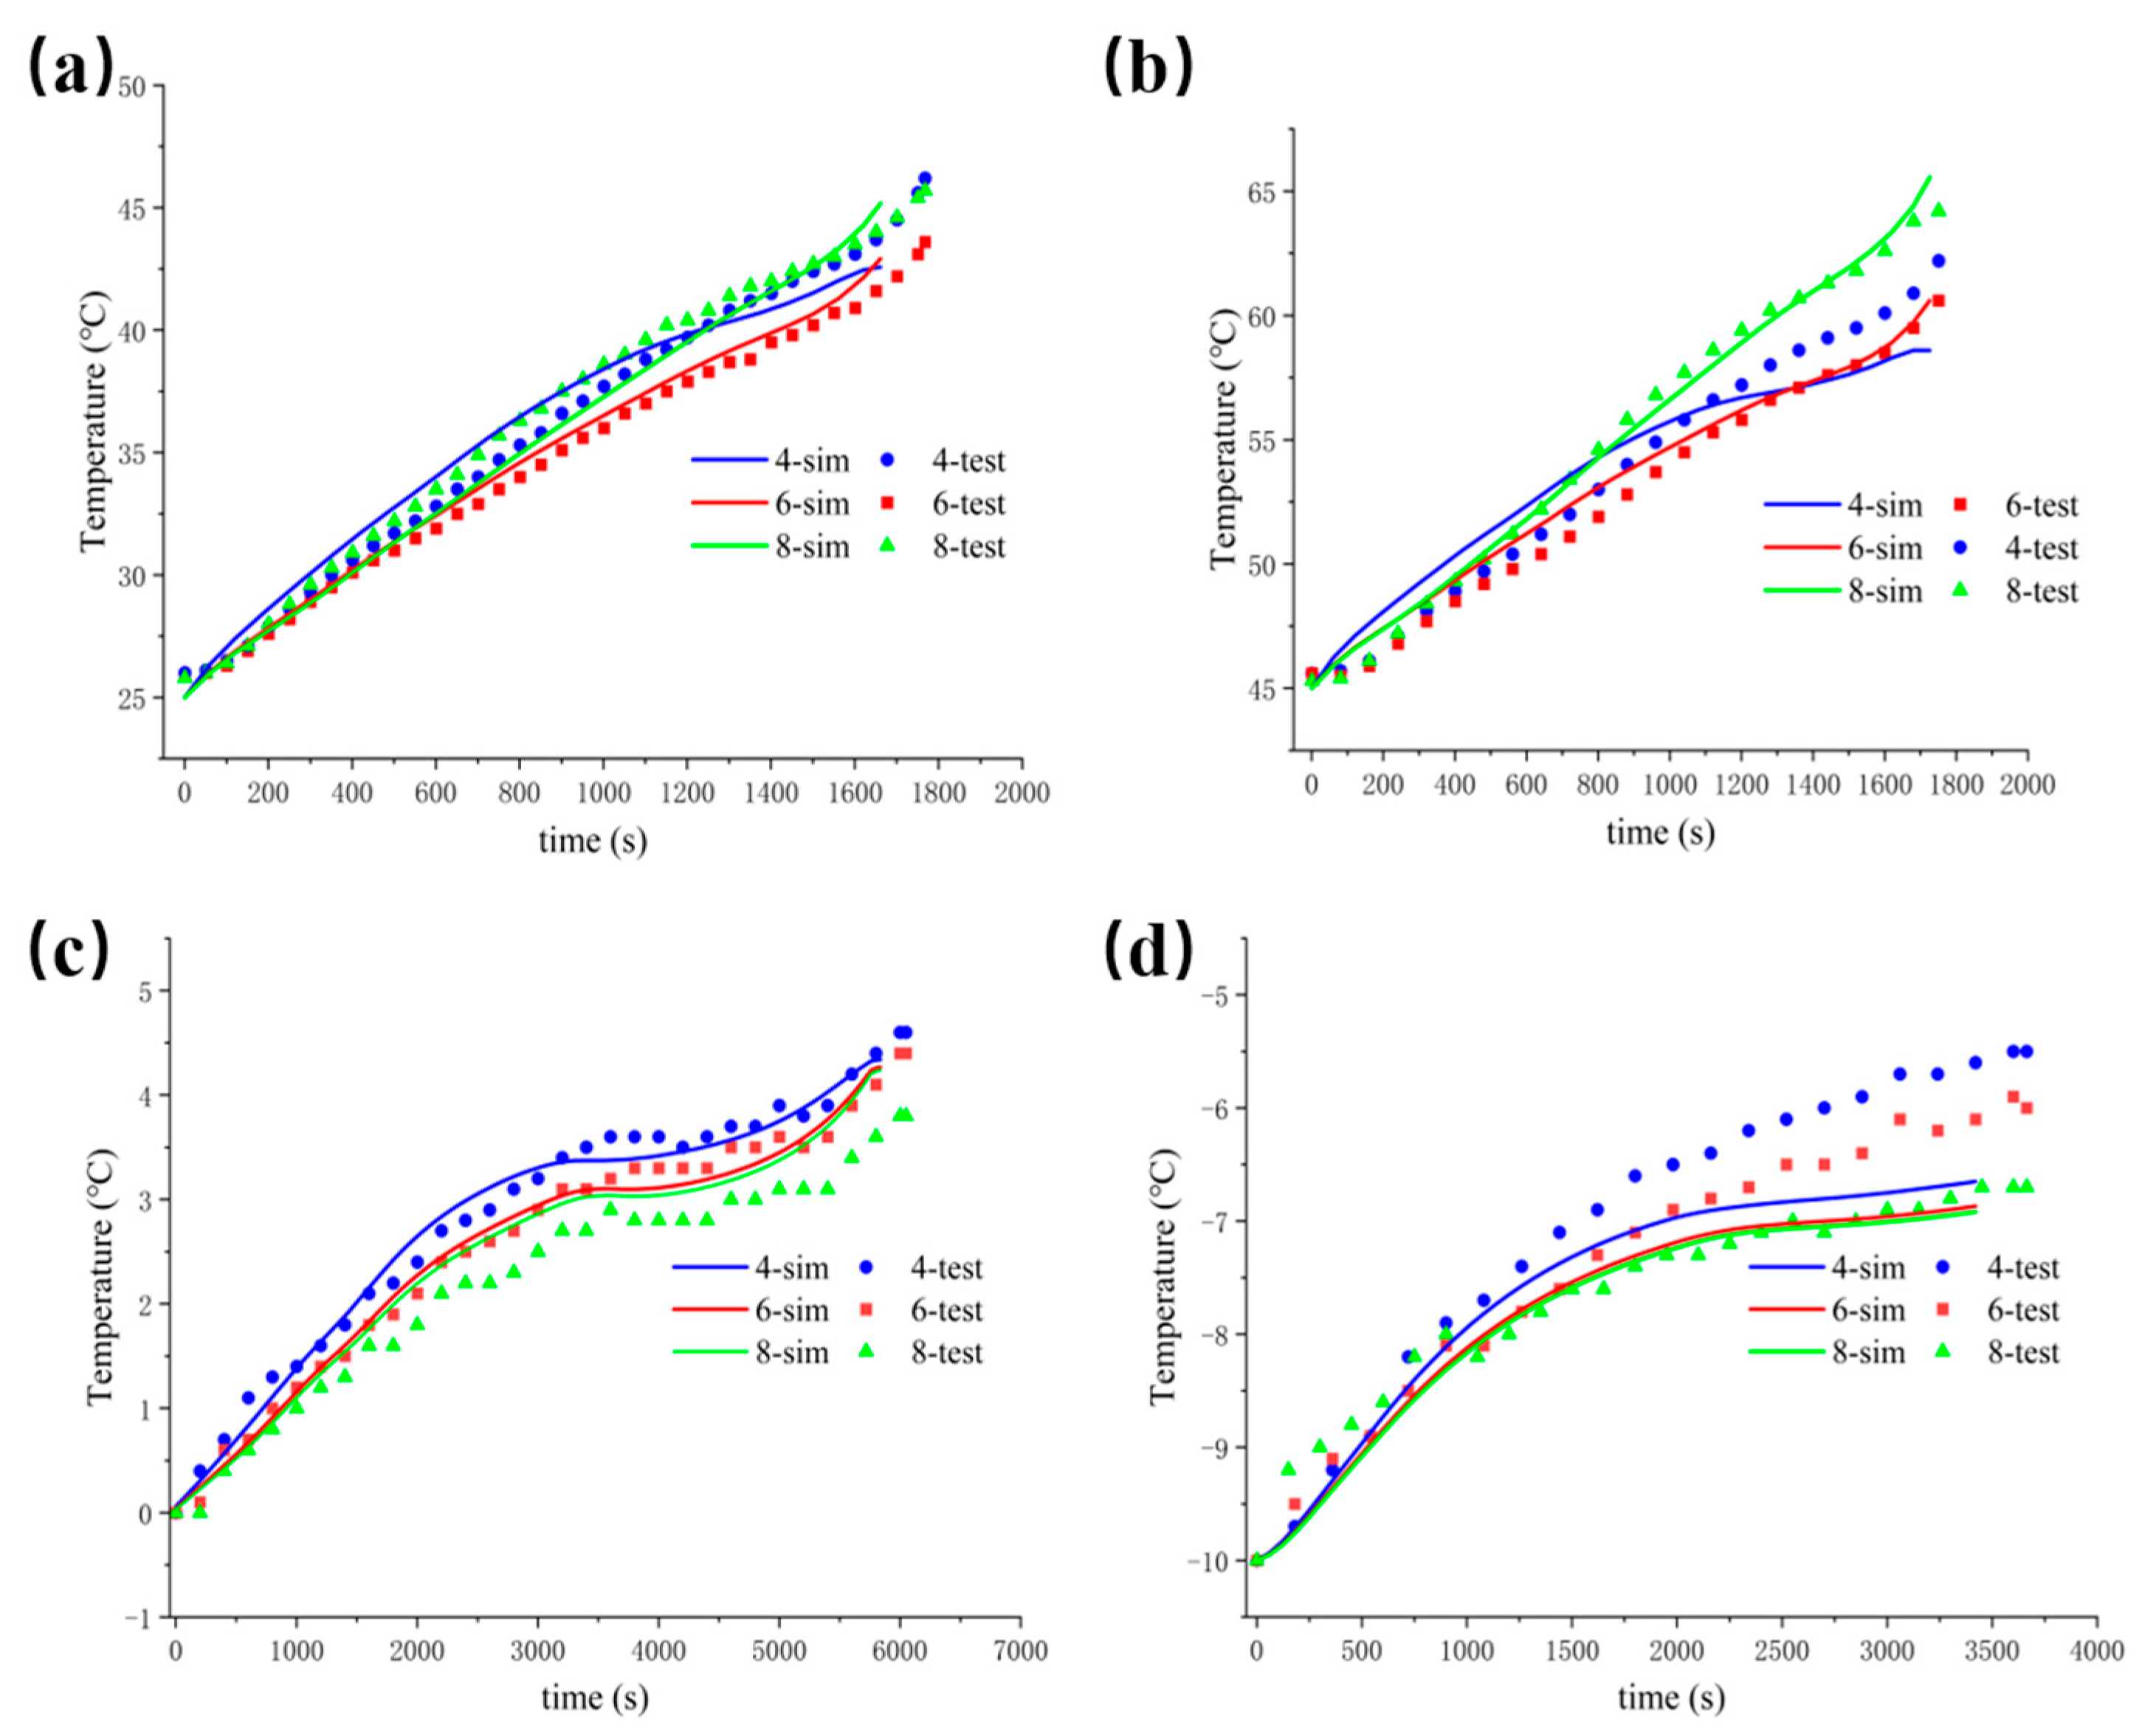
4.2. Model Verification

In order to better understand the inhomogeneity mechanism of the large-size cells, a three-dimensional thermoelectric coupling mechanism model for this large-size cell is developed in this section. It is developed in COMSOL Multiphysics®® software (version 5.4), based on pseudo-two-dimensional theory and solid-state heat transfer theory, with reference to our previous thermoelectric coupling modeling process and the way of obtaining model parameters.
A comparison of CC charging voltage curves for different operating conditions of the 3D electrochemical–thermal coupling model with the experimental results is demonstrated Figure 6. It can be observed that, after adding two cell length and width dimensions to the P2D model, and including the possible influence of the collector conductivity on the external monomer characteristics, the simulated voltage results under different operating conditions still match well with the experimental values. The RMSE (root mean square error) voltages of the different C-rate simulation results at 25 degrees and 45 degrees are lower than 7.5 mV. The models at 0 degrees and −10 degrees show some variability at high SOC, but the overall accuracy is good, indicating that the 3D thermoelectric coupling model can describe the charging characteristics of large-size batteries under different operating conditions.
Figure 7 validates the temperature response of the 3D model for different charging conditions. It should be noted that, for low rate charging, the machine model results in the smallest simulation error, so the maximum charging rate at four temperatures (that is, 25 °C and 45 °C 2 C conditions and 0 °C and −10 °C 0.5 C conditions) are used here as an example for validation, with the temperature validation locations being three temperature points on the midline of the large surface of the large-size battery, i.e., Figure 1 (a) in points 4, 6, and 8. As can be seen from the figure, the temperature results of the 3D model still match the experimental results. Due to the increased heat dissipation at the pole lugs and the low self-generated heat of the battery at the end of charging, the heat dissipation has a greater impact on the battery temperature, ultimately resulting in a model temperature at the end of charging that is slightly lower than the experimental temperature. However, the average temperature error is less than 2 °C. In addition, there is temperature inhomogeneity in the experimental temperature chamber under low-temperature conditions, with the temperature decreasing sequentially from point 4 to point 6 near the positive pole under low temperatures. However, the trend of temperature rise is the same.
To further verify the temperature inhomogeneity of the 3D model, the results of the 3D temperature distribution at the initial moment of charging and the cut-off moment under four charging multipliers are revealed in Figure 8, taking an operating condition of 25 °C as an example. Figure 8 suggests that the battery surface temperature is homogeneous at the initial charging moment, and the temperature inhomogeneity at the cut-off moment is highlighted. With the increase of the charging multiplier, the maximum temperature difference at the charging cut-off moment increases from 0.4 °C at 0.5 C to 8.8 °C at 2 C, which is consistent with the experimental results. The temperature inhomogeneity at the charging cut-off point is higher at the lug side and lower in the middle under conditions greater than 1 C, which is also the same as the inhomogeneity test results in Section 3.1.
In summary, the three-dimensional thermoelectric coupling model of large-size batteries can accurately describe the electrochemical and thermal characteristics of the batteries under different operating conditions and can also accurately simulate the surface temperature inhomogeneities of the large-size batteries, and as such, it has laid the foundation for the subsequent in-depth analysis of the model results.

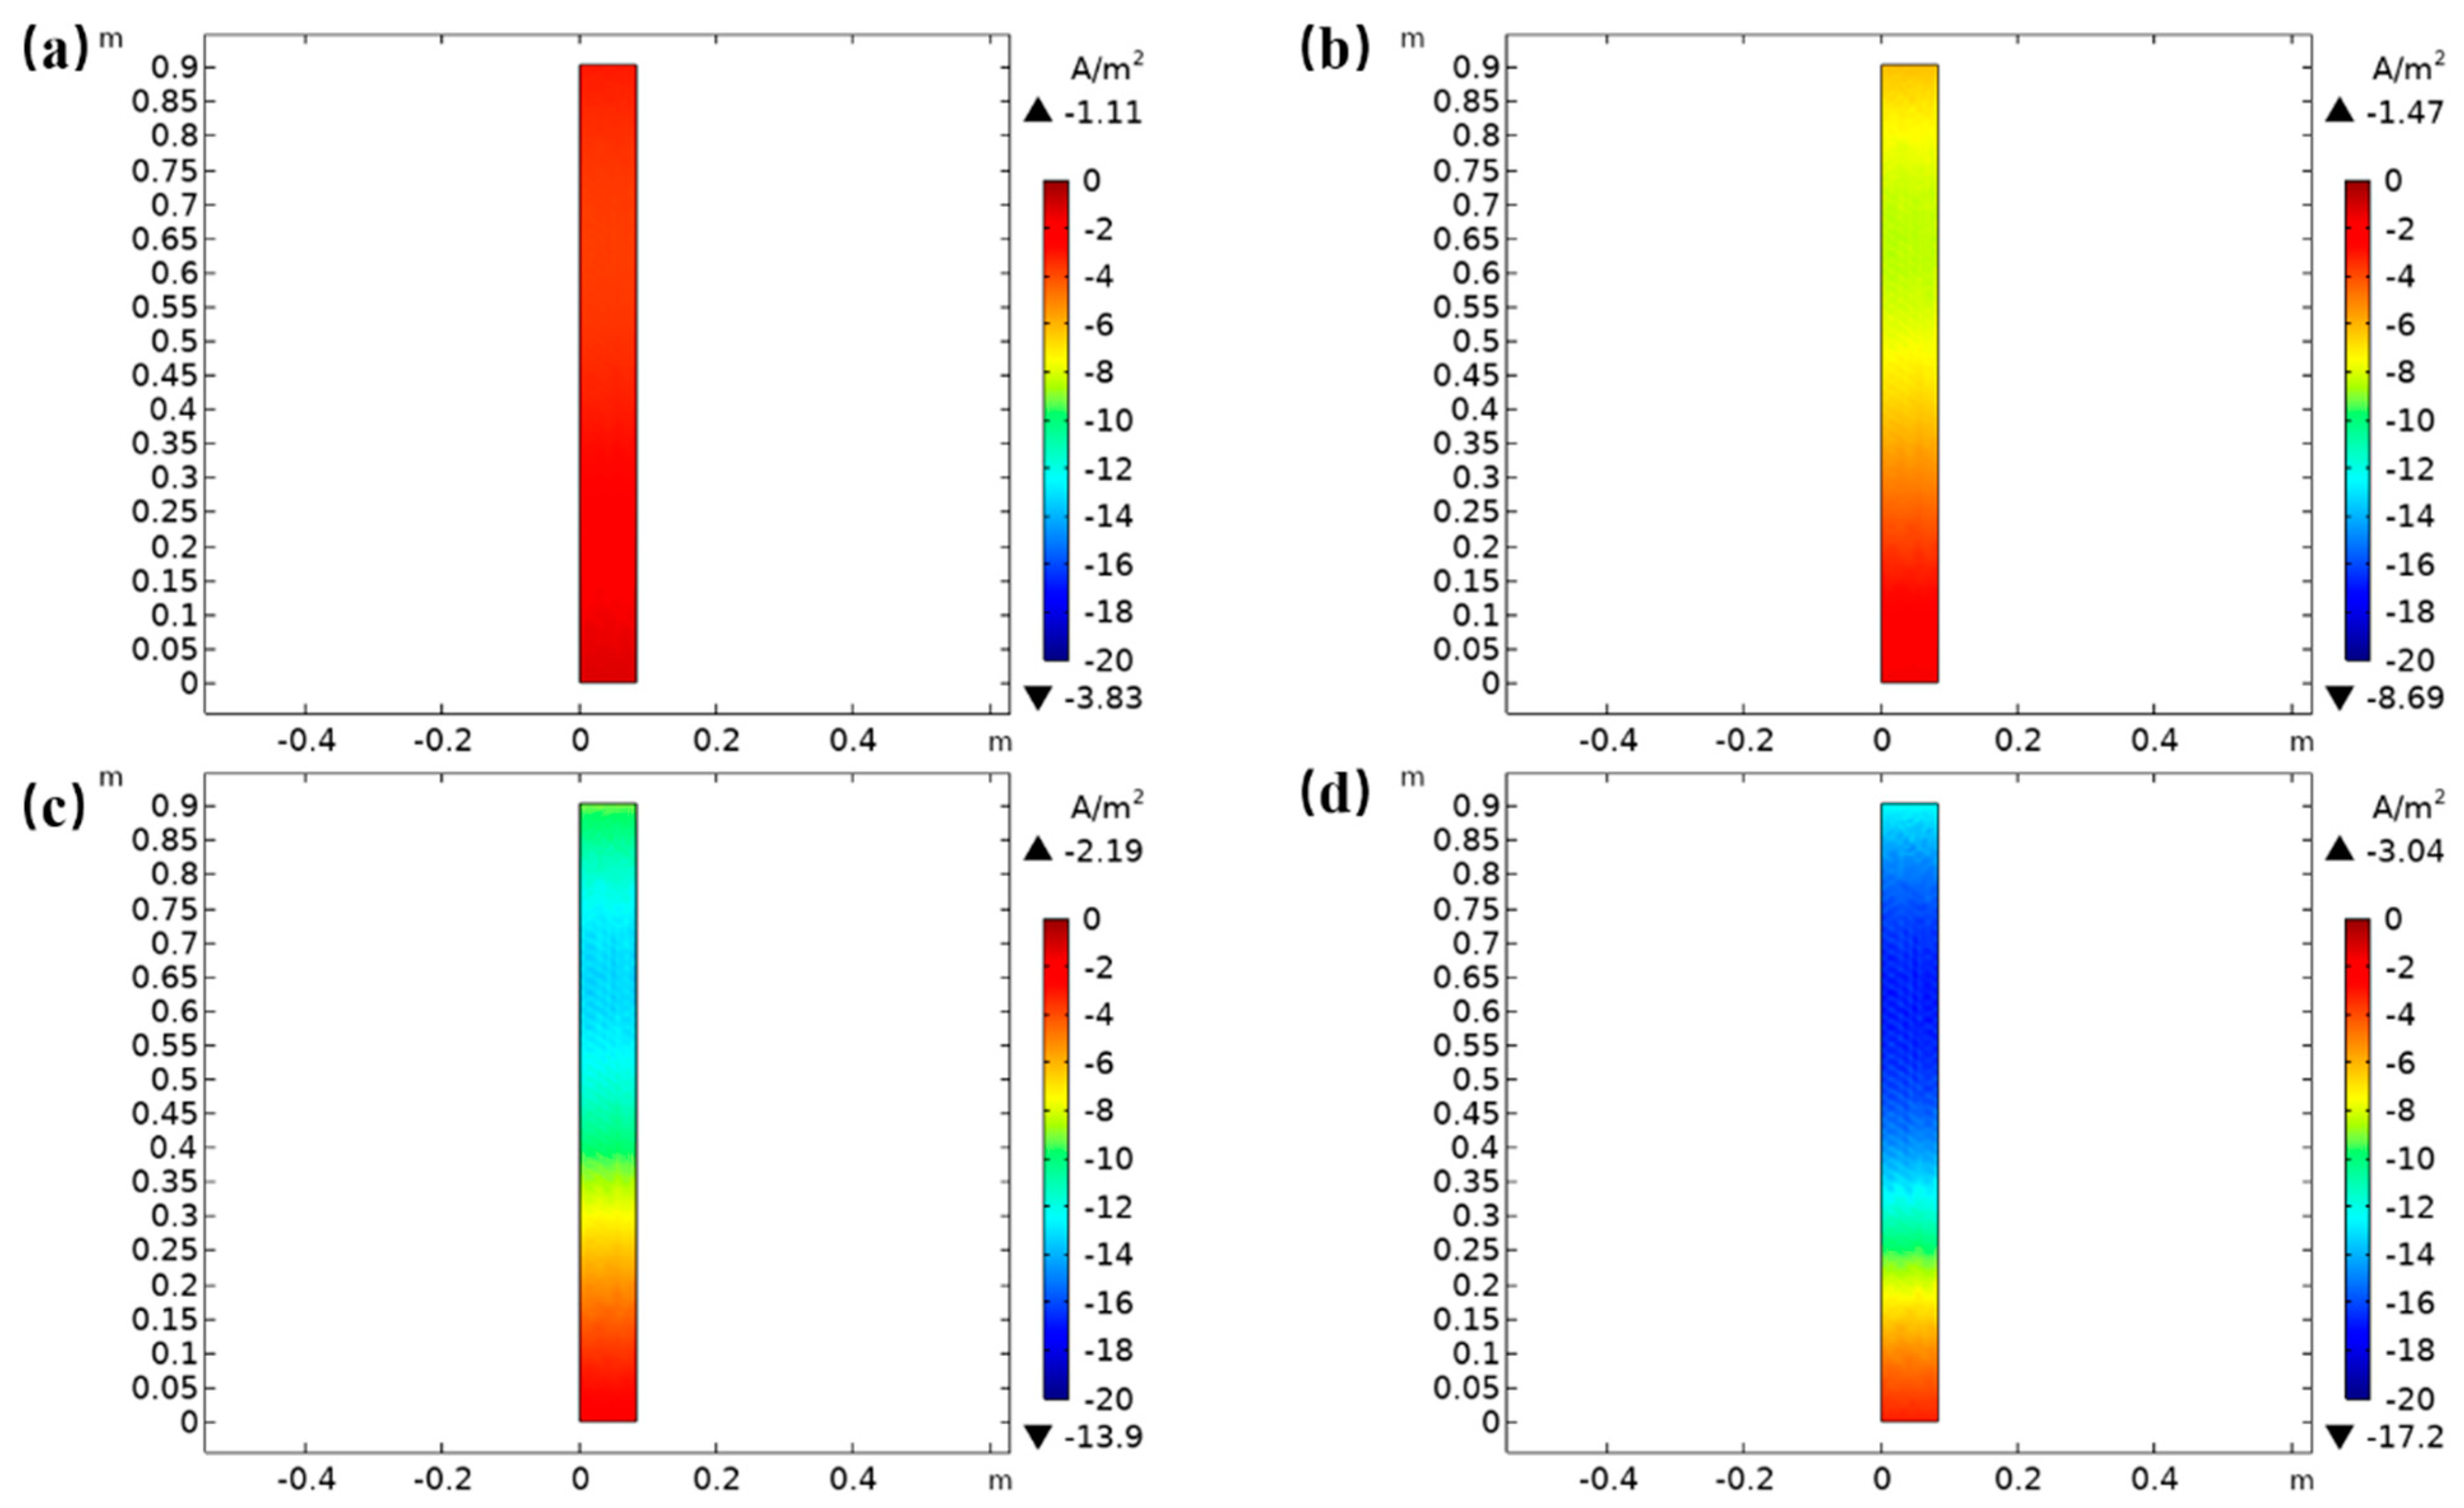
4.3. Mechanism Analysis Based on the Inhomogeneity of Electrothermal Coupling Model

The difference of SOC on the negative separator side at the charging cut-off moment is analyzed at different charging rates of 25 °C as an example, as shown in Figure 9, with the upper part of the two-dimensional diagram being close to the negative terminal lug side and the lower part being close to the positive terminal lug side. It can be seen that there is a difference of about 1% in the SOC distribution on the negative diaphragm side at the charging cutoff moment in the 0.5 C condition, which is slightly higher on the positive lug side and slightly lower on the negative lug side. The SOC distribution at 1 C and 0.5 C on the negative diaphragm side is similar to that at 0.5C, while at 2 C condition, the SOC is higher on the two lug sides and lower in the middle, with a SOC difference of around 7%. The comparison with Figure 8 indicates that this is the same situation as the uneven temperature distribution, where the cell temperature is also higher at the higher SOC location. This is mainly a result of the convergence of the electron currents entering the active material on the lug side, resulting in higher utilization of the electrode on the lug side and more heat generation during the charging process, as well as the heat generation effect of ohmic polarization at the lug position, which together result in a faster temperature rise on the lug side.
In addition, the intercalation current density distribution of the lithium-ion embedding reaction on the negative diaphragm side at the charging cut-off moment is also demonstrated in Figure 10. It can be seen that the inhomogeneity of the intercalation current density is the opposite of the SOC inhomogeneity and temperature inhomogeneity. As of the moment of charging, the lithium-ion embedding current density is lower on the bipolar ear side, where the electron currents converge due to the higher SOC and the lower lithium-ion embedding reaction rate, while the interlayer current density is relatively high at the location of the protruding surface in the middle, where the SOC is lower. As the multiplicity increases, the current density difference at 0.5C is about 2 A/m2, while it reaches 12 A/m2 at 2 C. However, a more significant current density difference at 2 C also results from the charging current difference, with a normalized current density difference of approximately 0.57 at 0.5 C working conditions, as opposed to approximately 0.75 at 2 C working conditions.

4.4. Unevenness Management Method Based on Electrothermal Coupling Model

Experimental and simulation results demonstrate that there is significant temperature inhomogeneity in the charging and discharging conditions of large-size batteries. Therefore, an optimization method of battery connection to reduce the temperature inhomogeneity, as well as a thermal management strategy to adjust the heat transfer coefficient at different locations based on a three-dimensional thermoelectric coupling model (based on the 25 °C 2 C charging model), is proposed in this section.

4.4.1. Battery Connection Optimization with Increased Contact Area of Lug Connection

In the original model design, the arrows in Figure 11a show the cross-section of the current entering and exiting the pole lugs. The maximum temperature difference at the 2 C charge cut-off is 8.8 °C. With all other parameters held constant, the maximum temperature difference at the charging cut-off drops to 4.7 °C. As shown in Figure 11b, by increasing the number of cross sections of the current entry in the model (that is, increasing the cross-sectional area), the maximum temperature drops from 51.2 °C to 46.9 °C, indicating that this method is effective in reducing the temperature inhomogeneity and also has a reducing effect on the amount of heat accumulation of the battery’s self-generated heat.

4.4.2. Thermal Management Strategy for Adjusting Heat Transfer Coefficients at Different Positions

Without changing the structural design of the original cell model, the heat dissipation at the two lug side positions of the large-size cell is optimized according to the temperature distribution of 25 °C 2 C operating conditions, and the convective heat transfer coefficients on the positive and negative lug sides are increased from 0.4 W-m-2-K-1 and 0.2 W-m-2-K-1 to 0.5 W-m-2-K-1 and 0.4 W-m-2-K-1, respectively. When comparing Figure 12a,b, it can be seen that the temperature on the lug side of the cell is significantly reduced from about 50 °C to about 40 °C. Additionally, the maximum temperature difference is reduced by more than 1 °C.
Therefore, according to the temperature distribution of the large-size battery at different temperature conditions, for instance, at room temperature, high temperature, and low temperature, cooling can be designed at different locations with different heat transfer coefficients. For example, the value of the convective heat transfer coefficient can be increased by increasing the flow rate of the coolant on the lug side and replacing it with a phase change material with better cooling performance at 2 C charging rate at 25 °C to reduce the uneven distribution of temperature and temperature rise in large-size cells. At low temperatures, the middle part of the large cell surface can be heated separately to improve the charging performance at low temperatures, as the heat generation at the bumps has an elevated effect on the temperature on the lug side.

5. Conclusions

In this paper, the homogeneity of large-size blade lithium-ion batteries is investigated. Firstly, various performance tests were carried out on a large-size blade battery to grasp the capacity of large-size batteries, and the optimal interval of battery performance was obtained. Additionally, based on the inhomogeneity temperature distribution data under different working conditions, the inhomogeneity distribution of large-size batteries was initially grasped. On this basis, a three-dimensional thermoelectric coupling model of a large-size cell was developed, and its accuracy was verified under various operating conditions. The results show that the model can accurately describe the electrochemical and thermal properties of large-size cells under different operating conditions and accurately simulate their inhomogeneity distribution. Finally, based on the model at working condition of 2C charging rate at 25 °C, a thermal management optimization strategy of increasing the contact area of the solder lug and adjusting the heat exchange at different positions is proposed. The results of this optimization strategy reveal that the above solutions is not only effective in alleviating the inhomogeneity distribution of large-size cells, but also in optimizing the temperature rise of the cells, which has an important impact on the charging and discharging performance of the cells under different operating conditions.

Author Contributions

Conceptualization, F.C., Y.Z. and D.R.; methodology, F.C., W.Z., X.K. and Y.H.; software, F.C., W.Z. and X.K.; validation, F.C.; formal analysis, Y.W.; data curation, F.C.; writing—original draft preparation, W.Z.; writing—review and editing, F.C.; project administration, Y.Z.; funding acquisition, Y.Z. and D.R. All authors have read and agreed to the published version of the manuscript.

Funding

This work was funded by the National Natural Science Foundation of China (NSFC), under grant numbers 52277222, 52007099, and 52177217, Shanghai Science and Technology Development Fund, 22ZR1444500, and China Postdoctoral Science Foundation, 2020M680550.

Data Availability Statement

Not applicable.

Acknowledgments

The study was approved by the University of Shanghai for Science and Technology.

Conflicts of Interest

The authors declare no conflict of interest.

References

  1. You, H.; Zhu, J.; Wang, X.; Jiang, B.; Sun, H.; Liu, X.; Wei, X.; Han, G.; Ding, S.; Yu, H.; et al. Nonlinear health evaluation for lithium-ion battery within full-lifespan. J. Energy Chem. 2022, 72, 333–341. [Google Scholar] [CrossRef]
  2. Kong, X.; Lu, L.; Yuan, Y.; Sun, Y.; Feng, X.; Yang, H.; Zhang, F.; Zhang, J.; Liu, X.; Han, X.; et al. Foreign matter defect battery and sudden spontaneous combustion. eTransportation 2022, 12, 100170. [Google Scholar] [CrossRef]
  3. Lai, X.; Chen, Q.; Tang, X.; Zhou, Y.; Gao, F.; Guo, Y.; Bhagat, R.; Zheng, Y. Critical review of life cycle assessment of lithium-ion batteries for electric vehicles: A lifespan perspective. eTransportation 2022, 12, 100169. [Google Scholar] [CrossRef]
  4. Chen, Q.; Lai, X.; Gu, H.; Tang, X.; Gao, F.; Han, X.; Zheng, Y. Investigating carbon footprint and carbon reduction potential using a cradle-to-cradle LCA approach on lithium-ion batteries for electric vehicles in China. J. Clean. Prod. 2022, 369, 133342. [Google Scholar] [CrossRef]
  5. Fachrizal, R.; Shepero, M.; van der Meer, D.; Munkhammar, J.; Widen, J. Smart charging of electric vehicles considering photovoltaic power production and electricity consumption: A review. eTransportation 2020, 4, 100056. [Google Scholar] [CrossRef]
  6. Wang, Y.J.; Wang, L.; Li, M.C.; Chen, Z.H. A review of key issues for control and management in battery and ultra-capacitor hybrid energy storage systems. eTransportation 2020, 4, 100064. [Google Scholar] [CrossRef]
  7. Zhang, H.L.; Zhang, J.J. An overview of modification strategies to improve LiNi0.8Co0.1Mn0.1O2 (NCM811) cathode performance for automotive lithium-ion batteries. eTransportation 2021, 7, 100105. [Google Scholar] [CrossRef]
  8. Harris, S.J.; Lu, P. Effects of Inhomogeneities-Nanoscale to Mesoscale-on the Durability of Li-Ion Batteries. J. Phys. Chem. C 2013, 117, 6481–6492. [Google Scholar] [CrossRef]
  9. Ng, S.H.; La Mantia, F.; Novak, P. A Multiple Working Electrode for Electrochemical Cells: A Tool for Current Density Distribution Studies. Angew. Chem.-Int. Ed. 2009, 48, 528–532. [Google Scholar] [CrossRef]
  10. Zhang, G.S.; Shaffer, C.E.; Wang, C.Y.; Rahn, C.D. In-Situ Measurement of Current Distribution in a Li-Ion Cell. J. Electrochem. Soc. 2013, 160, A610–A615. [Google Scholar] [CrossRef]
  11. Erhard, S.; Osswald, P.J.; Keil, P.; Höffer, E.; Haug, M.; Noel, A.; Wilhelm, J.; Rieger, B.; Schmidt, K.; Kosch, S.; et al. Simulation and Measurement of the Current Density Distribution in Lithium-Ion Batteries by a Multi-Tab Cell Approach. J. Electrochem. Soc. 2017, 164, A6324–A6333. [Google Scholar] [CrossRef]
  12. Muehlbauer, M.J.; Schoekel, A.; Etter, M.; Baran, V.; Senyshyn, A. Probing chemical heterogeneity of Li-ion batteries by in operando high energy X-ray diffraction radiography. J. Power Sources 2018, 403, 49–55. [Google Scholar] [CrossRef]
  13. Erhard, S.V.; Osswald, P.J.; Wilhelm, J.; Rheinfeld, A.; Kosch, S.; Jossen, A. Simulation and Measurement of Local Potentials of Modified Commercial Cylindrical Cells. J. Electrochem. Soc. 2015, 162, A2707–A2719. [Google Scholar] [CrossRef]
  14. Zhao, Y.; Patel, Y.; Zhang, T.; Offer, G.J. Modeling the Effects of Thermal Gradients Induced by Tab and Surface Cooling on Lithium Ion Cell Performance. J. Electrochem. Soc. 2018, 165, A3169–A3178. [Google Scholar] [CrossRef]
  15. Dai, H.; Yu, C.; Wei, X.; Sun, Z. State of charge estimation for lithium-ion pouch batteries based on stress measurement. Energy AI 2017, 129, 16–27. [Google Scholar] [CrossRef]
  16. Leung, P.; Moreno, C.; Masters, I.; Hazra, S.; Conde, B.; Mohamed, M.; Dashwood, R.; Bhagat, R. Real-time displacement and strain mappings of lithium-ion batteries using three-dimensional digital image correlation. J. Power Sources 2014, 271, 82–86. [Google Scholar] [CrossRef] [Green Version]
  17. Rieger, B.; Erhard, S.V.; Kosch, S.; Venator, M.; Rheinfeld, A.; Jossen, A. Multi-Dimensional Modeling of the Influence of Cell Design on Temperature, Displacement and Stress Inhomogeneity in Large-Format Lithium-Ion Cells. J. Electrochem. Soc. 2016, 163, A3099–A3110. [Google Scholar] [CrossRef]
  18. Wang, X.; Wei, X.; Zhu, J.; Dai, H.; Zheng, Y.; Xu, X.; Chen, Q. A review of modeling, acquisition, and application of lithium-ion battery impedance for onboard battery management. eTransportation 2021, 7, 100093. [Google Scholar] [CrossRef]
  19. Zhang, Y.X.; Yang, Z.J.; Tian, C.X. Probing and quantifying cathode charge heterogeneity in Li ion batteries. J. Mater. Chem. A 2019, 7, 23628–23661. [Google Scholar] [CrossRef]
  20. Bian, X.L.; Wei, Z.G.; Li, W.H.; Pou, J.; Sauer, D.U.; Liu, L.C. State-of-Health Estimation of Lithium-Ion Batteries by Fusing an Open Circuit Voltage Model and Incremental Capacity Analysis. IEEE Trans. Power Electron. 2022, 37, 2226–2236. [Google Scholar] [CrossRef]
  21. Mussa, A.S.; Lindbergh, G.; Klett, M.; Gudmundson, P.; Svens, P.; Lindstrom, R.W. Inhomogeneous active layer contact loss in a cycled prismatic lithium-ion cell caused by the jelly-roll curvature. J. Energy Storage 2018, 20, 213–217. [Google Scholar] [CrossRef]
  22. Arunachala, R.; Moraleja, L.; Jossen, A.; Garche, J. Aging Inhomogeneity influenced by Cell Size in Commercial Pouch Cells. In Proceedings of the European Battery, Hybrid and Fuel Cell Electric Vehicle Congress, Brussels, Belgium, 1–4 December 2015. [Google Scholar]
  23. Cannarella, J.; Arnold, C.B. The Effects of Defects on Localized Plating in Lithium-Ion Batteries. J. Electrochem. Soc. 2015, 162, A1365–A1373. [Google Scholar] [CrossRef] [Green Version]
  24. Liu, X.M.; Fang, A.; Haataja, M.P.; Arnold, C. Size Dependence of Transport Non-Uniformities on Localized Plating in Lithium-Ion Batteries. J. Electrochem. Soc. 2018, 165, A1147–A1155. [Google Scholar] [CrossRef]
  25. Zhu, Y.; Xie, J.; Pei, A.; Liu, B.; Wu, Y.; Lin, D.; Li, J.; Wang, H.; Chen, H.; Xu, J.; et al. Fast lithium growth and short circuit induced by localized-temperature hotspots in lithium batteries. Nat. Commun. 2019, 10, 2067. [Google Scholar] [CrossRef] [Green Version]
  26. Doyle, M.; Fuller, T.F.; Newman, J. Modeling of galvanostatic charge and discharge of the lithium/polymer/insertion cell. J. Electrochem. Soc. 1993, 140, 1526–1533. [Google Scholar] [CrossRef]
  27. Doyle, M.; Newman, J.; Gozdz, A.S.; Schmutz, C.N.; Tarascon, J.M. Comparison of modeling predictions with experimental data from plastic lithium ion cells. J. Electrochem. Soc. 1996, 143, 1890–1903. [Google Scholar] [CrossRef]
  28. Guo, M.; Sikha, G.; White, R.E. Single-Particle Model for a Lithium-Ion Cell: Thermal Behavior. J. Electrochem. Soc. 2011, 158, A122–A132. [Google Scholar] [CrossRef]
  29. Ye, Y.; Shi, Y.; Cai, N.; Lee, J.; He, X. Electro-thermal modeling and experimental validation for lithium ion battery. J. Power Sources 2012, 199, 227–238. [Google Scholar] [CrossRef]
  30. Wang, Q.S.; Ping, P.; Zhao, X.J.; Chu, G.Q.; Sun, J.H.; Chen, C.H. Thermal runaway caused fire and explosion of lithium ion battery. J. Power Sources 2012, 208, 210–224. [Google Scholar] [CrossRef]
  31. Smith, K.; Wang, C.Y. Power and thermal characterization of a lithium-ion battery pack for hybrid-electric vehicles. J. Power Sources 2006, 160, 662–673. [Google Scholar] [CrossRef]
  32. Han, X.; Ouyang, M.; Lu, L.; Li, J.; Zheng, Y.; Li, Z. A comparative study of commercial lithium ion battery cycle life in electrical vehicle: Aging mechanism identification. J. Power Sources 2014, 251, 38–54. [Google Scholar] [CrossRef]
  33. Han, X.; Lu, L.; Zheng, Y.; Feng, X.; Li, Z.; Li, J.; Ouyang, M. A review on the key issues of the lithium ion battery degradation among the whole life cycle. eTransportation 2019, 1, 100005. [Google Scholar] [CrossRef]
  34. Zhu, W.; Zhou, P.; Ren, D.; Yang, M.; Rui, X.; Jin, C.; Shen, T.; Han, X.; Zheng, Y.; Lu, L.; et al. A mechanistic calendar aging model of lithium-ion battery considering solid electrolyte interface growth. Int. J. Energy Res. 2022, 46, 15521–15534. [Google Scholar] [CrossRef]
  35. Valøen, L.O.; Reimers, J.N. Transport Properties of LiPF6-Based Li-Ion Battery Electrolytes. J. Electrochem. Soc. 2005, 152, A882–A891. [Google Scholar] [CrossRef]
  36. Feng, X.N.; Weng, C.H.; Ouyang, M.G.; Sun, J. Online internal short circuit detection for a large format lithium ion battery. Appl. Energy 2016, 161, 168–180. [Google Scholar] [CrossRef] [Green Version]
  37. Feng, X.; He, X.; Ouyang, M.; Wang, L.; Lu, L.; Ren, D.; Santhanagopalan, S. A Coupled Electrochemical-Thermal Failure Model for Predicting the Thermal Runaway Behavior of Lithium-Ion Batteries. J. Electrochem. Soc. 2018, 165, A3748–A3765. [Google Scholar] [CrossRef]
Figure 1. Large-size battery thermoelectric coupling layout diagram.
Energies 15 09556 g001
Figure 2. Equilibrium potential curve of large-size cell.
Energies 15 09556 g002
Figure 3. Identification results of Large-size battery dual tank model.
Energies 15 09556 g003
Figure 4. Entropy thermal coefficient test results of large-size battery monomer.
Energies 15 09556 g004
Figure 5. Capacity Charge/discharge Rate Temperature 3D plot of large-size battery for two tests. (a,b) Charging capacity (first/second test); (c,d) Discharging capacity (first/second test).
Energies 15 09556 g005
Figure 6. The 3D model charging voltage validation for different operating conditions (shape-experimental data, solid line-model results). (a) 25 °C; (b) 45 °C; (c) 0 °C; (d) −10 °C.
Energies 15 09556 g006
Figure 7. The 3D model midline temperature validation for different charging conditions. (a) 25 °C 2 C; (b) 45 °C 2 C; (c) 0 °C 0.5C; (d) −10 °C 0.5 C.
Energies 15 09556 g007
Figure 8. Results of the three-dimensional temperature distribution model for charging at 25 °C 0.5 C, 1 C, 1.5 C, 2 C. (a,c,e,g) charging initial moment; (b,d,f,h) charging cutoff moment.
Energies 15 09556 g008
Figure 9. Difference in SOC on the negative diaphragm side at the charging cut off moment for different operating conditions at 25 °C. (a) 0.5 C; (b) 1 C; (c) 1.5 C; (d) 2 C.
Energies 15 09556 g009
Figure 10. Difference in current density of the negative diaphragm side intercalation at the charging cutoff moment for different operating conditions at 25 °C. (a) 0.5 C; (b) 1 C; (c) 1.5 C; (d) 2 C. In summary, electrode SOC differences and current density differences combine to cause temperature inhomogeneity, due to the distribution of large-size cell lugs. Electrode SOC and current density inhomogeneity characteristics can be introduced from the temperature inhomogeneity distribution, while electrode SOC and current density differences indicate the physical mechanism of the temperature inhomogeneity.
Energies 15 09556 g010
Figure 11. Scheme of increasing the pole-ear contact area. (a,c) Original scheme and its temperature distribution; (b,d) increasing the lug contact area and its temperature distribution.
Energies 15 09556 g011
Figure 12. Effect of improving the heat exchange on the pole-ear side on the three-dimensional temperature distribution. (a) Temperature distribution of the original scheme; (b) Temperature distribution of the added pole-ear side heat transfer; (c) graphical representation of the improved heat transfer.
Energies 15 09556 g012
Table 1. Capacity test conditions.
T °C/C Rate0.2C0.3C0.5C1C1.5C2C
−10Cha and DchChaCha and DchDch//
0Cha and DchChaChaDch/Dch
25Cha and Dch/Cha and DchCha and DchCha and DchCha and Dch
45///Cha and DchCha and DchCha and Dch
Table 2. Model parameters of electrochemical–thermal coupling mechanism and thermal physical parameters of large-size cells.
SymbolMeaning of ParametersUnitValue
Thermal model parameters
FFaraday constantC·mol−196,485
R0Ideal gas constantJ·mol−1·K−18.3145
TrefReference temperatureK298.15
ρnegDensity of negative active materialkg·m−32300
ρposDensity of positive active materialkg·m−33600
ρsepDiaphragm densitykg·m−31108.98
ρneg,ccFluid density of negative setkg·m−38960
ρpos,ccPositive electrode fluid densitykg·m−32700
ρbattBattery cell densitykg·m−32600
kT,negThermal conductivity of negative active materialW·m−1·K−11.04
kT,posThermal conductivity of positive electrode active materialW·m−1·K−11.58
kT,sepThermal conductivity of diaphragmW·m−1·K−10.344
kT,neg,ccThermal conductivity of negative current collectorW·m−1·K−1400
kT,pos,ccThermal conductivity of positive current collectorW·m−1·K−1238
kT,battThermal conductivity of battery cellW·m−1·K−10.98
Cp,negSpecific heat capacity of negative active materialJ·kg−1·K−1750
Cp,posSpecific heat capacity of positive electrode active materialJ·kg−1·K−1881
Cp,sepSpecific heat capacity of diaphragmJ·kg−1·K−11978.16
Cp,neg,ccSpecific heat capacity of negative current collectorJ·kg−1·K−1385
Cp,pos,ccSpecific heat capacity of positive current collectorJ·kg−1·K−1900
Cp,battSpecific heat capacity of battery cellJ·kg−1·K−1983.9
h25℃Heat transfer coefficient at 25 °CW·m−2·K−112
h45℃Heat transfer coefficient at 45 °CW·m−2·K−116
h0℃Heat transfer coefficient at 0 °CW·m−2·K−18
h-10℃Heat transfer coefficient at −10 °CW·m−2·K−110
Electrochemical model parameters
SymbolMeaning of parametersUnitValue
NegSepNeg
LThickness m65.5 × 10−630 × 10−672.5 × 10⁻⁶
RsParticle radiusm30 × 10−6/10 × 10−6
εsActive material volume fraction 10.65/0.55
εeElectrolyte volume fraction10.30.40.2
asSpecific surface area m−13εs,neg/Rs,neg/3εs,pos/Rs,pos
AsBattery aream25.6618
PcBattery circumference m1.971
Lneg,ccThickness of negative current collector m10 × 10−6
Lneg,ccPositive current collector thicknessm15 × 10−6
LbattBattery cell thickness m1.93 × 10−4
WbattBattery cell width m8.25 × 10−2
HbattBattery cell length m9.03 × 10−1
WtabPolar ear widthm7.15 × 10−2
HtabPolar ear length m2 × 10−2
nlayersNumber of poles 138
x0Positive Stoichiometric Ratio of cell at 0% SOC10.0073
x100Positive Stoichiometric Ratio of cell at 100% SOC10.9501
y0The negative stoichiometric ratio of the cell at 0% SOC10.9329
y100The negative stoichiometric ratio of the cell at 0% SOC10.2904
σsSolid phase conductivity S·m−1100/91
σ s e f f Solid phase effective conductivityS·m−1εs,neg1.5σs,neg/εs,pos1.5σs,pos
σs,ccCurrent collector electronic conductivity S·m−11.4 × 10⁸/3.774 × 107
σs,tabPole-ear electronic conductivityS·m−17 × 107/1.5 × 107
κeLiquid phase conductivityS·m−1 10 8.43 54 T 5 × 10 3 × c 299 2.2 × 10 4 × c
κ e e f f Liquid effective conductivityS·m−1 ε e , n e g 1.5 κ e ε e , s e p 1.5 κ e ε e , p o s 1.5 κ e
D e e f f Effective diffusion coefficient of liquid phase m2·s−1 ε e , n e g 1.5 D e ε e , s e p 1.5 D e ε e , p o s 1.5 D e
Ds,refSolid diffusion coefficient at reference temperature m2·s−11 × 10−11/4 × 10−14
E a , D s Activation energy of Ds when temperature changeskJ·mol−1358.1/8.8
krefReaction rate coefficient at reference temperature m·s−11 × 10−10/5 × 10−11
E a , k Activation energy of k when temperature changeskJ·mol−12.1/5.1
cs,maxMaximum lithium-ion concentration of material mol·m−328,244/23,118
ce,0Initial concentration of liquid lithium-ion mol·m−31200
x,yLithium-ion stoichiometric ratio 10.0085, 0.771/0.0033, 0.998
t+Lithium-ion migration number10.382
αacLithium-ion transfer coefficient 10.5, 0.5/0.5, 0.5
RSEISEI film resistance Ω·m24 × 10−3//
dU/dTentropy heat coefficient VFigure 3//
UrefEquilibrium potential mV·K−1Figure 2/Figure 2
Publisher’s Note: MDPI stays neutral with regard to jurisdictional claims in published maps and institutional affiliations.

