Article

Optimal Process Parameters for a Thermal-Sprayed Molybdenum-Reinforced Zirconium Diboride Composite on a Dummy Substrate

by
Muftah M. Mihoob
1,
Haetham G. Mohammed
1,
Thar Mohammed Badri Albarody
1,*,
Faiz Ahmad
1 and
Mohamad Sahban Alnarabiji
2
1
Department of Mechanical Engineering, Universiti Teknologi PETRONAS (UTP), Seri Iskandar 32610, Malaysia
2
Centre for Advanced Material and Energy Sciences, Universiti Brunei Darussalam, Jalan Tungku Link, Gadong BE 1410, Brunei
*
Author to whom correspondence should be addressed.
Energies 2022, 15(24), 9415; https://doi.org/10.3390/en15249415
Submission received: 22 August 2022 / Revised: 13 October 2022 / Accepted: 5 November 2022 / Published: 12 December 2022
(This article belongs to the Section G1: Smart Cities and Urban Management)

Abstract

:
Thermal spray is an effective process for the fabrication of a metal matrix composite (MMC), where a zirconium diboride reinforcement is embedded in a molybdenum matrix to enable the combining of favorable properties in a new composite. The combination of two leading materials in the category of ultra-high-temperature ceramics (UHTCs) is due to a very high melting point (Mo: 2623 °C and ZrB2: 3245 °C), high thermal conductivity (Mo: 139 W/m°C and ZrB2: 24 W/m°C), good thermal shock resistance, low coefficient of thermal expansion (Mo: 5.35 µm/m°C and ZrB2: 5.9 × 10⁻⁶ K−1), retention of strength at elevated temperatures and stability in extreme environments. Thermal spraying of the Mo/ZrB2 composite possesses a non-linear behavior that is influenced by many coating variables. This characteristic makes finding the optimal factor combination difficult. Therefore, an effective and strategic statistical approach incorporating systematic experimental data is needed to optimize the process. In this study, the L9 orthogonal array in the Taguchi approach was utilized to optimize the spraying distance (SD), number of passes (NP), pressure (P) and coat-face temperature (TCF) using a dummy fiberglass substrate. The performance was evaluated based on the coating density (Cd) of the surfaces. Based on confirmation tests, our Taguchi analysis determined the ideal process parameters, which considerably enhanced the coating process. From the output response of the ANOVA, the most influential parameters for achieving a high coating density (Cd) were determined to be SD = 20 cm, NP = 24, P = 4 bar and TCF = 330 °C ((SD.)1-(NP.)3-P2-(S.T.)3). These observations show that the coating density (Cd) was significantly influenced by the coat-face temperature, followed by the number of passes, spraying distance and pressure with the following contributions 6.29, 17.89, 17.42 and 3.35%, respectively.

1. Introduction

Thermal spray (TS) process parameters, such as the spraying distance, gas pressure, coat-face temperature, number of passes and flow rate, directly affect the coating properties of coated materials. It was reported that a longer spraying distance produced a smoother and cleaner coating, whereas shorter spraying distances produced better hardness ratings [1,2,3]. The coating thickness of the coated substrate, using TS, was found to increase with a higher number of passes [4], whereas the porosity decreased with a higher particle temperature [5], resulting in a denser microstructure. In addition, the coating’s porosity was diminished due to the flow of oxygen and fuel. The increased particle velocity, caused by the greater oxygen and acetylene fuel rates, increased not only the pressure inside the combustion chamber and the particle’s spread but also the degree of contact, which extended the kinetic energy of the particle [6]. Therefore, it is crucial to control the process parameters in order to prevent coating defects.
The surface properties of a material have a direct impact on its performance in industrial applications. Since surface modification technologies are so widely available, it is possible to economically replace a subpar base material with a coating that has better surface properties and performance. In situations involving corrosive environments, wear protection, thermal insulation or severe stress applications, surface modification is highly beneficial. For instance, yttria stabilized zirconia (YSZ) is used as an overlay protective coating in thermal barrier coatings (TBCs) to protect nickel or cobalt superalloys from extremely high temperatures [7].
The simultaneous surge in harsh industrial conditions and the incremental development of classical materials has pushed materials research toward the development of new alloys for thermal coating. Molybdenum coatings that are flame-sprayed are widely applied in industrial applications to improve the performance of engineering components, including shafts, pistons and piston rings.
It is possible to produce improved thermal stability, corrosion resistance and wear resistance. In each of these situations, the cohesive and adhesive strengths of the coating, which are influenced by the spraying process parameters used during the coating deposition process, determine how efficiently the coating performs. In the present study, experiments were conducted with the aim of optimizing the flame-spraying process parameters so that high-quality coatings could be produced. The Taguchi techniques were used successfully by researchers in the past in optimization studies [8,9,10,11,12].
Zirconium diboride is a leading material in the category of ultra-high-temperature ceramics (UHTCs). Due to the extraordinary characteristics of this material, such as its structural, physical, transport and thermodynamic properties, it has been implemented in several different applications, such as refractory linings [13,14], electrodes [15], microelectronics [16] and cutting tools [17]. In addition to a high melting temperature, ZrB2 has a unique combination of chemical stability, high electrical and thermal conductivity and resistance to erosion/corrosion that makes it suitable as a thermal protection system.
Additionally, the spraying settings are crucial for enhancing the characteristics of coatings [18]. The coating performance of Fe-based metallic glass was enhanced by fine-tuning spraying parameters, demonstrating that the amorphous phase initially increased before decreasing when the power was raised [19]. It was postulated that the oxidation and melting states of the powders, as well as heat radiation from the flame, were responsible for this phenomenon. The microhardness and spraying power were positively correlated. Typically, optimizing the spray parameters will increase the coating’s strength, hardness and wear resistance.
Due to the difficulty of measuring the precise density of the cut samples of stainless steel, and the crucial importance of optimizing the thermal spray parameters for optimal dense coating surfaces, the main objective of the present work was principally focused on developing a Mo/ZrB2 composite coating using the TS coating process. The torch parameters were optimized using the Taguchi approach. The ANOVA method was used in order to examine and analyze the role of the coating process parameters, such as the spraying distance (SD), pressure of gas (P), number of passes (NP) and coat-face temperature (TCF), on the Mo/ZrB2 composite.

2. Materials and Methods

2.1. Materials

Nano crystallites of Mo/ZrB2 powder with an average particle size of 100 nm were used as the starting material.

2.2. Process Parameters

Different parameters primarily influenced the spray process. Table 1 shows the parameters and their levels that were used in this study. The main process variables affecting the in-flight particle temperature and velocity were the fuel flow, spraying distance and oxygen flow. In addition, the porosity and corrosion resistance of the coatings were significantly impacted by the spray distance [8].
Figure 1 depicts a general block diagram of the high-velocity oxy-fuel coating. Hydrogen fuel was mixed with oxygen and burned in a chamber. The products of the combustion were allowed to expand with the help of a nozzle where the gas velocities could have become supersonic [20].
The powder was introduced along the axis in the nozzle and was heated and accelerated. The powder was fully or partially melted and achieved velocities near 540 m/s. Since the powder was exposed to the products of combustion, they were melted in either a reducing or an oxidizing medium. Oxidation of metallic and carbide was possible. The TS processes could produce coatings of any metallic or cermet material [21].

2.3. Design of Experiment (DOE)

The DOE is an important statistical technique that makes use of the Taguchi orthogonal arrays (OAs) to examine the controllable factors and their corresponding responses at many levels in an organized manner. This reduces the number of tests, which saves resources and time. The most appropriate orthogonal array (OA) to utilize as a DOE tool parameter in the experimental activities was L9, a system with three levels and four factors (parameters), according to the Taguchi technique.
The coating data were entered and analyzed using Minitab 17.0 software. Using randomized OAs, nine sets of tests of thermal spray (TS) were carried out, starting with trial 1 and ending with trial 9. Table 2 displays the experimental results for the coating process experiments.

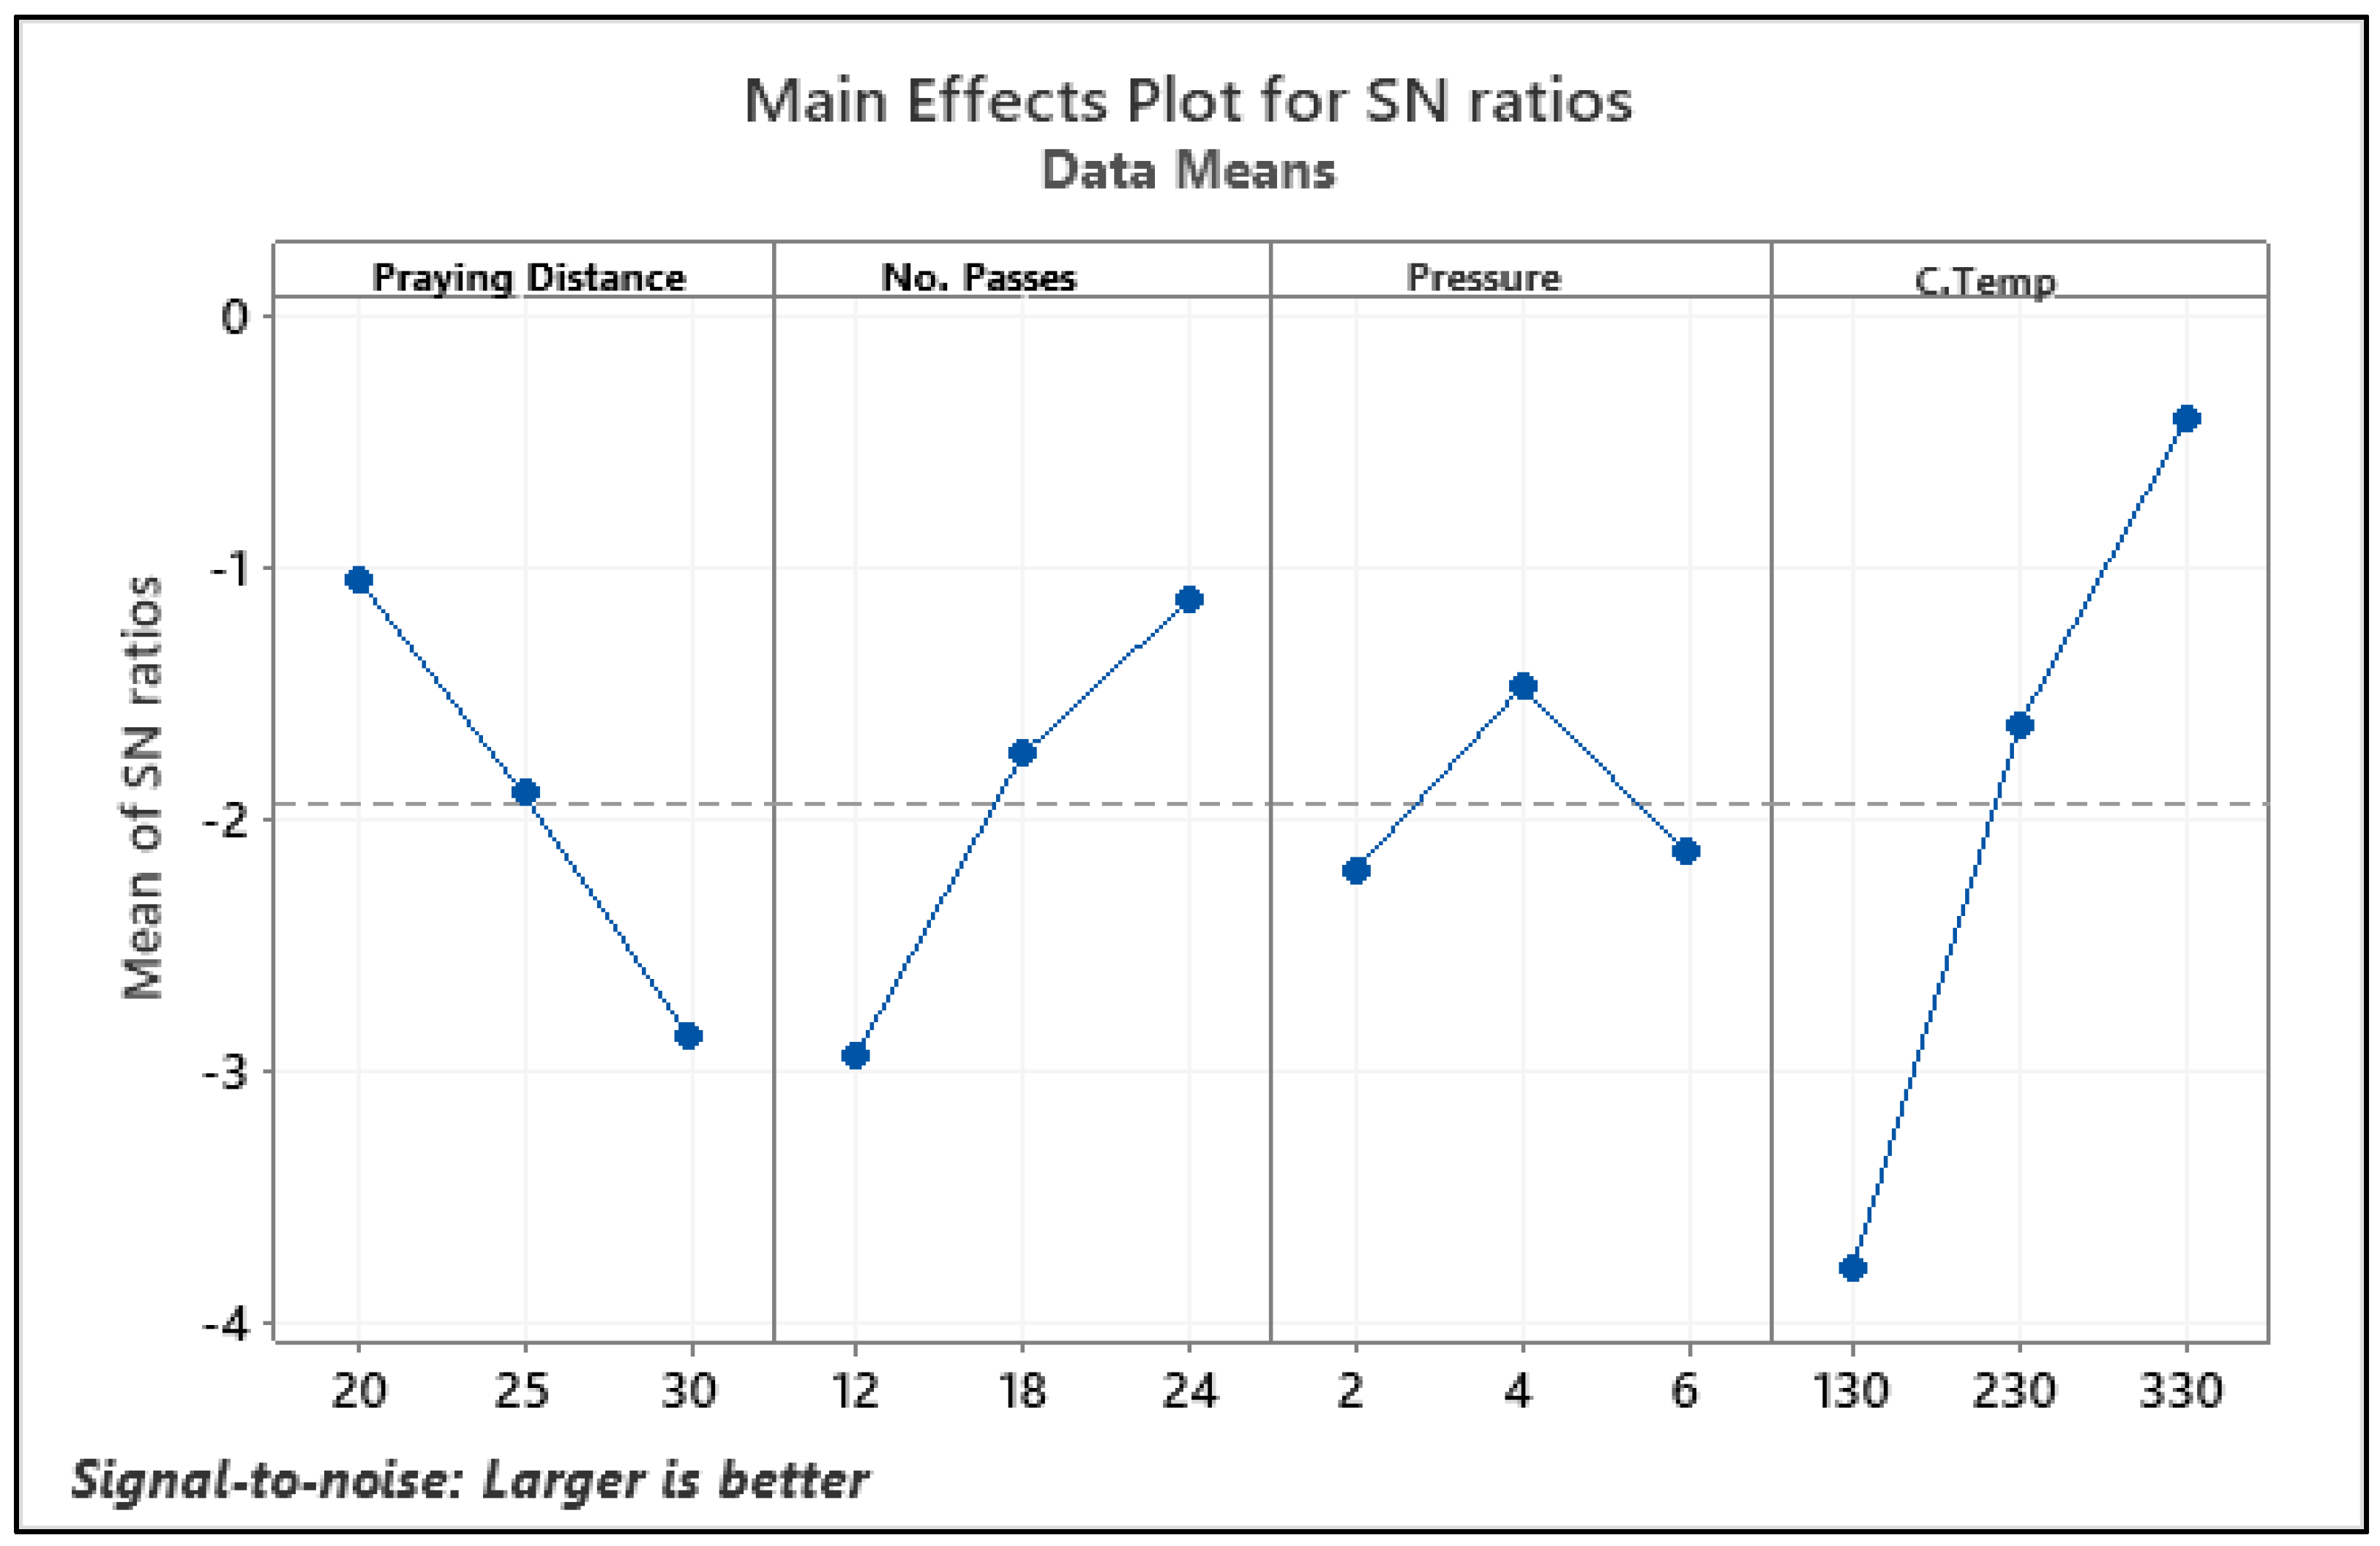
Signal-to-Noise Ratio Analysis

Next, Taguchi’s S/N ratio analysis was used to determine the ideal level for each response. As shown in Equation (1), a density with the-larger-the-better (LTB) quality characteristic was selected for the response.
η i = 10   l o g 10 1 N i = 1 r 1 y i 2   i = 1 ,   2 ,     r ,
where N is the number of tests, yi2 is the output and ηi is the S/N ratio.

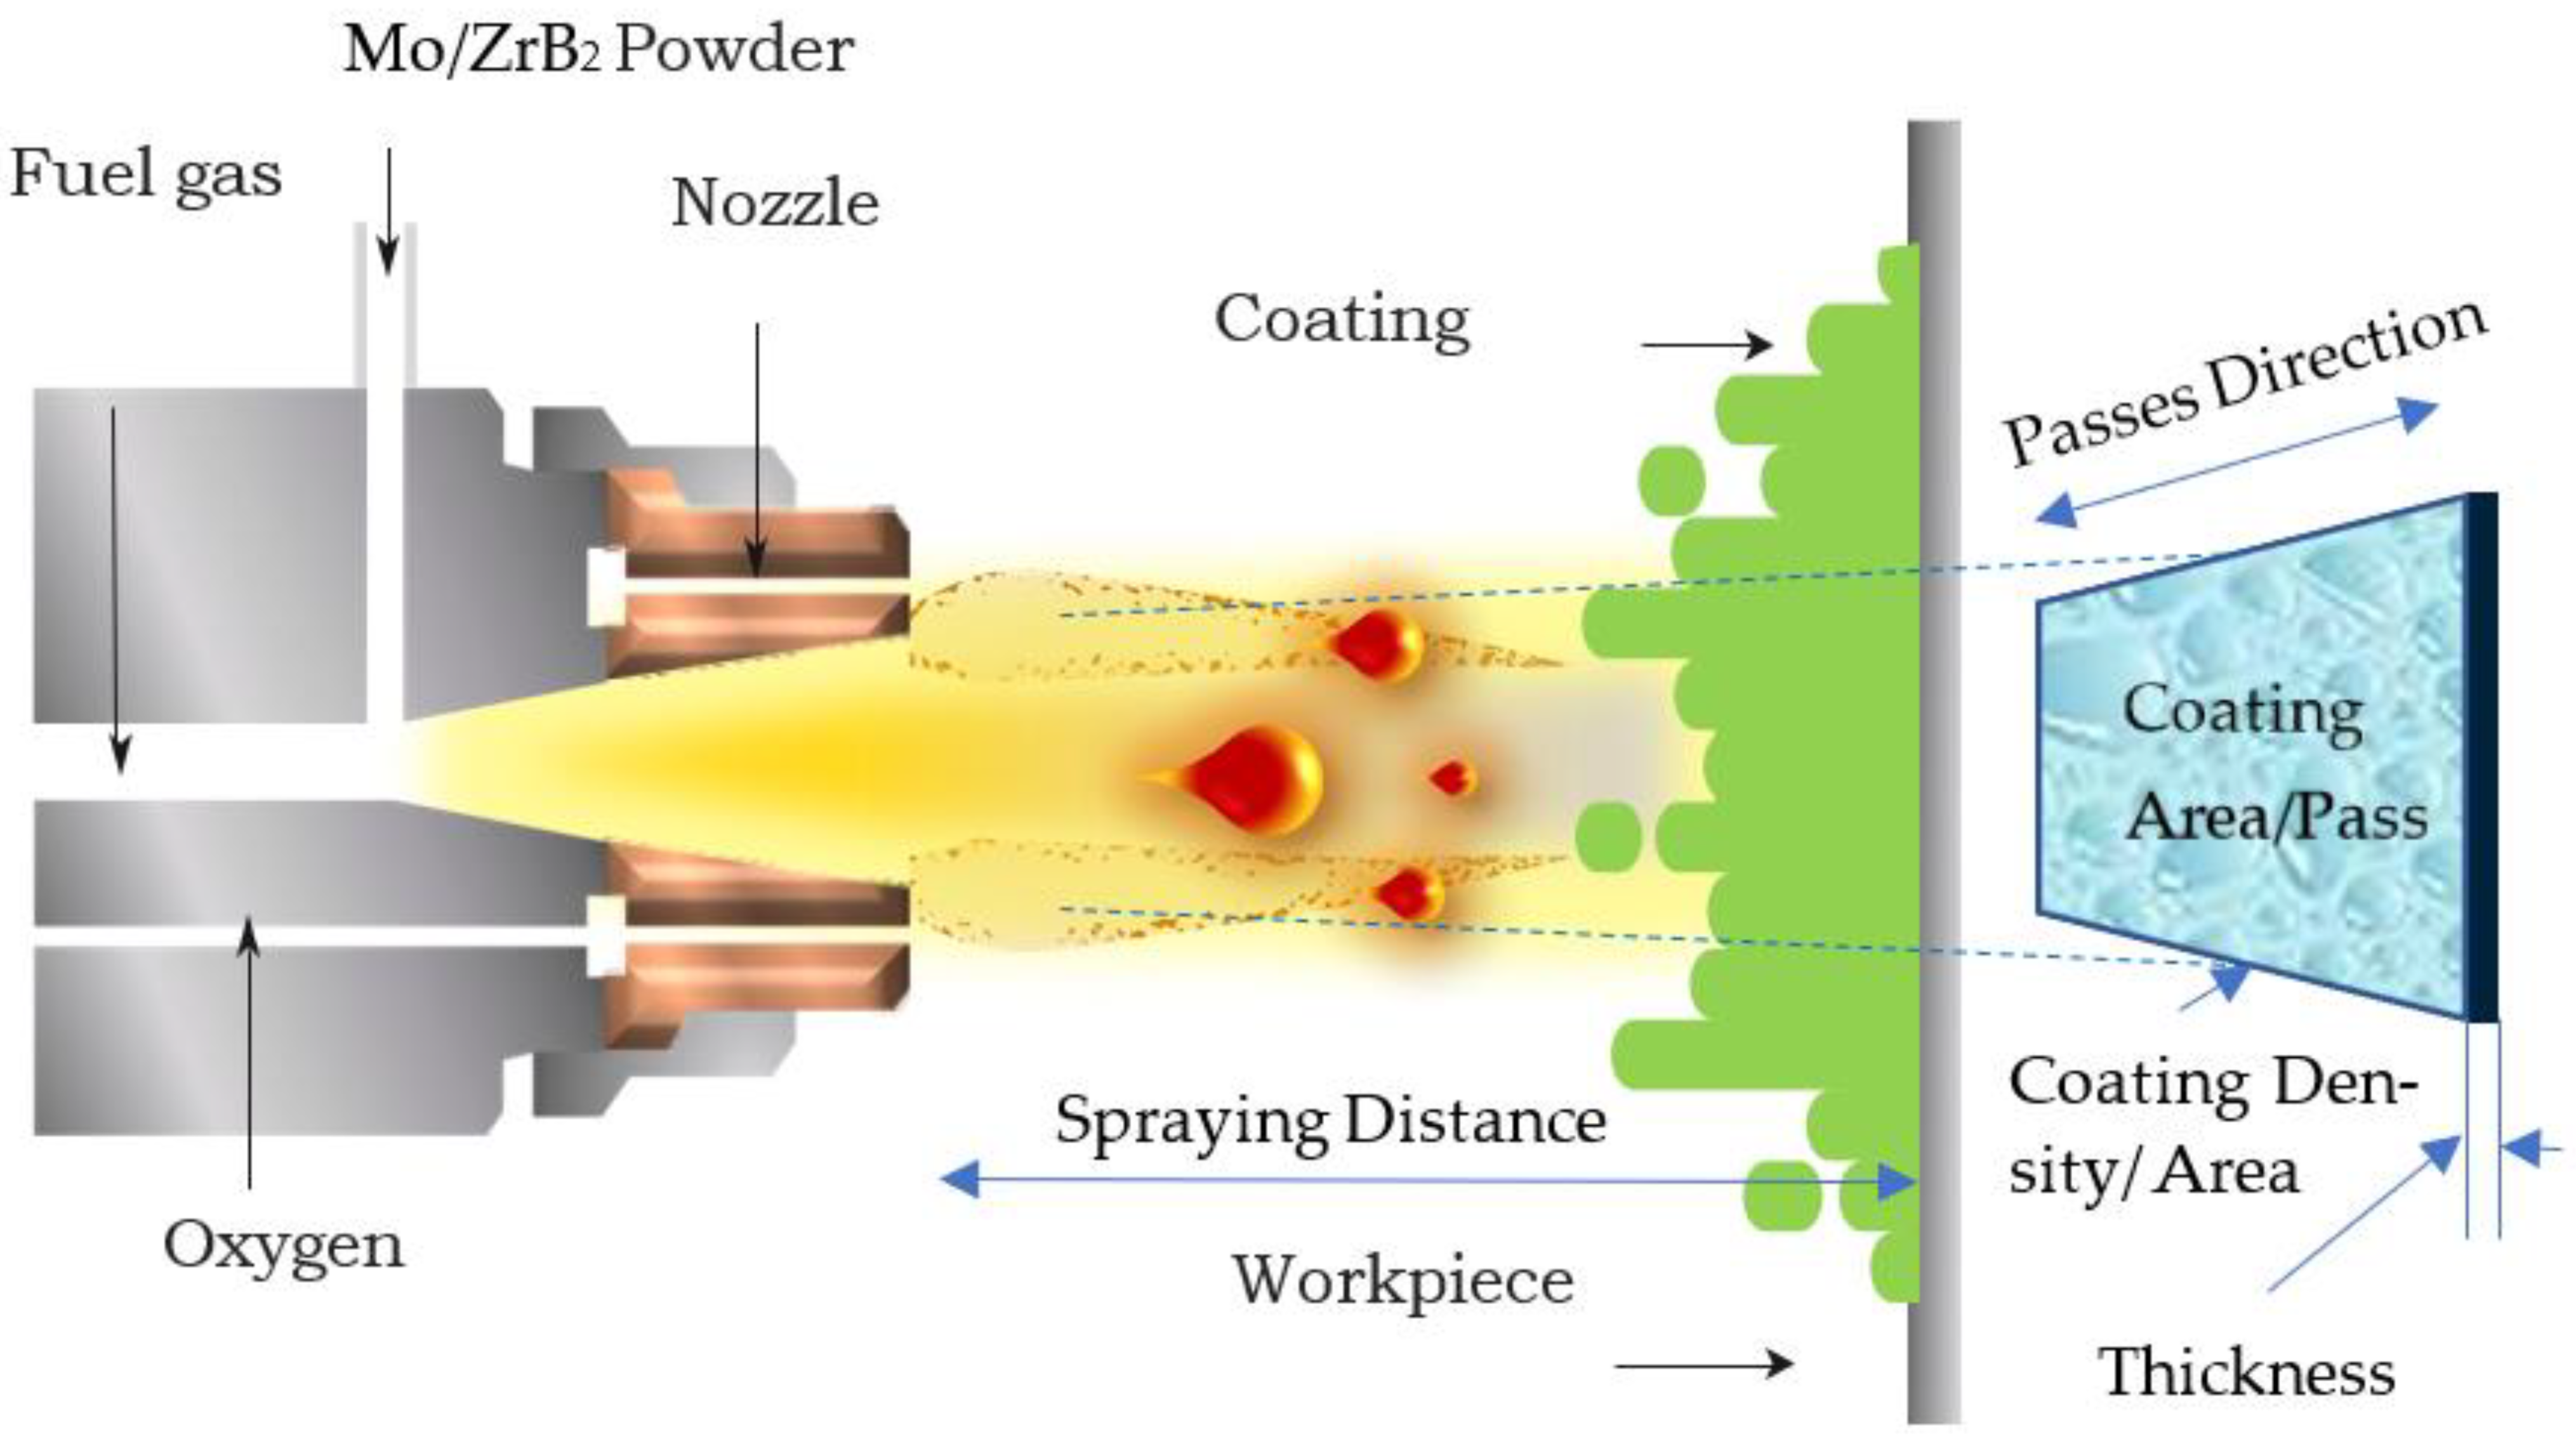
2.4. Experimental Procedures

The woven fiberglass substrates with their specifications are presented in Table 3. The molybdenum/zirconium diboride coatings were deposited onto dummy substrate surfaces of fiberglass using TS thermal spray equipment (QHT-7/h A-type high-speed flame spray gun, 3 mm nozzle). Before the coating process, the substrates were pre-heated by heating the torch without a powder feed across the substrate surface. The substrate coat surface temperature was measured. Subsequently, coating powders containing 50 wt.% ZrB2 and 50 wt.% Mo were sprayed at an atmospheric pressure and temperature. The particle Mo/ZrB2 nanopowder had a nominal particle size distribution of 10–45 nm and was deposited on each substrate in different conditions. The coated samples were cooled at room temperature.

2.5. Sample Preparation and Measurement

The dummy substrate that was utilized in the study was made of fiberglass, which has a decomposition temperature of 800 °C and a density of 1.55 g/cm3. The theoretical density (ρt), bulk density (ρb) and porosity (PS) were measured according to the ASTM D5965-19 standard using Archimedes’ approach, where the fiberglass was placed in a drying oven at 100 °C for 4 h. After that, it was weighed utilizing a precise digital balance instrument. Next, the sample was taken to obtain the immersed mass by immersing it in distilled water. The boiling method, as prescribed in the ISO standard, was used to measure the soaked mass, where the sample was put in a filled beaker of water that was boiled on a hot plate for three hours. The droplets were removed from the surfaces of the sample by using a wet absorbent cloth, and finally, its weight was measured. The bulk density was calculated based on Equation (2)
ρ C S = m d m m m s × ρ w
where ρ C S is the density of the coated sample, ρ w is the density of distilled water at room temperature (0.997 g/cm3), md is the mass of the dry sample, mm is the mass of the immersed sample and ms is the mass of the soaked sample. In this study, the utilized fiberglass substrates had a known density; hence, the total density of the coating was determined by the following Equation (3)
ρ c = ρ C S ρ F
where ρF is the density of fiberglass.

2.6. Validation

The coating process was carried out using the optimized parameters in order to validate the S/N ratio. The coating density and microstructure of the sample that was coated at the optimal coating parameters were measured and characterized, repeating each of the previous processes. The dependent variable, Cd, was then modeled as a function of the spraying distance, pressure, number of passes and coat-face temperature by using linear regression analysis, predictive mathematical models and Minitab 17.0 software. The experimental outcomes of the optimized parameters were contrasted with the results of the mathematical prediction models.

3. Results

3.1. Taguchi Method

The difference between the experimental data and the targets was converted by Taguchi’s loss function into a S/N ratio, or a ratio of the mean to standard deviation. Taguchi employs a signal and noise to symbolize the desired and unwanted values for the response. In order to get the S/N ratio, Equation (1) was employed, and the obtained results are shown in Table 4. The S/N ratio was separated into three groups based on the desired level of response: the-medium-the-better, the-larger-the-better and the-lower-the-better [22]. The larger-the-better level of the Cd was characteristic of the responses in this study.

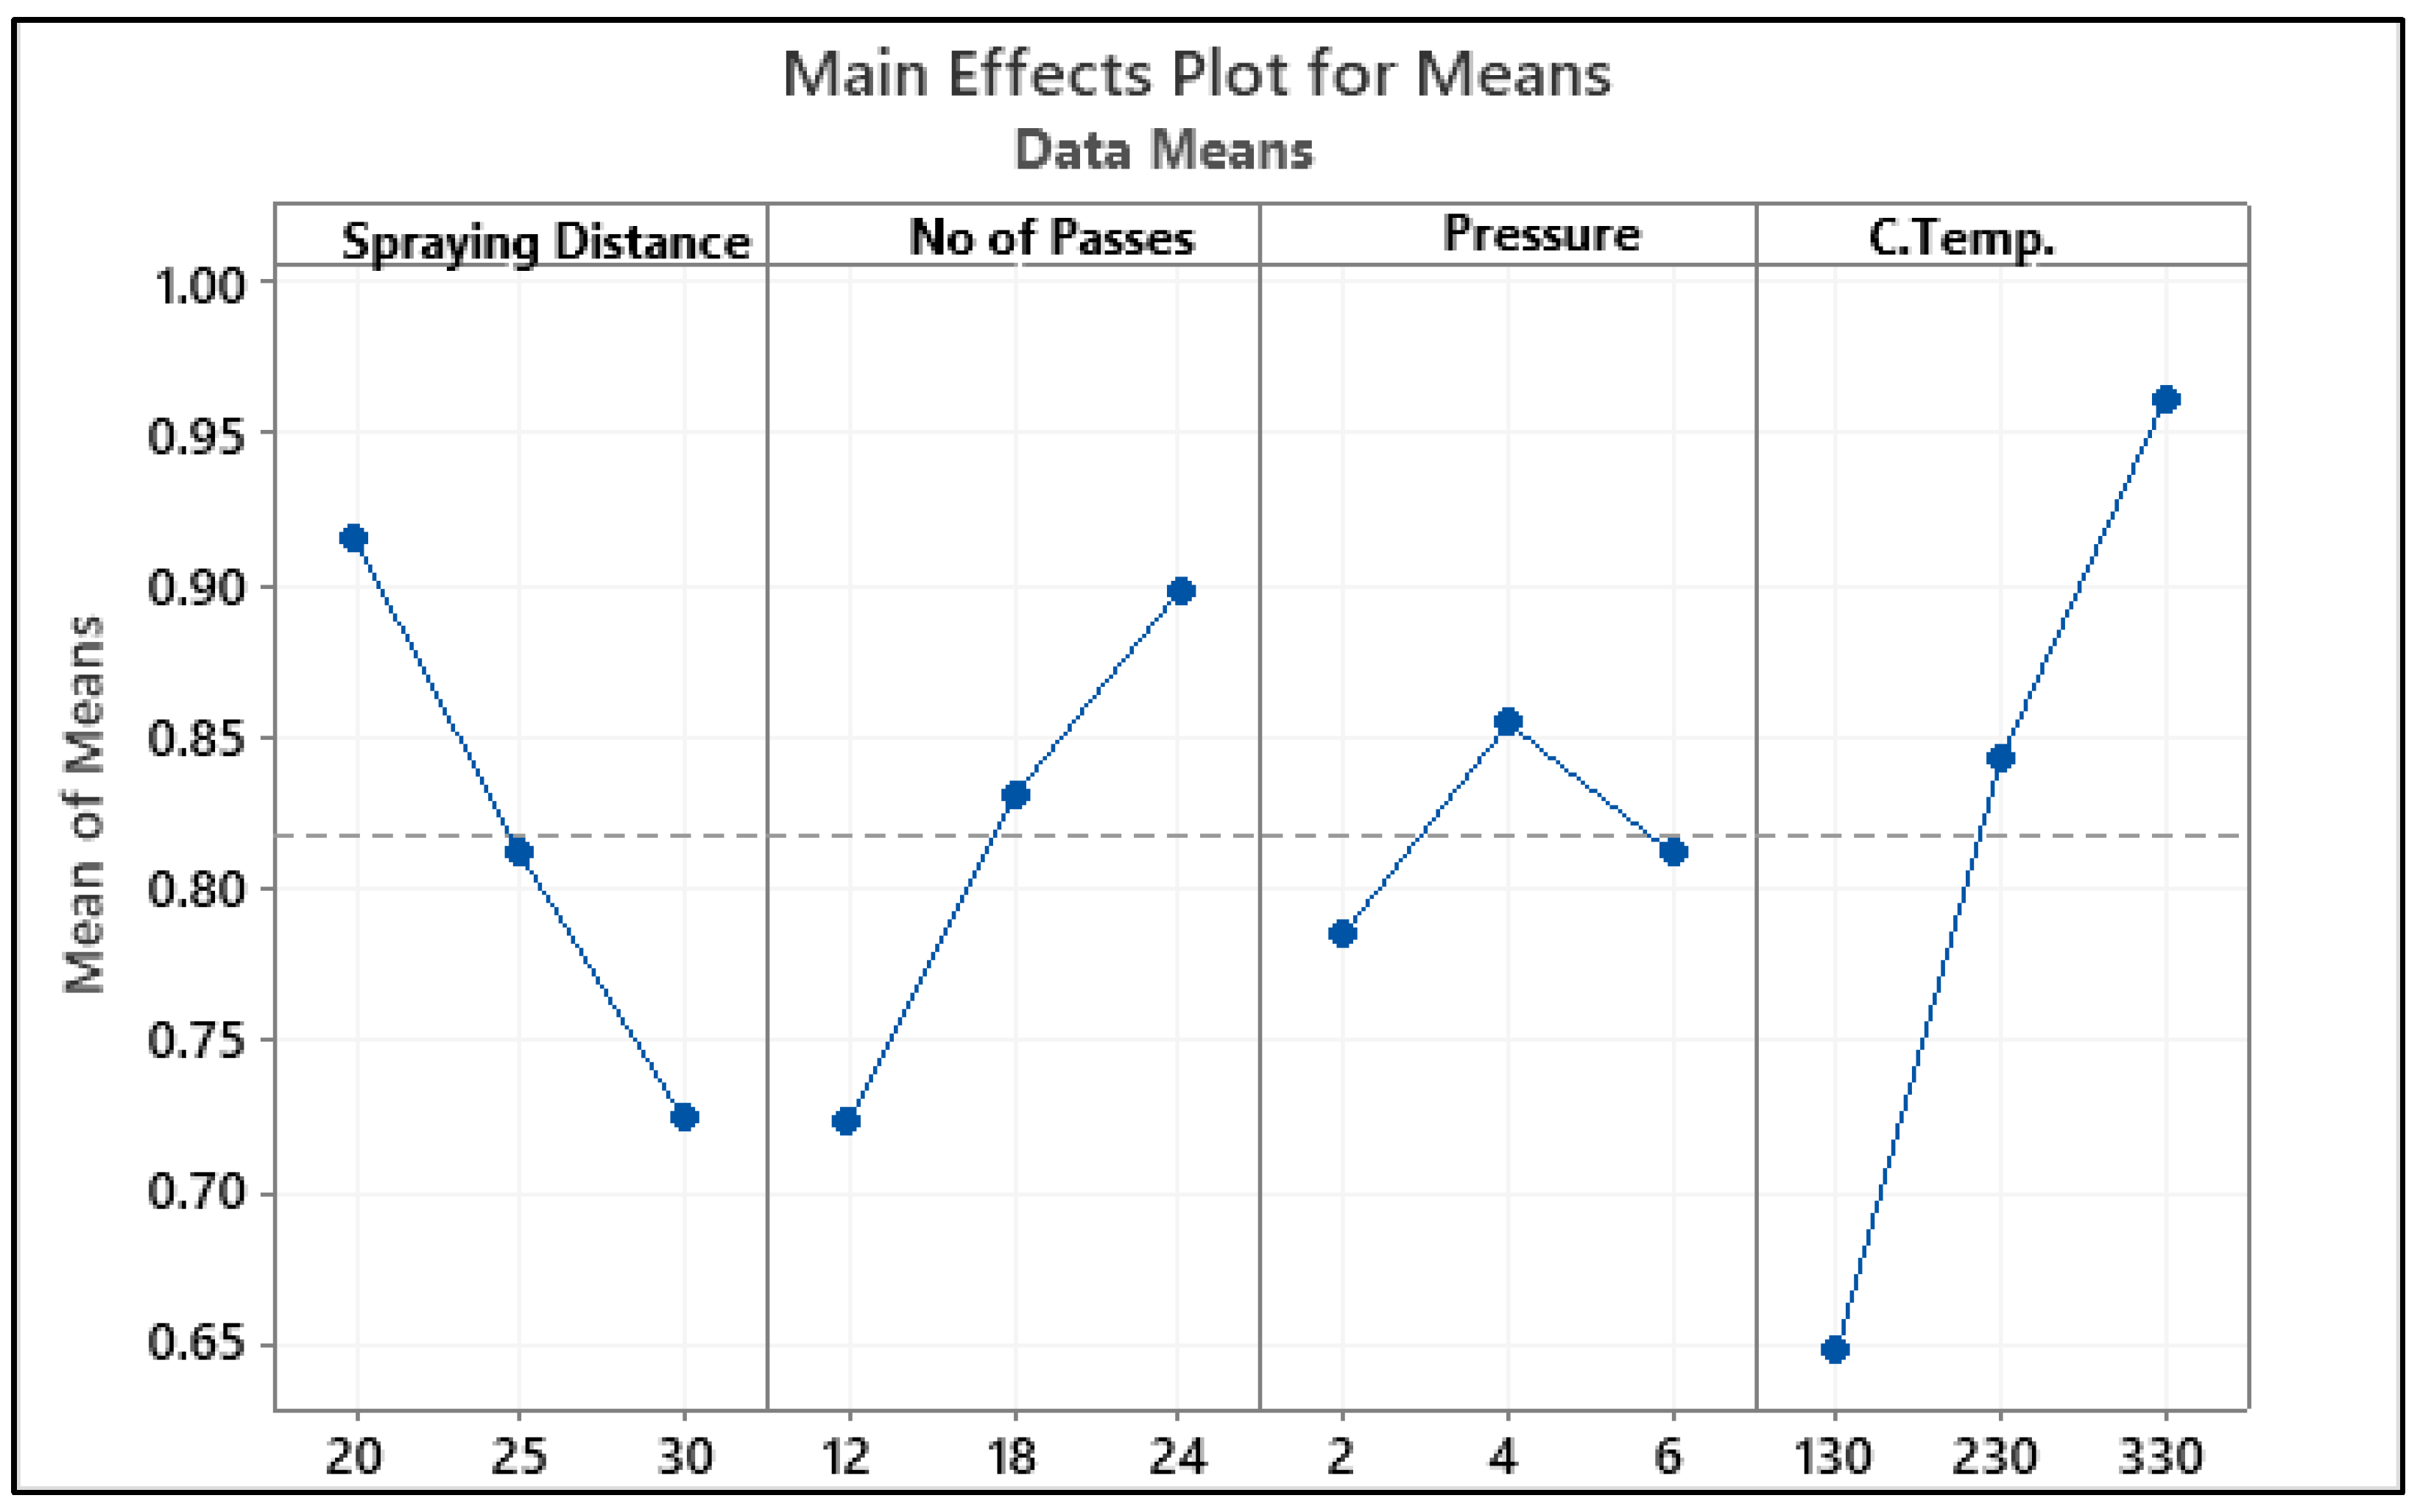
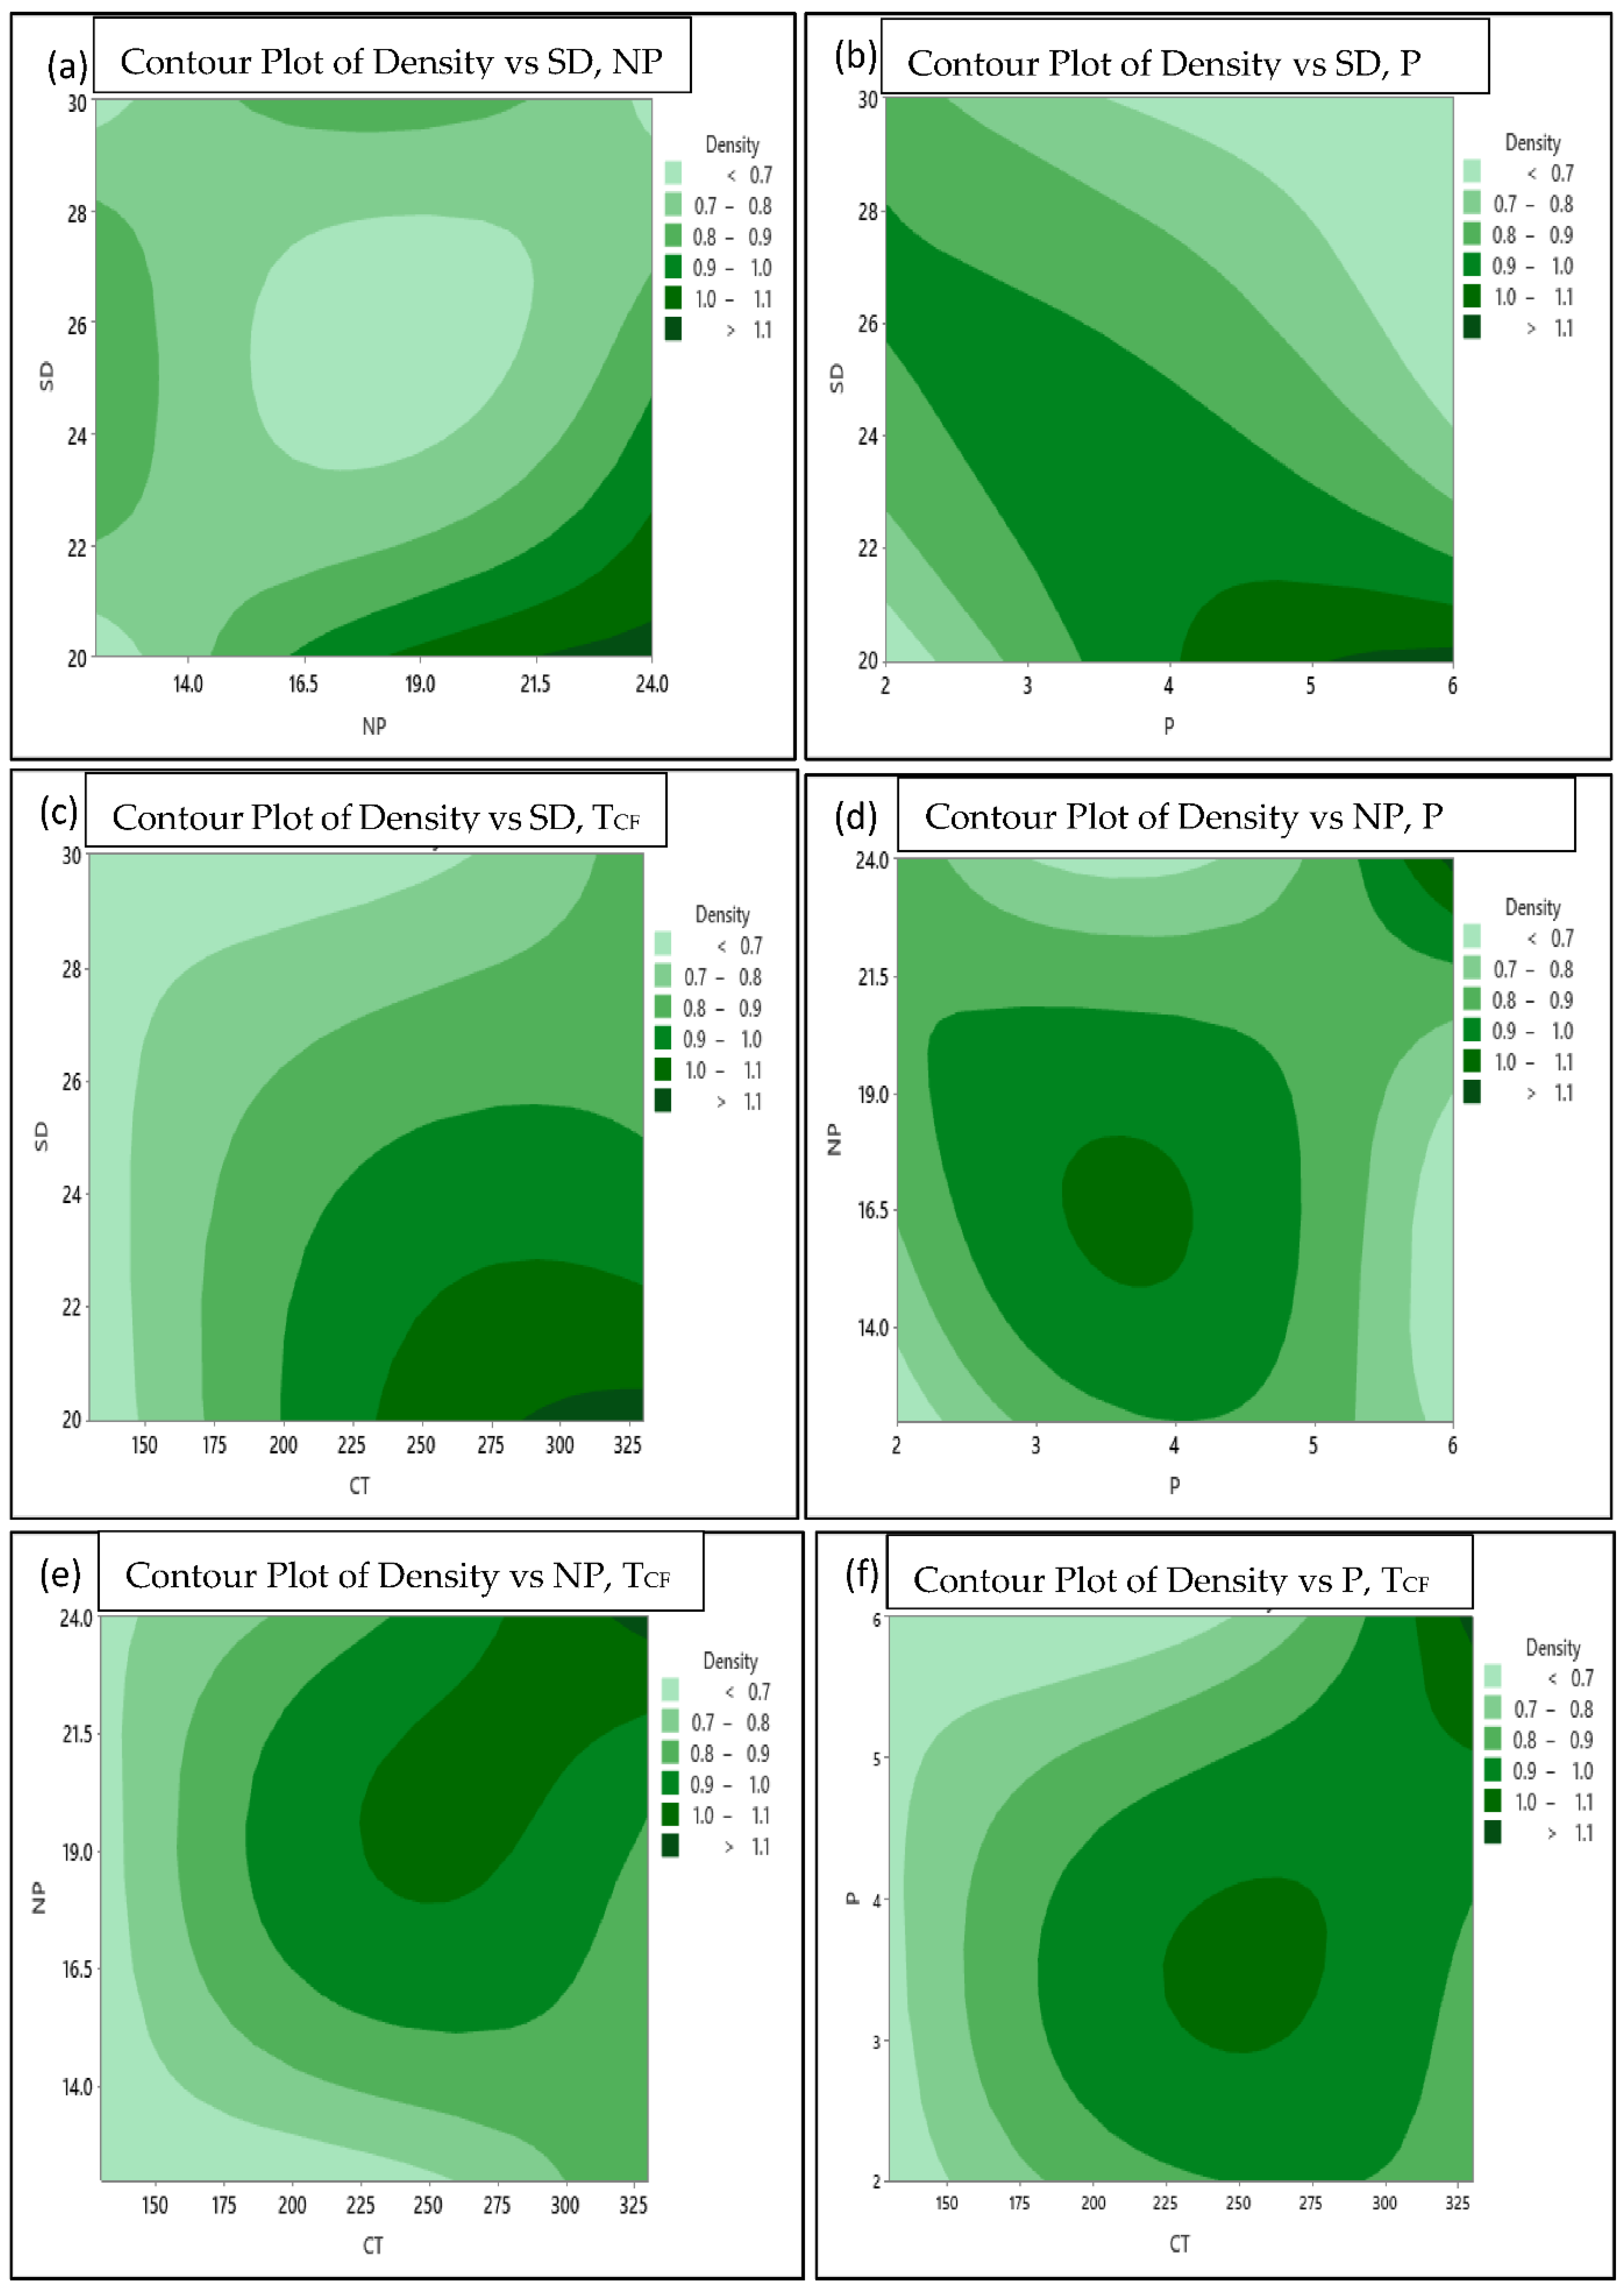
3.2. Effect of Process Parameters on the Coating Density

The effect of the thermal spray coating parameters, during the coating of the fiberglass substrates using Mo/ZrB2, on the coating density (Cd) is presented in Figure 2. The larger the means of Cd, the better the density of the coating of the samples. Figure 2 shows that when the spraying distance increases, the mean of means decreases. This sharp decline in the mean from 0.93 to 0.73 when the spraying distance was increased from 20 to 30 cm was caused by the solidifying of the melted powders projected onto the substrate [23]. As reported previously, the optimum spraying distance to obtain denser coated surfaces is higher than 10 cm [24].
With the increase in the number of passes during the coating process, the density of the coated material was increased due the occurrence of overlapping [25]. As observed from Figure 2, the optimum gas pressure is 4 bar for high-density coating. Low pressure led to a decrease in the flow rate and particle velocity, while extra pressure led to an increase in the particle velocity. At a high velocity, the dwell time decreased, during which the particles remain unmelted or partially melted [24,26]. Furthermore, the increase in the coat-face temperature led to sharp increases in the coating density, which resulted due to the melting of the coated particles at the high temperature [26,27].

3.3. Optimum Selected Parameters for Cd

Table 5 shows the response for the S/N ratio of Cd. Figure 3 displays the mean S/N ratio graph produced by the Minitab software tool. A higher S/N ratio indicated that there was less variation between the expected and measured output. The highest mean S/N ratio for Cd was obtained at 20 mm of coating depth, 24 passes at 4 bar pressure and a 330 °C coat-face temperature, as can be seen in Figure 3. The expected optimum parameters for obtaining a high coating density using the Taguchi method were SD = 20 mm, NP = 24, P = 20 bar and TCF 330 °C. The predicted combination of the optimum set was represented as SD1-NP3-P2-TCF3 for Cd.

3.4. Confirmation Test

In order to verify Taguchi’s predicted optimum conditions, confirmation experiments were conducted. The predicted S/N ratio was used to estimate and verify the response under the anticipated optimal coating conditions. The results of the confirmation experiments, which were performed using the Taguchi predicted ideal coating parameters, are reported in Table 6 for Cd. The representative performance results were improved by the forecasted Cd optimal coating parameters. The S/N ratios of the expected and optimal coating processes for Cd are shown in Table 6 to be quite similar. In comparison to the original settings, the enhanced S/N ratios for Cd were discovered at the optimal coating parameters with a value of 4.79 dB. The Cd confirmation results are shown in Table 5. According to the confirmation tests, the Taguchi-predicted optimum parameters yielded results that were superior to those of the original parameter conditions. The increase in the coating density was, therefore, 42.55%.

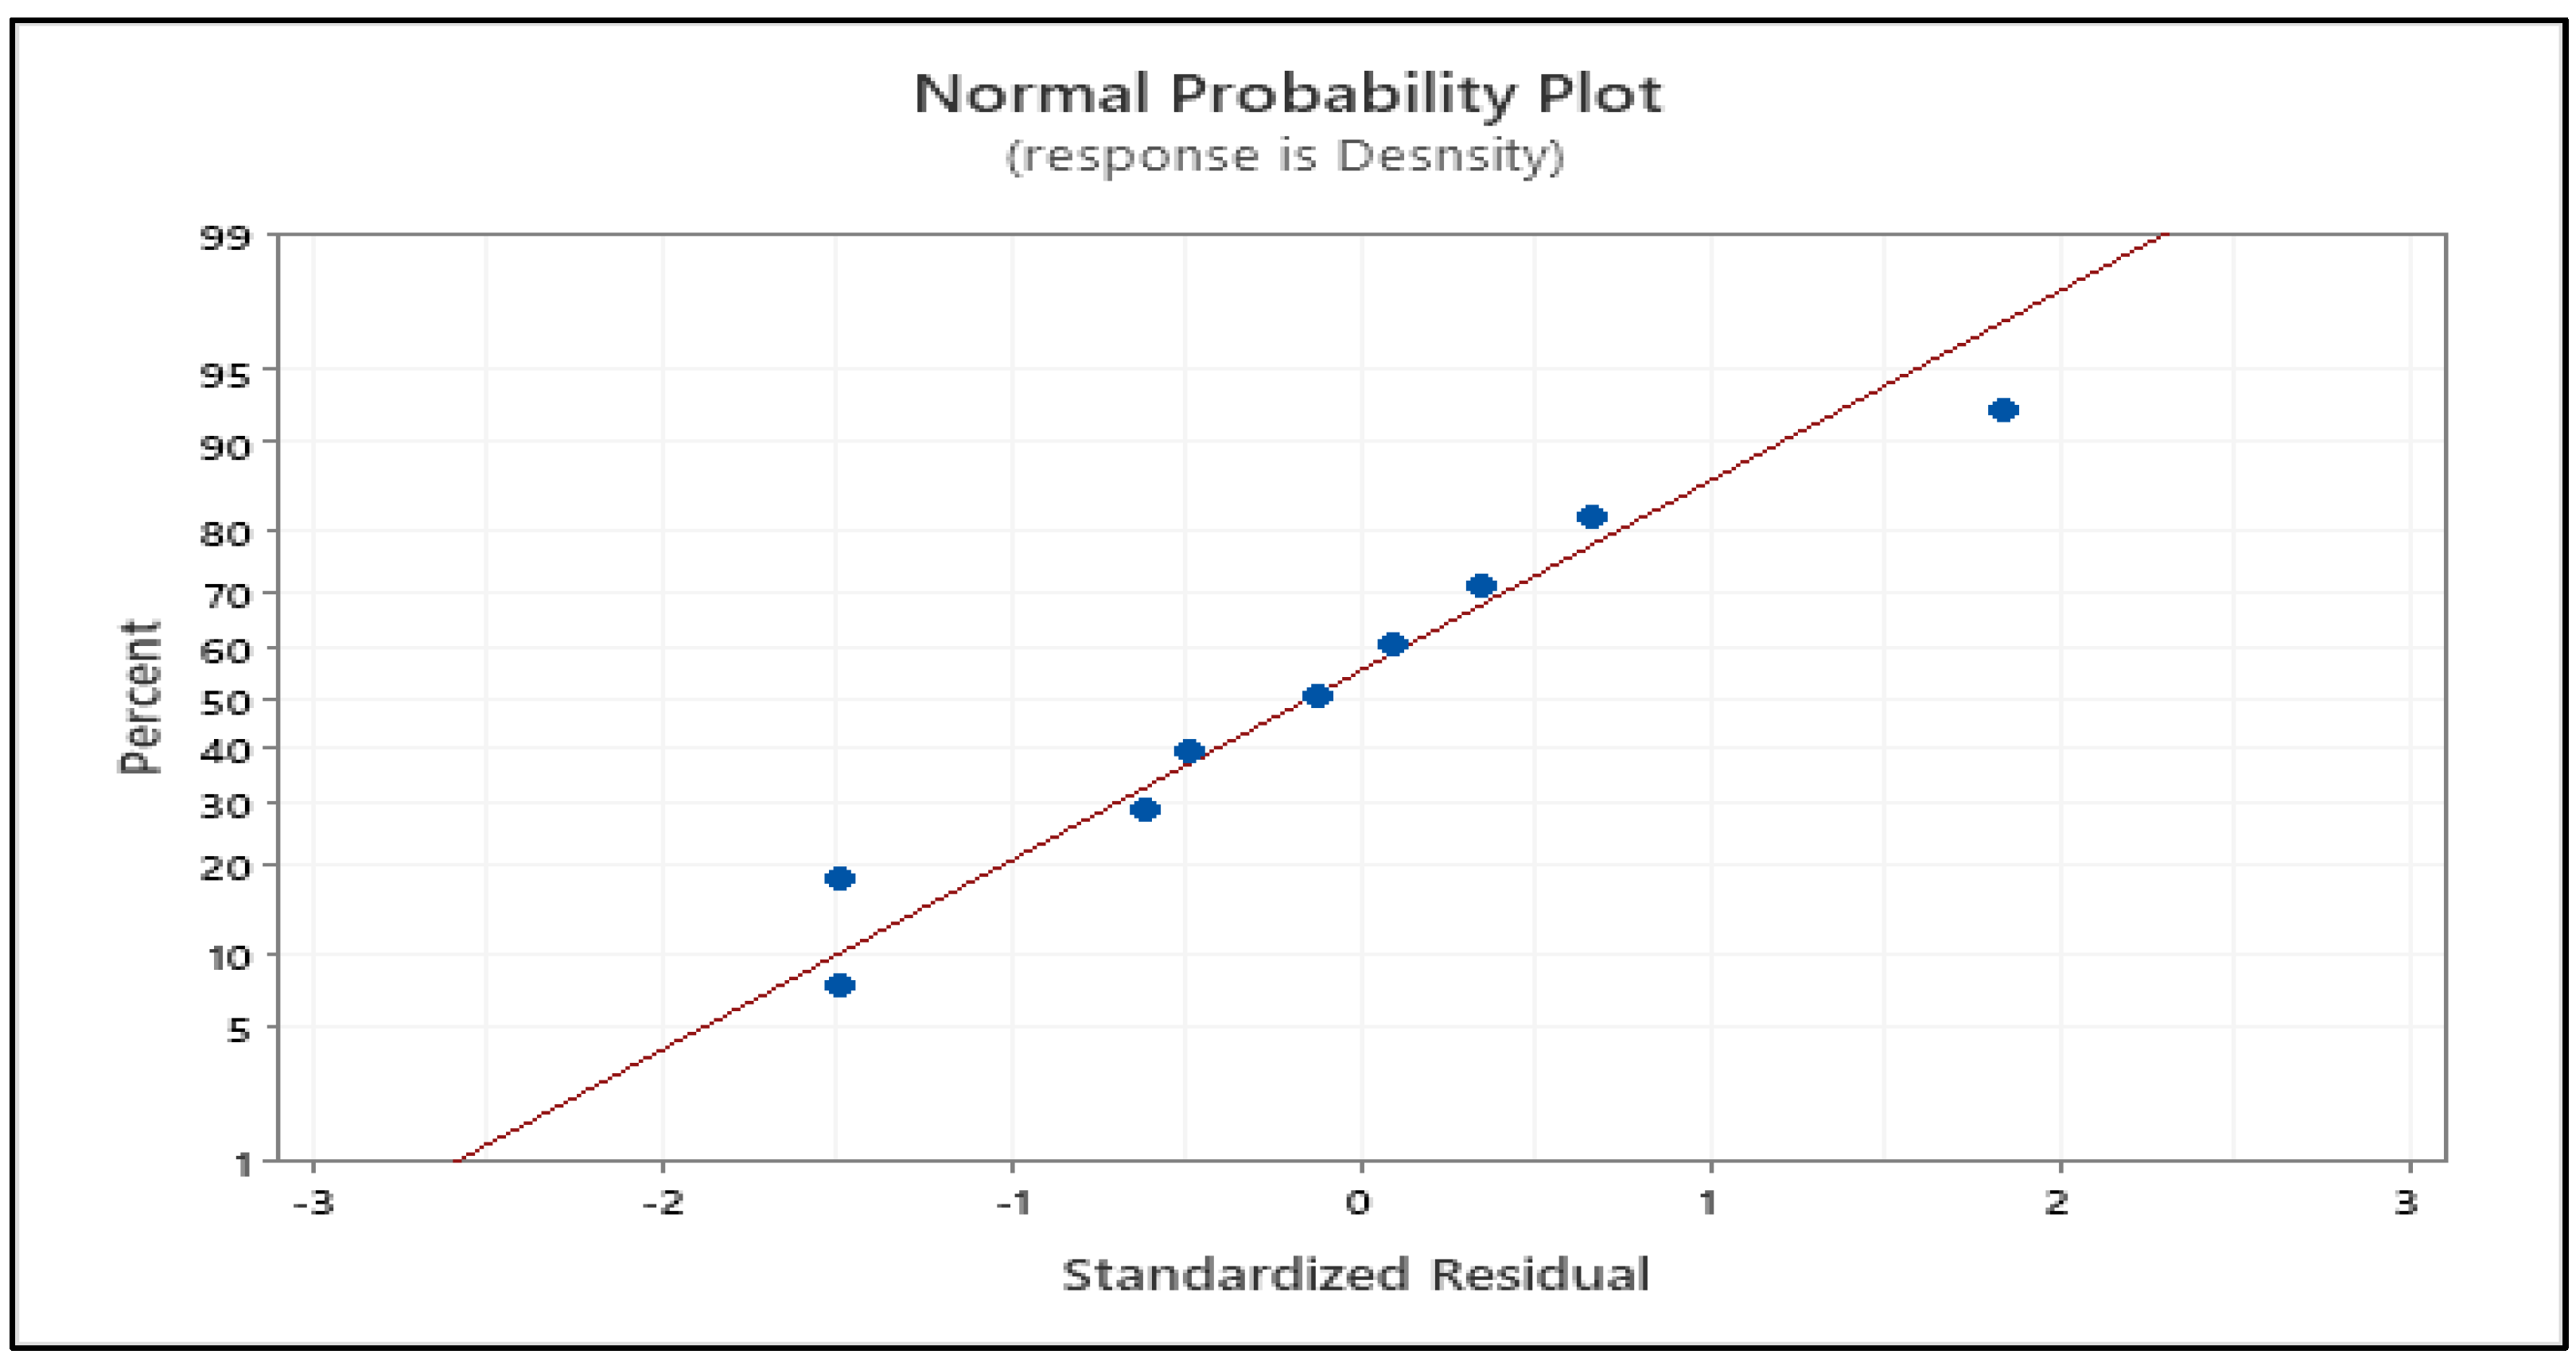
3.5. Analysis of Variance (ANOVA)

The process variable with the biggest impact on the result was identified through ANOVA. Table 6 shows the ANOVA results for Cd. Referring to the listed data in Table 7, the coat-face temperature had the greatest influence on Cd, followed by the number of passes, spraying distance and chamber pressure, which contributed to Cd by 61.29%, 17.89%, 17.42% and 3.35%, respectively. The ANOVA results revealed that Cd was significantly affected by the coat-face temperature, number of passes and spraying distance, whereas the gas pressure had an insignificant effect on the density of the coating. These results are in good agreement with the previous studies [28].

3.6. Modeling

Equation (4) was driven by the linear regression to predict the values of Cd.
Cd = 0.644 − 0.01910 SD + 0.01463 NP + 0.0066 P + 0.001572 CT
(R2 = 96.11%)
The developed regression model of Cd had a high coefficient of determination R2 value of ~96.11%. This suggests that the established models’ dependent and independent variables were well-matched. The residual plot confirmed the coefficient’s importance in the forecast model. When the plot was in a straight line, however, the model’s error was seen as regularly distributed and substantial. Figure 4 shows the Cd residual nearly in a straight line, suggesting that the established models were significant.
The created model was validated using confirmation tests, and the outcomes of the tests were chosen at random from the arrangement of the experimental matrix. The outcomes showed that the experimental and predicted values agreed well with the parameters listed in Table 8.
By observing the distinct contours of the anticipated response variables, contour plots were used to assess the relationship between the response and two variables. The relationship between the coating parameters and the coating density (Cd) values is represented by the contour plots in Figure 5. Figure 5a shows that the highest Cd range was at two dozen passes (24) and a spraying distance of 20 cm. The low spraying distance with the large number of passes generated a denser coating. Figure 5b indicates that the density was below 0.7 g/cm2 when the pressure and spraying distances ranged between 4–6 bar and 24–30 cm, respectively. The highest Cd was attained when the nitrogen pressure and spraying distance were in the range of 4–6 bar and 20–22 cm, respectively. The relationship between the Cd, spraying distance and coat-face temperature can be observed in the zone of the plot located at 20–24 cm SD and 225–325 °C TCF, as presented in Figure 5c. The relationship between the density, pressure and number of passes is shown in Figure 5d. It can be seen that Cd is higher than 1.1 g/cm2 if P and NP are in the range of 3.5–4.5 bar and 15–18, respectively. The maximum coating density was found when the CP and NP were 325 °C and 24, respectively, as demonstrated in Figure 5e. Finally, for the relationship between the P and TCF, there was a zone in which the coating density was considered to be high. The region was located in the plot at 3–4 bar and 225–275 °C of P and TCF, respectively, as can be observed in Figure 5f.

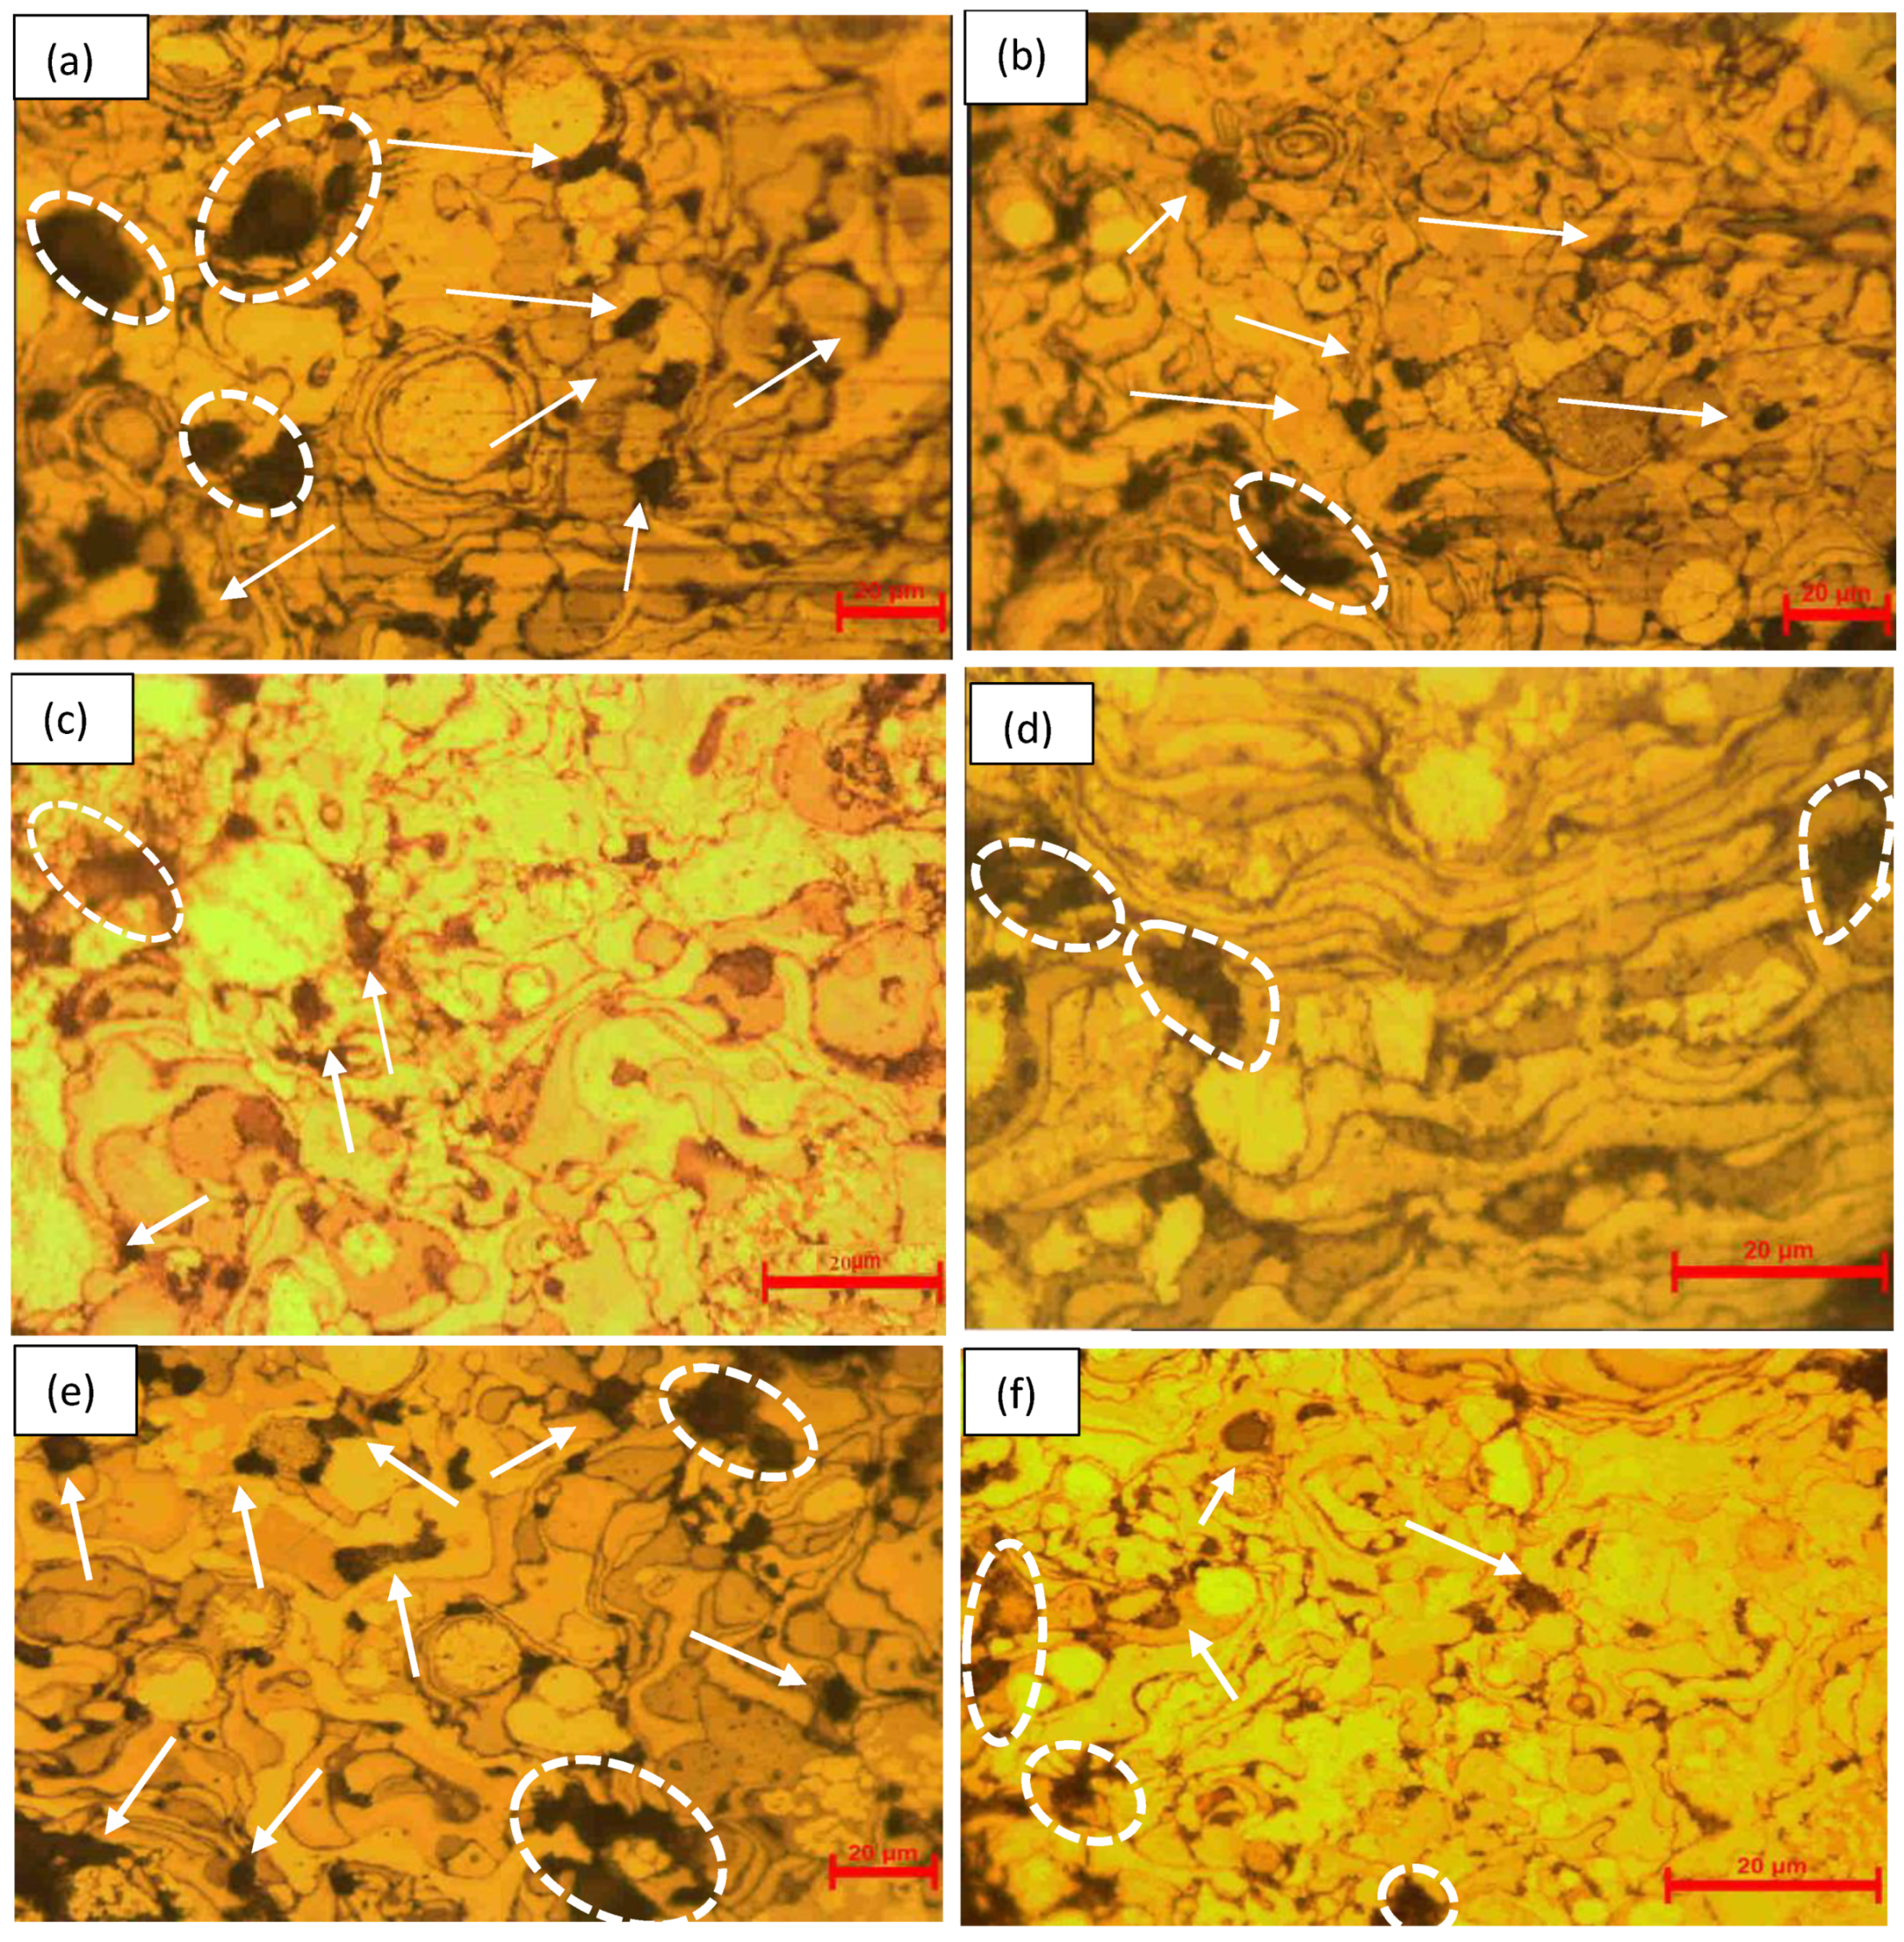
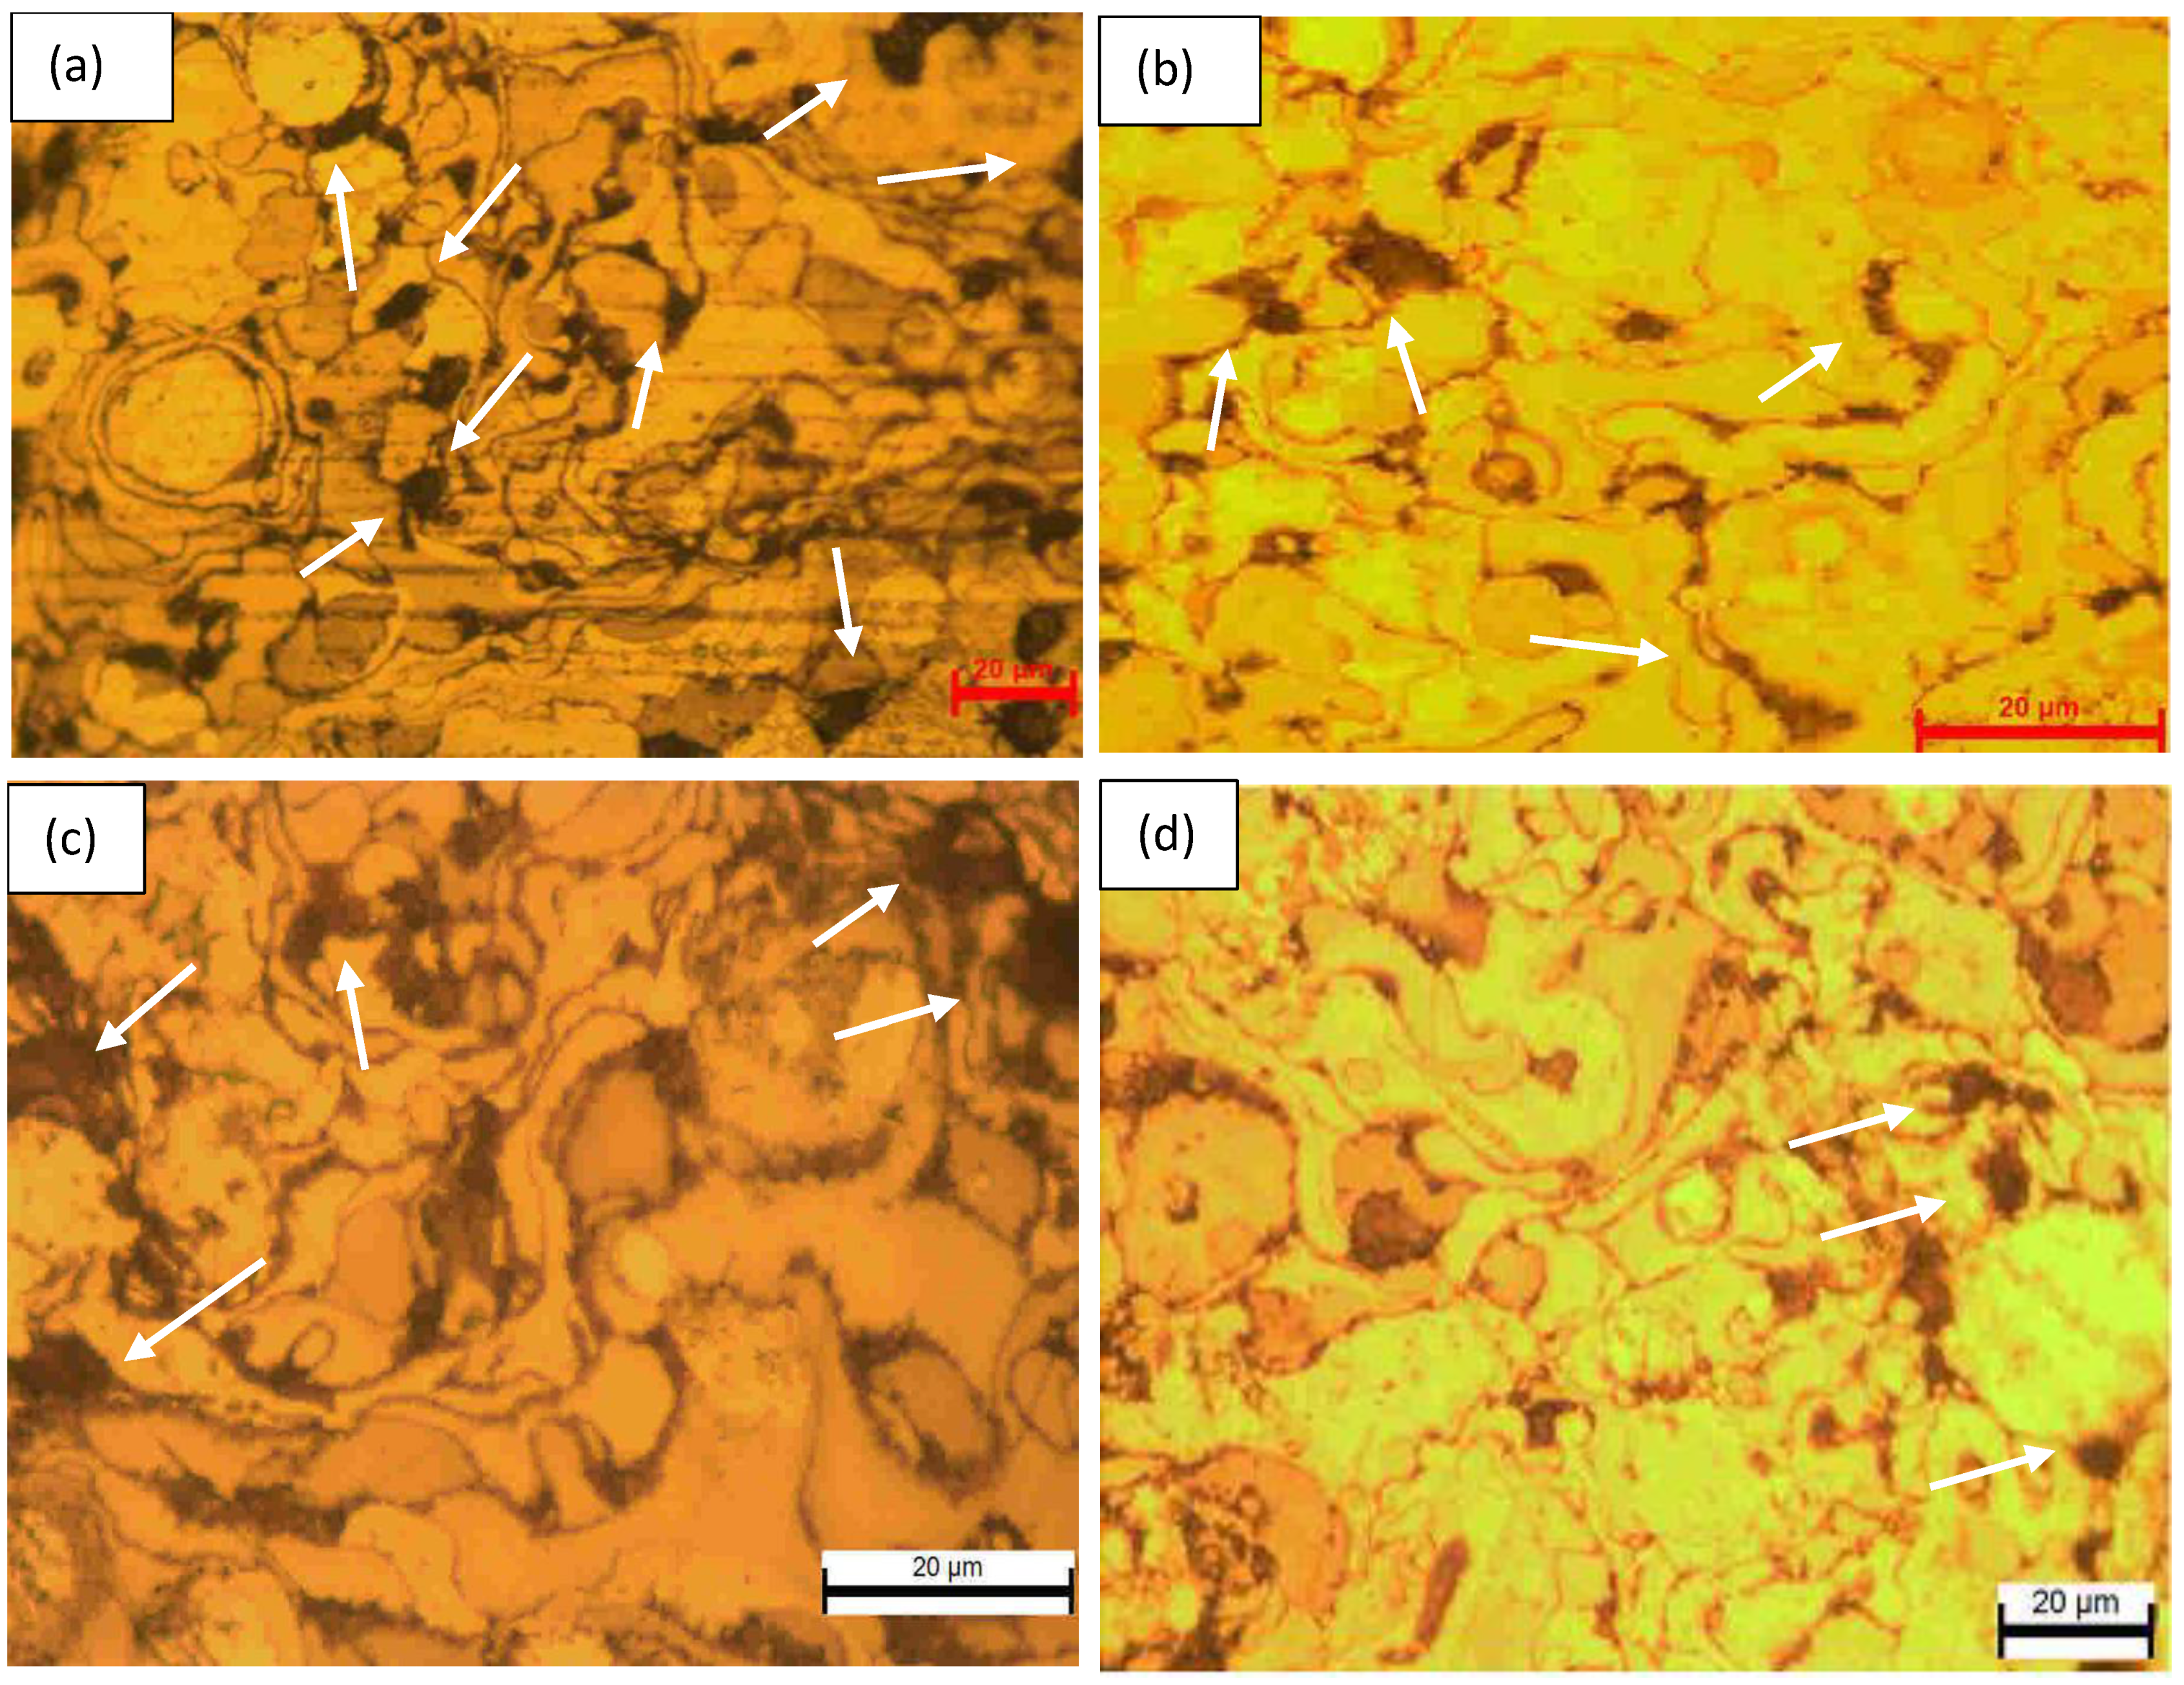
3.7. Morphological Analysis

The microstructure of the coating was examined by an optical microscope (OM). Figure 6 and Figure 7 show micrographs at the different spraying parameters. Nine images were taken to analyze the porosity of the coated sample to confirm the density tests. Generally, the porosity was estimated based on the percentage taken from the relationship between the pore area and the total area [29]. A denser coating surface was observed in the sample coated at a high coat-face temperature, large number of passes and low spraying distances, as shown in Figure 6c,d and Figure 7d. The OM micrographs make it clear that microstructures with low porosity and no cracks were used as a first structure. Figure 6a shows the high pore-coated surface of S1, which was coated at low temperature, low pressure and a low number of passes. The average pore area of the images was high compared to the total area. As observed in Figure 7d, the TS coating exhibited a good microstructure due to the accumulation of the optimal spraying distance, coat-face temperature, number of passes and pressure, resulting in coatings that were very dense, porous free and well-bonded to the substrate.

4. Conclusions

A Mo/ZrB2 coating was produced on a fiberglass substrate in different coating conditions. The following conclusions were derived from the findings of the analysis:
  • Using the Taguchi approach, the ideal coating parameters for achieving a high coating density (Cd) were determined to be SD = 20 cm, NP = 24, P = 4 bar and TCF = 330 °C ((SD.)1-(NP.)3-P2-(S.T.)3). It was noted that the Taguchi-determined optimal coating setting had a 42.55% increase in Cd.
  • It was observed from the ANOVA that the coating density (Cd) was significantly influenced by the coat-face temperature, followed by the number of passes, spraying distance and pressure, with contributions of 6.29, 17.89, 17.42 and 3.35%, respectively;
  • It can be inferred from the well-founded optimal coating parameters that TS might be a promising method for achieving an extremely dense coating surface;
  • The projected and experimental outcomes showed a strong level of agreement, according to the mathematical model of the Cd that was built. As a result, the generated model was able to choose the appropriate thermal spraying parameters without the need for test experiments.
  • From the OM images, the TS coating exhibited a good microstructure due to the accumulation of the optimal spraying distance, coat-face temperature, number of passes and pressure, resulting in coatings that were very dense, porous-free and well-bonded to the substrate.
  • We advise conducting further research to determine how TS process parameters affect microhardness.

Author Contributions

Data curation M.M.M., H.G.M. and T.M.B.A.; formal analysis, M.M.M. and H.G.M.; funding acquisition, T.M.B.A.; investigation, M.M.M., H.G.M., F.A. and M.S.A.; methodology, M.M.M., H.G.M. and T.M.B.A.; project administration, T.M.B.A.; resources, T.M.B.A.; software, M.M.M. and H.G.M.; supervision, T.M.B.A., F.A. and M.S.A.; validation, M.M.M., H.G.M. and T.M.B.A.; writing—original draft, M.M.M. and H.G.M.; writing—review and editing, M.M.M., H.G.M., F.A. and M.S.A. All authors have read and agreed to the published version of the manuscript.

Funding

The authors would like to acknowledge Universiti Teknologi PETRONAS for its financial support under a grant (MRA-015MD0-137), which is gratefully appreciated.

Data Availability Statement

The information will be used for upcoming research and analysis within this project, on which we are constantly working. However, with sufficient justification, any researcher who needs the data for additional research may email the corresponding author.

Conflicts of Interest

The authors declare no conflict of interest.

References

  1. Kout, A.; Müller, H. Parameter optimization for spray coating. Adv. Eng. Softw. 2009, 40, 1078–1086. [Google Scholar] [CrossRef]
  2. Kiilakoski, J.; Trache, R.; Björklund, S.; Joshi, S.; Vuoristo, P. Process parameter impact on suspension-HVOF-sprayed Cr2O3 coatings. J. Therm. Spray Technol. 2019, 28, 1933–1944. [Google Scholar] [CrossRef] [Green Version]
  3. Cai, Z.; Deng, S.; Liao, H.; Zeng, C.; Montavon, G. The effect of spray distance and scanning step on the coating thickness uniformity in cold spray process. J. Therm. Spray Technol. 2014, 23, 354–362. [Google Scholar] [CrossRef]
  4. Gujba, A.K.; Mahdipoor, M.S.; Medraj, M. Water droplet impingement erosion performance of WC-based coating sprayed by HVAF and HVOF. Wear 2021, 484, 203904. [Google Scholar] [CrossRef]
  5. Hanson, T.C.; Settles, G.S. Particle temperature and velocity effects on the porosity and oxidation of an HVOF corrosion-control coating. J. Therm. Spray Technol. 2003, 12, 403–415. [Google Scholar] [CrossRef]
  6. Prasad, R.V.; Rajesh, R.; Thirumalaikumarasamy, D.; Vignesh, S.; Sreesabari, S. Sensitivity analysis and optimisation of HVOF process inputs to reduce porosity and maximise hardness of WC-10Co-4Cr coatings. Sādhanā 2021, 46, 1–23. [Google Scholar] [CrossRef]
  7. Meghwal, A.; Anupam, A.; Murty, B.S.; Berndt, C.C.; Kottada, R.S.; Ang, A.S.M. Thermal spray high-entropy alloy coatings: A review. J. Therm. Spray Technol. 2020, 29, 857–893. [Google Scholar] [CrossRef]
  8. Hunter, C.E.; Gardner, T.P.; Zakrajsek, C.E. Simultaneous Optimization of Diesel Engine Parameters for Low Emissions Using Taguchi Methods. SAE Trans. 1990, 99, 2068–2078. [Google Scholar]
  9. Young, W.B.; McComb, J.A. New Piston Ring Face Coatings Using Design of Experiments. SAE Trans. 1990, 99, 1228–1235. [Google Scholar]
  10. Babu, M.V.; Kumar, R.K.; Prabhakar, O.; Shankar, N.G. Simultaneous optimization of flame spraying process parameters for high quality molybdenum coatings using Taguchi methods. Surf. Coatings Technol. 1996, 79, 276–288. [Google Scholar] [CrossRef]
  11. Nataraj, M.; Arunachalam, V.P.; Dhandapani, N. Optimizing diesel engine parameters for low emissions using Taguchi method: Variation risk analysis approach—Part I. Indian J. Eng. Mater. Sci. 2005, 12, 169–181. [Google Scholar]
  12. Katoh, Y.; Byun, T.; Nanstad, R.K. Materials Fabricated for FUTURIX-MI Experiment; Oak Ridge National Laboratory: Oak Ridge, TN, USA, 2005. [Google Scholar]
  13. Kuwabara, K.; Sakamoto, S.; Kida, O.; Ishino, T.; Kodama, T.; Nakajima, H.; Hirakawa, Y. Corrosion resistance and electrical resistivity of zrb 2 monolithic refractory. Refractories 2004, 56, 116. [Google Scholar]
  14. Chamberlain, A.L.; Fahrenholtz, W.G.; Hilmas, G.E.; Ellerby, D.T. High-strength zirconium diboride-based ceramics. J. Am. Ceram. Soc. 2004, 87, 1170–1172. [Google Scholar] [CrossRef]
  15. Rani, A.P.D.A.M.A. The Undersigned Certify That They Have Read, and Recommend to the Postgraduate Studies Programme for Acceptance This Thesis for the Fulfillment ofthe Requirements n.d. Available online: http://utpedia.utp.edu.my (accessed on 21 August 2022).
  16. Murata, Y. Cutting Tool Tips and Ceramics Containing Hafnium Nitride and Zirconium Diboride. U.S. Patent No. 3,487,594, 6 January 1970. [Google Scholar]
  17. Sung, J.; Goedde, D.M.; Girolami, G.S.; Abelson, J.R. Remote-plasma chemical vapor deposition of conformal ZrB 2 films at low temperature: A promising diffusion barrier for ultralarge scale integrated electronics. J. Appl. Phys. 2002, 91, 3904–3911. [Google Scholar] [CrossRef]
  18. Huang, B.; Zhang, C.; Zhang, G.; Liao, H. Wear and corrosion resistant performance of thermal-sprayed Fe-based amorphous coatings: A review. Surf. Coatings Technol. 2019, 377, 124896. [Google Scholar] [CrossRef]
  19. Zhang, H.; Hu, Y.; Hou, G.; An, Y.; Liu, G. The effect of high-velocity oxy-fuel spraying parameters on microstructure, corrosion and wear resistance of Fe-based metallic glass coatings. J. Non-Cryst. Solids 2014, 406, 37–44. [Google Scholar] [CrossRef]
  20. Chandra Yadaw, R.; Kumar Singh, S.; Chattopadhyaya, S.; Kumar, S.; CSingh, R. Tribological behavior of thin film coating—A review. Int. J. Eng. Technol. 2018, 7, 1656. [Google Scholar] [CrossRef]
  21. Metco, S. An Introduction to Thermal Spray. Issue 2013, 4, 24. [Google Scholar]
  22. Mohammed, H.G.; Albarody, T.M.B.; Susilawati, S.; Gohari, S.; Doyan, A.; Prayogi, S.; Bilad, M.R.; Alebrahim, R.; Saeed, A.A.H. Process Optimization of in situ magnetic-anisotropy spark plasma sintering of M-type-based barium hexaferrite BaFe12O19. Materials 2021, 14, 2650. [Google Scholar] [CrossRef]
  23. Sarikaya, O. Effect of some parameters on microstructure and hardness of alumina coatings prepared by the air plasma spraying process. Surf. Coat. Technol. 2005, 190, 388–393. [Google Scholar] [CrossRef]
  24. Han, T.; Zhao, Z.; Gillispie, B.A.; Smith, J.R. Effects of spray conditions on coating formation by the kinetic spray process. J. Therm. Spray Technol. 2005, 14, 373–383. [Google Scholar] [CrossRef]
  25. Technology, T.S.; Tucker, R.C. Introduction to Coating Design and Processing. Therm. Spray Technol. 2018, 5, 76–88. [Google Scholar] [CrossRef]
  26. Kumar, S.; Kumar, R. Influence of processing conditions on the properties of thermal sprayed coating: A review. Surf. Eng. 2021, 37, 1339–1372. [Google Scholar] [CrossRef]
  27. Łatka, L.; Pawłowski, L.; Winnicki, M.; Sokołowski, P.; Małachowska, A.; Kozerski, S. Review of functionally graded thermal sprayed coatings. Appl. Sci. 2020, 10, 5153. [Google Scholar] [CrossRef]
  28. Dinh, V.C.; Nguyen, T.H.; Nguyen, K.L. Application of taguchi method and anova techniques to maximize hvof spraying to wc-12co. Key Eng. Mater. 2020, 854, 109–116. [Google Scholar] [CrossRef]
  29. Andreola, F.; Leonelli, C.; Romagnoli, M. Techniques Used to Determine Porosity. Am. Ceram. Soc. Bull. 2000, 79, 49–52. [Google Scholar]
Figure 1. Schematic diagram of the high-velocity oxy spray process.
Energies 15 09415 g001
Figure 2. Effect of coating parameters on Cd.
Energies 15 09415 g002
Figure 3. Mean S/N ratio of Cd.
Energies 15 09415 g003
Figure 4. Normal probability plot of the residuals for Cd.
Energies 15 09415 g004
Figure 5. Contour plot for Cd vs. (a) SD and NP, (b) SD and P, (c) SD and TCF, (d) NP and P, (e) Np and TCF and (f) P and TCF.
Energies 15 09415 g005
Figure 6. OM of the sample: (a) S1, (b) S2, (c) S3, (d) S4, (e) S5 and (f) S6.
Energies 15 09415 g006
Figure 7. OM of the sample: (a) S7, (b) S8, (c) S9 and (d) optimum set.
Energies 15 09415 g007
Table 1. Thermal spray process parameters and their levels.
SymbolsProcess ParametersUnitsLevels
123
SDSpraying Distancecm202530
NPNo of Passes-121824
PNitrogen PressureBar246
TcfCoat-Face Temperature°C130230330
Table 2. Experimental data for the coating process.
RunSpraying Distance (cm)No. of Passes Pressure (Bar)Coat-Face Temperature
(°C)
120122130
220184230
320246330
425124330
525186130
625242230
730126230
830182330
930244130
Table 3. Specific fiberglass properties.
Dimensions25 × 15 × 2 mm
FinishCompatible with polyester, vinyl and epoxy
Weave pattern Plain
Yarn descriptionWarp: ECG 75 1/3-Fill: ECG 50 1/0
Count: ends × picks (mm)431.8–482.6 × 812.8–914.4
Weight7.80–9.60 oz/yd2
Table 4. Results of the experiments and the calculated S/N ratios.
Coating ParametersResults S/N Ratios
Exp. RunsSpraying Distance (cm)No. of Passes Pressure (Bar)Coat-Face Temp.
(°C)
CdCd
1201221300.61940−4.16058
2201842300.99172−0.07222
3202463301.135601.10451
4251243300.90000−0.91515
5251861300.65040−3.73639
6252422300.88730−1.03859
7301262300.65000−3.74173
8301823300.85040−1.40753
9302441300.67320−3.43712
Table 5. Mean S/N ratio response for Cd.
SymbolProcess ParametersMean S/N Ratio
Level 1Level 2Level 3Max-MinRank
SD Spraying Distance (cm)−1.0428−1.8967−2.86211.82142
NPNo. of Passes−2.9392−1.7387−1.12371.2003
PPressure (Bar)−2.2022−1.4748−2.12450.07774
TCFTCF (°C)−3.7780−1.6175−0.40612.16051
Table 6. Confirmation test results for Cd.
Optimal Process Parameters
Initial Process ParametersPredictionExperimental
Levels(SD)2-(NP)2-P2-(TCF)2(SD)1-(NP)3-P2-(TCF)3(SD)1-(NP)2-P3-(TCF)3
Cd0.65040.9981.1300
S/N ratio (dB)−3.729 1.0618
Improvement in S/N ratio (dB)4.79
Percentage of the increment in Cd42.55%
Table 7. ANOVA for Cd.
Source Degree of FreedomSum of SquareMeans Square% Contribution
SD (CM)24.97142.4856817.42
NP25.11502.5575017.89
P (bar)20.95730.478643.35
TCF (°C)217.50568.7528161.29
Total828.5492-100
Table 8. Confirmed results for the developed model.
Run ExperimentalPredictedResidualError%
Cd%Cd%
10.655120.61940.035725.452
31.171481.13560.035883.062
50.67380.65040.02343.472
60.892380.88730.005080.569
80.86630.85040.01591.835
Publisher’s Note: MDPI stays neutral with regard to jurisdictional claims in published maps and institutional affiliations.

