
Numerical Modeling on Dissociation and Transportation of Natural Gas Hydrate Considering the Effects of the Geo-Stress


Abstract
:1. Introduction
2. Methods
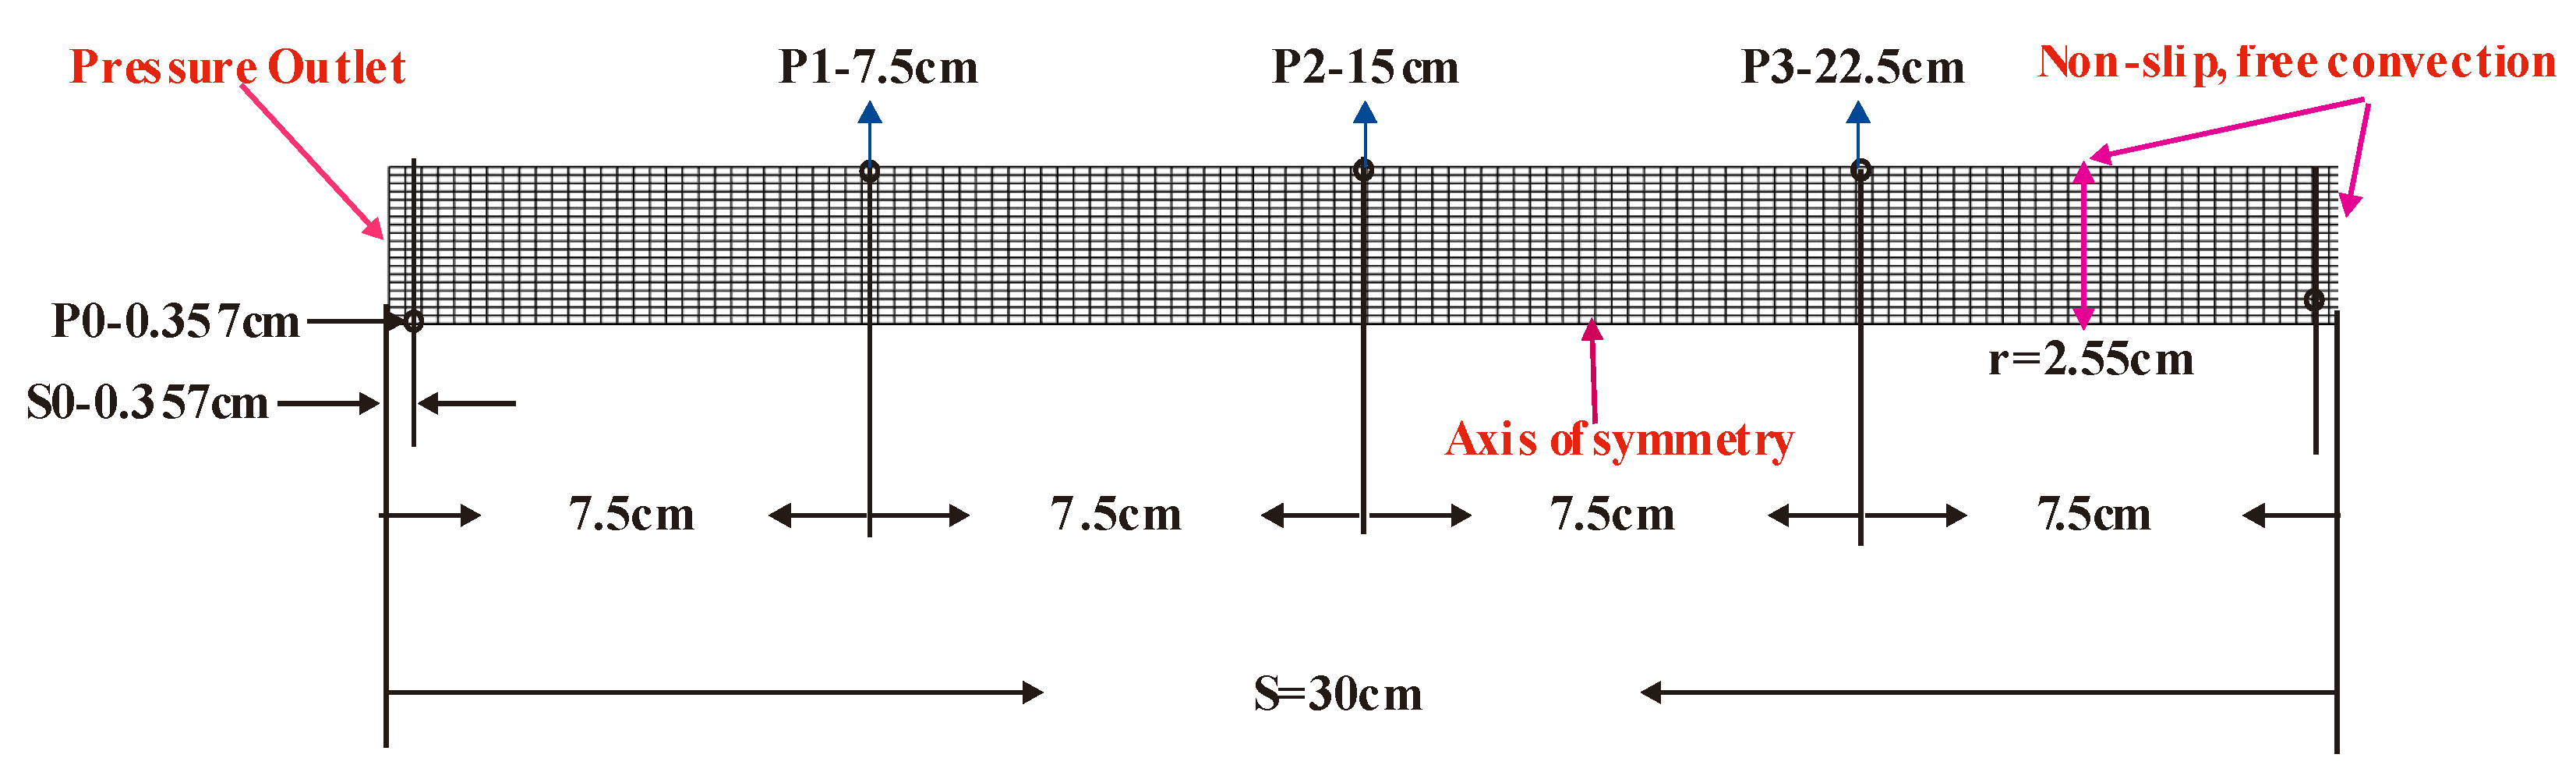
2.1. Computer Model
2.2. Mathematical Model
3. Results and Discussions
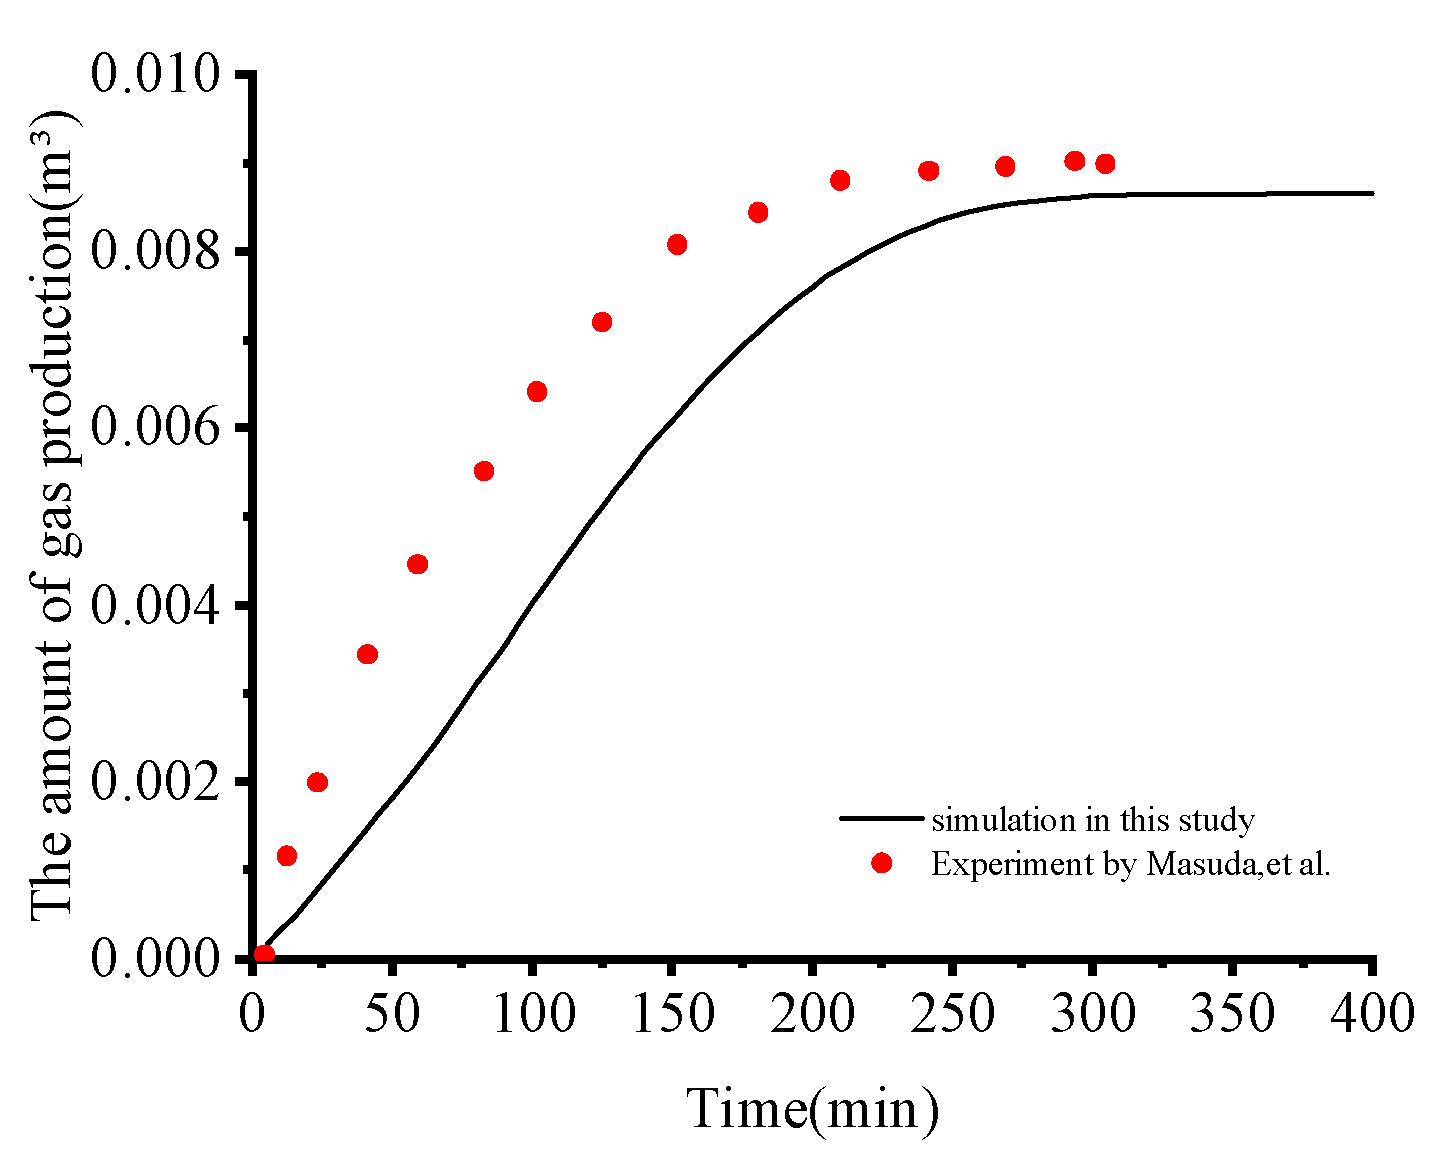
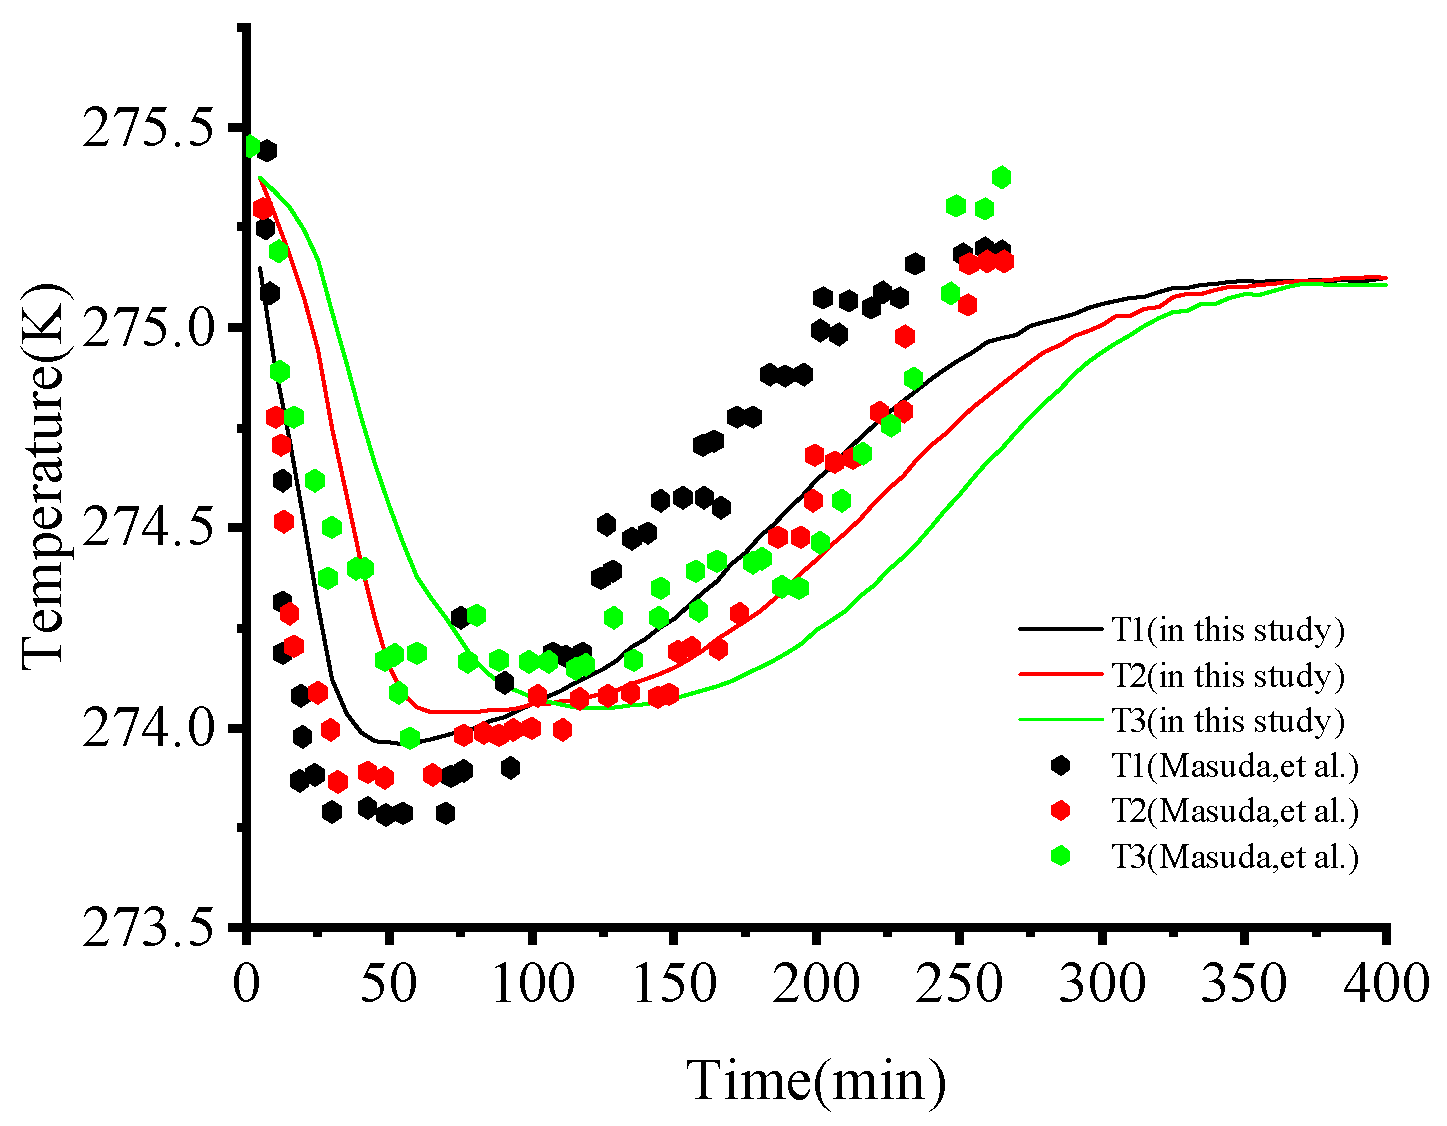
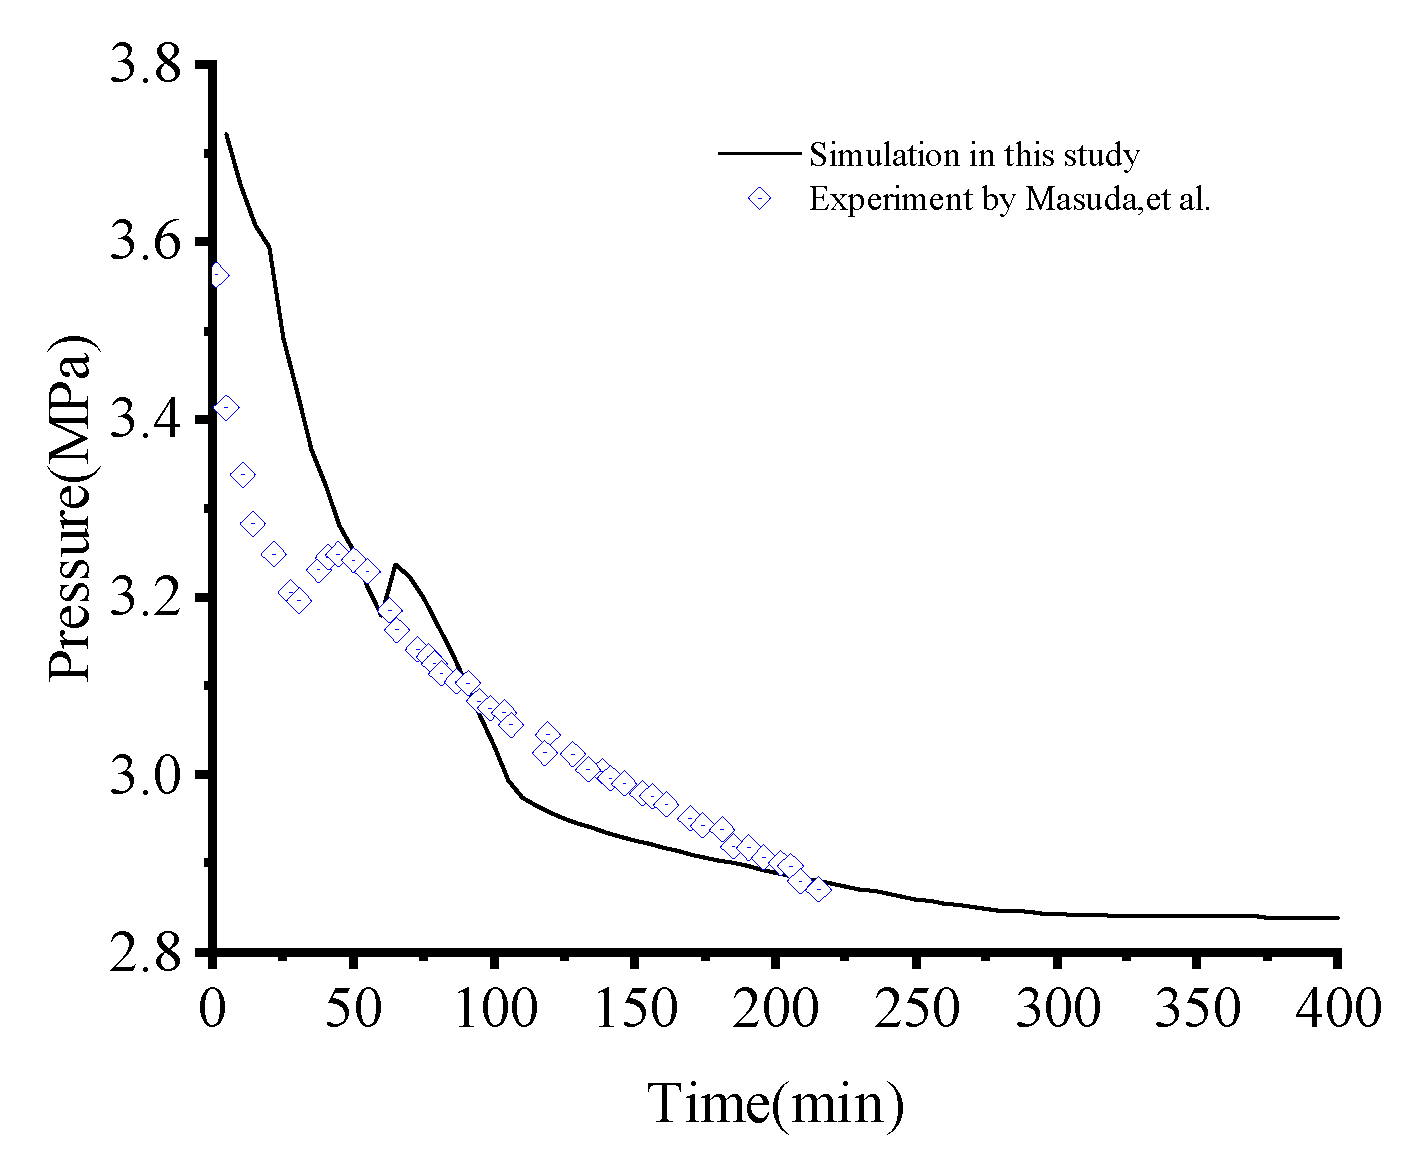
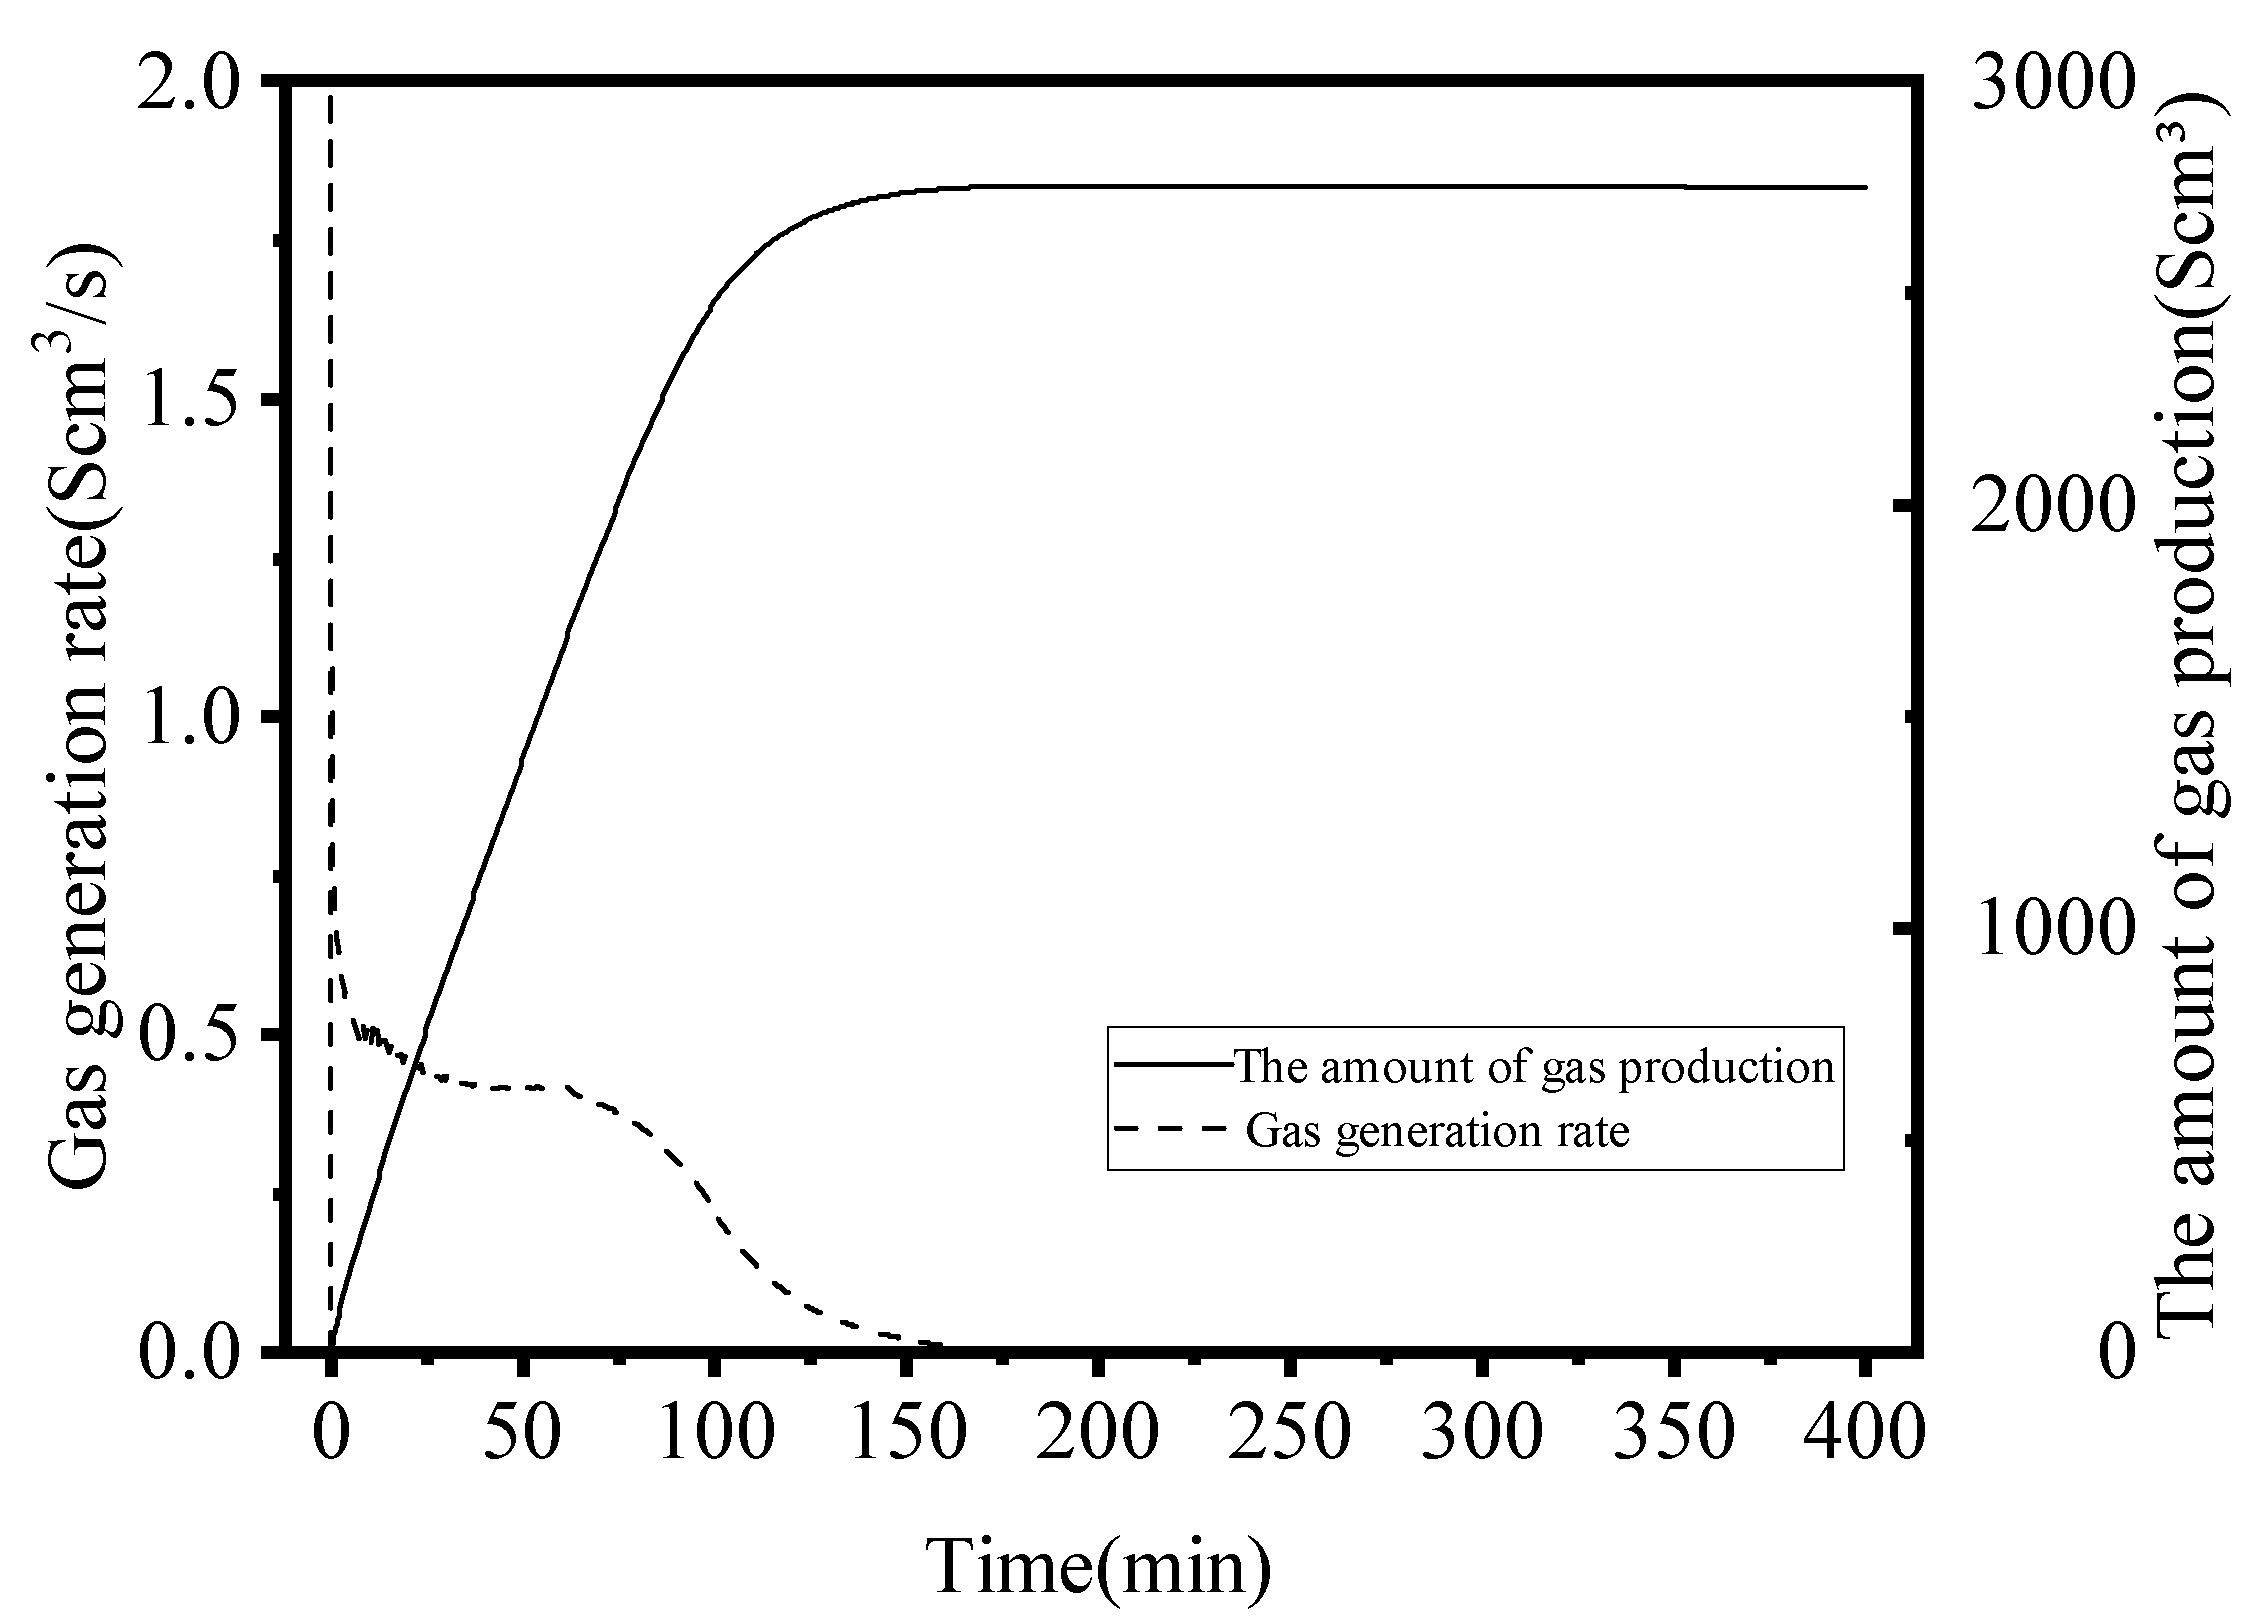
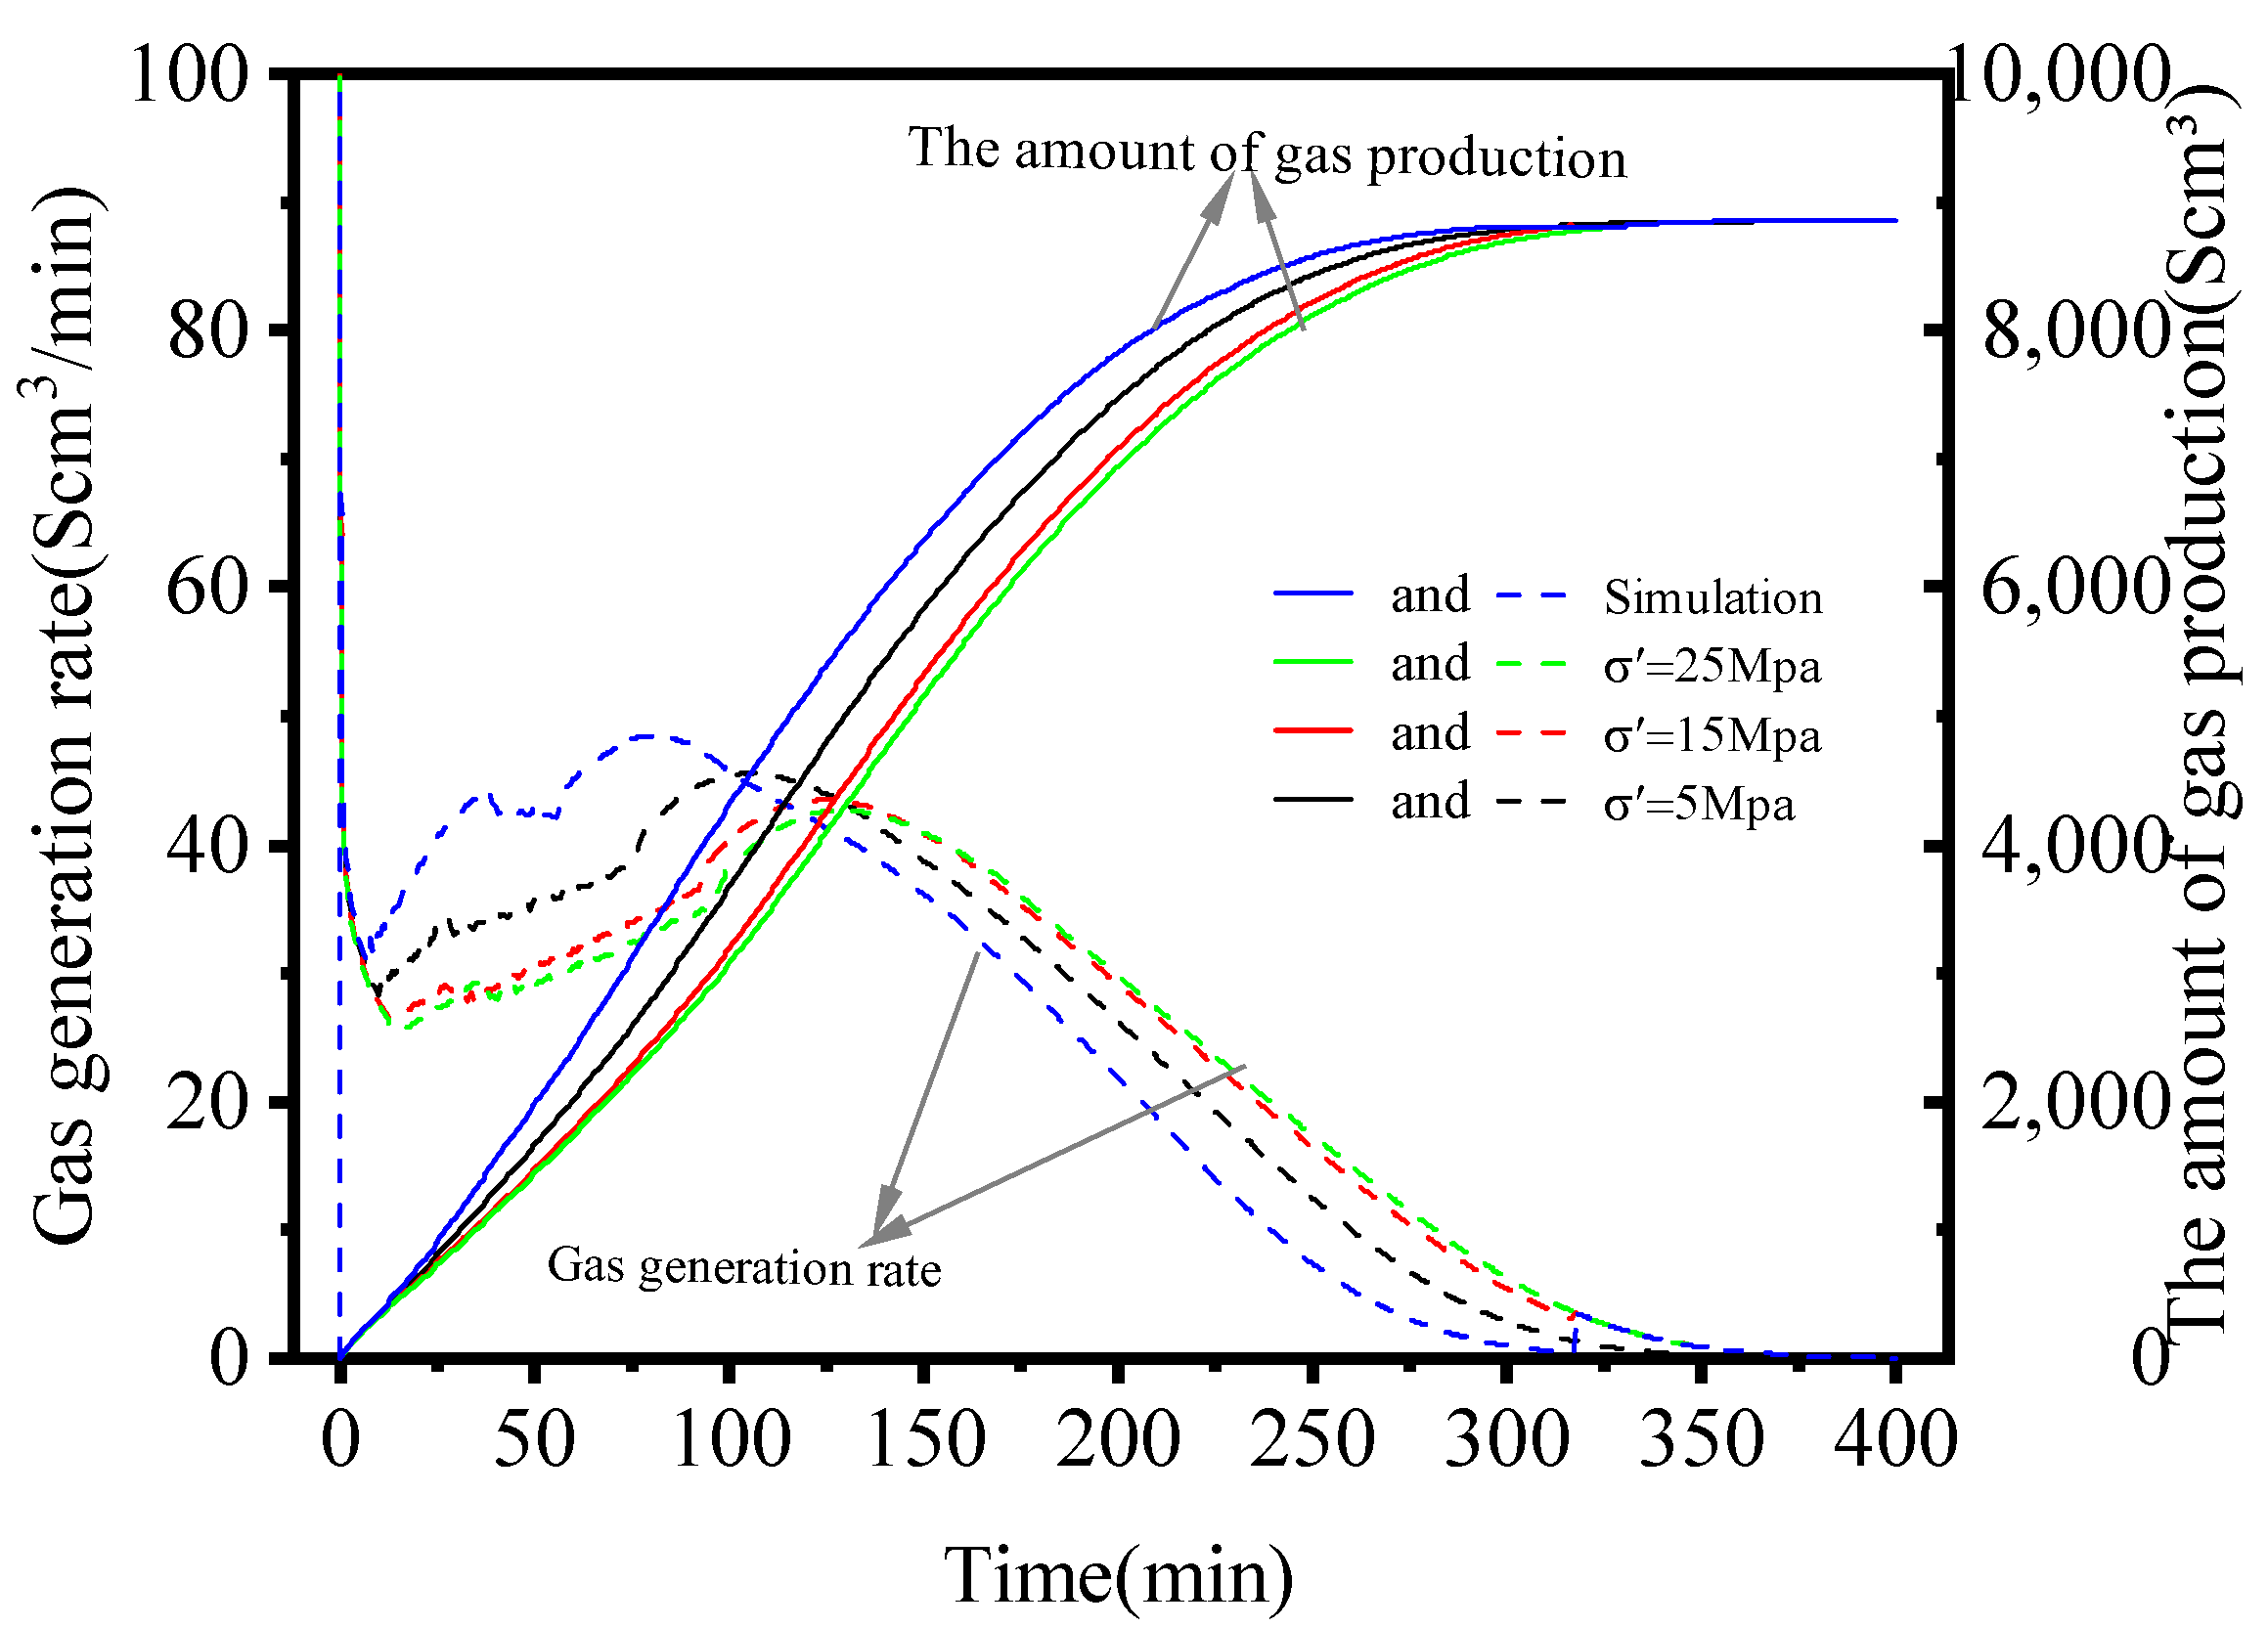
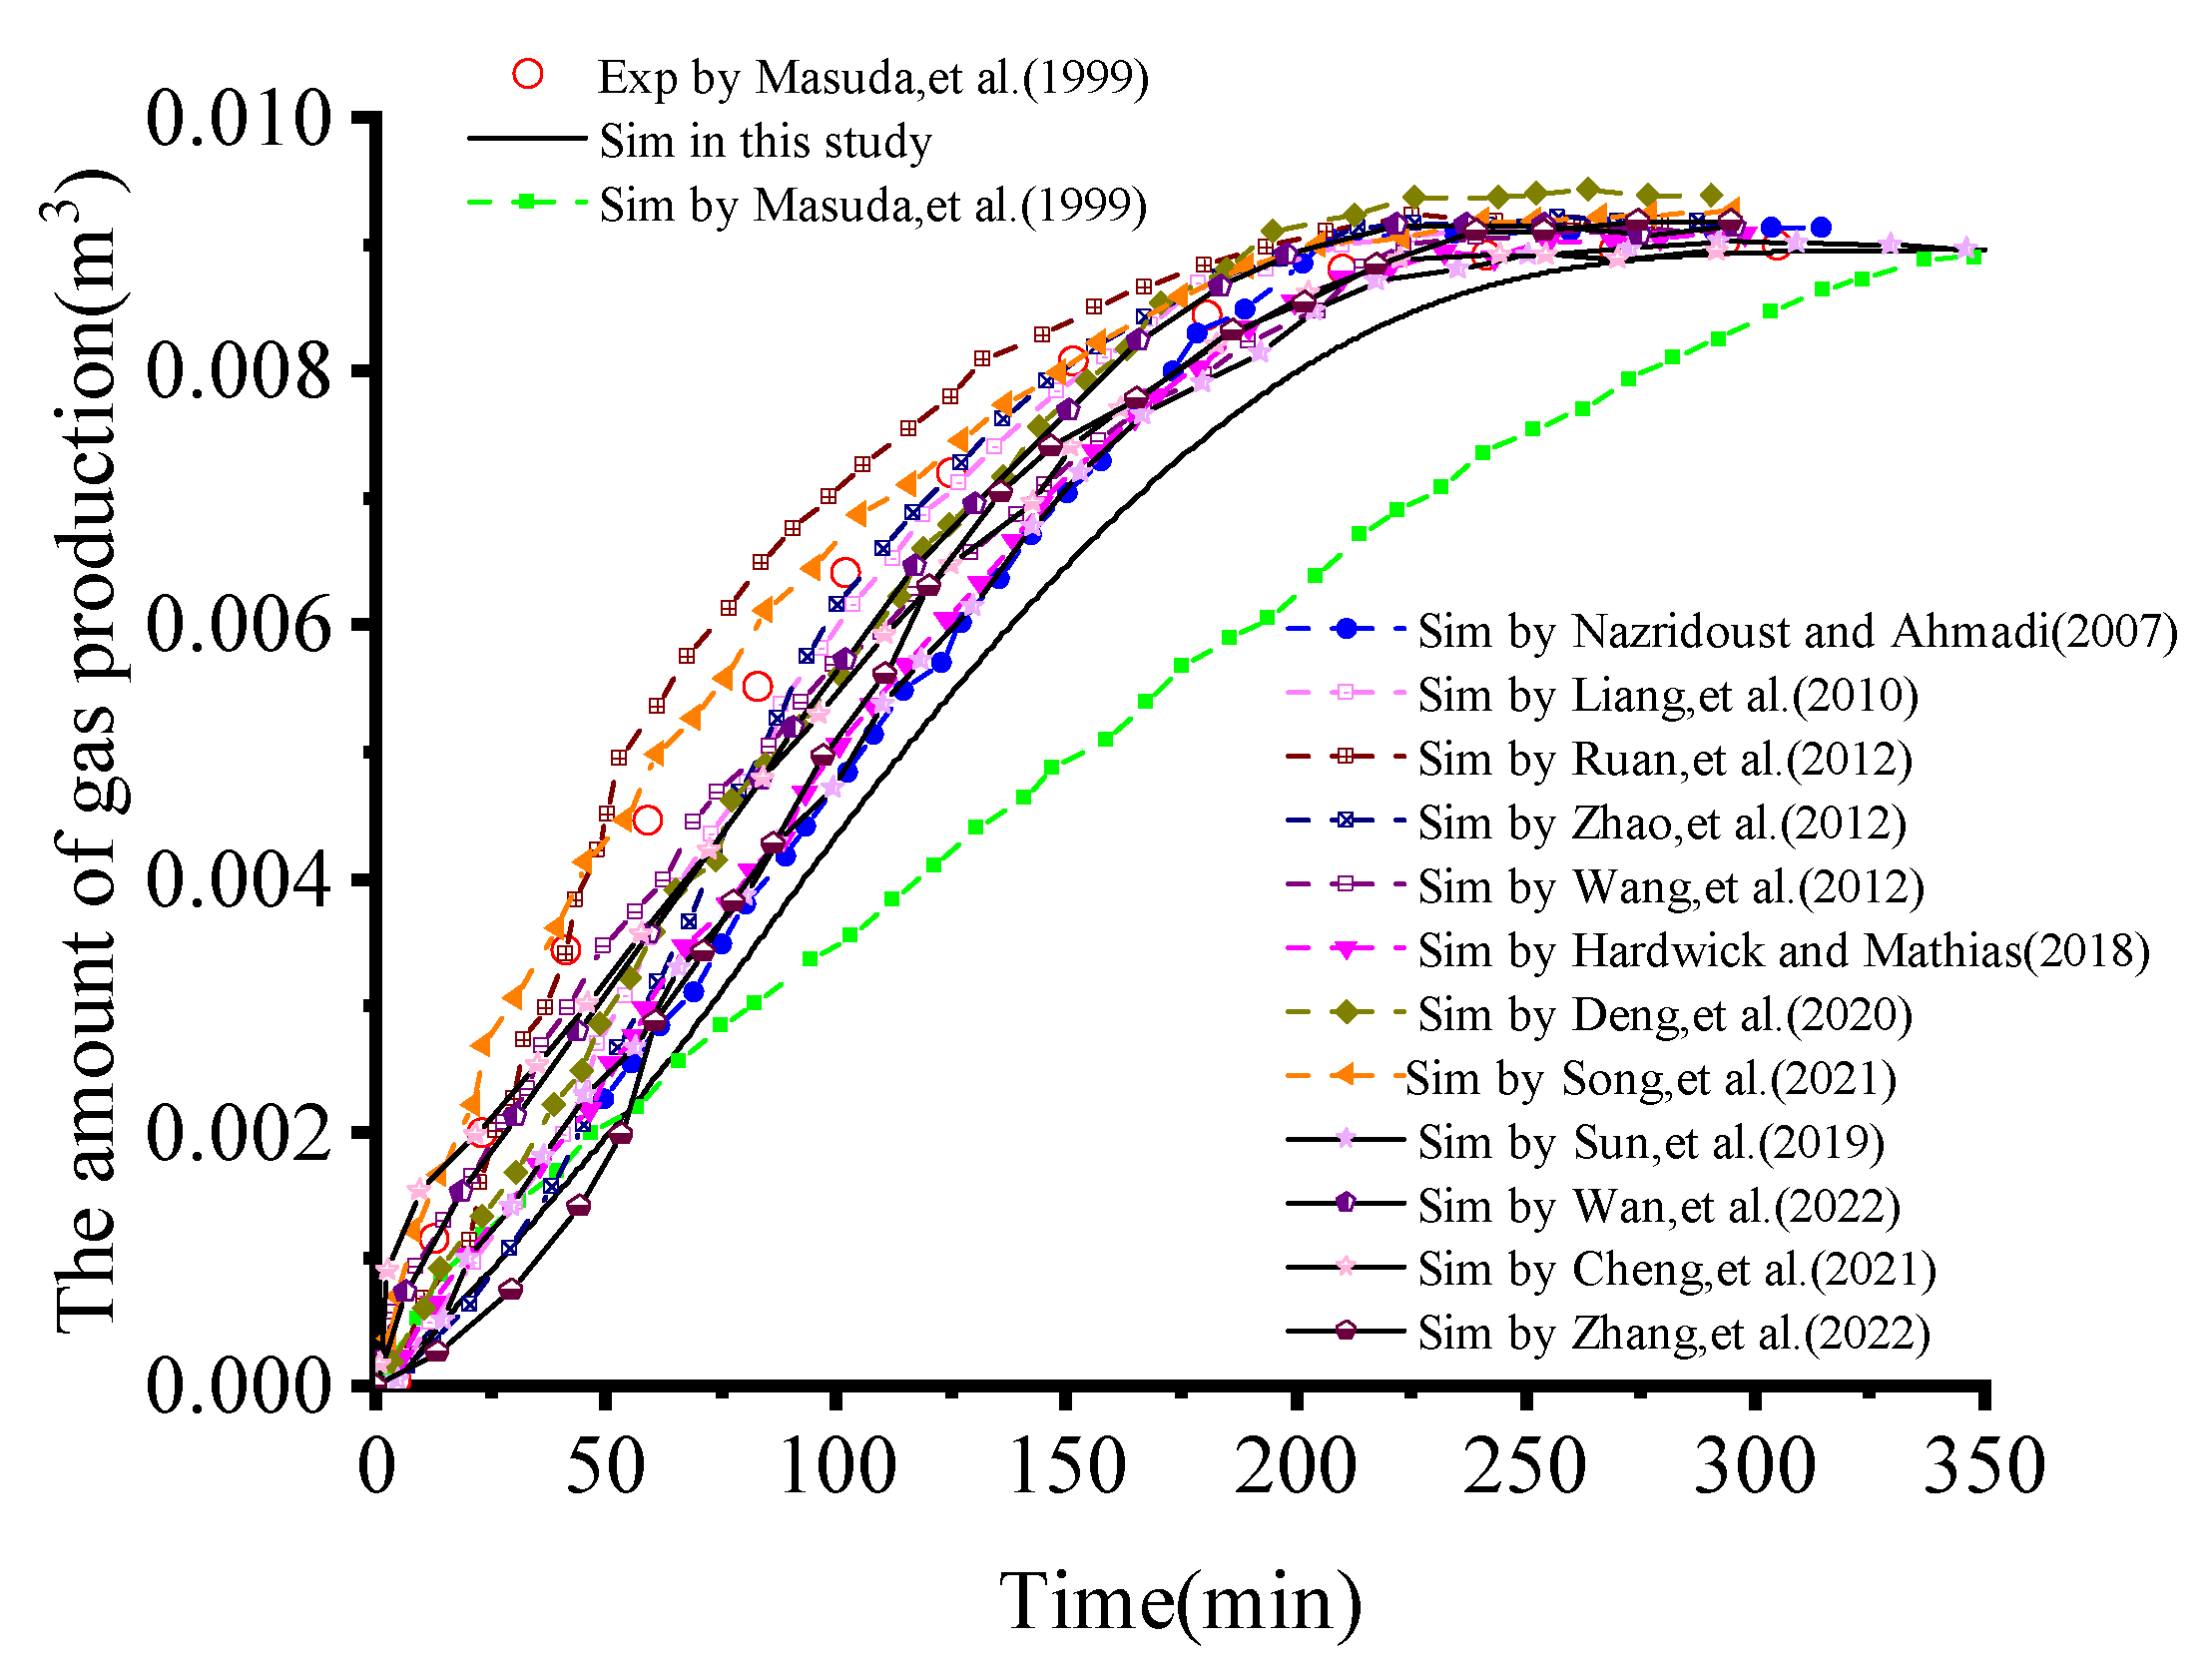
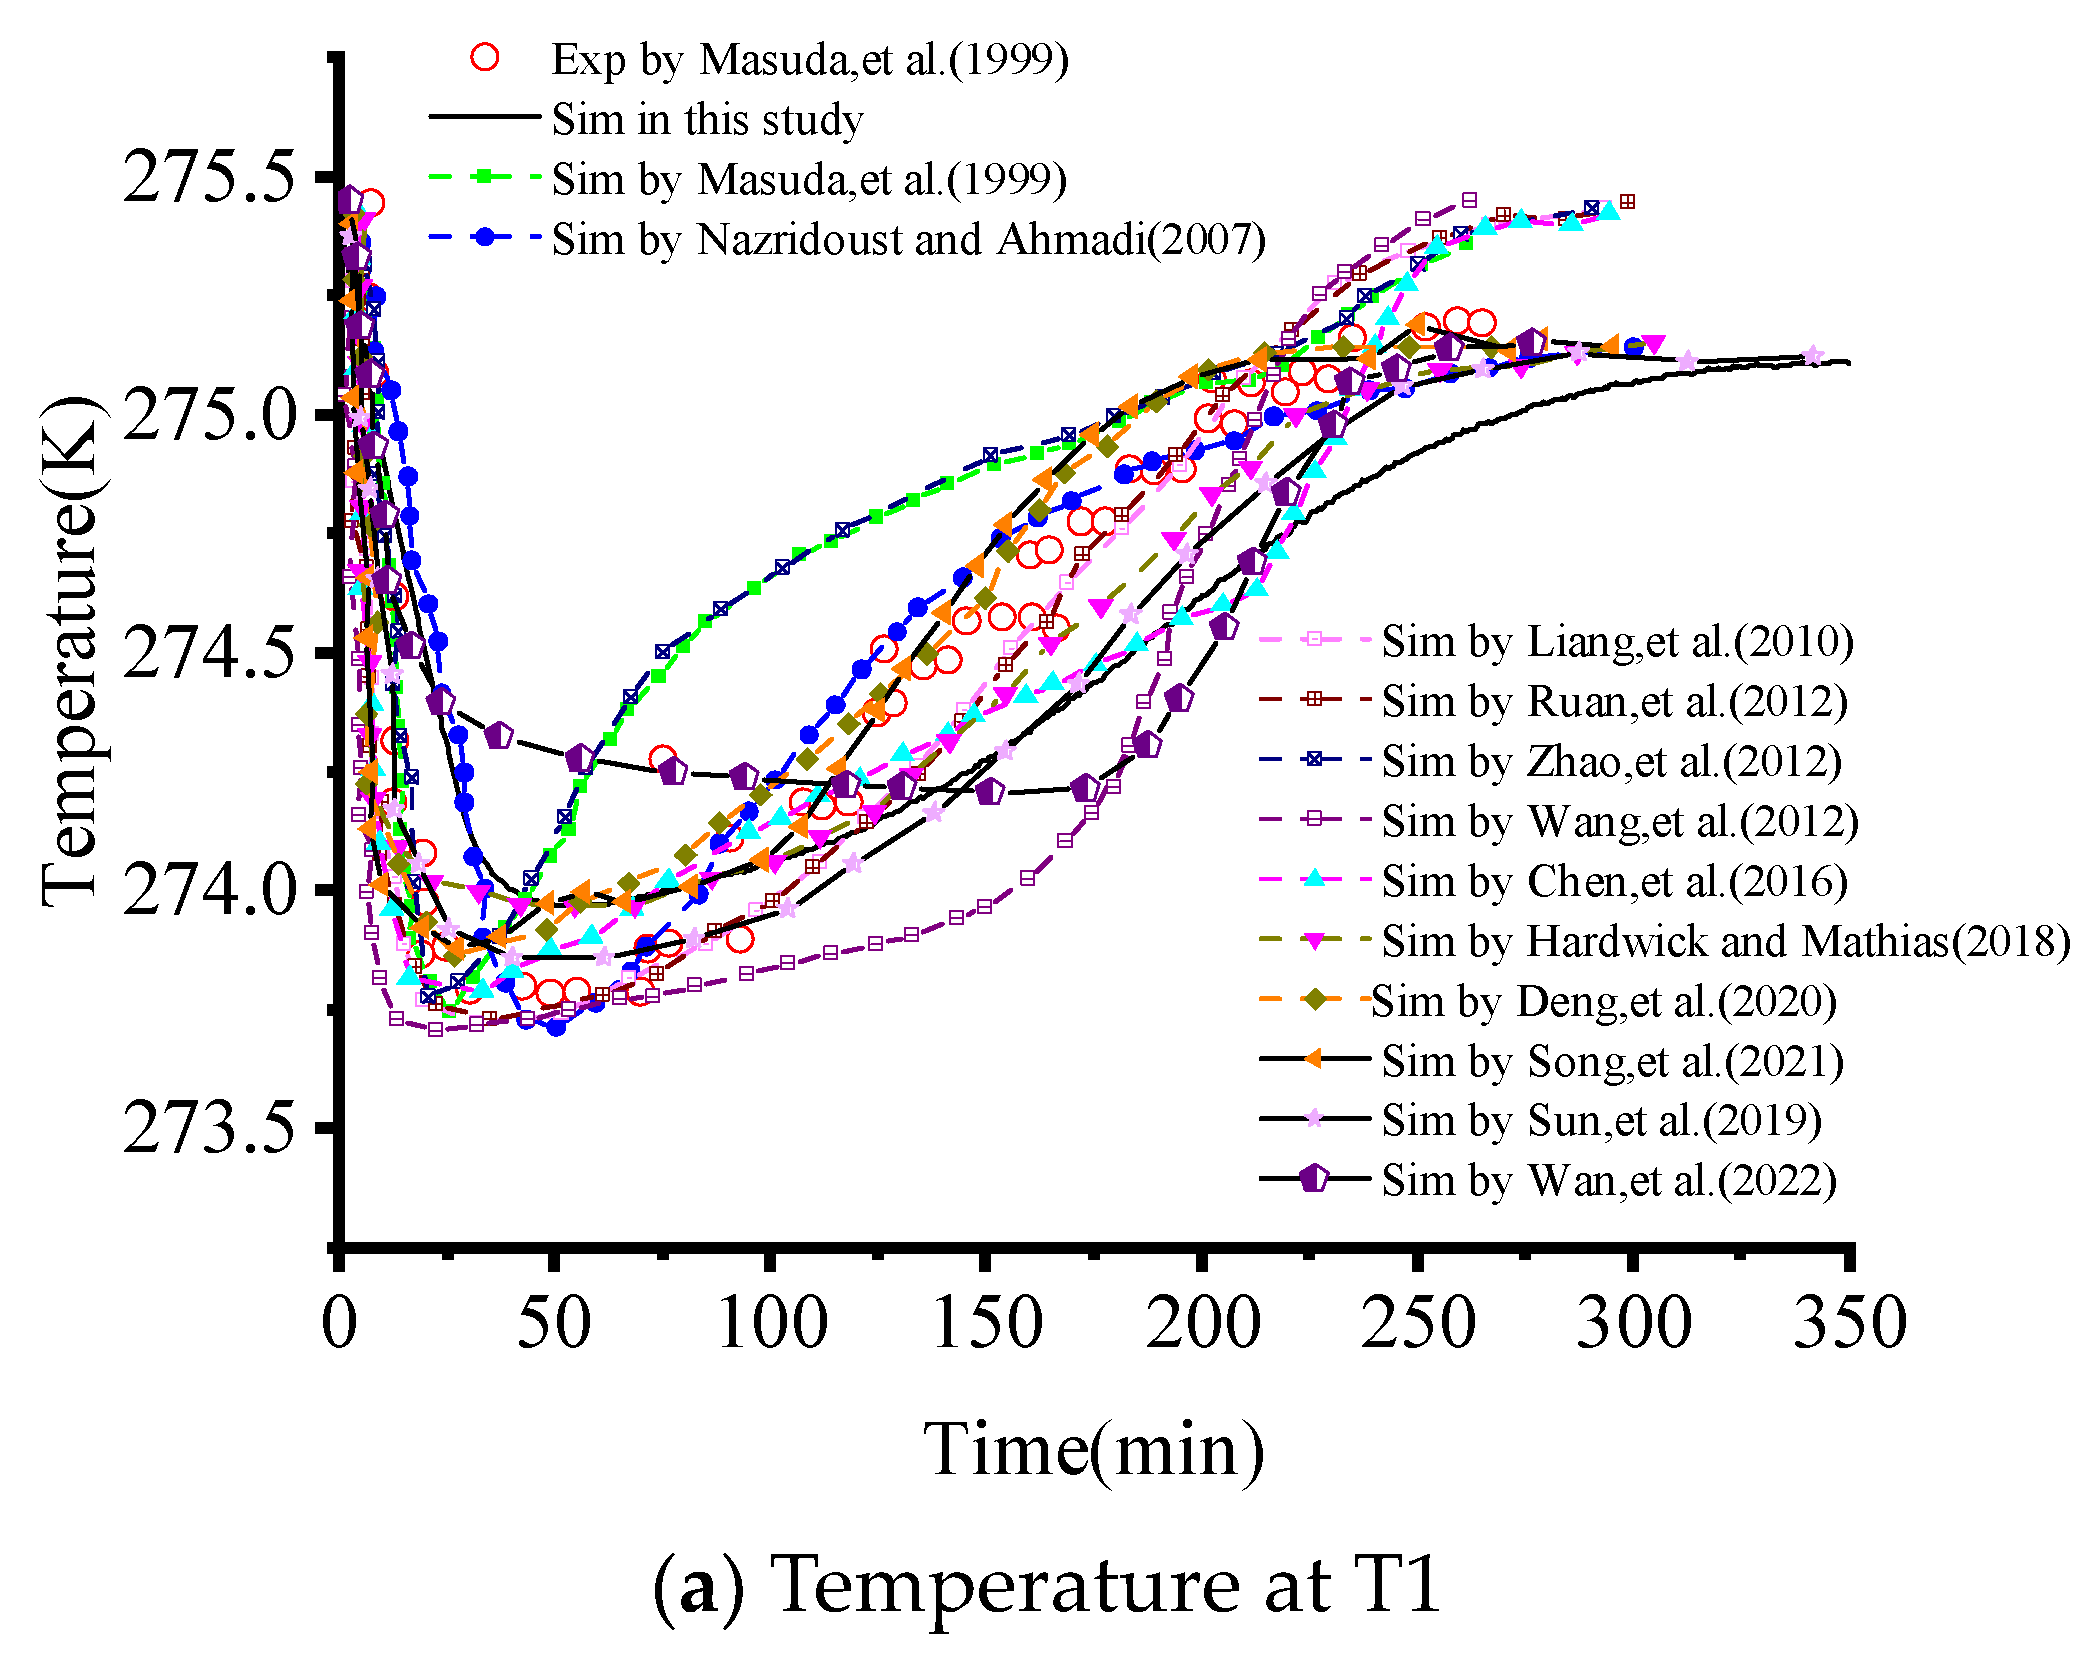
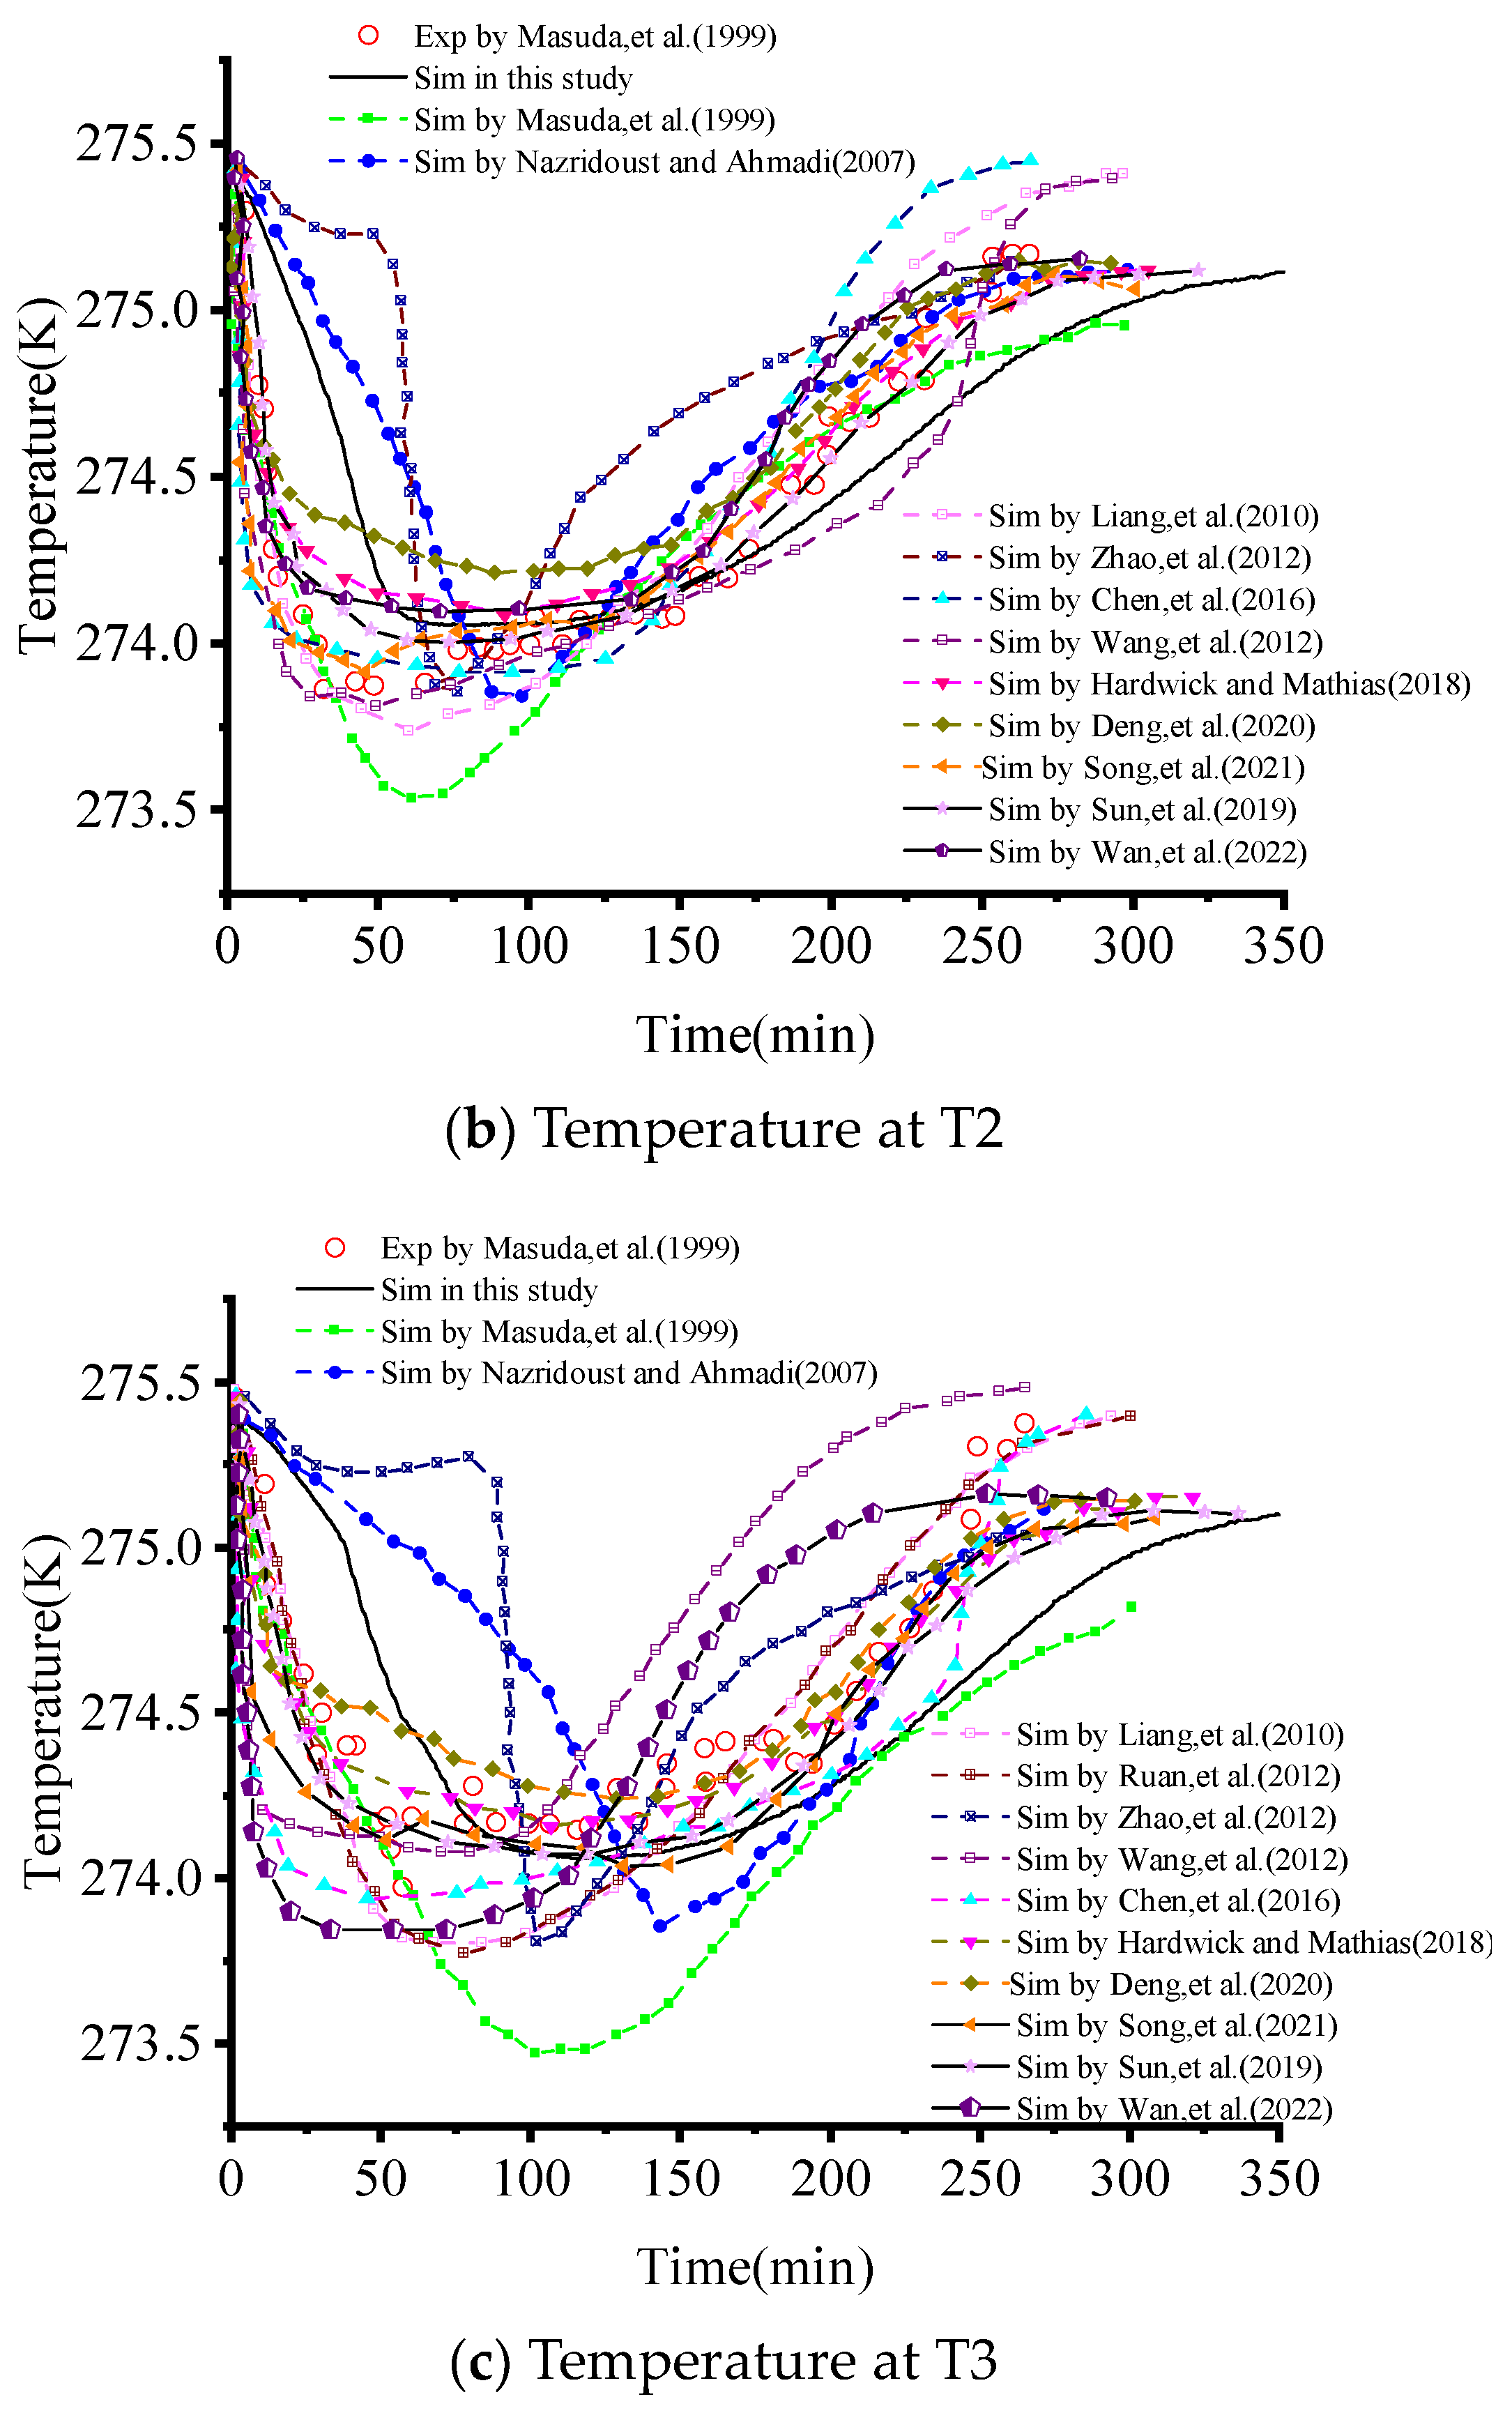
3.1. Model Validation
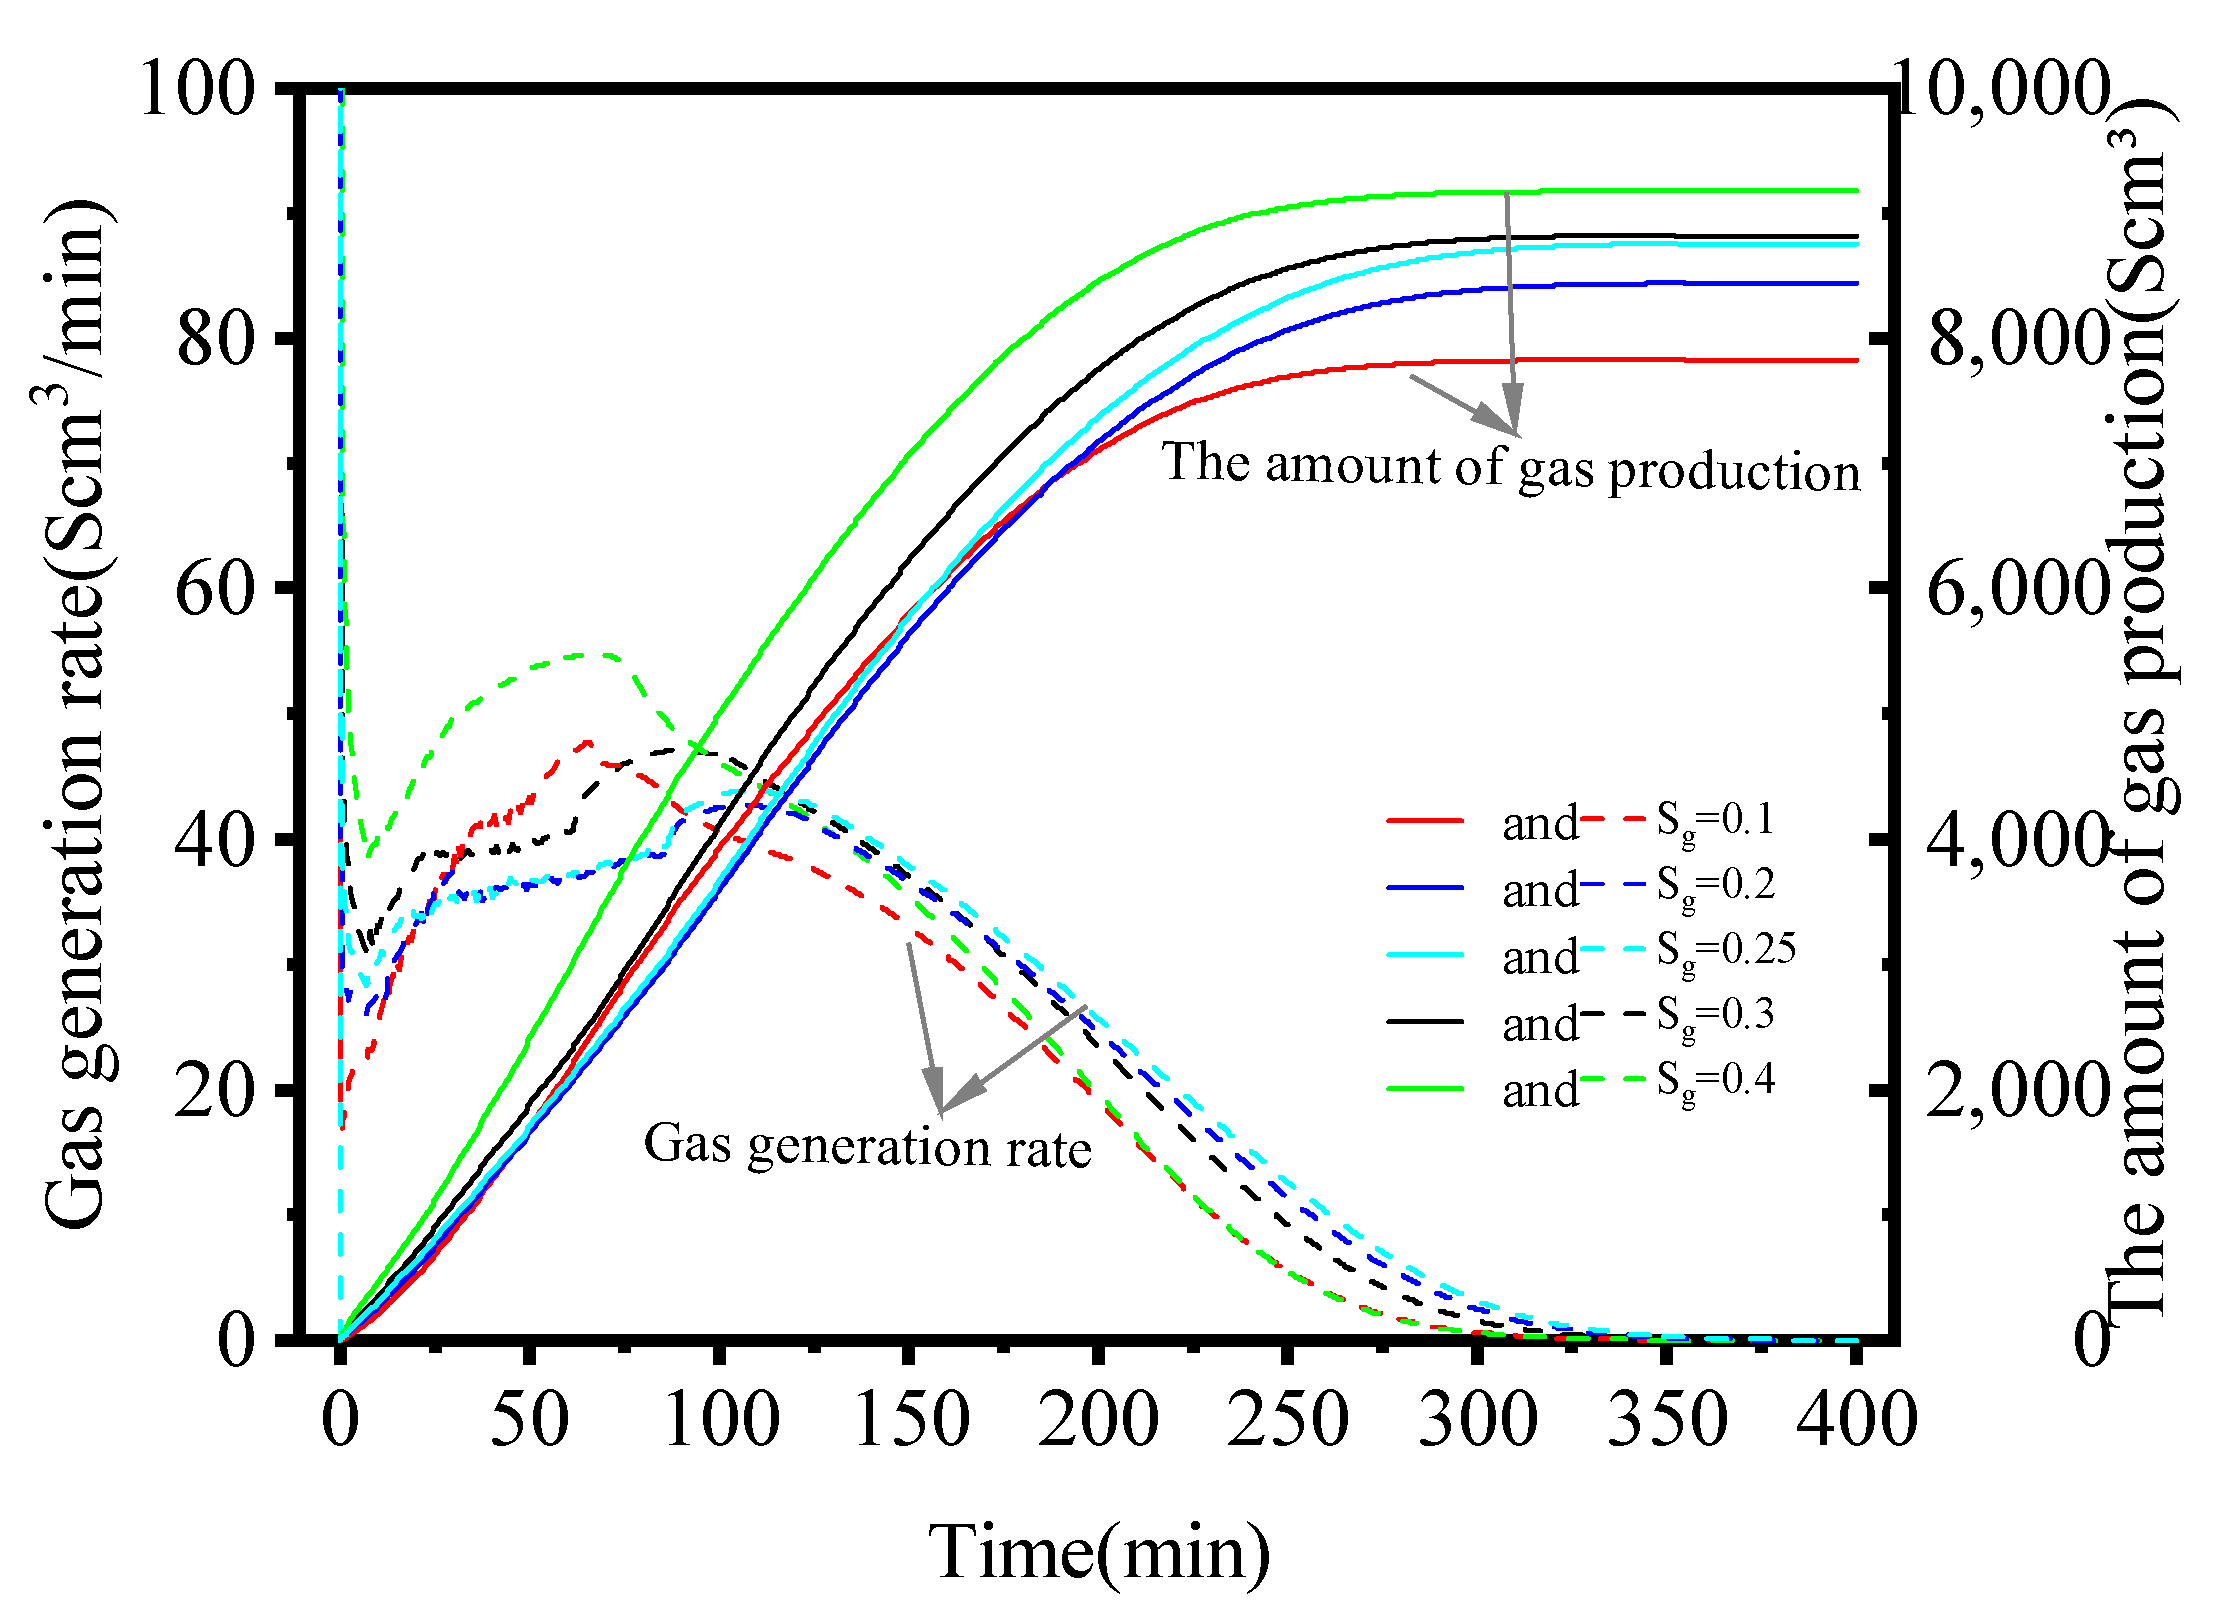
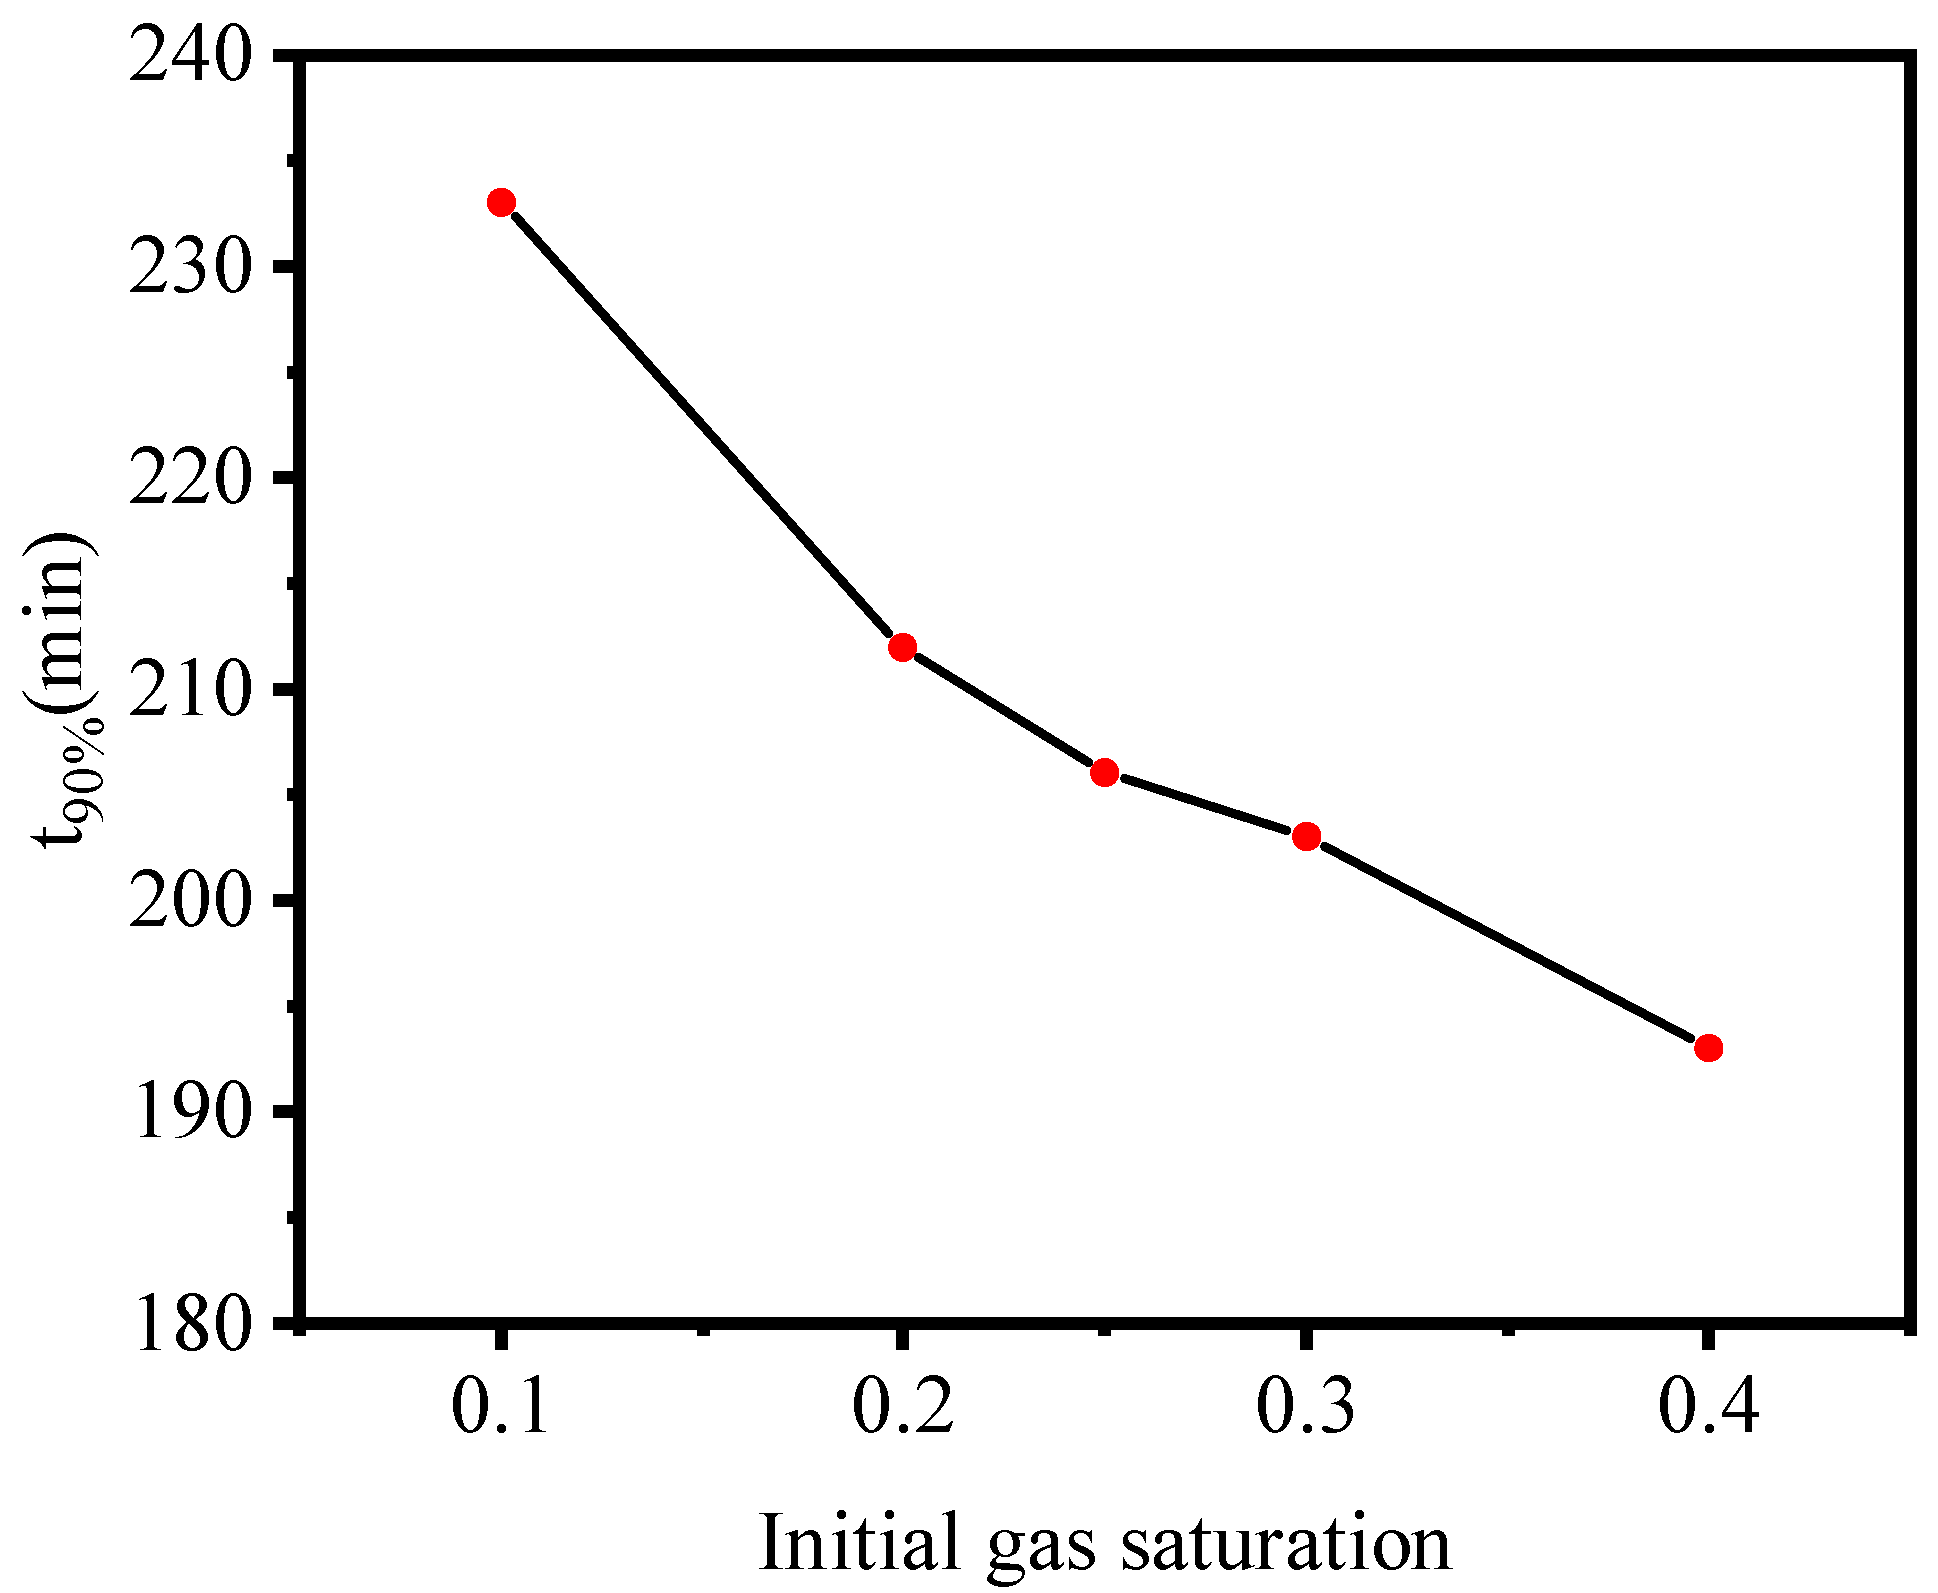
3.2. Effect of Initial Gas Saturation
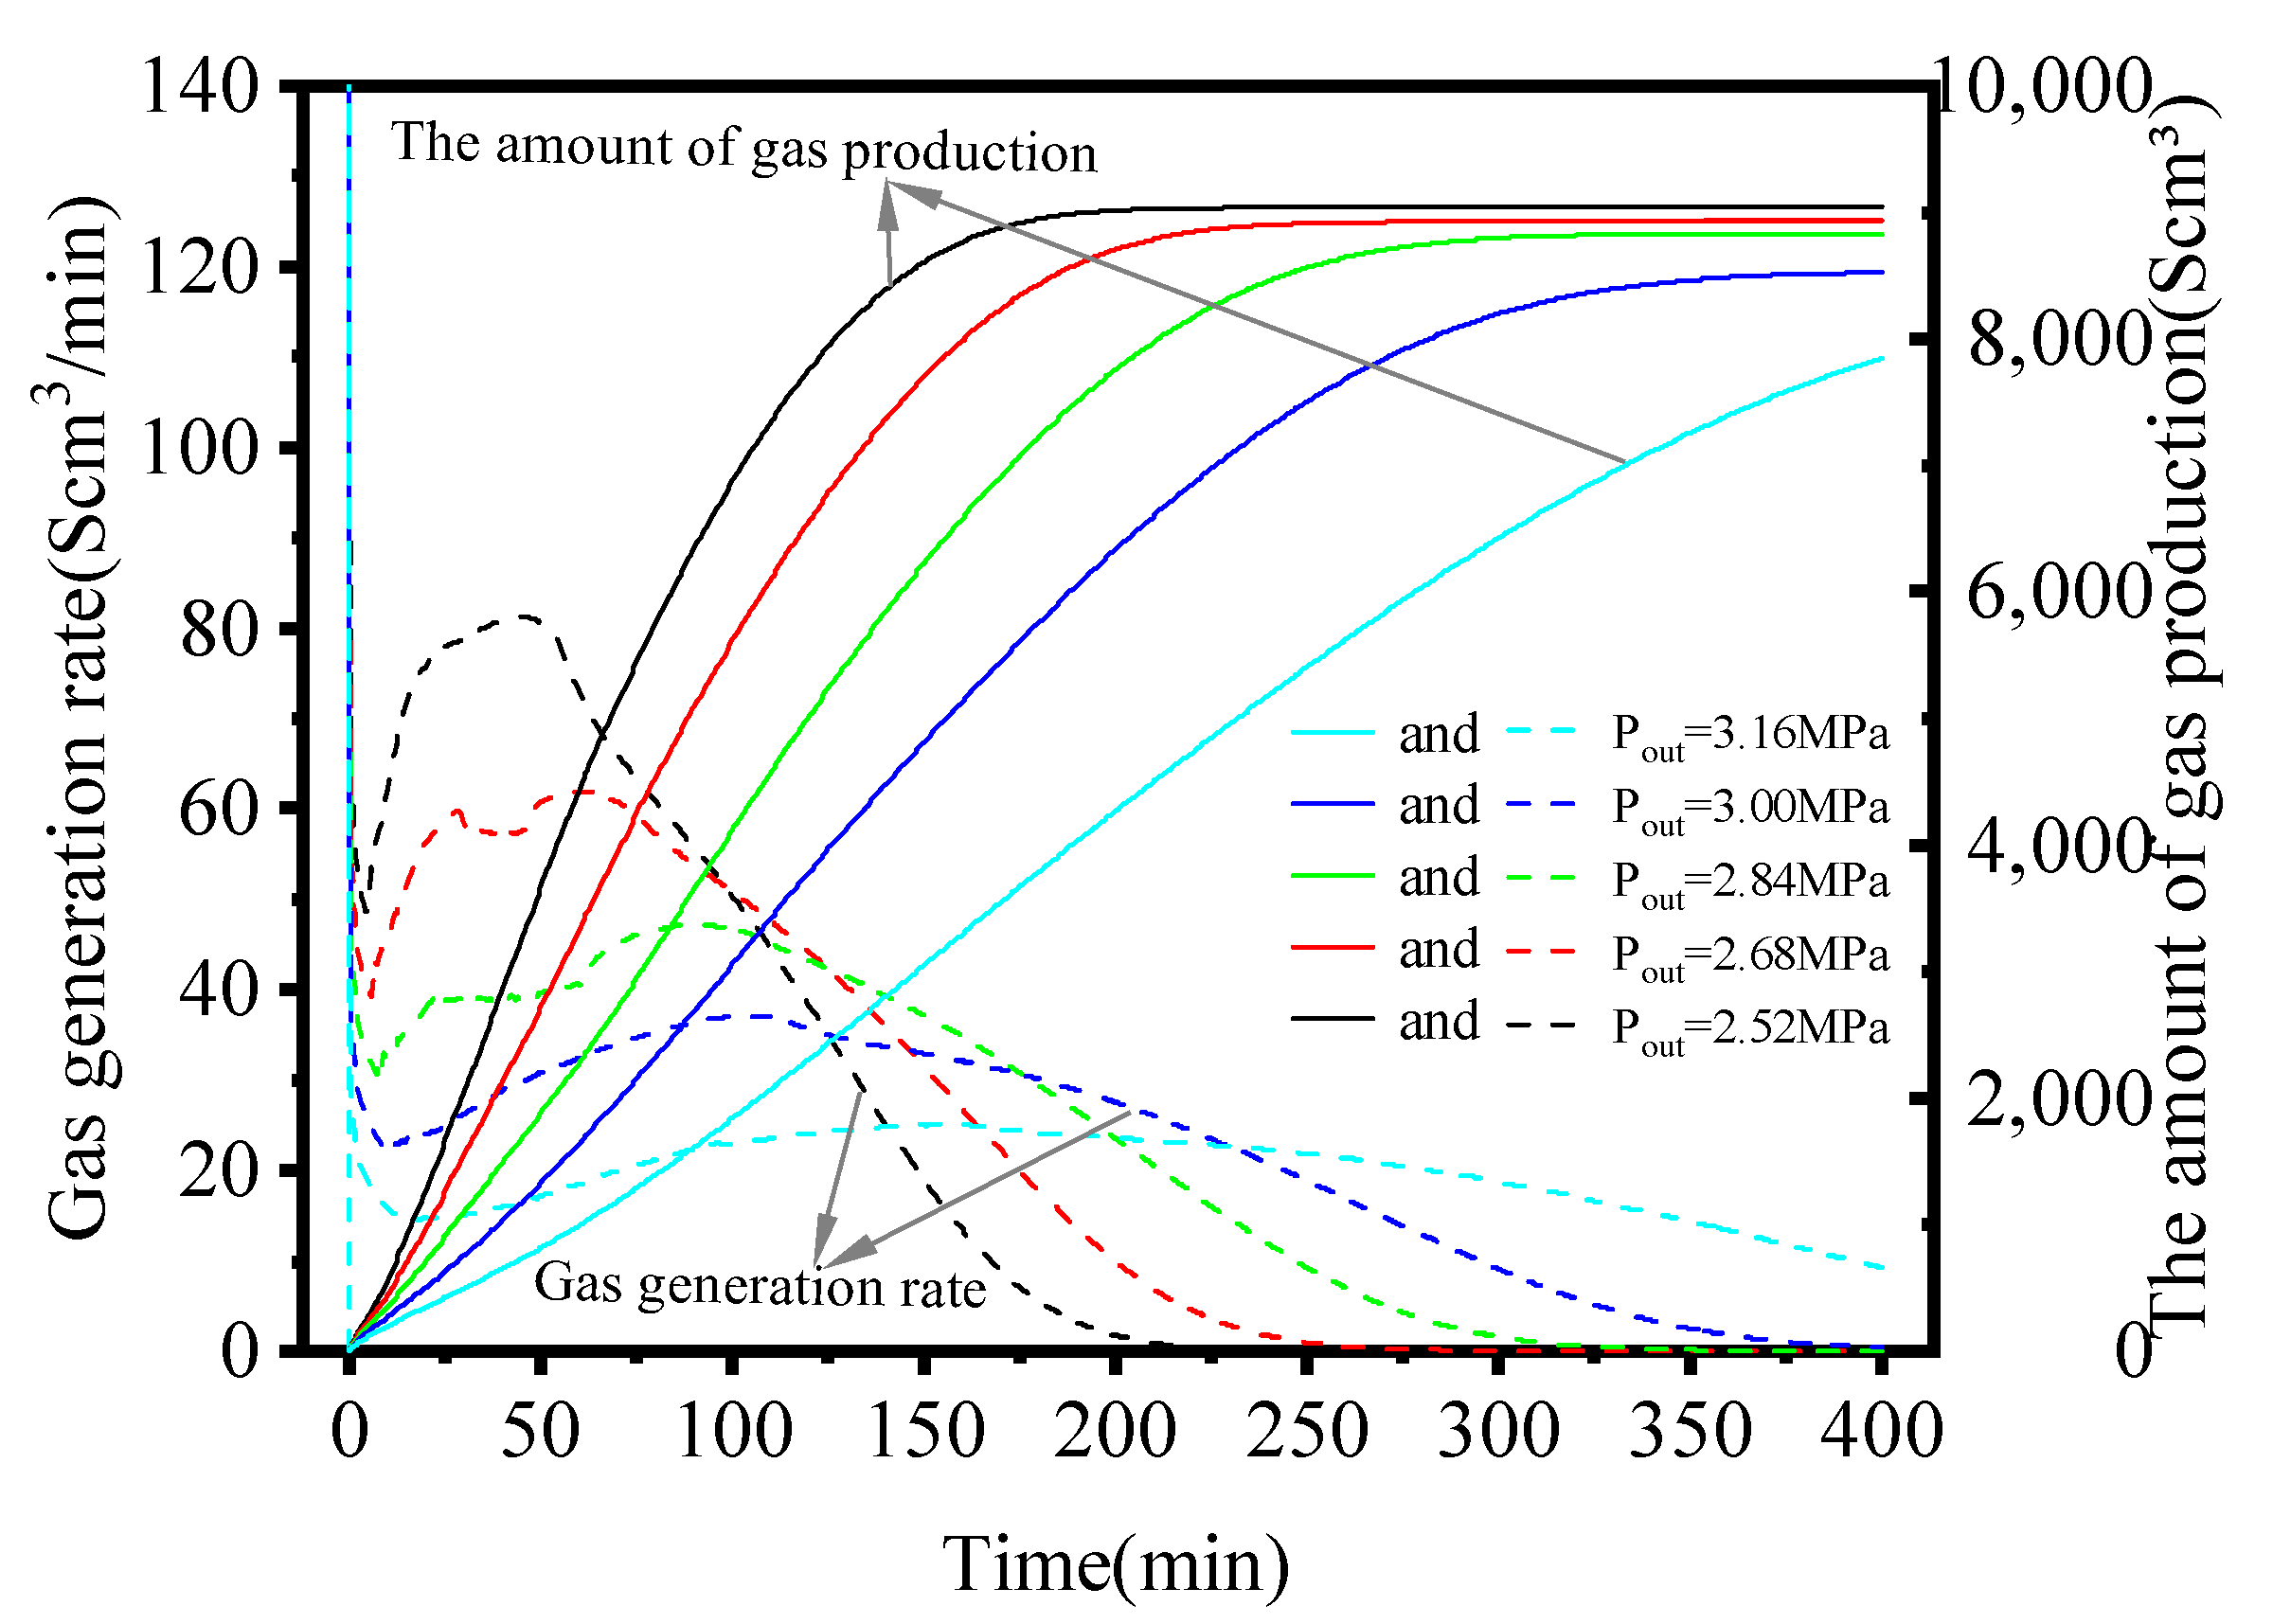
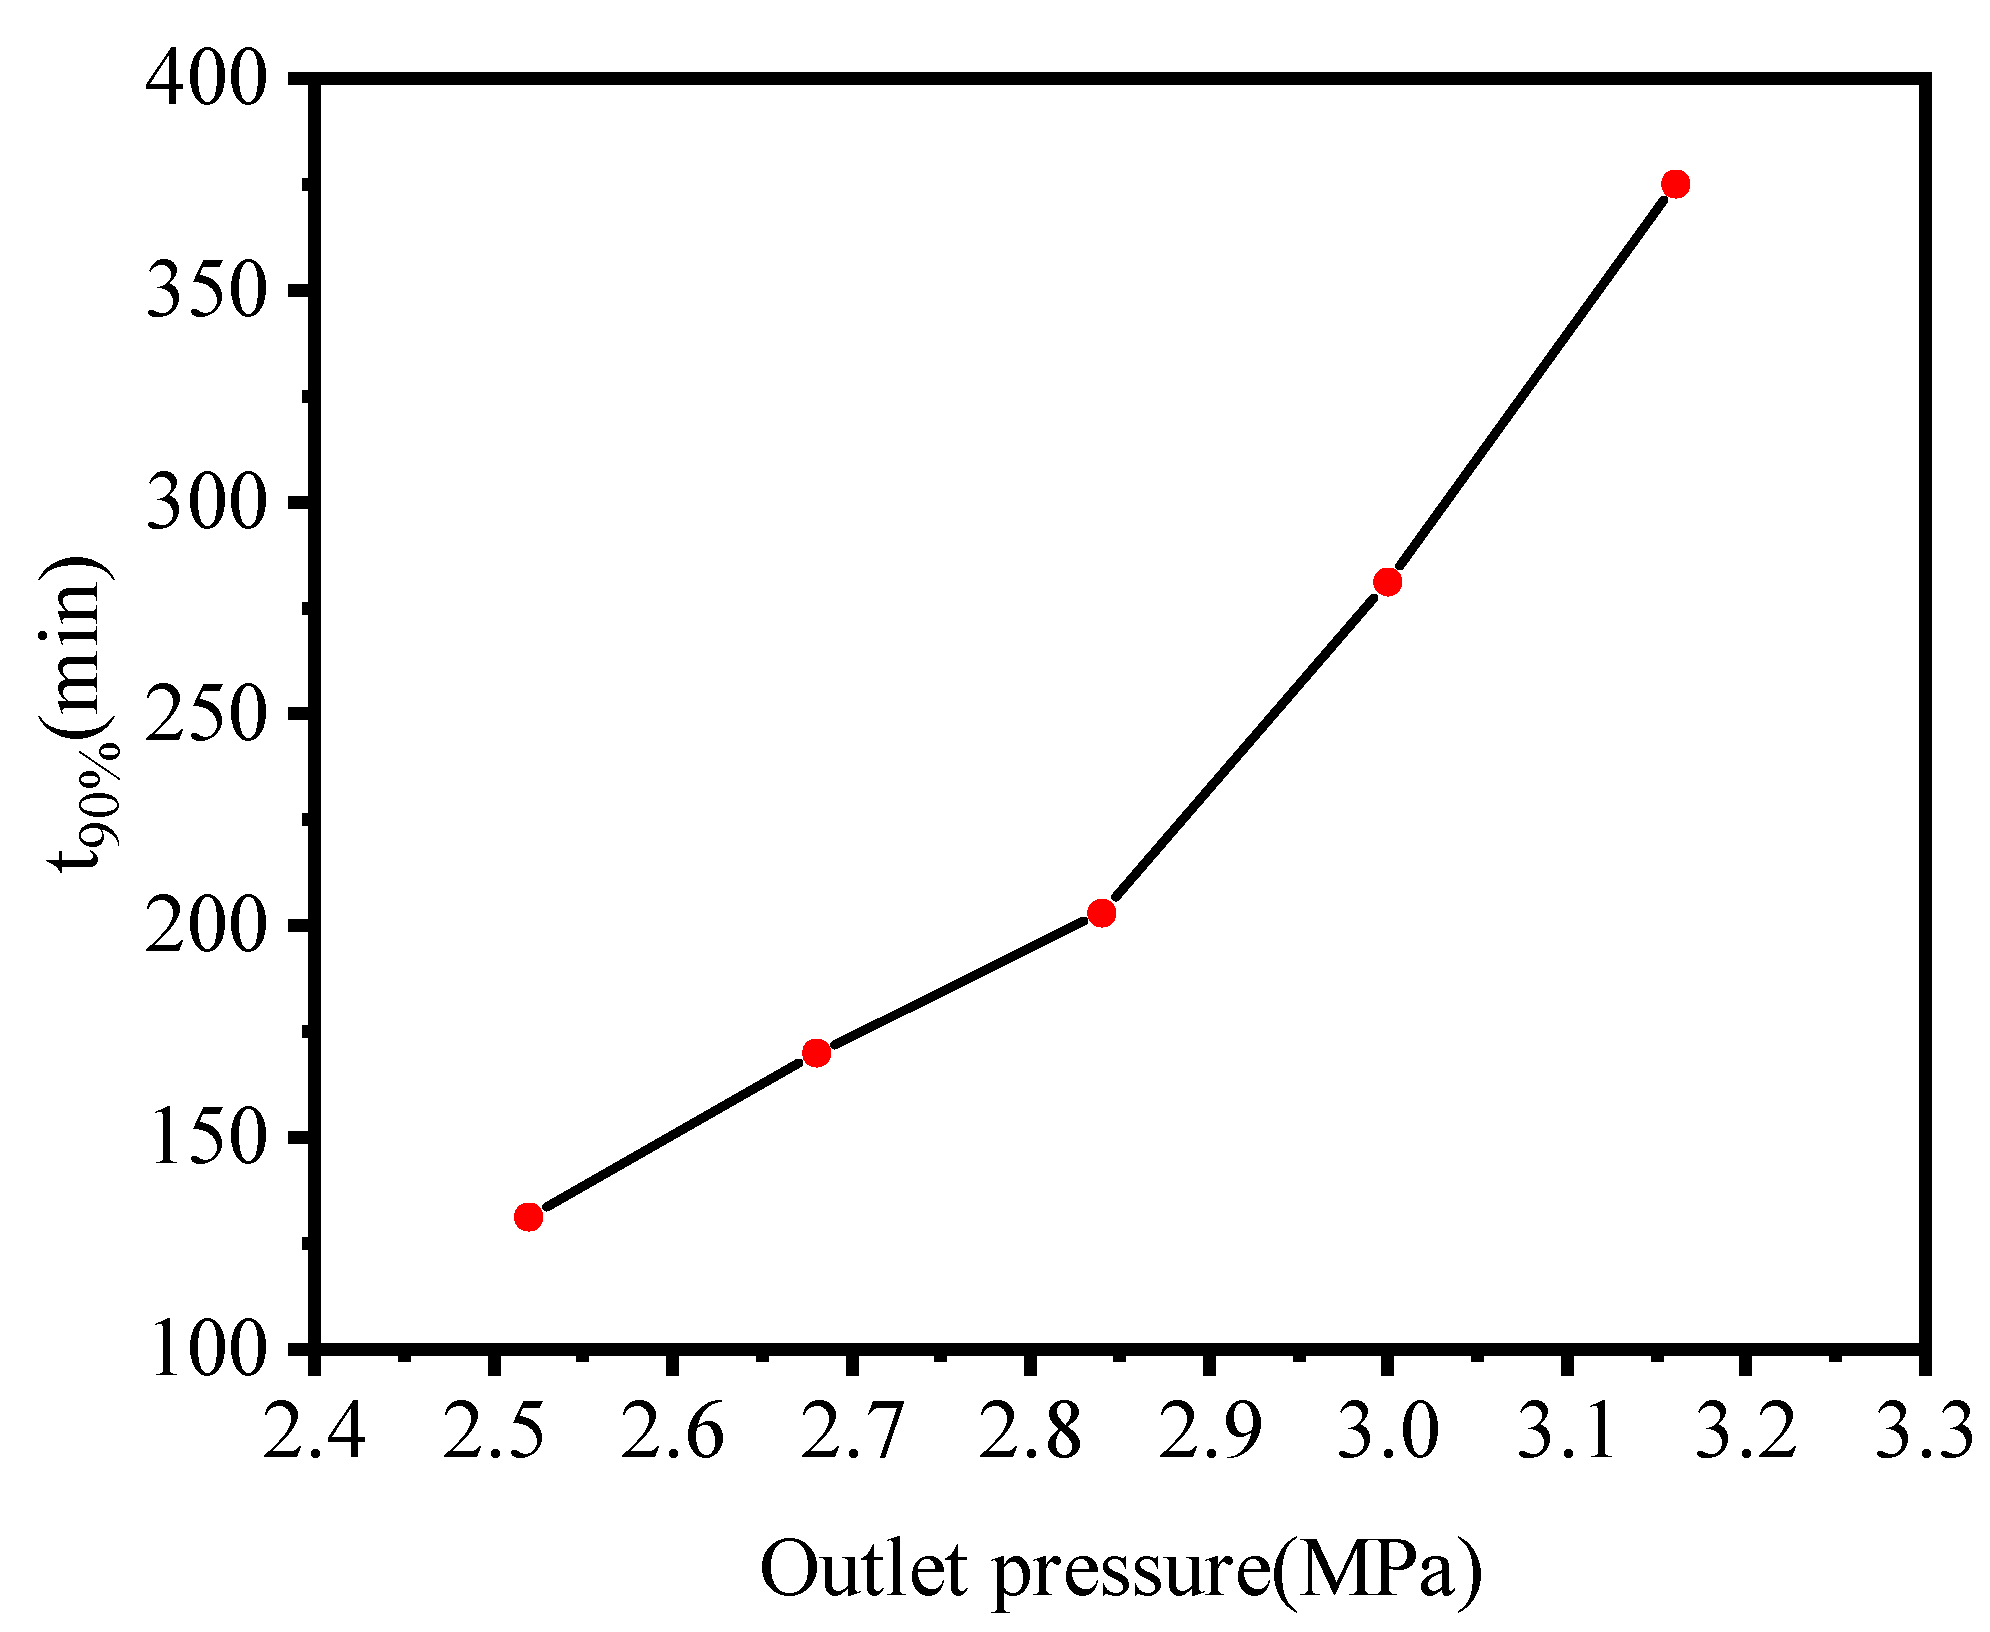
3.3. Effect of Outlet Pressure
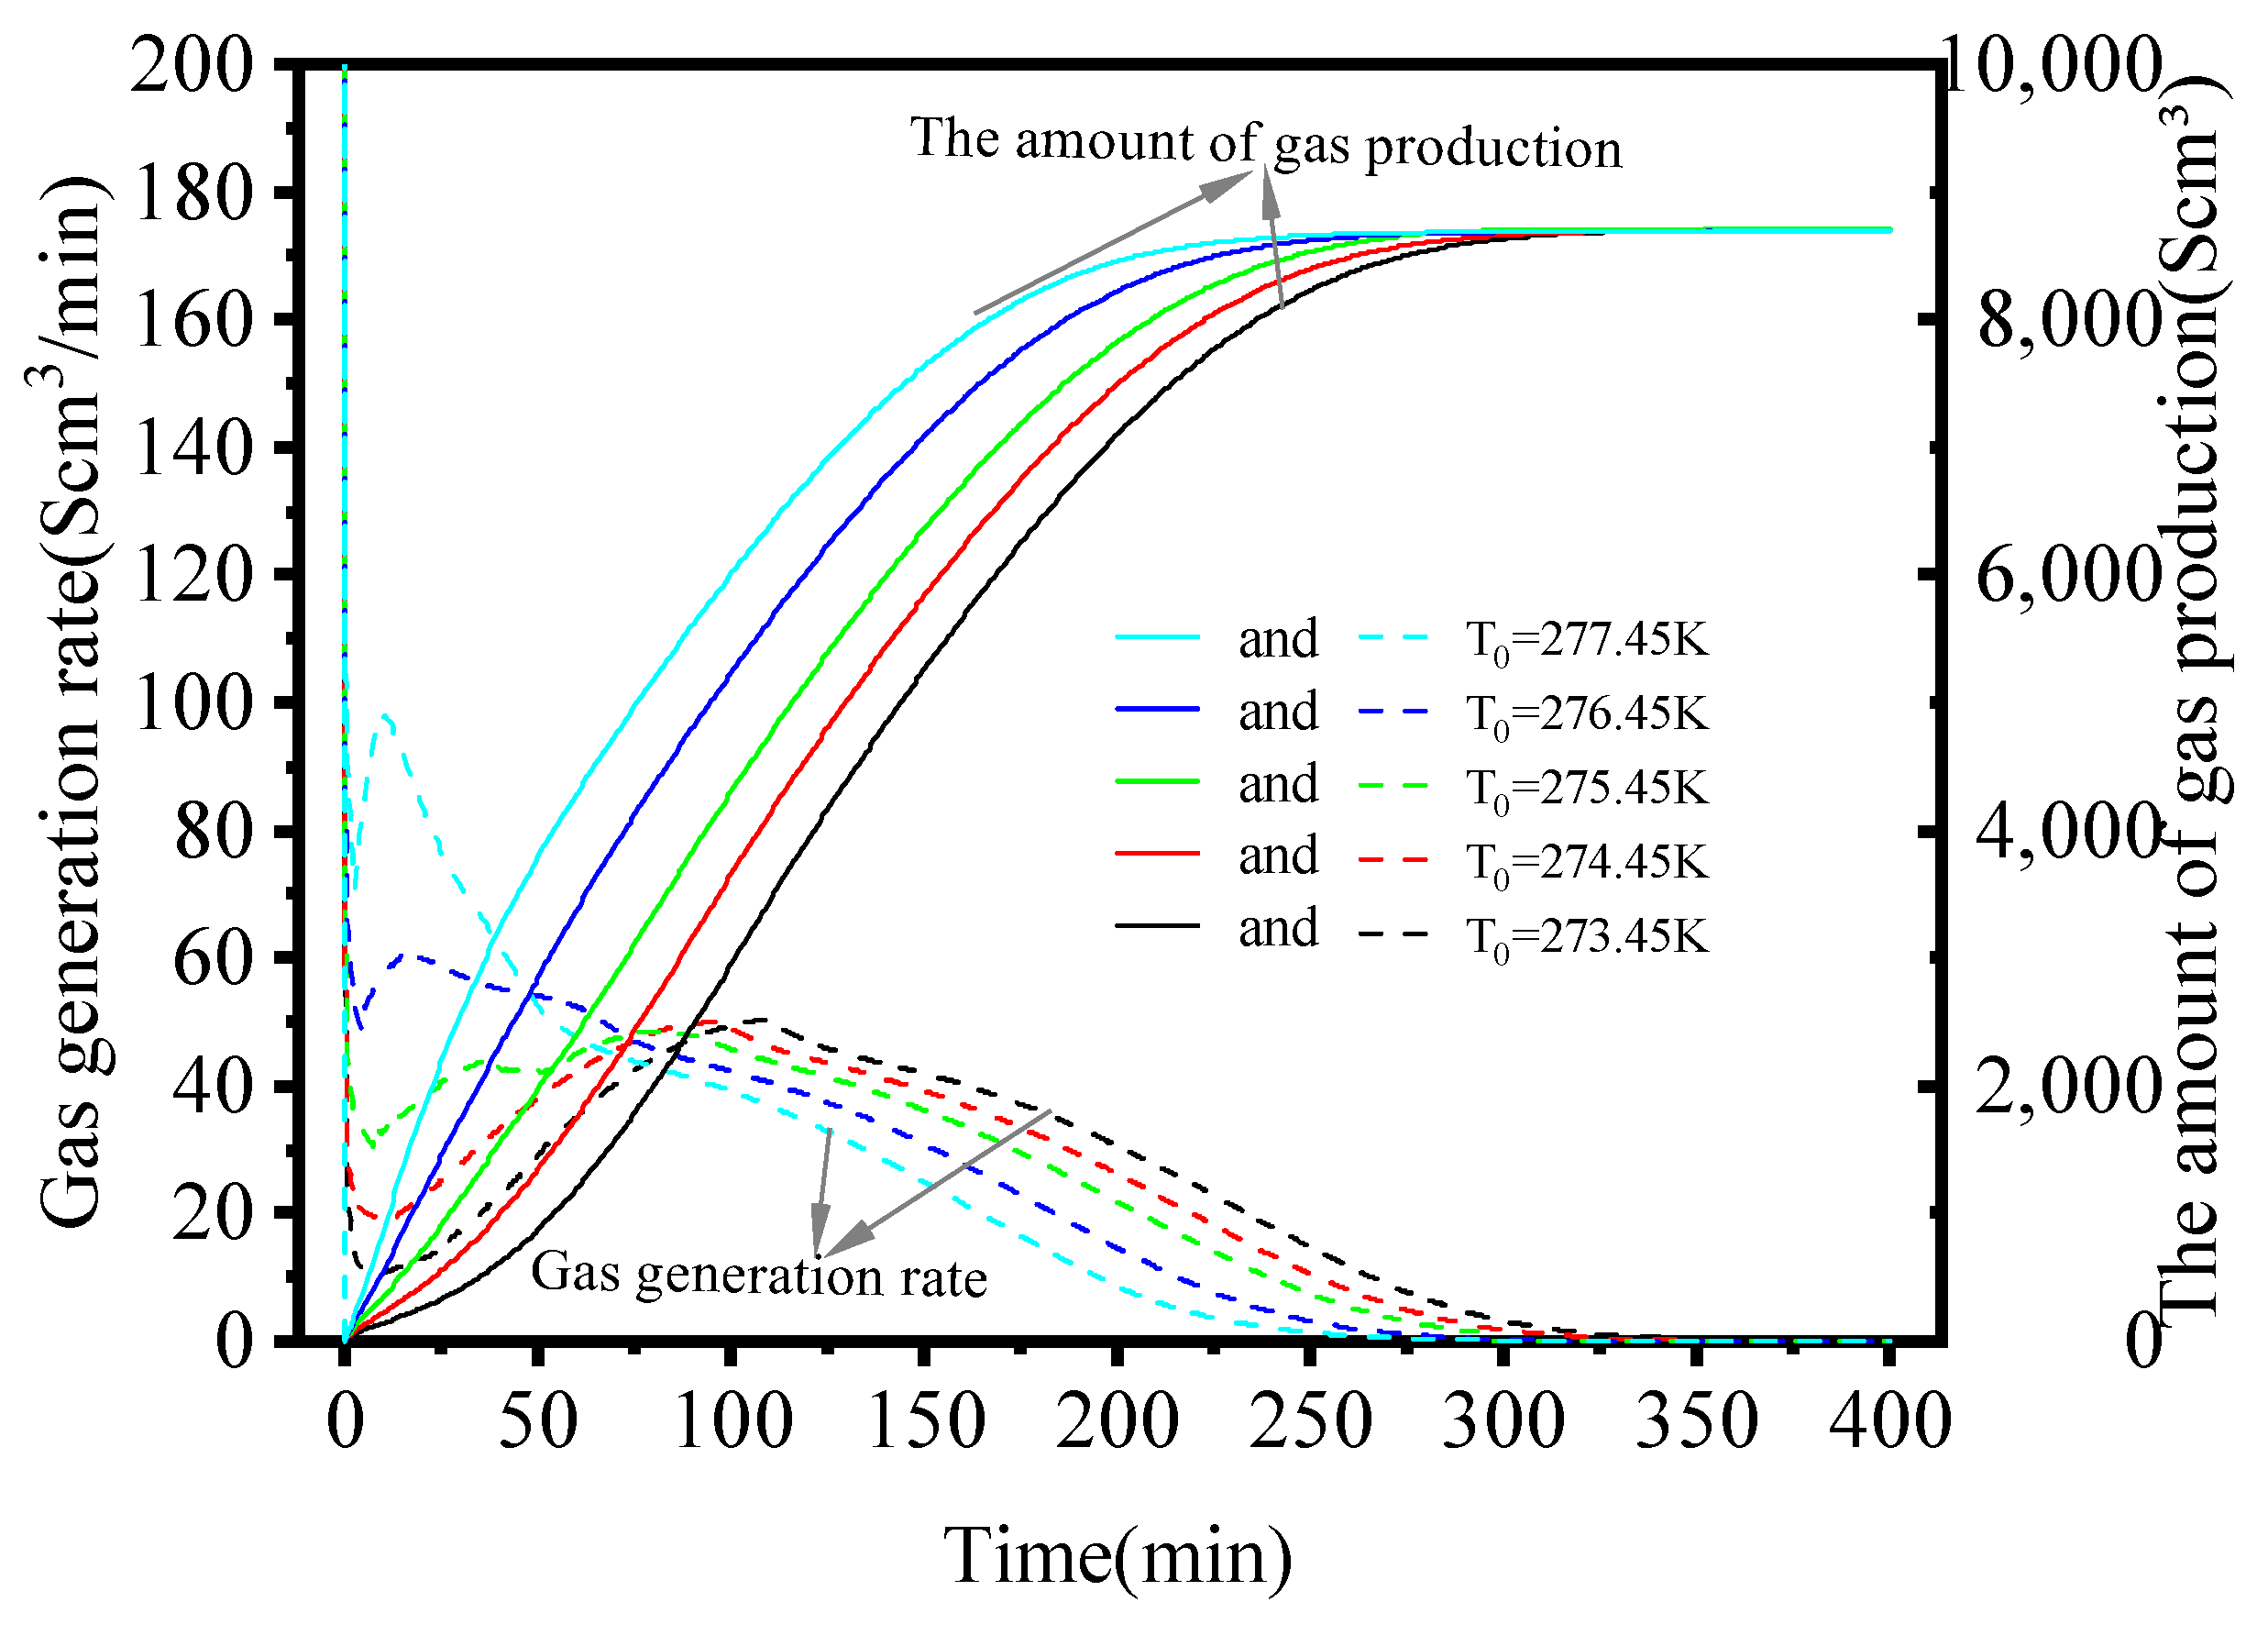
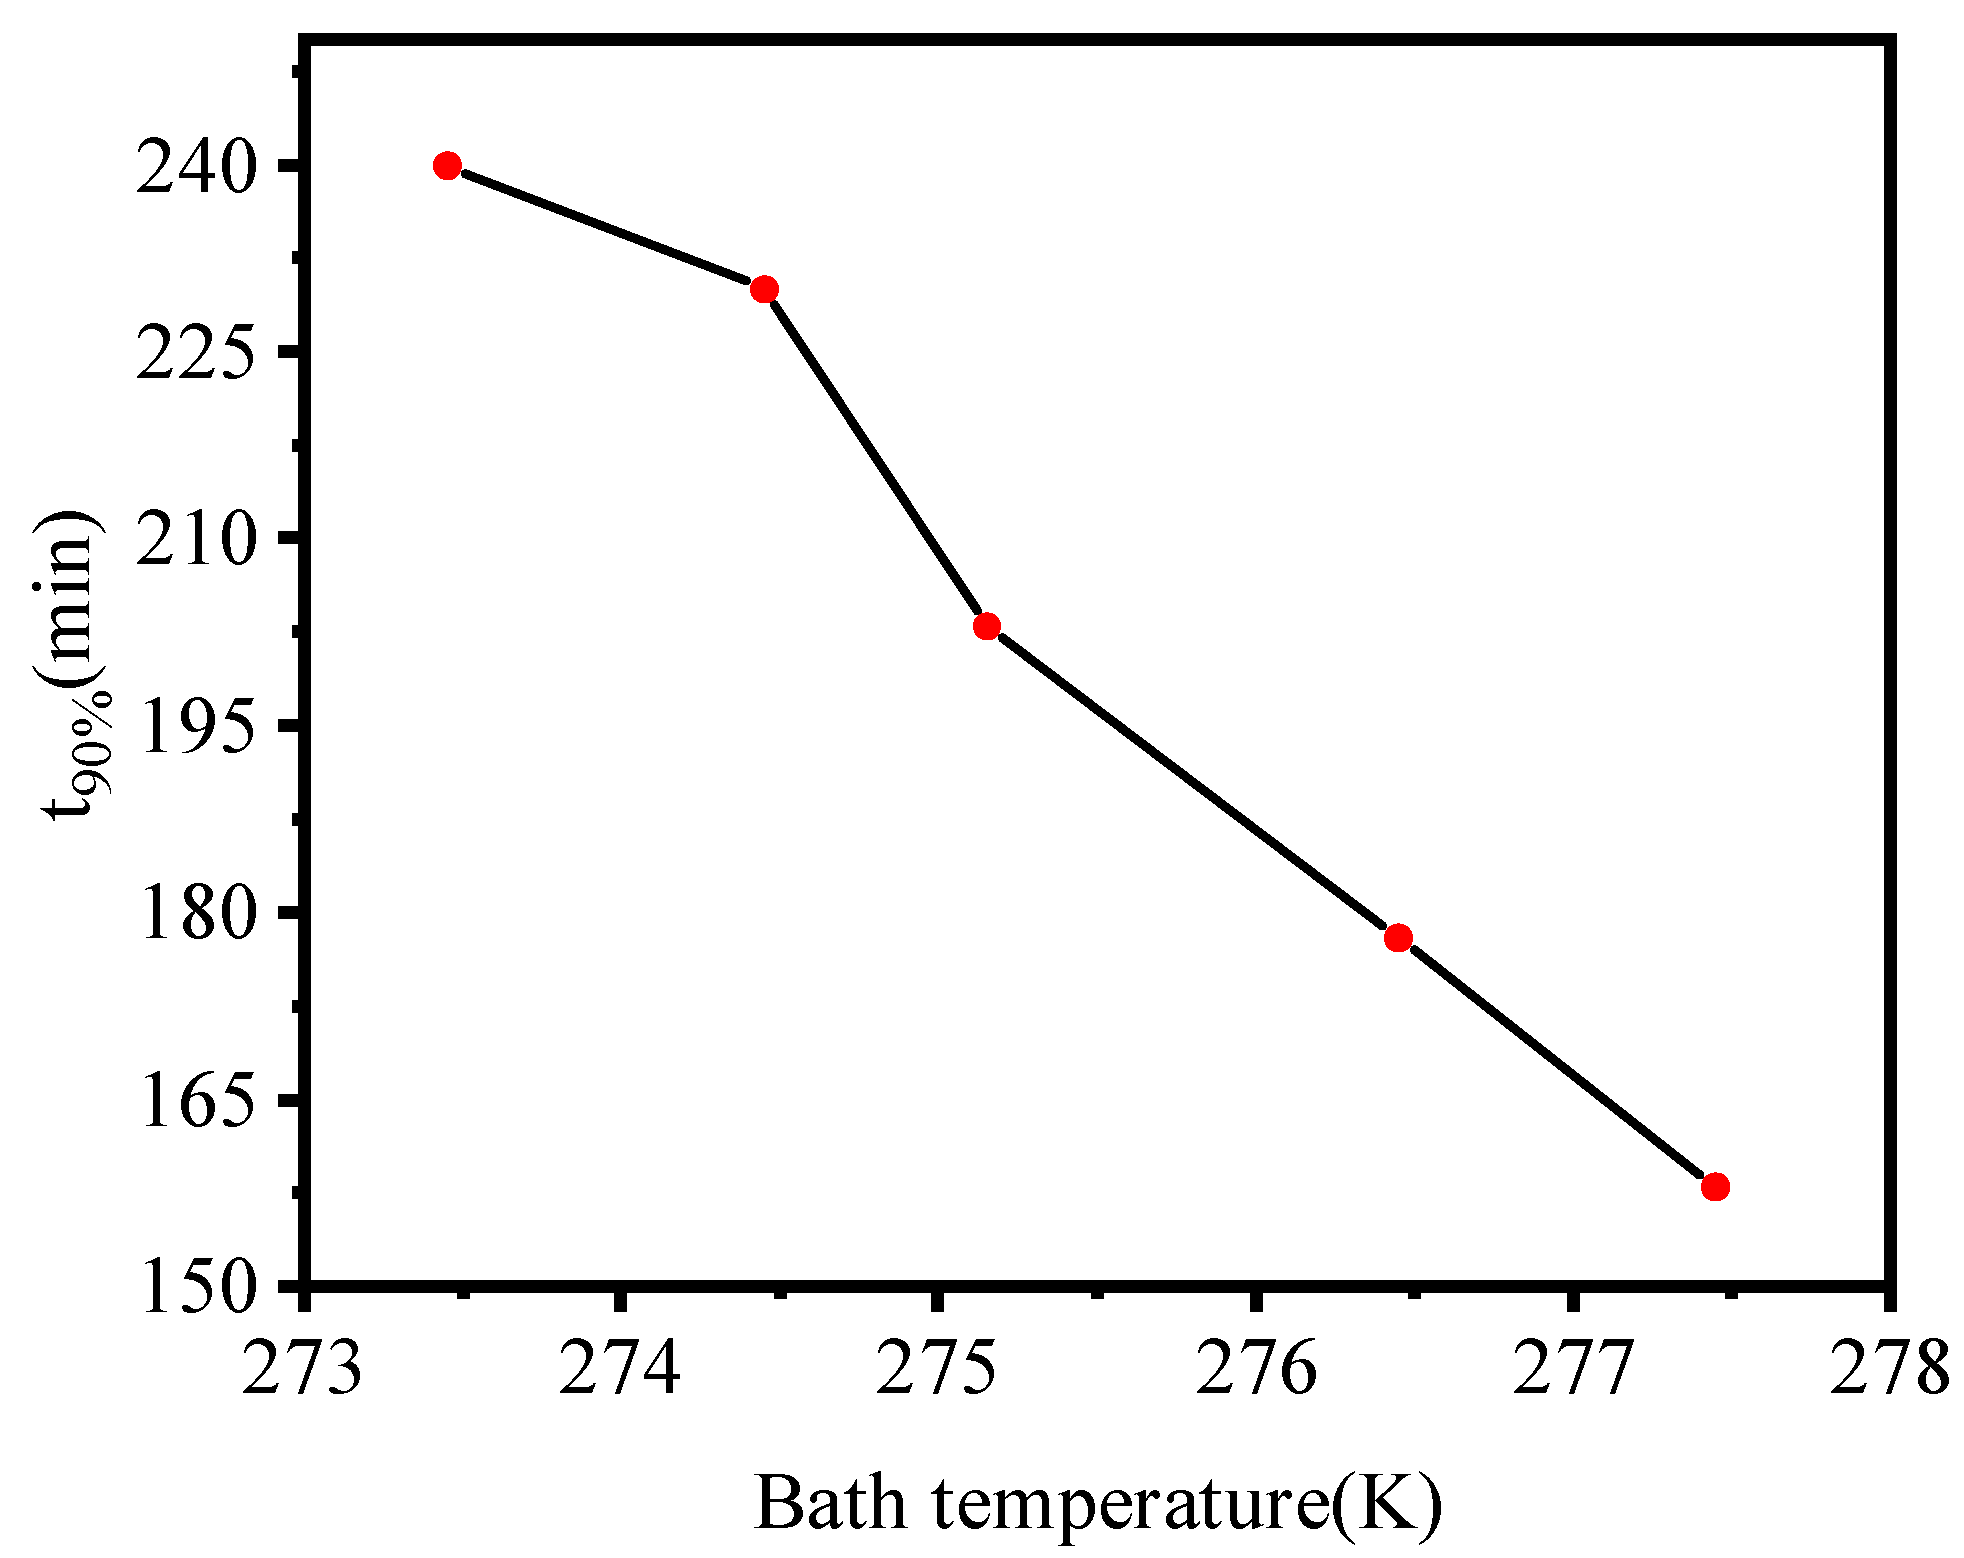
3.4. Effect of Initial Temperature
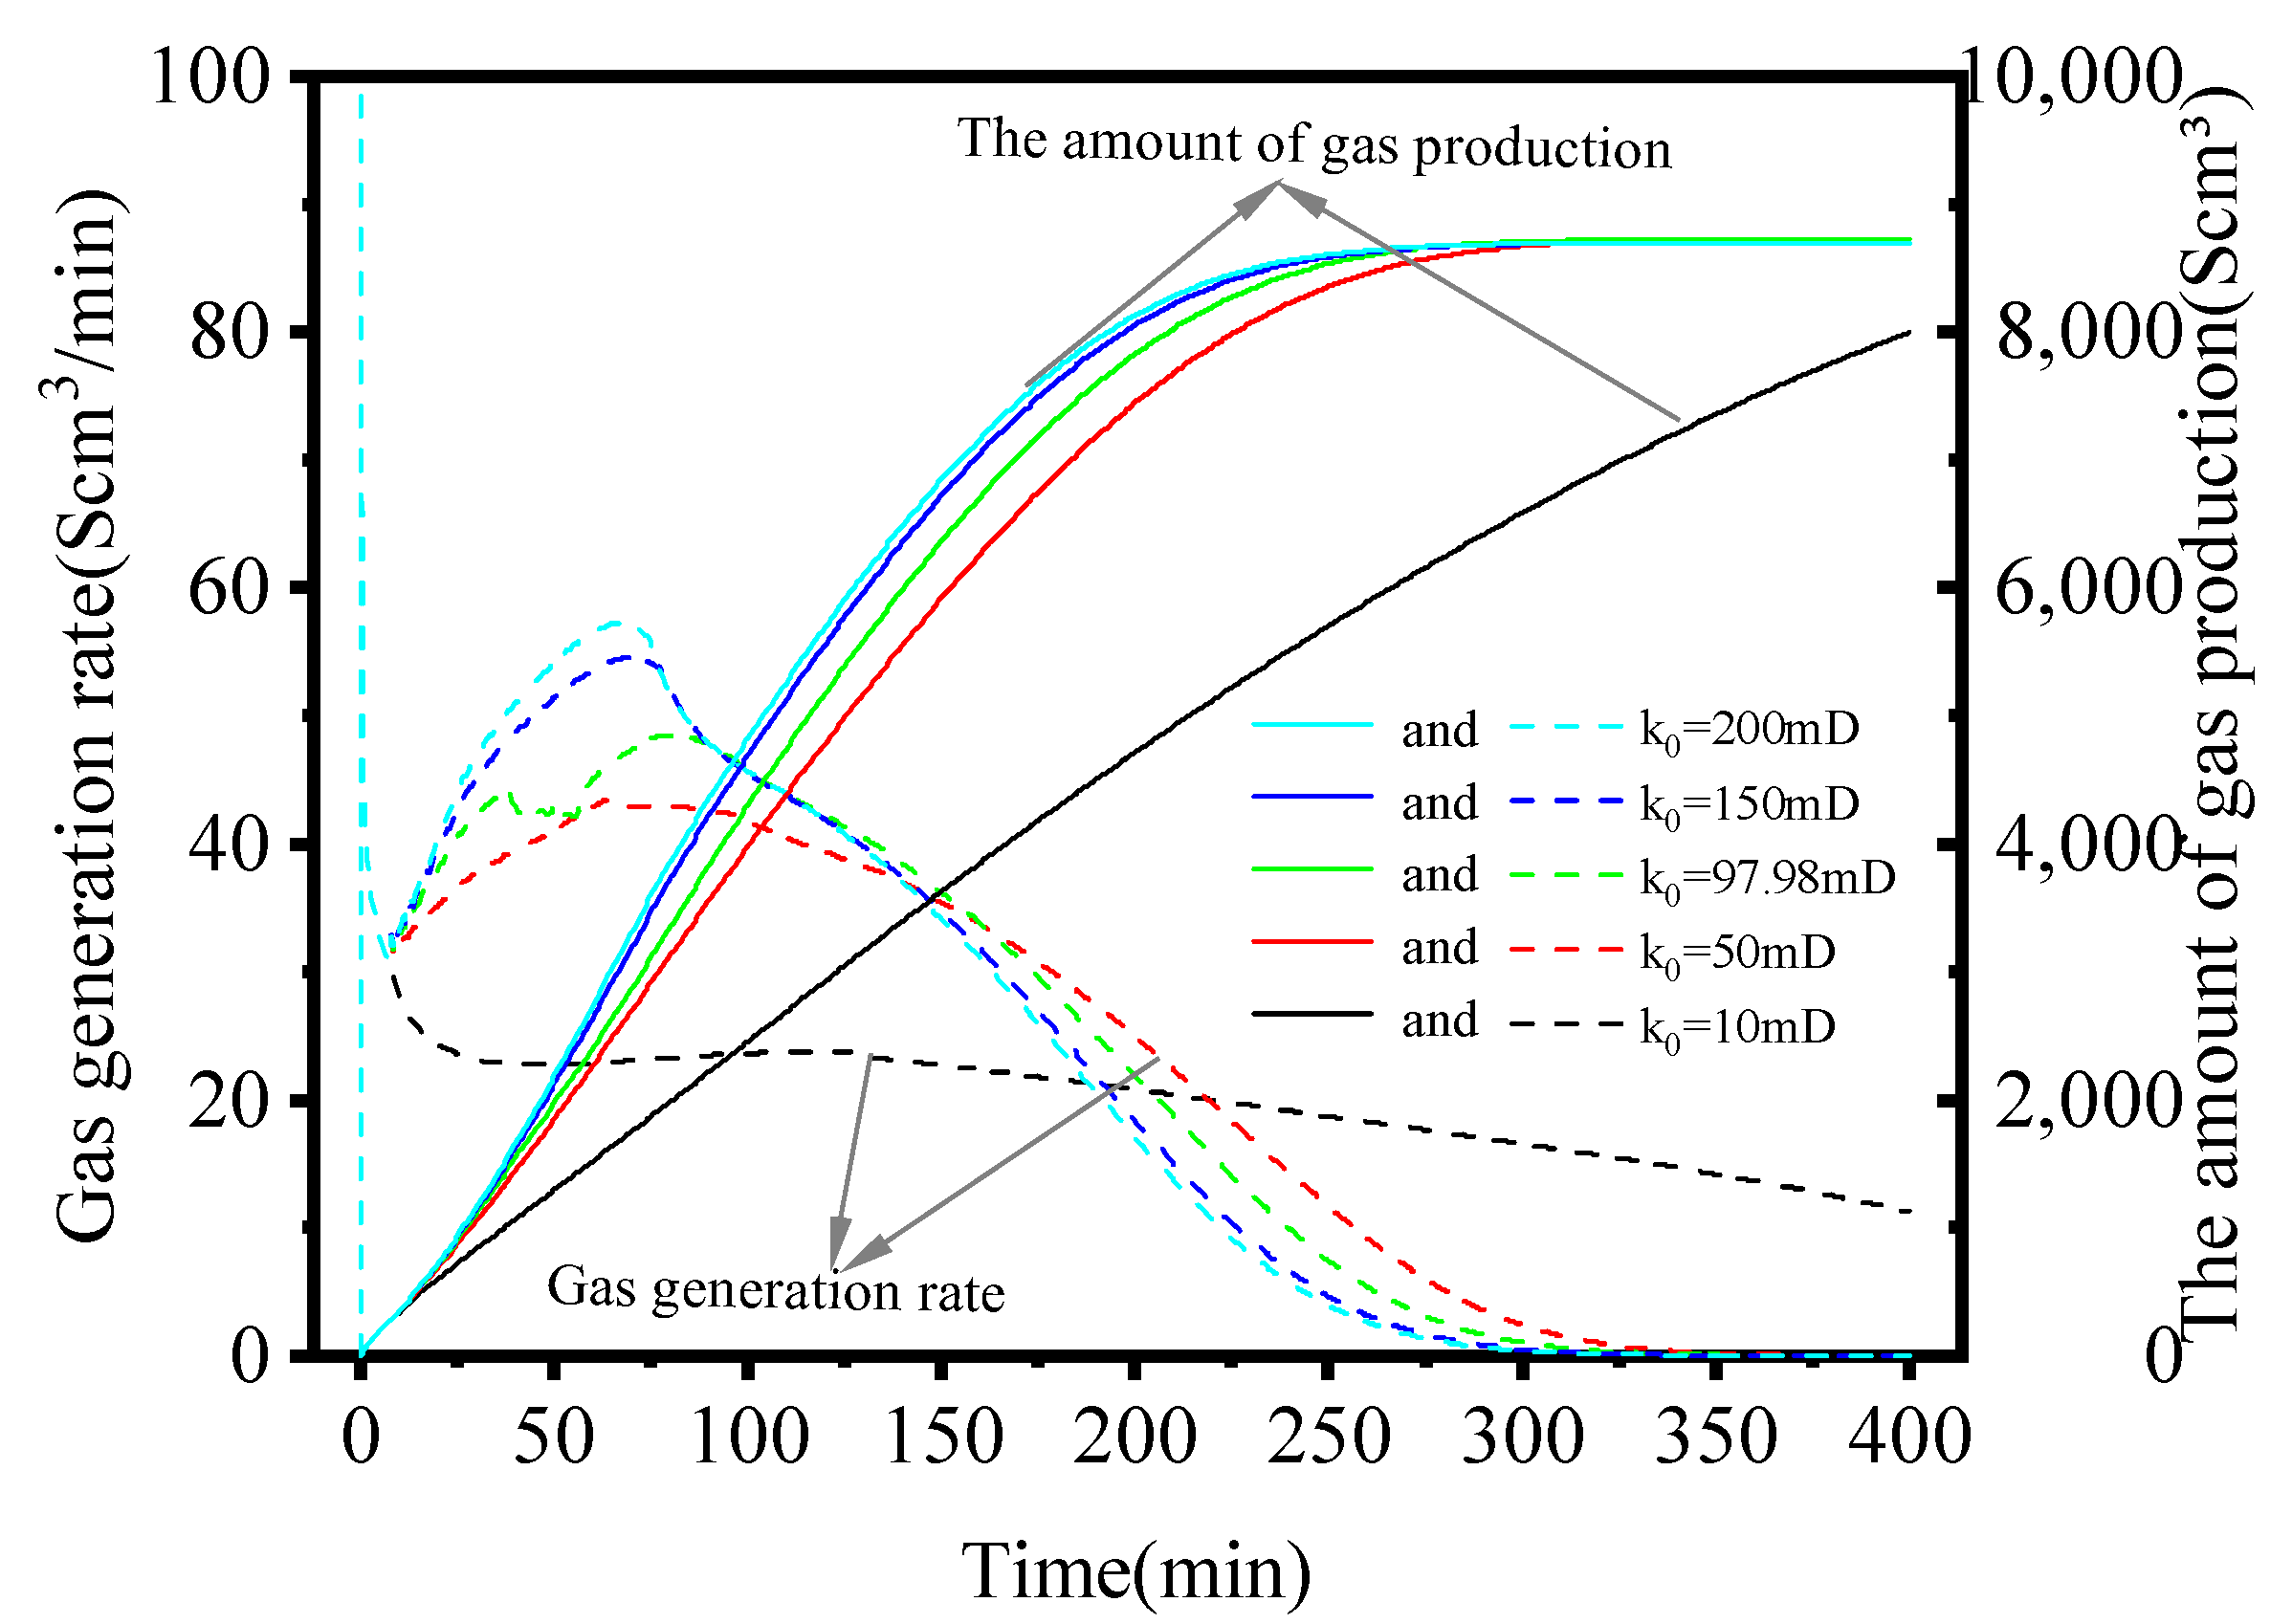
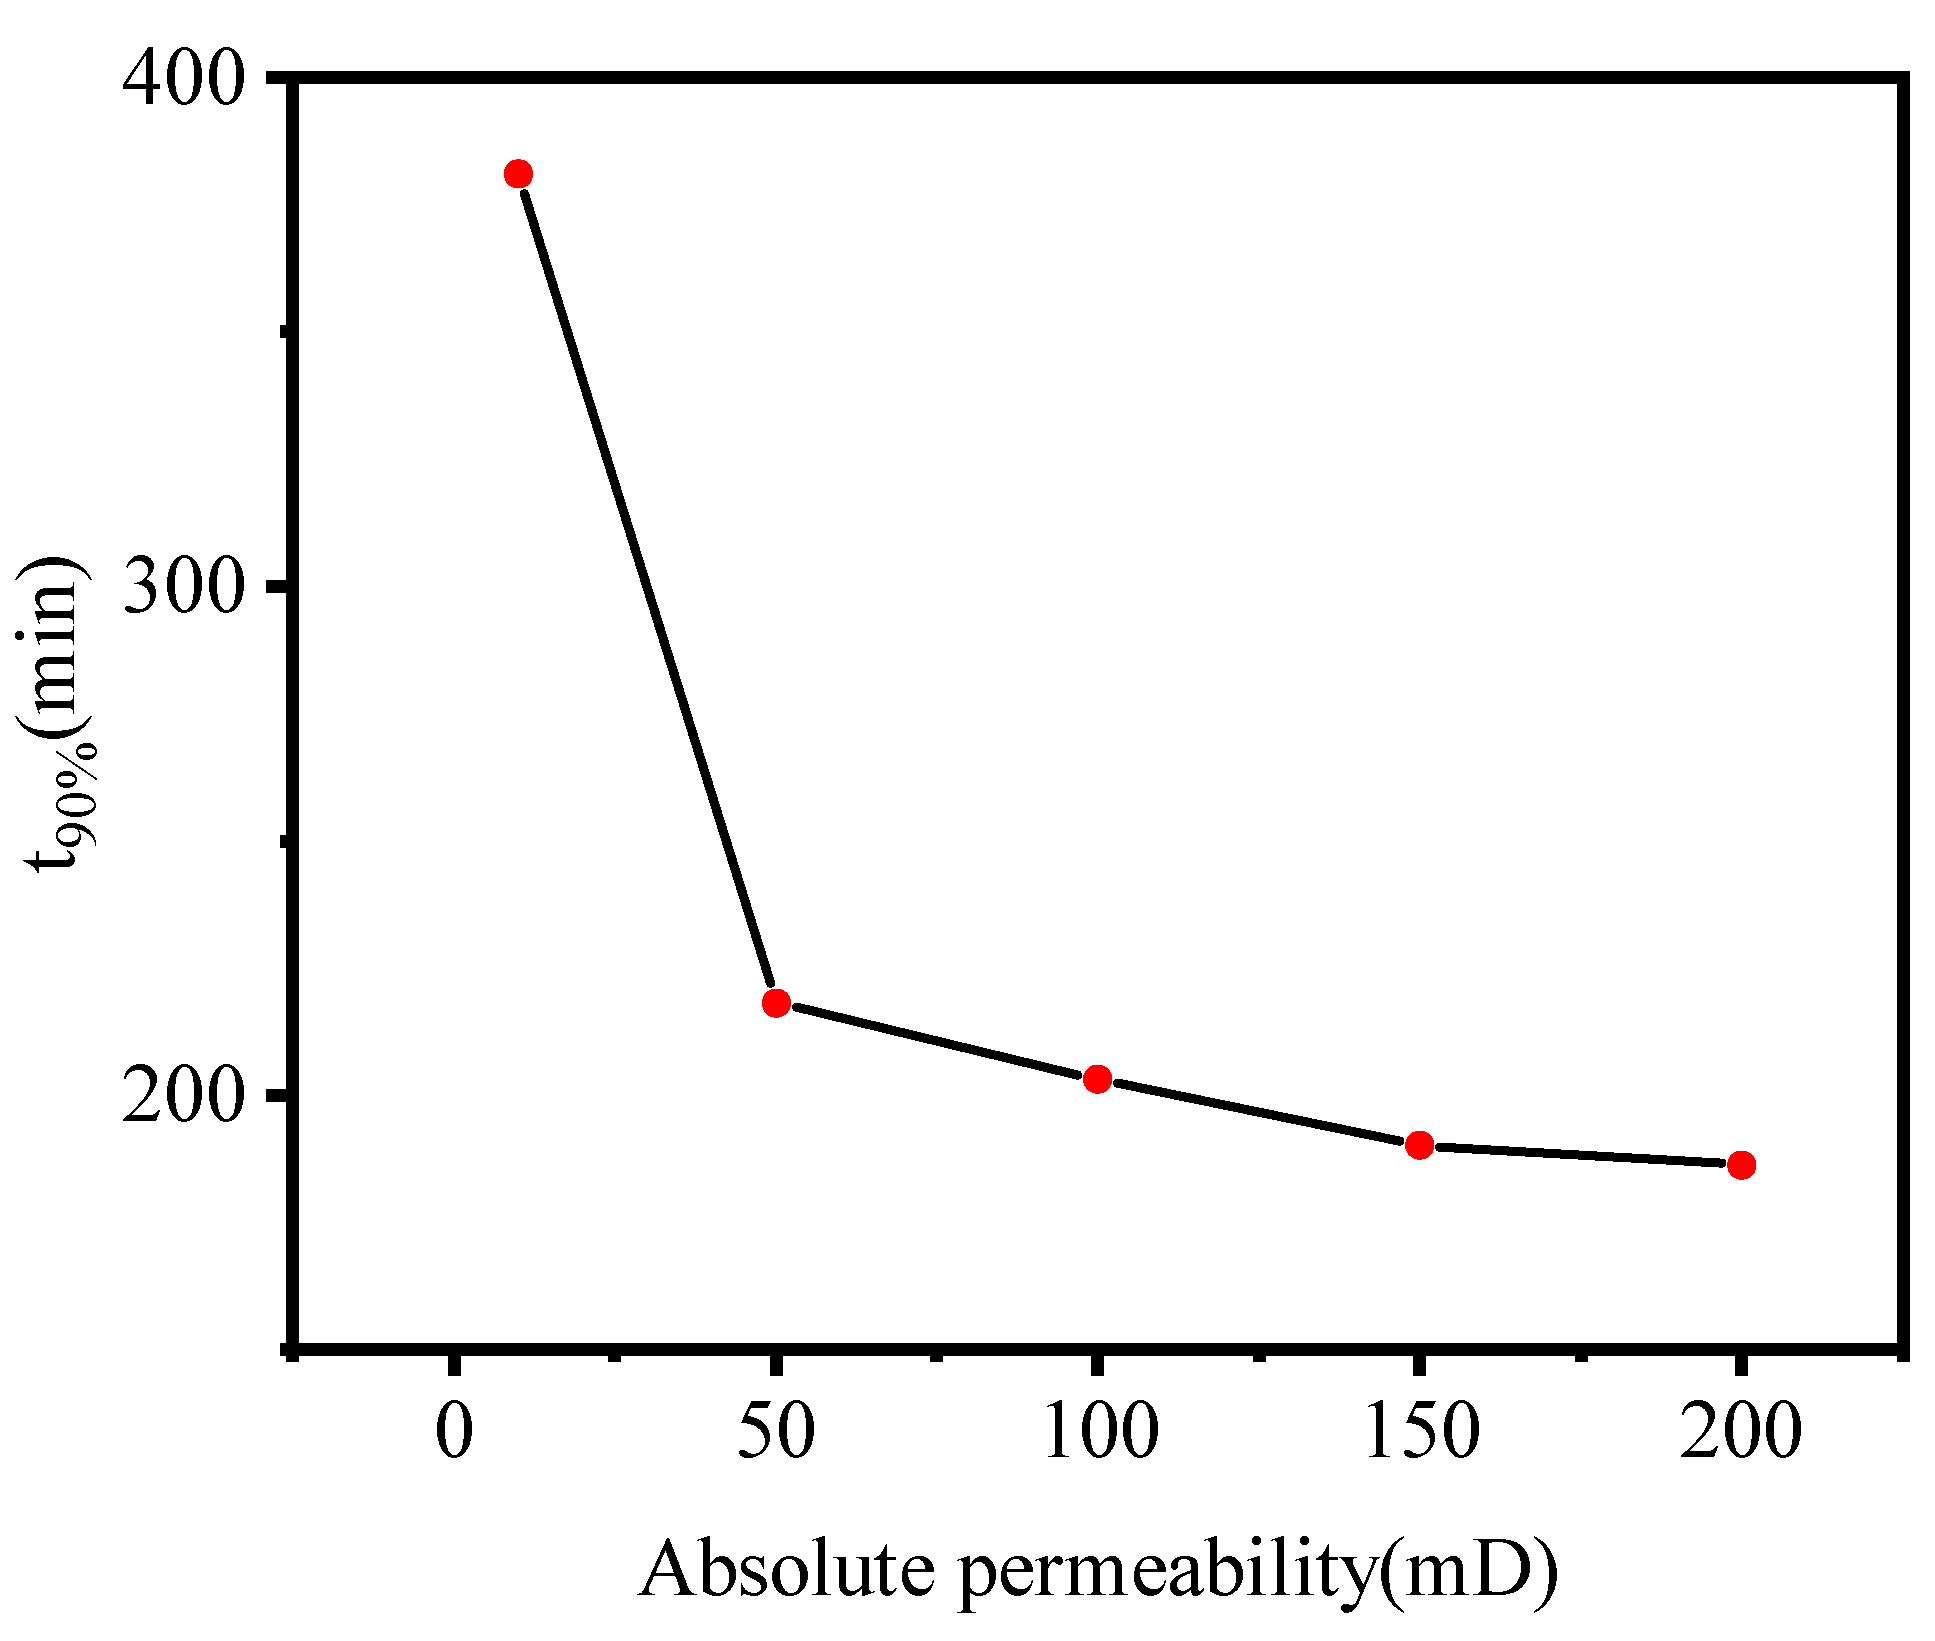
3.5. Effect of Absolute Permeability
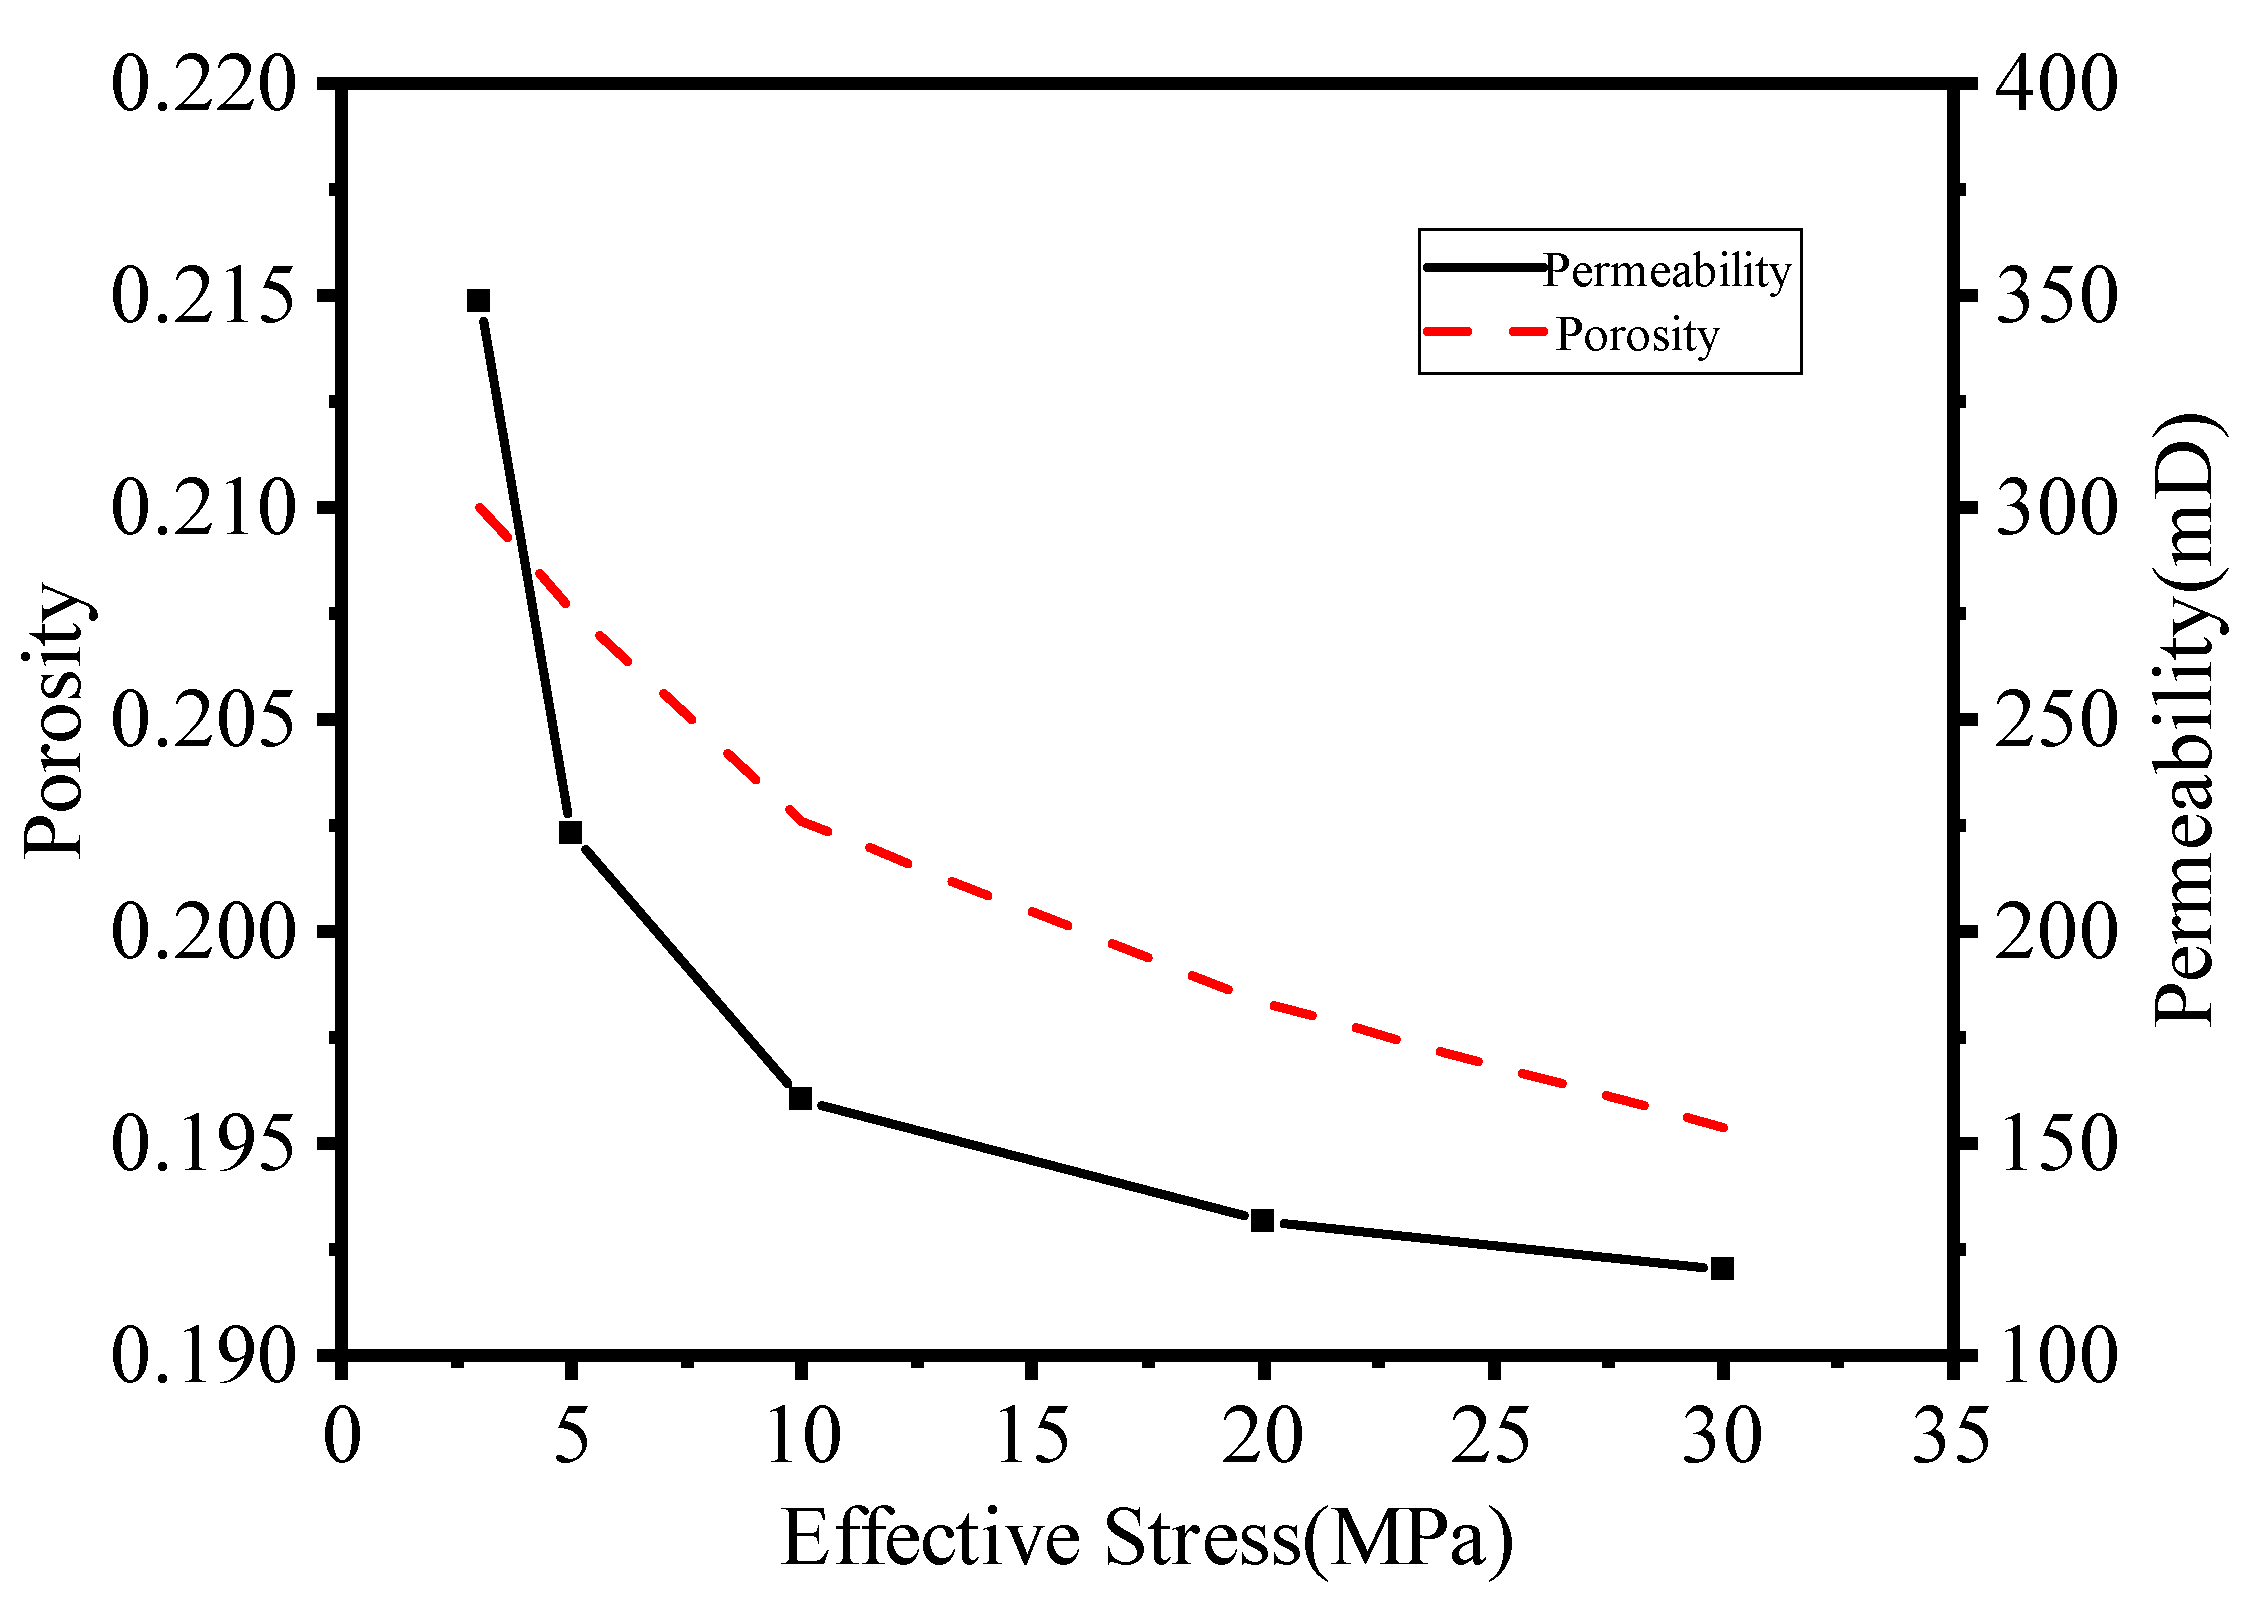
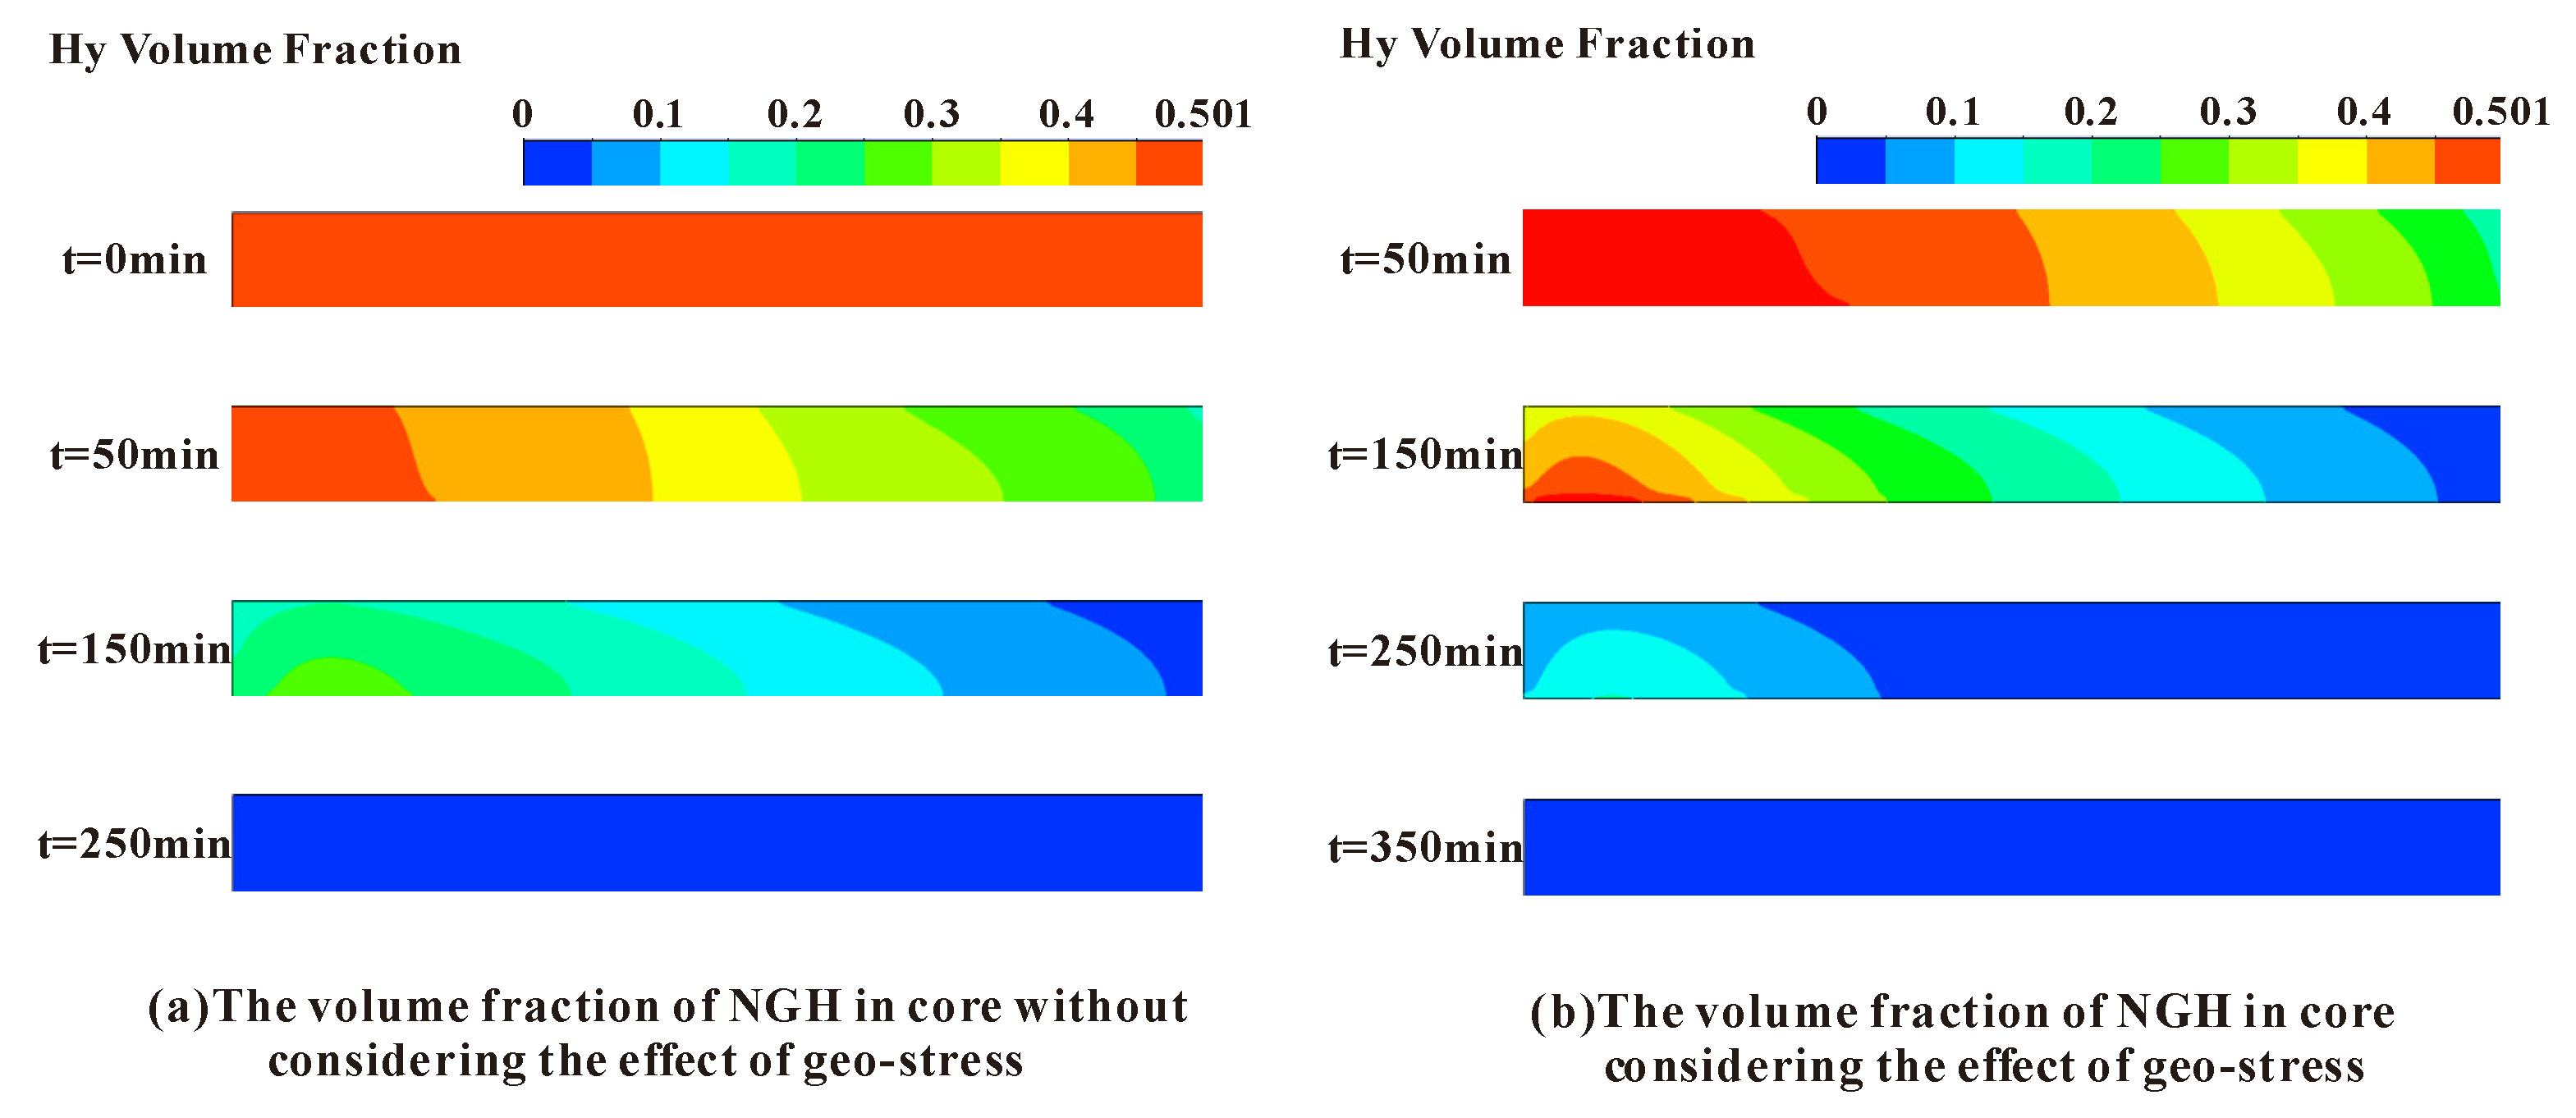
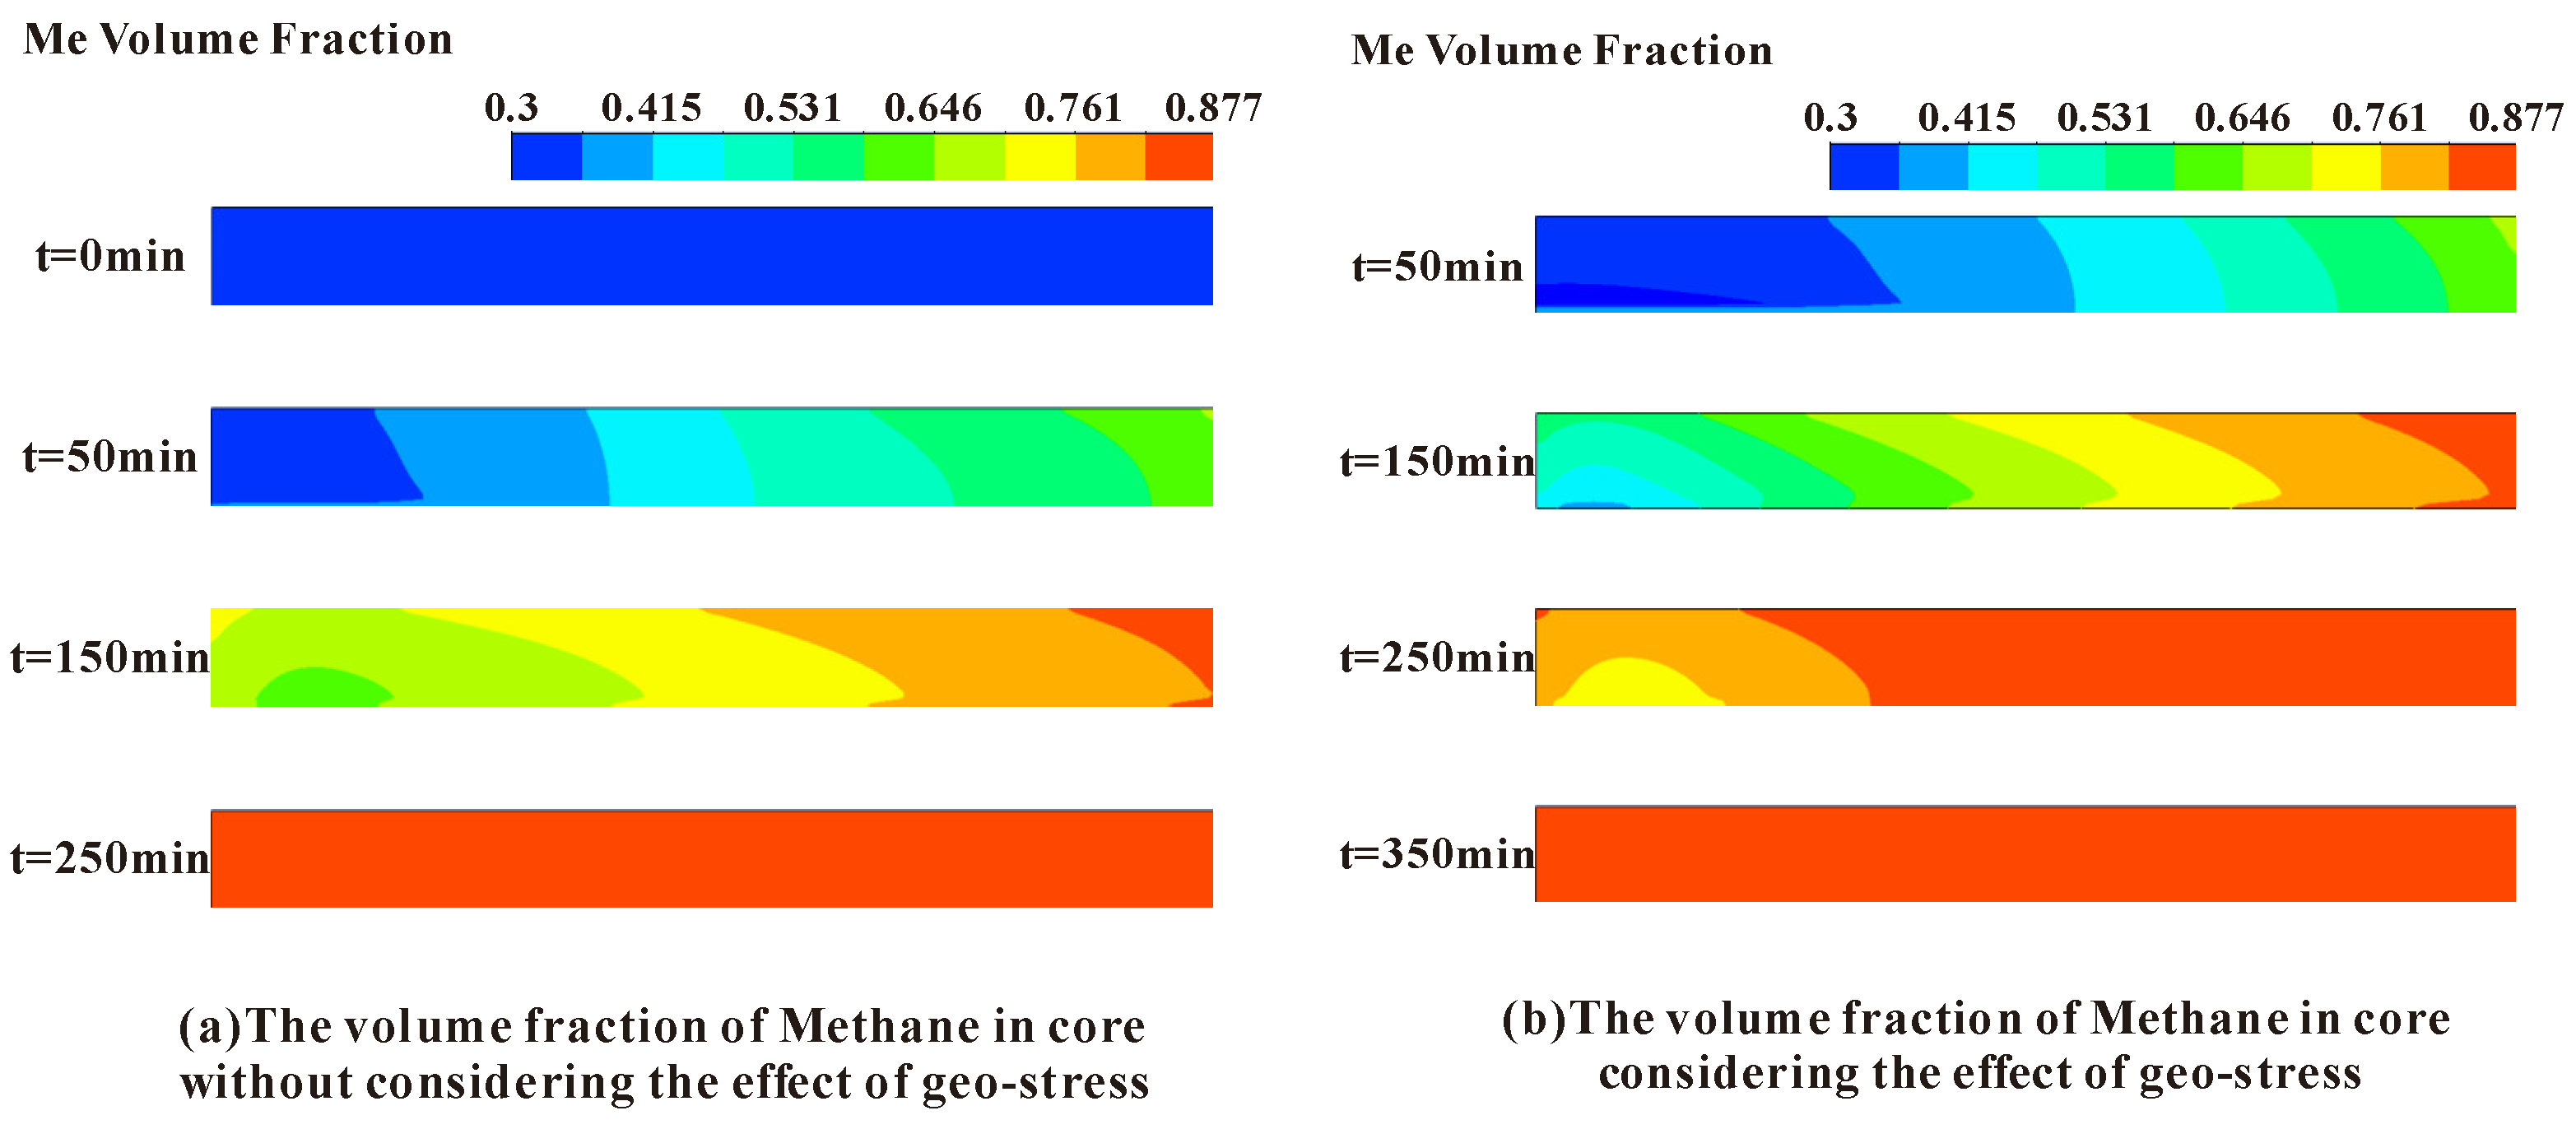
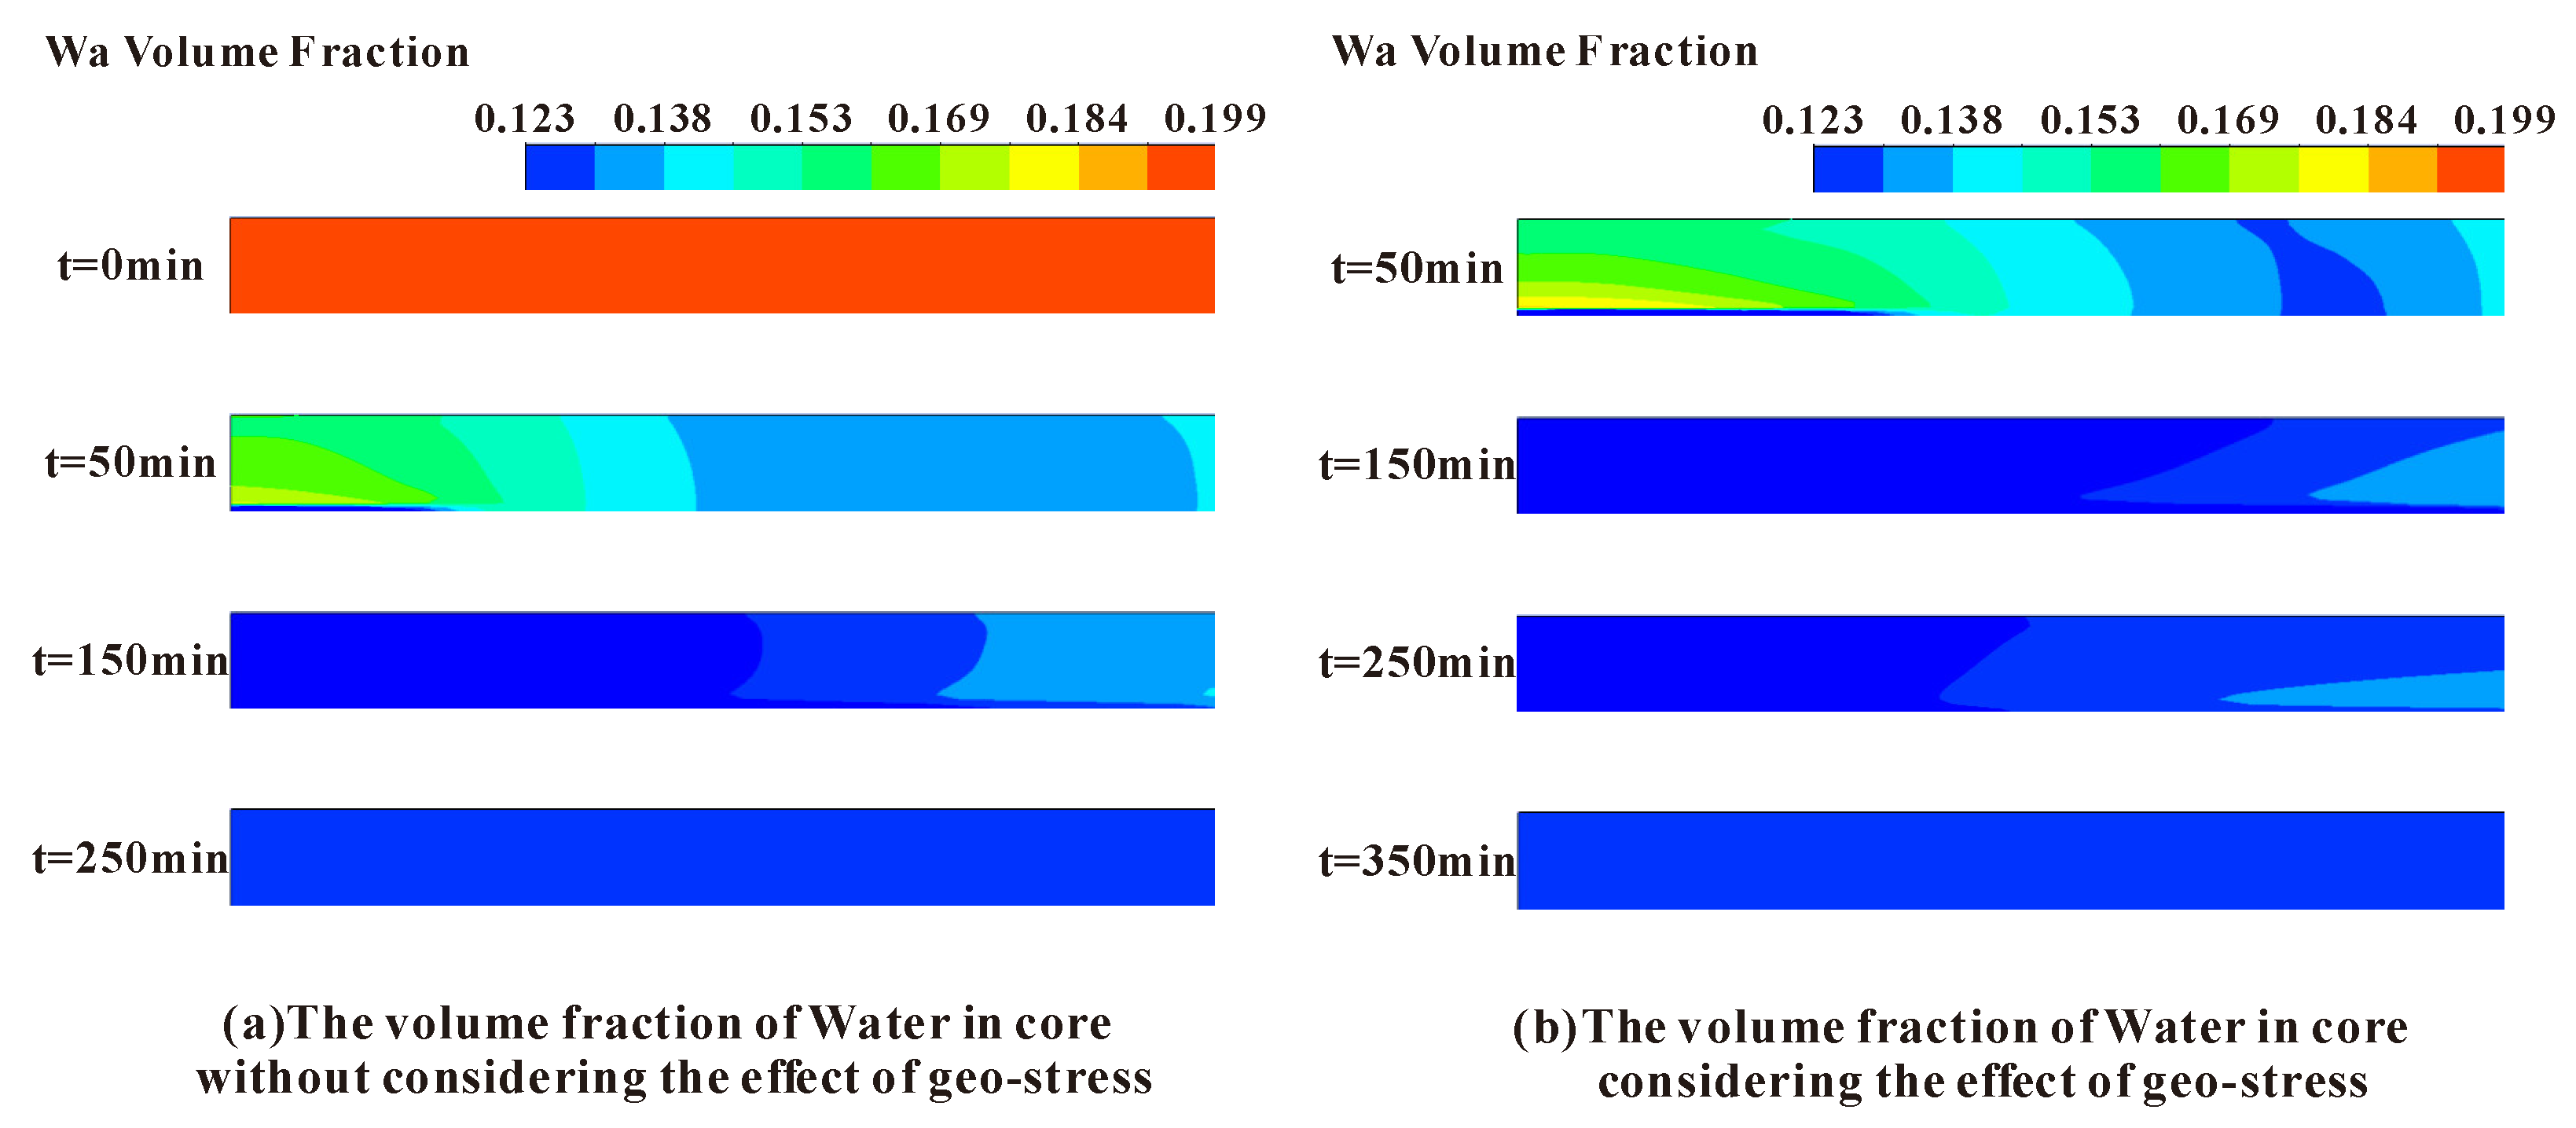
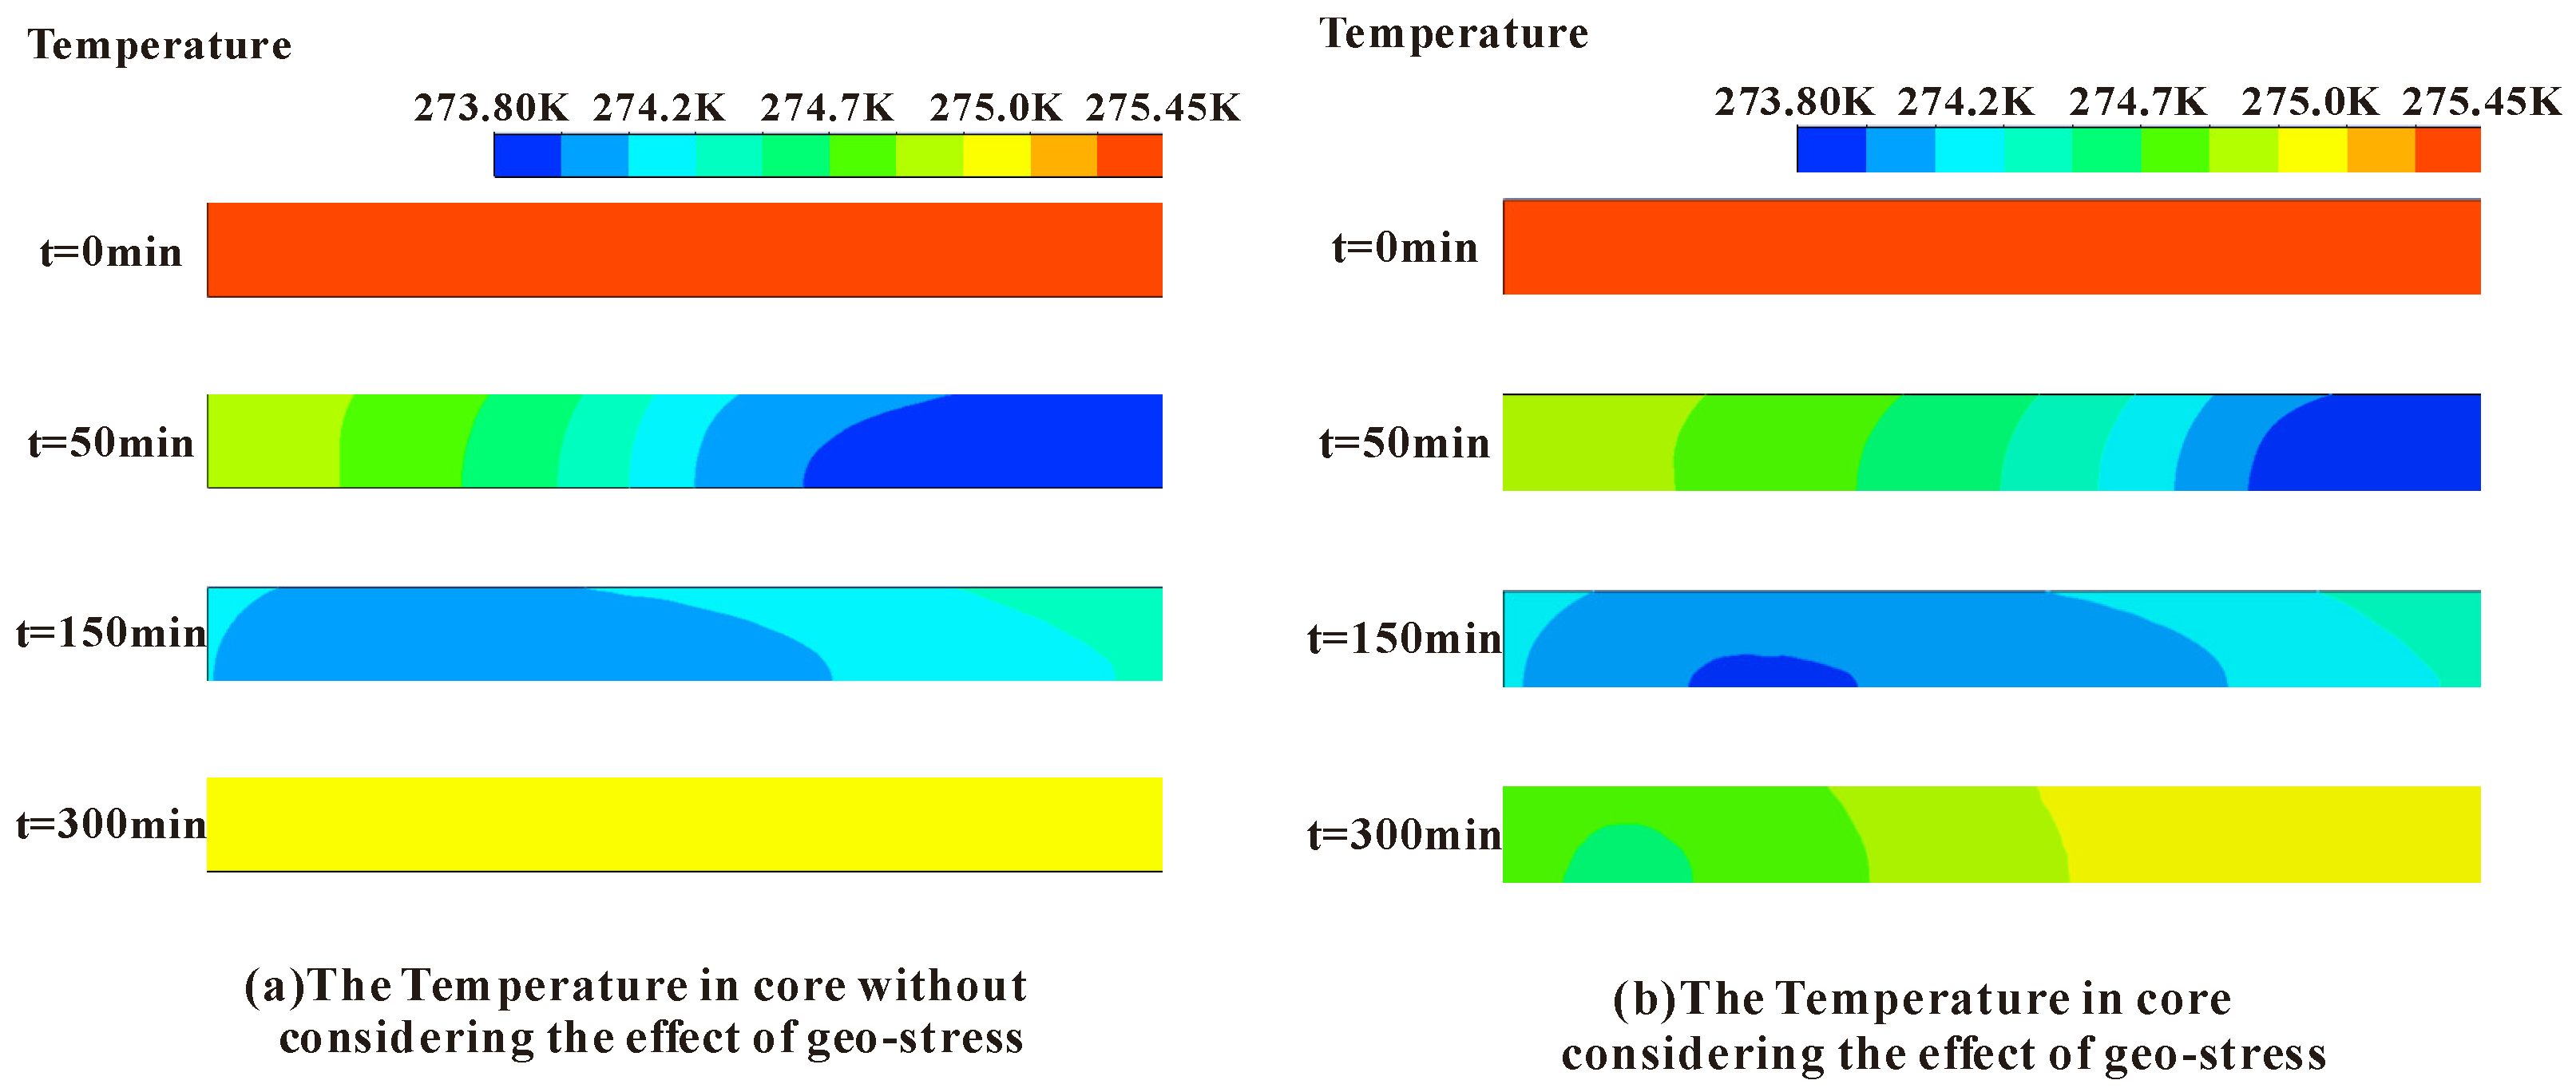
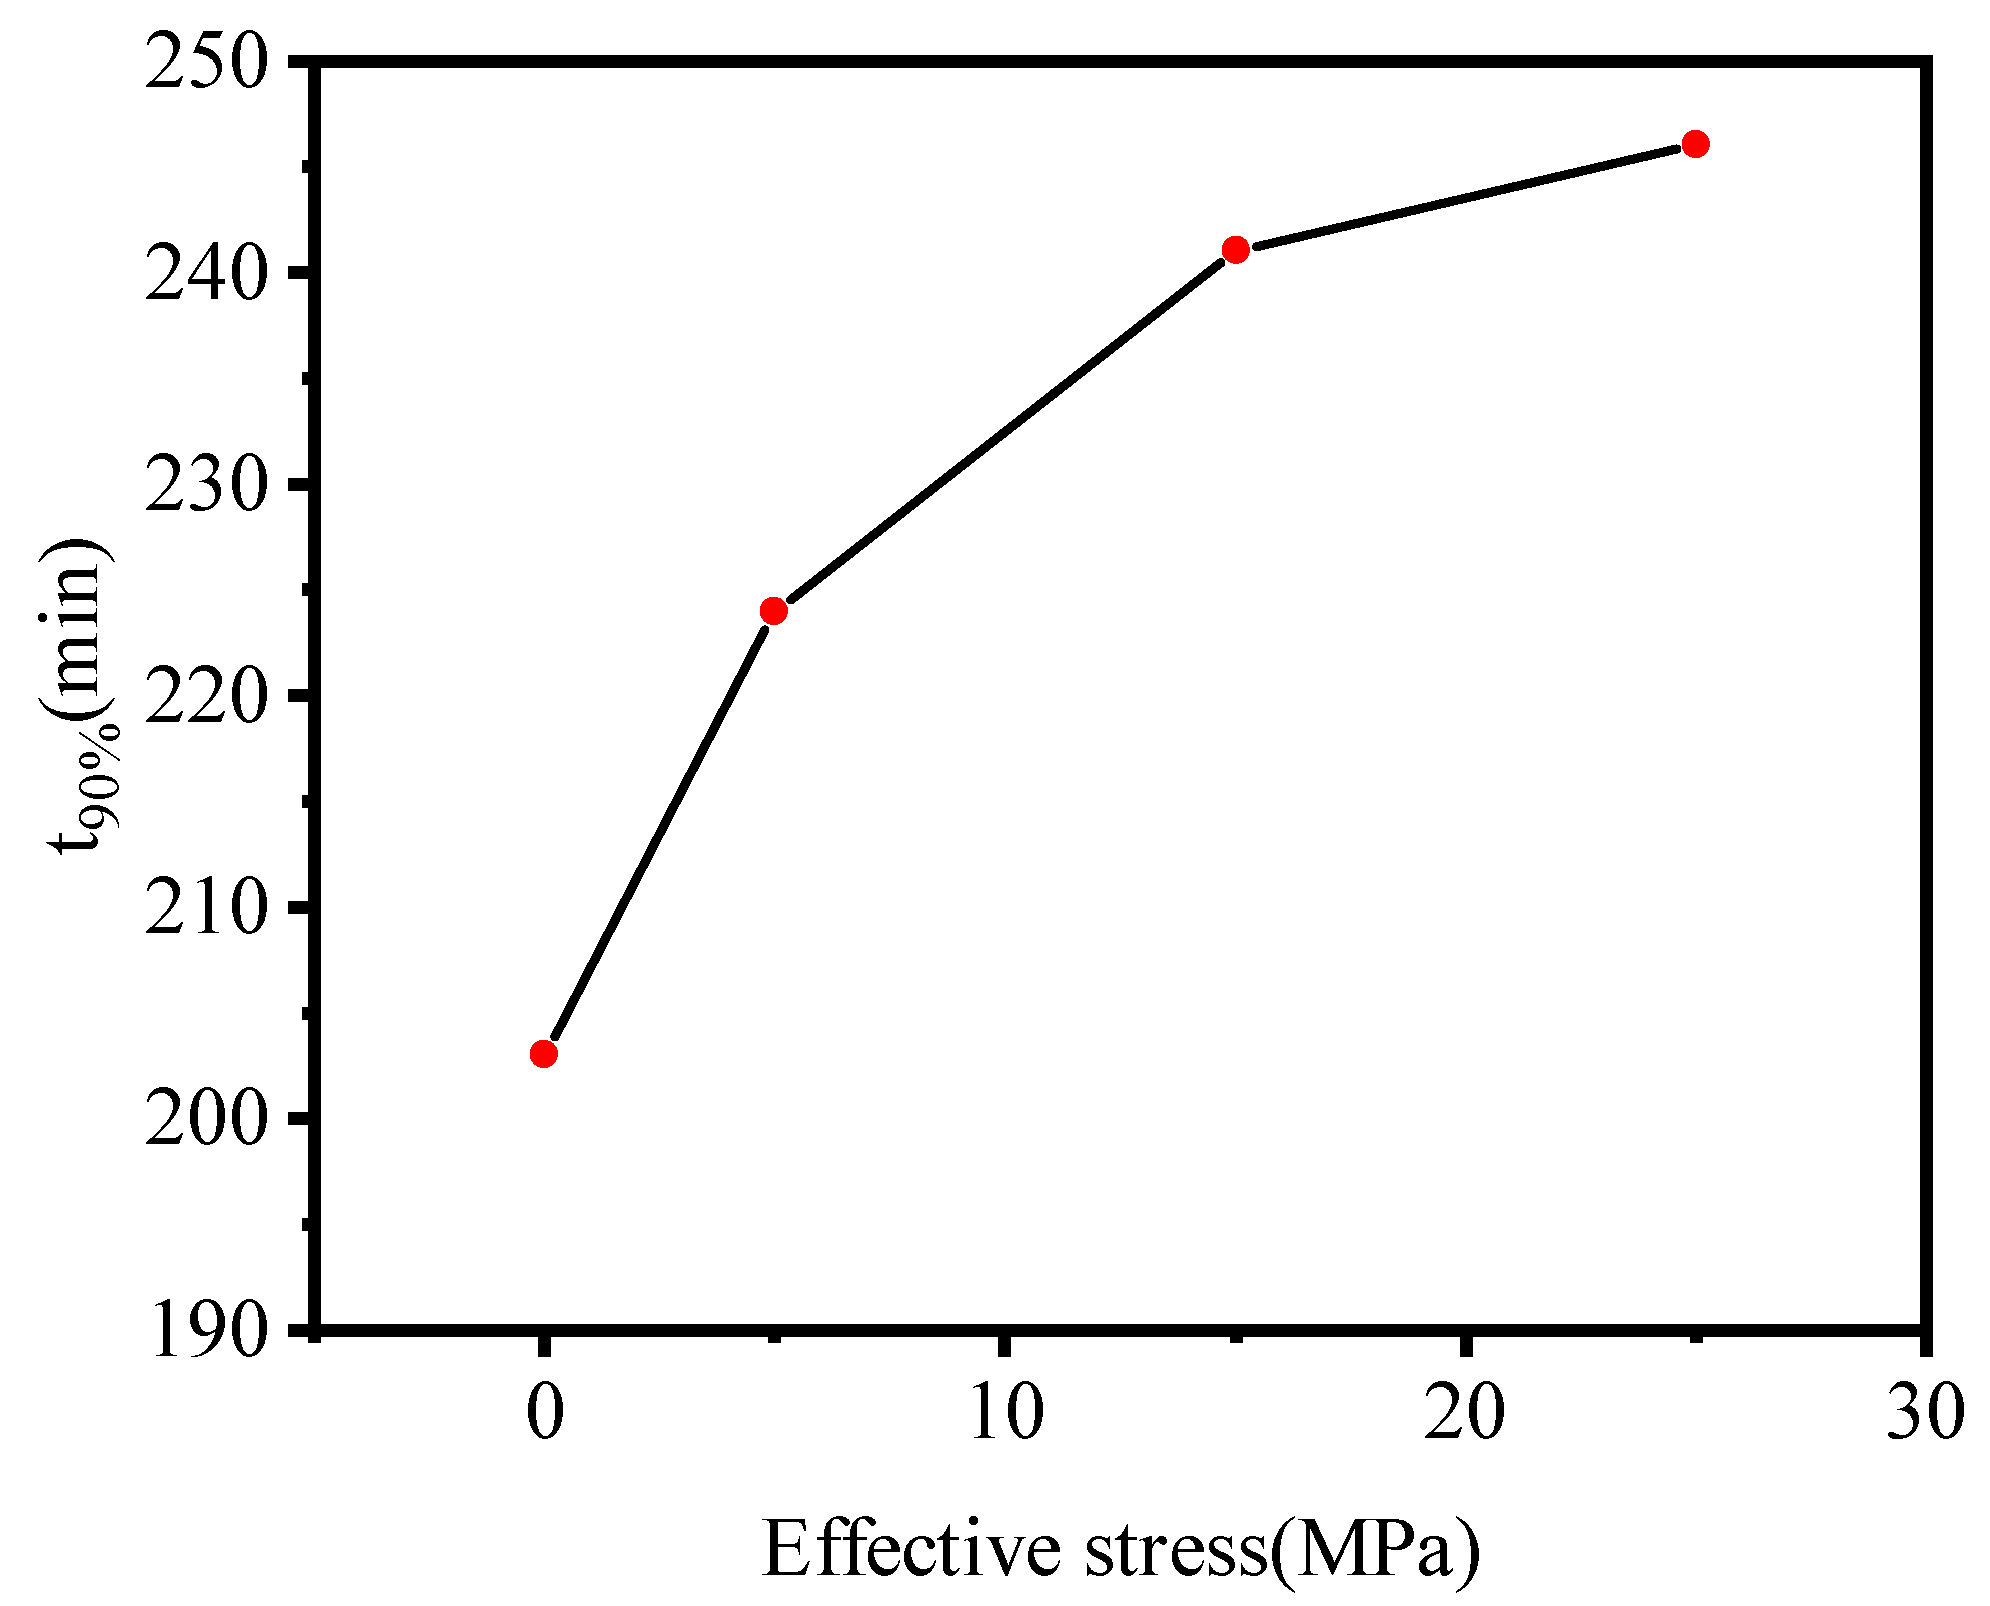
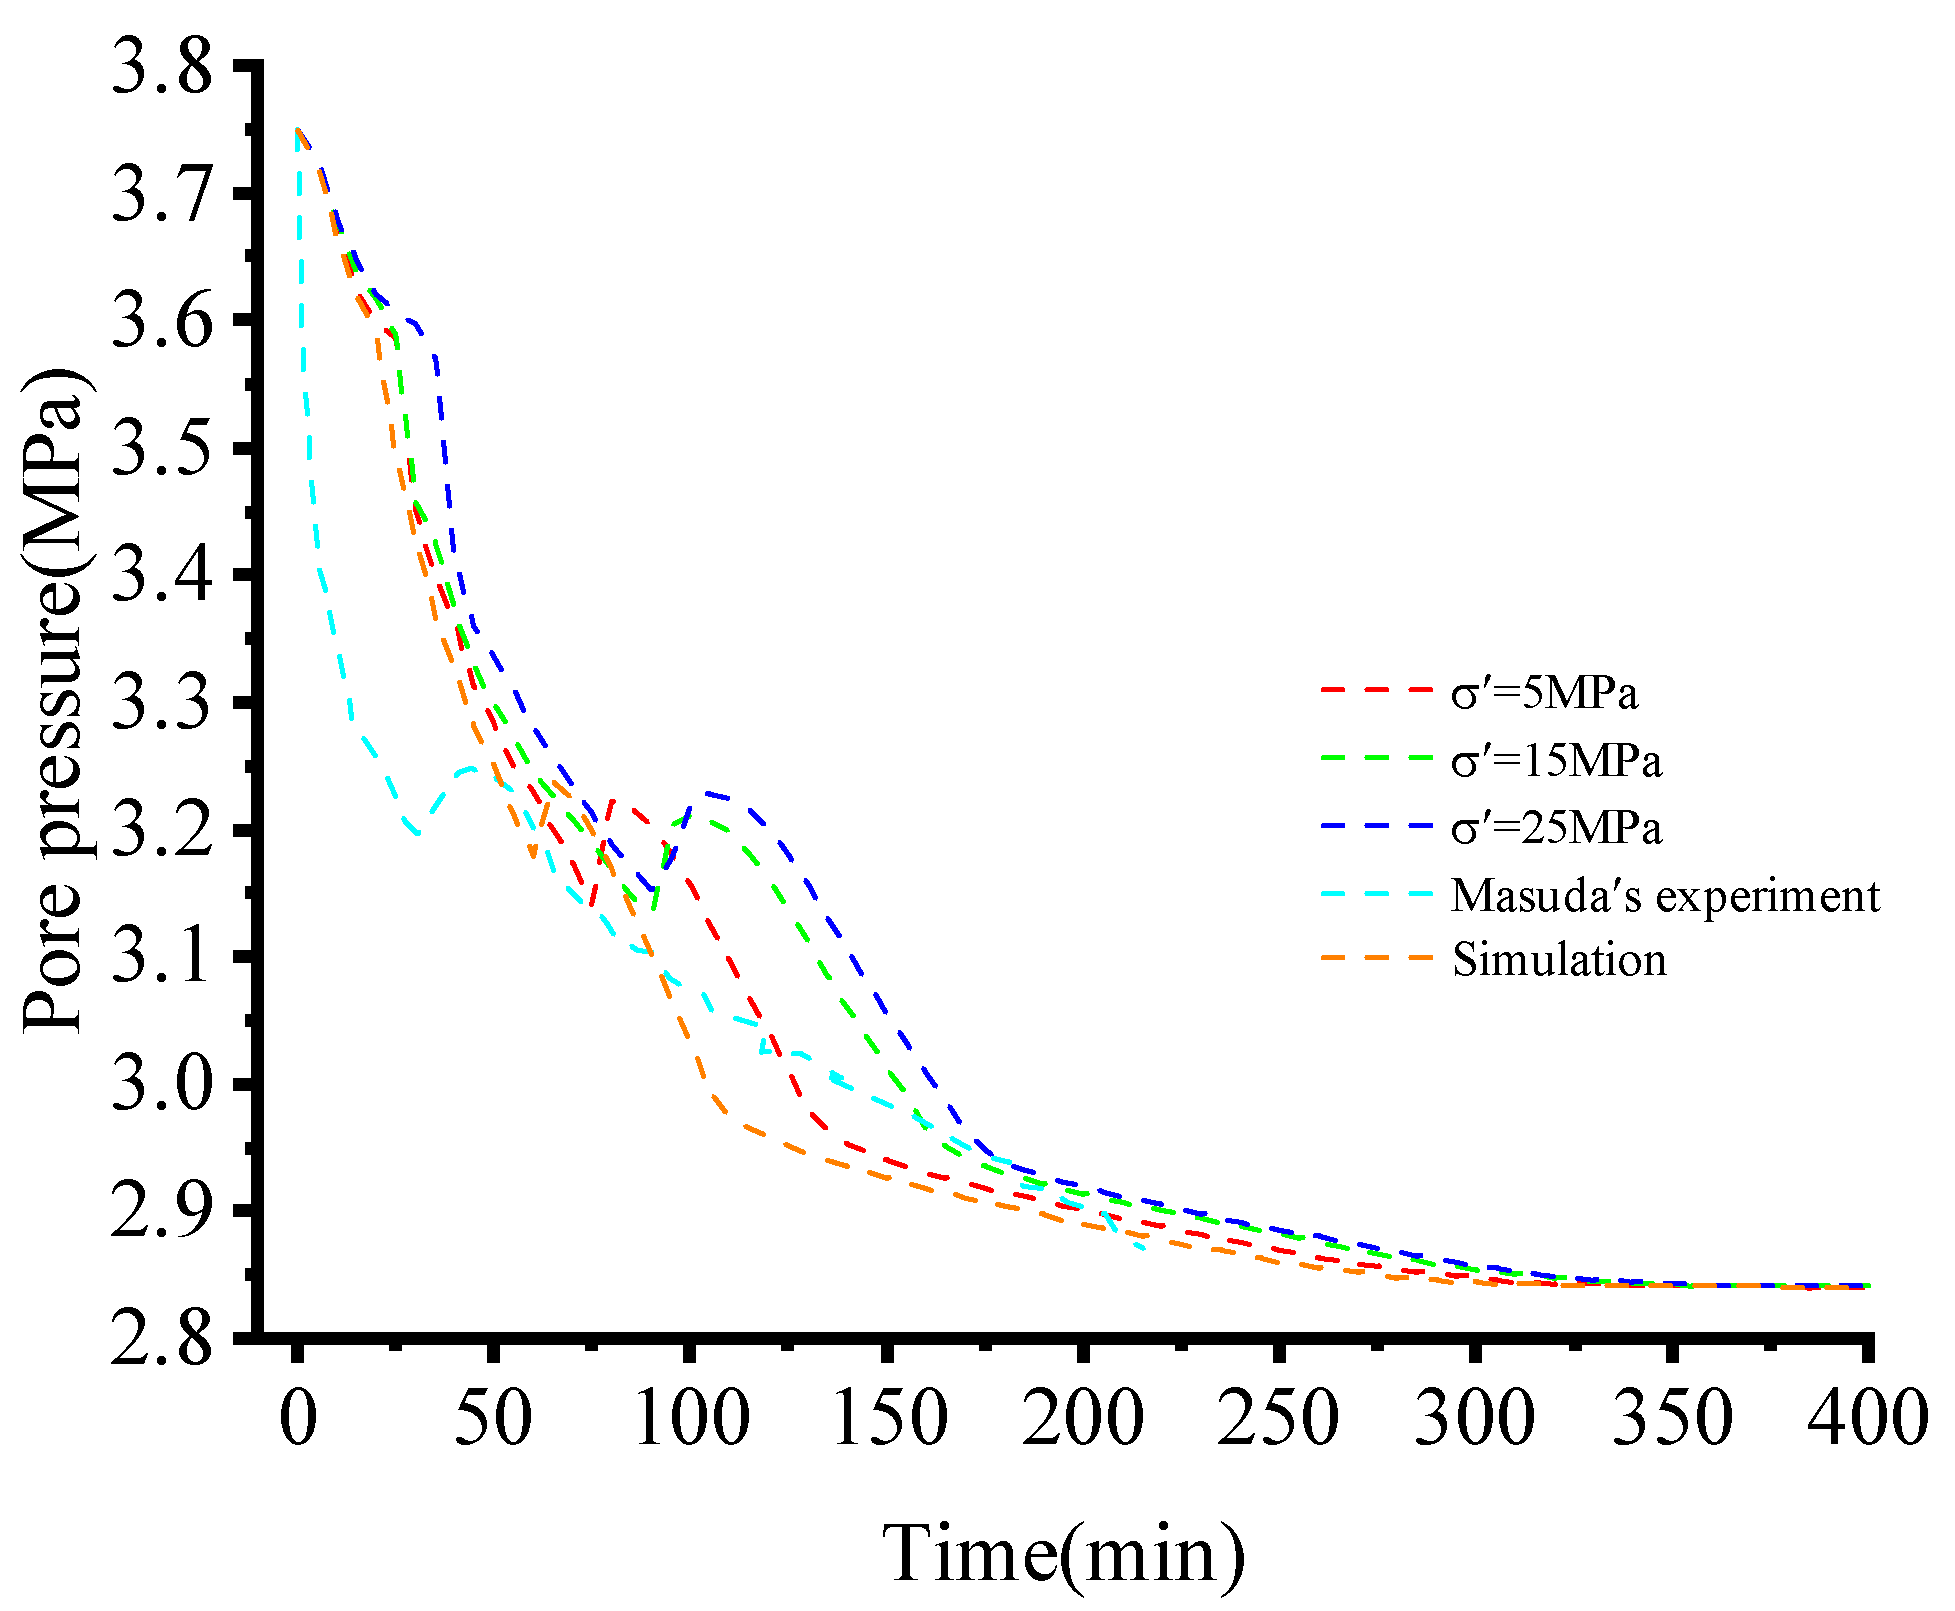
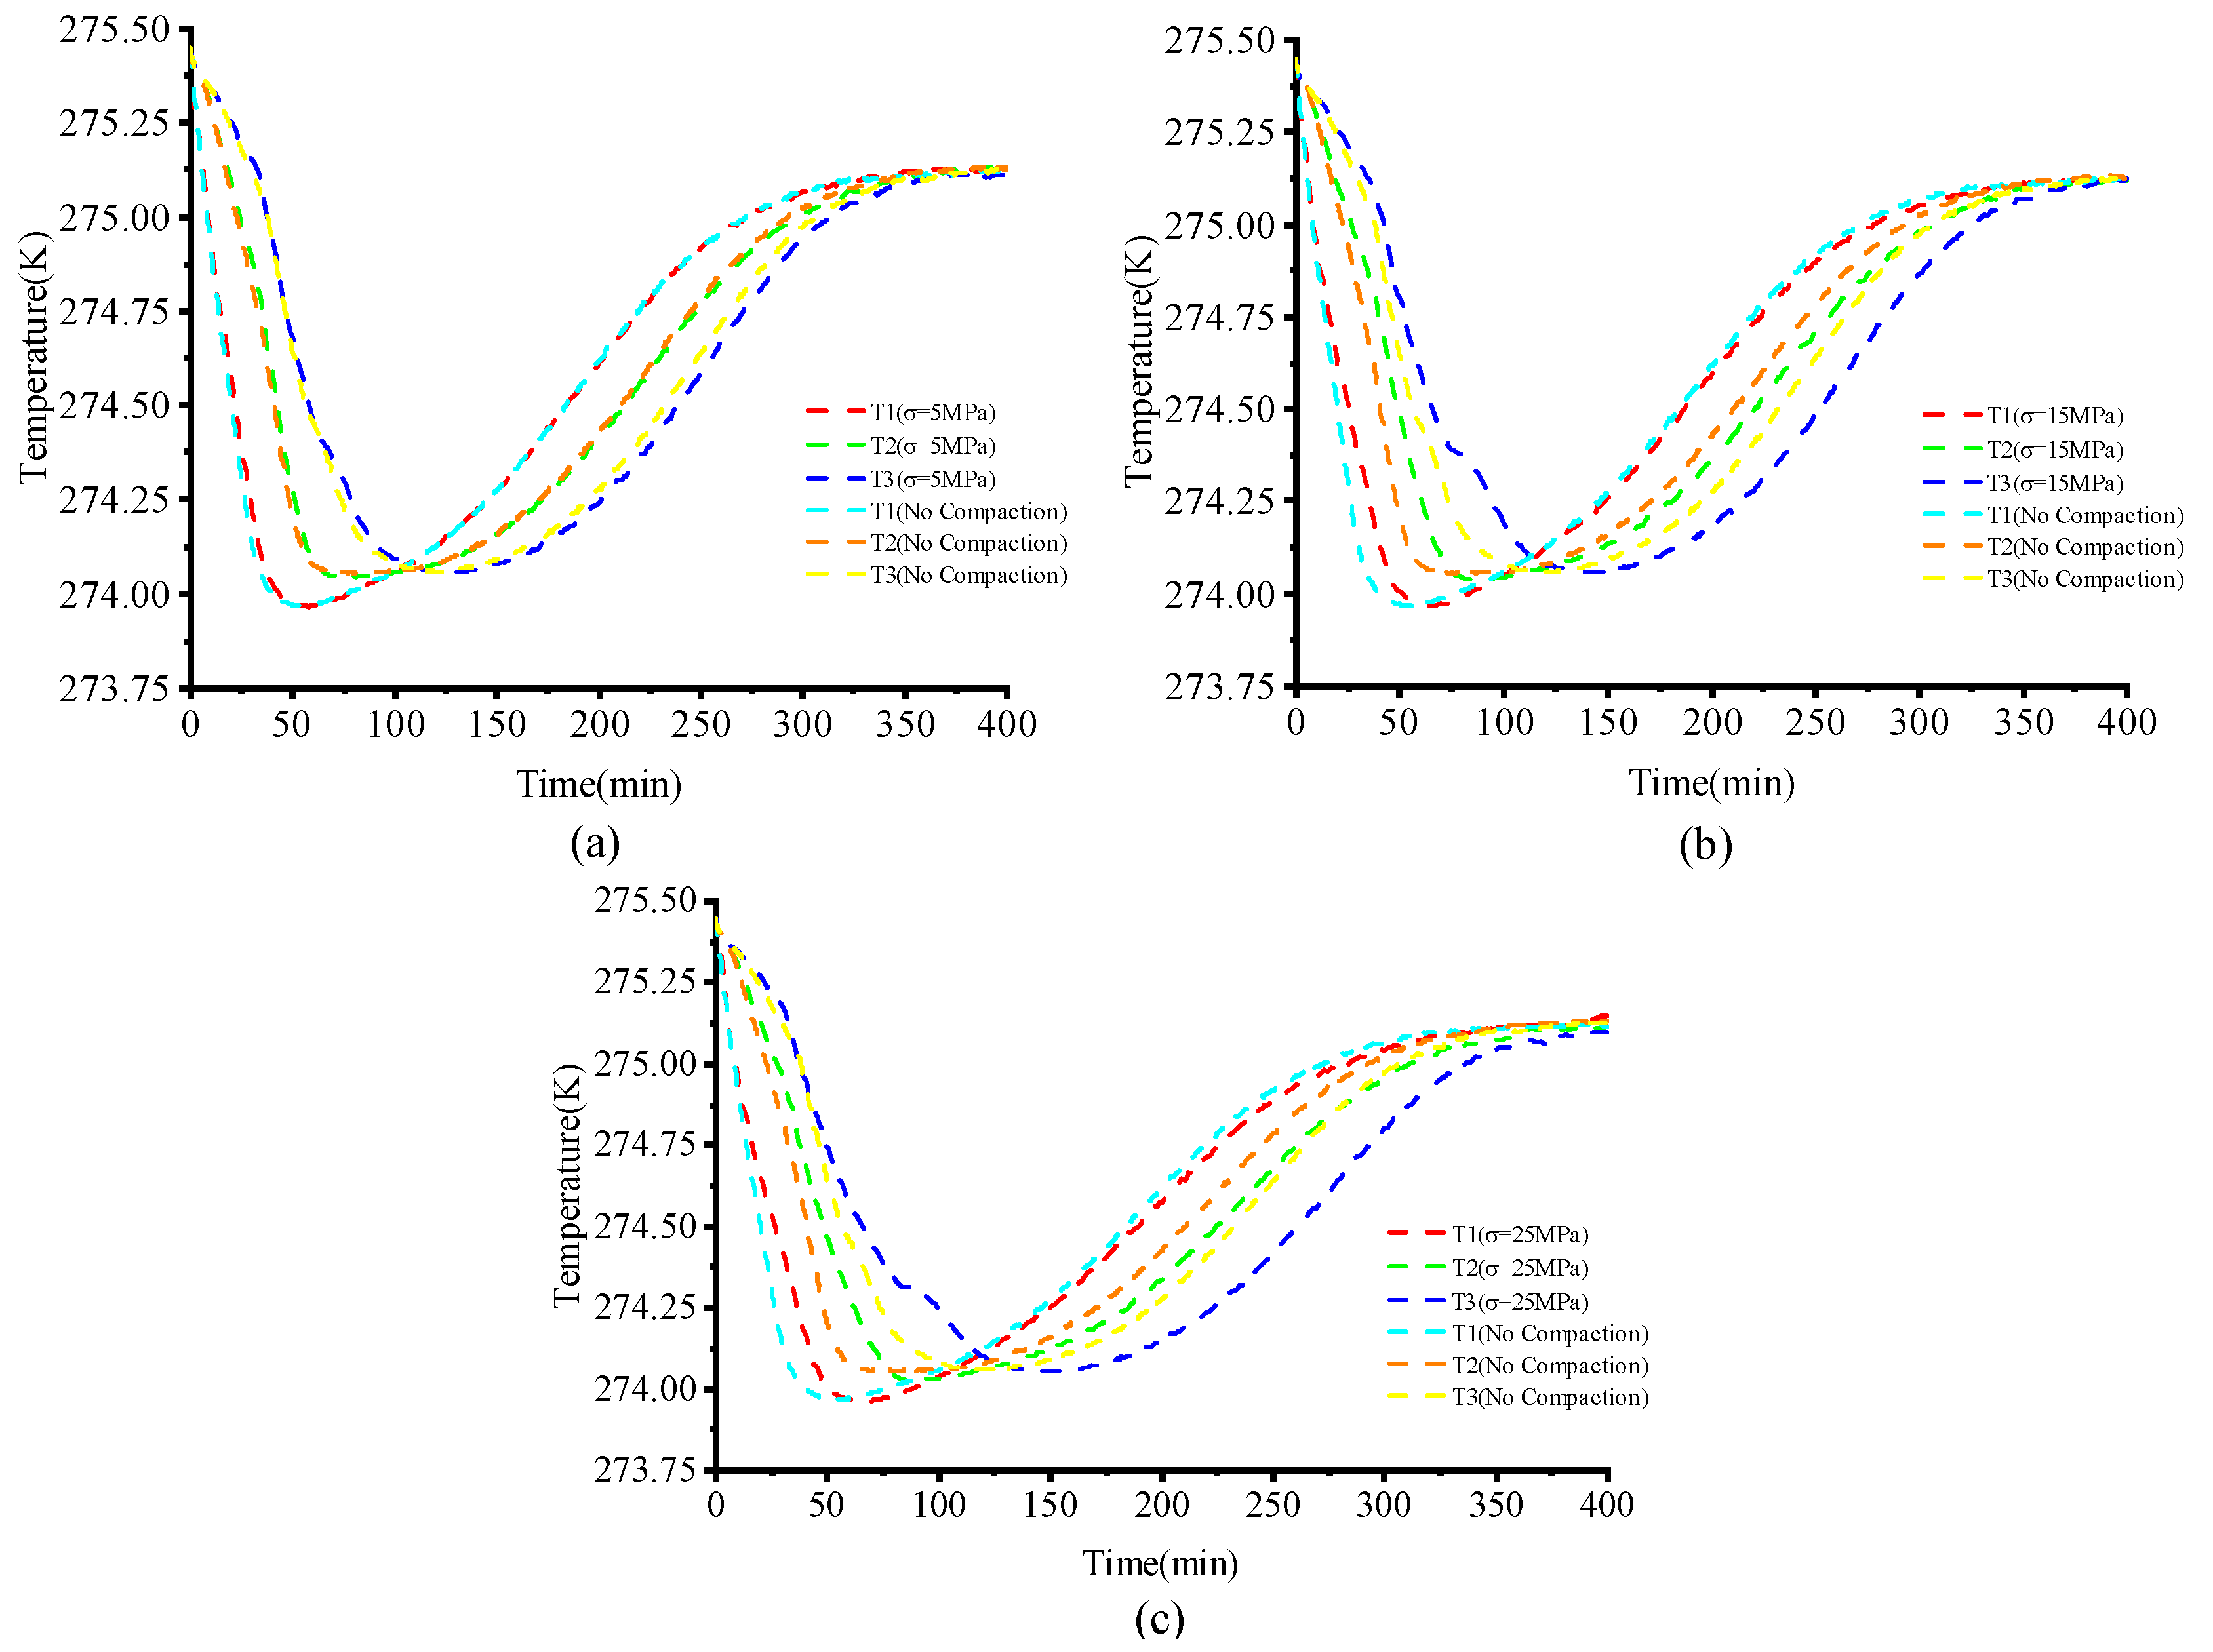
3.6. Effect of Geo-Stress
4. Conclusions
- The established mathematical model and the simulation scheme were validated by historical matching with the experimental benchmark data.
- The sensitivity analysis of the parameters revealed that a higher absolute permeability, higher initial gas saturation, lower outlet pressure, and higher initial temperature advanced the decomposition rate of hydrate. Thus, an optimized production plan is essential to promote the extraction efficiency of the NGH.
- Geo-stress caused a decrease of the porosity and permeability in the porous rock, which restricted the efficiency of the heat and mass transfer by the fluid flow, leading to a slow dissociation and transportation rate of the NGH. Thus, it is essential to take geo-stress into consideration and balance the extracting efficiency and the well pressure, especially when the NGH is developed by depressurization.
Author Contributions
Funding
Data Availability Statement
Conflicts of Interest
Appendix A

Appendix B

Appendix C


References
- Song, R.; Wang, Y.; Tang, Y.; Liu, J.; Yang, C. 3D Printing of natural sandstone at pore scale and comparative analysis on micro-structure and single/two-phase flow properties. Energy 2022, 261, 125226. [Google Scholar] [CrossRef]
- Song, R.; Liu, J.; Yang, C.; Sun, S. Study on the multiphase heat and mass transfer mechanism in the dissociation of methane hydrate in reconstructed real-shape porous sediments. Energy 2022, 254, 124421. [Google Scholar] [CrossRef]
- Song, R.; Sun, S.; Liu, J.; Yang, C. Pore scale modeling on dissociation and transportation of methane hydrate in porous sediments. Energy 2021, 237, 121630. [Google Scholar] [CrossRef]
- Song, R.; Sun, S.; Liu, J.; Feng, X. Numerical modeling on hydrate formation and evaluating the influencing factors of its heterogeneity in core-scale sandy sediment. J. Nat. Gas Sci. Eng. 2021, 90, 103945. [Google Scholar] [CrossRef]
- Yin, Z.; Linga, P. Methane hydrates: A future clean energy resource. Chin. J. Chem. Eng. 2019, 27, 2026–2036. [Google Scholar] [CrossRef]
- Song, R.; Wang, Y.; Ishutov, S.; Zambrano-Narvaez, G.; Hodder, K.J.; Chalaturnyk, R.J.; Sun, S.; Liu, J.; Gamage, R.P. A comprehensive experimental study on mechanical behavior, microstructure and transport properties of 3D-printed rock analogs. Rock Mech. Rock Eng. 2020, 53, 5745–5765. [Google Scholar] [CrossRef]
- Li, B.; Li, X.S.; Li, G.; Chen, Z.Y. Evaluation of gas production from Qilian Mountain permafrost hydrate deposits in two-spot horizontal well system. Cold Reg. Sci. Technol. 2015, 109, 87–98. [Google Scholar] [CrossRef]
- Li, G.; Moridis, G.J.; Zhang, K.; Li, X.S. Evaluation of the gas production potential of marine hydrate deposits in the Shenhu Area of the South China Sea. In Offshore Technology Conference; OnePetro: Houston, TX, USA, 2010. [Google Scholar]
- Feng, J.C.; Wang, Y.; Li, X.S.; Li, G.; Chen, Z.Y. Production behaviors and heat transfer characteristics of methane hydrate dissociation by depressurization in conjunction with warm water stimulation with dual horizontal wells. Energy 2015, 79, 315–324. [Google Scholar] [CrossRef]
- Chong, Z.R.; Pujar, G.A.; Yang, M.; Linga, P. Methane hydrate formation in excess water simulating marine locations and the impact of thermal stimulation on energy recovery. Appl. Energy 2016, 177, 409–421. [Google Scholar] [CrossRef]
- Chong, Z.R.; Yang, S.H.B.; Babu, P.; Linga, P.; Li, X.S. Review of natural gas hydrates as an energy resource: Prospects and challenges. Appl. Energy 2016, 162, 1633–1652. [Google Scholar] [CrossRef]
- Wang, Y.; Lang, X.; Fan, S.; Wang, S.; Yu, C.; Li, G. Review on enhanced technology of natural gas hydrate recovery by carbon dioxide replacement. Energy Fuels 2021, 35, 3659–3674. [Google Scholar] [CrossRef]
- Cai, J.; Xia, Y.; Lu, C.; Bian, H.; Zou, S. Creeping microstructure and fractal permeability model of natural gas hydrate reservoir. Mar. Pet. Geol. 2020, 115, 104282. [Google Scholar] [CrossRef]
- Wang, X.; Dong, B.; Li, W.; Yu, M.; Song, Y. Microscale effects on methane hydrate dissociation at low temperature in the micro porous media channels by depressurization. Int. J. Heat Mass Transf. 2018, 122, 1182–1197. [Google Scholar] [CrossRef]
- Makogon, Y.F. Natural gas hydrates–A promising source of energy. J. Nat. Gas Sci. Eng. 2010, 2, 49–59. [Google Scholar] [CrossRef]
- Zhao, J.; Liu, D.; Yang, M.; Song, Y. Analysis of heat transfer effects on gas production from methane hydrate by depressurization. Int. J. Heat Mass Transf. 2014, 77, 529–541. [Google Scholar] [CrossRef]
- Deng, X.; Feng, J.; Pan, S.; Wang, Z.; Zhang, J.; Chen, W. An improved model for the migration of fluids caused by hydrate dissociation in porous media. J. Pet. Sci. Eng. 2020, 188, 106876. [Google Scholar] [CrossRef]
- Zhang, P.; Liu, B.; Hu, L.; Meegoda, J.N. Coupled multiphase flow and pore compression computational model for extraction of offshore gas hydrates. Comput. Geotech. 2022, 145, 104671. [Google Scholar] [CrossRef]
- Liang, H.; Song, Y.; Chen, Y. Numerical simulation for laboratory-scale methane hydrate dissociation by depressurization. Energy Convers. Manag. 2010, 51, 1883–1890. [Google Scholar] [CrossRef]
- Ruan, X.; Song, Y.; Liang, H.; Yang, M.; Dou, B. Numerical simulation of the gas production behavior of hydrate dissociation by depressurization in hydrate-bearing porous medium. Energy Fuels 2012, 26, 1681–1694. [Google Scholar] [CrossRef]
- Nazridoust, K.; Ahmadi, G. Computational modeling of methane hydrate dissociation in a sandstone core. Chem. Eng. Sci. 2007, 62, 6155–6177. [Google Scholar] [CrossRef]
- Zhao, E.; Hou, J.; Liu, Y.; Ji, Y.; Liu, W.; Lu, N.; Bai, Y. Enhanced gas production by forming artificial impermeable barriers from unconfined hydrate deposits in Shenhu area of South China sea. Energy 2020, 213, 118826. [Google Scholar] [CrossRef]
- Chen, L.; Yamada, H.; Kanda, Y.; Lacaille, G.; Shoji, E.; Okajima, J.; Komiya, A.; Maruyama, S. Numerical analysis of core-scale methane hydrate dissociation dynamics and multiphase flow in porous media. Chem. Eng. Sci. 2016, 153, 221–235. [Google Scholar] [CrossRef]
- Wang, B.; Fan, Z.; Zhao, J.; Lv, X.; Pang, W.; Li, Q. Influence of intrinsic permeability of reservoir rocks on gas recovery from hydrate deposits via a combined depressurization and thermal stimulation approach. Appl. Energy 2018, 229, 858–871. [Google Scholar] [CrossRef]
- Zhao, J.; Fan, Z.; Dong, H.; Yang, Z.; Song, Y. Influence of reservoir permeability on methane hydrate dissociation by depressurization. Int. J. Heat Mass Transf. 2016, 103, 265–276. [Google Scholar] [CrossRef]
- Hardwick, J.S.; Mathias, S.A. Masuda’s sandstone core hydrate dissociation experiment revisited. Chem. Eng. Sci. 2018, 175, 98–109. [Google Scholar] [CrossRef] [Green Version]
- Deng, X.; Pan, S.; Zhang, J.; Wang, Z.; Jiang, Z. Numerical investigation on abnormally elevated pressure in laboratory-scale porous media caused by depressurized hydrate dissociation. Fuel 2020, 271, 117679. [Google Scholar] [CrossRef]
- Li, Q.P.; Lv, X.; Pang, W.X.; Yao, H.Y.; Ge, Y.; Wang, J.A. Numerical Simulation of the Effect of Porous Media Permeability on the Decomposition Characteristics of Natural Gas Hydrate at the Core Scale. Energy Fuels 2021, 35, 5843–5852. [Google Scholar] [CrossRef]
- Dai, S.; Santamarina, J.C.; Waite, W.F.; Kneafsey, T.J. Hydrate morphology: Physical properties of sands with patchy hydrate saturation. J. Geophys. Res. Solid Earth 2012, 117, B11205. [Google Scholar] [CrossRef] [Green Version]
- White, M.D.; Kneafsey, T.J.; Seol, Y.; Waite, W.F.; Uchida, S.; Lin, J.S.; Myshakin, E.M.; Gai, X.; Gupta, S.; Reagan, M.T.; et al. An international code comparison study on coupled thermal, hydrologic and geomechanical processes of natural gas hydrate-bearing sediments. Mar. Pet. Geol. 2020, 120, 104566. [Google Scholar] [CrossRef]
- Cheng, Y.; Li, L.; Yuan, Z.; Wu, L.; Mahmood, S. Finite element simulation for fluid–solid coupling effect on depressurization-induced gas production from gas hydrate reservoirs. J. Nat. Gas Sci. Eng. 2013, 10, 1–7. [Google Scholar] [CrossRef]
- Lee, T.; Son, H.; Lee, J.; Ahn, T.; Kang, N. Geomechanically Sustainable Gas Hydrate Production Using a 3D Geological Model in the Ulleung Basin of the Korean East Sea. Energies 2022, 15, 2569. [Google Scholar] [CrossRef]
- Liu, Z.; Lu, Y.; Cheng, J.; Han, Q.; Hu, Z.; Wang, L. Geomechanics involved in gas hydrate recovery. Chin. J. Chem. Eng. 2019, 27, 2099–2106. [Google Scholar] [CrossRef]
- Wu, Z.; Yang, S.; Liu, W.; Li, Y. Permeability analysis of gas hydrate-bearing sand/clay mixed sediments using effective stress laws. J. Nat. Gas Sci. Eng. 2022, 97, 104376. [Google Scholar] [CrossRef]
- Sun, X.; Li, Y.; Liu, Y.; Song, Y. The effects of compressibility of natural gas hydrate-bearing sediments on gas production using depressurization. Energy 2019, 185, 837–846. [Google Scholar] [CrossRef]
- Jang, J.; Dai, S.; Yoneda, J.; Waite, W.F.; Stern, L.A.; Boze, L.G.; Collett, T.S.; Kumar, P. Pressure core analysis of geomechanical and fluid flow properties of seals associated with gas hydrate-bearing reservoirs in the Krishna-Godavari Basin, offshore India. Mar. Pet. Geol. 2019, 108, 537–550. [Google Scholar] [CrossRef]
- Kimoto, S.; Oka, F.; Fushita, T.; Fujiwaki, M. A chemo-thermo-mechanically coupled numerical simulation of the subsurface ground deformations due to methane hydrate dissociation. Comput. Geotech. 2007, 34, 216–228. [Google Scholar] [CrossRef]
- Sun, X.; Luo, H.; Soga, K. A coupled thermal–hydraulic–mechanical–chemical (THMC) model for methane hydrate bearing sediments using COMSOL Multiphysics. J. Zhejiang Univ.-Sci. A 2018, 19, 600–623. [Google Scholar] [CrossRef]
- Sun, X.; Luo, T.; Wang, L.; Wang, H.; Song, Y.; Li, Y. Numerical simulation of gas recovery from a low-permeability hydrate reservoir by depressurization. Appl. Energy 2019, 250, 7–18. [Google Scholar] [CrossRef]
- Cheng, W.; Lu, C.; Ning, F.; Jia, M. A coupled thermal-hydraulic-mechanical model for the kinetic dissociation of methane hydrate in a depressurizing well. J. Pet. Sci. Eng. 2021, 207, 109021. [Google Scholar] [CrossRef]
- Wan, Y.; Wu, N.; Chen, Q.; Li, W.; Hu, G.; Huang, L.; Ouyang, W. Coupled thermal-hydrodynamic-mechanical–chemical numerical simulation for gas production from hydrate-bearing sediments based on hybrid finite volume and finite element method. Comput. Geotech. 2022, 145, 104692. [Google Scholar] [CrossRef]
- Yasuda, S.; Masuda, T.; Yoshida, N.; Nagase, H.; Kiku, H.; Itafuji, S.; Mine, K.; Sato, K. Torsional chear and triaxial compression tests on deformation characters of sands before and after liquefaction. In Proceedings of the Fifth US-Japan Workshop on Earthquake Resistant Design of Lifeline Facilities and Countermeasures against Soil Liquefaction, Snowbird, UT, USA, 29 September 1994; pp. 249–265. [Google Scholar]
- Masuda, Y. Modeling and experimental studies on dissociation of methane gas hydrates in Berea sandstone cores. In Proceedings of the Third International Gas Hydrate Conference, Salt Lake City, UT, USA, 18–22 July 1999. [Google Scholar]
- Song, R.; Feng, X.; Wang, Y.; Sun, S.; Liu, J. Dissociation and transport modeling of methane hydrate in core-scale sandy sediments: A comparative study. Energy 2021, 221, 119890. [Google Scholar] [CrossRef]
- Biot, M.A. General theory of three-dimensional consolidation. J. Appl. Phys. 1941, 12, 155–164. [Google Scholar] [CrossRef]
- Detournay, E.; Cheng, A.H.D. Fundamentals of poroelasticity. In Analysis and Design Methods; Pergamon: Oxford, UK, 1993; pp. 113–171. [Google Scholar]
- Fatt, I.; Davis, D.H. Reduction in permeability with overburden pressure. J. Pet. Technol. 1952, 4, 16-16. [Google Scholar] [CrossRef]
- Fatt, I. The effect of overburden pressure on relative permeability. J. Pet. Technol. 1953, 5, 15–16. [Google Scholar] [CrossRef]
- Van der Knaap, W. Nonlinear behavior of elastic porous media. Trans. AIME 1959, 216, 179–187. [Google Scholar] [CrossRef]
- Hubbert, M.K.; Rubey, W.W. Role of fluid pressure in mechanics of overthrust faultingi. mechanics of fluid-filled porous solids and its application to overthrust faulting. GSA Bull. 1959, 70, 115–166. [Google Scholar] [CrossRef]
- Zimmerman, R.W.; Somerton, W.H.; King, M.S. Compressibility of porous rocks. J. Geophys. Res. Solid Earth 1986, 91, 12765–12777. [Google Scholar] [CrossRef]
- Schutjens, P.M.T.M.; Hanssen, T.H.; Hettema, M.H.H.; Merour, J.; De Bree, P.; Coremans, J.W.A.; Helliesen, G. Compaction-induced porosity/permeability reduction in sandstone reservoirs: Data and model for elasticity-dominated deformation. SPE Reserv. Eval. Eng. 2004, 7, 202–216. [Google Scholar] [CrossRef]
- Gray, D.H.; Fatt, I. The effect of stress on permeability of sandstone cores. Soc. Pet. Eng. J. 1963, 3, 95–100. [Google Scholar] [CrossRef]
- Haghi, A.H.; Chalaturnyk, R.; Ghobadi, H. The state of stress in SW Iran and implications for hydraulic fracturing of a naturally fractured carbonate reservoir. Int. J. Rock Mech. Min. Sci. 2018, 105, 28–43. [Google Scholar] [CrossRef]
- McLatchie, A.S.; Hemstock, R.A.; Young, J.W. The effective compressibility of reservoir rock and its effects on permeability. J. Pet. Technol. 1958, 10, 49–51. [Google Scholar] [CrossRef]
- Zhu, W.; Wong, T.F. The transition from brittle faulting to cataclastic flow: Permeability evolution. J. Geophys. Res. Solid Earth 1997, 102, 3027–3041. [Google Scholar] [CrossRef]


| Properties | Value | Properties | Value |
|---|---|---|---|
| Average saturation of initial hydrate | 0.501 | Initial permeability of sandstone core | 97.98 mD |
| Average saturation of initial water | 0.199 | Sandstone core porosity | 0.182 |
| Average saturation of initial methane gas | 0.3 | Joule-Thomson throttling coefficient | −1.5 × 10⁻⁴ |
| initial temperature | 275.45 K | Critical pressure of methane | 4.599 MPa |
| initial pressure | 3.75 MPa | Critical temperature of methane | 190.56 K |
| outlet pressure | 2.84 MPa | ambient temperature | 274.15 K |
| Density (kg/m3) | Fluid Viscosity (cP) | Thermal Conductivity (w·m−1·k−1) | Thermal Capacity (J·kg−1·k−1) | |
|---|---|---|---|---|
| water | 1001.5 | 1 | 0.6 | 4180 |
| hydrate | 913 | - | 0.393 | 2010 |
| methane | PR equation | 0.01 | 0.00332 | 2190 |
| Berea sandstone | 2030 | - | 5 | 800 |
| Sun et al. (2005) | Nazridoust and Ahmadi. (2007) | Ruan et al. (2012) | Chen et al. (2016) | This Study | ||
|---|---|---|---|---|---|---|
| Modle | 1-D | 2-D | 2-D | 2-D | 2-D | |
| Flow model | Darcy’s law | Darcy’s law | Darcy’s law | Darcy’s law | Darcy’s law | |
| Relative permeability | Corey’s model (1954) | Corey’s model (1954) | Corey’s model (1954) | Corey’s model (1954) | Adapted Corey’s model (1954) | |
| Permeability model | where Krw and krg are the relative permeability of water and gas, Swr is the irreducible saturation of water. | |||||
| where φO is absolute porosity, εv is volumetric strain, kDO absolute permeability of the sandstone without contains hydrate, mD Sh is saturation of hydrate. | ||||||
| Kim et al. (1987) | Kim et al. (1987) | Kim et al. (1987) | Kim et al. (1987) | Kim et al. (1987) | ||
| Dissociation rate (kd, Ad) | where Peh is the equilibrium pressure, Pg is the methane pressure, Ad is reacting surface of hydrate, is the intrinsic constant, R is the universal gas constant, ΔE is an activation energy. | |||||
| Dissociation constant kd (kmol/Pa.s.m2) | ||||||
| Surface area of hydrate per unit volume Ad | where φe is the effective porosity of porous media. | |||||
| The heat transfer Enthalpy, internal energy (J/Kg) | Sun et al. (2005) | where Mw and Mh are molecular weights of water and hydrate. where q is boundary heat flux, To is air temperature, λb is the boundary heat transfer coefficient determined by the heat transfer coefficient of the rubber sleeve and the ambient convection intensity. | ||||
| Sun et al. (2005) | Nazridoust and Ahmadi. (2007) | Ruan et al. (2012) | Chen et al. (2016) | This Study | ||
| Continuity equation of different fluid phases are: Momentum equation | Nazridoust and Ahmadi. (2007) | where ρ is the density, mk is the mass rate of dissociation formation substance, φ0 is the porosity, S is the saturation, μk is the fluid velocity. The subscripts h, g, w corresponds to hydrate, gas and water in multiphase systems, respectively. where uk is the relative permeability of phase k, KD is the absolute permeability of hydrated sandstone, Krk is the relative permeability of phase k, and P is fluid pressure where C is the heat capacity, T is the temperature, is the internal energy, Subscript R represents rock, h is the enthalpy. λe is the effective thermal conductivity, is the source term of endothermic reaction based on hydrate dissociation. where is the mass dissociation rate for methane hydrate, ΔHd is the latent heat of hydrate during the dissociation of methane hydrate, σg is the Joule-Thomson throttling coefficient, σg = −1.5 × 10 −4 where λR,λh,λw,λg are thermal conductivity of rock, hydrate, water, gas, respectively. | ||||
| Energy equation | C = 56.599J/mol, d = −16.744J/mol K | Nazridoust and Ahmadi. (2007) | ||||
| Rock | |||
|---|---|---|---|
| Berea sandstone | 0.183 | 0.01859 | 9.842 |
Publisher’s Note: MDPI stays neutral with regard to jurisdictional claims in published maps and institutional affiliations. |
© 2022 by the authors. Licensee MDPI, Basel, Switzerland. This article is an open access article distributed under the terms and conditions of the Creative Commons Attribution (CC BY) license (https://creativecommons.org/licenses/by/4.0/).
Share and Cite
Song, R.; Duan, Y.; Liu, J.; Song, Y. Numerical Modeling on Dissociation and Transportation of Natural Gas Hydrate Considering the Effects of the Geo-Stress. Energies 2022, 15, 9311. https://doi.org/10.3390/en15249311
Song R, Duan Y, Liu J, Song Y. Numerical Modeling on Dissociation and Transportation of Natural Gas Hydrate Considering the Effects of the Geo-Stress. Energies. 2022; 15(24):9311. https://doi.org/10.3390/en15249311
Chicago/Turabian StyleSong, Rui, Yaojiang Duan, Jianjun Liu, and Yujia Song. 2022. "Numerical Modeling on Dissociation and Transportation of Natural Gas Hydrate Considering the Effects of the Geo-Stress" Energies 15, no. 24: 9311. https://doi.org/10.3390/en15249311