Review

Taxonomy for Industrial Cluster Decarbonization: An Analysis for the Italian Hard-to-Abate Industry

1
DENERG Department of Energy “Galileo Ferraris”, Politecnico di Torino, Corso Duca Degli Abruzzi 24, 10129 Torino, Italy
2
School of Management, Polytechnic of Milan, 20156 Milan, Italy
3
European Institute on Economics and the Environment, Via Bergognone 34, 20144 Milan, Italy
4
Chemical Engineering Department, Imperial College London, London SW7 2AZ, UK
*
Author to whom correspondence should be addressed.
Energies 2022, 15(22), 8586; https://doi.org/10.3390/en15228586
Submission received: 1 October 2022 / Revised: 2 November 2022 / Accepted: 11 November 2022 / Published: 16 November 2022
(This article belongs to the Collection Energy Transition towards Carbon Neutrality)

Abstract

:
The share of industry in final global energy consumption was more than 30% in 2020, of which, the hard-to-abate sectors accounted for almost 60% of total final consumption in industry. Similarly, in Europe, industry accounts for around 25% of final energy consumption. In order to reduce the impact of industry in energy consumption and greenhouse gas emissions, Europe has set many policies that support and regulate the sector, including pricing carbon emissions in a cap-and-trade scheme called the European Emission Trading Scheme (EU ETS). According to the EU ETS, in 2021 the verified emissions of all stationary installations were around 1.3 billion tons of carbon dioxide equivalent emissions. In 2021, the total allocated allowances amounted to around 1 billion tons of carbon dioxide equivalent emissions, half of which were freely allocated. After reviewing the existing modeling approaches for industrial clusters and the available datasets, and assessing the energy consumption and carbon dioxide emissions at plant level using a geographical information system approach (GIS), a taxonomy for industrial cluster decarbonization was introduced. This taxonomy shows that describing industry as sets of clustered installations rather than based on the conventional sectoral economic classification provides more insights into energy transition. First, the cluster description provides a more accurate techno-economic assessment based on a finer characterization of economies of scale compared to traditional energy systems models. Second, the industrial clustering approach may more realistically show the feasibility, in addition to the costs and benefits from coupling industry with transport (e.g., industrial fleets and logistics) or buildings (e.g., city scale), due to a more detailed representation of the energy sources and sinks.

1. Introduction

The term “industrial clusters” usually identifies a group of industries from the same sectors or different sectors located in the same area. Since the early 1990s in the framework of Industrial Ecology, specific industrial clusters have been studied through the industrial symbiosis approach, in which single industrial plants cooperate with each other to exchange energy and material flows, including waste and by-products, optimizing their economic performance, and reducing their environmental impact [1]. More recently, industrial clusters have gained interest in the decarbonization strategies of different countries and in the literature because they have several advantages in accelerating the transition. What makes clusters unique is the plant proximity, due to which plants can co-locate infrastructures, share knowledge more easily, enable technological innovation to reduce the costs of decarbonization, and attract investment and finance while reducing risks.
In a first analysis, in order to review the literature about industrial clusters in the energy field, the authors of this work searched Scopus using the Title-Abstract-Keywords fields, using the keywords industrial cluster anddecarbon*, which yielded 21 results: 12 results in the Energy subject area, nine in Environmental Science, five in Engineering, five in Chemical Engineering, four in Social Science, three in Computer Science, three in Economics, one in Business, Management and Finance, and one in Earth and Planetary Sciences, with some overlapping between fields. The twelve results in the energy fields are dated from 2018 to 2022. In the search set as described above, two works are not relevant for the purposes of the review because they are works related to geological impact of UK industrial clusters. Furthermore, in the energy field results, three papers are more devoted to social and political science, proposing new methodologies such as a place-based approach, and analyzing the concept of “SuperPlaces” for UK industrial clusters [2]; proposing a framework for ex ante design of only transition processes and post hoc assessment [3]; or addressing the topic of the social license to operate for CCS [4]. Three results focus their attention on one specific cluster or even on a specific technology related to the decarbonization of the area, such as hydrogen production, CCUS, or both, rather than presenting an approach to classify and analyze the industrial clusters of a specific area or region. In particular, in 2018, Samadi et al. analyzed decarbonization pathways for the industrial cluster of the Port of Rotterdam [5]; in 2018, Samadi et al. presented research about sequential combustion in steam methane reformers for hydrogen and power production with CCUS for clusters [6]. Recently, a review of the status of hydrogen technologies in the UK, which focused on industrial clusters, found that multidisciplinary research is needed to extend the hydrogen applications, and also reported recent advancements, challenges, and technological and socio-political challenge in UK settings [7]. One paper revised the mechanism of induced innovation, carbon leakage, and government intervention in the economy and their impact on possible approaches in the decarbonization of the industrial cluster. Finally, only one work presented a characterization of industrial clusters: Calvillo et al. in [8] presented a classification of the clusters with a special focus on their ability to implement CCS; as the authors reported, UK government documents and official reports sometimes do not provide very detailed information or complete data about some clusters, or do not include some clusters that have CCUS potential [8]. Excluding the last work mentioned, to the best of the authors’ knowledge, there is no relevant scientific literature about the clustering of industrial sites in any countries. Because they use different key words, most of the studies that do not appear in the review with the search set as described above are more linked to specific aspects of specific industrial symbiosis or eco-industrial parks rather than being devoted to characterization of clusters in terms of energy consumption and emissions. In particular, enlarging the research to other related key-words, such as industrial symbiosis and modeling, there are several works available in the literature that also focus on modeling topics such as modeling at the industrial cluster level; for example, Demartini et al. in [9] presented a literature review about the most diffused modeling approaches for the analysis of industrial symbiosis and selected the most appropriate method for analyzing and designing industrial symbiosis, which is the agent-based system dynamics hybrid approach. In [10], the authors proposed a mixed-integer optimization model for a waste material and exchanging network in the industrial symbiosis context, introducing three sub-objectives that represent the dimensions of sustainability: economy, environment, and society. The agent-based approach is also applied for modeling eco-industrial parks, with the aim to validate some industrial symbiosis indicators in [11]. The work presented in [12] provides some guidelines and policy implications for the application of industrial symbiosis in industrial clusters; it presents the application of the input-output approach to an industrial area located in Italy. Other works, such as Ref. [13], focus on the development of a framework that includes a mix of linear programming models for the optimal configuration of the industrial symbiosis area based on bio-energy. Another paper [14] proposes the application of optimization based on linear programming methods, and is able to offer different alternatives for industrial symbiosis in the case of conflicts, even in the case of a lack of a central authority. Finally, another work [15] is devoted to the analysis of the policies, focusing on industrial symbiosis in the European Union, United Nations, and the Organization for Economic Cooperation and Development.
In general, it is evident that, in the literature, there are several contributions to industrial clusters focused on the UK and the Netherlands. In particular, regarding industrial cluster decarbonization, the UK government has identified a pillar for their long-term decarbonization strategy, as shown in the Climate Change Act, and in the initiatives of the new Industrial Strategy Challenge Fund and the Industrial Decarbonisation Research and Innovation Centre (IDRIC [16]). The strategy is justified by the specific nature of the industrial consumption profile of the country, with only six clusters (the six UK clusters are located in different provinces: Grangemouth (Scotland), South Wales (Wales), the Humber, Merseyside, Southampton, and Teesside (England)), accounting for about one-half of the carbon dioxide emissions of the industry sector (direct emissions). A pathway model of the UK industrial sector [17] has been used developed by Element Energy and the Climate Change Committee (CCC); the model uses a least-cost approach to analyze the decarbonization pathways of the UK industrial sites. The clusters are industrial sites that are located at the most important ports across UK and within 25 km of potential CO2 sites, which are mainly petro-chemical and refinery plants and iron and steel plants. The six clusters are the most emissive, and were mapped by the Industrial Cluster Mission [18], as presented in Figure 1; the clusters totaled 40 Mt CO2, where the emissions of each cluster ranged from 1.4 to 12.5 Mt CO2. The UK government aims to cut 95% of the cluster emissions by 2050, becoming the world’s first net-zero carbon industrial cluster by 2040, and transforming four low-carbon clusters by 2030. In January 2021, six projects corresponding to each of the six clusters were awarded GBP 8 million [18]. The rest of the industrial emissions of the UK depend on highly energy-intensive and highly dispersed sites such as ammonia, ethylene, lime, glass, other minerals, paper, other chemicals and non-ferrous metal, dispersed cement plants, and iron and steel plants, and less energy-intensive dispersed sites (food and drink and other industry) [19].
Beyond these country-specific contributions, the acknowledgment of the role of industrial clusters for achieving net zero in international organizations is clear. In 2021, the World Economic Forum published the report “Industrial clusters: working together to achieve net zero” with the contribution of industrial and energy partners [20]. The document identifies four possible cluster characteristics that can have an impact on the type and feasibility of the different decarbonization strategies. The four characteristics are: (1) composition (type and number of industries); (2) geography; (3) existing infrastructure; and (4) energy cost and policy. In fact, the composition and the geography of the cluster influence the possible exchange of energy, waste, and by-products; the geography and the existing infrastructure, which are linked together, can have an impact on pursuing a specific decarbonization strategy, such as the development of CCS and hydrogen infrastructure, and the deployment of abundant renewable energy resources. The work proposed a classification of the clusters based on a main theme: electrification, hydrogen, and CCS, in order to identify the most important enablers for decarbonizing. For example, the electrification cluster enablers are the on-site and shared renewable, storage, and microgrids; virtual renewable Purchase Power Agreement (PPA); demand optimization; and retrofitting and hybrid technologies. The World Economic Forum (WEO) mentioned different pilot projects for low-carbon industrial clusters. One of the most important is a pilot project in China implemented in 2013, which included fifty-two industrial clusters. One of these clusters is the Suzhou Industrial Park established in 1994 and covering an area of 278 m2. Between 2014 and 2016, the administration committee of the park signed a contract with the energy-intensive plants of the cluster to reduce the coal consumption, and the environmental protection agency of the park developed a platform to manage energy and carbon emission. In 2017, they also introduced green credits for decarbonization project loans. The report also introduces the Humber industrial cluster in UK, as mentioned above [12].
Finally, this work reviews the main energy models with the aim of verifying if a cluster representation is included in the structure of an industry sector. In Appendix A, Table A1 shows the most relevant insights of the industry sector representation in the main energy models, such as the World Energy Outlook of the IEA [21]. The model applications have different geographical coverage and area disaggregation, and different industrial sub-sector disaggregation. The focus tends to be on a single and specific topic; for example, the direct air capture implications for the US power sector, modeled in the Integrated Model to Assess the Global Environment (IMAGE), or the taxation recycling impact on the US industry in the National Energy Modeling System (NEMS). At present, all of the reviewed energy models work at the sectoral level and do not follow an approach based on the industrial cluster representation. None of these models include the representation of the industrial clusters in the industry module. Hence, there is currently a link missing in the representation of clusters in energy systems modeling. This work can represent a step forward in linking the representation of clusters in energy modeling.

Contribution of the Study

After reviewing the work available in the literature about industrial clusters, industrial symbiosis, and the industrial sector in energy models, this work presents the first generic methodology to characterize industrial clusters in terms of energy and emissions consumption, starting from mostly public databases and data available in the literature, when specific reports or works are not present in the literature. The characterization and the geolocation of the clusters allows the definition of a taxonomy for the most energy-intensive industrial clusters in a country. Hence, the work provides a framework to increase the granularity of the representation of industry in energy system models where typically it is represented as a lump sector or as a group of sub-sectors. The methodology proposed here allows the inclusion of the possibility of exchanging energy and material between plants on the basis of their structural complementarities and/or geographical proximity. The work also presents a taxonomy for industrial cluster decarbonization based on the proximity, carbon dioxide emissions, and thermal and electricity consumption of the industrial areas. The taxonomy for the industrial cluster has the tremendous advantage of allowing replicability of analyses and of the impact of decarbonization strategy from one industrial cluster to a similar one, even if in a different area. Moreover, the cluster dimension introduces one more dimension in the energy systems models, allowing a representation of the industrial sector that combines a rich-technology bottom-up approach with a GIS-based approach, and considering the share of facilities and flows and more specific geographical features of the industrial sector. Moreover, national policies for the decarbonization of industrial clusters can be identified according to one or more of the attributes, such as proximity and emissions, for integration of territorial-specific policies.
The analysis was applied to the Italian industry (according to ENEA and the IEA, in 2019, the energy consumption of the industry sector in Italy accounted for 1048 PJ, which represented around 20% of the total final energy use [14,15], and the carbon dioxide emissions from manufacturing and the process industry accounted for 20% of the total national emissions [16]). However, this analysis is easily generalized to any country, provided that a minimum amount of information, as discussed in the study, is made available.
Refs. [22,23,24] The authors chose to apply the methodology to the Italian case for several reasons. First, as explained in the review, no works about the taxonomy and classification of industrial clusters in Italy are present in the literature. By searching Scopus based on “Title-Abstract-Keywords” with the key words Industrial Cluster andItal* there were no results. By comparison, using a more general search with the key words Ital*, “Decarb” and“Indust*” yielded 28 results, of which 31 were in the energy field. As for the UK case, most of these are about specific technology; social and environmental impacts of decarbonizing options for specific sectors; or plants or industrial areas for the industrial sector. Only Pivetta et al. presented a solution for a hybrid industrial area, which included a port, transport service, and industrial plants [25], although for a specific industrial area. Another reason concerns the fact that, to the best of the authors’ knowledge of public documents and reports of national industrial associations, there is no information about the energy consumption or emissions at the level of industrial areas; rather, there are only data about single plants or sectors when annual or sustainability reports are available. In this sense, the data are fragmented or missing completely, and it is not straightforward to have a clear picture of the Italian context at the level of industrial areas or, therefore, of the potential role of these areas in the framework of the decarbonization strategy of the country. In the National Recovery and Resilience Plan (NRRP) of 2021 [26], the Italian government presented its plans to build at least ten hydrogen valleys linked to some industrial areas; however, these are not a link with the decarbonization plan for the highly energy-intensive industries. The decarbonization strategy for the hard-to-abate industries is mentioned explicitly at the industrial area level only for the pig iron and steel production plant of Taranto. In this case, the document mentions the cement, chemical, and glass industries at the sector level, but not in terms of synergy with other plants or between each other.
The paper is organized as follows: In “Section 2” Materials and Methods, the authors present the methodology applied for the clustering of industrial sites in the Italian context, providing the general framework, and describing the input data and database used and reviewed in the study. In “Section 3”, Industrial Sector Analysis, the details and calculations regarding the industrial sectors are presented. In the “Section 4” Discussion of the Results, the GIS approach and the results of the clustering following the selected characteristics are presented. In the Discussion of the results, the most important results and findings are highlighted, and finally, the limitations and future possible works are discussed.

2. Materials and Methods

The method is based upon the following steps. Most relevant industrial installations belonging to the so called hard-to-abate sectors were collected and classified according to geocoded information, product category and quantity, allocated allowances, and actual emissions, electricity, and thermal energy consumption. Combining this data, industrial installations were classified into clusters, taking advantage of the available georeferenced data. Starting from the six initial hard-to-abate industrial sectors belonging to the EU ETS, classified using the Nomenclature of Economic Activities (NACE) rev.2 coding, individual installations from selected sectors were then identified, showing a total of 372 plants for Italy with their respective freely allocated allowances. The energy consumption (i.e., electricity and heat) and the carbon dioxide emissions were estimated using available data for energy intensities, carbon intensities, or real data available in specific databases and sustainability reports of corporates. Finally, individual installations were clustered by introducing a taxonomy based on six attributes: proximity, material flows, energy mix, total energy consumption (with a breakdown into electricity consumption and heat consumption), total greenhouse gas emissions, and decarbonization pathway.
The methodology to define a taxonomy on industrial clustering was defined with the following input data:
  • Geocoded data for industrial production plants: these data classify the geographical localization of industrial users and introduce a first attribute of the taxonomy—proximity.
  • Statistical classification of economic activities: these data classify industrial production activity and introduce a second attribute of the taxonomy—material flows.
  • Energy mix of economic activities: these data classify major energy resources deployed in specific industrial production plants and introduce a third attribute of the taxonomy—energy mix.
  • Energy intensity of economic activities: these data introduce energy intensity of economic activities deployed in specific industrial production plants, and express the amount of energy used per unit of industrial production output (J/t of industrial product). Therefore, these data introduce a fourth attribute of the taxonomy—total energy consumption (with a breakdown of different energy carriers deployed).
  • Emission factors of economic activities: these data introduce greenhouse emission factors of economic activities deployed in specific industrial production plants, and express the amount of greenhouse gases produced per unit of industrial production output (t CO2-eq/t of industrial product). Therefore, these data introduce a fifth attribute of the taxonomy—total greenhouse gas emissions.
  • Decarbonization options: these data introduce technology options for the decarbonization of economic activities and introduce a sixth attribute of the taxonomy—decarbonization pathway (with a breakdown of different decarbonization technology).
To build the taxonomy, it was necessary to collect these sets of data. First, an analysis was conducted among most relevant industrial sectors, considering energy-intensive industries as specified in the European Emission Trading Scheme (ETS) of greenhouse gases [27]. In particular, for the different sectors under the ETS framework, the verified emissions monitored in 2021 were collected, and are summarized in Table 1.
Refining of mineral oil and the production of bulk chemicals were excluded from the analysis because of the difficulty of accessing the required data and the complexity of production processes.
Therefore, the analysis included the main industrial sectors sorted by greenhouse gases emissions, namely:
  • Production of pig iron or steel
  • Production of cement clinker
  • Production of lime, or calcination of dolomite/magnesite
  • Manufacture of glass
  • Manufacture of ceramics
  • Production of paper or cardboard.
The total amount of emissions from these sectors was 34.9 Mt CO2-eq, which is more than 90% of the total verified emissions of all industrial installations, excluding combustion and the refining of mineral oil; hence, these sectors are a good representation of the ETS emissions despite the missing subsectors.
The selected sectors were then classified according to the corresponding economic activity. In particular, the Nomenclature of Economic Activities (NACE) classification was considered in this work [28], and the resulting coding is reported in Table 2.
The methodology applied to build the energy and emissions data for the country industrial plants includes the following steps, and is presented in Figure 1.
  • The first step was to extract all the companies registered in Italy in the selected ETS sectors. For this reason, the AIDA Database, part of the ORBIS database from the Bureau van Dijk Database, was used [29]. To the best of the authors’ knowledge, this is the most complete database that can provide complete and updated data about private companies, and allows searching for companies by NACE code, providing address, economic, and financial information.
  • In the second step, the list of companies belonging to the different industrial sectors extracted from the AIDA database was then crossed with the list of all the country ETS plants available on both the EU ETS Italy platform from the Italian Ministry of the Ecological Transition [30] for the Italian industrial sites available at [31], and also in the deliberation 2003/87/CE for Italy [32]. The platform and deliberation provide the most relevant information about the Emission Trading Scheme, including the list of industrial plants, geocoded data, and the freely allocated allowances updated for the fourth trading period (2021–2030) for each ETS plant. This second step was also fundamental to identifying all the production sites owned by the selected companies in the AIDA database. The coverage of the allowances and ETS emissions of the identified plants was verified with respect to the total value reported in the ETS platform of the European Union.
  • The third step consisted of verifying if the equivalent carbon dioxide of the selected ETS plants is available in the European Pollutant Release and Transfer Register (E-PRTR). If available, the most recent emissions data were assigned to the plant.
  • Then, in the fourth step, the total production outputs (only for industrial sectors in which it was possible to identify a single product), the total thermal energy, electricity, and carbon dioxide emissions (the carbon dioxide for a single plant was crossed with emissions data available in the E-PRTR database when available) were assessed based on the ETS freely allocated allowances from the EU-ETS platform (and from the deliberation previously mentioned) and the product benchmark assigned in the ETS system, specific to the sector (or a fuel or heat benchmark when it is not possible to identify a single product). In particular, the product of the free allowances and the fuel or product benchmark provides the production and the energy consumption of the plant, respectively. Benchmarks of products retrieved from the ETS deliberation of selected sectors are reported in Table 3. If the product benchmark was not applicable, the heat or fuel benchmark was applied to calculate the energy consumption and relative emissions.
  • The final step consisted of calculating the mismatch between the results obtained from the calculation and the total emissions and energy consumption of the sectors. The plant emissions and fuel consumptions were summed for each sector plant. The total values were compared with the available statistics, such as the total carbon from the energy tables of the IEA, and annual reports from national industrial associations, such as Federacciai and Federbeton for steel and cement, respectively. The mismatches from the values obtained and the statistics need to be evaluated with respect to the level of representativeness of the currently active plants modeled in hard-to-abate sectors. For the iron and steel sector, where a perfect correspondence exists between the World Energy Balance definition and the ETS sector, the comparison was assessed.
The freely allocated allowances were assigned based on the historical activity levels of the industrial site through the arithmetic mean activity during the baseline period (which covers five calendar years preceding the time-limit for submission of data to the Commission), multiplied by a product benchmark emission factor. In particular, “installations that meet the benchmarks and are therefore among the most efficient in the EU will, in principle, receive all the allowances they need to cover their emissions. Installations that do not reach the benchmarks will receive fewer allowances than they need. They will have to: (1) reduce their emissions, (2) buy additional allowances or credits to cover their emissions, or (3) combine these two options” [33]. A total of fifty-four benchmarks (52 products and 2 so-called fallback approaches based on heat and fuel) are available in the Annex of European Regulation 2019/331 (ANNEX 1 of COMMISSION DELEGATED REGULATION (EU) 2019/331 of 19 December 2018 determining transitional Union-wide rules for harmonized free allocation of emission allowances pursuant to Article 10a of Directive 2003/87/EC of the European Parliament and of the Council). Updated benchmarks were recently published in 2021, as described in [34].
The list of freely allocated allowances for all stationary installations in Europe for the fourth trading period is available elsewhere [35]. Therefore, combining the AIDA dataset and the ETS Database, it is possible to select stationary installations that belong to a specific economic sector and that are included in the carbon pricing mechanisms in Europe. Furthermore, the combination of these two datasets enables the association of freely allocated allowances for each stationary installation and, by knowing the sector benchmark, enables determination of the average/representative production of a certain good in an industrial installation.
As mentioned previously, in some cases, when a product benchmark was not available or could not be completely identified (e.g., multiple subprocesses and products, selling of intermediate products, etc.), a fallback approach could be used, considering, therefore, heat and fuel benchmarks. When available, production data, energy consumption data, and greenhouse gas emissions data for individual installations were considered. In particular, emissions of air pollutants for individual installations are partially available at the European Pollutant Release and Transfer Register (E-PRTR) [36]. In other cases, energy consumption and greenhouse gas emissions were considered by introducing energy (electricity and thermal) and carbon intensities that are representative of installations in Europe and, when possible, in Italy. A proportion of the calculated emissions and energy consumption was assessed with respect to the total verified emissions for the ETS sectors and with the national energy consumption of the sector based on the IEA World Energy Balance for Italy and national reports from the industrial federations of the sectors analyzed.

3. Industrial Sector Analysis

The following paragraphs review industrial installations in Italy under the EU ETS scheme, and compute the most relevant and environmental data based on real information available in public repositories. Derivations are reported and estimated based on the review of the latest information on energy and carbon intensities of the investigated industrial sectors. This analysis is part of the review work since it provides an updated assessment of the most relevant industrial sectors and installations in Italy.

3.1. Manufacture of Other Non-Metallic Mineral Products

3.1.1. Manufacture of Glass

The industrial sector of glass includes the manufacture and processing of products intended for a variety of uses, including residential, industrial, and transport. Based on the Nomenclature of Economic Activities (NACE) classification, glass production belongs to Group 23.1 (Manufacture of glass and glass products) with the following main classes: 23.11, manufacture of flat glass; 23.13, manufacture of hollow glass; 23.14, manufacture of glass fibers [28].
The total production of glass in Europe in 2020 was 35,851,000 tons, with more than 60% of the products consisting of hollow glass and 30% of flat glass. Europe is a net importer of glass, mainly of hollow glass products, and glass wools and fibers; overall, the ratio of exports to imports of glass products was 0.87 in 2020, based on data mainly provided by Glass Alliance Europe for 2020 [37] and compiled by Eurostat. Italy accounts for about 15% of total European production, with capacity in 2018 of 5,342,046 tons. Per capita consumption in Italy, in 2018, was 16.6 and 76.3 kg of flat and hollow glass, respectively [38].
The glass production sector is a highly energy-intensive sector, classified within the Energy Intensity Industry (EII) [27] sectors of the European greenhouse gas emission allowance trading system. Most of the emissions derive from the use of fossil fuels (generally natural gas in the European context), which are used to produce high-temperature thermal energy necessary in the production phases; a share of about 25% of total emissions is instead generated by the release of carbonates, which are present in the raw materials and decompose at high temperatures, releasing carbon dioxide [39]. There is also a share of indirect emissions related to the production of electricity used in the process.
At the European level, final energy consumption in the glass production sector is about 6–6.5 Mtoe per year (6.45 Mtoe in 2015 [40]), which corresponds to around 2.6–2.8% of the total final consumption of industry (231.758 Mtoe in 2020 [23]). About 16.9 million tons of CO2-eq were accounted for by the glass sector [41]. At the Italian level, final energy consumption in the glass production sector was 0.96 Mtoe in 2018 [38], which corresponds to about 4% of the total final consumption of the industry (23.94 Mtoe at 2020 [23]), with a mix that included the use of 65% natural gas and 27% electricity, and the remaining 8% from other sources (e.g., fuel oil, diesel). The glass production sector is therefore weakly electrified compared to the average value of electricity use in the industrial sector, which exceeds 40%. Equivalent greenhouse gas emissions were around 2.7 Mt in 2019, corresponding to about 9% of total emissions in industry and about 1% of total emissions [42].
Regarding glass production plants in Italy, a first analysis was undertaken by accessing the AIDA (database Bureau van Dijk) [29]. In particular, the search for companies was preformed considering the NACE classification 23.1—manufacture of glass and glass products, and then filtering for the two main classes 23.11 (manufacture of flat glass) and 23.13 (manufacture of hollow glass). Filtering was also considered by including the threshold of total revenues of individual companies higher than EUR 10,000,000 per year. The list of companies was then overlapped with the list of plants under the EU Emission Trading Scheme, as for the European Directive 2003/87/CE [32] and the more recent modification of the 2018/410/UE [43]. The list of plants for Italy was published by the Italian Ministry of Ecological Transition in the Deliberations 42/2021 (Aggiornamento dalla tabella nazionale di allocazione di cui all’articolo 11 della direttiva 2003/87/ce come modificato dalla direttiva 2018/410/UE di cui alla delibera 143/2019) and 113/2021 (Rilascio delle quote di emissione per l’anno 2021 impianti stazionari [31]), and includes all the stationary plants within the ETS framework. In general, the list of authorizations and allocation of freely allocated allowances is reported by the Ministry of the Ecological Transition, through a dedicated webpage [44]. Regarding the glass production plants, the analysis found a total of 40 plants in Italy produce hollow glass and eight produce flat glass. The total calculated freely allocated allowances in NACE Classification—23.1, based on the allocation of single plants, was found to be 1,861,452 t CO2-eq, whereas the value reported by the European Environmental Agency was 1,929,632 t CO2-eq at 2021 [41] (4% relative error). Finally, verified emissions were reported to be 2,781,431 t CO2-eq, indicating a significant misalignment in terms of greenhouse emission caps, and thus the need to decarbonize the sector by adopting appropriate measures. Summary results are shown in Table 4.
By knowing the freely allocated allowances and the benchmarking values of carbon intensity for different productive activities, it was possible to estimate the production output of single plants. The product benchmarks of float glass and hollow glass were considered to carry out this calculation. In particular, for the hollow glass, the average value between colored and colorless container glass was considered. Table 5 also reports the energy intensity and carbon intensity of glass production plants with a breakdown of unit electricity and thermal energy consumption. Energy intensities were assumed from the literature [45,46]; it can be noted that thermal energy is required for high-temperature processes (i.e., melting and finishing and post forming and finishing) above 1200 °C. Regarding the carbon intensity, data for flat glass were estimated from E-PRTR [47], where actual emissions are available, in addition to production for some installations (the value reported in Table 5 represents an average of estimated values). Alternatively, carbon intensity for hollow glass was considered for the Italian case, as reported in [38].
The estimated total yearly energy consumption of selected plants is around 54 PJ, whereas estimated total greenhouse gas equivalent emissions are around 2.7 Mt CO2-eq. The mapping of glass installations is reported in Figure 2 with an orange dot symbol.

3.1.2. Production of Lime, or Calcination of Dolomite/Magnesite

The industrial sector of lime includes the manufacture and processing of products intended, in particular, for the construction and manufacturing sectors; lime is also often used as an additive due to its alkalinity and ability to purify and neutralize [48]. Based on the Nomenclature of Economic Activities (NACE) classification, lime production belongs to Group 23.5 (Manufacture of cement, lime and plaster) and class 23.52, manufacture of lime and plaster. Regarding production, lime is characterized by high energy intensity and high carbon intensity. Especially high-temperature thermal energy is needed since lime production usually requires limestone to be heated to temperatures above 1000 °C. Some electricity consumption is also needed to ensure crushing and other auxiliary processes. Carbon dioxide emission is also relevant, and is either associated with the burning of fuels for the limestone heating process, or with the limestone decomposition, which releases carbon dioxide as a side product. Eventually, around two-thirds of emissions are associated with the process and only the remaining part with fuel combustion. As reported by the European Lime Association, the fuel mix of the sector includes 51% use of solid fossil fuels, 34% use of natural gas, 5% of oil, and the remaining 10% of waste and biomass.
For the sector, the search for companies was undertaken considering the NACE classification 23.5—manufacture of cement, lime and plaster, and then filtering for class 23.52 (manufacture of lime and plaster). Filtering was also considered by including the threshold of total revenues of individual companies higher than EUR 10,000,000 per year. The list of companies was then overlapped with the list of plants under the EU Emission Trading Scheme [31,33,34,44]. Regarding the lime production plants, the analysis found a total of 24 plants in Italy. The total calculated freely allocated allowance in NACE Classification—23.52, based on the allocation of single plants, was found to be 1,410,576 t CO2-eq, whereas the value reported by the European Environmental Agency was 1,678,561 t CO2-eq at 2021 [41] (19% relative error). Verified emissions were reported to be 2,202,986 t CO2-eq. Summary results are shown in Table 5.
By knowing the free allocated allowances and the benchmarking values of carbon intensity for different productive activities, it was possible to estimate the production output of single plants. The product benchmark of lime was considered to carry out this calculation. Table 6 also reports the energy intensity and carbon intensity of lime production plants, with a breakdown of unit electricity and thermal energy consumption. Energy intensities were assumed from the literature [48,49,50]; it can be noted that the thermal energy is required for high-temperature processes above 1000 °C. Regarding the carbon intensity, data were estimated from E-PRTR [47], where actual emissions are available in addition to production for some installations (the value reported in Table 6 represents an average of estimated values). The estimated total yearly energy consumption of selected plants is around 8.2 PJ, whereas estimated total greenhouse gas equivalent emissions are around 1.8 Mt CO2-eq. The mapping of lime installations is reported in Figure 2 with a blue dot symbol.

3.1.3. Manufacture of Ceramics

The industrial sector of ceramics includes the manufacture and processing of a large variety of products intended, in particular, for the construction sector. The different products depend on the starting raw materials and process conditions, and include ceramic tiles, bricks, and porcelain tiles [47]. Based on the Nomenclature of Economic Activities (NACE) classification, ceramics manufacture belongs to the wider Group 23.3 (Manufacture of clay building materials) and Group 23.4 (Manufacture of other porcelain and ceramic products). Regarding production, both electricity and thermal energy are required in the process to prepare raw materials and, in particular, for the firing step, which takes place in kilns at temperatures above 1000 °C.
For the sector, the search for companies was undertaken taking into account the NACE classification 23.3—manufacture of clay building materials and 23.4—manufacture of other porcelain and ceramic products; then filtering was performed for the classes 23.31 (manufacture of ceramic tiles and flags), 23.32 (manufacture of bricks, tiles and construction products, in baked clay), 23.41 (manufacture of ceramic household and ornamental articles), 23.42 (manufacture of ceramic sanitary fixtures), 23.43 (manufacture of ceramic insulators and insulating fittings), and 23.44 (manufacture of other technical ceramic products). Another filtering was considered by including the threshold of total revenues of individual companies higher than EUR 10,000,000 per year. The list of companies was then overlapped with the list of plants under the EU Emission Trading Scheme [31,33,34,44]. The analysis found a total of 121 plants in Italy under the EU ETS. It must be noted that 60 of the 121 plants are classified as “small” emitters and, as such, they are excluded from the ETS system, whereas emissions are still accounted for and disciplined by the Italian Authority according to the “opt out” scheme [51]. The total calculated freely allocated allowance based on the allocation of single plants, excluding small emitters, was found to be 1,409,666 t CO2-eq, whereas the value reported by the European Environmental Agency was 1,538,785 t CO2-eq at 2021 [41] (8% relative error). Verified emissions were reported to be 2,491,187 t CO2-eq. Summary results are shown in Table 6.
Given the complexity and variety of ceramic products, the benchmark considered for the allowances was the heat benchmark, which was used in combination with the freely allocated allowances to compute the thermal energy demand. Then, knowing the thermal energy intensity, as given in Table 7, the production in different plants was computed. Energy intensities in Table 7 are averaged values from real data and literature information [52]; even in this case, the thermal energy is required at high temperatures of above 1000 °C. For the carbon intensity, the estimated data are averaged values from real data and literature information [53]. The estimated total yearly energy consumption of selected plants is around 45 PJ, whereas the estimated total greenhouse gas equivalent emissions are around 2.7 Mt CO2-eq. The mapping of lime installations is reported in Figure 2 with a yellow dot symbol.

3.1.4. Production of Cement Clinker

The industrial cement sector includes the manufacture and processing of products intended, in particular, for the construction sector [54]. Based on the NACE rev.2 classification, cement production belongs to Group 23.5 (Manufacture of cement, lime, and plaster) and class 23.51, manufacture of cement. Similar to lime production, high temperature thermal energy is required in the process, with temperatures above 1000 °C. Electricity is also needed to ensure crushing and other auxiliary processes. Carbon dioxide emission is also relevant, and is either associated with burning of fuels for the heating process, or for the calcination step, which releases carbon dioxide as a side product. Eventually, around two-thirds of emissions are associated with the process, and only the remaining part with fuel combustion. The sector has a very high carbon intensity, using solid fossil fuels that are deployed on a massive scale, and some small contributions from waste utilization. Overall, considering the whole non-metallic mineral sector, the contribution from solid fuels was almost 11% considering coal, industrial waste, and solid biomass in Italy in 2021.
For the sector, the search for companies was carried out considering the NACE rev.2 classification 23.5—manufacture of cement, lime and plaster and then filtering for the classes 23.51. Filtering was also considered by including the threshold of total revenues of individual companies higher than EUR 5,000,000 per year. The list of companies was then overlapped with the list of plants under the EU Emission Trading Scheme [31,32,43,44]; for the cement production plants, the analysis found a total of 29 plants in Italy (Federbeton reported 27 fully integrated plants in Italy in 2020 [54]). The total calculated freely allocated allowances in NACE Classification—23.51, based on the allocation of single plants, was found to be 9,806,322 t CO2-eq, whereas the value reported by the European Environmental Agency was 10,083,701 t CO2-eq at 2021 (3% relative error) [47]. Verified emissions were reported to be 12,422,813 t CO2-eq in 2021. Summary results are shown in Table 7.
By knowing the freely allocated allowances and the benchmarking values of carbon intensity for different productive activities, it was possible to estimate the production output of single plants. The product benchmark of grey cement clinker (0.693 t CO2-eq/t of grey cement clinker) was considered to carry out this calculation. Table 8 also reports the energy intensity and carbon intensity of cement production plants, with a breakdown of unit electricity and thermal energy consumption. Energy intensities were assumed from the literature [55]. For greenhouse gas emissions, data were estimated from E-PRTR [47], where actual emissions are available in addition to production for some installations (the value reported in Table 8 represents an average of estimated values).
The estimated total yearly energy consumption of selected plants is around 58.1 PJ (about 51 PJ is high-temperature thermal energy), whereas data reported in the literature indicate consumption of about 55 PJ. The estimated total greenhouse gas equivalent emissions are around 12.2 Mt CO2-eq, with a coverage of around 98% with respect to the verified emissions reported by ETS system (Table 8). The mapping of cement installations is reported in Figure 2 with a green dot symbol.

3.2. Manufacture of Paper and Paper Products

Production of Paper or Cardboard

The industrial paper production sector includes the manufacture and processing of products intended for a variety of uses, including the production of cellulose pulp, paper, and cardboard products. The sector, based on the Nomenclature of Economic Activities (NACE) classification, is classified in Section C, which includes manufacturing activities; Division 17 which includes the production of pulp, paper and paperboard (Group 17.1) and paper and paperboard articles (Group 17.2) [28]. Even more specifically, the production of cellulose pulp falls within class 17.11, and the production of paper and cardboard fall within class 17.12. From a statistical and energy point of view, the pulp and paper production sector is often coupled with the printing products sector (division 18 of the NACE classification) as defined, for example, by the International Energy Agency.
Paper products are widely used in multiple sectors such as packaging, graphics and printing media, hygienic-sanitary, and household material. About 60% of European production is destined for packaging material, and products for graphic and printing applications account for about 30%; the remaining portion refers to products for hygienic-sanitary applications [56].
Energy consumption in the paper sector in Europe in 2019 was around 1.5 EJ, with biofuels and waste covering 40% of consumption, and the share of electrification (30%) and natural gas (19%) [57] was also growing. In particular, the use of biomass and waste from the production chain contributed more than 62% of the energy used by the combustion of fuels to produce heat [56].
For Italy, taking 2019 as a reference, the paper sector consumed about 86 PJ, with a quite different mix compared to the global and European composition, including 36% electricity consumption, 30% natural gas, and 30% heat produced in cogeneration plants or thermal plants. In addition, production facilities are often equipped with systems of combined heat, and power production technologies powered by natural gas with a self-consumption rate of about 76% [58]. The paper production sector accounts for more than 8% of the final consumption of industry and about 1.8% of final consumption in Italy.
The production of paper and cardboard in Italy amounted in 2019 to about 8.9 million tons, including 153 plants and about 19,000 employees. The 153 plants are divided relatively evenly in terms of total annual production; 29 plants had production of 1000–5000 t/year; 21 plants had production of 5001–10,000 t/year; 33 plants had production of 10,001–25,000 t/year; 18 plants had production of 25,001–50,000 t/year; 20 plants had production of 50,001–100,000 t/year; and 32 plants had production of over 100,000 t/year [56].
For the sector, the search for companies was undertaken considering the NACE rev.2 classifications 17, 17.10, 17.12, 17.20, 17.21, 17.22, 17.23, 17.24, and 17.29. Filtering was applied by including the threshold of total revenues of individual companies higher than EUR 5,000,000 per year. The list of companies was then overlapped with the list of plants under the EU Emission Trading Scheme [23,31,32,43,44] for the paper and cardboard production plants. This analysis found a total of 96 plants in Italy belonging to the EU ETS scheme (actually, 16 installations of the 96 are classified as small installations and participate in the “opt out” option. The total calculated freely allocated allowances based on the allocation on single plants was found to be 2,105,535 t CO2-eq, whereas the value reported by the European Environmental Agency was 2,204,457 t CO2-eq at 2021 (5% relative error) [41]. Verified emissions were reported to be 4,052,653 t CO2-eq. in 2021. Summary results are shown in Table 8.
By knowing the freely allocated allowances and the benchmarking values of carbon intensity for different productive activities, it was possible to estimate the production output of single plants. The average of product benchmarks for paper and carboard sector (0.22 t CO2-eq-t of product) was considered to carry out this calculation. Table 9 also reports the energy intensity and carbon intensity of cement production plants, with a breakdown of unit electricity and thermal energy consumption. Energy intensities were assumed from the literature, and were computed considering thermal energy, electricity consumption, and paper production in Italy in 2021 [58]. For greenhouse gas emissions, data were estimated from E-PRTR [47], where actual emissions are available in addition to production for some installations (the value reported in Table 9 represents an average of estimated values). The estimated total yearly energy consumption of selected plants is around 86.2 PJ. The estimated total greenhouse gas equivalent emissions are around 4.2 Mt CO2-eq. The mapping of paper installations is reported in Figure 2 with a dark pink dot symbol.

3.3. Manufacture of Basic Metals

The manufacture of basic metals, based on NACE rev.2 classification, corresponds to the code division 24 which includes five groups and 16 classes:
  • Group 24.1—Manufacture of basic iron and steel and of ferro-alloys
  • Group 24.2—Manufacture of tubes, pipes, hollow profiles and related fittings, of steel
  • Group 24.3—Manufacture of other products of first processing of steel (24.31 Cold drawing of bars; 24.32 Cold rolling of narrow strip;24.33 Cold forming or folding; 24.34 Cold drawing of wire)
  • Group 24.4—Manufacture of basic precious and other non-ferrous metals (24.41 Precious metals production; Aluminium production; 24.43 Lead, zinc and tin production, 24.44 Copper production, 24.45 Other non-ferrous metal production, 24.46 Processing of nuclear fuel)
  • Group 24.5—Casting of metals (24.51 Casting of iron; 24.52 Casting of steel; 24.53 Casting of light metals; 24.54 Casting of other non-ferrous metals)
In this analysis only the manufacture of steel and the related processes was considered, whereas the manufacture of the other basic metals, such as aluminum, lead, zinc, and copper, was not included (group 24.4) and will be considered for future works.

Production of Pig Iron or Steel

According to the data from the World Steel Association in 2021, steel production in Italy increased by 24.4 Mt of crude steel after the loss in production of 2020 during the COVID-19 pandemic (19.3 Mt of crude steel in 2020 and 22 Mt in 2019). In addition, Italy was confirmed as the second largest European producer after Germany [59]. The share of steel produced from blast oxygen furnaces (BOFs) in the same year was 16%, with the remainder produced with electric arc furnaces (EAFs). Moreover, the Italian trade association for steel, Federacciai, reports the statistics of the sector each year in its annual report and sustainability report.
In Italy, the only integrated iron and steel plant for primary steel production is the Acciaierie d’Italia facility located in Taranto in the South of Italy, which produced around 3.9 Mt of steel in 2021. Iron ore and coke are introduced into the blast furnace (BF), where the combustion of coke provides the carbon oxide and heat necessary for the oxidation of the iron ore to obtain the pig iron. Then, the pig iron is introduced into the blast oxygen furnace (BOF) to eliminate the impurities due to oxygen, which converts them into oxides such as carbon oxide and silicon, to finally obtain steel. The majority of steel (20.5 Mt in 2021) is produced from steel scrap in the EAF process. According to Federacciai and Eurofer data, in Italy, there are a total of 27 EAF facilitieslocated in different areas of Italy, i.e., in the provinces of Aosta, Bergamo, Brescia, Catania, Cremona, Cuneo, Padova, Terni, Trento, Udine, Varese, Verona, and Vicenza. Some of the steel plants also include manufacturing of secondary products, whereas others are entirely dedicated to secondary transformation of steel products. In the integrated cycle, the main contribution to the direct carbon dioxide emissions relates to the carbon input necessary for the reduction of the iron ore, as described above, and the use of coke. By comparison, in electric arc furnaces, the direct emissions are limited to the combustion of natural gas for heating and to reducing and process agents in the charge; the most important part of the emissions are indirect and linked to the electricity consumption necessary for the smelting of the scrap charge. Finally, the CO2 emissions from processing and transformation are linked to the combustion of natural gas in the reheating furnace or heat treatment. In 2020, the direct and indirect emissions of the sector were 17.5 Mt CO2, which corresponds to around 4.5% of the total national Italian emissions. The iron and steel sector in Italy is the most energy efficient in Europe, with consumption of 7.54 GJ/t steel; this is 38% higher than the European average [60]. The consumption of natural gas in 2018 was around 80 PJ and the consumption of electricity was around 17,500 MWh.
According to the data available on AIDA, the majority of the industrial plants analyzed in this work are registered in NACE 24.1 as steel manufactures. However, most of the plants are actually complex facilities that also include the casting, rolling, and finishing processes (24.3 and 24.5 groups), and, for certain plants, also or only include the manufacture of steel products (group 24.2). The search for companies was undertaken with NACE classifications 24.1, 24.2, 24.3, 24.51, and 24.52. We excluded the manufacture of basic precious metals and other non-ferrous metals and their casting is included in the remaining NACE code division 24. As mentioned for the other sectors, a filter on the revenues of the companies of EUR 10,000,000 per year was used to limit the number of companies to cross check with the list of plants included in the EU Emission Trading Scheme in the European Directive 2003/87/CE and its modification (2018/410/UE) and published by the Italian Ministry of Ecological Transition. For the iron and steel sector, 60 plants were found. The calculated freely allocated allowances of the plants, excluding the integrated iron and steel plants, were 11,858,150 t CO2-eq in 2021, which are higher than those of the ETS sectors 24 Production of pig iron or steel and 25 Production or processing of ferrous metals. This is probably due to the fact that a certain portion of the freely allocated allowances are included under the ETS sector 20 All stationary installations. Unfortunately, these are not available for each industrial sub-sector in the ETS database. Summary results areshown in Table 9.
In order to calculate the thermal energy consumption and the electricity consumption of the single plants, the authors distinguished between the only remaining plant that produces primary steel in Italy, Acciaierie d’Italia S.p.A, which is located in the South of Italy (TA), the plants producing secondary steel from scrap coupled with rolling, finishing, and manufacturing of steel products sections, and plants in which only processing and manufacturing take place. The energy consumption of the iron and steel plant Acciaierie d’Italia, ex-ILVA, was retrieved from the IEA World Energy Balance for Italy in 2019 [23]. In fact, the energy balance presents the detailed consumption of the typical gases produced in the blast furnace and basic oxygen furnace for the steel sector, which corresponds to the consumption of the plant. Moreover, according to ENEA, the plant also consumes natural gas, which is not possible to identify in the IEA energy balance because it is aggregated. It is important to note that the value used in the analysis refers to the thermal energy of the blast furnace and coke oven gas, because we expressed the energy consumption in terms of final thermal energy rather than fuel consumption. In 2019, the production of primary steel was 4.2 Mt, which represented a decline with respect to the production of the previous year [59]. The thermal energy consumption of the plant was 33 PJ, corresponding to consumption of coal and derived coal products of around 69 PJ, and specific energy consumption in terms of fuel of 18.3 GJ per ton of produced steel. The plant uses the excess gases from the furnaces to produce the electricity used in the process, which is probably sufficient to entirely cover its needs; for this reason, electricity consumption was not included in the analysis, since it is not useful to identify a possible electrification cluster. Nevertheless, if, in the future, the process is converted to direct reduction coupled with electric arc furnaces to decarbonize the process, the plants will increase their electricity consumption without the possibility of using recovered gases as in the blast furnace technology. The equivalent carbon dioxide emissions were available. For the other steel production and processing plants, because of the great variability in the type of processes and finishing, the number of manufactured products, and the corresponding energy consumption, the benchmark considered for the energy consumption of the plants was the fuel benchmark that was assumed to be proportional to the number of allowances allocated to each plant. The equivalent carbon dioxide values of some plants were available in the European Pollutant Release and Transfer Register (E-PRTR) database [47]. The calculated total yearly thermal energy consumption of selected plants is around 80 PJ, the total electricity consumption is around 63 PJ, and the estimated total greenhouse gas equivalent emissions are around 10.5 per year (around −6% relative error with respect to the verified emissions of the steel sector). These results in terms of consumption are consistent with the steel sector of the Italian Energy Balance published by the government, and by the IEA World Energy Balance. The mapping of the iron and steel installations is reported in Figure 2 with a black dot symbol.

4. Results

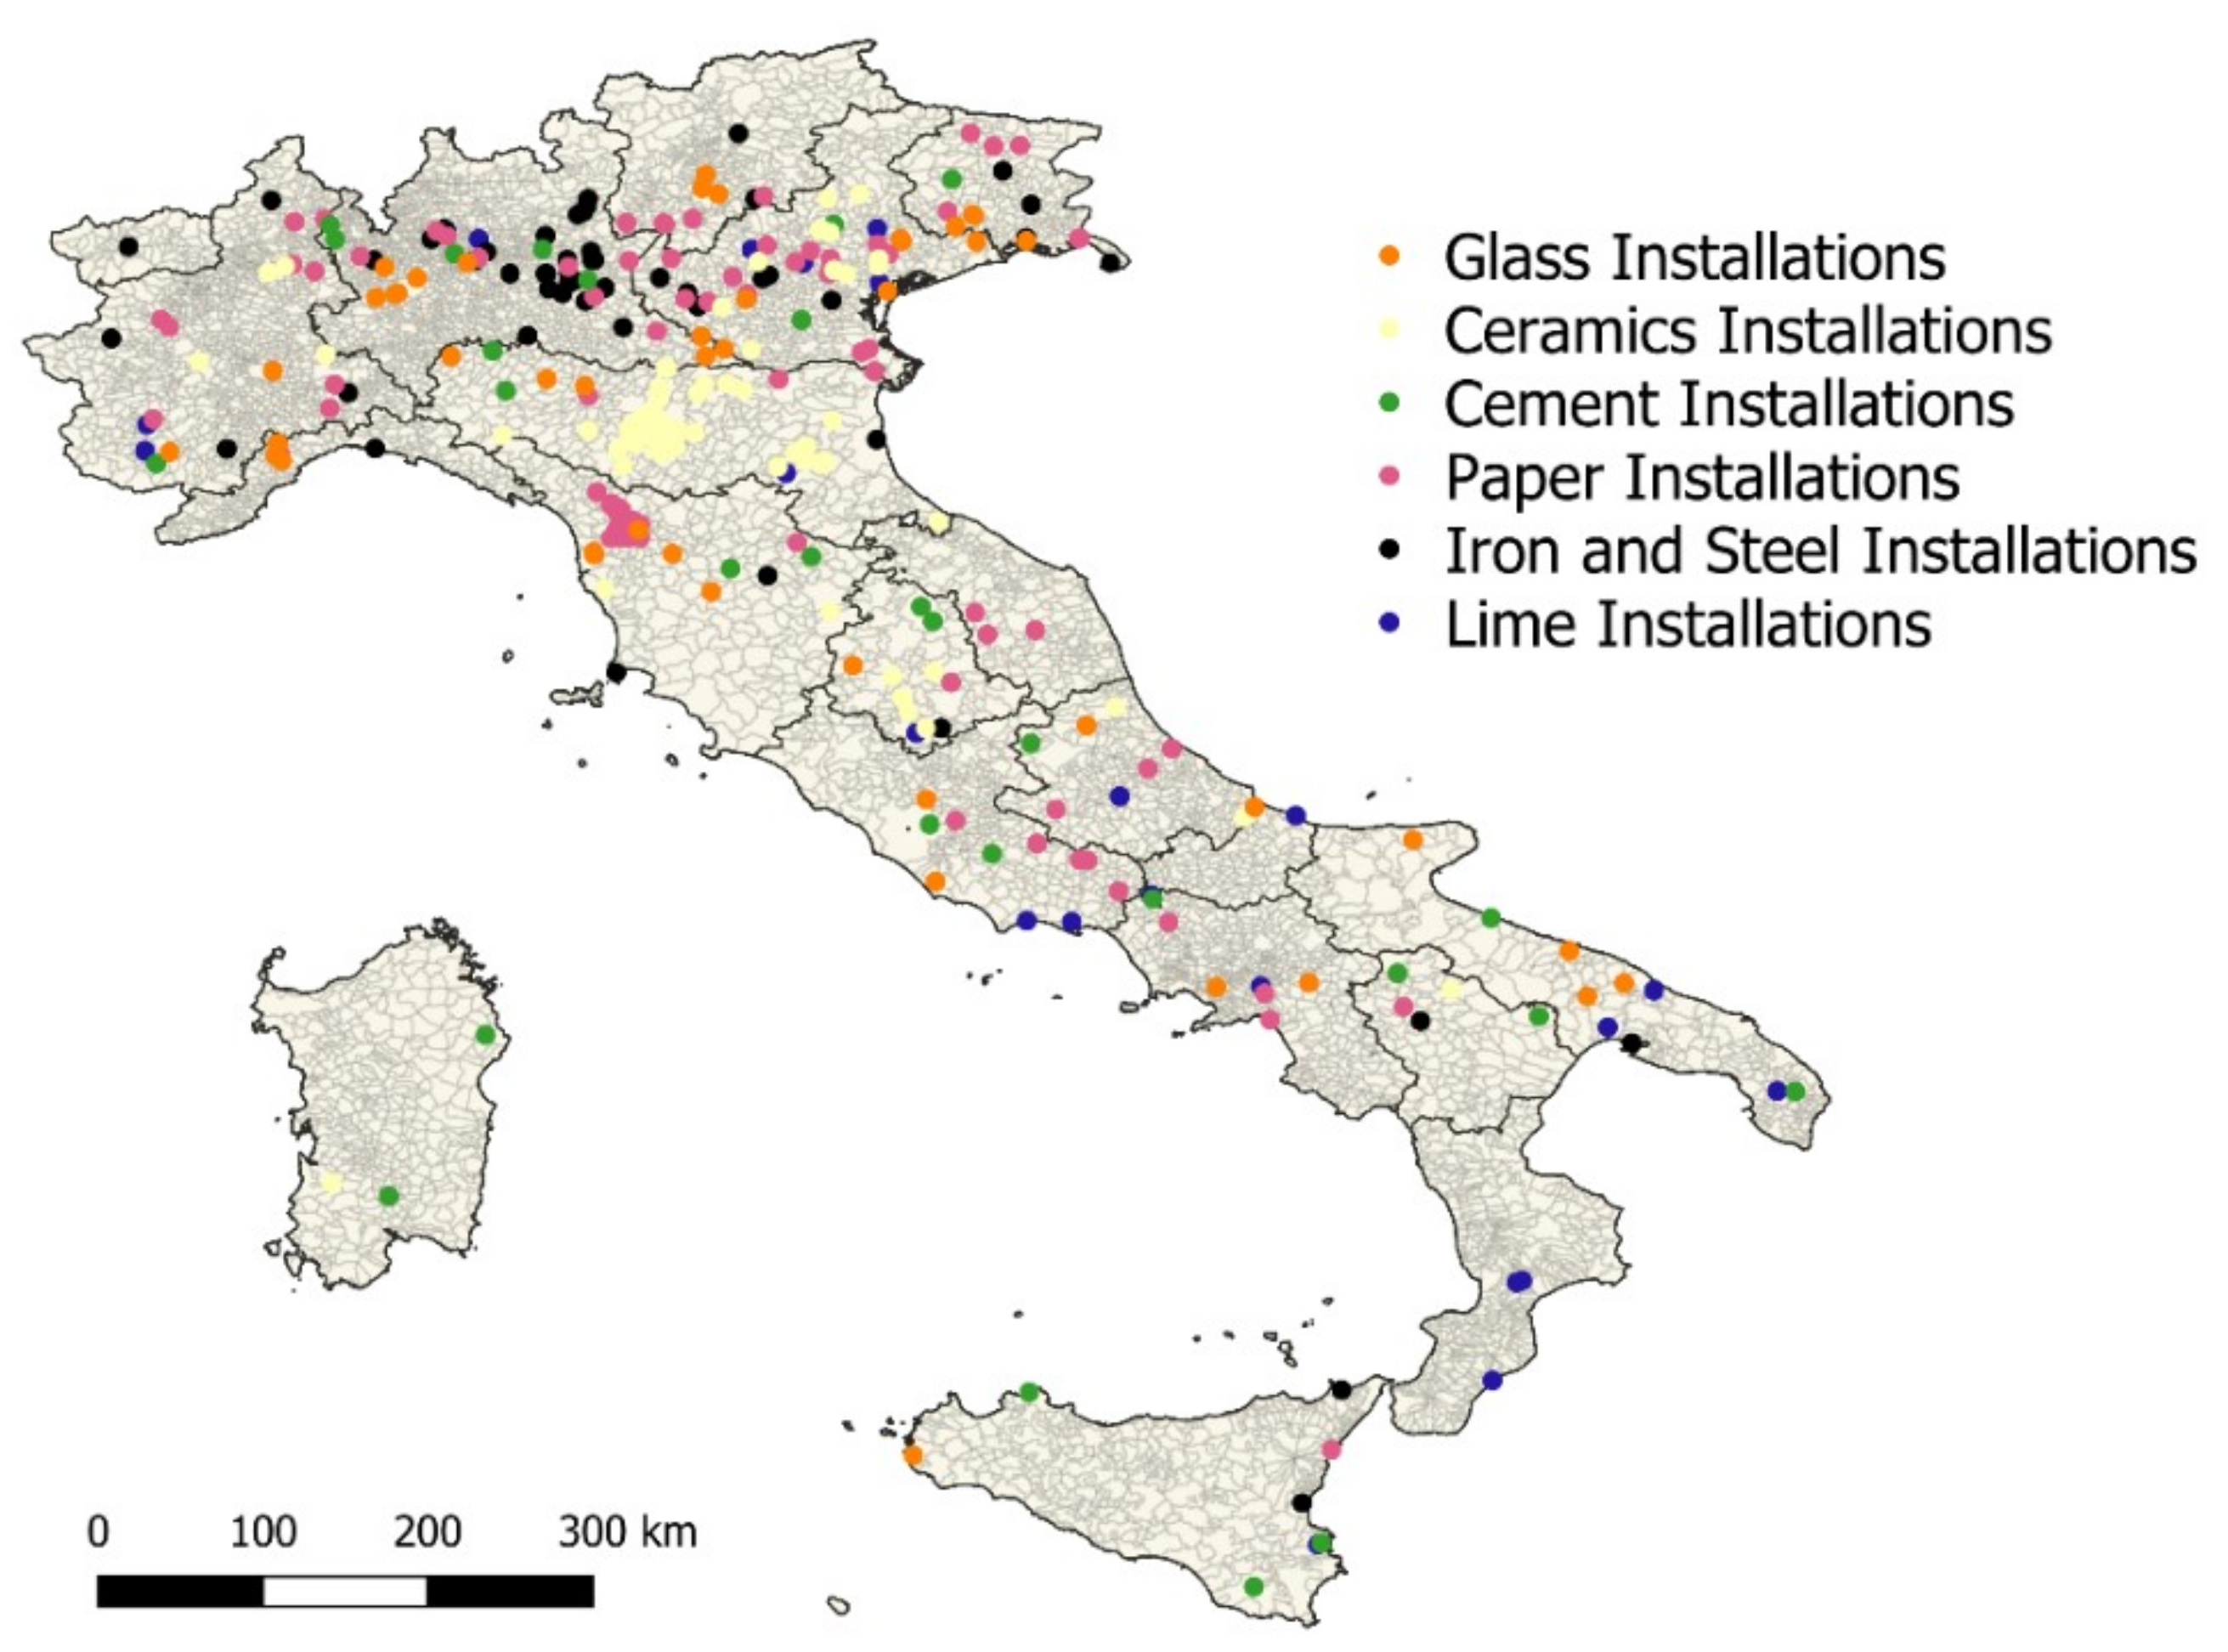
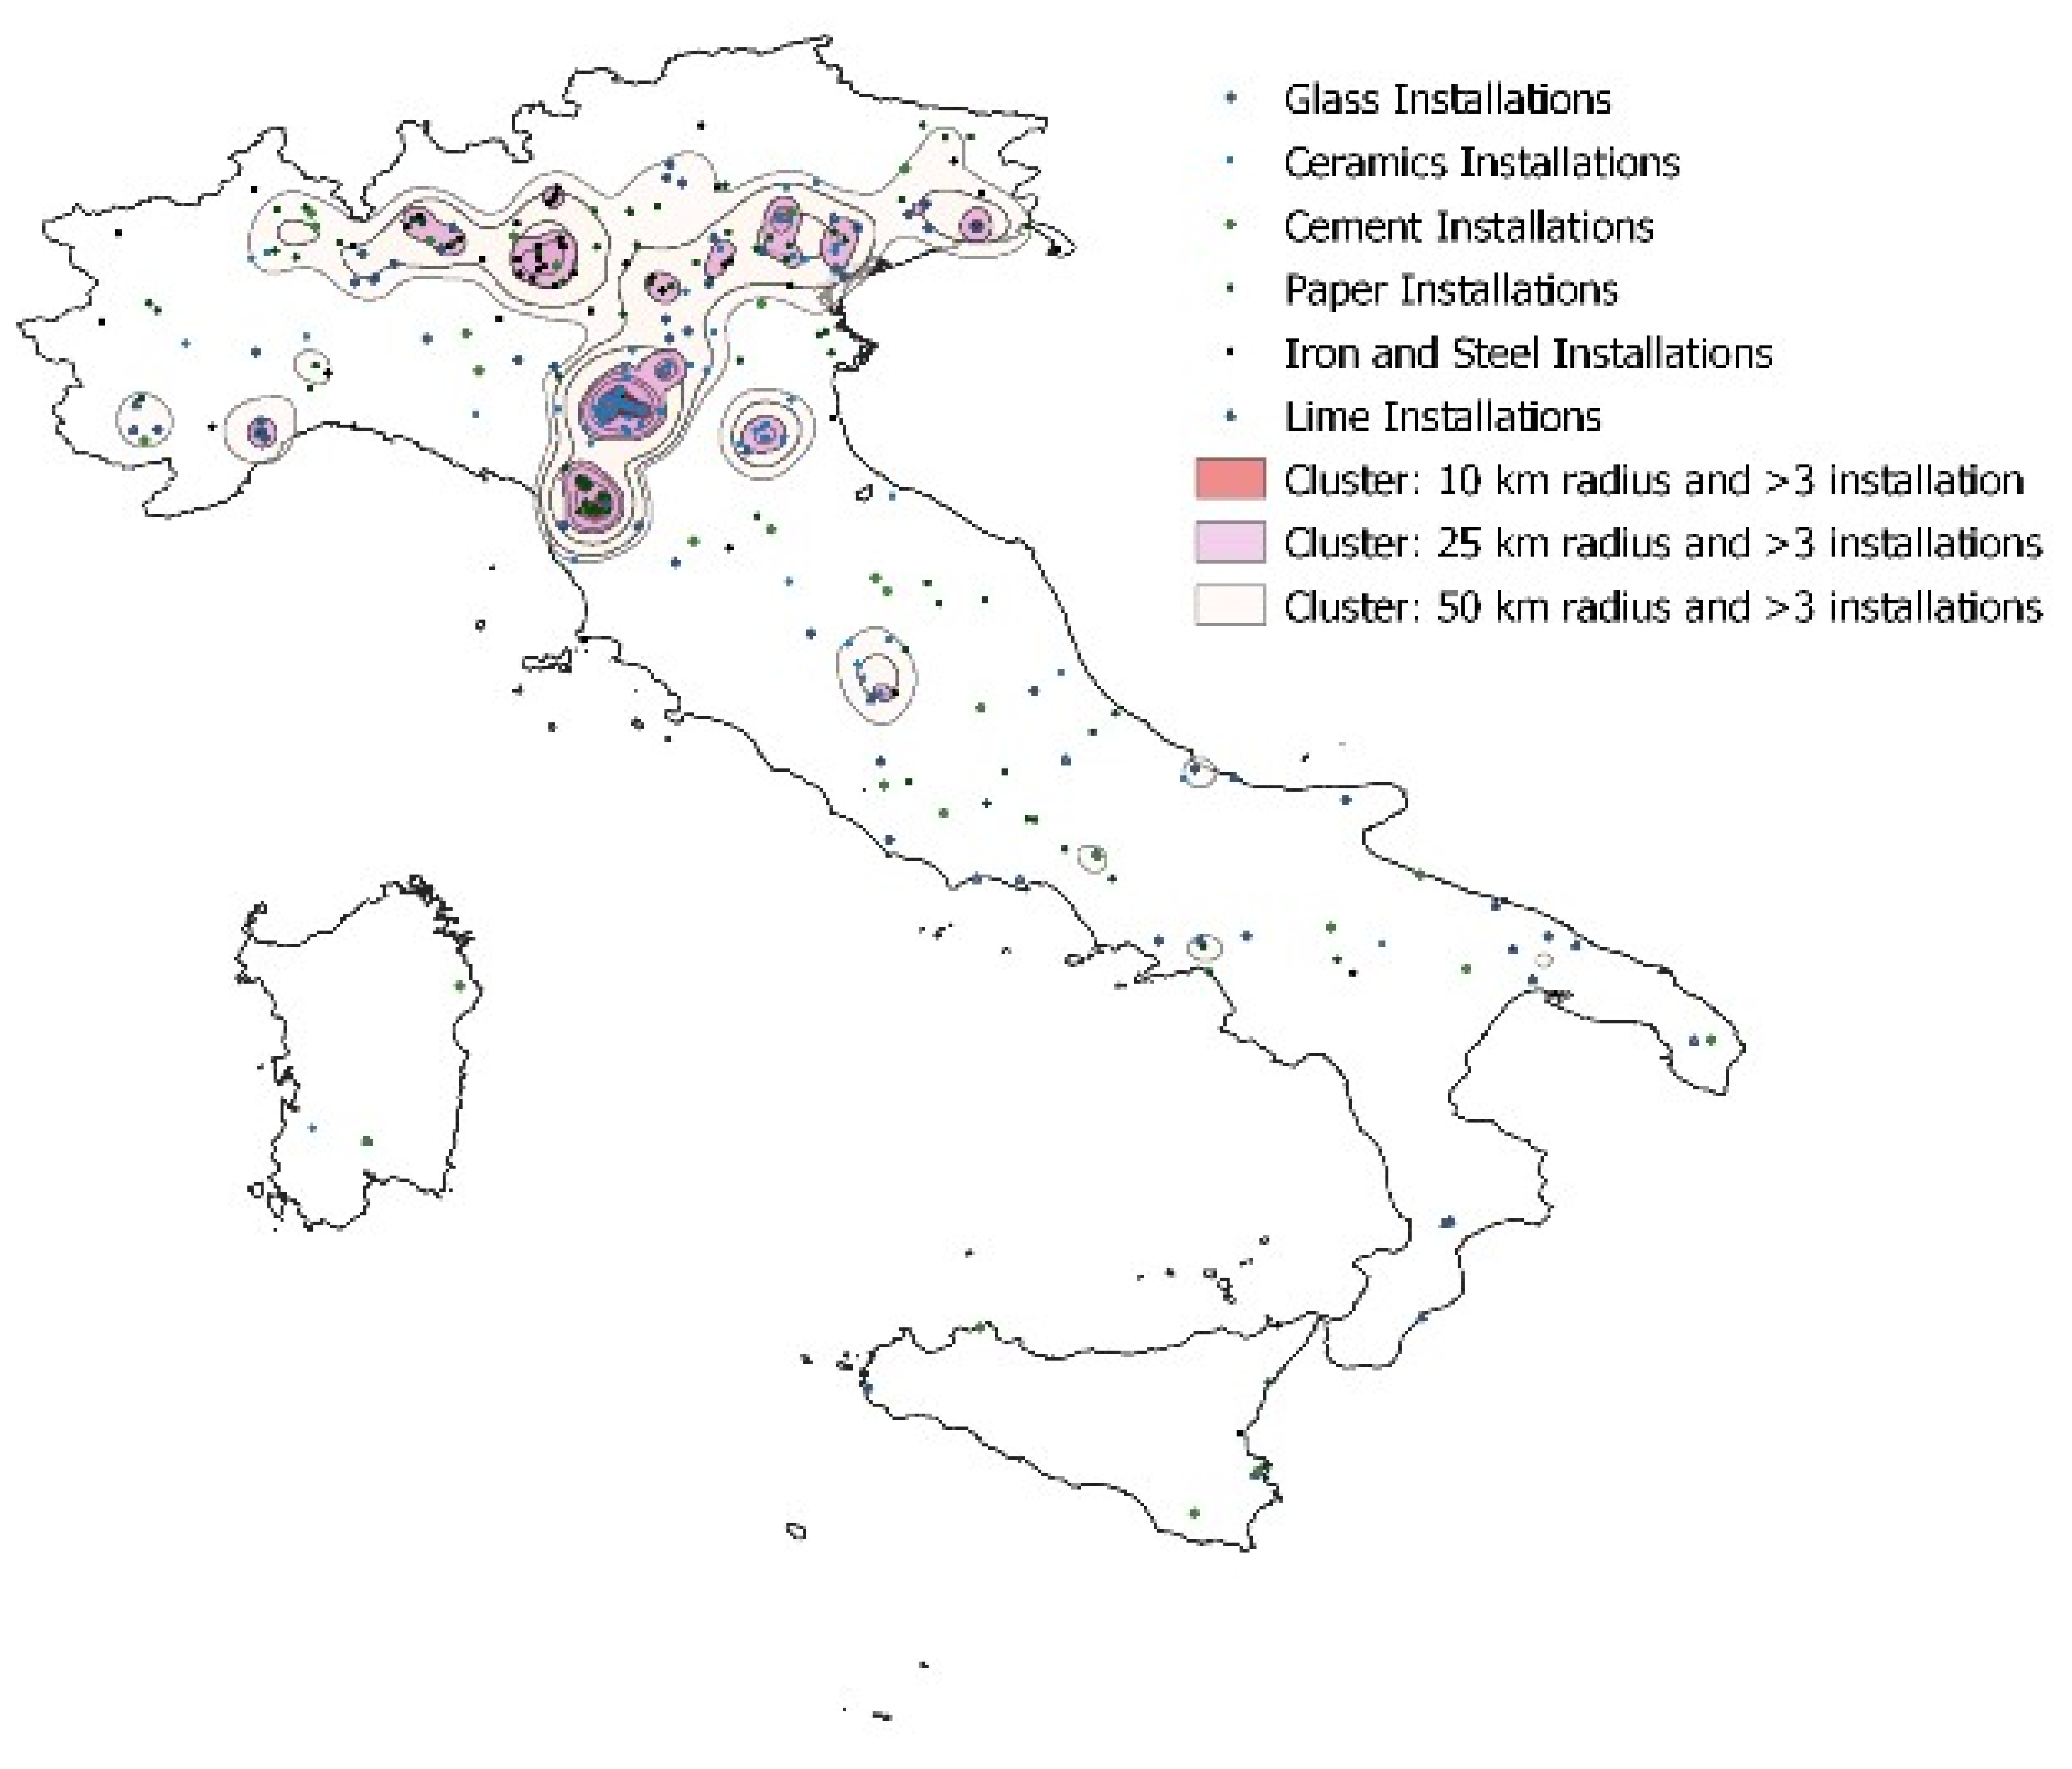
Based on the data collected in the previous paragraphs and attributes of the taxonomy of industrial clusters, it was possible to identify potential clustering of industrial installations. Figure 3 and Figure 4 show clustering of industrial installations based on spatial criteria. First, clusters were identified considering a minimum number of three installations, in areas having different radii of 10, 25, and 50 km. Each point in the shaded areas has a minimum of three installations at a certain distance corresponding to the investigated radius (light-to-dark red color gradation represents larger-to-smaller clusters). We found 10 large clusters with a radius of 50 km and containing more than three plants. The number of clusters with a radius of 25 km and more than three installations was 28, and there were nine smaller clusters with a 10 km radius and more than three installations. More granular information may be obtained in the case where the minimum number of installations is increased to five, as shown in 
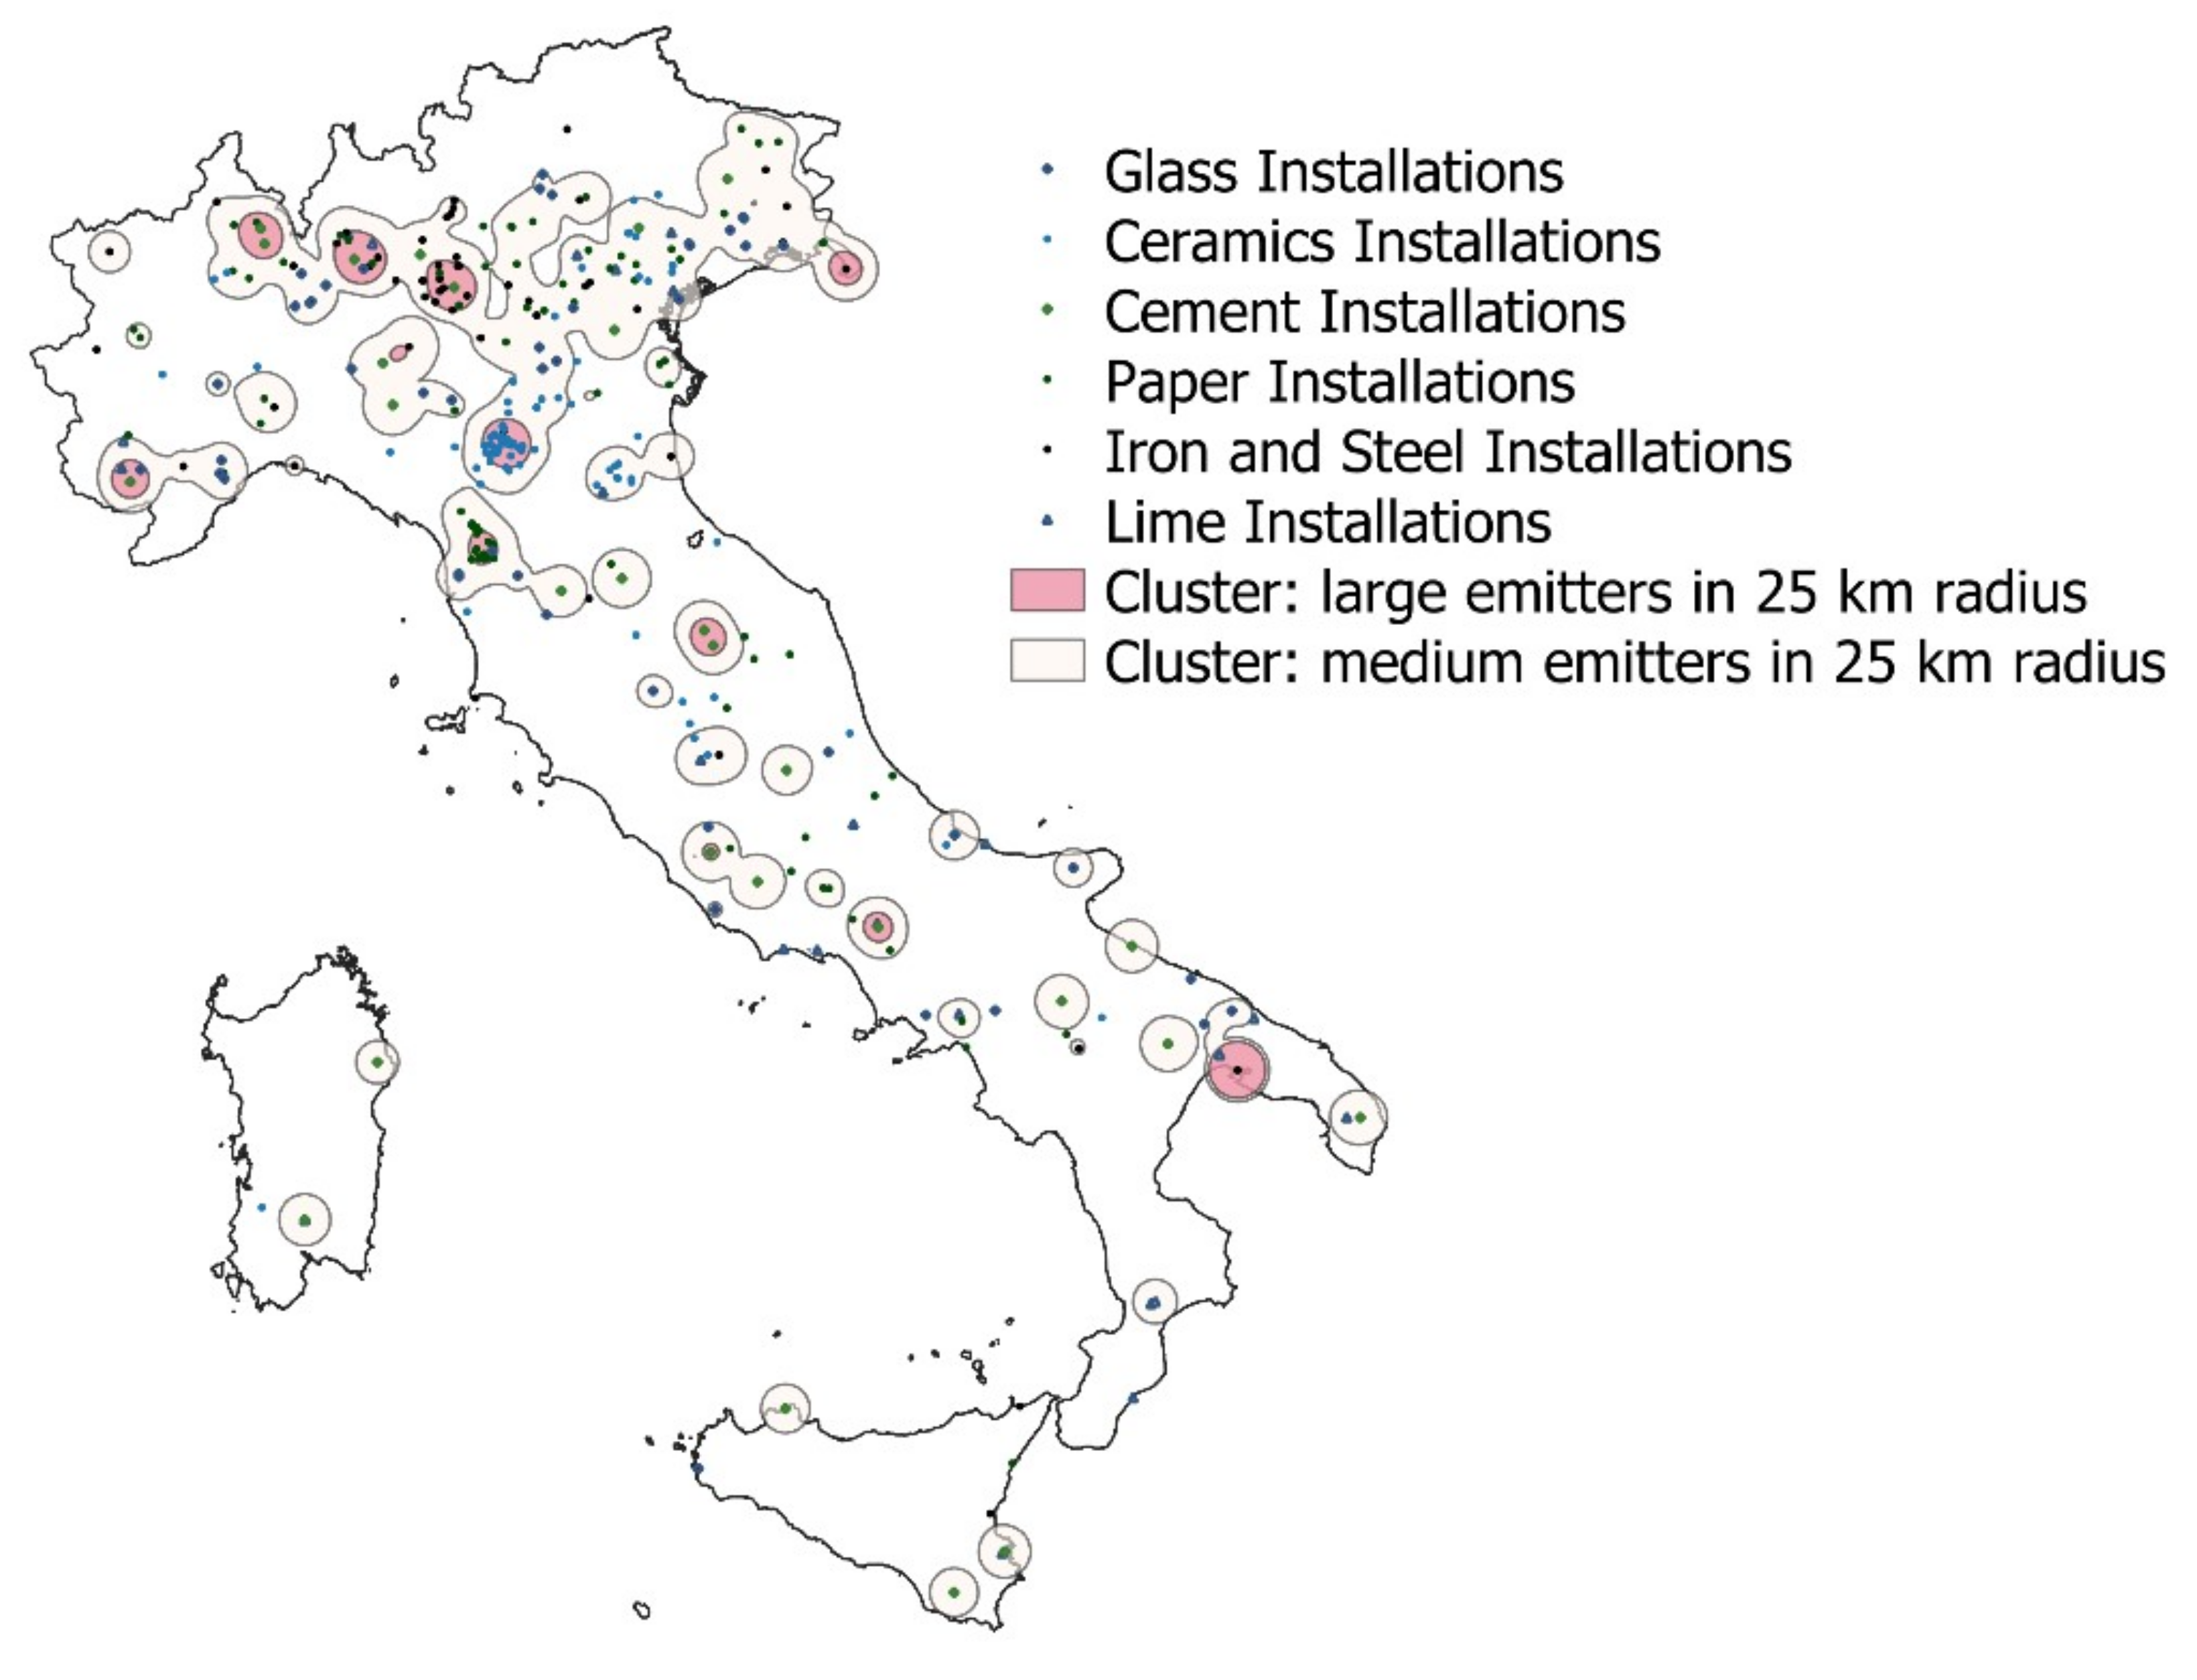
Figure 5, which highlights the areas in Northern Italy where all clusters above the density threshold, including 10 and 25 km radii, are located. Identified clusters generally include all investigated industrial sectors, with some clusters that feature the concentration of sectoral installations, such as ceramics, steel, and paper in Northern–Central Italy. Clustering of industrial areas was also undertaken considering other attributes of the taxonomy, such as the energy consumption and greenhouse gas emissions, as shown in Figure 6, where clustered installations behaving as large emitters (>500,000 t CO2-eq/y) and medium emitters (>50,000 t CO2-eq/y) within 25 km were considered. Again, increasing the value of the considered attribute reduces the granulometry of clusters.
Similarly, Figure 7 shows clusters defined considering thermal energy utilization, where two different values for this attribute were considered based on Eurostat classification of industrial natural gas consumers [61]. The considered values were those for consumers in Band I5 (1 PJ < Consumption < 4 PJ) and Band I6 (Consumption > 4 PJ).
The number of clusters belonging to Band I5 was 32, including a total number of installations of 277. By comparison, the number of clusters belonging to Band I6 was 10, with 123 installations. There was a substantial overlap among clusters identified with thermal energy consumption and greenhouse gas emissions, with the EU ETS scheme accounting for direct emissions (that are related to fossil combustion).
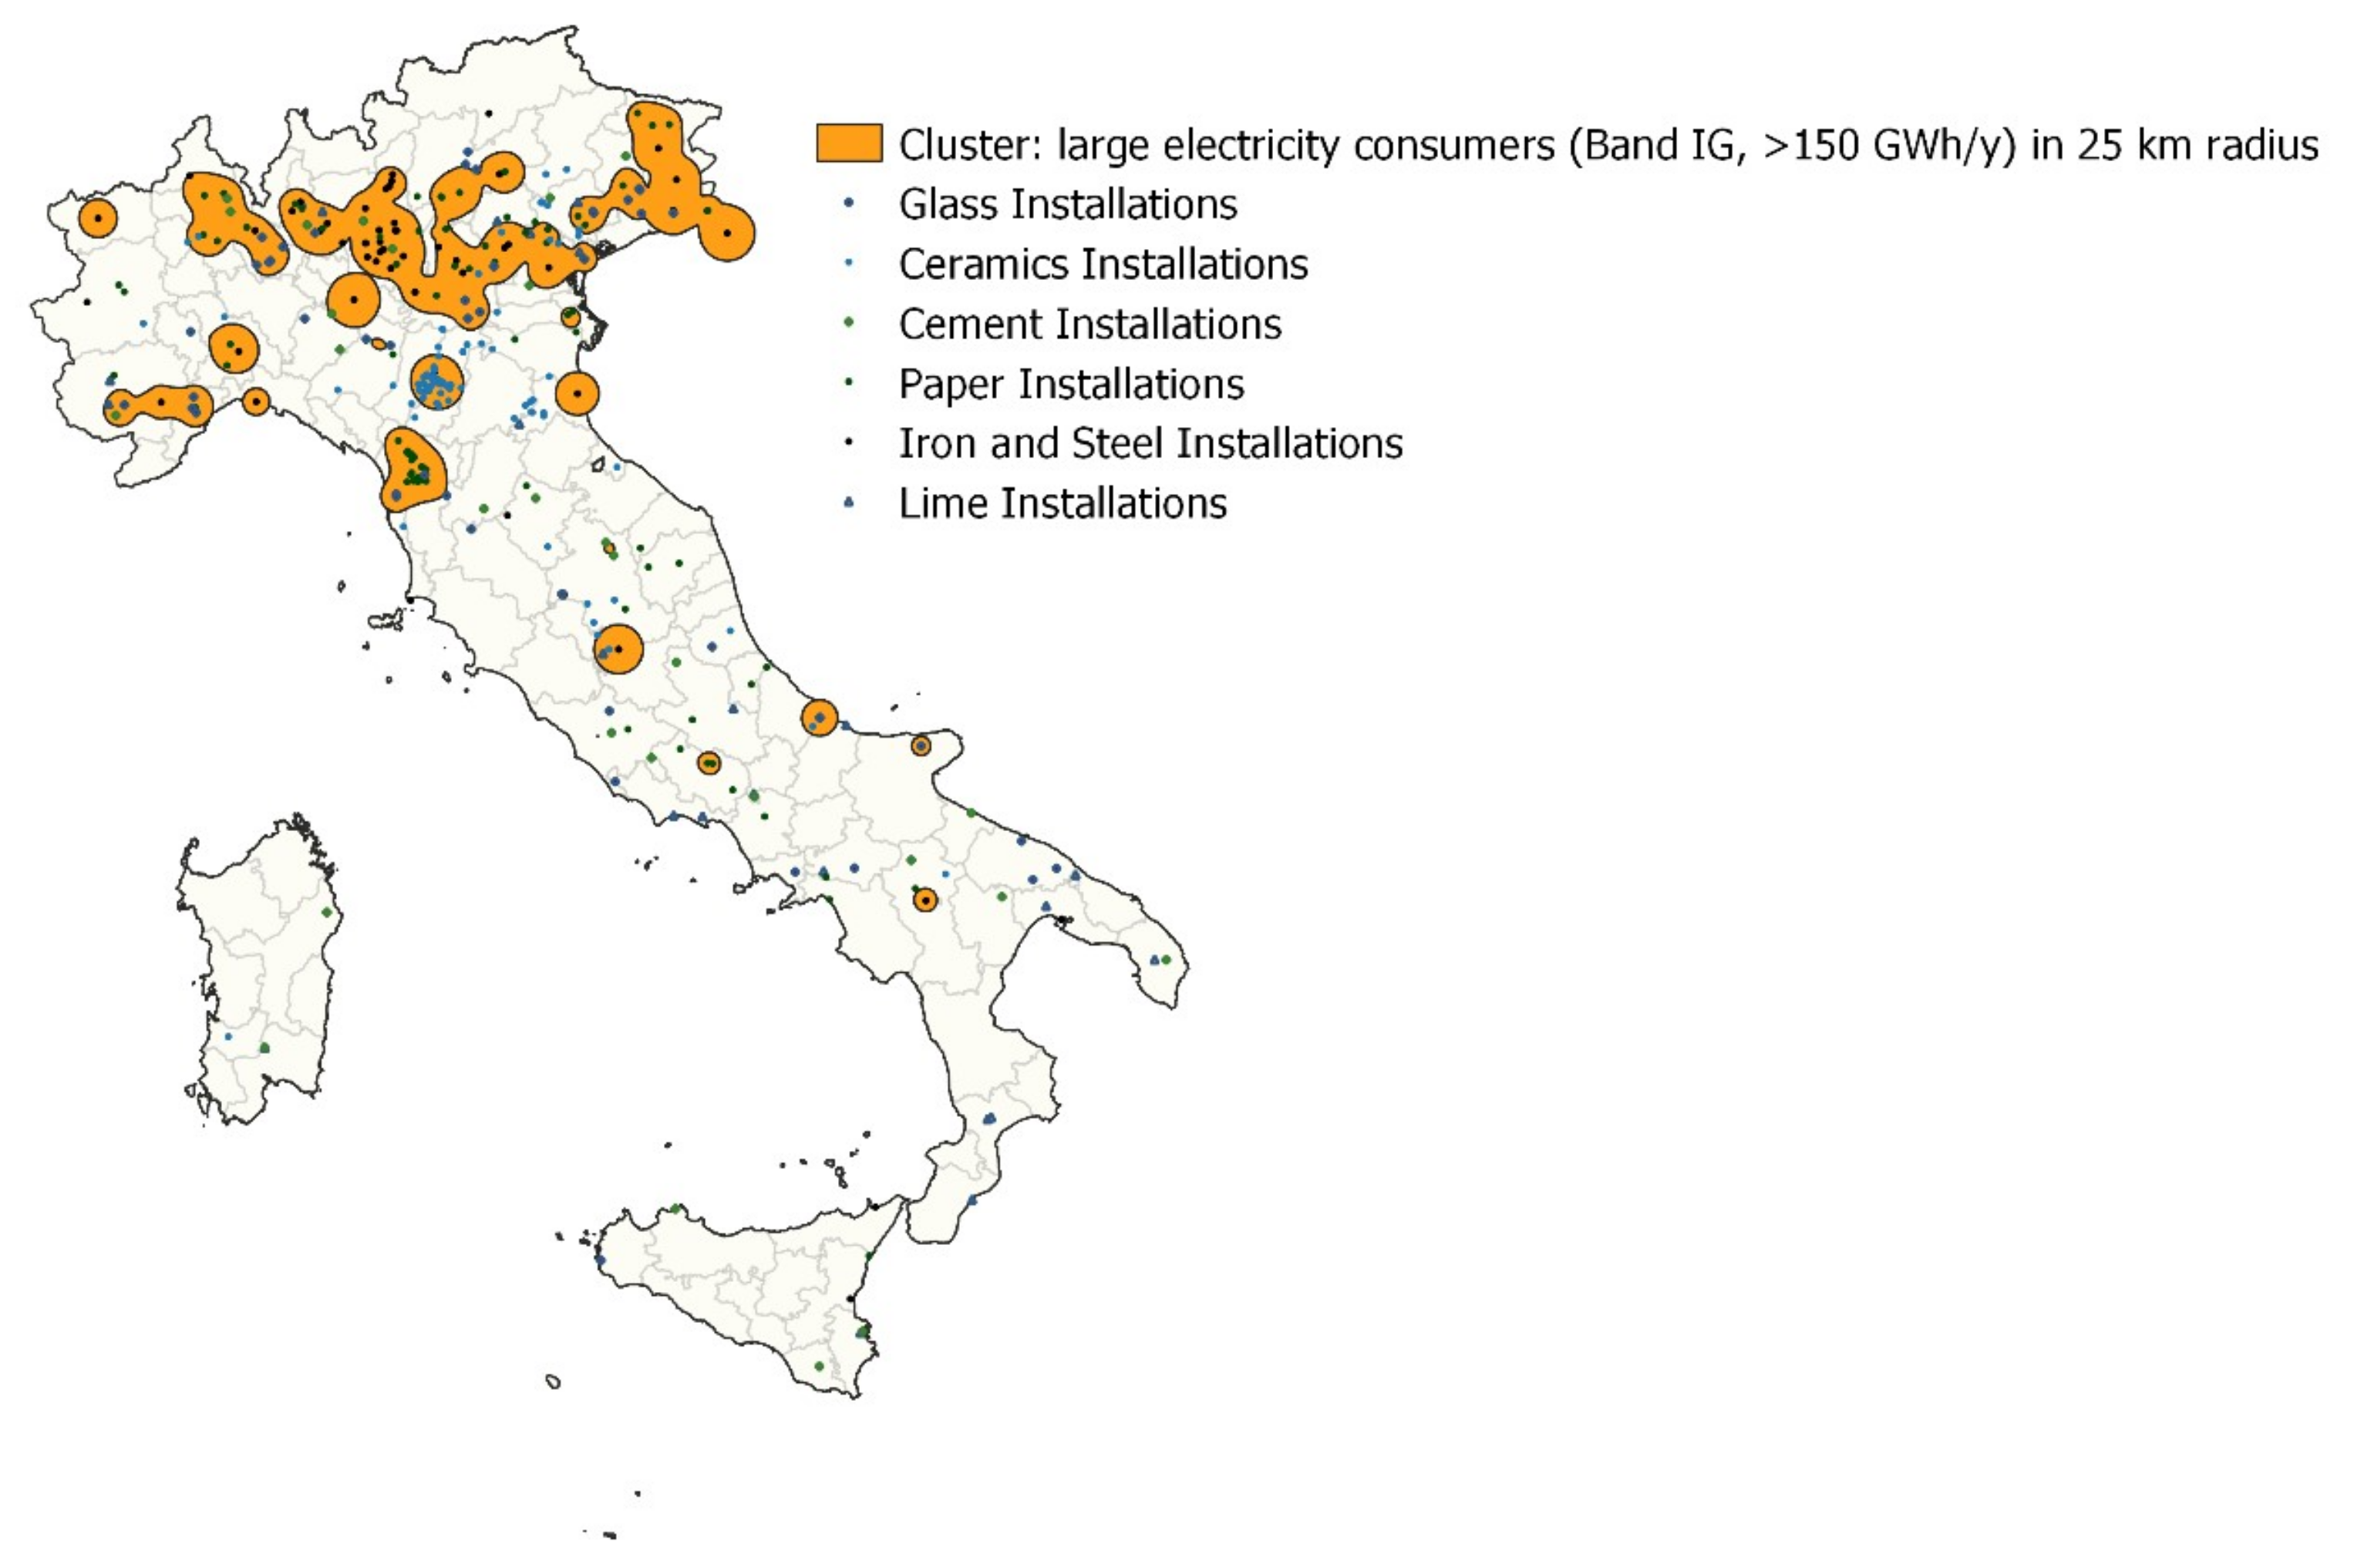
Finally, the identified clusters taking into account the attribute of electricity consumption are shown in Figure 7. Similarly, in this case, the Eurostat classification for electricity consumption for non-household consumers is considered, showing data for electricity consumption above 150 GWh (the highest Band IG) in clusters with a radius of 25 km. The total number of clusters is 20, with total installations numbering 236. Clusters with the highest electricity consumption are no longer considered since the methodology deployed in this paper is mostly based on the EU ETS database, and data are reported for direct emissions, thus showing high accuracy for combustion processes and related greenhouse emissions. By comparison, emissions from power generation are not allocated to the consuming industrial sectors but rather to the power generation sector itself, meaning that installations with a high electrification rate may not be included in ETS database.

5. Discussions of the Results

The Figure 4, Figure 5, Figure 6 and Figure 7 reported in previous paragraphs show very interesting features with reference to the relevance of clusters for industry energy consumption and emissions, as shown in Table 10. The table reports some data for clusters based on taxonomy attribute, taxonomy value, number of clusters, number of installations in the cluster, total thermal energy consumption, share in industrial thermal energy consumption, total electricity consumption, share in industrial electricity consumption, total greenhouse gas emissions, and share in industrial total greenhouse gas emissions. In particular, the calculated shares refer to total industrial thermal energy consumption, total industrial electricity consumption, and total industrial greenhouse gas emissions; the considered values are, respectively, 494 PJ, 430 PJ, and 53.9 Mt CO2-eq/y (verified emissions in ETS including all industrial installations (excl. combustion)) [23].
Based on the taxonomy attribute of proximity, which introduces the more severe constraint in the clustering of industrial users, it is possible to identify three clusters with a total of 67 installations, and having more than five installations in areas with a 10 km radius; these clusters represent 5%, 1%, and 4% of national thermal energy consumption, electricity consumption, and equivalent greenhouse gas emissions, respectively. In the case of three installations in areas with a 10 km radius, the number of clusters is nine, with 97 installations, and 8%, 3%, and 6% of national thermal energy consumption, electricity consumption, and equivalent greenhouse gas emissions, respectively.
Clustering of thermal energy consumption and relaxing the spatial constraint leads to the identification of clusters with high relevance in terms of energy and emissions. Indeed, with thermal energy consumption higher than 4 PJ in a 25 km radius, it is possible to identify 10 clusters with 123 installations, representing 51%, 11%, and 28% of national thermal energy consumption, electricity consumption, and equivalent greenhouse gas emissions, respectively. Similarly, with the greenhouse gas emissions attribute higher than 500,000 t CO2-eq/y in a 25 km radius, it is possible to identify 13 clusters with 118 installations, representing 50%, 9%, and 32% of national thermal energy consumption, electricity consumption, and equivalent greenhouse gas emissions, respectively. This is a very relevant result, since adequate policies and technology options addressing the cluster scale may have a significant impact in terms of energy saving and security, and reduction in emissions.
Looking in more detail at selected clusters provides more information. 
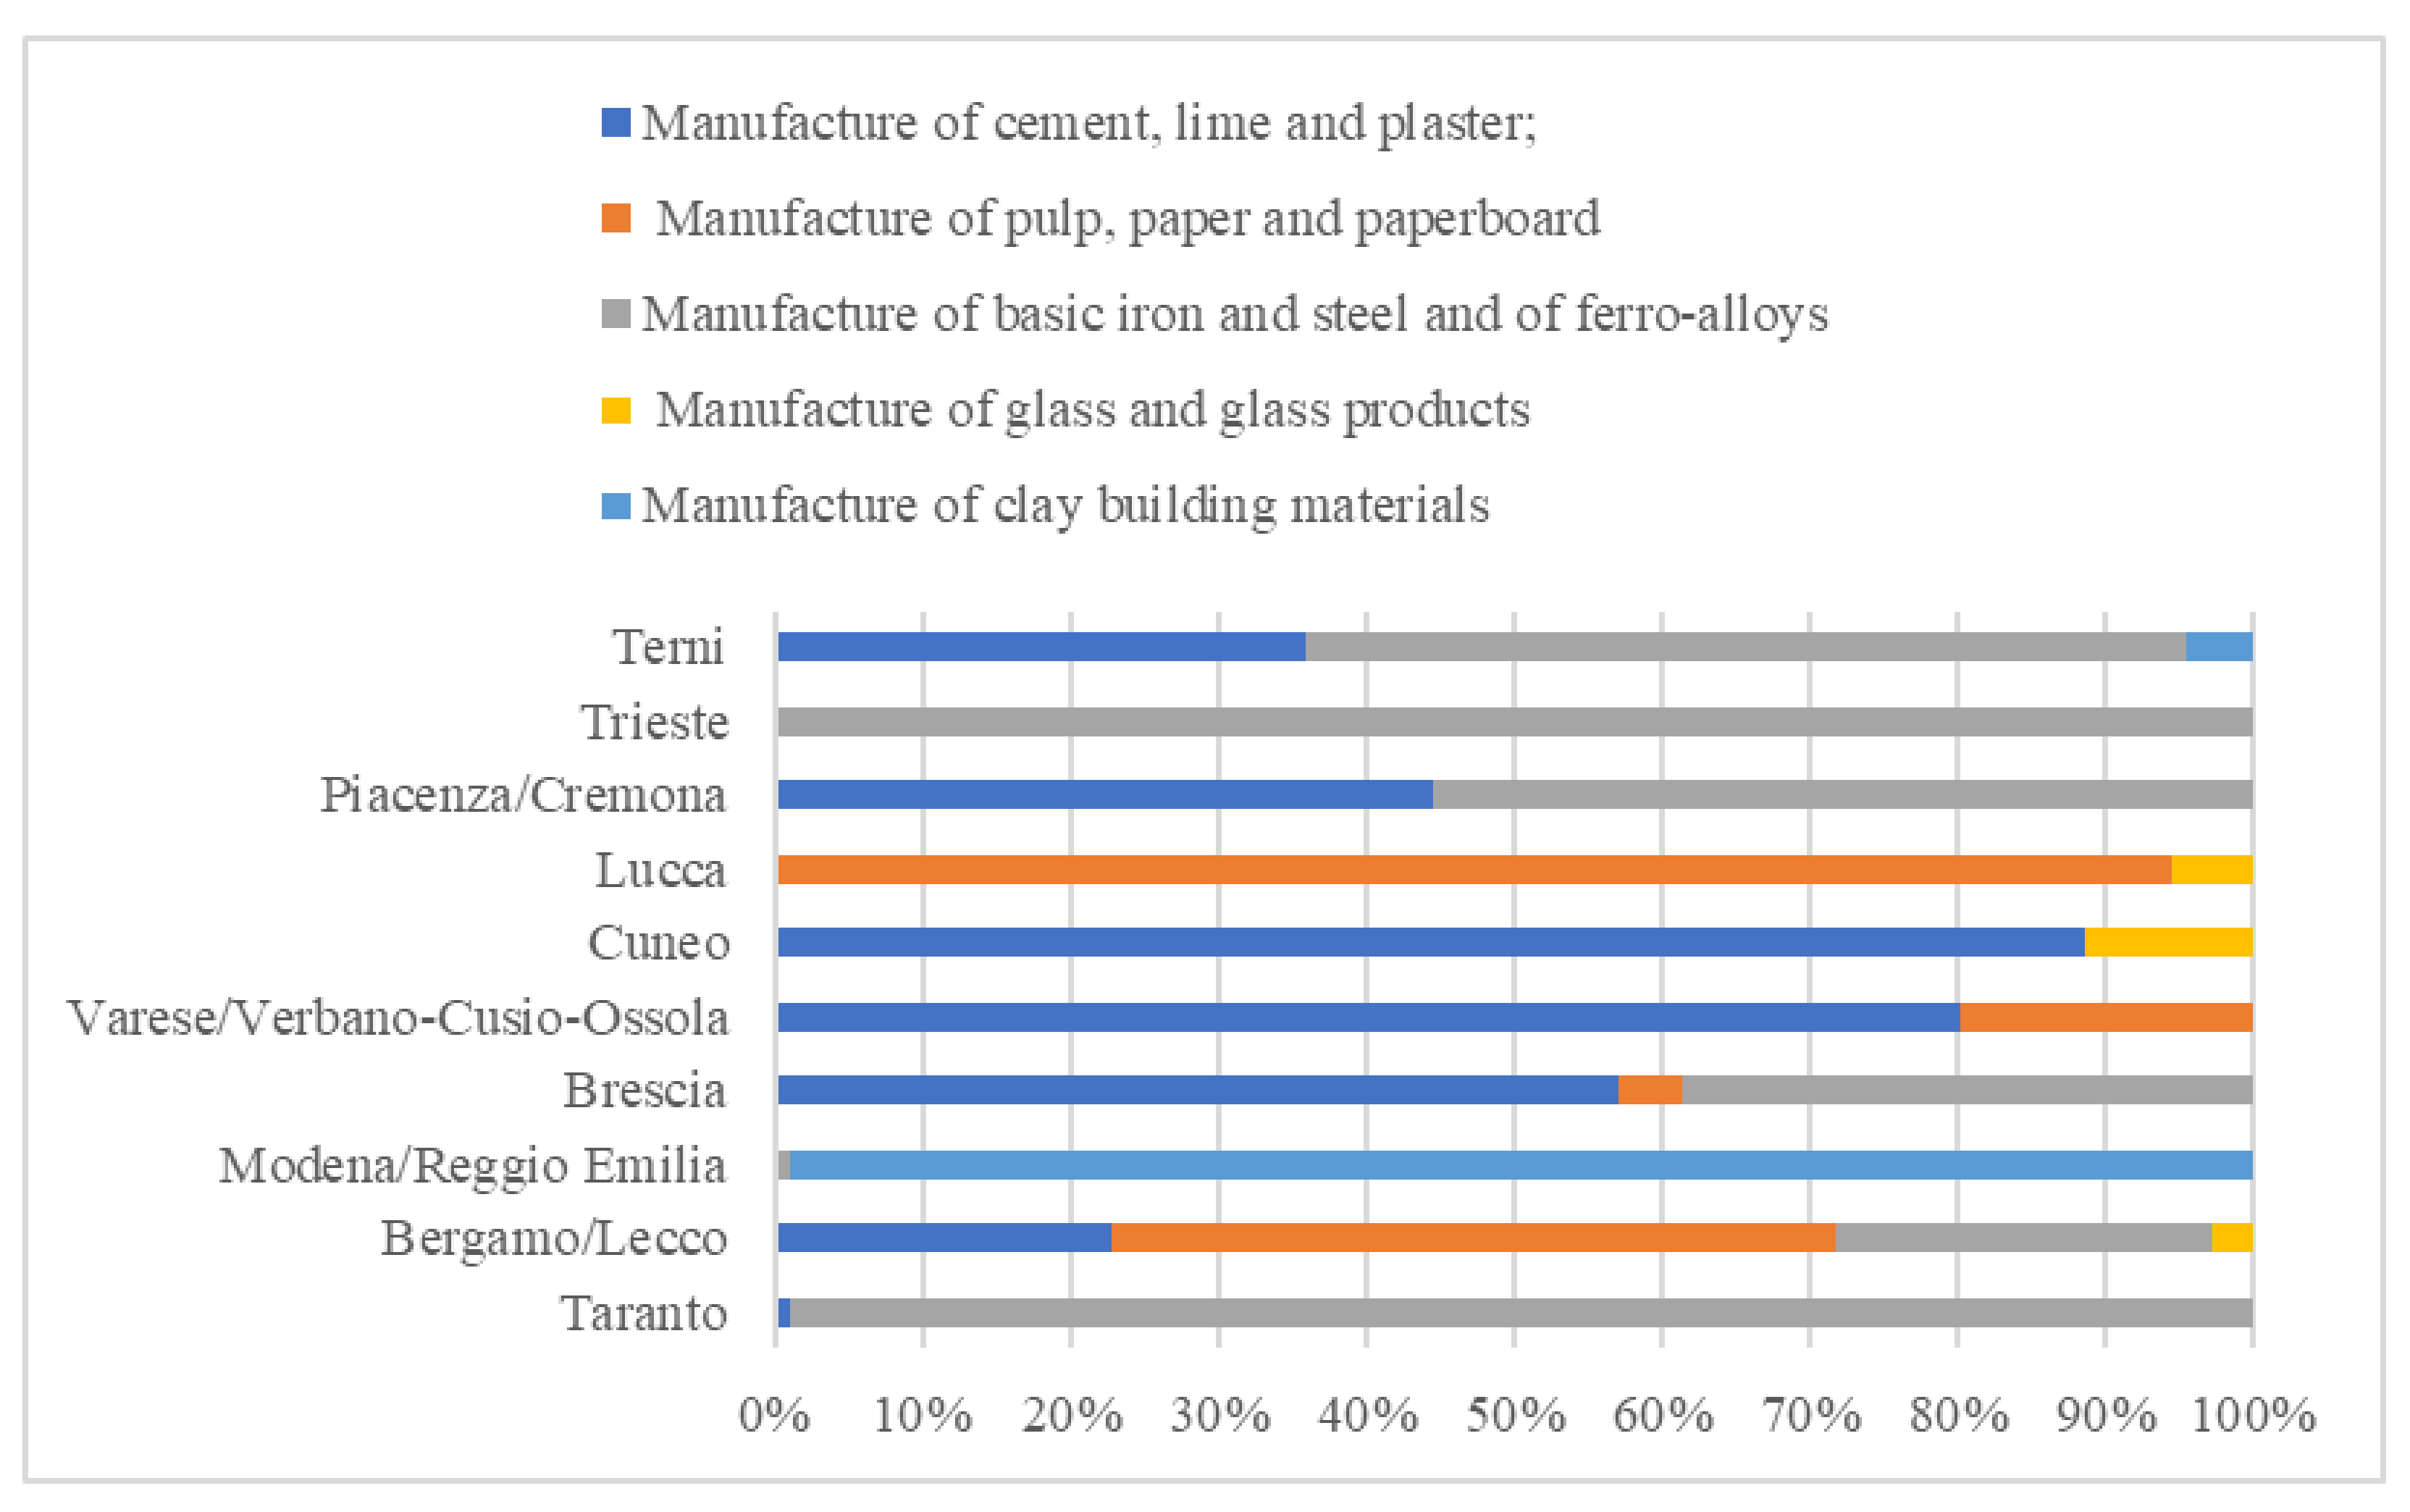
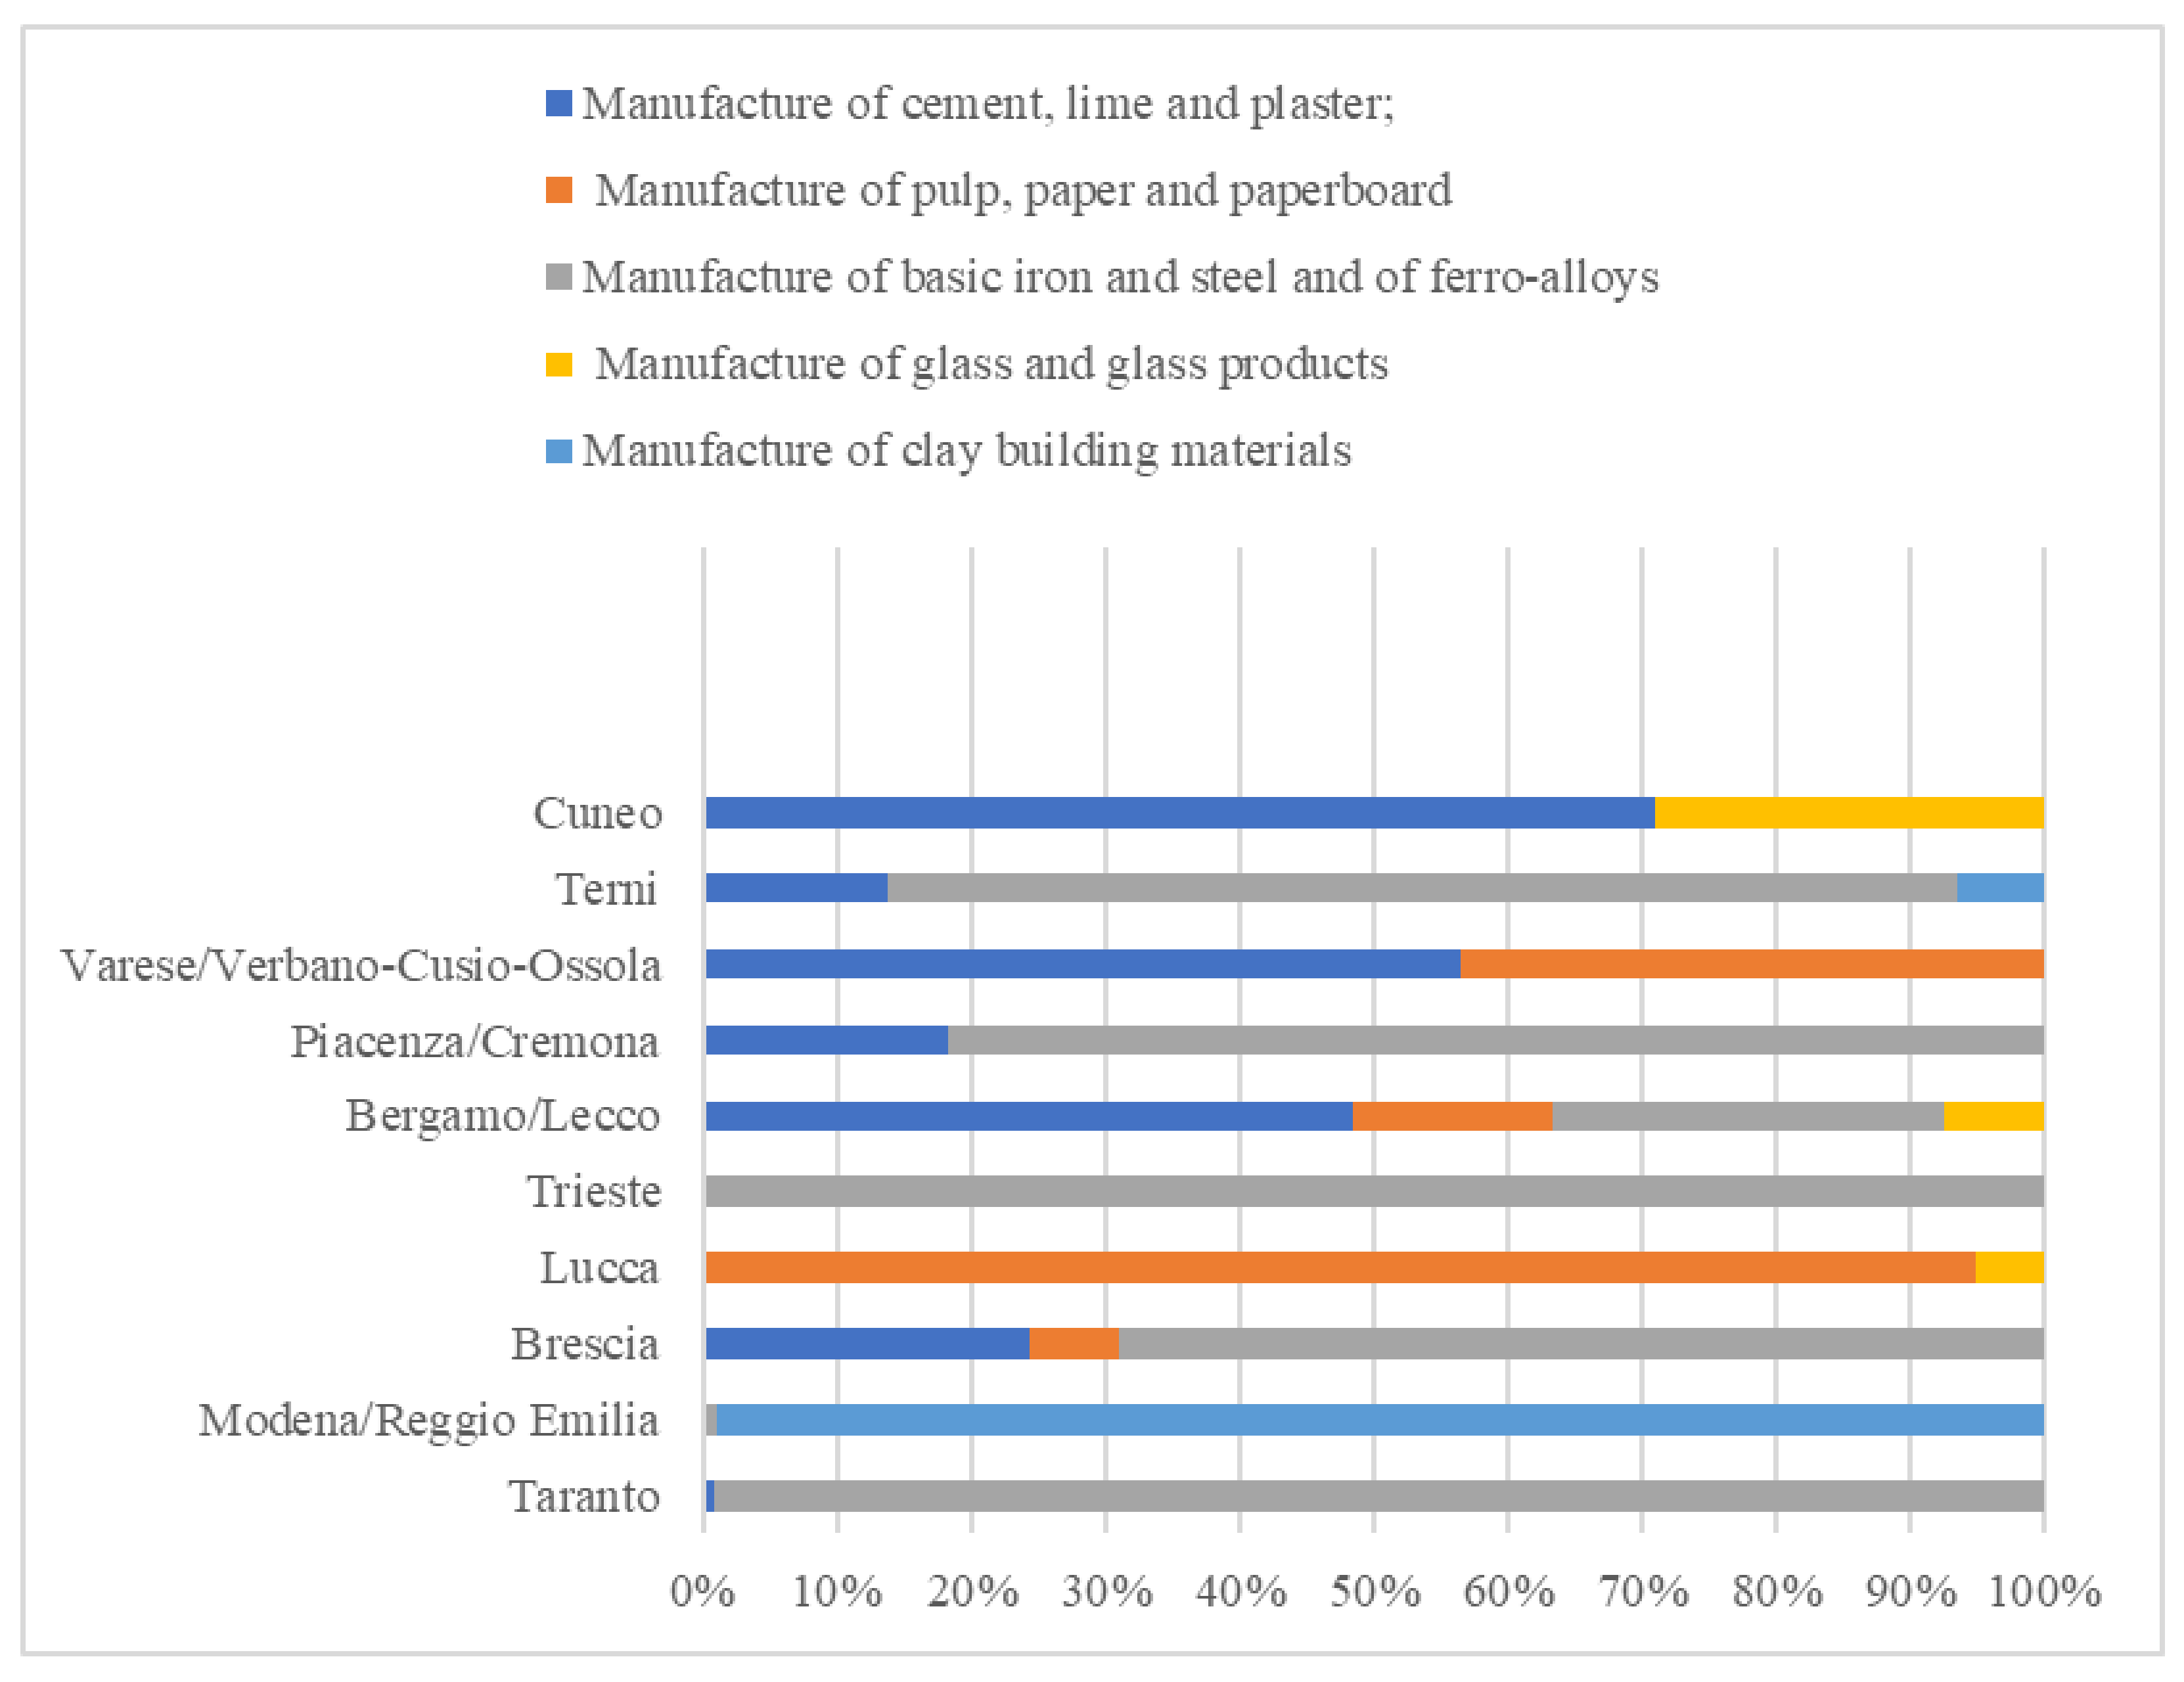
Table 11 shows the ranking of the top greenhouse gas emitters and thermal consumption emitters (the ranking is shown for the top greenhouse gas emitters); only 10 of the 13 clusters for the top emitters are included after removing single large emitters’ installations (Perugia, Roma, and Caserta areas with cement installations). In more detail, Figure 8 and Figure 9 show the industrial sectors’ share of greenhouse gas emissions and thermal energy consumption, respectively, thus introducing some criteria for the definition of industrial cluster archetypes.
Taranto, Brescia, Piacenza, Trieste, and Terni are characterized by a large contribution of the basic iron, steel, and ferro-alloy sector. In particular, the cases of Taranto and Trieste can also integrate ports in the cluster concept as a possible end-user or infrastructure for the supply of energy commodities, as addressed in the work by Taccani et al. [62] In general, including ports in the industrial cluster investigation can be of high value from the perspective of implementing the TEN-T strategy, with ports playing a major role in low-carbon and green fuel logistics (notably, Taranto, Trieste, Livorno, and Ravenna are among the most important core ports in Italy and EU strategy, and clusters can be integrated in Taranto and Trieste, in addition to Lucca and Modena) [63].
Clusters of Lucca and Bergamo feature a high contribution to the paper sector. The cement sector is quite uniformly distributed in the territory, and cement installations contribute to the definition of clusters given the high greenhouse gas emission and thermal energy consumption.
The cluster of Modena/Reggio Emilia features 66 installations belonging almost entirely to ceramic production and accounting for more than 25 PJ of thermal consumption.
Figure 8 and Figure 9 differ in their ranking position, given the fact the energy mix is different and sectors with high pet coke consumption (i.e., cement) rank higher in greenhouse gas emission, even if the total thermal energy consumption is lower than that of other sectors that mostly rely on natural gas (i.e., ceramic sector, glass, and paper).
The introduction of the taxonomy, the consequential definition of clusters, and the assessment of their relevance in terms of energy consumption, energy mix, and greenhouse gas emissions can help to design decarbonization options by considering clusters, rather than single industrial sectors, as an effective approach at either technical or policy-making levels. Table 12 provides some examples that link cluster definition with decarbonization options, also considering possible outcomes at technical and policy levels. The introduced taxonomy is useful for the definition of clusters, and may complement other higher-level definitions, such as that introduced by the World Economic Forum [20,64].

6. Conclusions, Limitation of the Study and Final Remarks

This work presented the first generic methodology to characterize industrial clusters in terms of energy consumption and emissions, starting mostly from public databases and data available in the literature, when specific reports or works about industrial areas are not available. The characterization and the geolocation of the clusters also allowed the definition of a taxonomy of the most energy-intensive industrial clusters in a country. Hence, the work provides a contribution to the improvement in the representation of the industry sector in energy models, where the sector is typically represented as a single sector or group of sub-sectors with no links between plants having similar characteristics in terms of energy consumption, the quantity of emissions, or location. In particular, the method was based on the availability of emissions data in the E-PRTR database and on the free allowances allocated to single plants available in the European Commission deliberations for the ETS system. By crossing these data with the specific energy consumption of industrial sectors from the literature and geolocating the plants in a GIS system, it was possible to derive the consumption and emissions of the single plants and, finally, of the analyzed and identified industrial clusters. The analysis was applied to the Italian industry but can be easily generalized to any European country, provided that a minimum amount of information, as discussed in the study, is available. In the Italian industry context, selected clusters are presented in different areas of the country, each with peculiar characteristics. A taxonomy linked to the attributes of proximity, thermal energy consumption, electricity consumption, and greenhouse gas emissions was presented and allows the identification of different types of clusters in the region. The results for the first 10 clusters show that the most interesting clusters in Italy are mainly located, as expected, in the North of Italy (8/10), with one in Central Italy and one in South Italy. The characteristics of each cluster in terms of thermal and electricity consumption, type of final energy, and quantity of carbon dioxide emissions can be deployed to customize decarbonization policies for each cluster and in synergy with the policy of the territory, considering possible exchange with the residential and transport sectors, in addition to political and socio-economic dimensions of the area.
The main limitations of the work concern the less-than-total coverage of the industrial ETS sectors. In particular, the analysis currently does not include industrial stationary installations, as follows: the production of bulk chemicals, and the production of hydrogen and synthesis gas (sectors 42 and 43 in the ETS system), which amounted to around 3.6 Mt CO2-eq in 2019, and accounted for 5% and 1.1%, respectively, of all the verified emissions from stationary industrial installation in Italy; the refining of mineral oil (ETS sect. 21); the production or processing of non-ferrous metals (ETS sect. 28); secondary aluminum; the manufacture of mineral wool (ETS sect. 33); and other activity opted-in under Art. 24 (ETS sect. 99). The study also does not include the combustion of fuels in the different industrial sectors because it was not straightforward to assign the industrial sector to these sub-installations. Another limitation concerns the fact that a unique benchmark for each plant was assigned, whereas the reality is more complex because the allocation of the free allowances is based on a calculation at the sub-installation level according to the EU documentation. Then, a more systematic comparison between the results and the national energy balance should be included; in fact, to date, the comparison was made only for the iron and steel sector because this is directly comparable with the ETS sector definition. Furthermore, a link between the bottom-up approach proposed here, and the more general top-down approach based on the national energy balance, is fundamental for future representations of the sector including clusters.
For future works, the authors propose first to include all the ETS sectors in the analysis, including the stationary combustion plants that belong to different sectors, such as the food sector (which, in some countries, is very relevant in terms of energy consumption and carbon dioxide emissions) in order to define some further possible symbiosis and industrial decarbonization options. Secondly, the authors intend to apply the methodology to other European countries to further validate the work and to improve the attributes that are useful for defining different kinds of clusters. The authors also propose including a systematic comparison between the results and the data available in the World Energy Balance in order to strengthen the link between the more general approach of modeling and the new framework for industrial clustering and the taxonomy proposed in his work. Moreover, the GIS analysis should be crossed with existing and planned infrastructure with a particular focus on ports, energy networks, and availability of renewable resources; this, again, should allow a best definition of the attributes for decarbonization. Finally, a deep review should be carried out and recommendations for policies linked to decarbonization of clusters should be provided.

Author Contributions

S.S.: Conceptualization, Data curation, Methodology, Formal analysis, Software, Writing—original draft, Visualization. S.G.: Conceptualization, Formal analysis, Supervision, Writing—review and editing. P.L.: Supervision, Conceptualization, Methodology, Formal Analysis, Software, Writing—original draft, Visualization, Resources. All authors have read and agreed to the published version of the manuscript.

Funding

This research received no external funding.

Conflicts of Interest

The authors declare no conflict of interest.

Abbreviations

AIDAAnalisi Informatizzata delle Aziende ItalianeGCAMGlobal Change Assessment Model
BFBlast FurnaceIAMIntegrated Assessment Model
BOFBasic Oxygen FurnaceIDRICIndustrial Decarbonisation Research and Innovation Centre
CCCClimate Change CommitteeIMAGEIntegrated Model to Assess the Global Environment
CCSCarbon Capture and StorageIEAInternational Energy Agency
CCUSCarbon Capture Utilization and StorageNACENomenclature of Economic Activities
E3M3Cambridge Econometric ModelNEMSNational Energy Model (US)
EAFElectric Arc FurnaceNRRPNational Recovery and Resilience Plan (Italy)
E-PRTREuropean Pollutant Release and Transfer RegisterPPAPurchase Power Agreement
EUEuropean UnionTIMESThe Integrated MARKAL-EFOM System
ETSEuropean Emission Trading Scheme WEOWorld Economic Forum
GISGeographical Information SystemWEMWorld Energy Model (IEA)

Appendix A

Table A1. Review of the industry sector in energy models. None of them includes the cluster representation.
ModelMain ReferenceIndustry Representation
WEMIEA World Energy Outlooknon-ferrous metals (aluminum), iron and steel, chemical and petrochemical, non-metallic minerals, pulp and paper, and other industry.
IMAGE[65,66]Multi-sector carbon neutrality; industry aggregated
hard-to abate sectors representation included circular economy
TIMES[67,68]focuses on advancements in energy demand sectors; best available technologies in industry included
focuses on decarbonization options for UK industry
UCLModel overview and structure
NEMSNEMS Industrial Demand Modulerepresentation of Hard to Abate Sectors and non-energy-intensive sectors. Horizontal and vertical processes are included
E3M3[69]Iron and Steel representation
G-CAM[70]Multi-sectoral analysis
MUSE[71]non-ferrous metals (aluminum), iron and steel, chemical and petrochemical, non-metallic minerals (cement), pulp and paper, and other industry

References

  1. Baldassarre, B.; Schepers, M.; Bocken, N.; Cuppen, E.; Korevaar, G.; Calabretta, G. Industrial Symbiosis: Towards a design process for eco-industrial clusters by integrating Circular Economy and Industrial Ecology perspectives. J. Clean. Prod. 2019, 216, 446–460. [Google Scholar] [CrossRef]
  2. Devine-Wright, P. Decarbonisation of industrial clusters: A place-based research agenda. Energy Res. Soc. Sci. 2022, 91, 102725. [Google Scholar] [CrossRef]
  3. Upham, D.P.; Sovacool, P.B.; Ghosh, D.B. Just transitions for industrial decarbonisation: A framework for innovation, participation, and justice. Renew. Sustain. Energy Rev. 2022, 167, 112699. [Google Scholar] [CrossRef]
  4. Gough, C.; Mander, S. CCS industrial clusters: Building a social license to operate. Int. J. Greenh. Gas Control 2022, 119, 103713. [Google Scholar] [CrossRef]
  5. Samadi, S.; Lechtenböhmer, S.; Schneider, C.; Arnold, K.; Fischedick, M.; Schüwer, D.; Pastowski, A. Decarbonization Pathways for the Industrial Cluster of the Port of Rotterdam; Wuppertal Institute for Climate, Environment and Energy: Wuppertal, Germany, 2016. [Google Scholar]
  6. Herraiz, L.; Lucquiaud, M.; Chalmers, H.; Gibbins, J. Sequential Combustion in Steam Methane Reformers for Hydrogen and Power Production with CCUS in Decarbonized Industrial Clusters. Front. Energy Res. 2020, 8, 180. [Google Scholar] [CrossRef]
  7. Edwards, R.L.; Font-Palma, C.; Howe, J. The status of hydrogen technologies in the UK: A multi-disciplinary review. Sustain. Energy Technol. Assess. 2021, 43, 100901. [Google Scholar] [CrossRef]
  8. Calvillo, C.; Race, J.; Chang, E.; Turner, K.; Katris, A. Characterisation of UK Industrial Clusters and Techno-Economic Cost Assessment for Carbon Dioxide Transport and Storage Implementation. Int. J. Greenh. Gas Control 2022, 119, 103695. [Google Scholar] [CrossRef]
  9. Demartini, M.; Tonelli, F.; Govindan, K. An investigation into modelling approaches for industrial symbiosis: A literature review and research agenda. Clean. Logist. Supply Chain. 2022, 3, 100020. [Google Scholar] [CrossRef]
  10. Huang, L.; Zhen, L.; Yin, L. Waste material recycling and exchanging decisions for industrial symbiosis network optimization. J. Clean. Prod. 2020, 276, 124073. [Google Scholar] [CrossRef]
  11. Mantese, G.C.; Amaral, D.C. Comparison of industrial symbiosis indicators through agent-based modeling. J. Clean. Prod. 2017, 140, 1652–1671. [Google Scholar] [CrossRef]
  12. Yazan, D.M.; Romano, V.A.; Albino, V. The design of industrial symbiosis: An input-output approach. J. Clean. Prod. 2016, 129, 537–547. [Google Scholar] [CrossRef]
  13. Gonela, V.; Zhang, J. Design of the optimal industrial symbiosis system to improve bioethanol production. J. Clean. Prod. 2014, 64, 513–534. [Google Scholar] [CrossRef]
  14. Galvan-Cara, A.L.; Graells, M.; Espuña, A. Application of Industrial Symbiosis principles to the management of utility networks. Appl. Energy 2022, 305, 117734. [Google Scholar] [CrossRef]
  15. Lybæk, R.; Christensen, T.B.; Thomsen, T.P. Enhancing policies for deployment of Industrial symbiosis—What are the obstacles, drivers and future way forward? J. Clean. Prod. 2021, 280, 124351. [Google Scholar] [CrossRef]
  16. IDRIC. The Industrial Decarbonisation Research and Innovation Centre (IDRIC). Available online: https://idric.org/the-industrial-decarbonisation-challenge/ (accessed on 27 September 2022).
  17. Climate Change Committee. Deep-Decarbonisation Pathways for UK Industry (Element Energy). Available online: https://www.theccc.org.uk/publication/deep-decarbonisation-pathways-for-uk-industry-element-energy/ (accessed on 27 September 2022).
  18. UK Government. The Grand Challenge Missions. Available online: https://www.gov.uk/government/publications/industrial-strategy-the-grand-challenges/missions (accessed on 27 September 2022).
  19. UK Government. Industrial Decarbonisation Strategy; UK Government: London, UK, 2021.
  20. World Economic Forum. Industrial Clusters: The Net-Zero Challenge. Available online: https://initiatives.weforum.org/transitioning-industrial-clusters (accessed on 31 July 2022).
  21. IEA. World Energy Model. Available online: https://www.iea.org/reports/global-energy-and-climate-model (accessed on 2 November 2022).
  22. ENEA. RAPPORTO ANNUALE EFFICIENZA ENERGETICA 2021. Available online: www.efficienzaenergetica.enea.it (accessed on 1 August 2022).
  23. IEA. World Energy Balance. 2022. Available online: https://www.iea.org/data-and-statistics/data-product/world-energy-balances#energy-balances (accessed on 1 August 2022).
  24. ISPRA—Stituto Superiore per la Protezione e la Ricerca Ambientale. L’andamento delle emissioni nazionali di gas serra L’andamento delle emissioni nazionali di gas serra ISPRA. Available online: https://www.isprambiente.gov.it/files2020/eventi/gas-serra/romano.pdf (accessed on 30 June 2022).
  25. Pivetta, D.; Dall’armi, C.; Taccani, R. Multi-Objective Optimization of a Hydrogen Hub for the Decarbonization of a Port Industrial Area. J. Mar. Sci. Eng. 2022, 10, 231. [Google Scholar] [CrossRef]
  26. Italian Government. National Recovery and Resilience Plan. Available online: https://www.governo.it/it/node/17027 (accessed on 30 September 2022).
  27. European Commission. EU Emissions Trading System (EU ETS). Available online: https://climate.ec.europa.eu/eu-action/eu-emissions-trading-system-eu-ets_en#ecl-inpage-690 (accessed on 27 September 2022).
  28. NACE rev.2. Available online: https://nacev2.com/en (accessed on 1 August 2022).
  29. AIDA—Bureau Van Dijk. Available online: https://www.bvdinfo.com/en-gb/our-products/data/national/aida (accessed on 31 July 2022).
  30. Ministero Della Transizione Ecologica. EU ETS—Italia. Available online: https://www.ets.minambiente.it/ (accessed on 15 August 2022).
  31. Ministero Della Transizione Ecologica. Delibere EU ETS—Italia. Available online: https://www.ets.minambiente.it/RicercaDelibereAP (accessed on 15 May 2022).
  32. European Union. Direttiva 2003/87/CE del Parlamento Europeo e del Consiglio, del 13 Ottobre 2003—Document 32003L0087. Available online: https://eur-lex.europa.eu/legal-content/it/TXT/?uri=CELEX:32003L0087 (accessed on 10 August 2022).
  33. European Commission. EU ETS Free Allocation to Industrial Installation. Available online: https://climate.ec.europa.eu/eu-action/eu-emissions-trading-system-eu-ets/free-allocation/allocation-industrial-installations_en (accessed on 10 August 2022).
  34. European Commission. Update of Benchmark Values for the Years 2021–2025 of Phase 4 of the EU ETS Benchmark Curves and Keyparameters. Available online: https://climate.ec.europa.eu/system/files/2021-10/policy_ets_allowances_bm_curve_factsheets_en.pdf (accessed on 15 August 2022).
  35. European Union. EUR-Lex Commission Decision of 29 June 2021. Document 32021D0728. Available online: https://eur-lex.europa.eu/legal-content/EN/TXT/?uri=uriserv%3AOJ.C_.2021.302.01.0001.01.ENG&toc=OJ%3AC%3A2021%3A302%3AFULL (accessed on 30 May 2022).
  36. European Environment Agency. The European Pollutant Release and Transfer Register (E-PRTR), Member States Reporting under Article 7 of Regulation (EC) No 166/2006. Available online: https://www.eea.europa.eu/data-and-maps/data/member-states-reporting-art-7-under-the-european-pollutant-release-and-transfer-register-e-prtr-regulation-22 (accessed on 1 August 2022).
  37. Glass Alliance Europe. Available online: https://www.glassallianceeurope.eu/en/homepage (accessed on 10 December 2021).
  38. Assovetro. Rapporto di Sostenibilità 2020. 2020. Available online: https://assovetro.it/rapporto-di-sostenibilita/ (accessed on 1 July 2021).
  39. Glass for Europe. 2050 Il Vetro Piano Nell’europa a Emissioni Zero. Innescare un Ciclo Virtuoso di Decarbonizzazione; Glass for Europe: Bruxelles, Brussels, 2020. [Google Scholar]
  40. Institute for European Studies. T. Industrial Value Chain: A Bridge towards a Carbon Neutral Europe Energy Intensive Industries’ Contribution to Europe’s Long-term Climate Strategy Content. Available online: https://www.glassallianceeurope.eu/images/para/industrial-value-chain-for-a-carbon-neutral-europe-sept-2018_file.pdf (accessed on 1 June 2022).
  41. European Commission. EU Emissions Trading System (ETS) Data Viewer. 2022. Available online: https://www.eea.europa.eu/data-and-maps/dashboards/emissions-trading-viewer-1 (accessed on 23 August 2022).
  42. IEA. IEA Data Tools. Available online: https://www.iea.org/data-and-statistics/data-tools (accessed on 15 August 2022).
  43. European Union. Direttiva (UE) 2018/410 del Parlamento Europeo e del Consiglio, del 14 marzo 2018, che Modifica la Direttiva 2003/87/CE—Document 32018L0410. Available online: https://eur-lex.europa.eu/legal-content/IT/TXT/?uri=CELEX%3A32018L0410 (accessed on 10 August 2022).
  44. Ministero Della Transizione Ecologica. Ricerca Impianti Autorizzati. Available online: https://www.ets.minambiente.it/RicercaIA (accessed on 28 July 2022).
  45. Shelby, J.E. Introduction to Glass Science and Technology, 2nd ed.; The Royal Society of Chemistry: Cambridge, UK, 2005. [Google Scholar]
  46. Zier, M.; Stenzel, P.; Kotzur, L.; Stolten, D. A review of decarbonization options for the glass industry. Energy Convers. Manag. X 2021, 10, 100083. [Google Scholar] [CrossRef]
  47. European Environment Agency. E-PRTR Industrial Reporting Database v4—March 2021. 2021. Available online: https://www.eea.europa.eu/data-and-maps/data/industrial-reporting-under-the-industrial-6 (accessed on 28 July 2022).
  48. EuLA. Competitive and Efficient Lime Industry-Cornerstone for a Sustainable Europe. 2019. Available online: www.eula.eu (accessed on 1 August 2022).
  49. Lerede, D.; Bustreo, C.; Gracceva, F.; Saccone, M.; Savoldi, L. Techno-economic and environmental characterization of industrial technologies for transparent bottom-up energy modeling. Renew. Sustain. Energy Rev. 2021, 140, 110742. [Google Scholar] [CrossRef]
  50. Ecofys, F.; Oko-Institut, E.V. Methodology for Free Allocation of Emission Allowances in the EU ETS Post 2021 Sector Report for the Lime Industry. 2009. Available online: https://climate.ec.europa.eu/system/files/2016-11/bm_study-lime_en.pdf (accessed on 31 May 2022).
  51. MISE Ministero dello Sviluppo Economico Italiano. Comitato Nazionale per la Gestione Della Direttiva 2003/87/CE e per il Supporto Nella Gestione Delle Attività di Progetto del Protocollo di Kyoto. Available online: https://www.mise.gov.it/images/stories/documenti/Deliberazione_12_2012_art27_Ufficiale_con_allegati.pdf (accessed on 28 September 2022).
  52. Branchini, L.; Bignozzi, M.C.; Ferrari, B.; Mazzanti, B.; Ottaviano, S.; Salvio, M.; Toro, C.; Martini, F.; Canetti, A. Cogeneration supporting the energy transition in the italian ceramic tile industry. Sustainability 2021, 13, 4006. [Google Scholar] [CrossRef]
  53. Ecofys, F.; Oko-Institut, E.V. Methodology for Free Allocation of Emission Allowances in the EU ETS Post 2021 Sector Report for the Ceramics Industry. Available online: https://climate.ec.europa.eu/system/files/2016-11/bm_study-ceramics_en.pdf (accessed on 5 June 2022).
  54. Federbeton. Rapporto di Sostenibilità Federbeton 2020. Available online: https://blog.federbeton.it/rapporto-di-sostenibilita-federbeton-2020-il-ruolo-della-filiera-per-la-decarbonizzazione/ (accessed on 1 July 2022).
  55. Global Cement and Concrete Association. Getting the Numbers Right, GCCA in NumbeRs. Available online: https://gccassociation.org/sustainability-innovation/gnr-gcca-in-numbers/ (accessed on 28 September 2022).
  56. CEPI. Key Statistics 2020. European Pulp & Paper Industry. 2021. Available online: https://library.cepi.org/ (accessed on 1 May 2022).
  57. IEA. Data Statistics. 2022. Available online: https://www.iea.org/statistics/ (accessed on 28 September 2022).
  58. Di Cura, A.A.; Bianchi, D. Rapporto ambientale dell’industria cartaria italiana. 2020. Available online: www.confindustria.it (accessed on 5 July 2022).
  59. World Steel Association. World Steel in Figures. 2022. Available online: https://worldsteel.org/steel-topics/statistics/world-steel-in-figures-2022/ (accessed on 1 August 2022).
  60. Federacciai. Federacciai Rapporto di Sostenibilità. 2021. Available online: https://federacciai.it/rapporto-di-sostenibilita-2021/ (accessed on 18 July 2022).
  61. Eurostat. Eurostat Data Browser—Gas Prices for Non-Households Consumer. Available online: https://ec.europa.eu/eurostat/databrowser/view/nrg_pc_203/default/table?lang=en (accessed on 29 September 2022).
  62. European Commission. TENtec Interactive Map Viewer. Available online: https://ec.europa.eu/transport/infrastructure/tentec/tentec-portal/map/maps.html (accessed on 15 September 2022).
  63. World Economic Forum and Accenture. Industrial Clusters: Working Together to Achieve Net Zero. 2021. Available online: https://www.accenture.com/_acnmedia/PDF-147/Accenture-WEF-Industrial-Clusters-Report.pdf (accessed on 1 April 2022).
  64. Federacciai. Assemblea Annuale 2021. 2021. Available online: https://federacciai.it/atti-assemblea-2021/ (accessed on 29 September 2022).
  65. Chen, H.-H.; Hof, A.F.; Daioglou, V.; de Boer, H.S.; Edelenbosch, O.Y.; van den Berg, M.; van der Wijst, K.-I.; van Vuuren, D.P. Using Decomposition Analysis to Determine the Main Contributing Factors to Carbon Neutrality across Sectors. Energies 2022, 15, 132. [Google Scholar] [CrossRef]
  66. Sharmina, M.; Edelenbosch, O.Y.; Wilson, C.; Freeman, R.; Gernaat, D.E.H.J.; Gilbert, P.; Larkin, A.; Littleton, E.W.; Traut, M.; van Vuuren, D.P.; et al. Decarbonising the critical sectors of aviation, shipping, road freight and industry to limit warming to 1.5–2 °C. Clim. Policy 2021, 21, 455–474. [Google Scholar] [CrossRef]
  67. Napp, T.A.; Few, S.; Sood, A.; Bernie, D.; Hawkes, A.; Gambhir, A. The role of advanced demand-sector technologies and energy demand reduction in achieving ambitious carbon budgets. Appl. Energy 2019, 238, 351–367. [Google Scholar] [CrossRef]
  68. Fais, B.; Sabio, N.; Strachan, N. The critical role of the industrial sector in reaching long-term emission reduction, energy efficiency and renewable targets. Appl. Energy 2016, 162, 699–712. [Google Scholar] [CrossRef] [Green Version]
  69. Bachner, G.; Mayer, J.; Steininger, K.W.; Anger-Kraavi, A.; Smith, A.; Barker, T.S. Uncertainties in macroeconomic assessments of low-carbon transition pathways—The case of the European iron and steel industry. Ecol. Econ. 2020, 172, 106631. [Google Scholar] [CrossRef]
  70. Peng, W.; Iyer, G.; Binsted, M.; Marlon, J.; Clarke, L.; Edmonds, J.A.; Victor, D.G. The surprisingly inexpensive cost of state-driven emission control strategies. Nat. Clim. Chang. 2021, 11, 738–745. [Google Scholar] [CrossRef]
  71. Moya, D.; Budinis, S.; Giarola, S.; Hawkes, A. Agent-based scenarios comparison for assessing fuel-switching investment in long-term energy transitions of the India’s industry sector. Appl. Energy 2020, 274, 115295. [Google Scholar] [CrossRef]
Figure 1. Visual representation of the methodology for the energy and emissions characterization of the industrial plants included in the analysis.
Energies 15 08586 g001
Figure 2. Map of industrial installations in Italy according to selected economic activity classification.
Energies 15 08586 g002
Figure 3. Cluster of industrial installations in Italy according to installation density (minimum installations per cluster is 3).
Energies 15 08586 g003
Figure 4. Clusters of industrial installations in Italy according to installation density (minimum installations per cluster is 5).
Energies 15 08586 g004
Figure 5. Clusters of industrial greenhouse gas emitters representing large and medium emitters.
Energies 15 08586 g005
Figure 6. Clusters of industrial installations based on thermal energy consumption.
Energies 15 08586 g006
Figure 7. Clusters of industrial installations based on electricity consumption.
Energies 15 08586 g007
Figure 8. Share of different industrial sectors to greenhouse gas emissions in top emitters’ clusters (top emitters increase from top to bottom).
Energies 15 08586 g008
Figure 9. Share of different industrial sectors to thermal consumption in top thermal energy consumption clusters (top consumers increase from top to bottom).
Energies 15 08586 g009
Table 1. Verified emissions of ETS sectors in Italy as for the 2021.
Main Activity Sector NameMt CO2-eq
Combustion of fuels77.6
All stationary installations131.4
Refining of mineral oil15.5
All industrial installations (excl. combustion)53.9
Metal ore roasting or sintering0.0
Production of pig iron or steel8.6
Production or processing of ferrous metals1.1
Production of secondary aluminum0.1
Production or processing of non-ferrous metals0.5
Production of cement clinker12.4
Production of lime, or calcination of dolomite/magnesite2.2
Manufacture of glass2.8
Manufacture of ceramics2.5
Manufacture of mineral wool0.1
Production or processing of gypsum or plasterboard0.1
Production of pulp0.6
Production of paper or cardboard3.5
Production of bulk chemicals3.0
Production of hydrogen and synthesis gas0.5
Other activity opted-in under Art. 240.4
Table 2. NACE Classification of selected industrial activities.
Industrial SectorsNACE DivisionNACE GroupNACE Class
Production of pig iron or steel24—Manufacture of basic metals24.1—Manufacture of basic iron and steel and of ferro-alloys24.10—Manufacture of basic iron and steel and of ferro-alloys
Production of cement clinker23—Manufacture of other non-metallic mineral products23.5—Manufacture of cement, lime and plaster23.51—Manufacture of cement
Production of lime, or calcination of dolomite/magnesite23—Manufacture of other non-metallic mineral products23.5—Manufacture of cement, lime and plaster23.52—Manufacture of lime and plaster
Manufacture of glass23—Manufacture of other non-metallic mineral products23.1—Manufacture of glass and glass products23.11—Manufacture of flat glass
23.13—Manufacture of hollow glass
Manufacture of ceramics23—Manufacture of other non-metallic mineral products23.3—Manufacture of clay building materials23.31—Manufacture of ceramic tiles and flags
23.32—Manufacture of bricks, tiles and construction products, in baked clay
Production of paper or cardboard17—Manufacture of paper and paper products17.1—Manufacture of pulp, paper and paperboard17.12—Manufacture of paper and paperboard
Table 3. Product benchmarks values as in EU Commission—Directorate General Climate Action, Update of benchmark values for the years 2021–2025 of phase 4 of the EU ETS—Benchmark curves and key parameters, updated final version issued on 12 October 2021.
NACE ClassProductProduct Benchmark
24.10—Manufacture of basic iron and steel and of ferro-alloysHot Metal1.288 t CO2-eq/t
Electric arc furnace (EAF)—carbon steel0.215 t CO2-eq/t
Electric arc furnace (EAF)—high alloy steel0.268 t CO2-eq/t
Iron casting0.282 t CO2-eq/t
23.51—Manufacture of cementGrey cement clinker0.693 t CO2-eq/t
23.52—Manufacture of lime and plasterLime0.725 t CO2-eq/t
Plaster0.047 t CO2-eq/t
23.11—Manufacture of flat glassFloat Glass0.399 t CO2-eq/t
23.13—Manufacture of hollow glassBottles and jars of colorless glass0.29 t CO2-eq/t
Bottles and jars of colored glass0.237 t CO2-eq/t
23.31—Manufacture of ceramic tiles and flagsSpray dried powder0.058 t CO2-eq/t
23.32—Manufacture of bricks, tiles and construction products, in baked clayFacing bricks0.106 t CO2-eq/t
17.12—Manufacture of paper and paperboardNewsprint0.226 t CO2-eq/(air-dried-t);
Uncoated and coated fine paper0.242 t CO2-eq/(air-dried-t);
Tissue0.254 t CO2-eq/(air-dried)t);
Uncoated carton board0.254 t CO2-eq/(air-dried-t);
Coated carton board0.254 t CO2-eq/(air-dried-t);
Fallback approach—1Heat47.3 t CO2-eq/TJ
Fallback approach—2Fuel42.6 t CO2-eq/TJ
Table 4. Summary data for glass production plants in Italy under EU ETS.
Companies in NACE Classification—23.1—AIDA with revenues filter77
Companies in NACE Classification—23.11—AIDA with revenues filter5
Companies in NACE Classification—23.13—AIDA with revenues filter16
Plants in manufacture of glass (flat)—EU ETS8
Plants in manufacture of glass (hollow)—EU ETS40
Estimated freely allocated allowances in manufacture of glass (flat)—EU ETS (t CO2-eq/a), 2021601,587
Estimated freely allocated allowances in manufacture of glass (hollow)—EU ETS (t CO2-eq/a), 20211,259,865
Freely allocated allowances in manufacture of glass—ETS (t CO2-eq/a), 20211,929,632
Verified emissions in manufacture of glass—ETS (t CO2-eq/a), 20212,781,431
Thermal energy intensity (GJ/t of float glass)8.1
Thermal energy intensity (GJ/t of hollow glass)4.8
Electricity intensity (GJ/t of float glass)3.6
Thermal energy intensity (GJ/t of hollow glass)2.7
Carbon intensity (t CO2/t of float glass)0.54
Carbon intensity (t CO2/t of hollow glass)0.386
Table 5. Summary data for lime production plants in Italy under EU ETS.
Companies in NACE Classification—23.50—AIDA with revenues filter72
Companies in NACE Classification—23.52—AIDA with revenues filter35
Plants in production of lime, or calcination of dolomite/magnesite—EU ETS24
Estimated freely allocated allowances in production of lime, or calcination of dolomite/magnesite—EU ETS (t CO2-eq/a), 20211,410,576
Freely allocated allowances in production of lime, or calcination of dolomite/magnesite—EU ETS (t CO2-eq/a), 20211,678,561
Verified emissions in production of lime, or calcination of dolomite/magnesite—EU ETS (t CO2-eq/a), 20212,202,986
Thermal energy intensity (GJ/t of lime)4
Electricity intensity (GJ/t of lime)0.2
Carbon intensity (t CO2/t of lime)0.94
Table 6. Summary data for ceramics production plants in Italy under EU ETS.
Companies in NACE Classification—23.3 and 23.4—AIDA with filtering135
Companies in NACE Classification—23.31 and 23.32—AIDA with filtering106
Companies in NACE Classification—23.41, 23.42, 23.483, 23.44—AIDA with filtering26
Plants in manufacture of ceramics—EU ETS121
Estimated freely allocated allowances in manufacture of ceramics—EU ETS (t CO2-eq/a), 20211,409,666
Freely allocated allowances in manufacture of ceramics—EU ETS (t CO2-eq/a), 20211,538,785
Verified emissions in production of ceramics—EU ETS (t CO2-eq/a), 20212,491,187
Thermal energy intensity (GJ/t of ceramics)4.9
Electricity intensity (GJ/t of ceramics)0.73
Table 7. Summary data for cement production plants in Italy under EU ETS.
Companies in NACE Classification—23.50—AIDA with revenues filter46
Companies in NACE Classification—23.51—AIDA with revenues filter45
Plants in production of cement—EU ETS29
Estimated freely allocated allowances in production of cement—EU ETS (t CO2-eq/a), 20219,806,322
Freely allocated allowances in production of cement—EU ETS (t CO2-eq/a), 202110,083,701
Verified emissions in production of cement—EU ETS (t CO2-eq/a), 202112,422,813
Thermal energy intensity (GJ/t of cement)3
Electricity intensity (GJ/t of cement)0.44
Carbon intensity (t CO2/t of cement)0.74
Table 8. Summary data for paper production plants in Italy under EU ETS.
Companies in NACE Classification—17, 17.10, 17.12, 17.20, 17.21, 17.22, 17.23, 17.24, 17.29—AIDA with revenues filter697
Plants in production of paper and cardboard in Italy—EU ETS96
Estimated freely allocated allowances in paper or cardboard—EU ETS (t CO2-eq/a), 20212,105,535
Freely allocated allowances in production of paper and cardboard—EU ETS (t CO2-eq/a), 20212,204,457
Verified emissions in production of paper and cardboard—EU ETS (t CO2-eq/a), 20214,052,653
Thermal energy intensity (GJ/t of product)5.7
Electricity intensity (GJ/t of product)3.3
Carbon intensity (t CO2/t of product)0.44
Table 9. Summary data for iron and steel production plants in Italy under EU ETS.
Companies in NACE Classification—24.1 24.2 24.51 24.52 AIDA with revenue filter293
Plants in Iron and steel in Italy—EU ETS60
Estimated freely allocated allowances in iron and steel (excl. integrated iron and steel)—EU ETS (t CO2-eq/a), 202111,858,150
Freely allocated allowances in production of iron and steel EU ETS (t CO2-eq/a), 202110,500,000
Verified emissions in production of iron and steel—EU ETS (t CO2-eq/a), 202111,229,129
Specific fuel consumption BF-BOG (GJ/t steel)16.5
Thermal energy intensity BF-BOF (accounts for blast furnace and coke oven gas final energy consumption as in the IEA World Energy Balance) (GJ/t steel)7.3
Thermal energy intensity scrap-EAF and finishing processes (calculated from natural gas consumption from Federacciai annual report for Italian steel sector [) (GJ/t steel)3.6
Electricity intensity scrap-EAF and finishing processes (calculated from Federacciai annual report for Italian steel sector) (GJ/t steel)3.3
Table 10. Relevance of industrial clustering for energy consumption and emissions in industry.
Taxonomy AttributeAttribute ValueNumber of ClustersNumber of InstallationsTotal Thermal Energy Consumption (PJ) and Share in Industrial Thermal Energy Consumption (%)Total Electricity Consumption (PJ) and Share in Industrial Electricity Consumption (%)Total Greenhouse Gas Emissions (Mt CO2-eq/y) and Share in Industrial Total Greenhouse Gas Emissions (%)
Proximity>3 installations in 10 km radius99739 (8%)14 (3%)3 (6%)
Proximity>3 installations in 25 km radius28348172 (35%)77 (18%)16 (30%)
Proximity>5 installations in 10 km radius36725 (5%)6 (1%)2 (4%)
Proximity>5 installations in 25 km radius711350 (10%)17 (4%)4 (7%)
Thermal energy consumption>1 PJ thermal energy consumption in 25 km radius32277380 (77%)111(26%)31 (58%)
Thermal energy consumption>4 PJ thermal energy consumption in 25 km radius10123250 (51%)49 (11%)15 (28%)
Electricity consumption>150 GWh electricity consumption in 25 km radius20236186 (38%)110 (26%)17 (32%)
Greenhouse gas emissions>50,000 t CO2-eq/y in 25 km radius38323400 (81%)122 (28%)33.2 (62%)
Greenhouse gas emissions>500,000 t CO2-eq/y in 25 km radius13118248 (50%)39 (9%)17 (32%)
Table 11. Ranking of clusters per carbon dioxide emissions and thermal energy consumption.
ClusterInstallationsYearly Thermal Energy Consumption (PJ/y)Yearly Electricity Consumption (PJ/y)Total Greenhouse Gas Emissions (Mt CO2-eq/y)
Taranto233.30.0155.96
Bergamo/Lecco1111.05.5021.94
Modena/Reggio Emilia6625.13.8041.71
Brescia1613.910.3821.63
Varese/Verbano-Cusio-Ossola48.02.6741.34
Cuneo35.41.2111.01
Lucca2712.37.0990.95
Piacenza/Cremona28.06.6380.80
Trieste111.210.9420.76
Terni56.45.0900.58
Table 12. Possible decarbonization options and policies linked to the selected taxonomy attributes of the industrial clusters.
Taxonomy AttributeDecarbonization Option—Technology Decarbonization Option—Policies
ProximityDistributed renewable sources, industrial and waste symbiosis, circularity, thermal integration, demand-side management, etc.Energy community, flexibility, circular economy, etc.
Thermal energy consumptionHydrogen and other renewable gas production, fuel switching in hybrid fuel furnacesHydrogen valleys, internal market of hydrogen and biomethane in industrial cluster (Purchase Agreement Scheme); infrastructure planning for hydrogen logistics, storage, and transport; clean hydrogen policies for industry.
Electricity consumptionOn-site renewables generation, hybrid microgrid, storage shared dispatchable zero-carbon sources (e.g., biomass plant, SMR, or hydropower), storage and microgrids, electrificationFlexibility market, power purchase agreements, contracts for difference, and other alternative economic models to support low-carbon investment; infrastructure planning; reduction in taxes and levies on electricity with respect to natural gas
Greenhouse gas emissionsCarbon capture and utilizationInfrastructure planning for carbon dioxide pipelines and underground storage, carbon tax
Publisher’s Note: MDPI stays neutral with regard to jurisdictional claims in published maps and institutional affiliations.

