
Real-Time Experimental Monitoring for Water Absorption Evolution Behaviors of Sandstone in Mogao Grottoes, China
 ,
,
Abstract
:1. Introduction
2. Experiment and Procedures
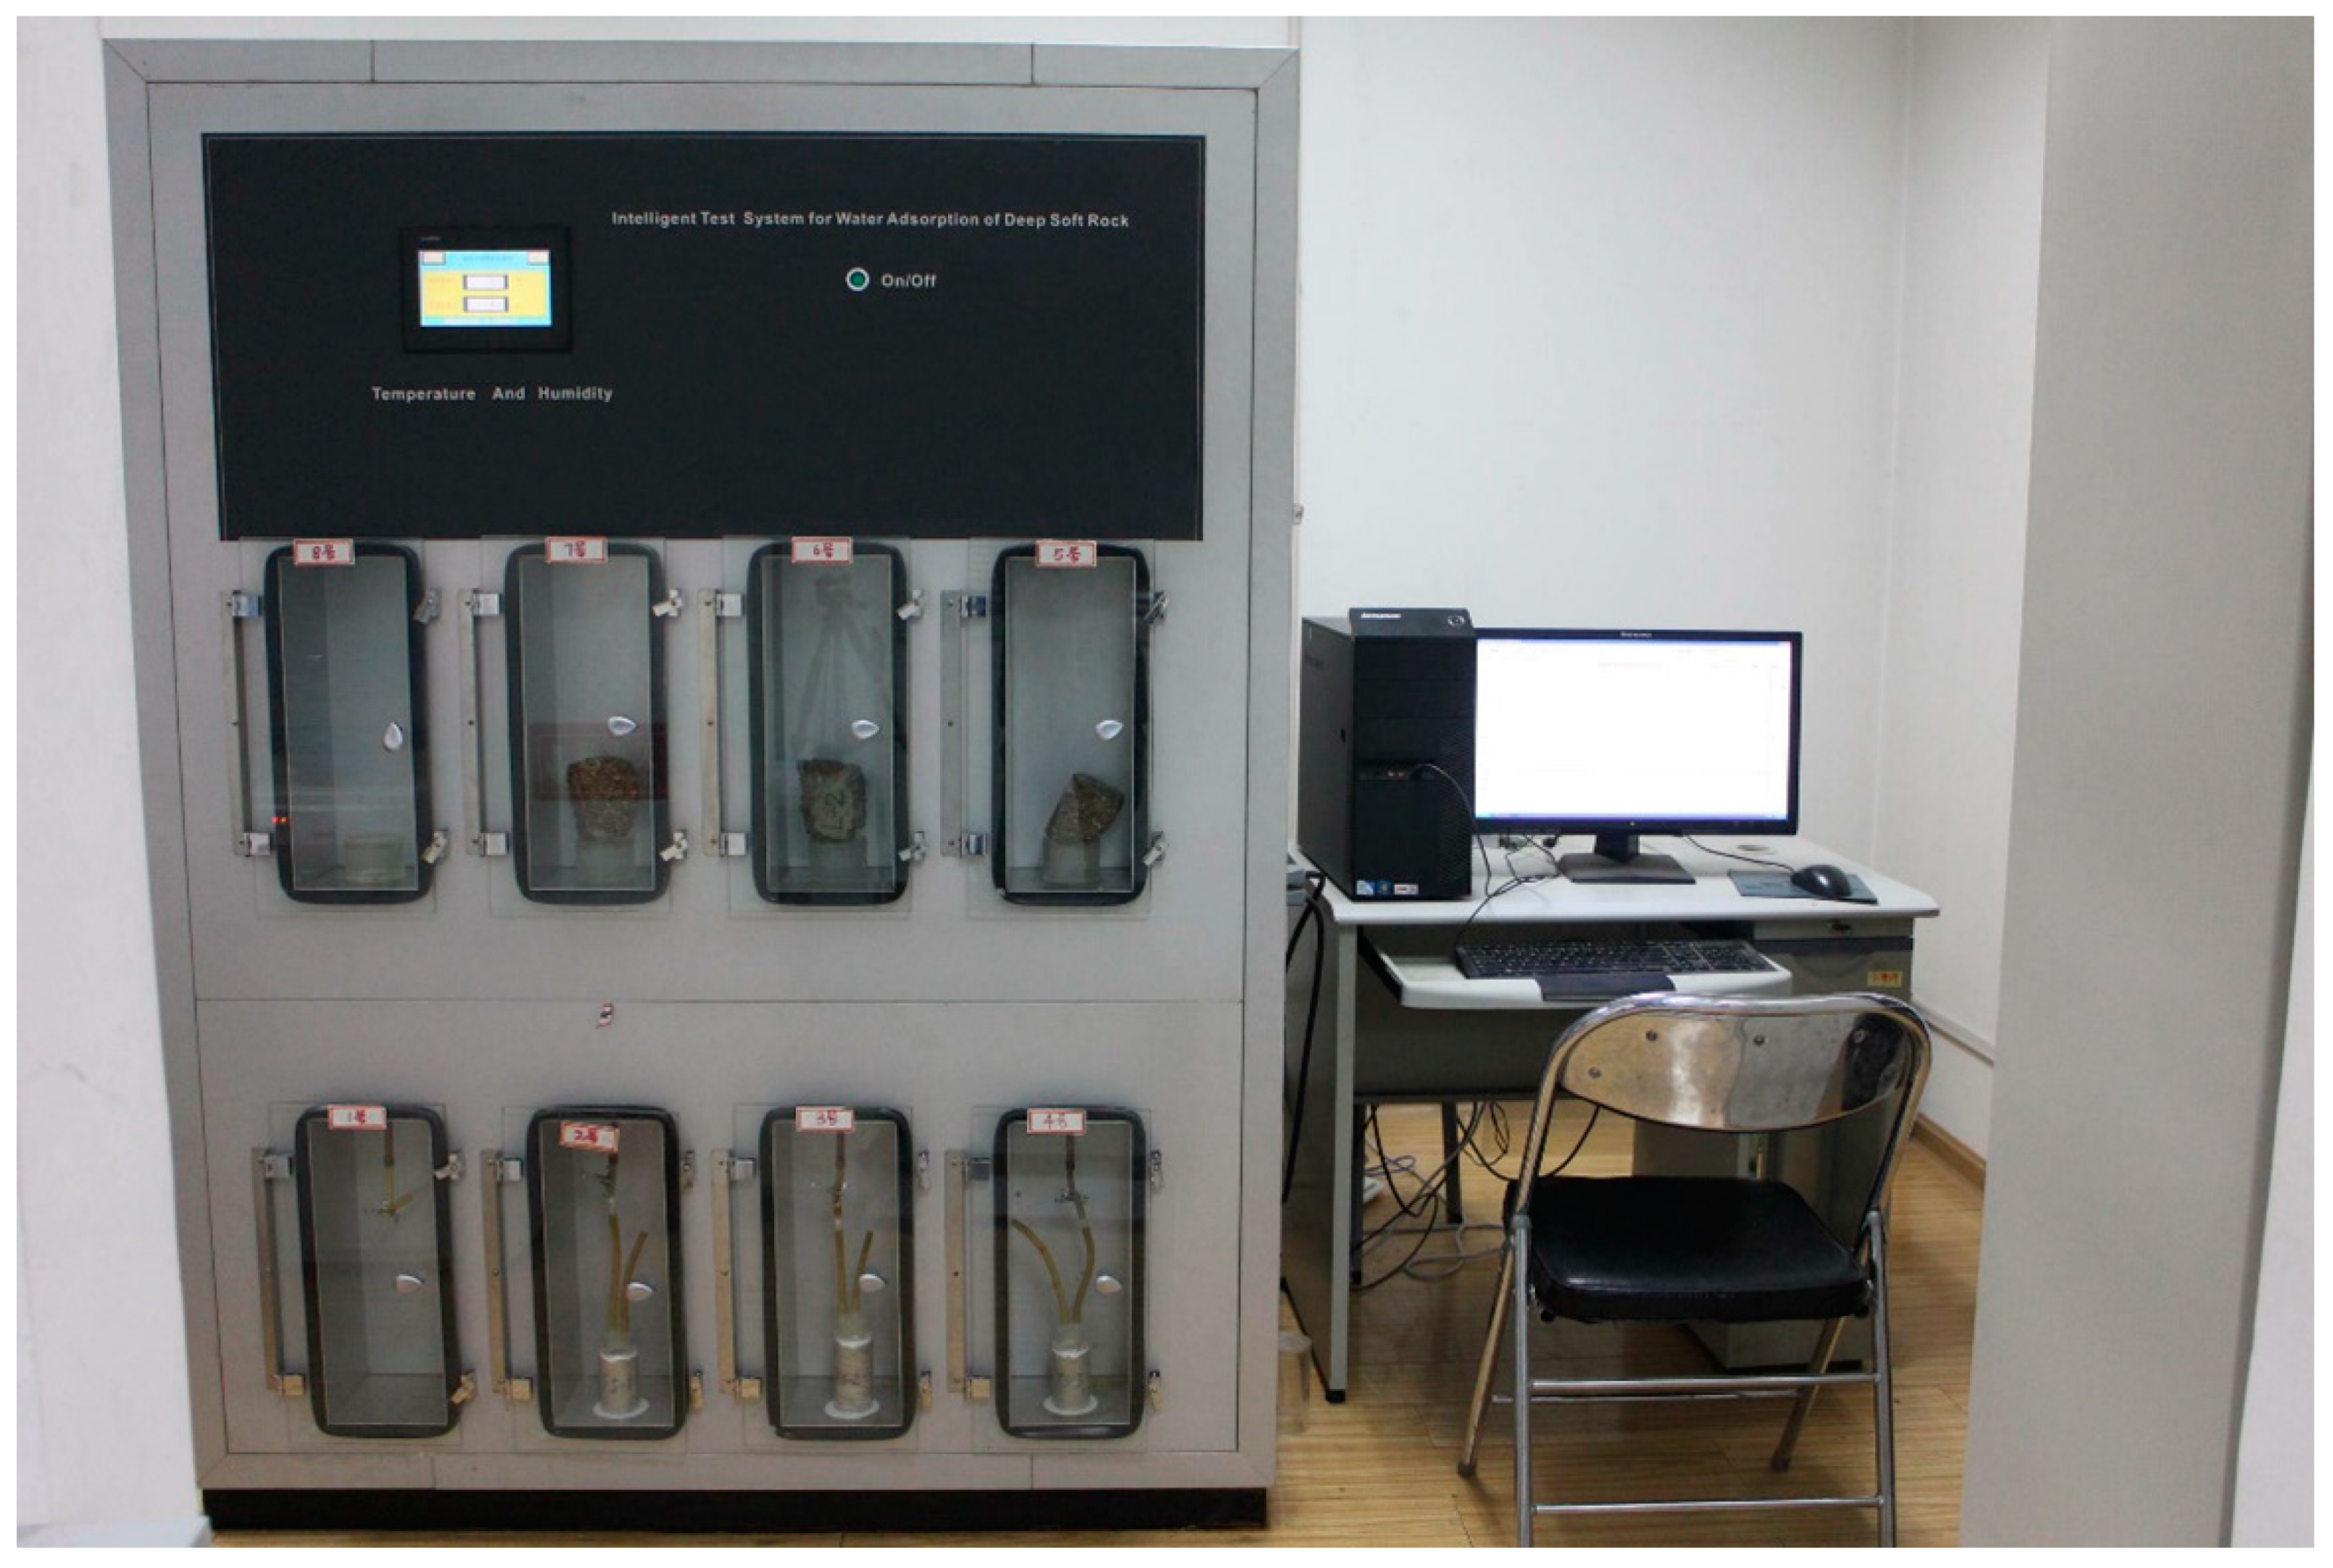
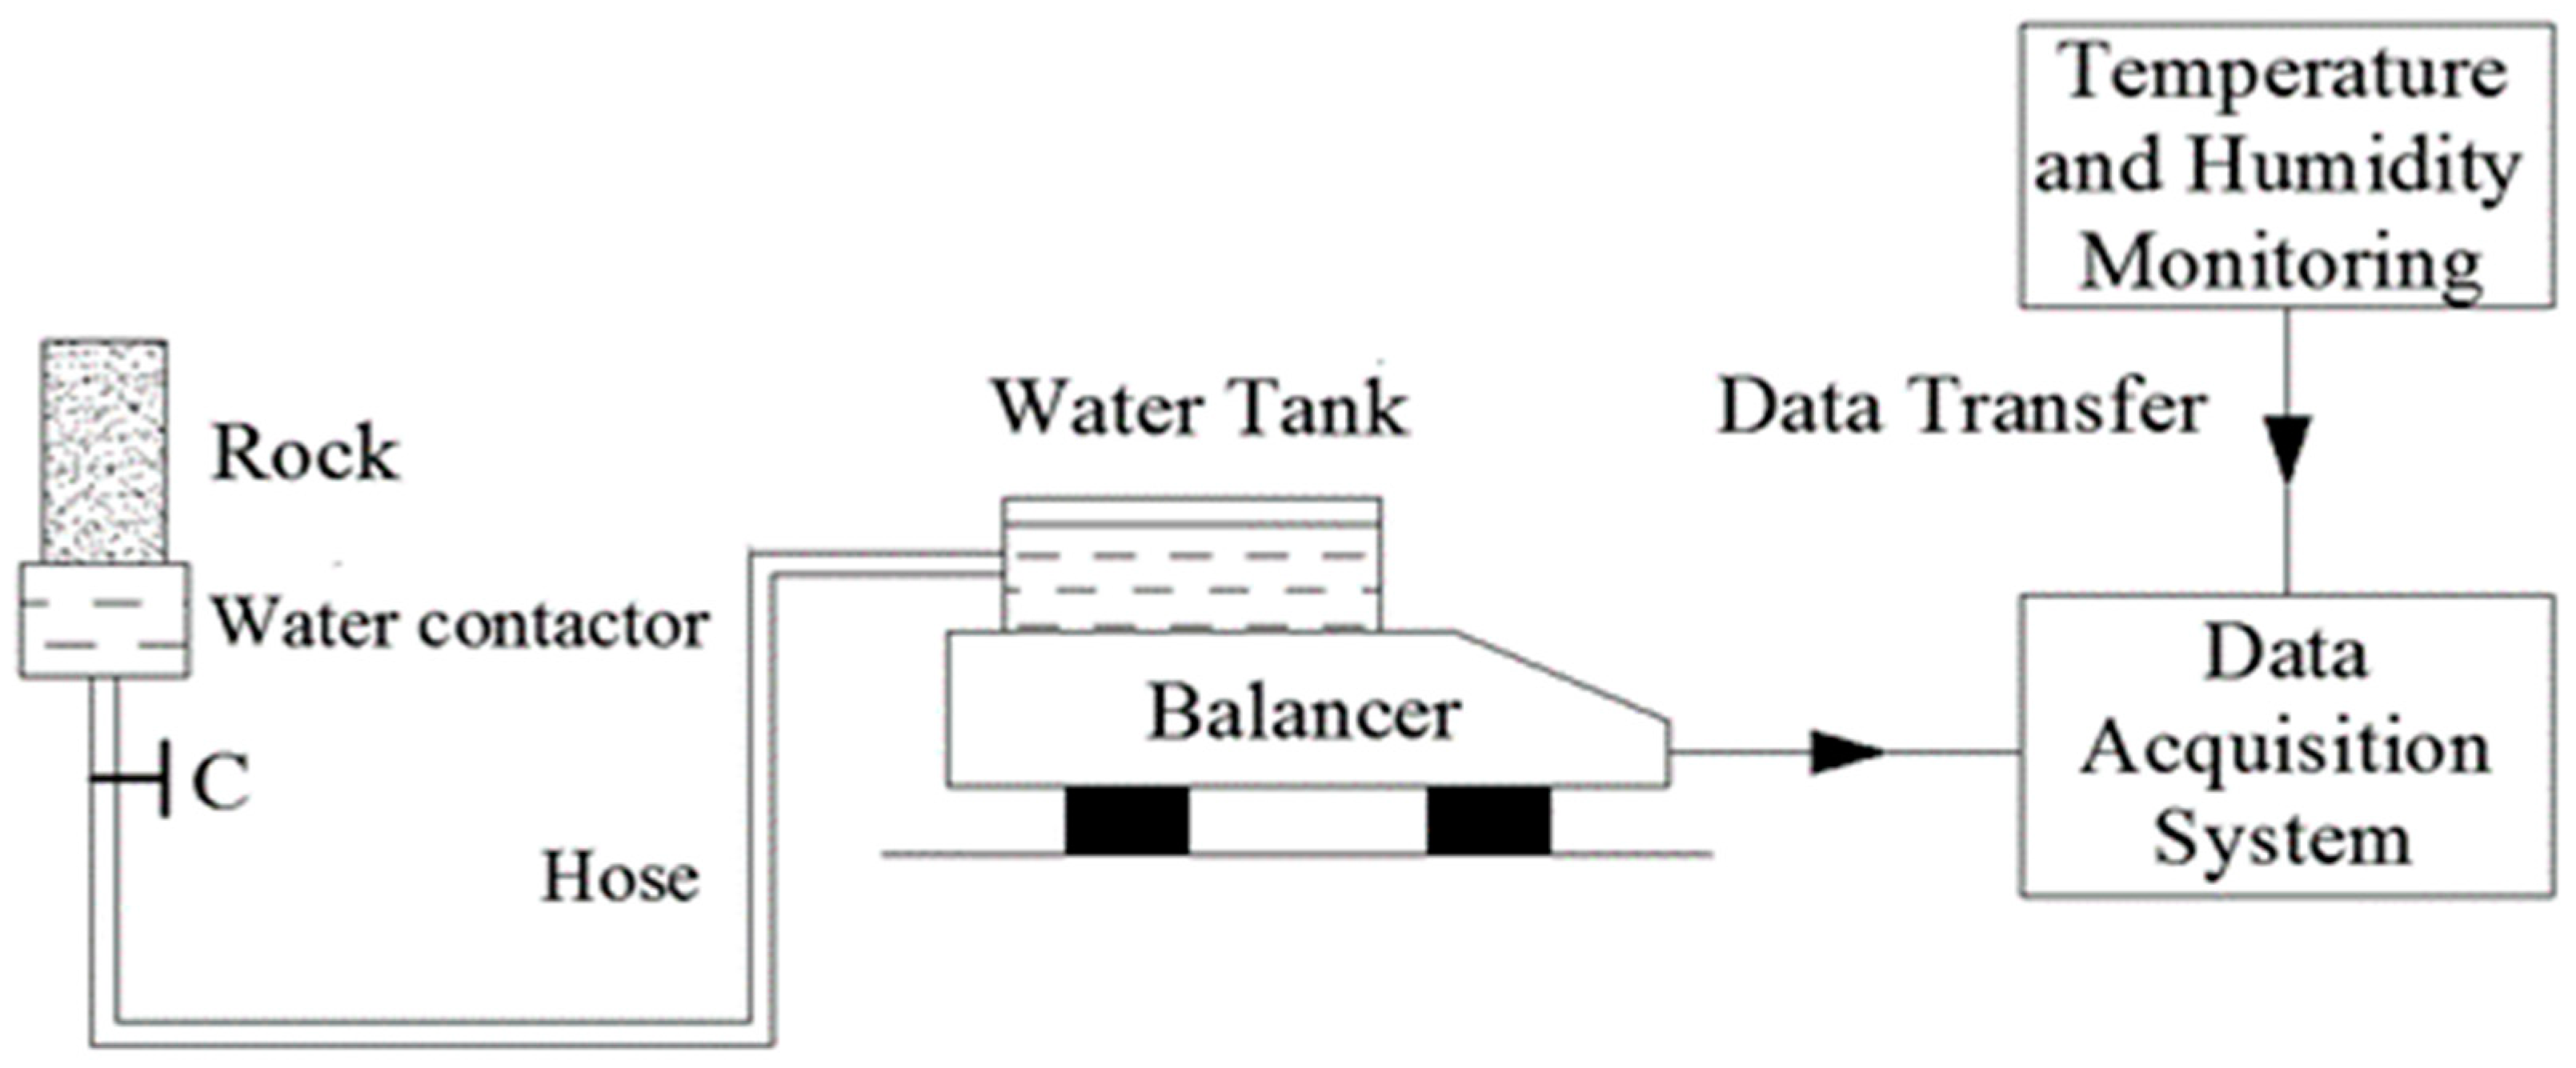
2.1. Real-Time Monitoring Experimental System and Procedures
- (1)
- Firstly, open the rear operation interface of the test box, inject water into each water storage bucket to three-quarters of the volume, and fill the connecting pipe.
- (2)
- Secondly, open the valve on the water inlet of the pressureless water contactor to fill the water storage area of the pressureless water contactor.
- (3)
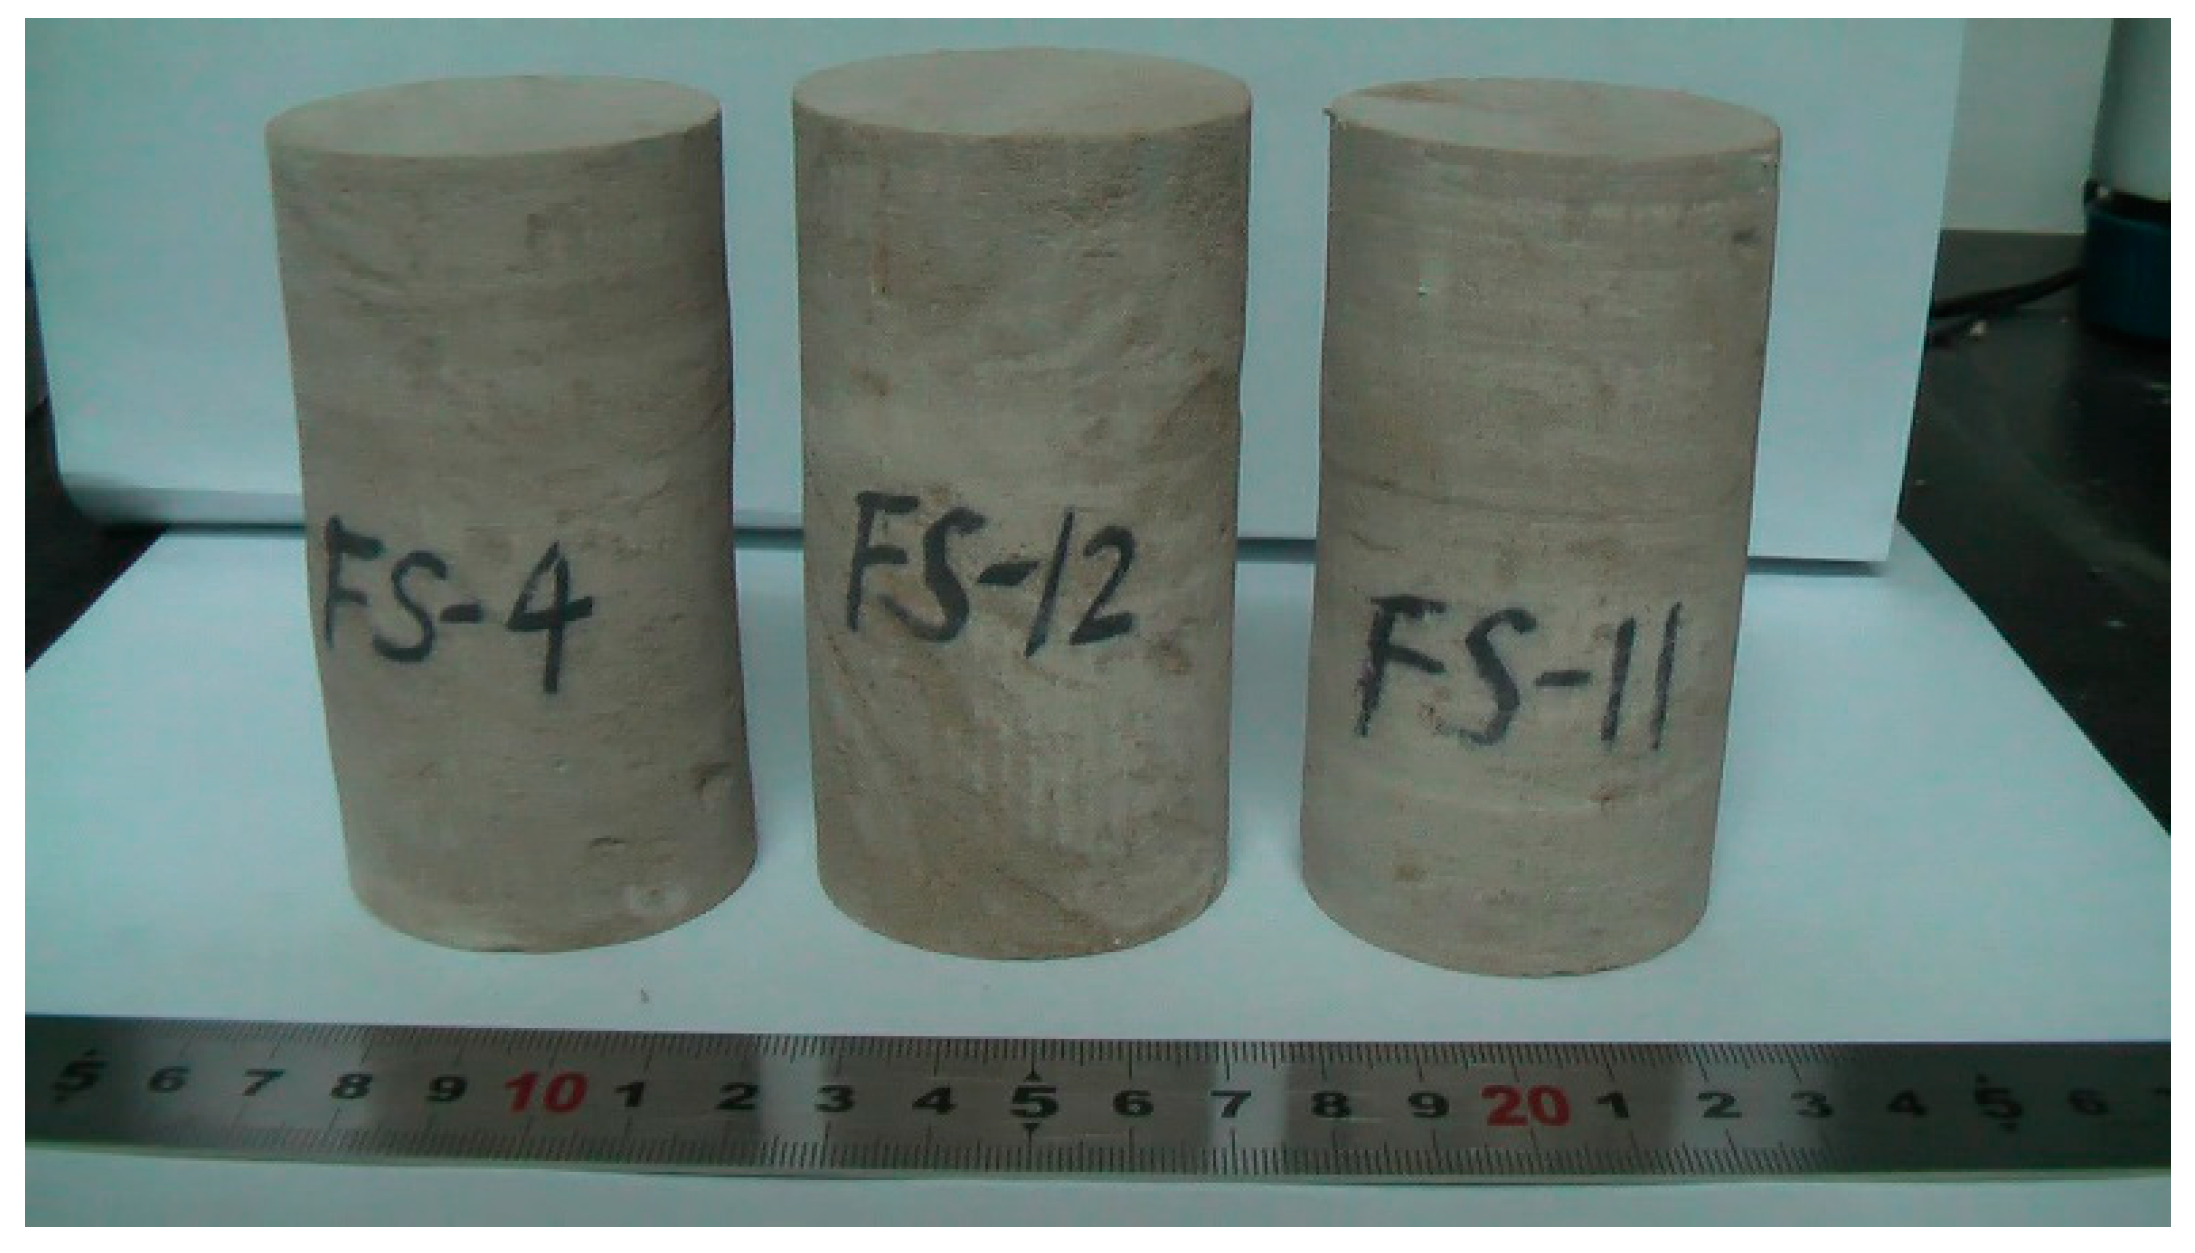
- Thirdly, the glass mold (no water absorption) with the same diameter as the experimental non pressure rock sample is placed on the support surface of one non pressure water contactor, and three pressureless rock samples are placed on the support surface of three pressureless water contactors. The water absorption end of the pressureless rock sample contacts the water surface of the water storage area, and the water absorption process of the pressureless rock sample begins.
- (4)
- Finally, close the observation window, turn on the computer for data acquisition, collect the reading information on each electronic balance and temperature and humidity sensor at any time, and automatically draw the test chart after summary and analysis to record the process of adsorbed water of each rock sample.
2.2. Microstructure and Components of Sandstone Samples in Mogao Grottoes, China
- (1)
- XRD experimental results of sandstone samples
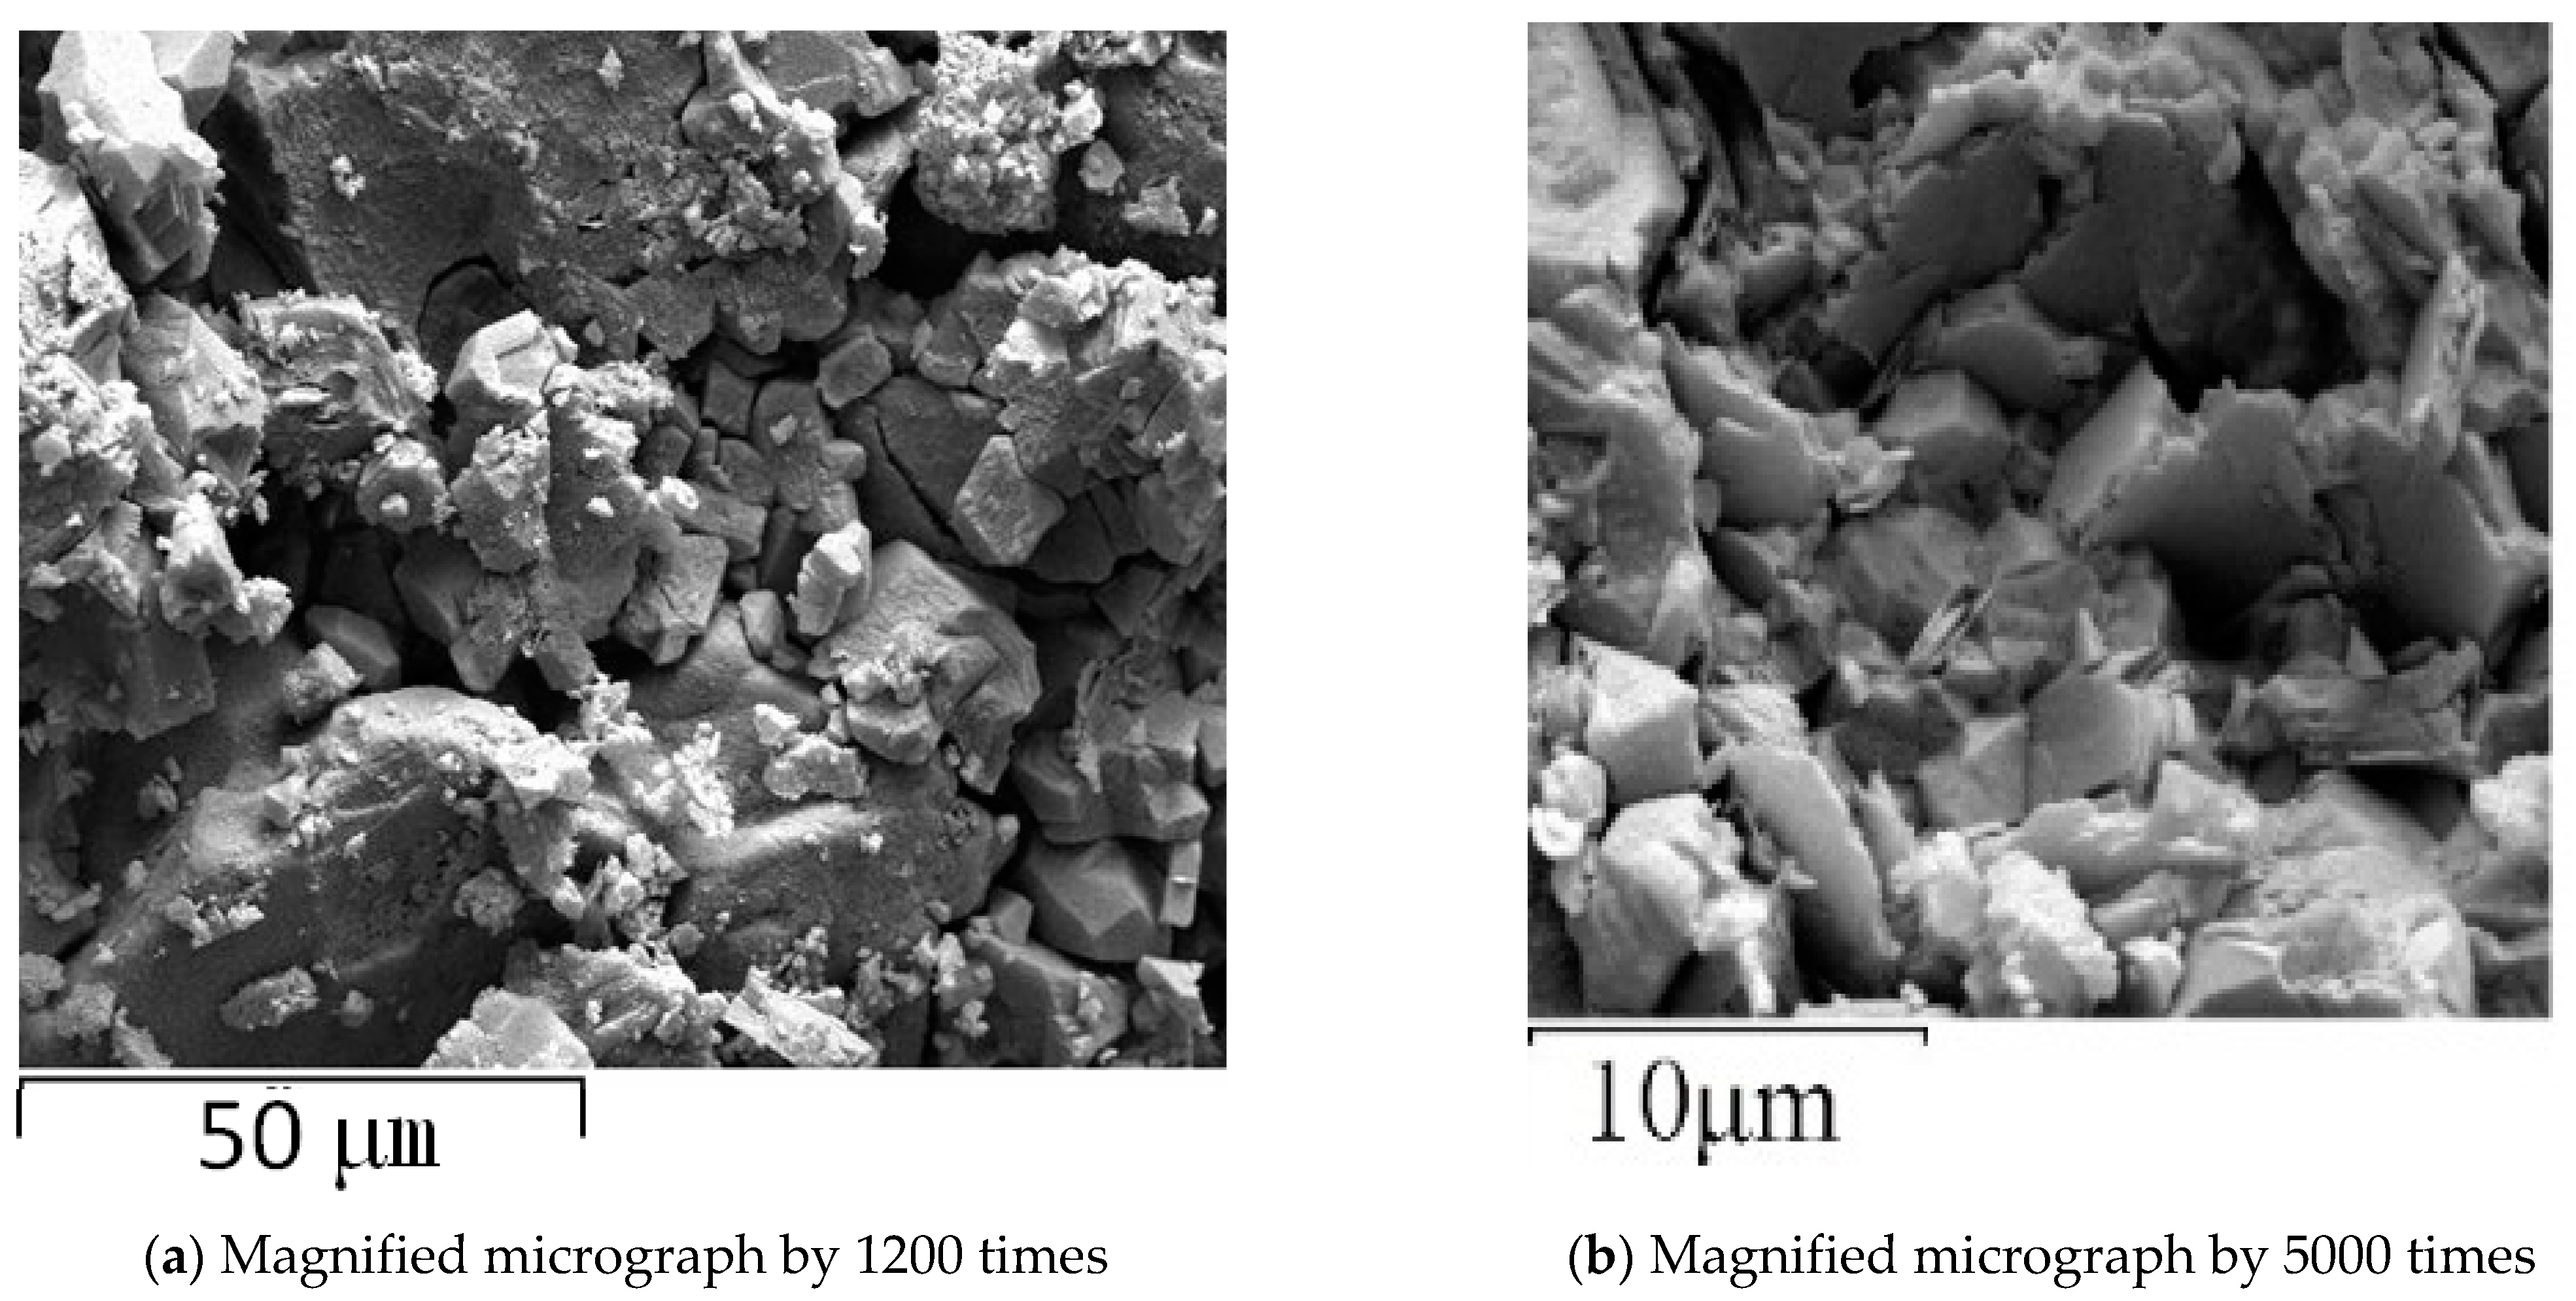
- (2)
- SEM experimental results of sandstone samples
- (3)
- Mercury intrusion test results
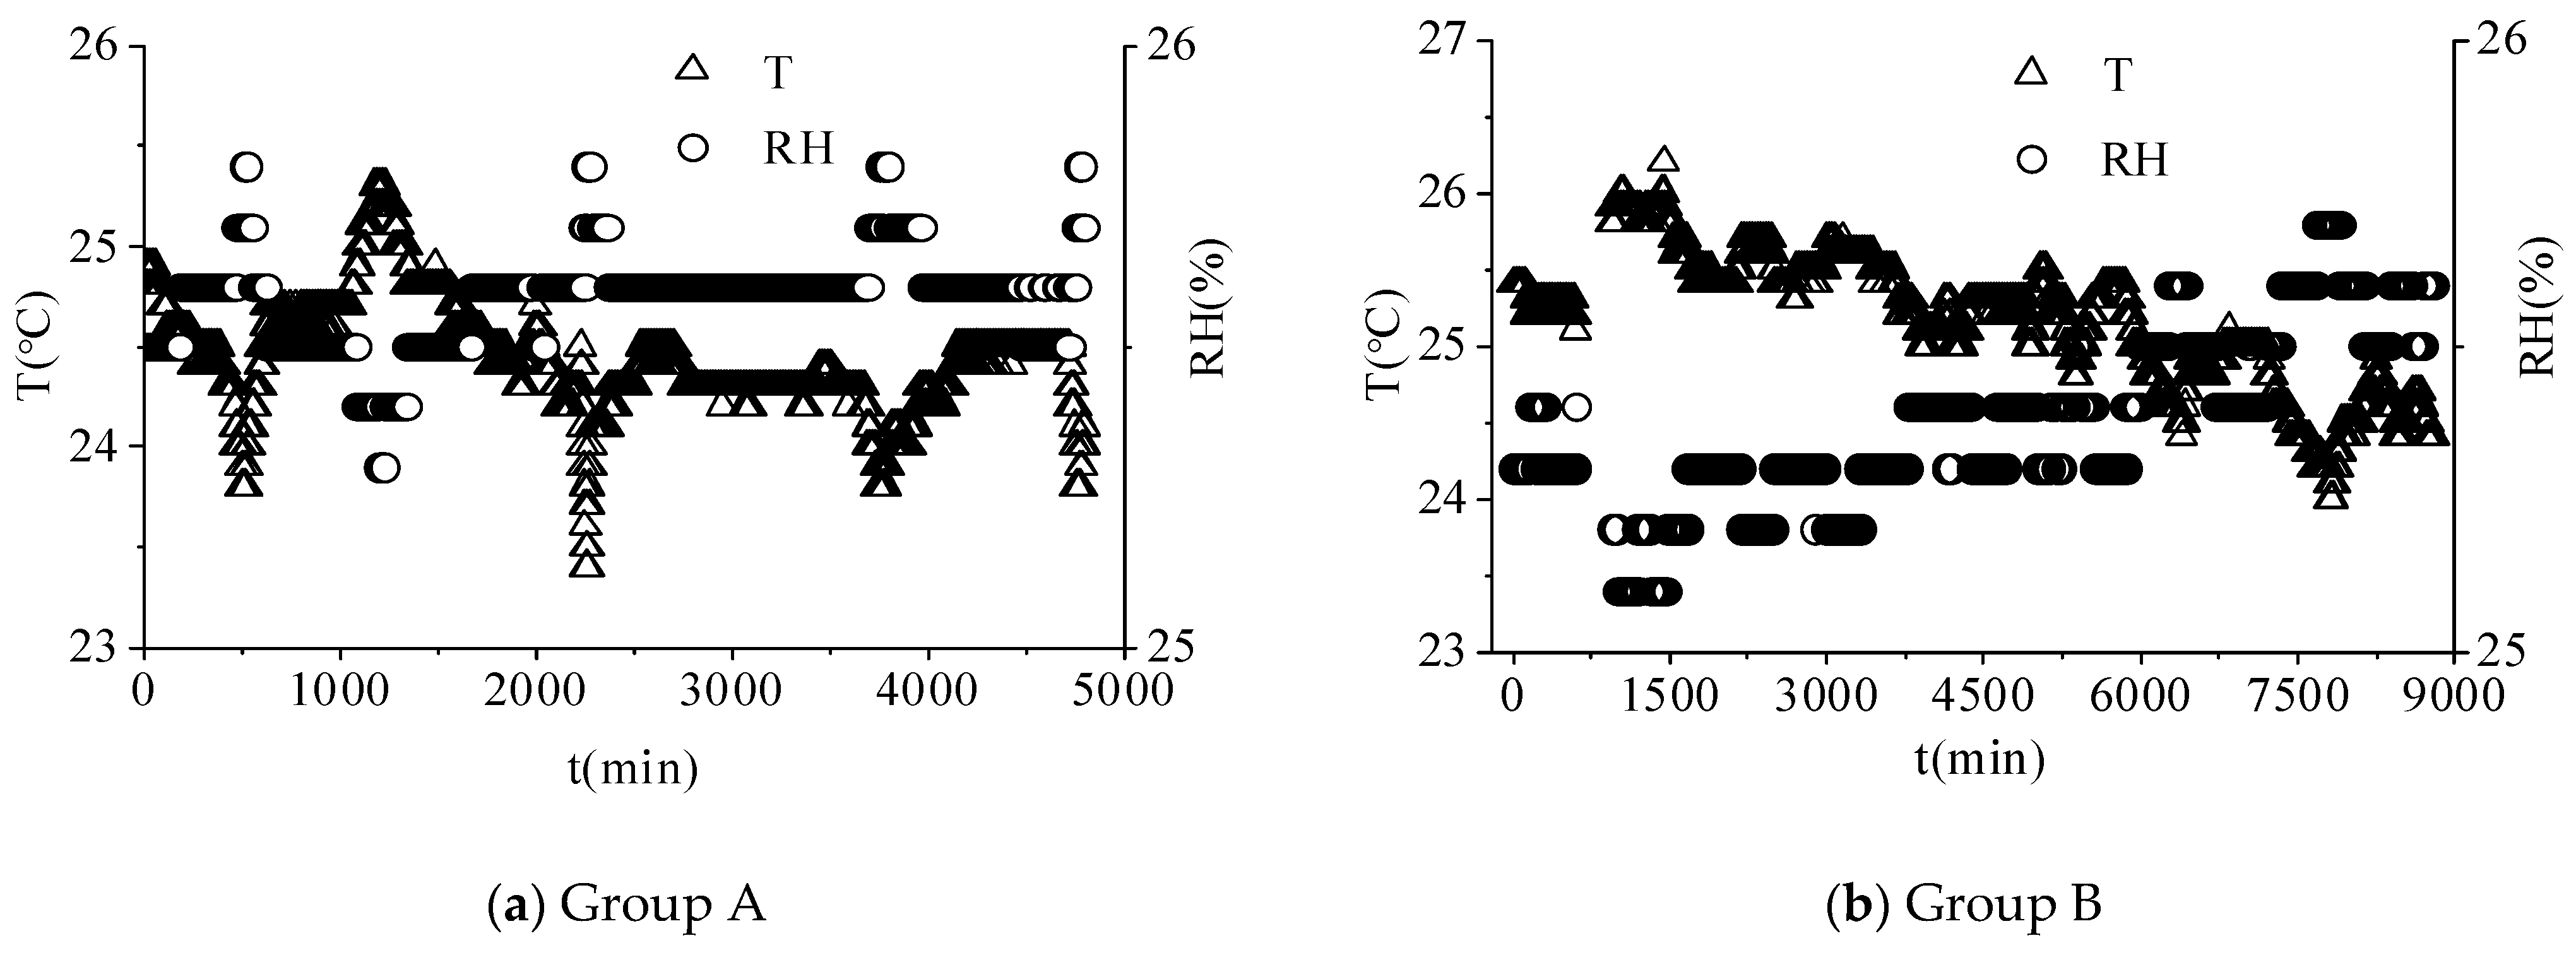
3. Results and Analysis for Interaction Behaviors between Water and Sandstone
4. Conclusions
- (1)
- The physical experimental system for real-time experimental monitoring for water absorption evolution behaviors is developed. This experimental system simulates three modes of rock sample water absorption process under the action of capillary, gravity and hydrostatic pressure, and accurately estimates the water absorption quality of rock samples, environmental temperature and humidity, in real time.
- (2)
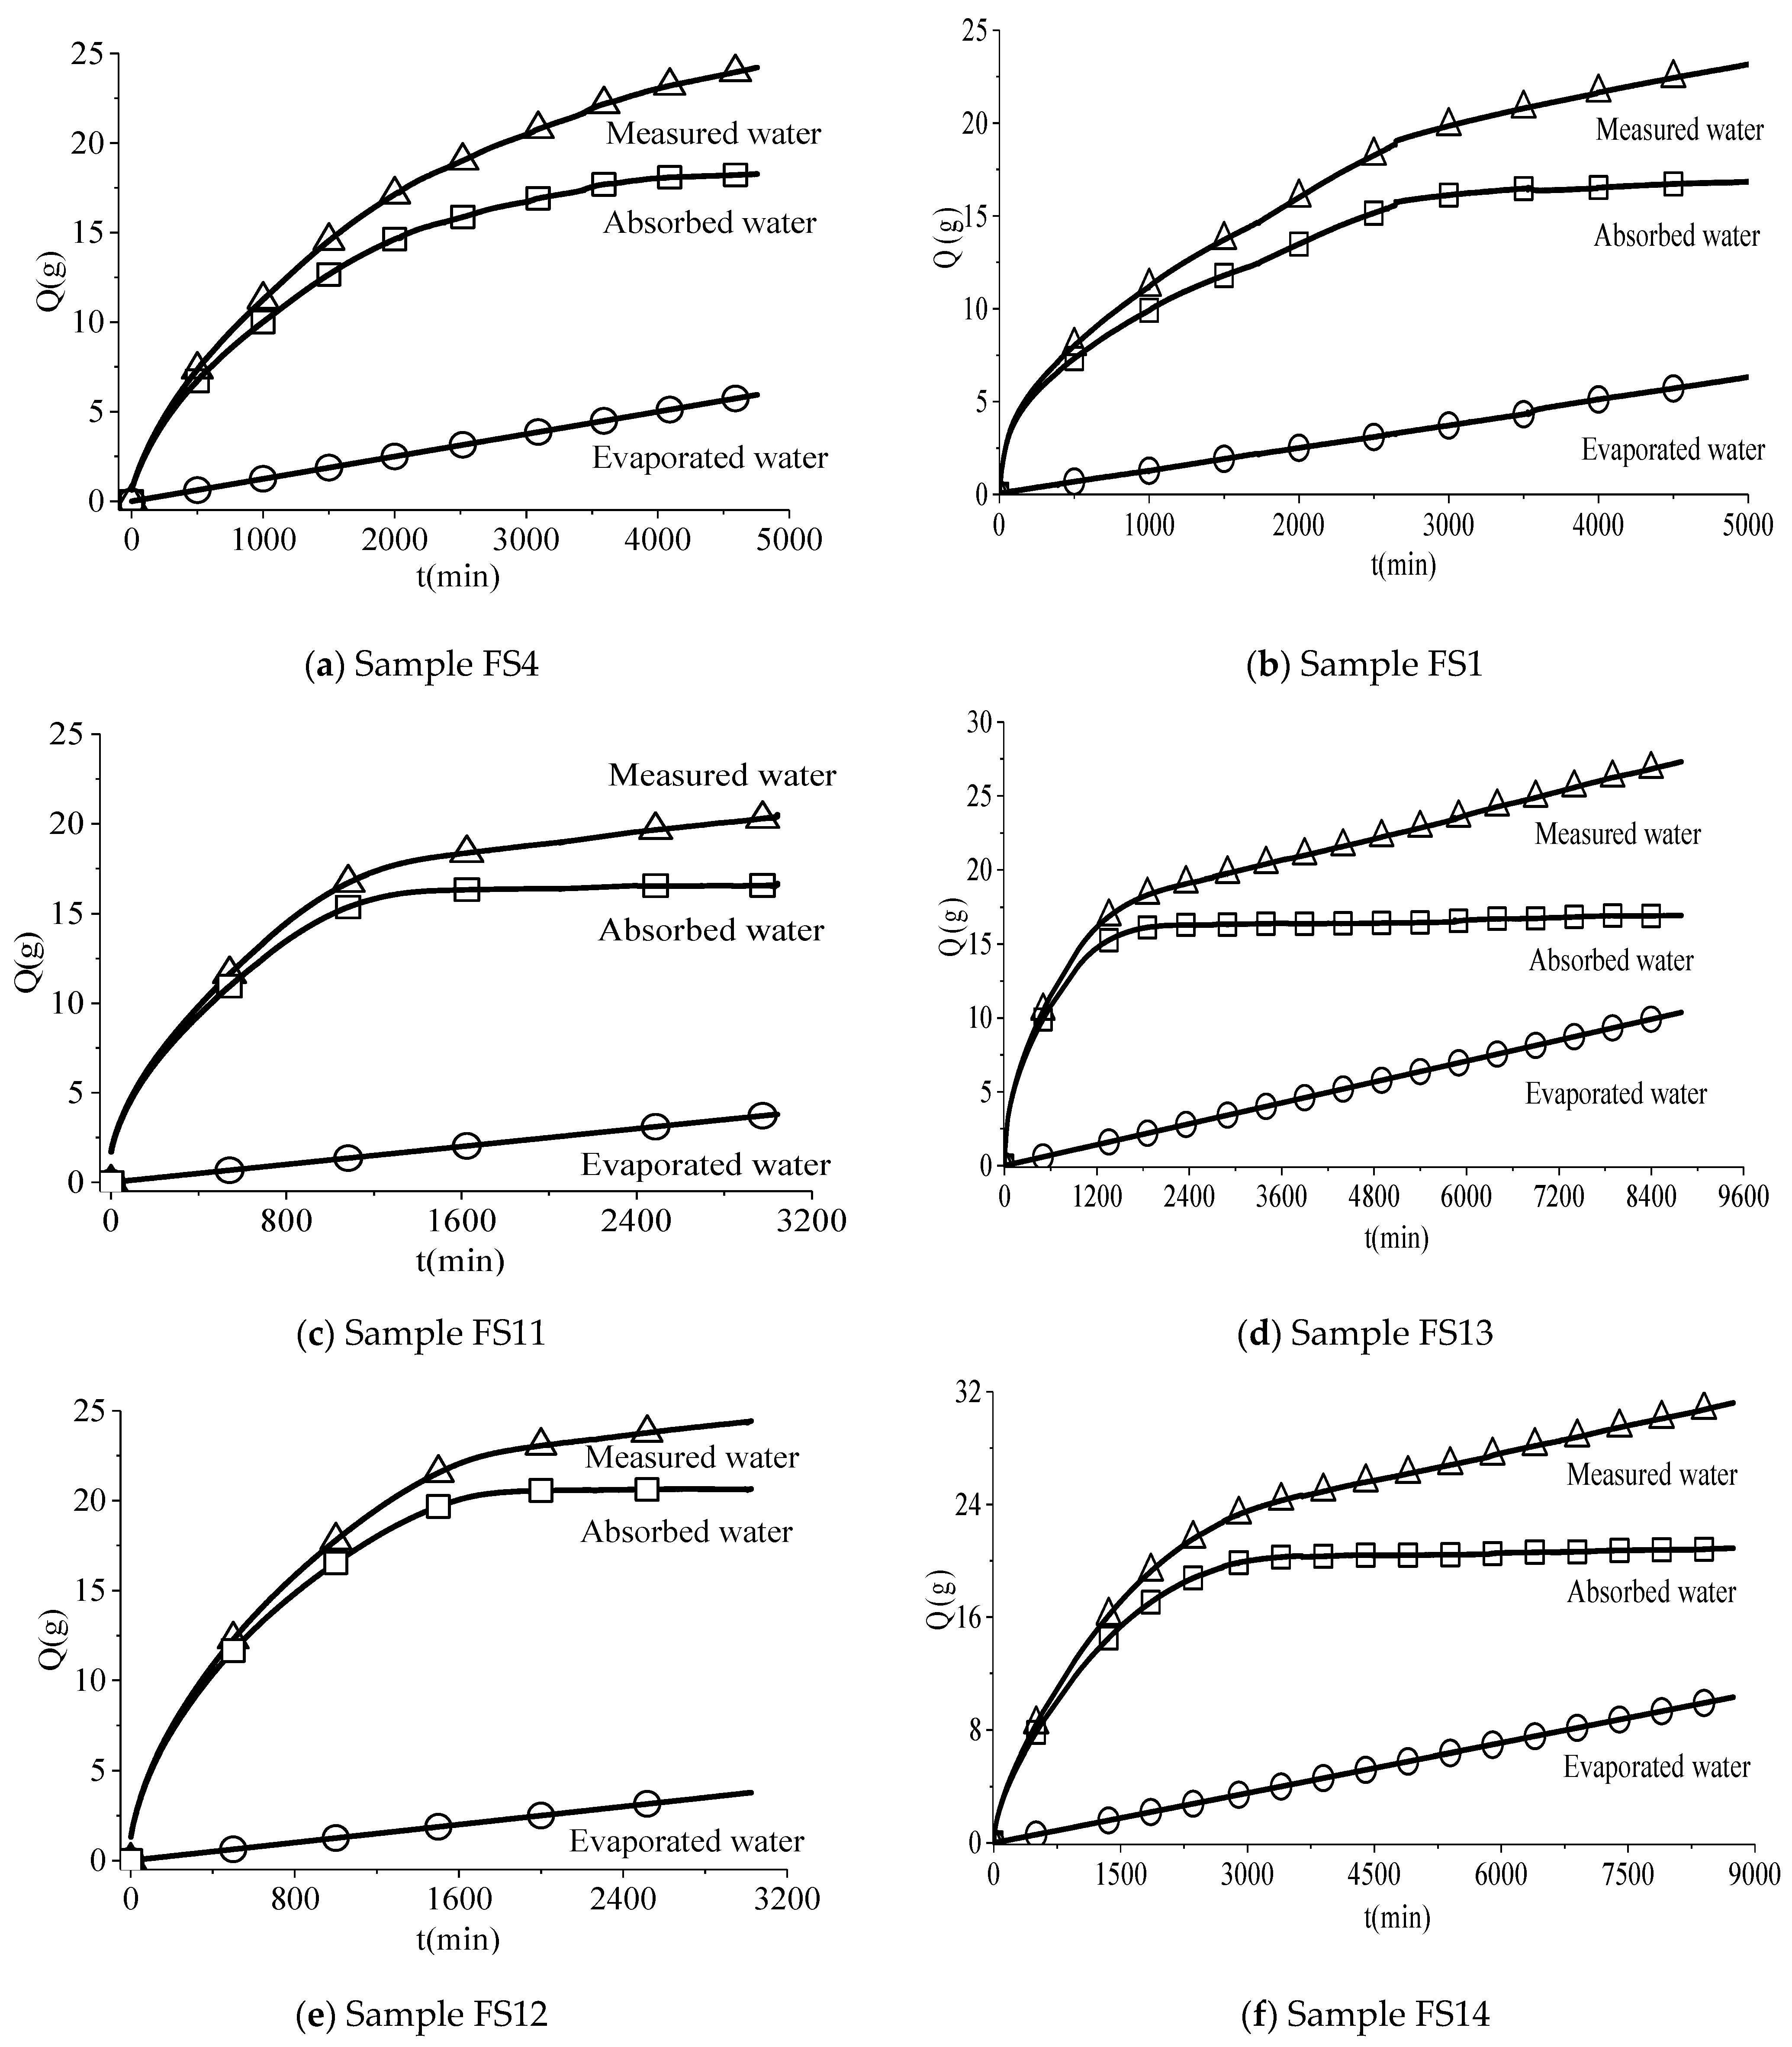
- The effects of water evaporation on the water absorption quality of the rock samples are evaluated quantitatively and accurately. The actual water absorption of the rock samples should be the difference between the amount of water reduction measured by the balance and the amount of water evaporation. The quantitative value of water in rock mass is measured by the developed experiments.
- (3)
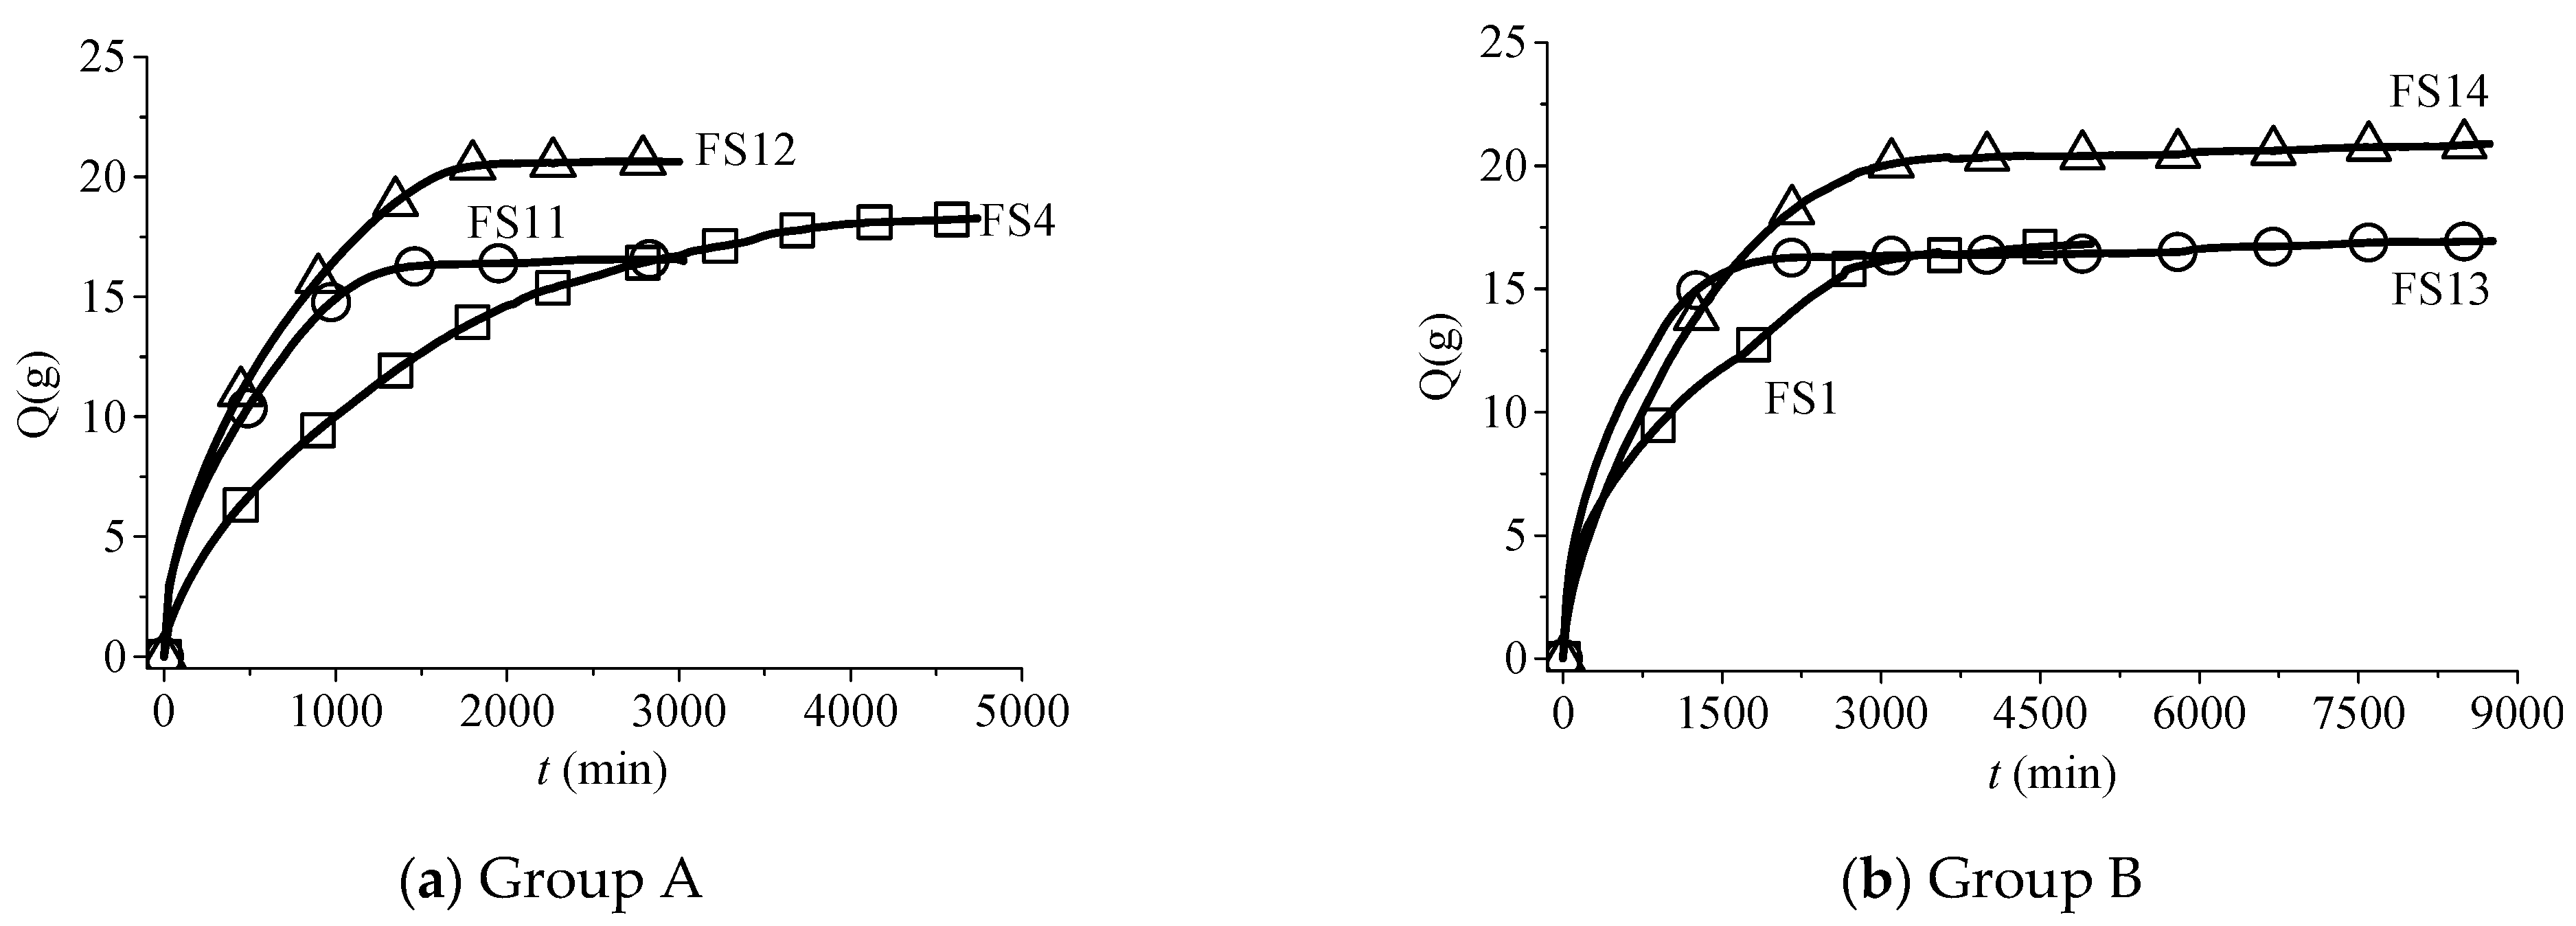
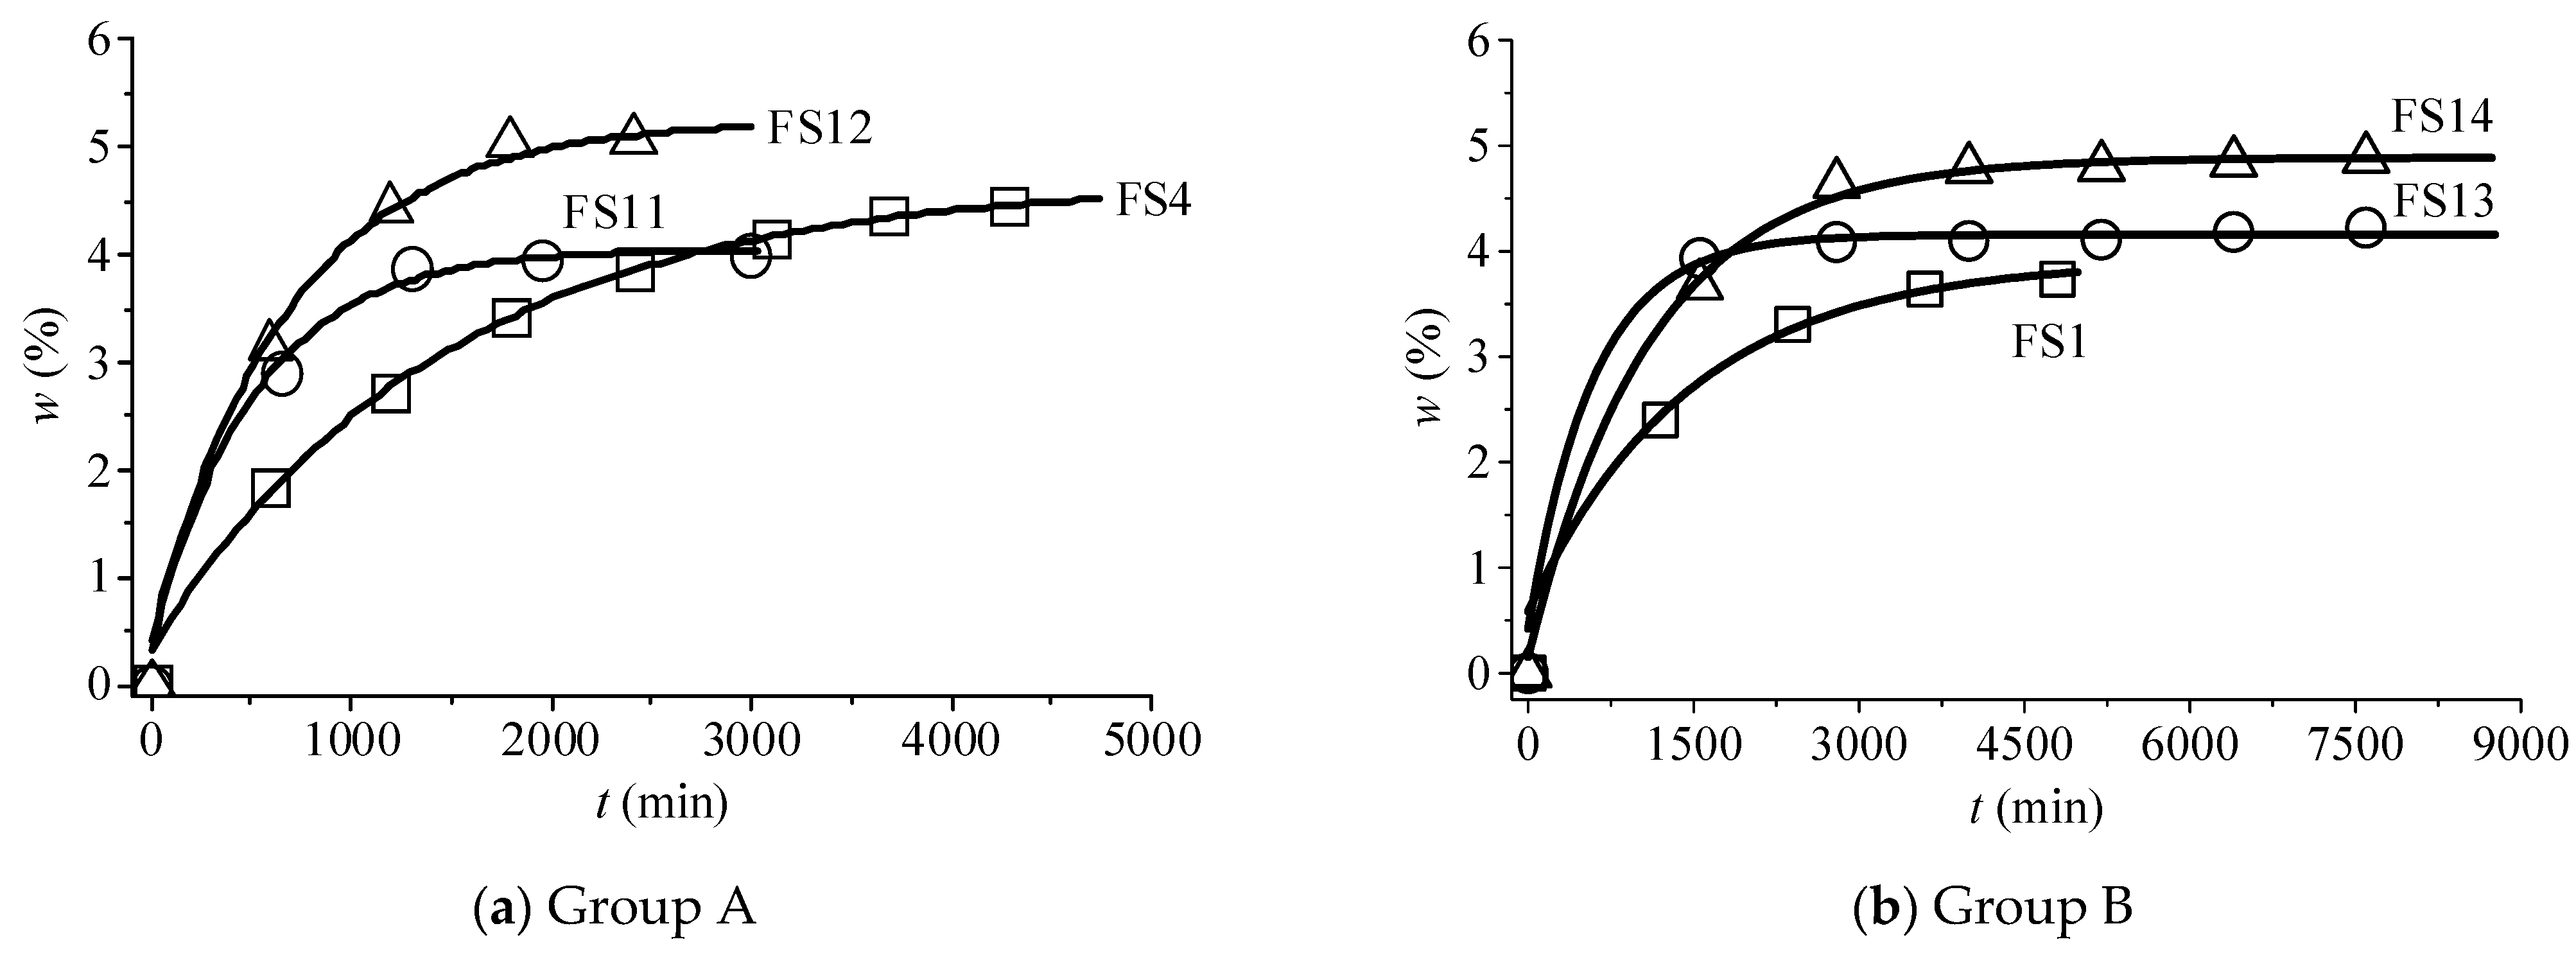
- The water absorption process of sandstone in Mogao Grottoes, China, under capillary action is simulated by a non-pressure water absorption experiment. The water absorption characteristic curve of the rock samples can be fitted by exponential function, and it shows that the water absorption increases rapidly in the initial stage, then slowly increases, and finally tends to be stable. These results can provide reference for evaluating hydration and protecting rock mass.
Author Contributions
Funding
Data Availability Statement
Conflicts of Interest
References
- Wang, Y.; Wang, J.; Li, L. Dynamic propagation behaviors of hydraulic fracturenetworks considering hydro-mechanical coupling effects in tight oil and gasreservoirs: A multi-thread parallel computation method. Comput. Geotech. 2022, 152, 105016. [Google Scholar] [CrossRef]
- Wang, Y. Adaptive Analysis of Damage and Fracture in Rock with Multiphysical Fields Coupling; Springer Press: Berlin/Heidelberg, Germany, 2021. [Google Scholar]
- Wang, X.; Fu, P. Summary of painting materials and techniques of the Mogao Grottoes. Mural paintings of the Silk Road: Cultural exchanges between East and West. In Proceedings of the 29th Annual International Symposium on the Conservation and Restoration of Cultural Property, National Research Institute for Cultural Properties, Tokyo, Japan, 19–21 January 2007. [Google Scholar]
- Agnew, N.; Maekawa, S.; Wei, S. Causes and mechanisms of deterioration and damage in Cave 85. Conservation of Ancient Sites on the Silk Road. In Proceedings of the Second International Conference on the Conservation of Grotto Sites, Mogao Grottoes, Dunhuang, China, 28 June–3 July 2004; Agnew, N., Ed.; Getty Conservation Institute: Los Angeles, CA, USA, 2010; pp. 412–420. [Google Scholar]
- Guo, Q.; Wang, X.; Zhang, H.; Li, Z.; Yang, S. Damage and conservation of the high cliff on the Northern area of Dunhuang Mogao Grottoes, China. Landslides 2009, 6, 89–100. [Google Scholar] [CrossRef]
- Li, H.; Wang, W.; Zhan, H.; Qiu, F.; Guo, Q.; Zhang, G. Water in the Mogao Grottoes, China: Where it comes from and how it is driven. J. Arid. Land. 2015, 7, 37–45. [Google Scholar] [CrossRef]
- Zhao, Z.; Guo, T.; Ning, Z.; Dou, Z.; Dai, F.; Yang, Q. Numerical modeling of stability of fractured reservoir bank slopes subjected to water–rock interactions. Rock Mech. Rock Eng. 2020, 53, 2215–2231. [Google Scholar] [CrossRef]
- Ma, D.; Duan, H.; Zhang, J.; Liu, X.; Li, Z. Numerical simulation of water–silt inrush hazard of fault rock: A three-phase flow model. Rock Mech. Rock Eng. 2022, 55, 5163–5182. [Google Scholar] [CrossRef]
- Bi, J.; Zhou, X. A novel numerical algorithm for simulation of initiation, propagation and coalescence of flaws subject to internal fluid pressure and vertical stress in the framework of general particle dynamics. Rock Mech. Rock Eng. 2017, 50, 1833–1849. [Google Scholar] [CrossRef]
- Huang, N.; Jiang, Y.; Liu, R.; Li, B. Experimental and numerical studies of the hydraulic properties of three-dimensional fracture networks with spatially distributed apertures. Rock Mech. Rock Eng. 2019, 52, 4731–4746. [Google Scholar] [CrossRef]
- Ren, Q.; Jin, Q.; Feng, J.; Li, M.; Du, H. Mineral filling mechanism in complex carbonate reservoir fracture system: Enlightenment from numerical simulation of water-rock interaction. Rock Mech. Rock Eng. 2020, 195, 107769. [Google Scholar] [CrossRef]
- Al-Khailany, D.K.; Saleh, M.M.; Daraei, A. Evaluating the Moisture Content Variation on Critical Strain of Geo-materials: A Case Study. J. Eng. 2022, 28, 27–38. [Google Scholar] [CrossRef]
- Ma, H.; Song, Y.; Chen, S.; Yin, D.; Zheng, J.; Shen, F.; Li, X.; Ma, Q. Experimental investigation on the mechanical behavior and damage evolution mechanism of water-immersed gypsum rock. Rock Mech. Rock Eng. 2021, 54, 4929–4948. [Google Scholar] [CrossRef]
- Lin, Y.; Zhou, K.; Li, J.; Ke, B.; Gao, R. Weakening laws of mechanical properties of sandstone under the efect of chemical corrosion. Rock Mech. Rock Eng. 2020, 53, 1857–1877. [Google Scholar] [CrossRef]
- Lin, H.; Zhang, Q.; Zhang, L.; Duan, K.; Xue, T.; Fan, Q. The infuence of water content on the time-dependent mechanical behavior of argillaceous siltstone. Rock Mech. Rock Eng. 2022, 55, 3939–3957. [Google Scholar] [CrossRef]
- Yao, W.; Li, C.; Zhan, H.; Zhou, J.; Criss, R.; Xiong, S.; Jiang, X. Multiscale study of physical and mechanical properties of sandstone in three gorges reservoir region subjected to cyclic wetting–drying of yangtze river water. Rock Mech. Rock Eng. 2020, 53, 2215–2231. [Google Scholar] [CrossRef]
- Zhang, C.; Dai, Z.; Tian, W.; Yang, Y.; Zhang, L. Multiscale study of the deterioration of sandstone in the three gorges reservoir area subjected to cyclic wetting–cooling and drying–heating. Rock Mech. Rock Eng. 2022, 55, 5619–5637. [Google Scholar] [CrossRef]
- He, M.; Sun, X.; Zhao, J. Advances in interaction mechanism of water (gas) on clay minerals in China. Int. J. Min. Sci. Technol. 2014, 24, 727–735. [Google Scholar] [CrossRef]
- He, M.; Zhang, N. Experimental study on water absorption and strength degradation effect of shale at great depth. Dis. Adv. 2014, 7, 28–36. [Google Scholar]
- Guo, H.; He, M.; Sun, C.; Li, B.; Zhang, F. Hydrophilic and strength-softening characteristics of calcareous shale in deep mines. J. Rock Mech. Geotech. Eng. 2012, 4, 344–351. [Google Scholar] [CrossRef]
- Li, D.; Wang, G.; Han, L.; Liu, P.; He, M.; Yang, G.; Tai, Q.; Chen, C. Analysis of microscopic pore structures of rocks before and after water absorption. Min. Sci. Technol. 2011, 21, 287–293. [Google Scholar]


| Minerals (%) | Clay Minerals (%) | |||||||
|---|---|---|---|---|---|---|---|---|
| Quartz | Potash Feldspar | Soda Feldspar | Calcite | Dolomite | Clay Minerals | Illite | Kaolinite | Chlorite |
| 24.3 | 0.5 | 6.3 | 22.8 | 16.4 | 29.7 | 68 | 8 | 24 |
| Porosity (%) | Specific Surface Area (m2/g) | Volume Median Pore Diameter (nm) | Area Median Pore Diameter (nm) | Mean Pore Diameter (nm) | Bulk Density (g/mL) | Skeleton Density (g/mL) |
|---|---|---|---|---|---|---|
| 12.23 | 0.082 | 9764.8 | 974.4 | 2838.4 | 2.11 | 2.41 |
| Group | Sample | Diameter d (mm) | Length l (mm) | Dried Mass before Test M1 (g) |
|---|---|---|---|---|
| A | FS4 | 49.52 | 91.08 | 406.432 |
| A | FS11 | 50.00 | 92.12 | 414.024 |
| A | FS12 | 49.56 | 94.20 | 406.400 |
| B | FS1 | 48.36 | 101.14 | 449.706 |
| B | FS13 | 49.38 | 92.48 | 399.947 |
| B | FS14 | 49.38 | 97.58 | 425.623 |
| Average | 49.37 | 94.77 | 417.022 |
| Sample | Fitting Parameters | Sample | Fitting Parameters | ||||||
|---|---|---|---|---|---|---|---|---|---|
| a | b | w | R2 | a | b | w | R2 | ||
| FS-4 | −4.341 | −1477.740 | 4.704 | 0.999 | FS-1 | −3.326 | −1465.154 | 3.912 | 0.990 |
| FS-11 | −3.638 | −529.384 | 4.072 | 0.993 | FS-13 | −3.7323 | −587.070 | 4.156 | 0.992 |
| FS-12 | −4.770 | −698.107 | 5.267 | 0.995 | FS-14 | −4.7311 | −1101.379 | 4.886 | 0.996 |
| Group | Sample | Time t (min) | Water Quality Evaporated Q1 (g) | Water Quality Reduced Q2 (g) | Imbibition Measured Automatically Q3 (g) | Dried Mass before Test M1 (g) | Hydrous Mass after Test M2 (g) | Imbibition Measured Manually M3 (g) | Imbibition Error E (%) | Water Content w (%) |
|---|---|---|---|---|---|---|---|---|---|---|
| A | FS4 | 4755 | 5.94 | 24.22 | 18.28 | 406.432 | 424.459 | 18.027 | 1.40 | 4.44 |
| FS11 | 3042 | 3.80 | 20.50 | 16.70 | 414.024 | 429.585 | 15.561 | 7.32 | 3.76 | |
| FS12 | 3024 | 3.78 | 24.43 | 20.65 | 406.400 | 427.198 | 20.798 | −0.71 | 5.12 | |
| B | FS1 | 4999 | 6.32 | 23.16 | 16.84 | 449.706 | 466.144 | 16.438 | 2.45 | 3.66 |
| FS13 | 8792 | 10.375 | 27.32 | 16.945 | 399.947 | 416.887 | 16.940 | 0.03 | 4.24 | |
| FS14 | 8745 | 10.319 | 31.210 | 20.891 | 425.623 | 448.369 | 22.746 | −8.16 | 5.34 |
Publisher’s Note: MDPI stays neutral with regard to jurisdictional claims in published maps and institutional affiliations. |
© 2022 by the authors. Licensee MDPI, Basel, Switzerland. This article is an open access article distributed under the terms and conditions of the Creative Commons Attribution (CC BY) license (https://creativecommons.org/licenses/by/4.0/).
Share and Cite
Hao, N.; Wang, Y.; Wu, X.; Duan, Y.; Li, P.; He, M. Real-Time Experimental Monitoring for Water Absorption Evolution Behaviors of Sandstone in Mogao Grottoes, China. Energies 2022, 15, 8504. https://doi.org/10.3390/en15228504
Hao N, Wang Y, Wu X, Duan Y, Li P, He M. Real-Time Experimental Monitoring for Water Absorption Evolution Behaviors of Sandstone in Mogao Grottoes, China. Energies. 2022; 15(22):8504. https://doi.org/10.3390/en15228504
Chicago/Turabian StyleHao, Nai, Yongliang Wang, Xiaochong Wu, Yifeng Duan, Panshun Li, and Manchao He. 2022. "Real-Time Experimental Monitoring for Water Absorption Evolution Behaviors of Sandstone in Mogao Grottoes, China" Energies 15, no. 22: 8504. https://doi.org/10.3390/en15228504