Article

Dynamic Interactions between Local Energy Systems Coupled by Power and Gas Distribution Networks

1
Beijing Smartchip Microelectronics Technology Company Limited, Beijing 100192, China
2
School of Electrical and Information Engineering, Tianjin University, Tianjin 300072, China
*
Author to whom correspondence should be addressed.
Energies 2022, 15(22), 8420; https://doi.org/10.3390/en15228420
Submission received: 9 October 2022 / Revised: 31 October 2022 / Accepted: 4 November 2022 / Published: 10 November 2022
(This article belongs to the Special Issue Advances in Multi-Energy Systems and Smart Grids)

Abstract

:
Supplied with electricity and natural gas, local energy systems (LESs) with gas-fired generations increase the operational flexibility of urban energy supply. However, the increasing usage of these LESs may lead to adverse impacts on the urban energy system supply via power and/or gas distribution networks. Dynamic interactions between the LESs, electricity, and gas networks subject to different disturbances need to be investigated due to the complexity of the problem. To address this issue, this paper first presents the topology and operating mode of the LESs as well as the relationship with power and gas networks. Second, an extended microturbine model is developed to reflect the nonlinear dynamic propagation of disturbances between the two networks. A general model of the interconnected LESs is developed to analyze the mutual impacts between gas and electricity networks under different modes. Finally, an iterative method is proposed to simulate the mechanism of disturbance propagation between the electricity network, gas network, and LESs, incorporating the impacts of loads and renewables. Case studies reveal that simultaneous regulation of multiple gas-fired generators would reduce the minimum pressure to 50% of the steady-state value. The resulted pressure drop is even lower than the case with higher total gas demand but only one gas-fired generator regulated. Moreover, it is shown that state fluctuations of the gas system last 20 times longer than the electricity system within the LESs. The electrical link between LESs, such as soft opening point with shorter response time, could smooth the fluctuations.

1. Introduction

Due to the advances in hydraulic fracturing technology, it becomes a growing trend to use natural gas, which is abundant and cleaner, in power generation [1]. This trend, along with the emergence of renewable generations and combined heat and power technologies, has profoundly changed the traditional paradigm of energy supply systems [2]. However, intermittent renewable energies and interactions between thermal (heating/cooling), gas, and electric systems could impose significant challenges on the security and management of the urban energy system [3]. Technical implications associated with the energy system integration require detailed analysis, such as the disturbance propagation and mutual support between electricity and gas networks.
However, this analysis requires developing models and tools for the design and analysis of integrated energy systems (IES) [4,5]. Two challenging issues are identified, namely, how to describe the behaviors of the coupled energy systems and how to quantify the interactions among different energy networks. These issues have been intensively researched separately for both the coupling units and energy networks. For coupling units, the energy hub is a representative system in describing the energy conversion process and has been used in the coordination study and design of the IES [6]. However, the energy hub cannot be able to describe the relationship of interconnection between nodes among different energy networks. Additionally, it is not friendly to dynamic and nonlinear behaviors [7]. At the system component level, a key issue is to understand the coupling effect of the microturbines (MTs) in the power and gas systems, since any adjustment in the MT can be transmitted to the power output. Some black-box and analytical models have been developed to describe the energy conversion processes inside the MT [8,9] and the interactions between gas and electricity systems [10]. The problem is that these models mainly focus on certain variables or are designed for the MT operated around the rated operating point, which indicates the models cannot reflect the dynamics of the whole system in a wide range [11]. For energy networks, power and gas systems are coordinated through a unified framework, which incorporates transfer and line-pack capabilities of gas networks in the security and operating cost analysis of electricity systems [12,13]. Furthermore, a multi-vector energy system analysis is conducted to simulate the steady-state behaviors of interrelated heat, gas, and power networks and the impact of renewable integration [14,15]. In [16], a steady-state analysis model with bi-directional energy conversion is used to investigate the effect of renewable energy on the integrated power and natural gas system. In [17], gas traveling velocity and compressibility are taken into account to study energy adequacy in short-term operations. In [18], the integrated electricity and gas system of EU-28 is modeled to examine the potential impacts of gas supply interruptions. These models and analysis methods perform well in the planning and scheduling of the IES, while they may encounter voltage violation or pressure swing problems due to the ignored network and coupling unit dynamics [19,20]. The dynamic model and simulation of a single energy system is mature and used widely in practice, such as PSASP and PSCAD/EMTDC in electricity system, TGNET and SYNERGI in gas system. Though there are no recognized commercial tools for IES, it is attracting great attention. Based on MATLAB/Simulink, an integrated simulation model is established to study the short-term dynamic behaviors of integrated power and gas system. However, it still adopts AC power flow model and steady-state hydraulic model [21]. In [22], a model that can realize a single time frame simulation of two systems is proposed. The model considers the dynamic equation of the natural gas pipeline and the AC power flow model of electricity system. The detailed model of MT is not considered. Compared with electricity system, the dynamic behavior of gas system is slower, ranging from minutes to hours. The distinguished time scales between natural gas and electrical systems result in different and more complex behaviors in the operation [23]. Therefore, there is a pressing need for the development of dynamic analysis approaches for integrated energy systems.
Even though this topic has been intensively studied, two main challenges still exist: (1) How to reflect the mutual impacts of LESs coupled by gas and electricity systems with different dynamics; (2) How to characterize the nonlinear behaviors of gas-fired generators. To address this need, this paper will study the LESs in urban areas as an example, which features electricity and gas distribution networks and LESs which integrate renewable generations and gas-fired units. An interconnected system model will be developed to characterize the dynamic interactions among different energy systems as well as mutual impacts between different LESs through the gas network. The model describes the dynamics of the LES and electricity networks formulated in differential algebra equations (DAEs), and gas networks formulated in partial differential equations (PDEs). A novel Hammerstein-Wiener model for the MT is proposed to reflect dynamic interactions between the two systems. A two-time-scale iterative simulation methodology is then proposed to investigate the dynamic behaviors in the whole system. Numerical results reveal that the variations in LESs can cause a large pressure drop in gas networks with some swings, which will propagate to both the electricity and gas networks in surrounding areas. Moreover, the results show that LES energy changes can help in improving the security of energy networks.
Compared with existing studies, the scope of this paper is extended from steady state to dynamic responses of interconnected LESs following different disturbances. Main contributions include: (i) Framework and operating modes of the interconnected LESs in which the structure of future urban energy systems are clarified; (ii) A novel MT model is developed to reflect the interactions and speed variations in a wider operating range; (iii) An iterative system model is developed to characterize the complex behaviors of the LESs and their energy exchanges with external grids.
The remainder of this paper is organized as follows. Section 2 introduces the framework of interconnected LESs. Section 3 presents the model and disturbance propagation mechanism between LESs. In Section 4 and Section 5, case studies are conducted to discuss interactions among different energy systems and how to smooth the gas pressure fluctuations by coordination within the electricity system. Section 6 concludes the paper.

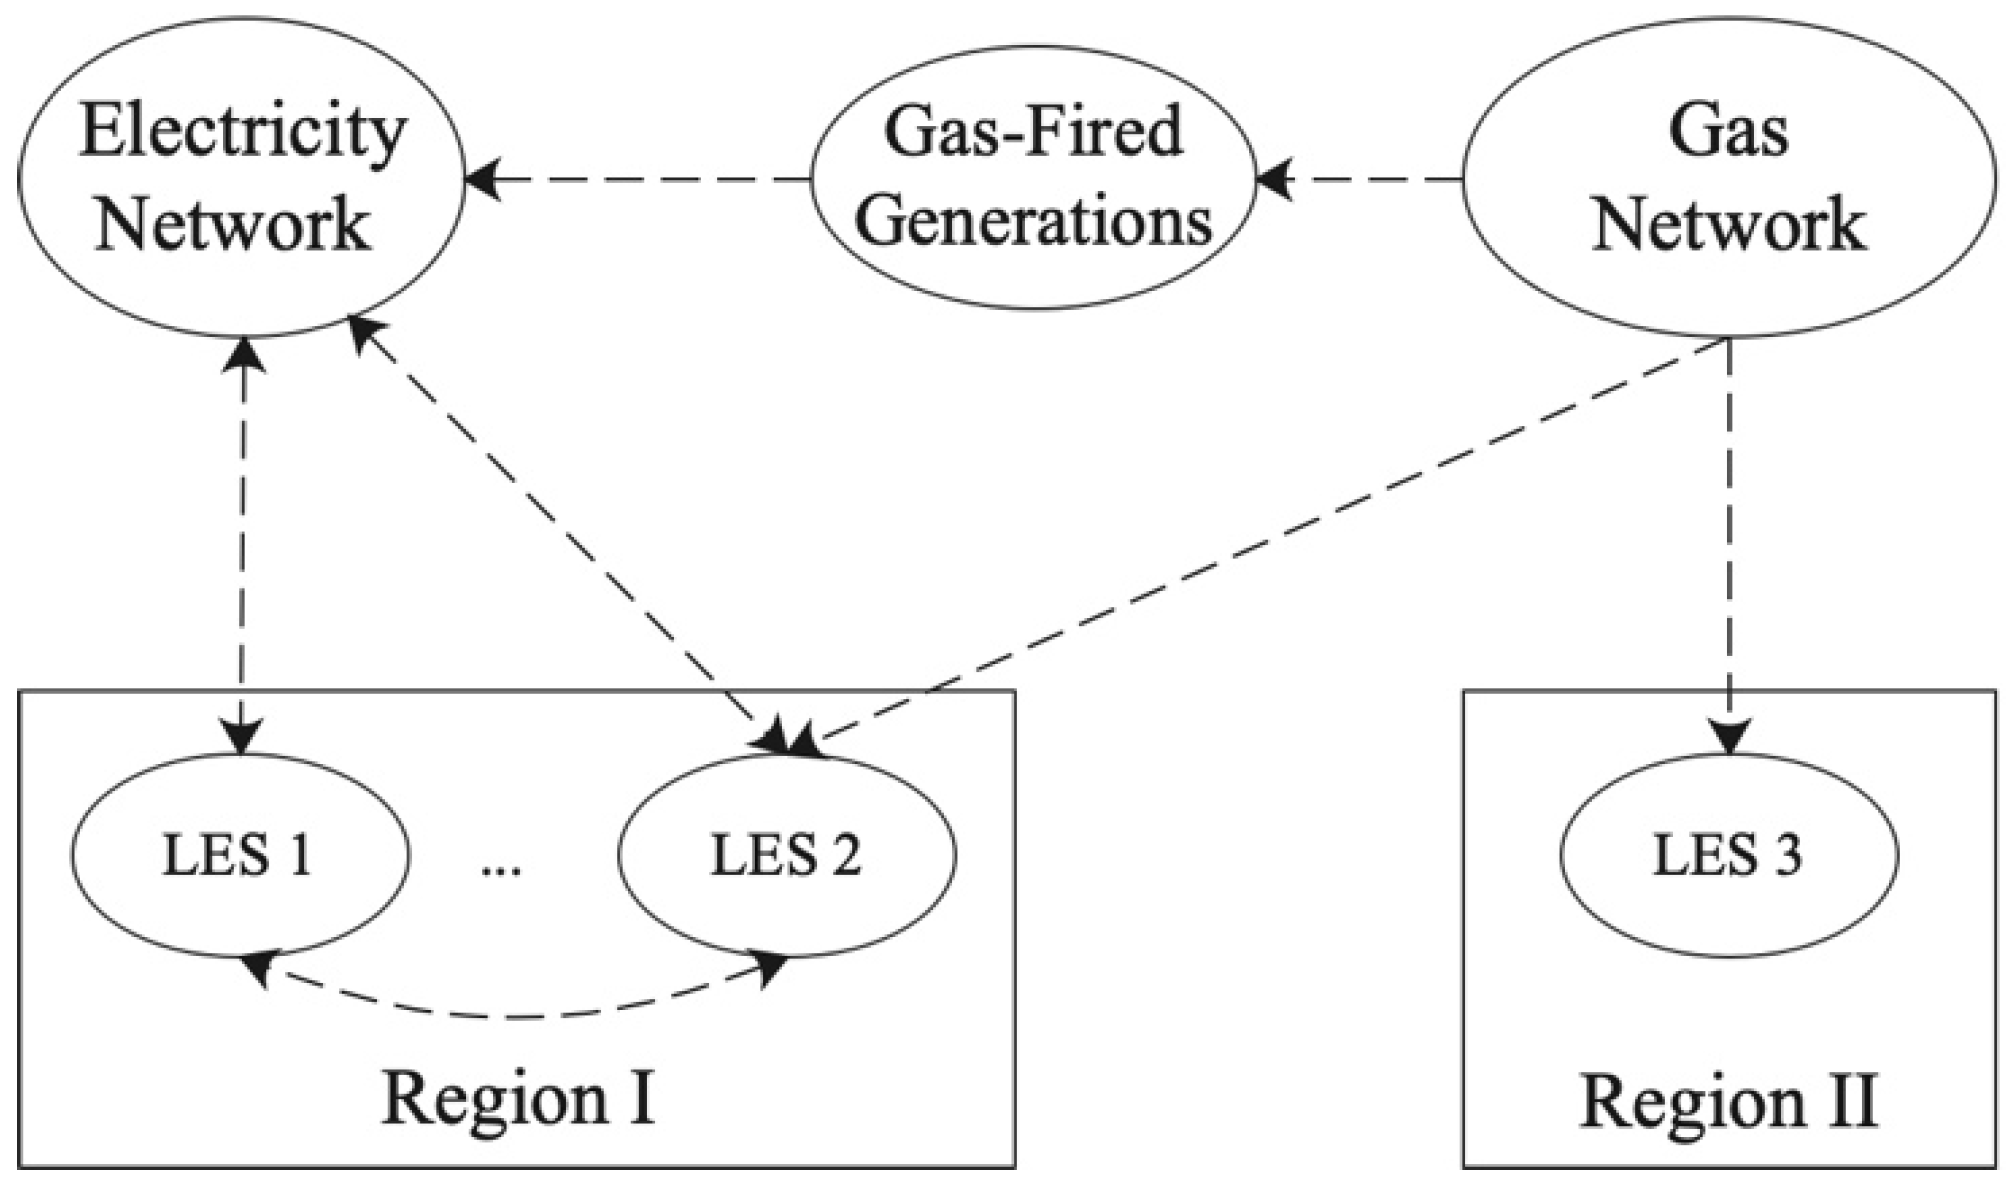
2. Interconnected LESs Coupled by Electricity and Gas Networks

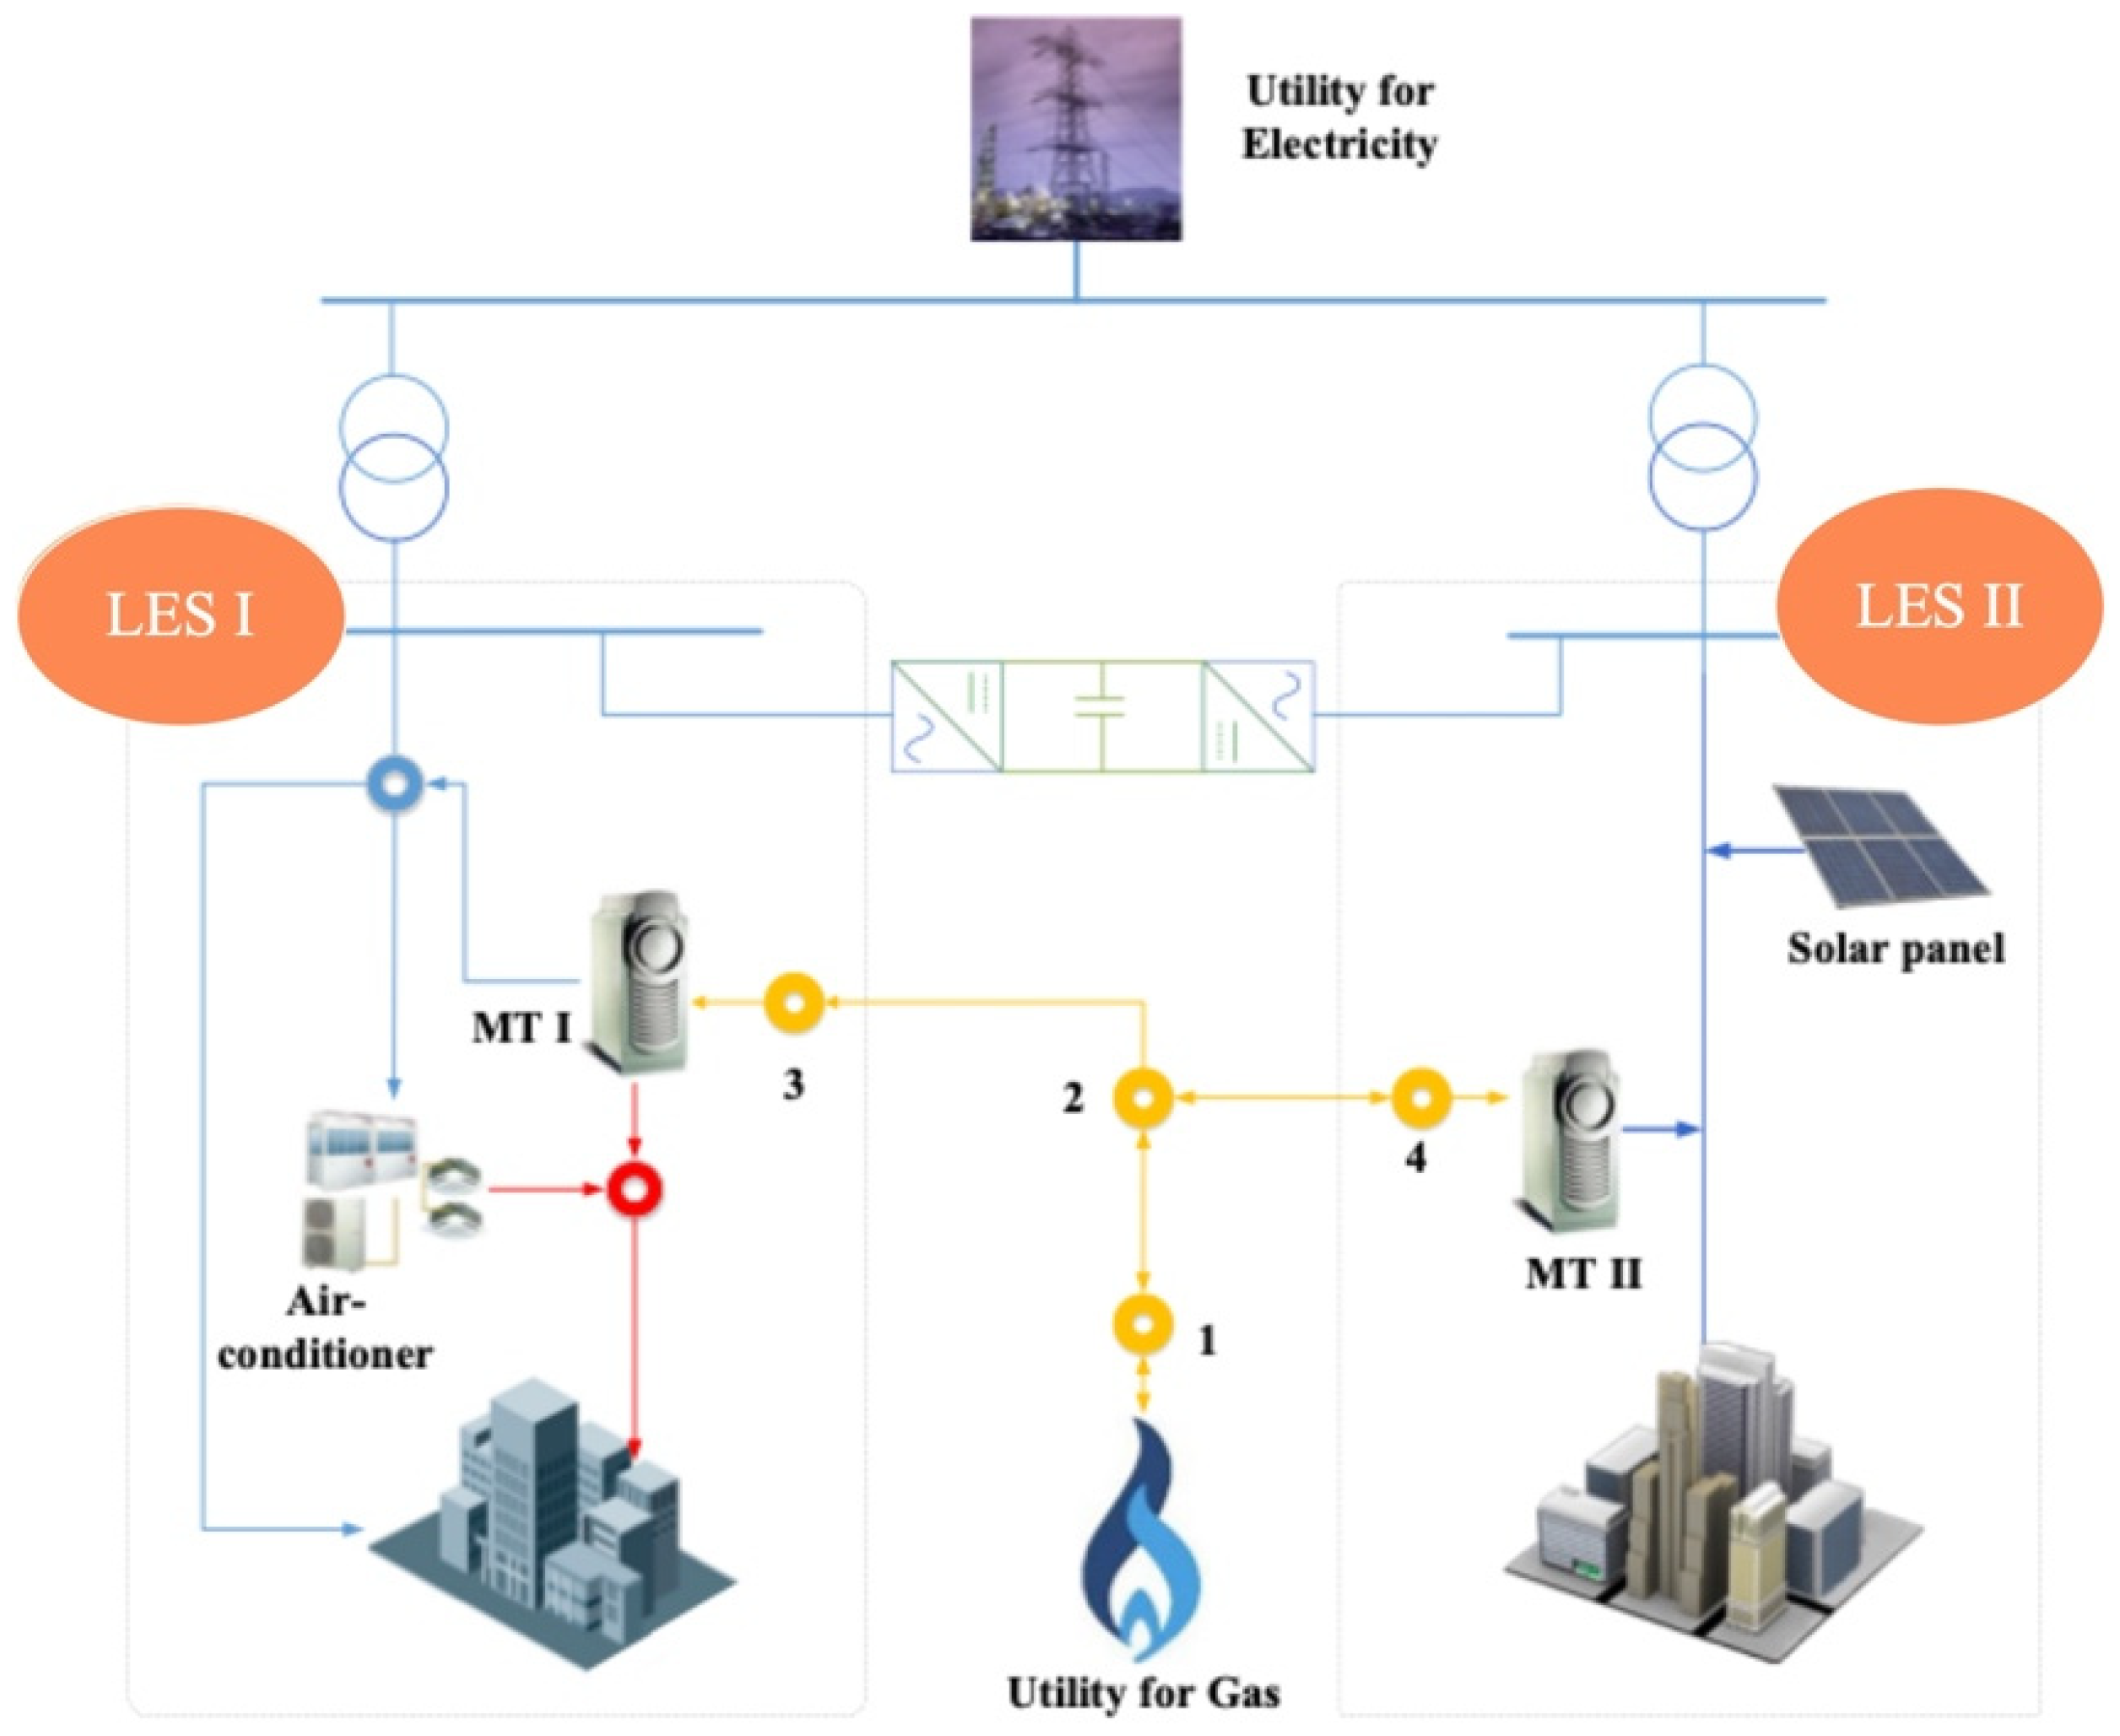
2.1. System Topology

From the topological perspective, a typical urban energy system consists of electricity and gas networks owned by utility companies. By integrating various local generations, the LESs can be connected to electricity or gas networks via timelines, as shown in Figure 1. In this paper, the LESs that are connected to both electricity networks are named as dual-grid-interfaced LESs, which may be owned by customers or third-party investors. Apart from the LESs, the two networks are also coupled by energy conversion units, such as gas-fired distributed generations (DGs), power-driven compressors, and power-to-gas equipment, etc. In most cases, gas-fired DGs, such as MTs, account for the largest proportion of energy exchange units between the two networks. Therefore, the coupling function of MTs, will be highlighted in the following sections. In addition to energy conversion units, the LESs couple power and gas grids by integrating various energy units and loads and exchanging energy with the two networks.

2.2. Operating Modes

As shown in Figure 2, different energy systems, i.e., electricity, gas, and thermal systems, are coupled by energy conversion units, such as MTs, gas boilers, and air-conditioners. These systems, combined with other DGs and energy storage facilities, exchange energy with external electricity and gas networks, and provide energy services to host facilities. In most cases, LESs only take in gas from the gas network when no gas acquisition equipment exists, such as LES 2 and 3 in Figure 1. The LES without gas loads is considered a special form of LESs which is connected to the electricity network only, such as LES 1. Using different coordination strategies, LESs can operate independently or in conjunction with nearby LESs. For example, LES 1 and 2 in region I can exchange power with each other through channels, such as soft opening points (SOP) [24].
According to their connection states with energy networks, the operation of LESs can be divided into the following modes.
(1)
Dual-Grid-Tied Mode: When the LES is accessed to both gas and electricity networks, and takes in energy from the two networks according to heat and power demands. When DGs and gas producers exist, the LES can also feed gas and electricity back to the energy networks.
(2)
Gas-Grid-Tied Mode: When a contingency occurs to the electrical grid, the LES can be isolated from the main grid and operated independently. If connected to the gas network, the LES can still keep facilities running for a long period using CHP and renewable generations.
(3)
Power-Grid-Tied Mode: When there is no gas-fired equipment or when gas valves are closed, LESs are considered to be operated in the power-grid-tied mode. In this mode, LESs only exchange energy with the electricity network. Gas demands can be met by gas storage for a short period. In the longer term, there should be some gas producers, such as biomass gasifiers. Other energy demands are supplied by power sources.
(4)
Isolated Mode: When serious disasters, such as earthquakes or hurricanes occur, both gas and electricity infrastructures may be disrupted or even destroyed. In this scenario, the LES is operated in the isolated mode by coordinating DGs, energy storage, and demand response. In some rural areas where the power grid is weak or unavailable, people build biomass gasifiers and power supply systems, which can be seen as another form of LES operated in this mode.

2.3. Energy Network and LES Disturbances

As illustrated in Figure 2, the LES, the electricity network, and the gas network interact with each other through the MT. Therefore, the electric utility, the gas utility, and the LES owners are interrelated with each other in the urban energy supply system. On one hand, the gas network and the electricity network interact with each other through the MTs. On the other hand, LESs owned by third parties may also affect the operation of each other through the energy networks at the same level. From a location standpoint, the set of disturbances D can be divided into LES disturbance D L E S and energy network disturbance D N .
Disturbances in the electricity network cause state variations in the electricity network, and then affect LESs through electric timelines. Disturbances in the gas networks propagate to LESs by affecting the state of their gas inlet. The set of network disturbance D N can thus be described by
D N = D E N D G N ,
where D E N represents disturbances in the electricity network, such as electric load variations, generation adjustments, interconnected community coordination actions, etc. D G N represents disturbances that occurred in the gas network, such as gas load variations, and valve or compressor adjustments, etc.
LES disturbances come from the variations of renewable generations, loads, and energy exchanges with external networks. For these renewable generations, weather conditions, such as solar irradiance, temperature, and wind speed, can also affect the LES operation. The disturbance set of LES DiM can be expressed as
D i M = D i R e n D i L o a d D i E X ,
where D i R e n and D i L o a d represent the sets of renewable energy sources and loads in LES i. D i E X represents the disturbance from LES j, j = 1, 2, ..., N, ji.

3. Interconnected System Model

Considering various system characteristics and property rights of different sectors, the LES in this paper is described as interconnected energy systems, including the power grid Σ e 0 , the gas grid Σ g 0 , and LESs Σ LES .

3.1. Dynamic System Model

3.1.1. Power Grid

The power grid including loads and generations can be expressed by [25]
( Σ e : ) { x ˙ e = f e ( x e , y e )             0 = g e ( x e , y e , u e ) ,
where u e is power grid disturbances, such as load variations, generation adjustments, etc. x e = [ x e a ,     x e b ,   x e c ] T R n y e are state variables at each phase of the network, including generators, control systems, and loads. y e = [ y e a ,     y e b ,   y e c ] T R n y e are algebraic variables at each phase of the network, including magnitudes and phase angles of the bus voltage and current. f e : R n x e × R n y e R n x e are dynamic state variations of each phase and its relations with other phases. g e : R n x e × R n y e R n y e are steady-state variations of each phase and its relations with other phases.

3.1.2. Gas Grid

The gas grid model consists of the pipeline model and the network topology. Based on the mass and momentum conservation laws, the gas flow in a pipeline can be expressed as [26]
{ 0 = B A M t + p t 0 = p x + 1 A M t + p g B 2 s i n θ + f B 2 M 2 2 D A 2 p ,
where B2 = (∂p/∂ρ)s is the sound speed, s stands for the isentropic process, A is the cross-sectional area of the pipe, D is the diameter of the pipeline, M is the mass flow, f is the friction coefficient, g is the acceleration of gravity, and θ is the angle between the horizon and the pipeline.
The network topology can be described by initial conditions and boundary conditions. Initial conditions, including node pressure and pipeline flow, can be obtained by calculating the steady-state gas flow. The stationary mass flow along a pipe is equal to the connected load. Boundary conditions include the conservation of mass at each node, as well as pressure or mass flow of gas sources and loads. Therefore, the gas network Σ g in the interconnected systems can be modeled by
( Σ g : ) { t x g = f g ( t , x g , p x g ) x g ( 0 , p ) = x g 0                               x g ( t , 0 ) = g g ( u g , x g ) x g ( t , D ) = h g ( u g , x g ) ,
where u g = [ u g m ,   u g g ] T D G N is the gas demand. u g m = [ u g 1 , u g 2 , , u g l ] T is the gas demand of the LESs. u g g is the gas demand of other gas loads. x g is the node pressure and pipeline flow of the gas network, p is the position variable. D = [ D 1 , D 2 , , D k ] T is the length of the pipelines in the gas network. k is the pipeline number. g g and h g are the boundary conditions of the gas network. x g 0 is the initial condition of the gas network.

3.1.3. LESs

In this paper, the MT is considered due to its coupling function to the energy networks as well as loads and DGs in LESs. Specifically, a single shaft MT is modeled. In traditional MT models, the MT speed is usually assumed to be around 1.0 p.u. When the MT output increases, the MT speed decreases. This assumption is inconsistent with the real MT characteristics, where the speed increases as its power output rises. The problem lies in the reference speed which needs to be adjusted according to the load signal. Inspired by the Wiener-Hammerstein model [9], an improved MT model is proposed here by extending the model in [10] with a nonlinear part. Due to the strong nonlinear characteristics, a radial basis function (RBF) neural network model is used to describe the reference speed and the load signal. The model is a linear combination of RBF neural nodes. A fast-recursive algorithm [27] is employed to select the hidden nodes and model the relationship between the load signal and the rotational speed. The parameters of the model (6) are obtained by the identification method based on data acquired from physical experiments. With this model, the load signal P m t r e f of the MT is converted to the reference of the engine speed ω r e f , and then transmitted to the linear part as an input.
ω r e f = i = 1 m λ i ϕ i ( P m t r e f , σ i , c i ) = Φ T Λ ,
where Φ = [ ϕ 1 , ϕ 2 , , ϕ m ] T , Λ = [ λ 1 , λ 2 , , λ m ] T is the linear output weight of node i, and ϕ i ( P m t r e f , σ i , c i ) denotes the RBF of the ith hidden node. c = [ c 1 , c 2 , , c m ] T and σ = [ σ 1 , σ 2 , , σ m ] T are the center and width vectors of the Gaussian function.
Based on mechanism analysis, the linear part of the model is obtained to describe the interactions between the two networks. The reference value for the engine speed is combined with the obtained model to describe the MT behavior on a wider operating scale. MT fuel consumption F m t is also an input of the model. MT power output P o u t and fuel inlet pressure   p m t are chosen as outputs of the model. The MT model can thus be described by
{ x ˙ m t = f m t ( x m t , y m t , x m t ( t τ ) )     0 = g i ( x m t , y m t , u m t )                                                 ,
where y m t = [ P o u t ,   p m t ] T is the MT output, u m t = [ P m t r e f , F m t ] T , τ represents the combustor time delay and the exhaust time delay, x m t is the MT state variable, including the engine speed, the exhaust gas temperature, etc.
The load signal of the MT umt is determined by
u i m t = ϕ i ( u i R e n , u i L o a d , m m t ) ,
where ϕ i represents the energy management system of LES i; mmt represents the operating mode of the MT in LES i.

3.1.4. Overall System Model

Combining the MT model with other DGs and load models, the dynamic model of LES i can be expressed as
( Σ m i : ) { x ˙ i = f i ( x i , y i )                                                                                                   0 = g i ( x i , y i , u m i ) + h i ( c e i u e i , c g i u g i , u e x i ) ,
where x i R n i x and y i R n i y are state variables (rotor angles, rotor speeds, gas node pressure, water temperature, etc.) and algebraic variables (voltages, angles, gas flows, etc.), i = 1, 2, ..., l; f i : R n i x × R n i y R n i x and g i : R n i x × R n i y R n i y are hybrid continuous and discrete functions, and represent dynamic and algebraic relationships between energy subsystems in LES i; u m i = [ u i L o a d ,   u i R e n ] T represents the variations of loads u i L o a d D i L o a d and renewable generations u i R e n D i R e n ; u e i and c e i are the power exchange and connection state between LES i and the electricity network; u g i and c g i are the gas exchange and connection state between LES i and the gas network; u e x i = [ c e x i 1 u e x i 1 , c e x i 2 u e x i 2 , , c e x i l u e x i l ] are the power exchange between LES i and other LESs; c m i j and u m i j are the power exchange and connection state between LES i and LES j, ji. If i = 0 , i j i = l c m i j = 0, LES i is supported by itself. Otherwise, it is cooperating with LES j, if c m i j ≠ 1.

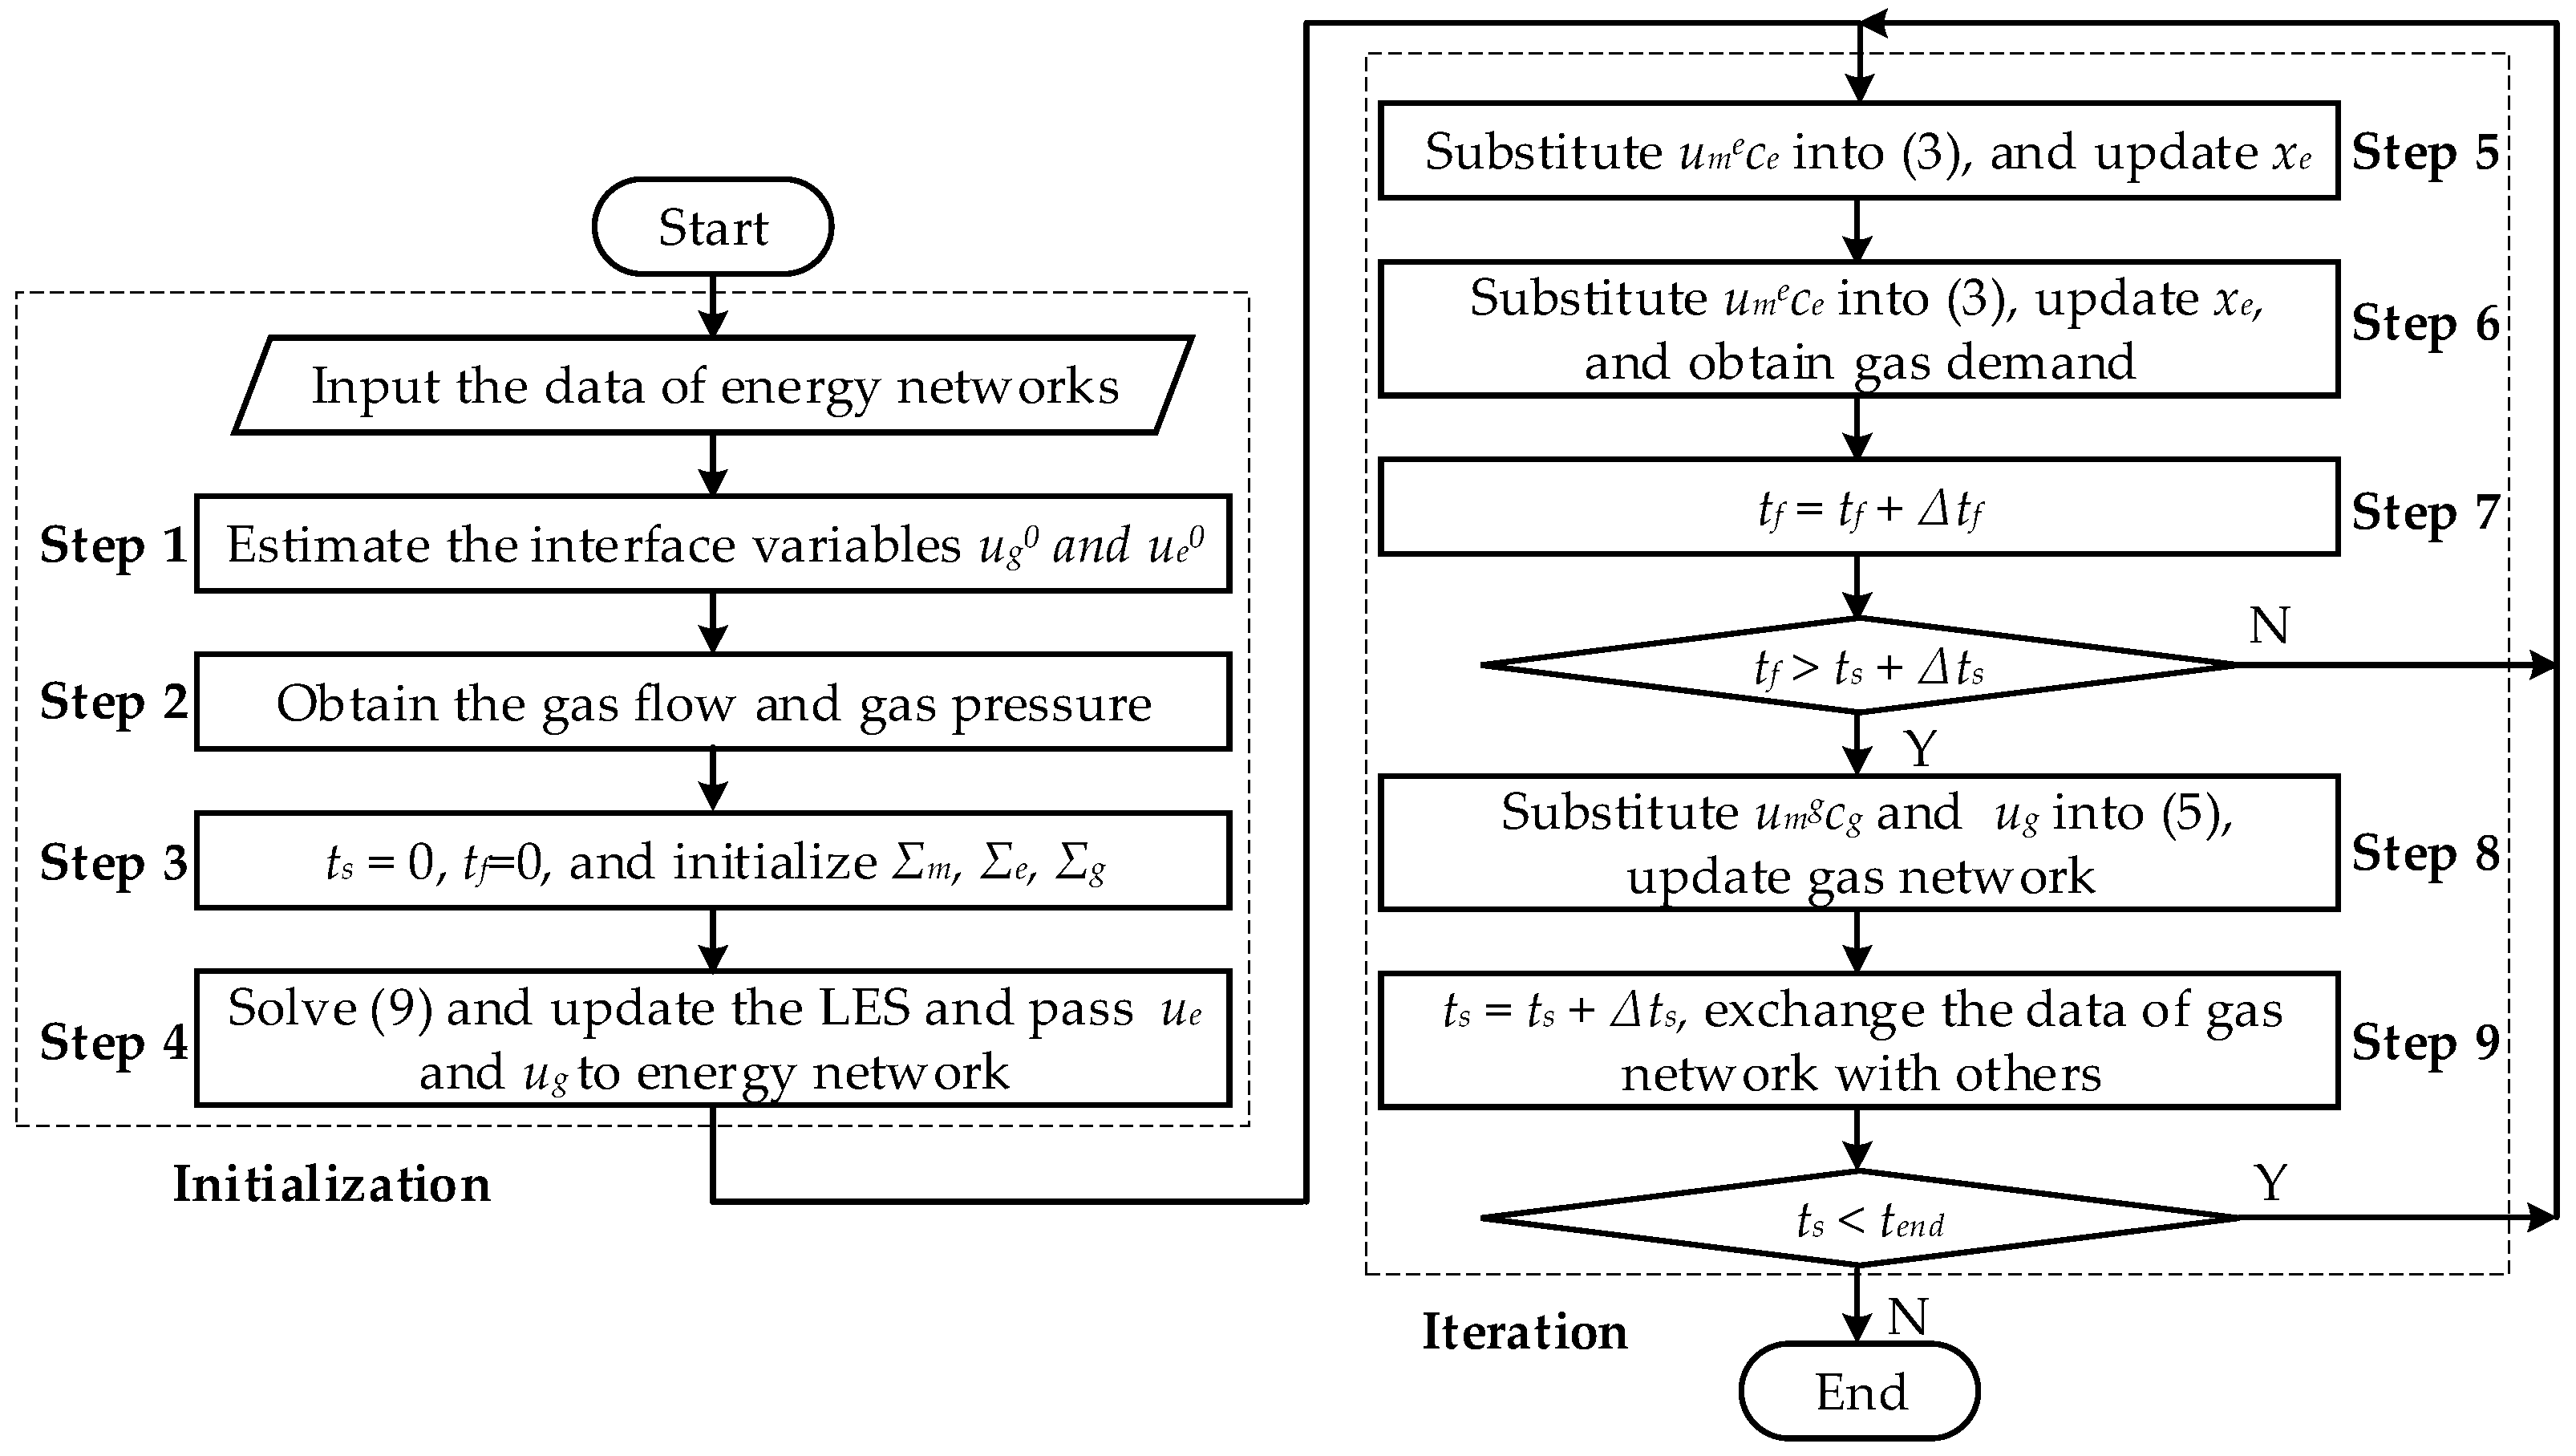
3.2. Iterative Simulation Method

In contrast to gas and power networks, LESs include multiple energy systems with complex behaviors in small spatial scales. When integrated into the energy networks, it is difficult to simulate the whole system in a unified framework. To characterize the behaviors of the interrelated subsystems, an iterative methodology is utilized to simulate this system, as shown in Figure 3.

3.2.1. Initialization

The interrelated subsystems are initialized by calculating the steady-state energy flows of the energy networks. The specific initialization process is presented as follows.
Step (1): Estimate the interface variables (gas exchange ug0 and power exchange ue0) between LESs and energy networks based on DG outputs and loads of LESs.
Step (2): Set LESs as PQ buses in the electricity network, and then solve the electric power flow according to the power exchange ue0. Calculate the gas demand of the electricity network if gas-fired generations exist.
Step (3): Solve the gas flow according to the LES gas demand ug0 and calculate the gas pressure of each node as initial conditions of (5).
Step (4): Set ts = 0, tf = 0, and then initialize state variables of LESs Σm, the power grid Σe, and the gas network Σg.

3.2.2. Iterative Simulation
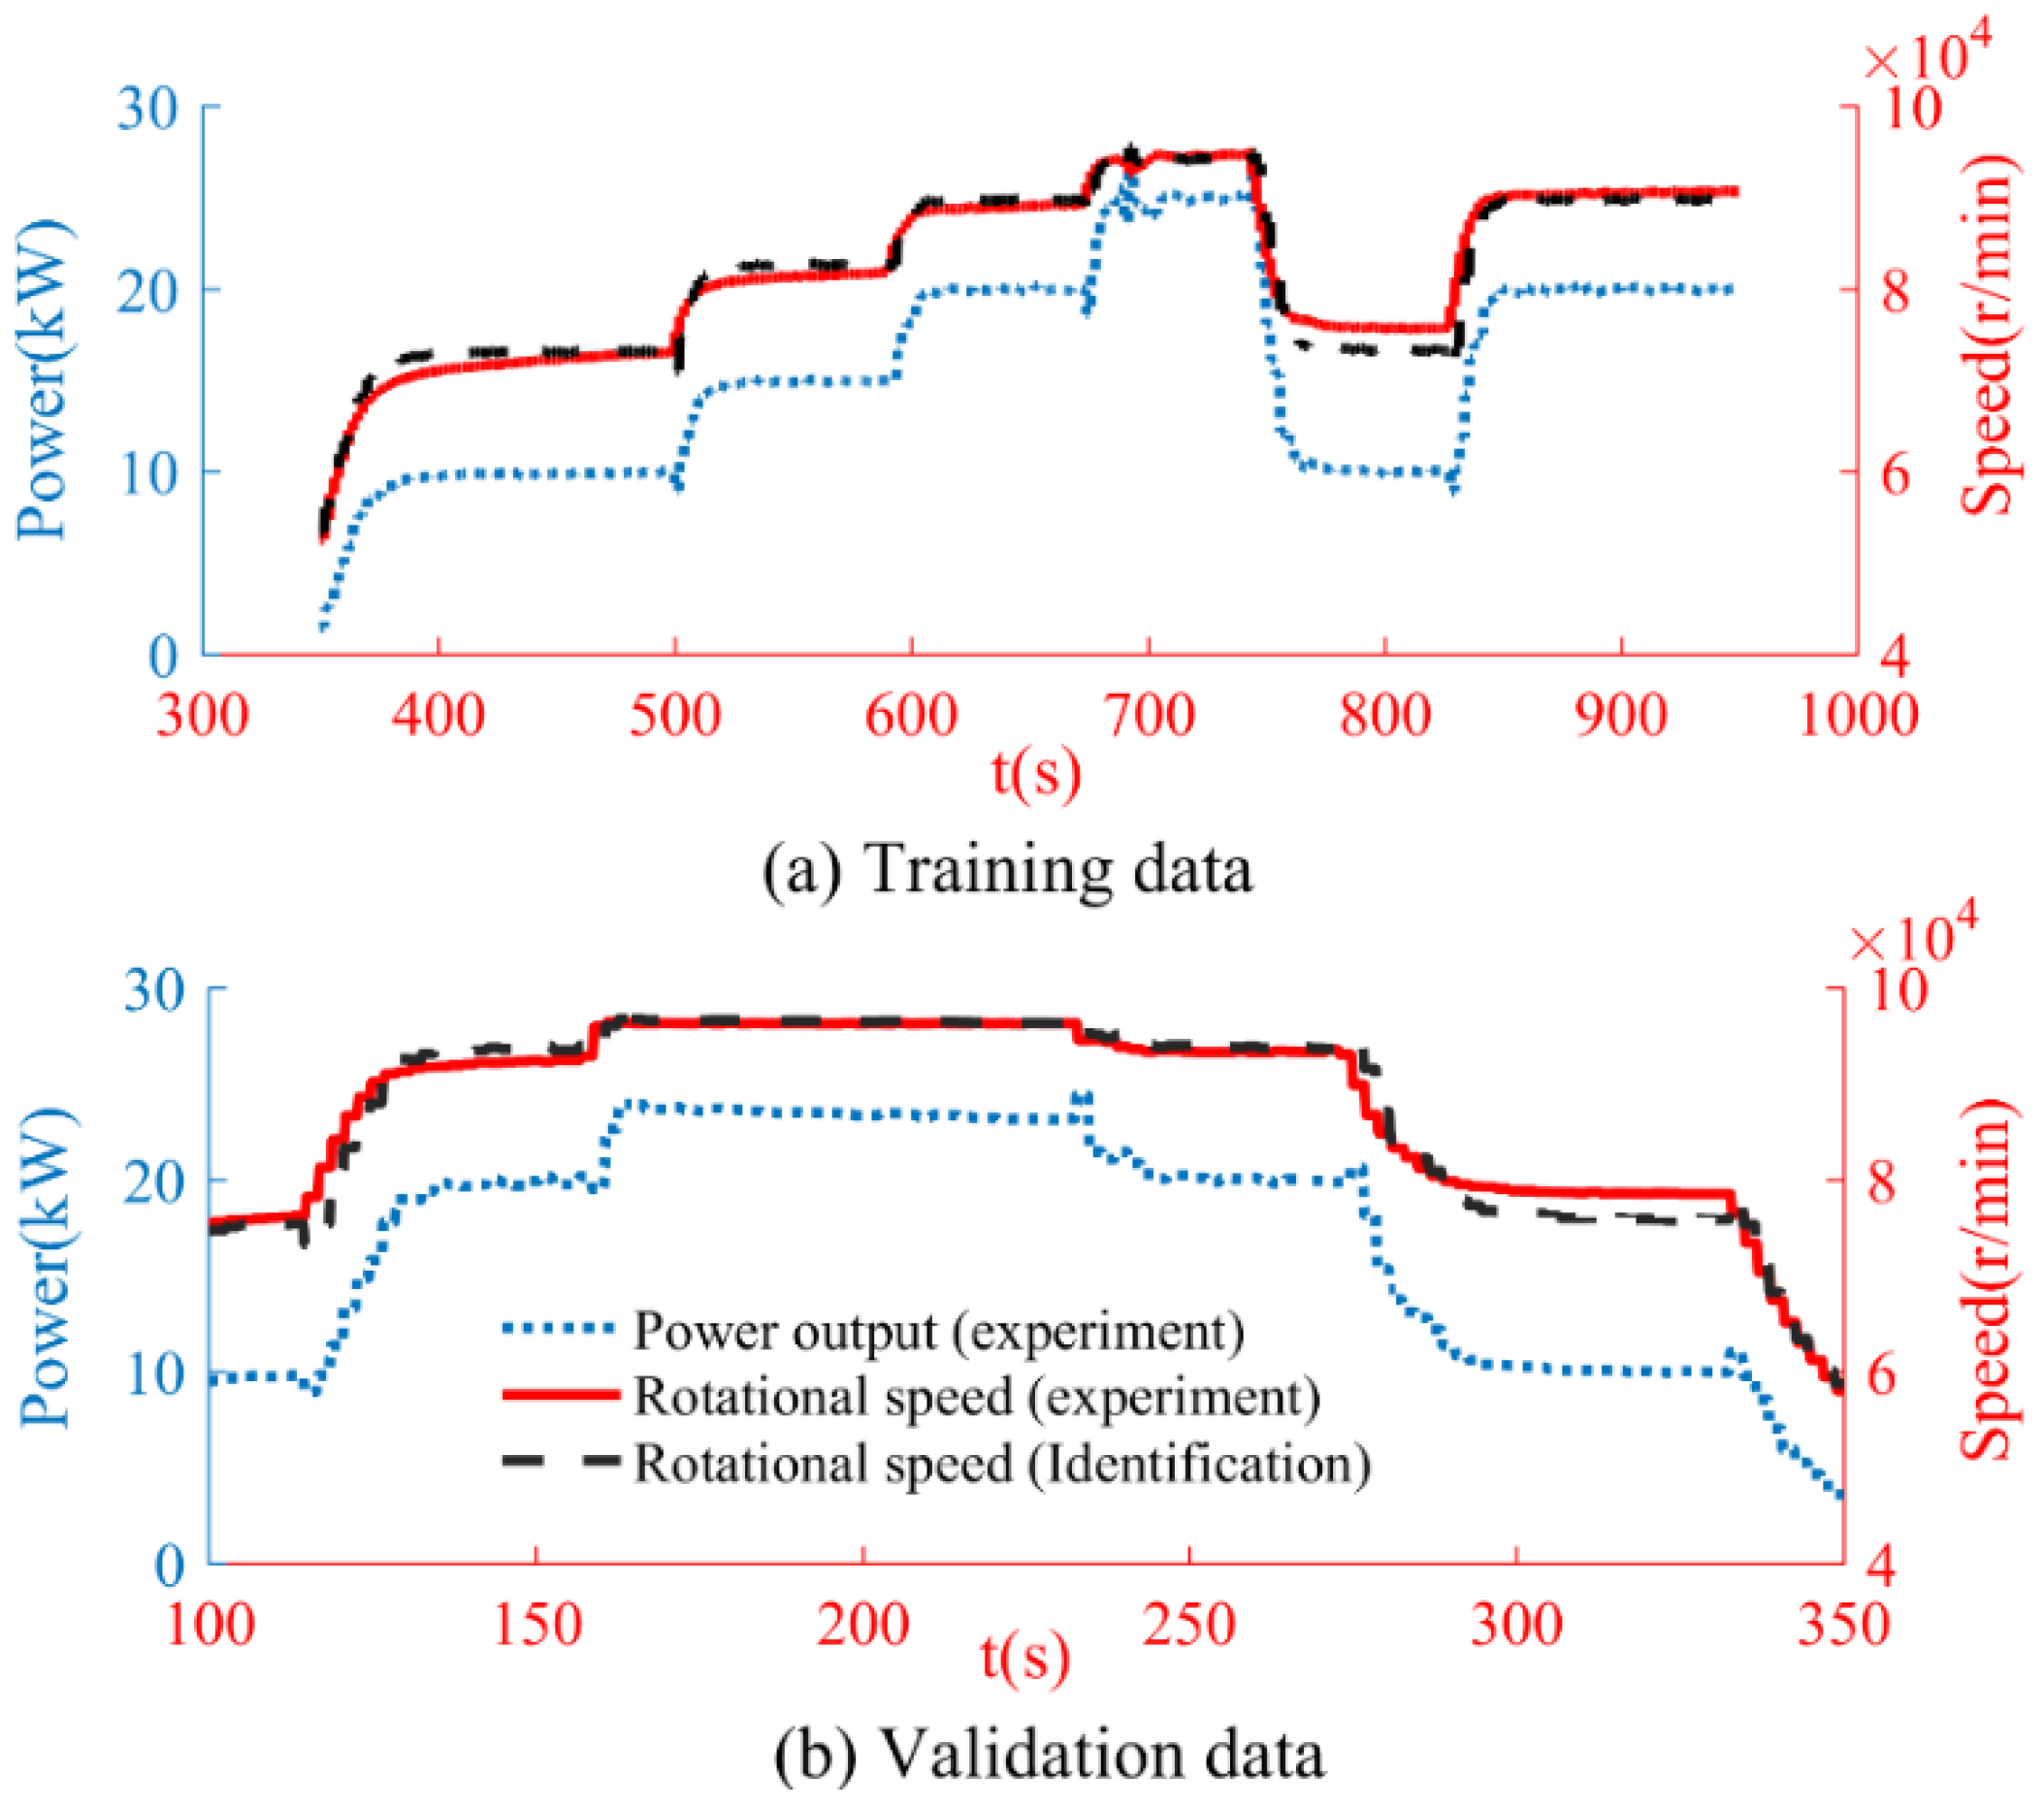
One key factor that affects the computational efficiency is the step size for the simulation. It is safe to select a constant, small step size for all subsystems as long as the attraction region exists. As the spatial step and time step are correlated with each other, a smaller time step indicates more spatial steps and will significantly increases the dimension of the integrated system. The time required for the simulation will be significantly longer. Nevertheless, it is also necessary to finish the analysis in a finite period, particularly for long-term simulations. Considering the slow response time of the gas system, it is simulated with a larger step ∆ts compared with other parts of the system.
Incorporating different subsystem characteristics while ensuring the performance of the algorithm, an iterative dynamic simulation method is employed to describe the behaviors of the interconnected system. The algorithm is presented as follows.
Step (5) Solve (9) to update LES internal states and interface variables. The obtained power exchange ue and the gas inlet pressure ug are passed to the energy networks.
Step (6) Substitute umece into (3), and update the power grid states. Then, calculate its demand from the gas network if gas-fired generations exist.
Step (7) Set tf = tf + ∆tf, if tf > ts + ∆ts, continue; otherwise go to Step (5).
Step (8) Substitute umgcg and variations of other gas loads ug into (5), and then calculate the states of the gas network.
Step (9) Set ts = ts + ∆ts, and exchange the data of the gas network with LESs and the electricity network. If ts < tend, go to Step (5), otherwise terminate.
Although the iterative method avoids simulating the systems with different dynamics as a whole, the mutual impacts through the coupling variables bring about new issues for numerical implementations. For example, an evident change in the gas flow injected into the MT within one time step may result in the divergence of the other systems and further influence the overall system simulation. To address these issues, a key condition that needs to be met is that the state changes of one system caused by the change in the coupling variables must lie inside the convergence domain of the integrated system. In addition to the mutual impacts, controlling the step and grid sizes is also required to solve a given problem with a specified accuracy within a certain amount of time. In practice, a proper choice of the step and grid sizes is usually custom-designed for specific applications, and they should satisfy the following rules: (1) The fast step size ∆tf is set according to the accuracy requirements for the analysis of LESs and the external electricity network; (2) The slow step size is set to ensure that the fast system can converge to a steady state within ∆ts under any step changes of the gas system; (3) For the gas network discretization, the spatial and temporal grid sizes should satisfy ∆pBts.

4. Case Studies

In this section, the proposed interconnected model and simulation method are applied to investigate the dynamic behaviors of interconnected LESs. As shown in Figure 4, the test system includes two LESs with MTs which are accessed to both power and gas grids. To reflect future elements in the urban energy systems, a SOP is also setup. It is assumed that the upper-level gas grid can maintain the gas pressure of Node 1 at 5 kPa (hereafter gauge pressure is used to describe the pressure). Parameters of the pipelines are illustrated in Table 1.
The coupling unit model, i.e., the MT model, is obtained by adding a nonlinear part to the model developed in [10]. The parameters of the nonlinear part are extracted from a Capstone C30 MT. According to (6), the load signal and the engine speed of the MT are selected as the input and output of the nonlinear model. Two groups of data are employed for model training and validation, as depicted in Figure 5. It can be observed that, with the nonlinear part included in the model, the proposed model can well reflect the change trend of the MT rotational speed. As a further validation, the simulation results of MT power output are compared with the field measurement data. It can be seen that from Figure 6, the power output of the proposed model is highly consistent with the field measurement in most cases. Note that some fluctuations of MT power output are observed in the field measurement when the set-point reaches 25 kW. This is due to the fact that the studied MT is connected to a low-pressure gas network that limits the maximum MT power output. The MT shows strong nonlinear features when closing to the maximum power output.
Based on the model, this section will discuss the interactions between LESs and energy networks under different scenarios. As illustrated in Figure 4, the power grid is connected to the gas grid indirectly through LESs or directly through gas-fired generations. The gas grid is used as an energy source for the LESs and the power grid. LESs without MTs (operated in the power-grid-tied mode) are treated as part of the power grid in urban areas, since they have no direct impacts on the interactions between the two energy networks. For the dual-grid-tied LES, the MTs are usually used to supply heat and power to facilities. Under normal conditions, the output variations mainly include the pre-planned scheduling variation and short-term load following. Their impacts on the gas grid depend on the loads of the LESs. For the grid level operation, when a MT is employed to smooth renewable generations or support the power grid operation, the interactions between the two grids are similar to the case between a LES and the gas grid. Next, we will first investigate interactions between gas grid and LESs operated in the dual-grid-interfaced mode under internal disturbances. Then, mutual impacts between LESs are studied. Finally, impacts of power grid faults are analyzed.

5. Results and Discussion

In this section, the results of interactions between LESs and energy networks are discussed separately, including mutual impacts of LESs via gas network and electricity network, and impact of power grid contingencies on the gas grid.

5.1. Mutual Impact of LESs via Gas Network

Without loss of generality, the MT in LES I (hereafter referred to as MT I) is adjusted to analyze its impact on the gas network. The power output of MT is shown in Figure 7. The power output of MT II is set be constant at 15 kW. As shown in Figure 8, the MT output variations lead to the pressure fluctuation of the whole gas grid. As the MT output decreases at 120 and 160 s, the gas pressure increases when it reaches steady states. It can be noticed that the proposed model is able to capture the changing use of fuel during the transient process. Due to less gas consumption, the maximum value of the MT inlet pressure is higher than its steady-state value during the deceleration process. Similar results can be observed as the MT output increases at 200 and 240 s. During the MT acceleration process, more gas is absorbed and leads to a serious pressure drop which is lower than 2000 Pa. The short-term pressure drop can further affect the state of other gas-fueled equipment connected to the same gas network. In the extreme scenarios, it can trigger the protection scheme and shut down the pressure sensitive equipment, such as the MT.
From the viewpoint of the LESs, the pressure change in the gas grid can affect the operation of the LES, as well. As illustrated in Figure 9, although the output of MT II is set to be constant, some speed swings can be observed in the MT. This is due to the fact that the MT fuel control system increases the valve opening to maintain the MT output at the set-point. Moreover, compared with the smooth power output changes, the gas system requires a significantly longer period (more than 20 s) to converge to the steady state. Therefore, to avoid the lagging influence of the slow varying gas system, its dynamics should be taken into account in LES control and dispatched if it involves MT adjustments.

5.2. Impact of Electricity Exchanges between LESs

In LESs, the mismatched energy between the loads and the generations can be positive or negative. If the energy imbalance can be exchanged between the two LESs, less MT output adjustments will be conducted. Therefore, it is easy to understand that the exchanged energy can mitigate the impact of the LESs on the gas grid. In this case, a SOP is setup to investigate the short-term impact of LES energy exchanges on MT outputs and gas grid. The relevant exchange energy between the two LESs is shown in Figure 10. It can be seen that although the exchanged energy varies with different amplitudes, less than 1% of MT output variations can be seen at 190 s, as depicted in Figure 7. Due to the isolation of DC links, no fluctuations are observed in the gas grid and MT states. Since the SOP is implemented based on power electronic devices, other inverter-interfaced DGs have similar effects with the SOP. Therefore, we can conclude that power grid and other DGs almost have no impacts on the gas grid and MT states in the short term unless the MT is set as the slack bus of the LES in the gas-grid-tied mode. In the long term, variations in the power grid and LESs affect the gas grid through their energy management systems.

5.3. Impact of Power Grid Contingencies on the Gas Grid

In contrast to energy grids, LESs are more vulnerable to external conditions including grid faults, weather conditions, human behaviors, etc. These condition changes are transmitted to the energy grids, notably when LESs are connected to only one grid. Under normal operating states, all LESs can be influenced by disturbances from their accessed grids. In this paper, we focus on the network disturbances due to power grid faults. Gas grid faults are not considered, given the line-pack capability of the upper-level gas network. Compared with normal adjustments in LESs, power grid faults can make greater impacts on the gas grid since different LESs are likely to be disconnected from the power grid simultaneously. If MTs are used as slack buses of the LESs, the energy imbalance of all LESs will be transmitted to the gas grid through MTs. In the worst scenarios, all these imbalanced values are negative, which will lead to a sudden load rising to the gas grid.
Assume that a fault occurs to the power grid at 54.9 s, the two LESs are then disconnected from the power grid at 55 s. The operating mode of the LESs is switched from the dual-grid-tied mode to the gas-grid-tied mode to adapt to the mismatch between the generations and the loads. Suppose that the two LESs require more generations, the two MTs increase their power outputs as shown in Figure 11. A pressure drop can be observed in the gas grid at 55 s as shown in Figure 12. The minimum pressure of the gas grid is lower than half of the steady-state values, which will affect the operation of other pressure-sensitive loads in the surrounding areas. Moreover, impacts of the two MTs on the gas grid overlay during the transient process. Although the inlet pressures of the two MTs converge to values which are higher than 3600 Pa, the minimum value of the pressure during the adjustment process is below 2500 Pa, due to the increasing use of gas for both MTs. The minimum value at Node 4 is even lower than the steady-state value after the MT power output increases at 149 s, where more gas is consumed by the MTs. Since the amount of energy imbalances are not the same, the required periods for MT adjustments are different, which lead to some pressure fluctuations during the mode switching process in addition to the pressure drop. When multiple MTs co-exist in one gas grid, behaviors of the gas grid and LESs can be more complex. Therefore, dynamic analysis is vital for the design of LES management and control system.
After switching to the gas-grid-tied mode, the fluctuation of solar panel power outputs and loads, are partially passed to the gas grid via MTs. These fluctuations are treated as a whole. The resulted MT output changes are shown in Figure 11. The output increase in MT I results in the gas pressure drop at Node 3. Then, this pressure variation is propagated to Node 4. It can be seen from Figure 12 that speed swings are observed in MT II, as the output of MT I changes at 135 s. Similar observations can be found at 190 s when the power output of MT II is adjusted. Although no clear output variation of the two MTs occurs, the impacts on the MT speed should be considered from the viewpoint of security operations, since the engine speed plays a key role in the MT operation. It should be noted that although the amplitude of pressure drops can be different when various parameters of the control system are set, their impacts cannot be ignored in the gas grid analysis.
In practice, valves in the upper level will be activated to maintain the gas pressure level, but may not be fast enough to follow the gas pressure fluctuation caused by MTs. Moreover, the capability of valves may not be able to cover the gas needs of the newly installed MTs, particularly in the extreme cases where the power output of MTs in all LESs increase evidently at the same time. Considering the serious pressure drop in the short term, these impacts need to be carefully checked in both steady and dynamic states from the viewpoint of the gas network. When the valves cannot maintain the pressure level, certain coordination schemes can be put in place to the energy management system of the LESs in order to avoid the unexpected shutdown of other gas loads.

6. Conclusions

This paper investigates in detail the dynamic interactions between LESs coupled by the electricity and gas networks in urban areas. By taking into account the energy services provided by the gas networks, various operating modes of LESs are studied, namely dual-grid-tied mode, gas-grid-tied mode, power-grid-tied mode, and isolated mode. A novel MT model has been proposed to capture the nonlinear interactions between the gas and electricity networks. Based on the MT model, an interconnected system model is proposed to characterize the dynamic behaviors of interconnected LESs. An iterative methodology is then proposed to reflect the disturbance propagations among different LESs.
Numerical studies reveal that although LESs are able to increase the flexibility of the local energy systems, the required gas delivery may increase the vulnerability of the energy supply systems if MTs in different LESs are not well coordinated. First, fast changing loads and DGs can result in the pressure swings of the gas grid when MTs are used to smooth the impact of renewables or to follow loads. During the transient process, the minimum pressures are significantly lower than their steady states due to the increasing gas consumptions for MT accelerations, which will cause negative impacts on surrounding gas consumers. Second, in the case that multiple LESs are connected to one gas grid, disturbances in one LES can be transferred to other LESs through MTs. Due to the isolation of the DC link, neither MT outputs nor the power grid are significantly influenced by the gas grid variations during normal operations. However, evident speed swings can be noted, which is closely related to the operation security of MTs. Third, when a power grid fault occurs, different LESs may be switched to the gas-grid-tied mode, the imbalanced energy is then passed to the gas grid simultaneously and lead to MT speed changes and a pressure drop with longer durations. In extreme cases, the pressure drops can lead to MT output saturation or even shutdown.
In the future, the dynamic fluctuations and stability issues observed in this paper will be further studied via theoretical tools, such as eigenvalue analysis or Lyapunov functions, particularly for the urban areas with multiple LESs. The tools will be able to help in optimizing the operation strategies and enhancing the system security level.

Author Contributions

Conceptualization, X.X.; methodology, Y.H.; validation, J.L.; formal analysis, Y.H.; investigation, Y.H. and J.L; data curation, J.L.; writing—original draft preparation, Y.H.; writing—review and editing, Y.H.; visualization, J.L.; supervision, X.X.; project administration, X.X.; funding acquisition, X.X. All authors have read and agreed to the published version of the manuscript.

Funding

This research was funded in part by the joint project of National Natural Science Foundation of China under Grants 52107119 and 52061635103 and Engineering and Physical Sciences Research Council of the UK under Grant EP/T021969/1.

Conflicts of Interest

The authors declare no conflict of interest.

Nomenclature

D N Set of disturbances in the energy network
D E N , D G N Sets of disturbances in electricity and gas systems
D i M Set of disturbances in LES i
D i R e n , D i L o a d Sets of renewable energy sources and loads in LES i
u e Disturbances in the electricity network
x e State variables at each phase of the electricity network
y e Algebraic variables at each phase of the electricity network
ugGas demand of gas network
xgNode pressure and pipeline flow of gas network
x i , y i State variables and algebraic variables in the overall system model
ts, ∆tfLarge step size and fast step size for simulation, respectively

References

  1. Li, L.; Wu, F.; Cao, Y.; Cheng, F.; Wang, D.; Li, H.; You, J. Sustainable development index of shale gas exploitation in China, the UK, and the US. Environ. Sci. Ecotechnol. 2022, 12, 100202. [Google Scholar] [CrossRef] [PubMed]
  2. Grubert, E.; Zacarias, M. Paradigm shifts for environmental assessment of decarbonizing energy systems: Emerging dominance of embodied impacts and design-oriented decision support needs. Renew. Sustain. Energy Rev. 2022, 159, 112208. [Google Scholar] [CrossRef]
  3. Hall, J.W.; Tran, M.; Hickford, A.J.; Nicholls, R.J. The Future of National Infrastructure: A System-of-Systems Approach; Cambridge University Press: Cambridge, UK, 2016. [Google Scholar]
  4. Li, C.; Wang, N.; Wang, Z.; Dou, X.; Zhang, Y.; Yang, Z.; Yang, Y. Energy hub-based optimal planning framework for user-level integrated energy systems: Considering synergistic effects under multiple uncertainties. Appl. Energy 2022, 307, 118099. [Google Scholar] [CrossRef]
  5. Liu, W.H.; Ho, W.S.; Lee, M.Y.; Hashim, H.; Lim, J.S.; Klemeš, J.J.; Mah, A.X.Y. Development and optimization of an integrated energy network with centralized and decentralized energy systems using mathematical modelling approach. Energy 2019, 183, 617–629. [Google Scholar] [CrossRef]
  6. Son, Y.G.; Oh, B.C.; Acquah, M.A.; Fan, R.; Kim, D.M.; Kim, S.Y. Multi energy system with an associated energy hub: A review. IEEE Access 2021, 9, 127753–127766. [Google Scholar] [CrossRef]
  7. Mohammadi, M.; Noorollahi, Y.; Mohammadi-Ivatloo, B.; Yousefi, H. Energy hub: From a model to a concept—A review. Renew. Sustain. Energy Rev. 2017, 80, 1512–1527. [Google Scholar] [CrossRef]
  8. Asgari, H.; Venturini, M.; Chen, X.; Sainudiin, R. Modeling and simulation of the transient behavior of an industrial power plant gas turbine. J. Eng. Gas Turbines Power 2014, 136, 061601. [Google Scholar] [CrossRef]
  9. Mohammadi, E.; Montazeri-Gh, M. A new approach to the graybox identification of wiener models with the application of gas turbine engine modeling. J. Eng. Gas Turbines Power 2015, 137, 071202. [Google Scholar] [CrossRef]
  10. Xu, X.; Jia, H.; Chiang, H.-D.; Yu, D.; Wang, D. Dynamic modeling and interaction of hybrid natural gas and electricity supply system in microgrid. IEEE Trans. Power Syst. 2015, 30, 1212–1221. [Google Scholar] [CrossRef]
  11. Shen, F.; Ju, P.; Shahidehpour, M.; Li, Z.; Wang, C.; Shi, X. Singular perturbation for the dynamic modeling of integrated energy systems. IEEE Trans. Power Syst. 2020, 35, 1718–1728. [Google Scholar] [CrossRef]
  12. Qiu, J.; Dong, Z.Y.; Zhao, J.H.; Meng, K.; Zheng, Y.; Hill, D.J. Low carbon oriented expansion planning of integrated gas and power systems. IEEE Trans. Power Syst. 2015, 30, 1035–1046. [Google Scholar] [CrossRef]
  13. Yang, J.; Zhang, N.; Kang, C.; Xia, Q. Effect of natural gas flow dynamics in robust generation scheduling under wind uncertainty. IEEE Trans. Power Syst. 2018, 33, 2087–2097. [Google Scholar] [CrossRef]
  14. Abeysekera, M. Combined Analysis of Coupled Energy Networks. Ph.D. Thesis, Cardiff University, Cardiff, UK, 2016. [Google Scholar]
  15. Liu, C.; Shahidehpour, M.; Wang, J. Coordinated scheduling of electricity and natural gas infrastructures with a transient model for natural gas flow. Chaos Interdiscip. J. Nonlinear Sci. 2011, 21, 025102. [Google Scholar] [CrossRef] [Green Version]
  16. Zeng, Q.; Fang, J.; Li, J.; Chen, Z. Steady-state analysis of the integrated natural gas and electric power system with bi-directional energy conversion. Appl. Energy 2016, 184, 1483–1492. [Google Scholar] [CrossRef]
  17. Correa-Posada, C.M.; Sanchez-Martin, P. Integrated power and natural gas model for energy adequacy in short-term operation. IEEE Trans. Power Syst. 2014, 30, 3347–3355. [Google Scholar] [CrossRef]
  18. Deane, J.P.; Ciaráin, M.Ó.; Gallachóir, B.P.Ó. An integrated gas and electricity model of the EU energy system to examine supply interruptions. Appl. Energy 2017, 193, 479–490. [Google Scholar] [CrossRef]
  19. Devlin, J.; Li, K.; Higgins, P.; Foley, A. The importance of gas infrastructure in power systems with high wind power penetrations. Appl. Energy 2016, 167, 294–304. [Google Scholar] [CrossRef] [Green Version]
  20. Chertkov, M.; Backhaus, S.; Lebedev, V. Cascading of fluctuations in interdependent energy infrastructures: Gas-grid coupling. Appl. Energy 2015, 160, 541–551. [Google Scholar] [CrossRef] [Green Version]
  21. Fan, J.; Tong, X.; Zhao, J. Multi-period optimal energy flow for electricity-gas integrated systems considering gas inertia and wind power uncertainties. Int. J. Electr. Power Energy Syst. 2020, 123, 106263. [Google Scholar] [CrossRef]
  22. Erdener, B.C.; Pambour, K.A.; Lavin, R.B.; Dengiz, B. An integrated simulation model for analysing electricity and gas systems. Int. J. Electr. Power Energy Syst. 2014, 61, 410–420. [Google Scholar] [CrossRef]
  23. Pambour, K.A.; Erdener, B.C.; Bolado-Lavin, R.; Dijkema Gerard, P.J. SAInt—A novel quasi-dynamic model for assessing security of supply in coupled gas and electricity transmission networks. Appl. Energy 2017, 203, 829–857. [Google Scholar] [CrossRef]
  24. Zhang, J.; Foley, A.; Wang, S. Optimal planning of a soft open point in a distribution network subject to typhoons. Int. J. Electr. Power Energy Syst. 2021, 129, 106839. [Google Scholar] [CrossRef]
  25. Kundur, P.; Balu, N.J.; Lauby, M.G. Power System Stability and Control; McGraw-Hill: New York, NY, USA, 1994. [Google Scholar]
  26. Menon, E.S. Gas Pipeline Hydraulics; CRC Press: Boca Raton, FL, USA, 2005. [Google Scholar]
  27. Li, K.; Peng, J.-X.; Bai, E.-W. Two-stage mixed discrete–continuous identification of radial basis function (RBF) neural models for nonlinear systems. IEEE Trans. Circuits Syst. I Regul. Pap. 2009, 56, 630–643. [Google Scholar]
Figure 1. Framework of the interconnected LESs.
Energies 15 08420 g001
Figure 2. Structure of dual grid-interfaced LESs.
Energies 15 08420 g002
Figure 3. Flow chart of the iterative simulation method.
Energies 15 08420 g003
Figure 4. Integrated simulation platform for the test system.
Energies 15 08420 g004
Figure 5. MT model acquisition.
Energies 15 08420 g005
Figure 6. Comparison of MT power output simulation results and field measurement data.
Energies 15 08420 g006
Figure 7. Variations of MT power output.
Energies 15 08420 g007
Figure 8. Variations of pressure during the MT output adjustment process.
Energies 15 08420 g008
Figure 9. Variations of engine speed during the MT output adjustment process.
Energies 15 08420 g009
Figure 10. Energy exchanges between the two LESs.
Energies 15 08420 g010
Figure 11. MT state variations during the mode switching process.
Energies 15 08420 g011
Figure 12. Gas pressure variations during the mode switching process.
Energies 15 08420 g012
Table 1. Parameters of the gas network.
Start NodeEnd NodeLength (m)Diameter (mm)
1250050
2370050
2450050
Publisher’s Note: MDPI stays neutral with regard to jurisdictional claims in published maps and institutional affiliations.

