Article

Modeling the Effect of Cell Variation on the Performance of a Lithium-Ion Battery Module

Department of Chemical Engineering and Division of Energy Systems Research, Ajou University, Suwon 16499, Korea
*
Author to whom correspondence should be addressed.
Energies 2022, 15(21), 8054; https://doi.org/10.3390/en15218054
Submission received: 7 October 2022 / Revised: 24 October 2022 / Accepted: 26 October 2022 / Published: 29 October 2022
(This article belongs to the Special Issue Lithium-Ion Batteries: Latest Advances, Challenges and Prospects)

Abstract

:
Owing to the variation between lithium-ion battery (LIB) cells, early discharge termination and overdischarge can occur when cells are coupled in series or parallel, thereby triggering a decrease in LIB module performance and safety. This study provides a modeling approach that considers the effect of cell variation on the performance of LIB modules in energy storage applications for improving the reliability of the power quality of energy storage devices and efficiency of the energy system. Ohm’s law and the law of conservation of charge were employed as the governing equations to estimate the discharge behavior of a single strand composing of two LIB cells connected in parallel based on the polarization properties of the electrode. Using the modeling parameters of a single strand, the particle swarm optimization algorithm was adopted to predict the discharge capacity and internal resistance distribution of 14 strands connected in series. Based on the model of the LIB strand to predict the discharge behavior, the effect of cell variation on the deviation of the discharge termination voltage and depth of discharge imbalance was modeled. The validity of the model was confirmed by comparing the experimental data with the modeling results.

1. Introduction

Lithium-ion batteries (LIBs) have diverse applications because of their high energy density, efficiency, and power [1]. LIB-powered energy storage devices balance the power supply and demand, reduce peaks, and maintain a stable power system [2]. Cell-to-cell variation is unavoidable due to the inconsistency from the fabrication of cell components including electrodes, separators, and electrolytes to the assembly process of cell [3,4,5,6,7]. Owing to an imbalance between cells, overcharging and overdischarging can occur when LIBs are connected in series or parallel, thereby triggering a decrease in module performance and safety [8]. Therefore, computing the cell-to-cell deviation effect of the LIB module via mathematical modeling is necessary to improve the reliability of the power quality of the energy storage device and ensure efficient operation of the energy system [9].
Numerous studies have reviewed the effects of cell-to-cell deviation in modules and packs of LIBs [3,4,5,6,7]. Xie et al. [10] proposed an experimental procedure to measure the capacity and voltage deviation accurately between cells connected in series of an LIB module. Chang et al. [11] modeled the performance of a battery pack based on Monte Carlo experiments in which LIB cells were connected in parallel. Astaneh et al. [12] predicted the performance of an LIB pack for EV by scale-up, considering the random variability of the cell based on the electro-thermal model of the LIB cell. Tran et al. [13] estimated the state of charge (SOC) distributions of modules connected in series with LIB cells using a nonlinear state observer. They lowered the computational burden compared with the conventional SOC estimation algorithm. Liu and Zhang [14] proposed a cell balancing method to solve the cell imbalance of batteries by designing an active balancing circuit through SOC estimation using an extended Kalman filter. Lee et al. [15] predicted the voltage behavior in a LIB pack based on the normal distribution of the capacity and internal resistance of the LIB cell. They verified the pack-modelling results through a dynamic test. Krupp et al. [16] proposed a modeling tool that estimates the state of health (SOH) distribution of individual cells and that of a module in real-time through incremental capacity analysis. Zilberman et al. [17] estimated the distribution of the capacity and impedance of 18,650 LIB cells using differential voltage analysis and analyzed the deviation changes according to calendar aging. The cell-to-cell deviation that occurs when the battery module is operating can cause overcharge and overdischarge in the cell and accelerate cell aging, reducing the efficiency of the battery module and causing safety issues [18]. Commercial battery modules require a modeling methodology to accurately estimate the cell deviation in real time. The voltage deviation among cells should be predicted by estimating the individual parameters of the battery cell to minimize energy loss in the battery system [19].
Many works mentioned in the above [10,11,12,13,14,15,16,17] reported the estimation of the distributions of the cell voltage, SOC, capacity, and internal resistance distributions of individual cells in LIB modules using various modeling methodologies including extended Kalman filter, nonlinear state observer, incremental capacity analysis, and differential voltage analysis among others. To the best of authors’ knowledge, there are no published articles on the assessment of overdischarge and early discharge termination of individual cells in a module based on modeling and verified by the comparison of experimental measurement data. Herein, we propose a methodology that can effectively model the deviation of the discharge termination and depth of discharge (DOD) imbalance of the LIB module under the effect of cell variation. Two cells were combined in parallel to form a single strand, and then 14 strands were connected in series in the LIB module analyzed in this study. Based on the polarization properties of the electrode, Ohm’s law and the law of charge conservation were employed as governing equations to predict the discharge performance of a single strand. The distribution of capacity and internal resistance of the LIB strand, which are the main parameters of strand deviation in the LIB module [3,17], were calculated using the particle swarm algorithm (PSO) [20,21]. In the modeling approach proposed in this study, several constant-current discharge experiments of the module were performed to calculate the modeling parameters. Finally, the experimental data were compared with the modeling results to validate the proposed model.

2. Mathematical Model

Herein, an LIB cell by LG Energy Solution with a capacity of 63 Ah composed of lithium nickel manganese cobalt oxide (NMC) cathodes and graphite anodes was modeled. The modeling procedure for each LIB cell in the module was similar to that used in our previous studies [22,23,24]. As LIB batteries are composed of alternating anodes and cathodes, two parallel cathodes and anodes with tabs positioned in opposite directions, as shown in Figure 1, are modeled. Figure 1 shows that the current flow between the electrodes from the cathode to the anode during discharge was perpendicular to the electrode, assuming that the distance between the cathode and the anode was very close. From the continuity of the current at the cathode and anode during discharge, the Poisson equations for the voltages at the cathode and anode can be derived as follows:
2 V c = + r c J             in   Ω c
2 V a = r a J             in   Ω a
Resistances rc and ra were calculated as described in the previous papers [22,23,24]. In addition, a previous study reported relevant boundary conditions for Vc and Va [22].
Current density, J, is a function of the cathode and anode voltages, and the functional relationship between the current density and voltage depends on the polarization properties of the electrodes. This study adopted the polarization characteristics proposed by Tiedemann and Newman [25] and Newman and Tiedemann [26], as follows:
J f a r a d a i c = Y ( V c V a U )
where Y and U are the fitting parameters as functions of the DOD, as shown in Gu [27], and their electrochemical meanings have been described in the previous studies [28,29]. The detailed procedure for deriving Y and U from the experimental data and the functional relationship between Y and U according to DOD are described in Section 4.
By excluding the modeling procedure to calculate the voltage distribution of the transport phenomena of ionic species and electrolyte phase, the model reduces the computational burden significantly while maintaining its validity [22,23,24,28,29,30,31,32,33,34,35]. In the simplified model, the DOD according to the time during discharge can be calculated by integrating J with respect to time as follows:
D O D = D O D i + 0 t J d τ Q 0
Figure 2 shows a schematic of an LIB module in which two LIB cells are connected in parallel to form a single strand and 14 strands are connected in series. The negative and positive terminals of the module composed of copper busbars were connected to the 1st and 14th strands, respectively. Each cell was connected in series and parallel with aluminum bus bars through laser welding to minimize the electrical contact resistance, while the 7th and 8th strands were connected with copper busbars. The LIB module in Figure 2 measures the total terminal voltage and voltage at each strand terminals through a sensor. The electrical resistance, including the busbar, BMS sensor, and contact resistance with the terminal, is negligible because of the good welding conditions and very small compared to the resistance of the LIB cell [36]. As the measurement data that can be obtained from the experiment are the terminal voltage of the module and the voltage of 14 strands, we proceeded with the above modeling procedure by considering the strand in which two cells are connected in parallel as a single battery model. The key parameters of the above-mentioned modeling for calculating the voltage deviation of the battery strands are Qn and Yn. Qn is the capacity of the nth LIB strand, and Yn correspnds to the reciprocal of the internal resistance of the LIB [29]. As Yn is a function of the DOD, Equation (5) is introduced to efficiently calculate the distribution of Yn by multiplying Yref with a proportionality constant, βn.
Y n = Y r e f β n
To reflect the deviation of Qn and Yn from the discharge behavior of the reference LIB strand, the DOD of each LIB strand was modified with Qn and was calculated as follows:
D O D n = D O D n , i + 0 t J d τ Q n
The PSO algorithm was used to calculate the distribution of strand capacity and internal resistance. PSO is a widely used metaheuristic optimization method that determines an optimal solution by moving particles, a solution candidate group, according to a mathematical formula to solve the problem [20]. The PSO algorithm has fewer hyperparameters than other optimization techniques, and has the advantages of concise theory, efficient operation, and stable convergence [21]. To determine Qn and βn using the PSO algorithm, Vmodel according to a constant current was calculated by assigning Qn and βn into the battery strand model as inputs. Equation (7) was used as the fitness function to minimize the sum of errors compared with the experimental Vexp.
f i t n e s s f u n c t i o n = 0 t ( V e x p V m o d e l ) 2 d τ

3. Experimental Section

The energy of the LIB cell composed of the NMC cathode and graphite anode was 232 Wh, and the nominal capacity was 63 Ah. The positive and negative tabs of the LIB cells were positioned in both directions. The energy of the two parallel and 14 series-connected LIB modules is 6.5 kWh, and the nominal capacity is 126 Ah. The LIB module was stacked with an aluminum case of dimensions 445 × 110 × 620 mm3. In Figure 2, the negative tab of the 1st strand is connected to the negative terminal of the module. The positive tab of the 14th strand is connected to the positive terminal of the module. LIB module tests were conducted in a chamber maintained at 25 °C. The LIB module was charged with a current of 0.2 C and discharged at three different C rates of 0.2 C, 0.5 C, and 1 C with a rest of 1 h in the same experimental condition as the cell test. The discharge termination voltage of the LIB cell was 42 V. During the experiment, the voltage sensor measured the terminal voltage of the module and those of the 14 strands.

4. Results and Discussion

4.1. Model Validation for LIB Strand

As one of the experimental data that can be obtained from the discharge test of the LIB module is the voltage of a strand, the LIB strand was modeled as a single-battery model by neglecting the electrical resistance for parallel connection in this work. The nominal capacity of the LIB strand was 126 Ah, because the two LIB cells were connected in parallel. Figure 3 shows the discharge voltage according to three different C rates in the range of 0.2 C to 1 C of the 1st strand. The discharge curves in Figure 3 show the nonlinear behaviors, because the electrical resistance of battery cell is not constant during the discharge with constant current as shown by combinatorial atomistic-to-AI simulation on supercapacitors validated by experimental data [37]. In this work, the internal resistance change of LIB cell during discharge was accounted through the functional dependence of model parameter Y on DOD, because Y can be regarded as the reciprocal of the internal resistance of the LIB [28,29]. The dependence of Y on the environmental temperature was reported in the previous work [28]. Figure 4 illustrates the linear relationship between the LIB strand voltage and current density during discharge obtained from the experimental results shown in Figure 3. The well-fitted results in Figure 4 justify the linear relationship between the current density and LIB strand voltage of Equation (3). As the vertical intercept and slope of the linear function change according to the DOD level, U and Y can be expressed as functions of DOD. Unlike the previous works [22,23,24,28] in which U and Y were expressed as the polynomial functions of DOD, U and Y were determined through an interpolation with a 2 × 101 matrix whose elements are the values U and Y at a certain DOD between 0 and 1 with an increment of 0.01 given in Figure 5a,b. U can be considered as the equilibrium voltage and Y as the reciprocal of the internal resistance of the LIB [28,29].
To verify the modeling methodology for the LIB strand, 0.2 C, 0.5 C, and 1 C discharge behaviors of the LIB strand were calculated using U and Y in Figure 5a,b. The experimental discharge voltage curves of the 1st LIB strand at 0.2, 0.5, and 1 C were compared with the modeling results, as shown in Figure 6. The comparison of the modeling results and experiments showed good agreement.

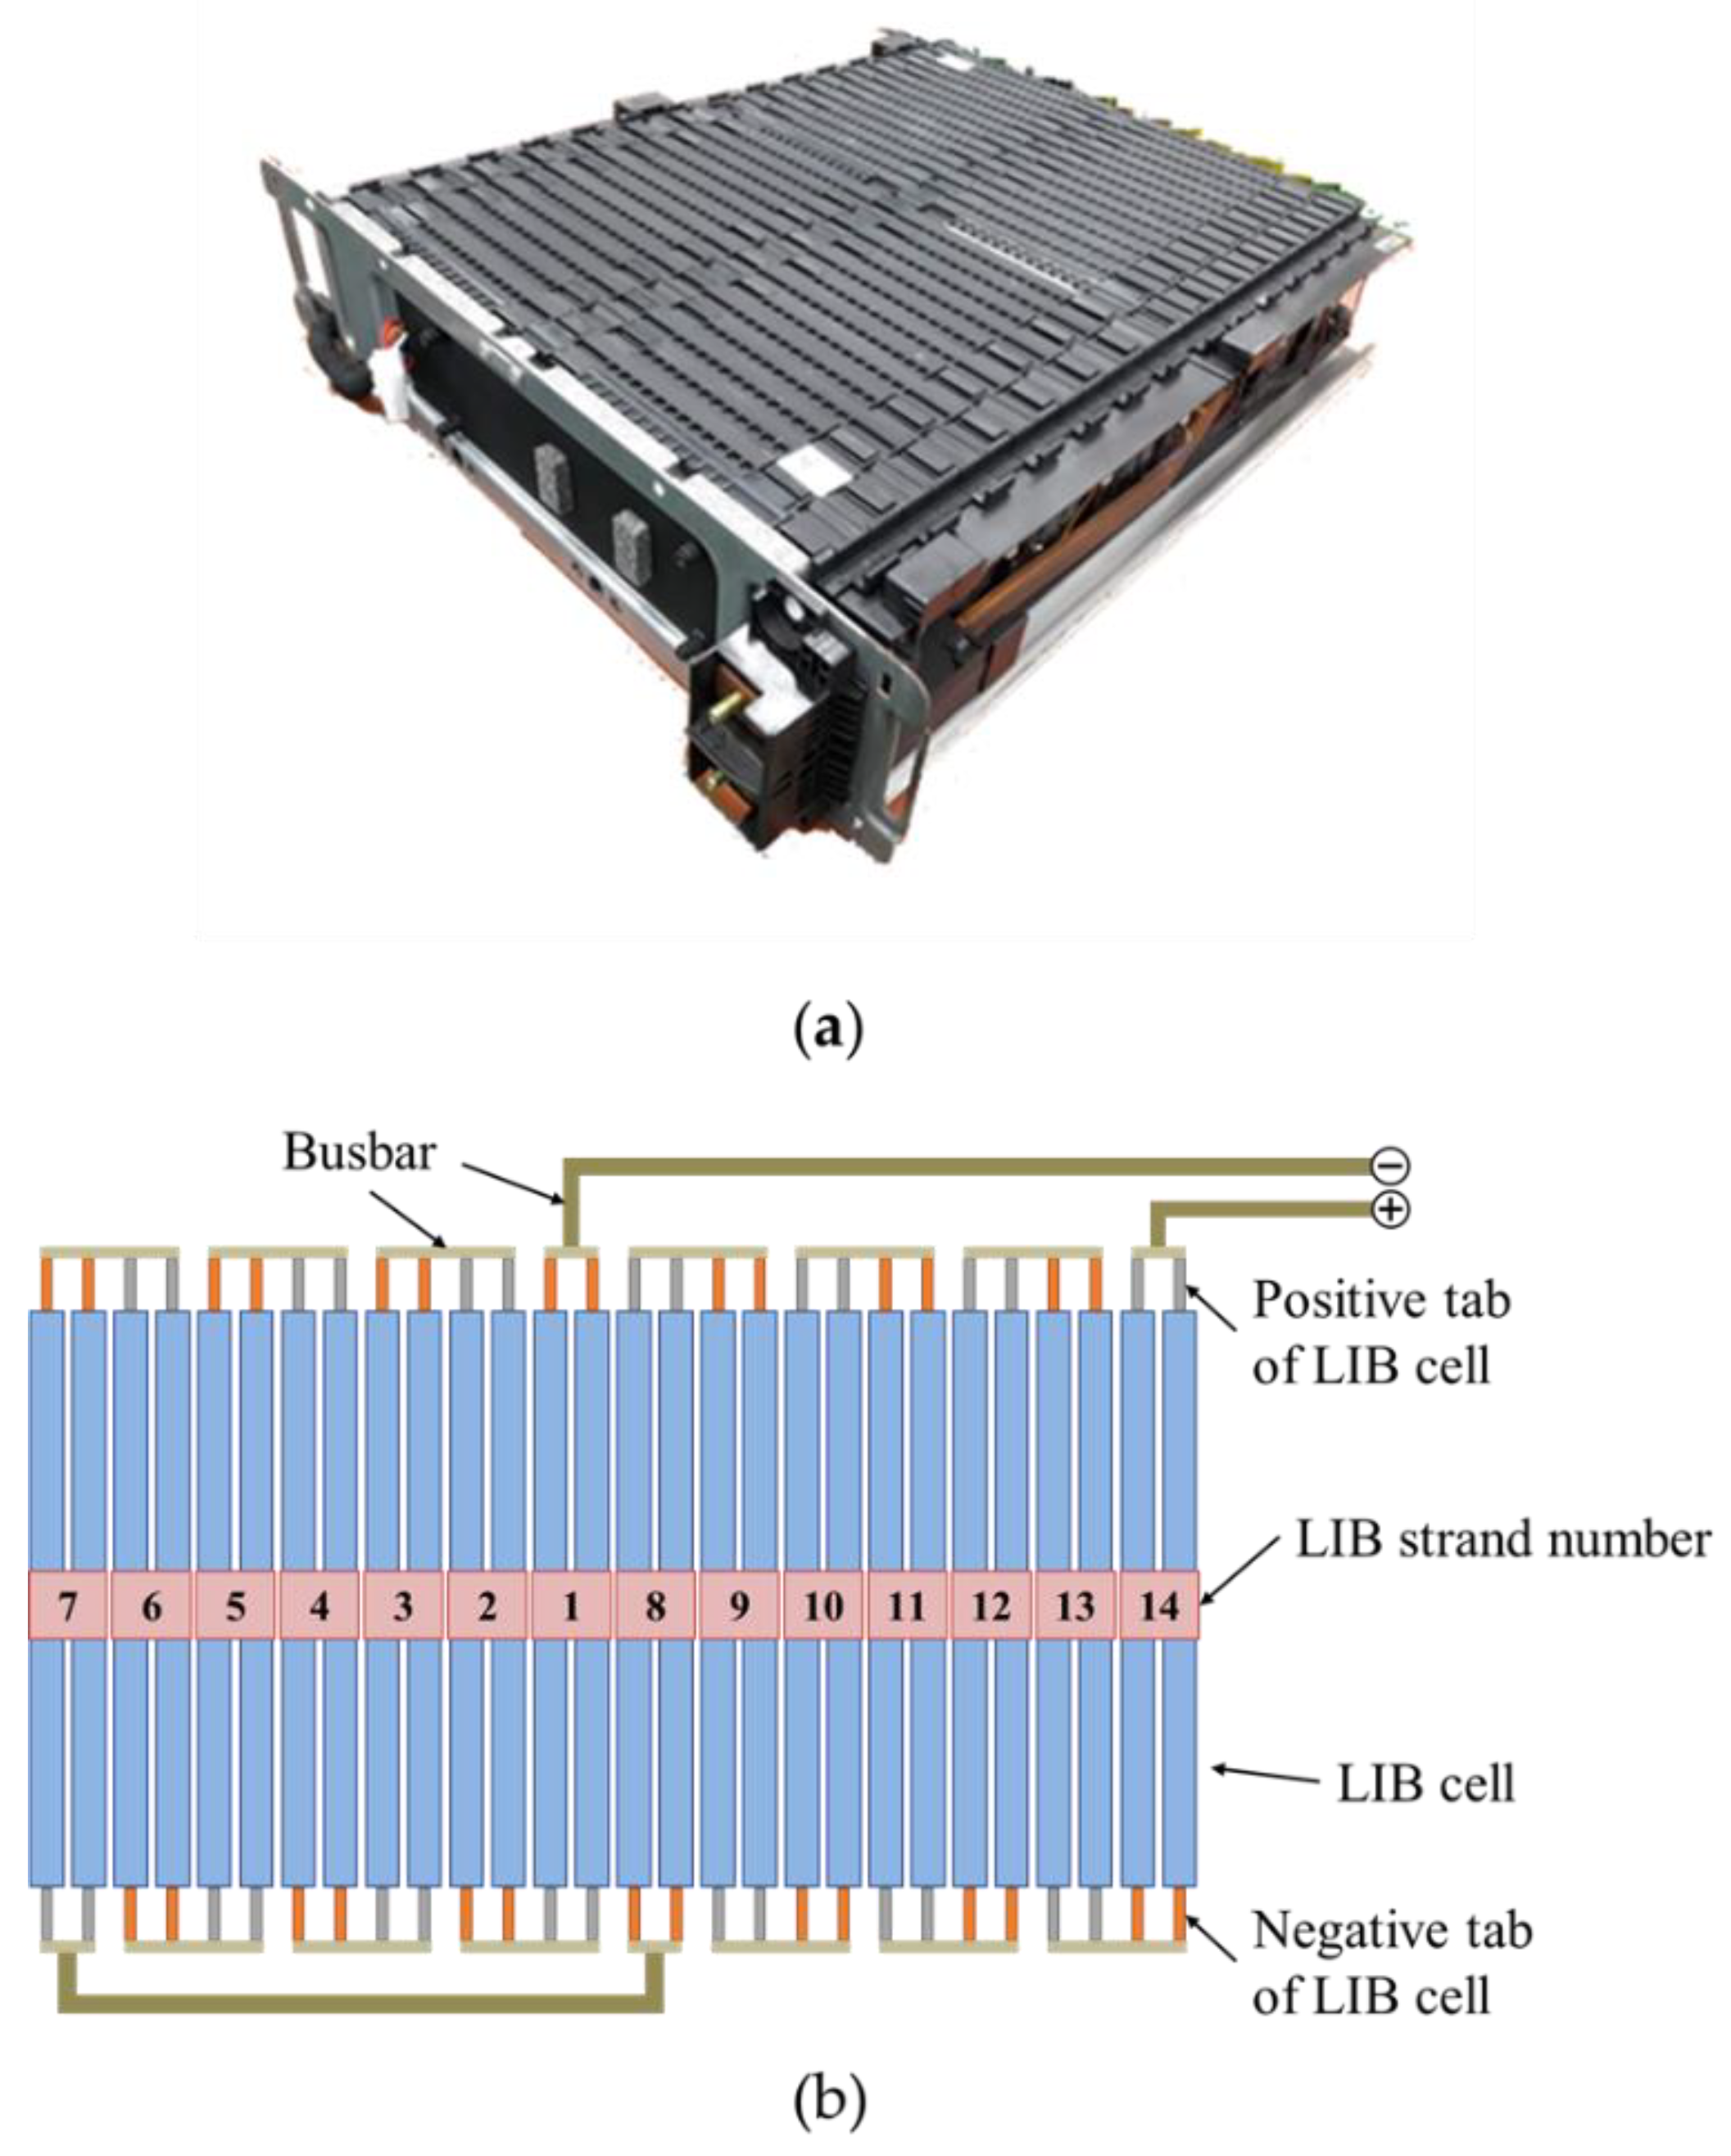
4.2. Model Validation for LIB Module

It was found that the variation of Un due to the change of the strand number, n, was negligible, if Un is calculated as a function of DODn instead of DOD. Because the variation of Yn was noticeable as the change of the strand number unlike Un, the value of Yn which is expressed in terms of βn should be determined through the PSO algorithm along with Qn. By using Equation (7) as the fitness function of the PSO algorithm, the Qn and βn that can render the best fit of the 0.2 C, 0.5 C, and 1 C voltage behaviors calculated from the modeling to the experimental data were obtained. Each LIB strand discharge voltage behavior was predicted by using the calculated Qn and βn values and it was compared with the experimental results. The modeling results are summarized in Table 1 in terms of the RMSE values at different C-rates of the LIB strand and it was calculated by using the following formula:
R M S E = i = 1 T ( V e x p V m o d e l ) 2 T
where T represents all sampling times in which the LIB strand was discharged with the discharge rates of 0.2 C, 0.5 C, and 1 C.
The results in Table 1 indicate that the model presented herein can accurately simulate the voltage behavior of the battery strand with an accuracy of 4 mV or less. The deviation in the capacity and internal resistance of the LIB cell is caused by the inconsistency in the electrochemical characteristics of the LIB cell that occurs during the process of material synthesis and cell manufacturing. Figure 7a–c show the capacity distributions at 0.2 C, 0.5 C, and 1 C. If we define the uniformity index (UI) of discharge capacity distribution as the difference between the maximum and minimum discharge capacities divided by the average value of discharge capacity, the UIs of 0.2, 0.5, and 1 C shown in Figure 7a–c are 0.006, 0.007, and 0.007, respectively. Although UI increases slightly with higher C rate, the values of UI at different C rates are very small and we may regard that the nonuniformity of the discharge capacity distribution is not significant. Figure 8 shows the distribution of βn, which is a parameter related to the internal resistance of each LIB cell in the strand [29].
Based on the modeling methodology mentioned above, the discharge behaviors of the LIB module consisted of 14 strands connected in series were predicted. Figure 9 shows the comparison of the discharge voltage variations of the LIB module with time from modeling and those from experiment at the discharge rates of 0.2 C, 0.5 C, and 1 C. The voltage comparison results of the module were good; thus, the methodology presented in this paper may be justified.

4.3. Modeling of LIB Module Performance

When discharging in the LIB module, the termination voltage is terminated at 42 V and the cell termination voltage becomes 3.0 V considering the connection of 2P 14S. However, each cell maintains a different voltage level, and there are early discharge termination and overdischarge cells if we regard 3.0 V as the termination voltage. The module efficiency can be reduced in case of an early discharge. In the case of overdischarge, aging may be accelerated and cause serious safety problems. Therefore, predicting the end of voltage is important during the discharge of each cell. Figure 10 compares the end of voltage for each strand at 0.2, 0.5, and 1 C from the experimental with modeling results. The blue bars represent early discharge termination, where the termination voltage of the strand has not reached 3.0 V, and the red bars represent overdischarge, where the strand voltage has dropped below 3.0 V. The experimental results indicated by the black dots show a good fit with the modeling results.
The voltage difference between the strands can be calculated based on the verified model, which accurately simulates the strand voltage in the LIB module. Figure 11 shows the difference between the maximum and minimum voltages measured by the sensor over time when discharging at 0.2, 0.5, and 1 C. The difference between the maximum and minimum voltages is defined as the voltage imbalance and it is compared with the modeling. Figure 11 shows that the voltage imbalance increases as the discharge current rate increases, and particularly at the end of the discharge, it rises very steeply. The comparison results of the model and experiment are in good agreement, indicating that the proposed modeling methodology is suitable for calculating the voltage deviation in the module.
As proper cell balancing is not performed after charging, an initial DOD deviation occurs. The DOD range used by each strand during discharging is different. Figure 12a–c show the DOD range area from the initial DOD to the final DOD when discharging at 0.2 C, 0.5 C, and 1 C, respectively. The point at 3.0 V is indicated by a red dashed line. The initial DOD of each strand was obtained by interpolation into the OCV table, and the DOD use for each strand was calculated using Equation (6). In Figure 12a, when some strands fall below 3.0 V at 0.2 C discharge, an overdischarge occurs and DOD value exceeds 1.0. The rest of the strands are assessed as early termination discharge. In Figure 12b,c, the strand below the red dashed line is the early discharge termination, and the strand above the red dashed line is the overdischarge.
Variations in the voltage and DOD used in the LIB module are unavoidable owing to differences in the physical properties of the electrode materials and cell manufacturing process. Early discharge termination owing to these deviations reduces the efficiency of the LIB module. If overdischarge accumulates continuously, it can accelerate individual aging and cause serious damage to the battery system. Therefore, it is possible to accurately analyze and parametrize the cell deviation within the LIB module to calculate the difference by using the modeling methodology proposed in this study. Although the modeling approach was verified with data of only the discharge behavior, the deviation between the battery cells in a module or pack can be calculated in real time under various operating conditions using the modeling methodology presented herein. The modeling approach will be a good strategy for cell balancing and improving the energy efficiency in large-scale energy storage applications.

5. Conclusions

We developed a mathematical model to accurately calculate the effect of cell variation during discharge in an LIB module. A simplified model that can simulate the behavior of an LIB strand, eliminating the computational burden, was applied. The discharge-voltage behavior of the LIB strand is modeled based on Ohm’s law and charge conservation law using the simplified polarization characteristics of the electrode. Based on the modeling methodology validated on a single LIB strand, the capacity and internal resistance distributions of the 14 strands were calculated using the PSO algorithm. The calculation result was compared with each strand voltage measured by the sensor in the module and the calculation accuracy was expressed with RMSE. The modeling methodology in this study simulated the voltage behavior of a module composed of 2P 14S and showed an excellent agreement with the experimental data. Based on the verified modeling method, the voltage difference between the strands, discharge termination voltage, and DOD use distribution were modeled during discharge in the LIB module.

Author Contributions

D.L., S.K. and C.B.S. developed the methodology and performed modeling. All authors have read and agreed to the published version of the manuscript.

Funding

This research was supported by the Korea Institute of Energy Technology Evaluation and Planning (KETEP) grant funded by the Ministry of Trade, Industry & Energy (MOTIE) (No. 20206910100090) of the Republic of Korea. This study was partially funded by the Korea Electrotechnology Research Institute (KERI) Primary Research Program through the National Research Council of Science & Technology (NST), funded by the Ministry of Science and ICT (MSIT) (No. 22A01011), and the Technology Innovation Program (20011379, Development of advanced charge acceptance technology for charging power improvement of xEV battery system), funded by the Ministry of Trade, Industry & Energy (MOTIE, Korea).

Data Availability Statement

Data is contained within the article.

Conflicts of Interest

The authors declare no conflict of interest.

Nomenclature

SymbolDescriptionUnits
DODDepth of discharge
DODiDOD at t = 0
DODnDOD of nth LIB strand
JCurrent density between the electrodesA cm−2
nLIB strand number
Q0Nominal capacity per unit areaAh cm−2
QnQ of LIB cell in nth LIB strandAh cm−2
rcResistance of cathodeΩ
raResistance of anodeΩ
tTimes
UPolarization characteristic of the electrodes, intercept of the voltage-current curveV
VcVoltage of cathodeV
VaVoltage of anodeV
VexpExperiment voltageV
VmodelModeling voltageV
YPolarization characteristic of the electrodes, inverse of the slope of the voltage-current curveS cm−2
YnY of nth LIB strandS cm−2
YrefY of reference LIB strandS cm−2
βnProportionality constant of internal resistance of nth strand
ΩaComputational domain of anode
ΩcComputational domain of cathode

References

  1. Kim, T.; Song, W.; Son, D.-Y.; Ono, L.K.; Qi, Y. Lithium-ion batteries: Outlook on present, future, and hybridized technologies. J. Mater. Chem. A 2019, 7, 2942–2964. [Google Scholar] [CrossRef]
  2. Killer, M.; Farrokhseresht, M.; Paterakis, N.G. Implementation of large-scale Li-ion battery energy storage systems within the EMEA region. Appl. Energy 2020, 260, 114166. [Google Scholar] [CrossRef]
  3. Omariba, Z.B.; Zhang, L.; Sun, D. Review of battery cell balancing methodologies for optimizing battery pack performance in electric vehicles. IEEE Access 2019, 7, 129335–129352. [Google Scholar] [CrossRef]
  4. Naguib, M.; Kollmeyer, P.; Emadi, A. Lithium-ion battery pack robust state of charge estimation, cell inconsistency, and balancing: Review. IEEE Access 2021, 9, 50570–50582. [Google Scholar] [CrossRef]
  5. Uzair, M.; Abbas, G.; Hosain, S. Characteristics of battery management systems of electric vehicles with consideration of the active and passive cell balancing process. World Electr. Veh. J. 2021, 12, 120. [Google Scholar] [CrossRef]
  6. Feng, F.; Hu, X.; Liu, J.; Lin, X.; Liu, B. A review of equalization strategies for series battery packs: Variables, objectives, and algorithms. Renew. Sustain. Energy Rev. 2019, 116, 109464. [Google Scholar] [CrossRef]
  7. Beck, D.; Dechent, P.; Junker, M.; Sauer, D.U.; Dubarry, M. Inhomogeneities and cell-to-cell variations in lithium-ion batteries, a review. Energies 2021, 14, 3276. [Google Scholar] [CrossRef]
  8. Hemavathi, S. Overview of cell balancing methods for Li-ion battery technology. Energy Storage 2021, 3, 203. [Google Scholar]
  9. Habib, A.K.M.A.; Hasan, M.K.; Mahmud, M.; Motakabber, S.M.A.; Ibrahimya, M.I.; Islam, S. A review: Energy storage system and balancing circuits for electric vehicle application. IET Power Electron. 2021, 14, 1–13. [Google Scholar] [CrossRef]
  10. Xie, L.; Ren, D.; Wang, L.; Chen, Z.; Tian, G.; Amine, K.; He, X. A facile approach to high precision detection of cell-to-cell variation for Li-ion batteries. Sci. Rep. 2020, 10, 7182. [Google Scholar] [CrossRef]
  11. Chang, F.; Roemer, F.; Baumann, M.; Lienkamp, M. Modelling and evaluation of battery packs with different numbers of paralleled cells. World Electr. Veh. J. 2018, 9, 8. [Google Scholar] [CrossRef]
  12. Astaneh, M.; Andric, J.; Löfdahl, L.; Maggiolo, D.; Stopp, P.; Moghaddam, M.; Chapuis, M.; Ström, H. Calibration optimization methodology for lithium-ion battery pack model for electric vehicles in mining applications. Energies 2020, 13, 3532. [Google Scholar] [CrossRef]
  13. Tran, N.-T.; Khan, A.B.; Nguyen, T.-T.; Kim, D.-W.; Choi, W. SOC Estimation of Multiple Lithium-Ion Battery Cells in a Module Using a Nonlinear State Observer and Online Parameter Estimation. Energies 2018, 11, 1620. [Google Scholar] [CrossRef] [Green Version]
  14. Liu, R.; Zhang, C. An active balancing method based on SOC and capacitance for lithium-ion batteries in electric vehicles. Front. Energy Res. 2021, 9, 662. [Google Scholar] [CrossRef]
  15. Lee, J.; Ahn, J.-H.; Lee, B.K. A novel Li-ion battery pack modeling considering single cell information and capacity variation. In Proceedings of the 2017 IEEE Energy Conversion Congress and Exposition (ECCE), Cincinnati, OH, USA, 1–5 October 2017; pp. 5242–5247. [Google Scholar]
  16. Krupp, A.; Ferg, E.; Schuldt, F.; Derendorf, K.; Agert, C. Incremental capacity analysis as a state of health estimation method for lithium-ion battery modules with series-connected cells. Batteries 2021, 7, 2. [Google Scholar] [CrossRef]
  17. Zilberman, I.; Ludwig, S.; Jossen, A. Cell-to-cell variation of calendar aging and reversible self-discharge in 18650 nickel-rich, silicon–graphite lithium-ion cells. J. Energy Storage 2019, 26, 100900. [Google Scholar] [CrossRef]
  18. Hossain Lipu, M.S.; Hannan, M.A.; Karim, T.F.; Hussain, A.; Saad, M.H.M.; Ayob, A.; Miah, M.S.; Indra Mahlia, T.M. Intelligent algorithms and control strategies for battery management system in electric vehicles: Progress, challenges and future outlook. J. Clean. Prod. 2021, 292, 126044. [Google Scholar] [CrossRef]
  19. Feng, F.; Hu, X.; Hu, L.; Hu, F.; Li, Y.; Zhang, L. Propagation mechanisms and diagnosis of parameter inconsistency within Li-ion battery packs. Renew. Sustain. Energy Rev. 2019, 112, 102–113. [Google Scholar] [CrossRef]
  20. Wikipedia. Particle Swarm Optimization. Available online: https://en.wikipedia.org/wiki/Particle_swarm_optimization (accessed on 6 September 2022).
  21. Kennedy, J.; Eberhart, R.C. Particle swarm optimization. In Proceedings of the IEEE International Conference on Neural Networks, Perth, Australia, 27 November 1995; pp. 1942–1948. [Google Scholar]
  22. Kwon, K.H.; Shin, C.B.; Kang, T.H.; Kim, C. A two-dimensional modeling of a lithium-polymer battery. J. Power Sources 2006, 163, 151–157. [Google Scholar] [CrossRef]
  23. Kim, U.S.; Shin, C.B.; Kim, C. Effect of electrode configuration on the thermal behavior of a lithium-polymer battery. J. Power Sources 2008, 180, 909–916. [Google Scholar] [CrossRef]
  24. Kim, U.S.; Shin, C.B.; Kim, C. Modeling for the scale-up of a lithium-ion polymer battery. J. Power Sources 2009, 189, 841–846. [Google Scholar] [CrossRef]
  25. Tiedemann, W.; Newman, J. Current and potential distribution in lead-acid battery plates. In Battery Design and Optimization; Gross, S., Ed.; The Electrochemical Society Inc.: Pennington, NJ, USA, 1979; pp. 39–49. [Google Scholar]
  26. Newman, J.; Tiedemann, W. Potential and current distribution in electrochemical cells—Interpretation of the half-cell voltage measurements as a function of reference-electrode location. J. Electrochem. Soc. 1993, 140, 1961–1968. [Google Scholar] [CrossRef]
  27. Gu, H. Mathematical analysis of a Zn / NiOOH cell. J. Electrochem. Soc. 1983, 130, 1459–1464. [Google Scholar] [CrossRef]
  28. Kim, U.S.; Yi, J.; Shin, C.B.; Han, T.; Park, S. Modeling the dependence of the discharge behavior of a lithium-ion battery on the environmental temperature. J. Electrochem. Soc. 2011, 158, A611–A618. [Google Scholar] [CrossRef]
  29. Yi, J.; Koo, B.; Shin, C.B.; Han, T.; Park, S. Modeling the effect of aging on the electrical and thermal behaviors of a lithium-ion battery during constant current charge and discharge cycling. Comput. Chem. Eng. 2017, 99, 31–39. [Google Scholar] [CrossRef]
  30. Kim, U.S.; Yi, J.; Shin, C.B.; Han, T.; Park, S. Modelling the thermal behaviour of a lithium-ion battery during charge. J. Power Sources 2011, 196, 5115–5121. [Google Scholar] [CrossRef]
  31. Kim, U.S.; Yi, J.; Shin, C.B.; Han, T.; Park, S. Modeling the thermal behaviors of a lithium-ion battery during constant-power discharge and charge operations. J. Electrochem. Soc. 2013, 160, A990–A995. [Google Scholar] [CrossRef]
  32. Yi, J.; Kim, U.S.; Shin, C.B.; Han, T.; Park, S. Modeling the temperature dependence of the discharge behavior of a lithium-ion battery in low environmental temperature. J. Power Sources 2013, 244, 143–148. [Google Scholar] [CrossRef]
  33. Yi, J.; Lee, J.; Shin, C.B.; Han, T.; Park, S. Modeling of the transient behaviors of a lithium-ion battery during dynamic cycling. J. Power Sources 2015, 277, 379–386. [Google Scholar] [CrossRef]
  34. Koo, B.; Yi, J.; Lee, D.; Shin, C.B.; Han, T.; Park, S. Modeling the effect of fast charge scenario on the cycle life of a lithium-ion battery. J. Electrochem. Soc. 2018, 165, A3674–A3680. [Google Scholar] [CrossRef]
  35. Lee, D.; Kim, B.; Shin, C.B. Modeling Fast Charge Protocols to Prevent Lithium Plating in a Lithium-Ion Battery. J. Electrochem. Soc. 2022, 169, 090502. [Google Scholar] [CrossRef]
  36. Bruen, T.; Marco, J. Modelling and experimental evaluation of parallel connected lithium ion cells for an electric vehicle battery system. J. Power Sources 2016, 310, 91–101. [Google Scholar] [CrossRef]
  37. Bo, Z.; Li, H.; Yang, H.; Li, C.; Wu, S.; Xu, C.; Xiong, G.; Mariotti, D.; Yan, J.; Cen, K.; et al. Combinatorial atomistic-to-AI prediction and experimental validation of heating effects in 350 F supercapacitor modules. Int. J. Heat Mass Transf. 2021, 171, 121075. [Google Scholar] [CrossRef]
Figure 1. Schematic of the current flow in parallel cathode and anode of LIB during discharge.
Energies 15 08054 g001
Figure 2. (a) Photograph of an LIB module with LIB cells configured in two parallel and 14 series and (b) schematic of the electrical connections of the LIB module.
Energies 15 08054 g002
Figure 3. Experimental discharge voltage curves of 1st LIB strand for 0.2 C, 0.5 C, and 1 C.
Energies 15 08054 g003
Figure 4. Strand voltage as a function of applied current density at various DOD levels during discharge.
Energies 15 08054 g004
Figure 5. Fitting parameters of 1st LIB strand to calculate voltage behavior (a) U and (b) Y.
Energies 15 08054 g005
Figure 6. Comparison of discharge voltage behavior of modeling and experimental data at 0.2 C, 0.5 C, and 1 C of LIB strand.
Energies 15 08054 g006
Figure 7. Modeling results of capacity distribution of LIB strands (a) 0.2 C, (b) 0.5 C, and (c) 1 C.
Energies 15 08054 g007aEnergies 15 08054 g007b
Figure 8. Modeling results of βn distribution of LIB strands.
Energies 15 08054 g008
Figure 9. Comparison of modeling and experimental data of discharge behavior of LIB module at 0.2 C, 0.5 C, and 1 C.
Energies 15 08054 g009
Figure 10. Comparison of experimental results with modeling results of the voltage of LIB strands at the end of discharge (a) 0.2 C, (b) 0.5 C, and (c) 1 C.
Energies 15 08054 g010
Figure 11. Comparison of modeling and experimental results of the difference between the maximum and minimum voltages between LIB strands according to DOD. The solid lines denote modeling results and symbols are the experimental data.
Energies 15 08054 g011
Figure 12. Modeling results of DOD use distribution of LIB strands during discharge (a) 0.2 C, (b) 0.5 C, and (c) 1 C.
Energies 15 08054 g012aEnergies 15 08054 g012b
Table 1. RMSE of the modeling results and experimental data of discharge voltages of LIB strands at 0.2 C, 0.5 C, and 1 C.
Strand NumberRMSE (mV)
0.2 C0.5 C1 C
12.0693.6741.964
22.8043.8462.249
32.8213.2353.202
42.7943.4432.591
52.8043.1672.937
62.2673.2883.581
72.7503.8292.542
82.5344.1932.591
92.4613.6072.666
102.7673.6782.335
112.3063.3073.561
122.8753.5262.812
132.8033.7251.958
142.2833.4202.785
Publisher’s Note: MDPI stays neutral with regard to jurisdictional claims in published maps and institutional affiliations.

