Article

Optimising High-Rise Buildings for Self-Sufficiency in Energy Consumption and Food Production Using Artificial Intelligence: Case of Europoint Complex in Rotterdam

by
Berk Ekici
1,*,
Okan F. S. F. Turkcan
2,
Michela Turrin
1,
Ikbal Sevil Sariyildiz
1 and
Mehmet Fatih Tasgetiren
3
1
Chair of Design Informatics, Faculty of Architecture and the Built Environment, Delft University of Technology, Julianalaan 134, 2628 BL Delft, The Netherlands
2
Department of Architecture, Faculty of Architecture and the Built Environment, Delft University of Technology, Julianalaan 134, 2628 BL Delft, The Netherlands
3
Department of Industrial and Systems Engineering, 3301 Shelby Center, Auburn University, Auburn, AL 36849, USA
*
Author to whom correspondence should be addressed.
Energies 2022, 15(2), 660; https://doi.org/10.3390/en15020660
Submission received: 20 December 2021 / Revised: 11 January 2022 / Accepted: 13 January 2022 / Published: 17 January 2022

Abstract

:
The increase in global population, which negatively affects energy consumption, CO2 emissions, and arable land, necessitates designing sustainable habitation alternatives. Self-sufficient high-rise buildings, which integrate (electricity) generation and efficient usage of resources with dense habitation, can be a sustainable solution for future urbanisation. This paper focuses on transforming Europoint Towers in Rotterdam into self-sufficient buildings considering energy consumption and food production (lettuce crops) using artificial intelligence. Design parameters consist of the number of farming floors, shape, and the properties of the proposed façade skin that includes shading devices. Nine thousand samples are collected from various floor levels to predict self-sufficiency criteria using artificial neural networks (ANN). Optimisation problems with 117 decision variables are formulated using 45 ANN models that have very high prediction accuracies. 13 optimisation algorithms are used for an in-detail investigation of self-sufficiency at the building scale, and potential sufficiency at the neighbourhood scale. Results indicate that 100% and 43.7% self-sufficiencies could be reached for lettuce crops and electricity, respectively, for three buildings with 1800 residents. At the neighbourhood scale, lettuce production could be sufficient for 27,000 people with a decrease of self-sufficiency in terms of energy use of up to 11.6%. Consequently, this paper discusses the potentials and the improvements for self-sufficient high-rise buildings.

Graphical Abstract

1. Introduction

There is an increasing demand for the construction of high-rise buildings in metropolises [1], which requires the integration of various self-sufficiency aspects (such as food, energy, and water), owing to population growth and urbanisation trends. Compared with low-rise buildings, high-rises require more energy while causing significant CO2 emissions [2]. For this reason, optimisation algorithms and machine learning (ML) techniques have been widely used for investigating sustainable high-rise alternatives. However, population growth does not only affect the increase in final energy consumption. Another global problem is the decreasing stock of arable land in the world [3]. The United Nations Food and Agriculture Organisation (FAO) foresees that only one-third of the arable land per person in 1970 will be available in 2050 [4]. Vertical farms, which are multi-storey plant factories [5], are designed to provide rapid and uniform product growth of a high quality [6]. Recent work shows that various types of crops, e.g., leafy greens, lettuce, vine crops, and tomatoes [7], can be grown in closed farming systems. Therefore, integrating vertical farms in high-rise buildings can be one of the sustainable solutions for providing food in highly dense urban areas that can increase the amount of agricultural land while decreasing CO2 emissions from the transportation of the agricultural products.
Considering dense habitation, food production and energy generation in one building suggests a new optimisation problem in the architectural design called “self-sufficient high-rise buildings” (also defined as generative high-rises [8]). In this definition, self-sufficiency, which aims to provide a sufficient amount of resources in multiple aspects for the residents and for the neighbourhood in metropolitan areas, is different from self-sufficiency in terms of only energy (e.g., net-zero energy buildings (nZEB), energy-autonomous buildings [9]). Additionally, it is unlikely that high-rise buildings will be designed as off-grid systems with existing technology, such as small-scaled autonomous houses [10], because of their extreme sizes. Therefore, the contribution of self-sufficient high-rises is to generate and efficiently use multiple resources (such as energy, food, and water) to decrease their environmental impact while providing dense habitation in metropolitan areas. The complexity of this design problem is higher than the ones focusing on optimising high-rise buildings for various performance aspects of sustainability because of the existing and proposed challenges listed below:
  • Providing a sufficient amount of food for at least the residents of high-rises, and for as much of the neighbourhood as possible (proposed).
  • Generating energy via solar power for food production and for the annual usage of the residents of the building (proposed).
  • Integrating multiple performance aspects such as energy consumption, comfort and daylight (existing) [11].
  • Considering performance variations between the ground- and sky-levels because of the dense urban areas in metropolises (existing) [12].
  • Discovering well-performing high-rise alternatives in a reasonable amount of time during the conceptual design phase (existing) [13].
  • Coping with the enormous number of decision variables to optimise the entire shape of high-rise buildings (existing) [14].
This paper investigates the optimisation of high-rise buildings for self-sufficiency in food production and energy consumption subject to daylight availability. The food production system involves stacked lettuce crops, which is only one of the possible agricultural products among the other alternatives mentioned before. Energy consumption considers the farming and residential energy usage and the generated energy via solar panels. While investigating high-rise alternatives, sufficient natural lighting is also taken into account. Europoint complex in Rotterdam (also known as Marconi Towers), designed by SOM architecture firm and constructed in 1975, is the focus of the work. The studied model initially focuses on the building scale, and further investigation addresses the potential self-sufficiency at the neighbourhood scale for sustainable future cities.

1.1. Problem Statement

Optimising high-rise buildings for various design and performance aspects has been focused on for two decades. Because of the existing challenges mentioned in the previous section, most of the published studies focus on the efficient usage of resources in high-rises, i.e. energy-efficient layout plans [15], natural ventilation potentials [16], energy-saving solutions for the envelope design [17], optimum solar access in high-density urban areas [18], double skin façades for efficient energy usage [19], optimisation processes for improving thermal and power performances [20], multiple building operation scenarios [21], and passive design strategies [22]. Considering the existing and proposed challenges together can result in a conflict between self-sufficiency aspects that increases the complexity of the high-rise design problem. For instance, closed farming systems consume significantly more energy in comparison to residential or office buildings, reaching more than 1000 kWh m−2 y−1 depending on the climate zone [23]. They do this while causing an increase in energy consumption with less habitation in the high-rise buildings, the higher number of farming floors provides more food with low CO2 emissions when compared to regular farming. On the other hand, fewer farming floors provide less cultivation area with reduced energy consumption, but this causes higher CO2 emissions owing to the transportation of the crops to respond to the food demand in metropolises. Therefore, an optimal solution for self-sufficiency in energy and food should be investigated. The multi-zone optimisation (MUZO) methodology, which uses artificial intelligence (AI) methods, is adopted in this research to cope with existing and proposed challenges [13,14]. Similar works, which focus on self-sufficiency in high-rises, are mentioned in Section 1.2, and the novelty of this paper is explained in Section 1.3.

1.2. Overview of Previous Works

Previous works were found using the keywords related to “high-rise building”, “self-sufficiency”, “energy consumption”, “photovoltaic panel”, “vertical farming”, “daylight”, and “artificial intelligence”. Although a remarkable number of papers are published on high-rise optimisation for performance aspects related to sustainability, studies optimising self-sufficiency aspects are limited (Table 1). An early study focused on optimising various floor plan configurations using the HGPSPSO algorithm to minimise the overall energy consumption considering building integrated photovoltaic (BIPV) panels [24]. Another work utilised single-objective and multi-objective optimisation algorithms for a two-step optimisation process using NSGA-II and HGPSPSO to minimise energy consumption while maximising energy production through opaque photovoltaic (PV) panels on the façade and semi-transparent PV panels as glazing [25]. A similar problem formulation was used to minimise energy demand and maximise the percentage of total comfortable time for achieving zero-energy high-rise buildings with NSGA-II [26]. In addition to producing energy through BIPV panels, a recent study considered the economic aspects of various hybrid renewable energy generation systems in high-rises collecting the results from four different applications [27]. Four of the previous studies presented promising results but only considered self-sufficiency in energy. The complexity of the studied design problems was limited because of the low size of decision variables (DV). Only one study focused on the impact of the urban context [24], while the other papers only examined the high-rise building itself. Moreover, none of the previous studies investigated the results conducted by different optimisation algorithms that can lead to a representation of the solutions in local minima owing to the No Free Lunch (NFL) theorem [28]. Finally, ML algorithms were not involved in the previous studies. Hence, a limited number of function evaluations (FES) were considered because of the simulation-based optimisation processes.

1.3. Novelty of This Paper

This study considers multiple self-sufficiency aspects (i.e., food production and energy consumption) instead of considering a singular criteria (e.g., energy sufficient only as in previous works). Additionally, an enormous number of design parameters related to the number of farming floors, shape, and the property of the proposed façade skin with shading devices are extensively investigated using AI methods for self-sufficiency in building and the neighbourhood scales. For these reasons, the paper is focused on optimising three towers of the Europoint complex in Rotterdam for self-sufficiency in total energy consumption ( E t o t ) and food production ( F P ).
Since the developed model can consider the abovementioned crops by changing the simulation parameters to provide the required indoor environments, self-sufficiency for food production is demonstrated for stacked lettuce crops. The study aims to provide sufficient lettuce crops for the habitants with low energy consumption subject to acceptable daylight performance. As the urban context may affect the design decisions [12], the impact of two towers on another is considered by dividing each building into three subdivisions as suggested in MUZO. Therefore, design decisions for various floor levels, which can provide better high-rise performance [29], are also investigated considering dense surroundings. A new façade skin is proposed in each tower for integrating PV panels and generating shading devices. 39-variables are used to parametrise the studied complex for the abovementioned design parameters. One optimisation problem is formulated for the three towers to use the advantage of each building’s location for power generation and so that the assignment of farming floors achieves the highest self-sufficiency performance possible. This formulation suggests a design problem, which corresponds to more than 4.5e + 91 design alternatives in the search space, with 117-variables. A parametric high-rise model is integrated into the simulation engines to evaluate the self-sufficiency of the complex. Because the simulation models take significant time during the optimisation process, 45 surrogate models are developed for performance prediction based on feed-forward neural networks (FNN). Ten-fold cross-validation (CV) and hyperparameter tuning in each model are considered to investigate the highest prediction accuracies. Developed surrogate models are optimised for self-sufficiency in building and the neighbourhood scales using five single-objective and eight multi-objective optimisation algorithms. Near feasibility threshold (NFT) constraint handling [30,31] is used to cope with 37 and 36 constraints in both optimisation problems. Considering different search strategies suggests a need for a deep investigation of the search space since the global optimal of the design problem is unexplored owing to the NFL theorem in architecture [14]. Employed algorithms, based on the swarm, evolutionary and model-based search strategies that are frequently used in the architectural design domain [32], are given in Table 2.

2. Methodology

The MUZO methodology [13,14], which consists of three main phases to optimise high-rise buildings for performance aspects related to sustainability, is considered to be the core of the methodology. The parametric high-rise model, alongside machine learning for surrogate models, computational optimisation and decision-making phases are followed to utilise the MUZO methodology to optimise the Europoint complex for self-sufficiency in food and energy as illustrated in Figure 1. The following subsections explain the case-building and utilisation of the MUZO methodology in detail.

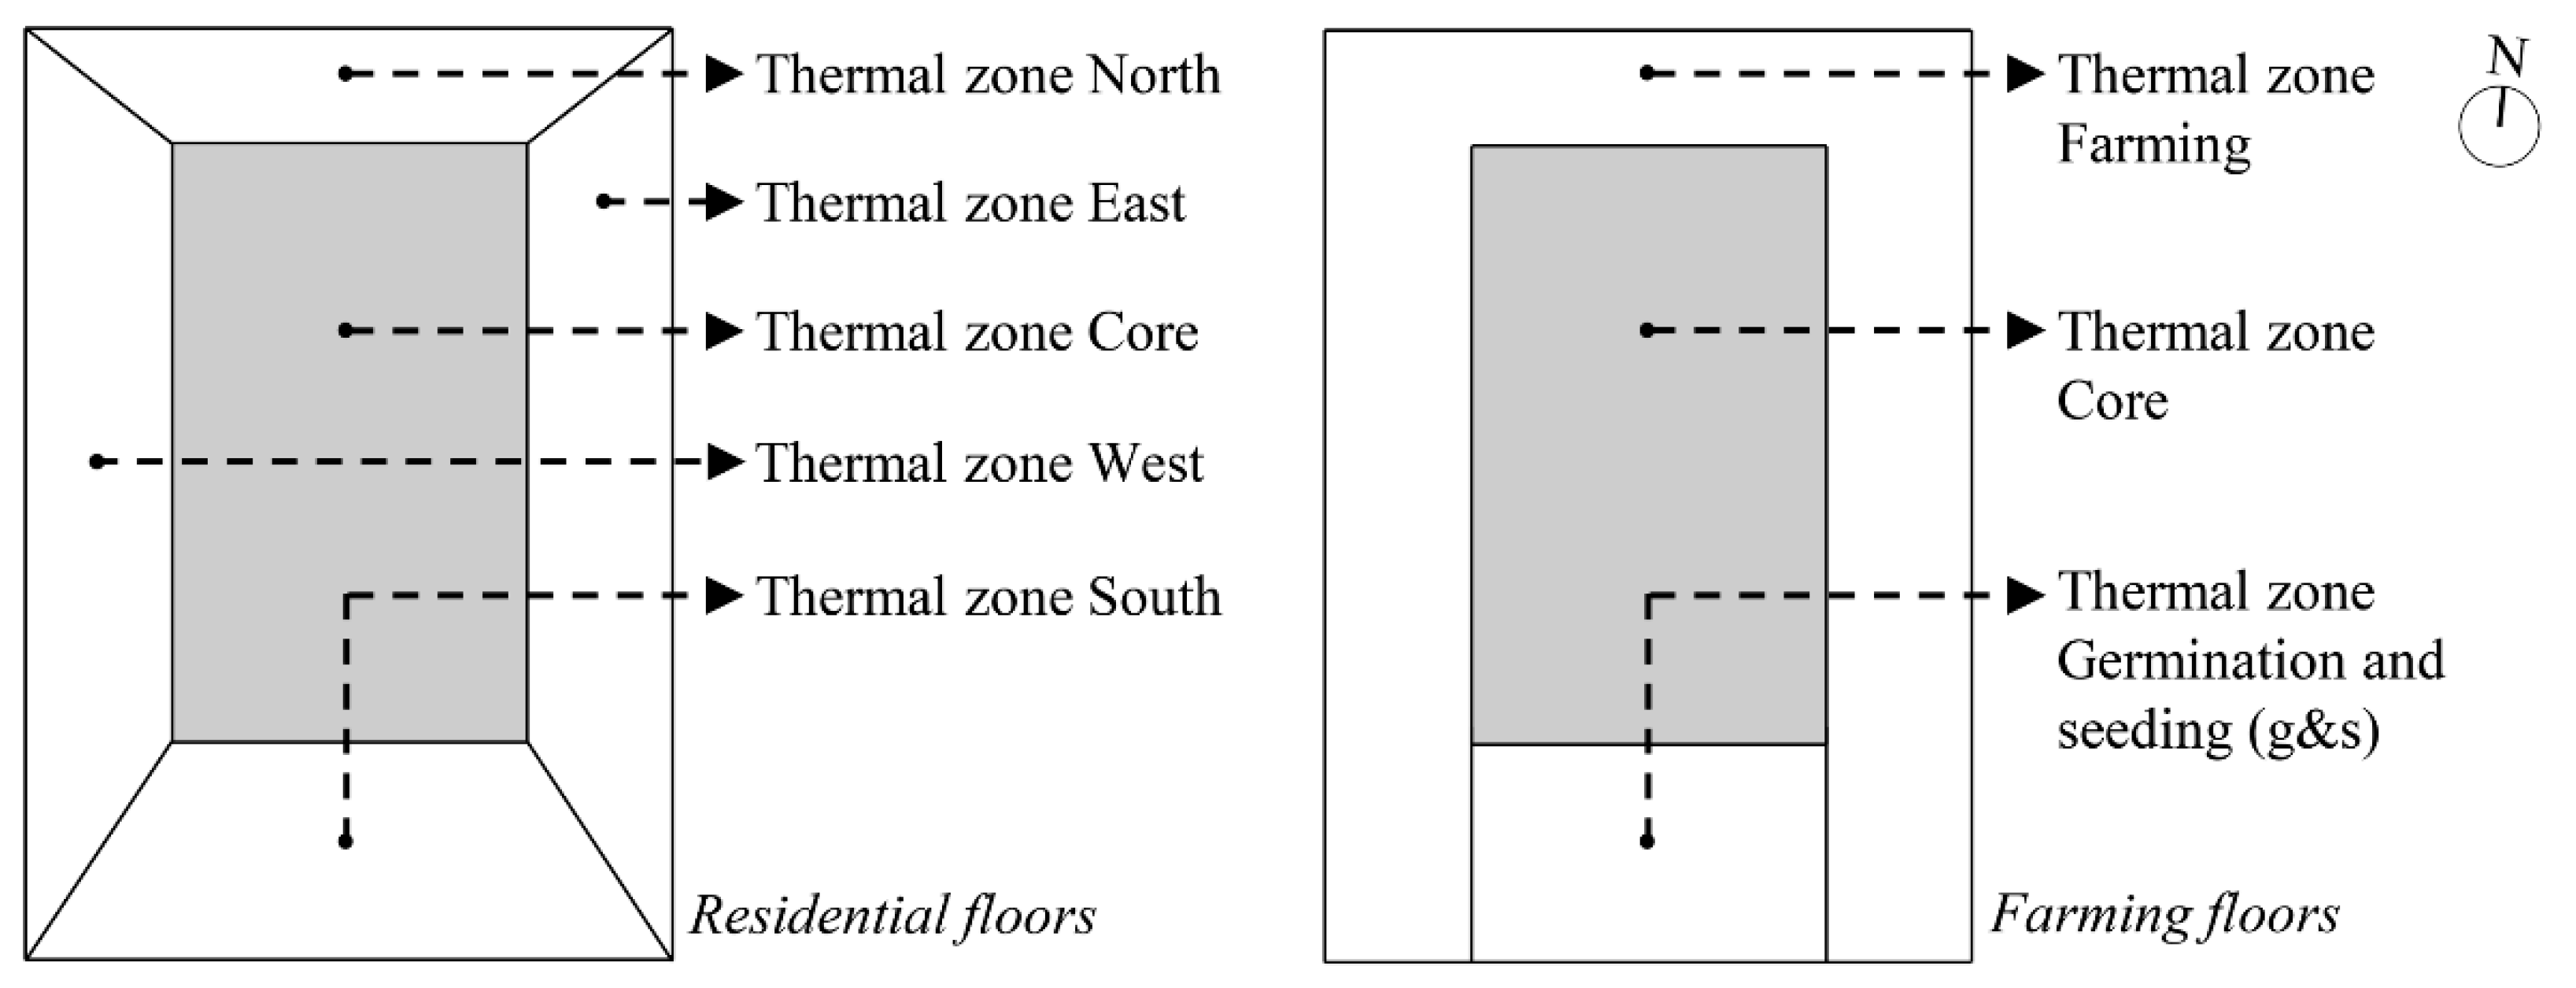
2.1. Case Building Description

The Europoint complex, which was designed by the SOM architecture firm and constructed in 1975, is in the Merwe-Vierhavens (M4H) area of Rotterdam. The complex consists of three towers with 22 storeys, 3.75 m floor heights and a 95 m overall height. It has a rectangular plan scheme measuring 47.6 m by 33.2 m and a central core plan with 1580 m2 gross and 1033 m2 net floor areas, the Europoint Towers are some of the buildings that represent the international façade style of the 1970s (Figure 2). Recently, the MOR team of TU Delft [50] proposed a prototype for the Europoint complex considering net-positivity in energy, air, water, material, and biomass for the Solar Decathlon competition in 2019 [51]. One of the main reasons to focus on these towers was the undesirable energy performance of the existing buildings, which corresponds to 75% of the building stock [52]. The Europoint complex is one of the many examples available in Europe of building complexes that have a significantly higher energy usage when compared to buildings that incorporate the sustainable solutions of the 21st century. In addition to the great potential for improving the energy performance of the Europoint complex, another aspect we consider in this study is to cope with the dense surrounding that will be a challenge in many metropolises based on population growth and urbanisation trends in the future. Besides the built environment, the distances between the Europoint Towers (31 m and 24 m, respectively) cause a large degree of shading on one another. Therefore, each tower should be focused on as a design problem that uses different parameter sets. Related to the self-sufficient high-rise concept, we also propose a different building program that provides farming and residential floors, in addition to public and commercial usage with semiprivate gardens, as illustrated in Figure 3.

2.2. Parametric High-Rise Model

The studied buildings are parametrised considering the most commonly used design parameters for optimisation problems in architecture [32], as well as by following the steps of the first phase of MUZO methodology, which suggests dividing the buildings into several zones (subdivisions) to evaluate their performances separately. Hence, the performance variances in different floor levels can be considered during the optimisation process. The existing complex with surroundings is modelled in the Rhino3d computer-aided design program [53]. The parametrisation process is completed in the Grasshopper3d (GH) algorithmic modelling environment [54] that works as a plug-in for Rhino3d. The following subsections explain the parametrisation process and the simulation setups.

2.2.1. Parametrisation Process

Public and commercial activities are placed on the ground level. Floor levels between 1 to 10, which are also decision variables, are associated with farming floors. The rest of the floor levels are defined as residential floors. The zoning process of the MUZO methodology is considered for dividing the residential part into three zones (subdivisions) in each building. The proposed façade covers the south (S), east (E), and west (W) orientations since the north (N) part of the buildings has insufficient solar potential and creates unnecessary shading. The shape of the skin also follows the zones, farming floors, and other parameters related to the BIPV. The proposed skin can have different distances from the building to create box-shaped shading devices in each zone. Reflectance values of these devices are defined as another parameter for extensive daylight control. In addition, 13 different glazing types, which are based on various visible transmittances (Tvis), thermal transmittances (U-val.) and solar transmittances (g-val.), are also investigated during the optimisation process. Finally, another parameter is used to control the existing size (2.7 m) of the windows that affects the daylight performance, energy consumption, and façade area that can be used for placing additional BIPV panels. Hence, the energy performance of the entire complex can be optimised for finding the most desirable self-sufficiency score under various circumstances (such as considering different design preferences for shaded or unshaded parts of the towers). All the mentioned variables, which are given in Table 3, correspond to a 39-dimensional design problem in each tower that suggests a 117-dimensional design problem for the entire complex. The proposed façade skin with three zones is illustrated in Figure 4.

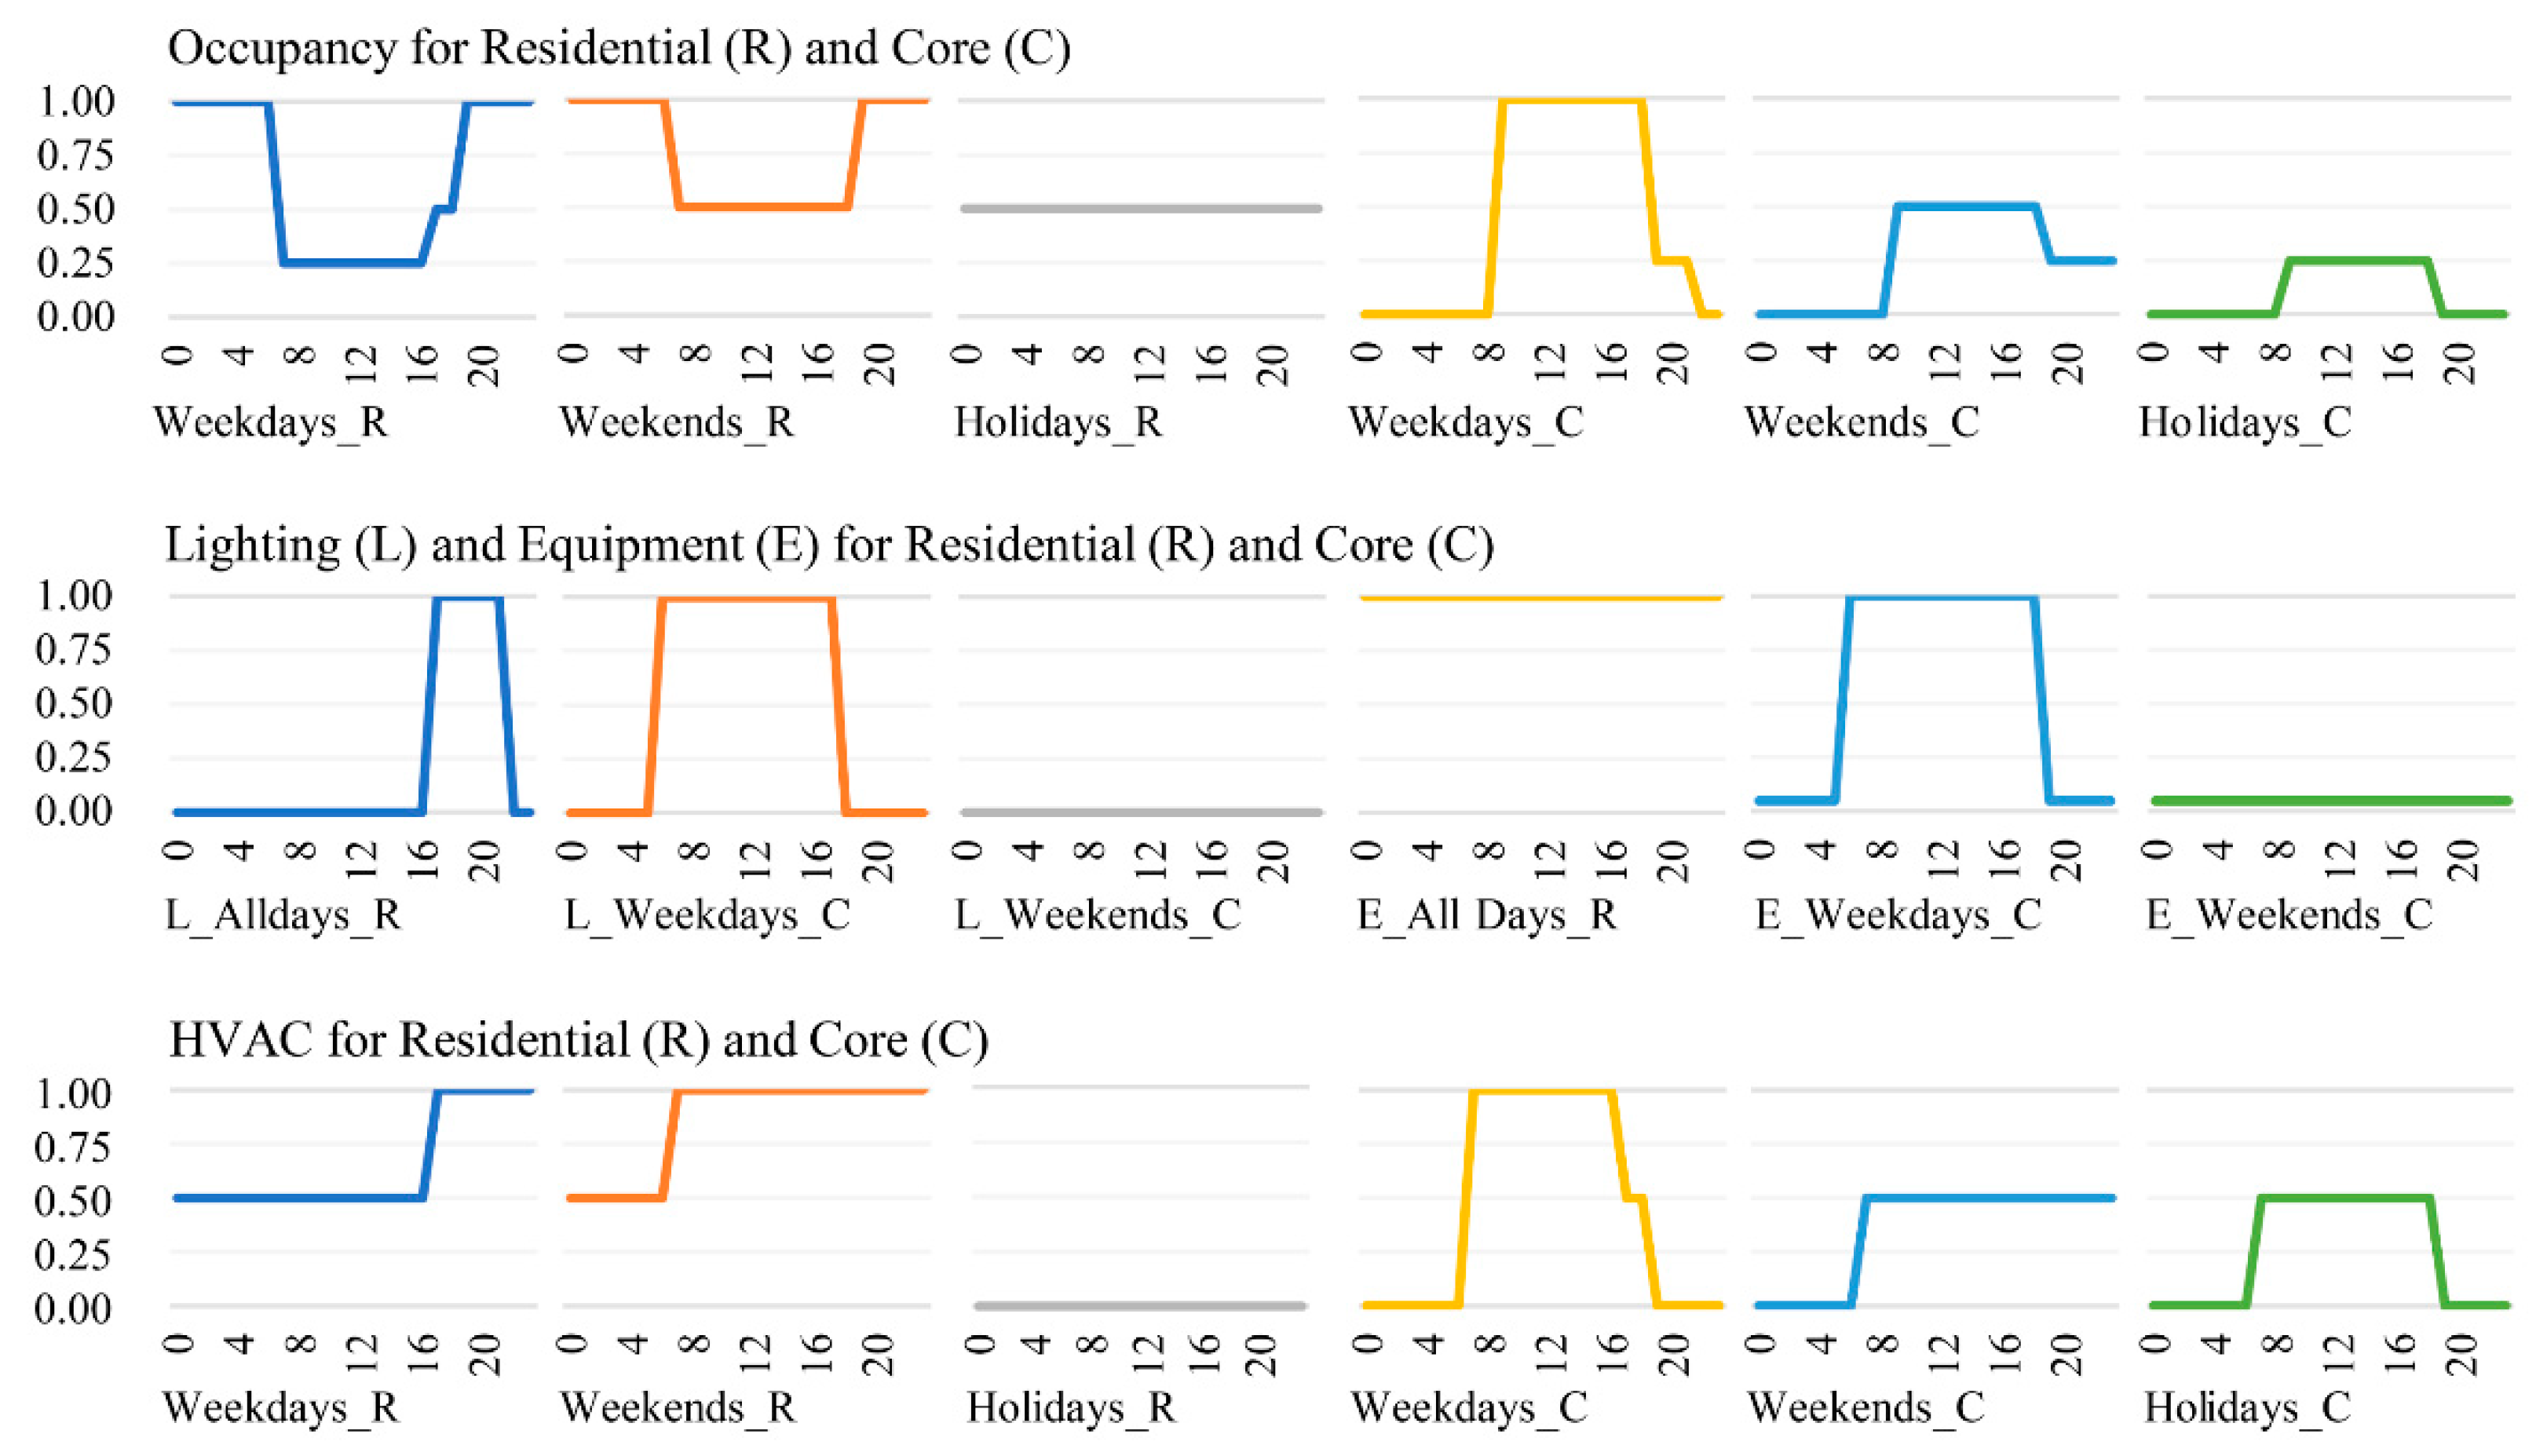
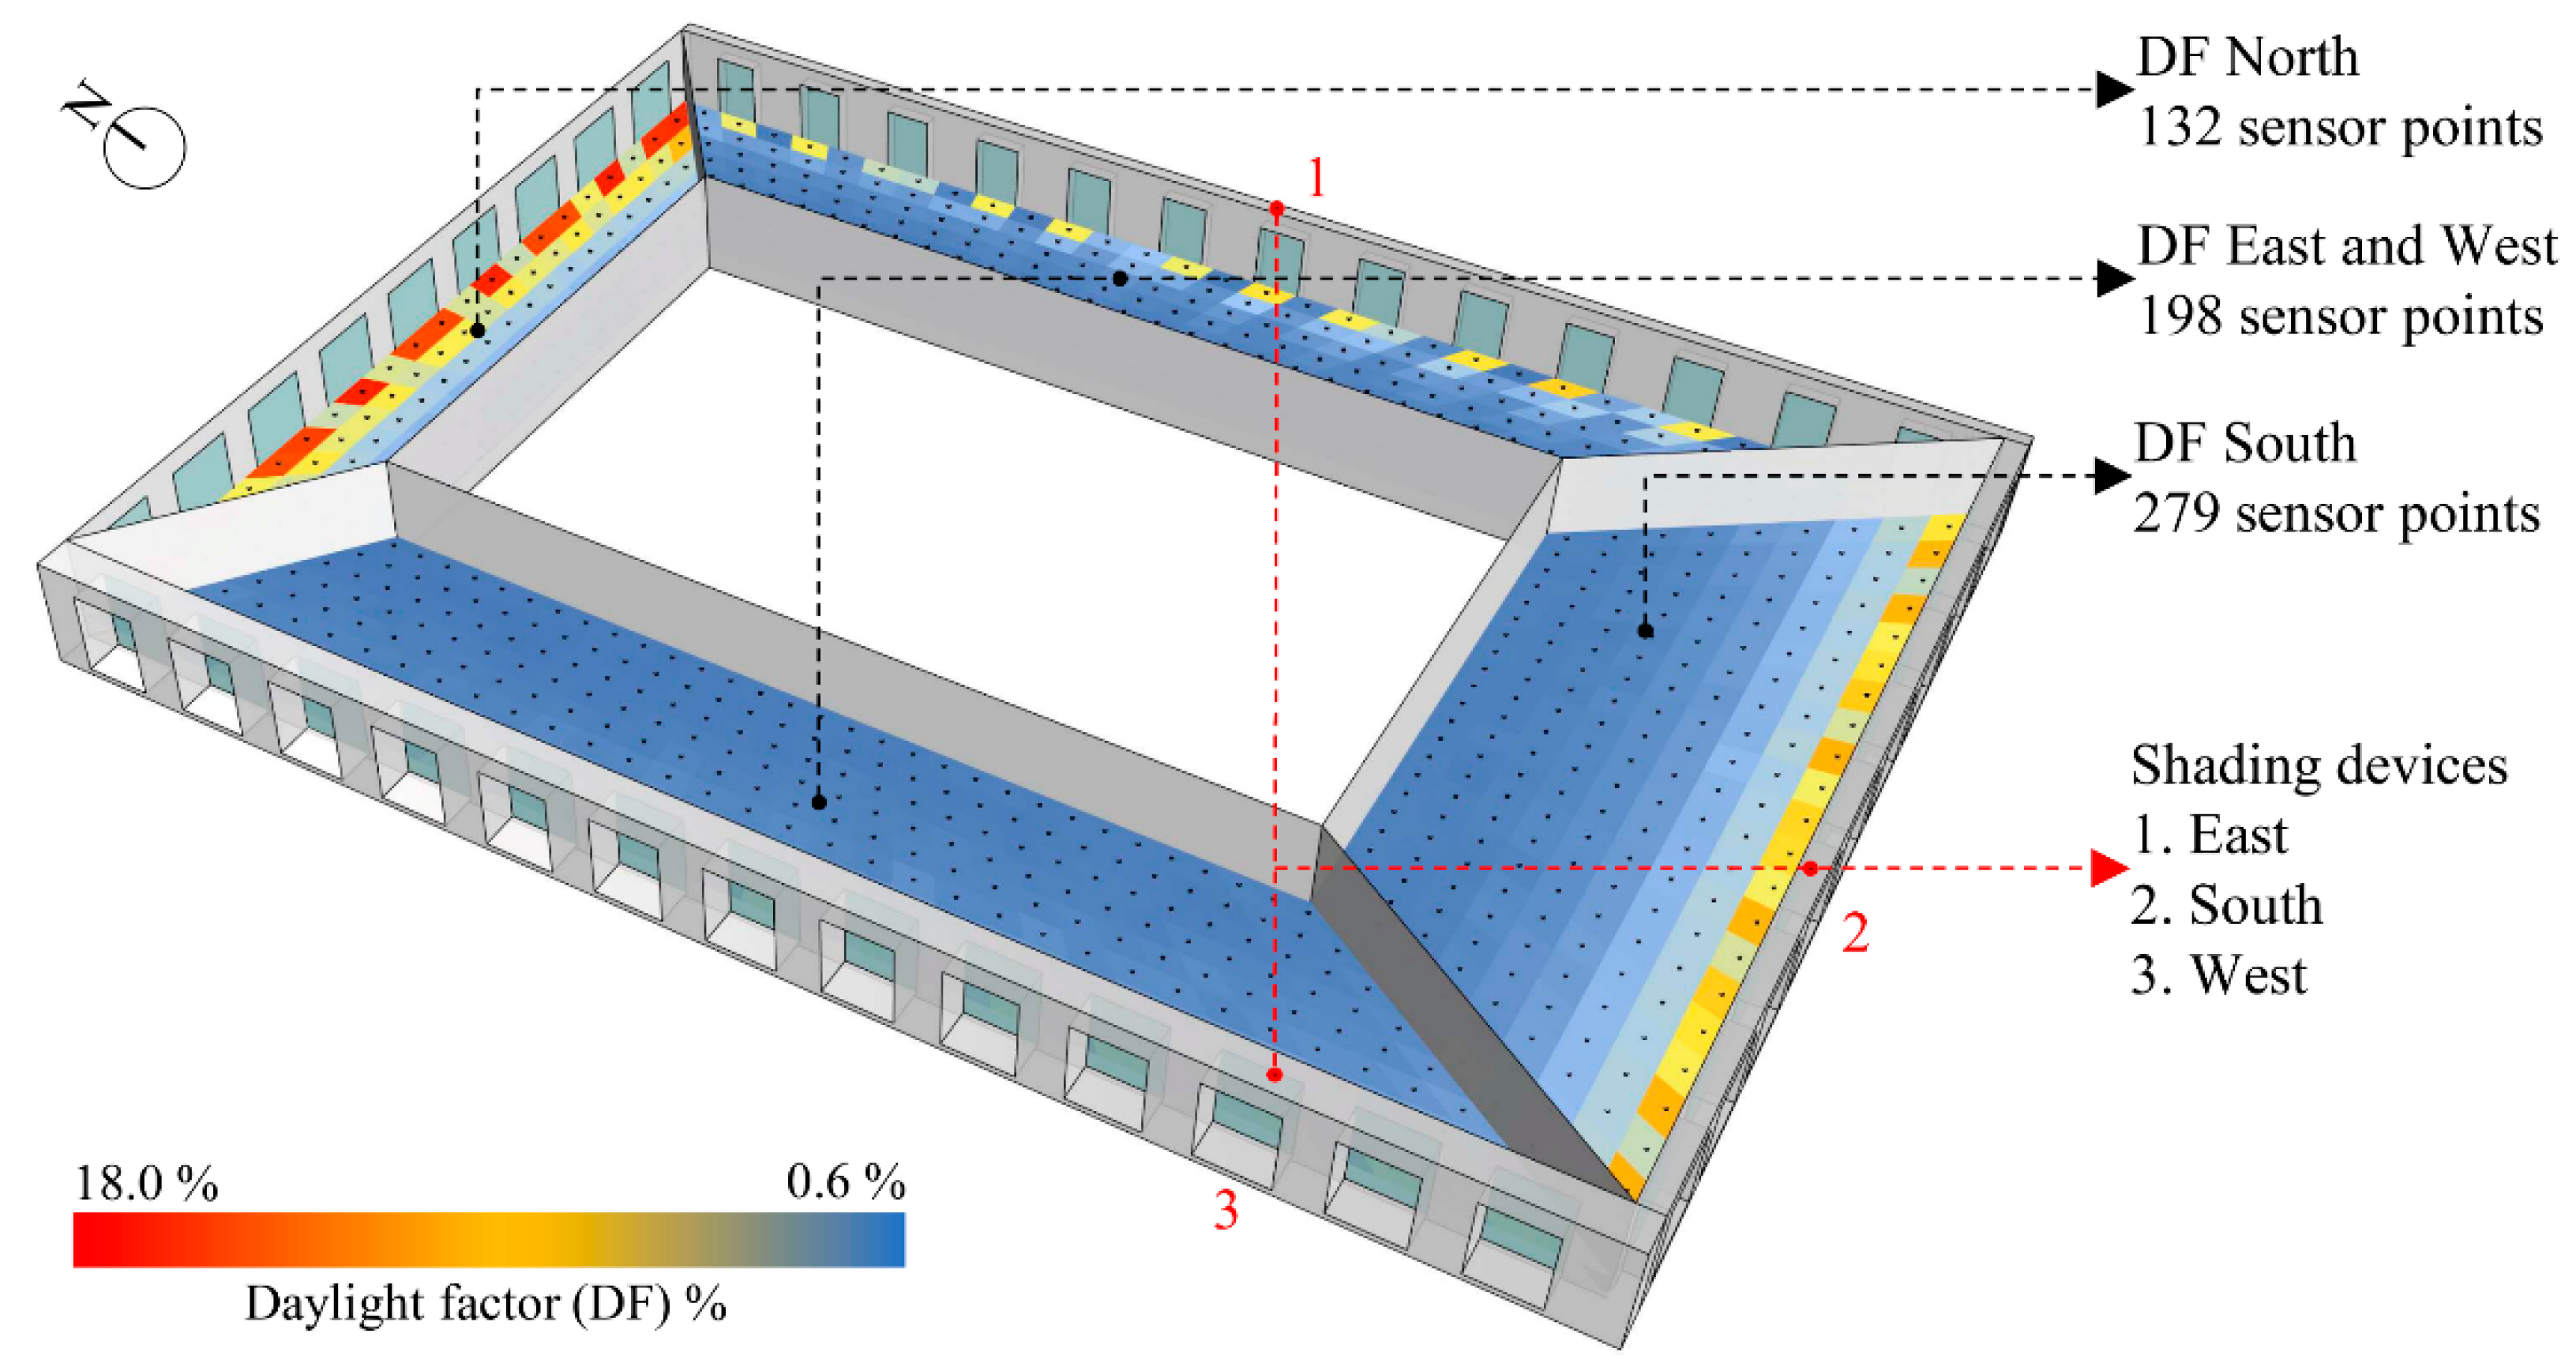
2.2.2. Simulation Setups

The E t o t simulated for self-sufficiency of residential and farming floor levels consists of heating ( E h ), cooling ( E c ), lighting ( E L ) and equipment ( E e q ) consumption, the D F of residential levels and energy generation ( E g ) via BIPV panels. Honeybee (HB) and Ladybug (LB) plug-ins in GH [55], which use Open Studio for energy analysis [54], simulating the energy consumption and generation. Regarding the daylight assessment, HB and LB also evaluate the design alternatives using the Radiance simulation engine [56]. Having an oceanic climate, winters in Rotterdam are mild, humid, and windy, whereas summer days are cool. Therefore, the focus of residential energy consumption is primarily to minimise the heating, lighting and equipment loads. In the farming system, significant energy usage is necessary for the growing process of the plants that require cyclically consistent temperatures, a certain level of humidity with mechanical ventilation, artificial lighting, and other mechanical equipment. Therefore, heating and cooling loads are both considered, as well as lighting and equipment loads. The simulation model of the residential floors is simplified to five thermal zones as N, S, E, W, and core, whereas four thermal zones are utilised in the farming floors, which are farming, germination and seed (g&s), and core, as illustrated in Figure 5. Inputs of the farming energy model are based on recently published closed systems [7,23]. Schedules are based on a 16/8 occupancy period, and 1000 ppm CO2 is considered, which results in an estimated 80 kg m2 y−1 lettuce yield in an 833 m2 floor area, for three stacked hydroponics crop systems covering 50% of the floor plan. In residential floors, various schedules are considered for occupancy, lighting, equipment, and HVAC considering the preferences of the MOR team [50] as defined in Figure 6. All the other inputs of the energy models are given in Table 4.
Regarding BIPVs, the rooftop and façade of residential floors are used to place solar panels. Additionally, external surfaces of the farming floors are used to locate BIPVs since the exterior surfaces of the considered farming system consist of opaque wall material. On the southern elevation of farming, and on the rooftop, four different parameters are defined to optimise the alignment of the panels to achieve the highest E g .
The boundaries of these parameters on the street level ( x 2 ,   x 3 ) are defined according to site conditions. Therefore, different maximum extrusions are considered for each building (Table 3). The radiation analysis to calculate the energy potential of BIPV surfaces is conducted on a 0.5 m by 0.5 m grid to calculate the energy potential through radiation analysis. Sensor points with a minimum of 175 kWh m−2 of energy falling on the surface are used to locate the PV panels for maximum energy/cost profit. This selection also suggests different BIPV patterns in each tower because the way each building is shaded differs from one another. Hence, the total E g can be enhanced in the entire complex because of the larger available PV surface area in different subdivisions (zones) of the towers. As a result, an optimum configuration for window sizes, glazing types, and shading extrusion is expected for energy consumption, alongside generation, and daylight availability. Figure 7 illustrates an example of BIPV allocation in the Europoint complex, whereas parameters used in the calculation of E g are given in Table 5.
Finally, daylight models are developed to simulate D F , which is one of the most commonly used daylight metrics to identify the lighting performance in the early phase of the design process [57,58]. According to Dutch standard NEN-EN 17037, a minimum of 2% of D F should be provided in residential places. While evaluating the D F , performances of each orientation in each zone, which correspond to 36 D F results, are considered under an overcast sky. For each model, a 0.5 m by 0.5 m grid size, which is 0.8 m above the finished floor, is used. In total, 7263 sensor points are used to evaluate one design alternative for the entire complex that corresponds to 807 sensor points on one floor. An example simulation result with the sensor points is illustrated in Figure 8.
Radiance parameters, which are similar to those used in the studies published in the same domain, and the material properties of the developed daylight models, are given in Table 6. Based on the simulation results in three zones for three towers, the following equations calculate the energy consumption of the entire complex:
E t o t = E R + E F E g ,
E R = i = 1 3 j = 1 3 ( E h i , j + E L i , j + E e q i , j ) z i , j ,
E F = i = 1 3 x 1 = 0 x 1   E h i ,   x 1 + E c i ,   x 1 + E L i ,   x 1 + E e q i ,   x 1 ,
E g = i = 1 3   E g i ,
where   E R and   E F are the total energy consumption of residential and farming floor levels, { i 1 , , i 3 } are the three towers in the complex, { j 1 , , j 3 } are the three subdivisions (zones) of each tower, and z i , j is the number of each zone in each tower that changes with the number of the farming floors ( x 1 ). Since the parameters related to the closed farming system are not considered in this study, simulation results of the farming model explained above are multiplied with x 1 to calculate the farming energy consumption in each tower. All the simulation models use the Amsterdam weather data file provided by LB tools [64]. Integrating simulation engines to the parametric model completes the first phase of the MUZO methodology. After validating the results of the energy model with simulations, the parametric high-rise model becomes ready for the second phase of MUZO.

2.3. Machine Learning for Surrogate Models

The surrogate modelling in phase two of the MUZO methodology starts with the sampling process. In this paper, Latin Hypercube Sampling (LHS) [65] generates the design alternatives to be used in the ANN development. As a common approach, Equation (5) identifies the sample size as [66]:
n s = 22.5 n i ,
where n s is the size of the samples and n i is the number of decision variables. In this case, at least 877 samples should be collected for a 39-dimensional design problem. Since the extension of the sample size is beneficial [67], the size of the collection is extended to 1000, thus, the sampling process covers 9000 design alternatives to be collected from the entire complex for ER, Eg, and D F . Normalisation of the collected samples initiates the development of the ANN models using a min–max scale as:
x = σ ( max ( x ) min ( x ) ) + min ( x ) ,
where x is the scaled value, σ is the standard deviation and x is the original value. After identifying a ratio of 0.2 to define training and test sets, the Stochastic Gradient Descent (SGD) algorithm [68] optimises the weights and biases for an ANN architecture that has 39 input, 3 hidden, and 1 output layers. The α of each i th layer is activated as in Equation (7), whereas each neuron is activated by the rectified linear units (ReLU) as in Equation (8):
α i = f ( b i + j = 1 m w i j x i ) ,
f ( x ) = { 0   f o r   x 0 x   f o r   x > 0 ,
where f is the activation function, b is the bias, w i j is the i th layer of the j th weight, and x i is the input vector of the i th layer. To avoid overfitting, ANN models also consider the dropout technique [69] with a rate of 0.1. Based on this setup, the grid search process initiates parameter tuning with a 10-fold CV to identify the best prediction accuracy in each ANN model using the five hyperparameters given in Table 7. The R-squared (R2) term in Equation (9), the mean squared error (MSE) in Equation (10), the mean absolute error (MAE) in Equation (11), and the standard deviation (Std) in Equation (12) are used for model selection:
R 2 = 1 i ( x i y i ) 2 i ( x i x ¯ ) 2 ,
M S E = 1 n i = 1 n ( x i y i ) 2 ,
M A E = i = 1 n | y i x i | n ,
S t d = 1 n 1 i = 1 n ( x i x ¯ ) 2 ,
where n is the size of the samples, { x 1 , , x n } are the observed values, x ¯ is the mean of the collected data, x i is the observed data, and y i is the predicted value. The purpose is to select the models which present a high mean for R2, and a low mean for MSE, and MAE while presenting low Std values for R2, MSE, and MAE at the end of the grid search. Hyperparameters with the best accuracies are once again fit to record the weights and biases for developing the predictive models in the last phase of the MUZO methodology. The abovementioned steps are developed in the Python programming language [70], which also uses the additional Python libraries given in Table 7 to automate the entire ML process.

2.4. Computational Optimisation for Decision-Making

The final phase of the MUZO methodology initiates the optimisation process in GH, which reads the weights and biases that are recorded in phase two, by defining each predictive model with the following equation:
y = f n ( f n 1 ( f n 2 ( f n 3 ( x · w n 3 + b n 3 ) · w n 2 + b n 2 ) · w n 1 + b n 1 ) · w n + b n ) ,
where f n is the n th activation function, w n and b n are the n th weight and bias, respectively, and x and y are the input vector and the predicted performance aspect. The first optimisation problem focuses on the analysis of self-sufficiency in building scale in detail. Equation (14) presents the single-objective constrained problem formulation that is subject to 37 constraints for the first optimisation round:
m i n i m i s e : E t o t s u b j e c t   t o : D F 1 , , 36 2 F p 60 ,
where E t o t is the total energy consumption of the three towers, D F 1 , , 36 are the values of 36 D F s in four orientations (N, S, E, W) for the three zones of the three towers. The minimum F p is defined as 60 tons for 1800 residents living in the Europoint complex, assuming 100 g of lettuce is consumed per person in one day. Therefore, at least two farming floors should be placed in the complex, while optimal energy production can also be achieved with the alignment of two farming floors in three buildings. The second optimisation round investigates the potential self-sufficiency of the Europoint complex at the neighbourhood scale with multi-objective constrained problem formulation subject to 36 constraints as:
m i n i m i s e : E t o t m a x i m i s e : F p s u b j e c t   t o : D F 1 , , 36 2 .
Equation (15) considers F p as another objective function that corresponds to 30 non-dominated solutions in the Pareto front. Instead of a limited searchability for constant penalty functions, both optimisation problems handle the constraints with NFT by panelising the fitness function f ( x ) as:
f p ( x ) = f ( x ) + ( v ( x ) N F T ) α ,
N F T = N F T 0 1 + λ · g ,
where f p ( x ) is the panelised fitness function, v ( x ) is the total violation, N F T 0 is the upper bound of the NFT taken as 0.1, λ and α are defined as 0.04 and 2, respectively, and g is the iteration or generation number. The optimisation phase of the MUZO methodology suggests a need for replication of the optimisation runs and algorithm comparisons owing to the NFL theorem in architecture. Thus, the decision-making step considers various replications using different optimisation algorithms for extensively investigating the unexplored search space of the design problem.

3. Results and Discussion

This section presents the results of the validation and sampling processes using simulation models, statistical results of the grid search and tuned models of ML, and the optimisation results for two scales of self-sufficiency problems, i.e., the building and neighbourhood scales. Finally, results are discussed for both problem scales focusing on the potentials and limitations of the study.

3.1. Model Validation and Sampling Results

Energy results collected from HB were validated using another simulation model in DesignBuilder (DB) before initiating the sampling phase for the entire complex. Therefore, a simplified version of the residential energy model was used in HB and DB with the values given in Table 4. As illustrated in Figure 9, monthly air, radiant, and operative temperatures suggested an observable correlation between the results of HB and DB. For further investigation, a regression analysis was performed considering weekly temperatures. The results in Figure 10 indicated that R2 for all the temperature results was higher than 0.96. Afterwards, E F was calculated for the validated HB environment. When CoP was equal to 1, annual farming energy consumption was calculated as 1123.2 MWh y−1, whereas it was 629.3 MWh y−1 for CoP 5. The F P of the farming system for lettuce crops was calculated as 33 tons on a single floor with the temperatures given in Figure 11.
The collected samples, which include the simulation results of E R (for CoP 1 and 5), E g and average D F for all orientations in all zones of the three towers, were published as an open-access dataset [76]. The completion time for this task was recorded as 15 d 6 h 40 m using a computer with an Intel I7 5820K core processor at 3.30 GHz, with 16-GB DDR4 of memory, and a 256-GB solid-state drive. Distributions of the simulation results (Figure 12) indicated that the three towers presented similar E R values between 1066 MWh and 1951 MWh (when CoP was equal to 5), and a wider range between 1652 MWh and 3246 MWh (while CoP was 1). Regarding E g , tower one had the highest solar power potential with a range of between 592 MWh and 1040 MWh. While tower two presented a solar power potential range of between 580 MWh and 901 MWh, tower 3 demonstrated a range from 556 MWh to 923 MWh. Although ranges of towers two and three were similar, the minimum E g of tower two was higher than that of tower three because of its location. Nevertheless, the maximum E g of tower three indicated that its solar potential could be improved with the x 2 and x 3 parameters by controlling the positions of the BIPV panels.
Regarding D F , N and S orientations presented similar distributions, while higher values were observed in the north when compared to the south. The reason for this was that the places located on the southern elevation of the towers were much deeper than in the north. On the other hand, various distributions were observed in the E and W orientations in different zones and towers, that could be due to the effect of the towers shading one another. Finding D F values higher than 2% in the E and W orientations was more challenging than for N and S orientations during the sampling process. Therefore, different design decisions were expected for various zones of each tower in the optimisation process.

3.2. Machine Learning Results

The data collection, which had 1000 samples in each zone, was trained using FNN (as an ANN method) and is explained in Section 2.3. In total, 9000 samples were used to develop 45 surrogate models, which predict D F , E R , and E g using 39 design parameters that are given in Table 3. Additionally, 36 D F models were developed separately for each zone in each orientation, since the daylight standard should be achieved for the entire complex. During the prediction of E t o t , the summation of consumed ( E R ) and produced ( E g ) energy for each tower was considered. Grid search setup, which investigates the five hyperparameters given in Table 7, was considered with a 10-fold CV. The total number of the models to fit using the FNNs was calculated as 109,350, based on the results of 2430 models for completing the grid search process in every fold of the 45 surrogate models. The average completion time for one grid search task was recorded as 2 h 17 m using a computer with an Intel Xeon E5-2640 v4 core processor at 2.40 GHz, with 64-GB DDR4 of memory, and a 1024-GB solid-state drive. A self-developed Python program automatically read the data, developed ANN models, selected the best hyperparameters for 45 models according to mean and Std of the MAE, MSE, and R2 values, fitted the final ANN models for training alongside test sets using the selected hyperparameters, and reported the statistical results as well as weights and biases for the 45 surrogate models. The best hyperparameters with corresponding means and Stds of the MAE, MSE, and R2 values for three zones of the three towers are given in Figure 13.
During the batch size selection, 21 models had the best accuracy using a value of 25, while for ten models it was 50, and for 14 models it was 75. For epochs, 31 models had the best score with values of 750, for nine models it was 500, and for five models it was 250. For the momentum parameter, four models had the best score using values of 0.3, for seven models it was 0.6, and for 34 models it was 0.9. Regarding the learning rate parameter, nine models had the best accuracy using values of 0.01, fifteen models yielded the best results using 0.05, and 21 models using 0.1. As final the hyperparameter, 6 out of 45 ANN models had the best accuracy using 50 neurones, 23 models had the best results using 100 neurons, and for 16 models the best value was 150 neurones. Results of the best hyperparameters indicated that the mean of all MAE values was less than 0.05 while having Std values of less than 0.005. The mean of the MSE values was less than 0.003 with Std values smaller than 0.0005. The mean of all R2 values was higher than 0.94, whereas the Std values were less than 0.0015.
Reported statistical results in the grid search process presented promising prediction accuracies. Therefore, tuned ANN models were developed using the selected hyperparameters in the next step. Initially, the data was split into training and test sets considering a ratio of 0.2 to demonstrate accurate prediction. Results in Figure 14 indicated that MAE and MSE values of both sets were less than 0.05 and 0.003, respectively. Additionally, all R2 values were higher than 0.94. Finally, tuned ANN models were used to predict the parameter values generated by LHS with the weights and biases provided as the Supplementary Material. R2 values indicated that there was a very high correlation between the simulation and the prediction results for E R , E g and mean D F as shown in Figure 15. All of the results of the second phase of the MUZO methodology suggested that the predictive models could be used for the optimisation process in the next phase.

3.3. Computational Optimisation Results

During the last phase of the MUZO methodology, two design problems were considered focusing on different scales. First, a single-objective problem was investigated in detail employing the single-objective optimisation algorithms given in Table 2, using the Optimus, Opossum, Galapagos, and Silvereye plug-ins in GH. Since jEDE, GA, and PSO are populated algorithms, 50 and 100 population & swarm (P&S) sizes were considered in this optimisation round. Secondly, the multi-objective optimisation problem was investigated considering single replication to present the potential self-sufficiency of the Europoint complex at the neighbourhood scale by employing the stepwise and multi-objective optimisation algorithms given in Table 2, using the Optimus, Wallacei, Octopus, and Opossum plug-ins in GH. Except for RBFMOpt, 50 P&S was considered for populated algorithms. The mutation rate of jEDE was set between −1 and 1, while the other algorithms were used with the default parameters. The NFT module in the Optimus plug-in was considered to cope with the constraint functions of both problems for all optimisation algorithms. All the runs were completed when CoP was equal to 5. Since the ML models for CoP 1 were also developed, their results were also reported. The following subsections present the gathered results for both problems at the building and neighbourhood scales.

3.3.1. Building Scale

Results at the building scale were conducted for 7500 FES using a computer with an Intel I7 5820 K core processor at 3.30 GHz, with 16-GB DDR4 of memory, and a 256-GB solid-state drive. Because the non-populated algorithms were used in the Opossum plug-in, 7500 FES was defined as a maximum iteration count for CMA-ES and RBFOpt, whereas 50 and 100 P&S sizes were considered with 150 and 75 generation/iteration counts for the populated algorithms. The criteria for comparing the optimisation results of this problem were defined as finding feasible solutions for 37 constraints, the lowest E t o t needed to have zero violation, Std was calculated for five replications, and computation time (CPU) needed to have been recorded. Figure 16 illustrates the boxplots of the optimisation results for feasible solutions only, whereas Table 8 presents the number of feasible solutions ( v ( x ) = 0 ), the minimum (Min), maximum (Max), average (Avg), and Stds of E t o t for five replications. For constraint handling, jEDE, CMA-ES, and GA reported feasible results in all the replications, whereas RBFOpt found two, and PSO reported one feasible solution. For the algorithms which reported infeasible solutions, Max, Avg, and Std values were also higher than the ones which reported feasible results in all replications because the panelised fitness function remained until the end of the optimisation. Regarding feasible alternatives, jEDE presented promising results with the lowest E t o t and Std values. The CMA-ES algorithm also suggested promising searchability for discovering feasible solutions, while finding slightly higher values of E t o t and Std than jEDE. Despite the feasible solutions, GA had higher E t o t when compared to jEDE and CMA-ES. During the optimisation process, the CPU of the algorithms was recorded as 82, 269, 819, 124, and 334 min for jEDE, CMA-ES, RBFOpt, GA, and PSO, respectively. This suggested that the jEDE was the most robust algorithm because its lower CPU, E t o t , and Std values than the other algorithms. The convergence graphs of all algorithms for this optimisation round are given in Figure 17.
The results of the jEDE with a population size of 50 was selected for further analysis of self-sufficiency at building scale. When the design of the optimised complex was investigated in detail, weekly averages of air temperatures were observed as being between 19.5 °C and 25.1 °C in all zones. Since the violation was 0 at the end of the optimisation process, all the 36 D F values were higher than 2%, while 66 tons of lettuce was provided in one year. For energy performance, the E t o t of the optimised design was reported as 3072.8 MWh y−1, while the values of E R , E F , and E g were 4206.3 MWh y−1, 1258.6 MWh y−1, 2392.1 MWh y−1, respectively. Therefore, 43.7% self-sufficiency was achieved in energy, while 100% self-sufficiency was reached in lettuce production. Considering CoP as 1, E R , E F and E g were reported as 6854.9 MWh y−1, 2246.4 MWh y−1, 2392.1 MWh y−1, respectively. Average air temperatures of three zones for each tower are given in Figure 18.
Finally, the efficiency of the MUZO methodology was tested by generating typical high-rise scenarios, which had the same set of design parameters for the complex instead of differentiating them as in the optimised solution. 7776 typical design scenarios were generated using the combinations of the parameters given in Table 9 for each tower. Design scenarios having more than two farming floors in the complex were discarded to have the same lettuce production for 1800 residents. Figure 19 presents the comparison between the optimised design and typical scenarios, whereas Figure 20 illustrates the parameter values of the optimised design and the best typical scenario.
Results indicated that the studied problem was extremely challenging because of finding feasible solutions for D F in each orientation of nine zones while minimising E t o t . When the distribution of the typical scenarios was examined in Figure 18, it was observed that there were 1202 feasible solutions out of 7776. Although some infeasible alternatives had similar E t o t values with the optimised solution, their D F values were less than 2%, which was lower than the Dutch building standards. Additionally, the lowest energy consumption in the typical scenarios was observed as 3922.9 MWh y−1. When the optimised solution was compared to a typical design, the performance improvement was noted as 21%, corresponding to 850.1 MWh y−1 less energy consumption for the entire complex. The final design achieved at the end of the MUZO methodology is illustrated in Figure 21 using the parameter values of the jEDE algorithm with a population size of 50.

3.3.2. Neighbourhood Scale

Results for the neighbourhood scale were also conducted for 7500 FES using a computer with an Intel I7 5820 K core processor at 3.30 GHz, with 16-GB DDR4 of memory, and a 256-GB solid-state drive. The 7500 FES was defined as the maximum iteration count for the RBFMopt algorithm in the Opossum plug-in because of its non-populated application. In other algorithms, 50 population sizes were considered for jEDE, NSGA-II, HypE, SPEA-2, and MOEA/D with 150 generations, and 50 swarm sizes for NSPSO, and MACO with 150 iterations. The criteria for comparing the optimisation results of this problem were defined as finding feasible solutions for 36 constraints, having a large number of non-dominated solutions, and having a small CPU. Results of the jEDE algorithm were based on the stepwise run using incremental violation for F p . Table 10 presents the overview of the optimisation results at the neighbourhood scale. Figure 22 illustrates the search space and the lowest E t o t (non-dominated) results of jEDE, whereas Figure 23 presents the same results for the rest of the other multi-objective algorithms.
During the stepwise optimisation, jEDE discovered feasible solutions in all problems that corresponded to 30 non-dominated solutions. Because of the single-objective design of jEDE, the total run time was higher than other multi-objective optimisation algorithms owing to the 30 runs completed in each step. Contrarily, results of jEDE were used as a benchmark, because of its promising searchability. Results indicated that jEDE found 24 lower E t o t values than other algorithms. In other words, 24 results dominated the other non-dominated solutions discovered by multi-objective optimisation algorithms. On the other hand, HypE dominated six of the jEDE solutions, slightly. Despite promising results in E t o t , NSGA-II and HypE could find 20 non-dominated solutions out of 30. However, the non-dominated solutions of NSGA-II were dominated by jEDE and HypE. SPEA-2 Alt. The Pm. and Pm. applications discovered 30 and 28 non-dominated solutions, which were also dominated by jEDE and HypE, respectively. Additionally, NSPSO presented a limited number of feasible non-dominated solutions, whereas the MACO, RBFMopt, and MOEA/D algorithms discovered only infeasible alternatives. Therefore, jEDE, NSGA-II, HypE, and versions of the SPEA-2 algorithms were selected to investigate the potential of the Europoint complex in detail. Figure 24 illustrates the combined version of the non-dominated solutions, which have an E t o t between 2575.4 MWh y−1 and 19,639.6 MWh y−1 and an F p between 33 tons and 1000 tons, as a result of the selected algorithms. The developed model indicated potential annual self-sufficiency in lettuce production starting from 900 people up to 27,000 people, whereas potential self-sufficiency in energy was observed for between 47.8% and 11.6% starting from the building scale to the neighbourhood scale.
Despite the increasing surface area of BIPV panels at higher values of F p , self-sufficiency in energy was decreased because of the significant energy use of the closed farming systems. Regarding the energy results, variances of E t o t were higher at the building scale when compared to the neighbourhood scale. The reason was that the lower values of F p increased the significance of the design parameters related to the energy consumption of the residential floors. In solutions with higher F p values at the neighbourhood scale, the energy consumption of the closed farming systems dominated the impact of those parameters. Therefore, jEDE significantly improved upon other algorithms at the building scale, whereas jEDE and HypE slightly improved upon NSGA-II and SPEA-2 at the neighbourhood scale. From a broad perspective of the search space, a linear correlation was observed between E t o t and F p that was expected as the constant energy consumption and production results of the farming systems were associated with the number of the farming floors ( x 1 ). To evaluate the potential impact of the developed model in Rotterdam city, the density of the habitation was considered at 3043 residents per km2 [77]. A self-sufficiency map is illustrated in Figure 25 using Stamen Maps [78]. For the highest value of F p , the Europoint complex could provide lettuce for 27,000 residents in a 1.67 km radius that corresponded to 2.66% of the population of Rotterdam (assuming the city has 1,012,017 residents [77]). To become a self-sufficient city after achievement of self-sufficiency at the neighbourhood scale, approximately 940,000 m2 of vertical farming area would be needed to respond to the lettuce demand of the citizens of Rotterdam. In other words, 38 complexes like the Europoint complex, which involves 30 F p levels that have 833 m2 floor area each, would make Rotterdam self-sufficient in lettuce crop.

3.4. Discussion

This section presents the discussion based on the results of the sampling, ML, and optimisation experiments conducted for the Europoint complex. Five topics are discussed, which are defined as: the parametric high-rise model; ML for performance prediction; computational optimisation; self-sufficiency in energy and food; and the MUZO methodology for self-sufficient high-rise buildings in future cities.
  • Parametric high-rise model: Samples of Europoint complex were collected separately for each subdivision (zone) using a computer with an Intel I7 5820 K core processor at 3.30 GHz, with 16-GB DDR4 of memory, and a 256-GB solid-state drive. During the sampling process, the computer terminated the calculation process because of a memory shortage when the entire complex was simulated using 21 models. The same test was replicated using a computer with an Intel Xeon E5-2640 v4 core processor at 2.40 GHz, that had 64-GB DDR4 of memory, and a 1024-GB solid-state drive. The completion time was recorded as more than 1 h when it was expected to be approximately 22 m for the hourly simulation period. After the examination, the reason was defined as the data transfer between the simulation plug-ins and engines. Although less effort was required to conduct the results using all the simulation models of the complex, each sampling process was completed separately, which was three times more efficient than considering a sampling process for the entire complex. Lower simulation periods, i.e., 15 min, can cause an exponential increase in the efficiency of conducting the sampling results. In this paper, self-sufficiency in energy and food was examined subject to daylight performance. In the case of integrating other performance aspects related to self-sufficiency or comfort, the MUZO methodology would still be a feasible solution because of how it deals with different parts of the buildings as different design problems. Moreover, there was no error reported during the simulations because the studied building had an orthogonal floor plan and façade configuration. In the case of convex or nonconvex surfaces involved in any part of the building, errors, or exponential increases in simulation time could be observed.
  • ML for performance prediction: 45 surrogate models were developed to predict the performance aspects. While nine of these models were used to predict energy-related criteria, 36 of them were considered for daylight evaluation. Instead of using a high number of surrogate models to predict the daylight in detail, average values for each tower were considered during the initial phase of the ANN development. Despite the promising prediction accuracies, which had R2 values higher than 0.8, it was observed that the minimum daylight requirement could not be achieved in all orientations of the three zones. Therefore, different surrogate models were considered that caused a slight increase in function evaluation during optimisation, but also a higher accuracy in terms of correct prediction. One may argue that a possible alternative could be to develop daylight models for average and deviatory values, which were not investigated owing to the limitations of the study. On the other hand, because of the full automation between the developed Python program and the predictive models developed in GH, extra effort was not needed to cope with a high number of surrogate models. Results of the grid search process indicated that different hyperparameter sets were required to predict performance with a high level of accuracy. This once again underlines the importance of grid search investigations for predicting performance aspects in the building simulation domain. When large numbers of ANN models are required for fitting during the grid search process, GPU usage can be considered not only for the studied problem scale in this paper but also for the problems focusing on larger scales in the built environment.
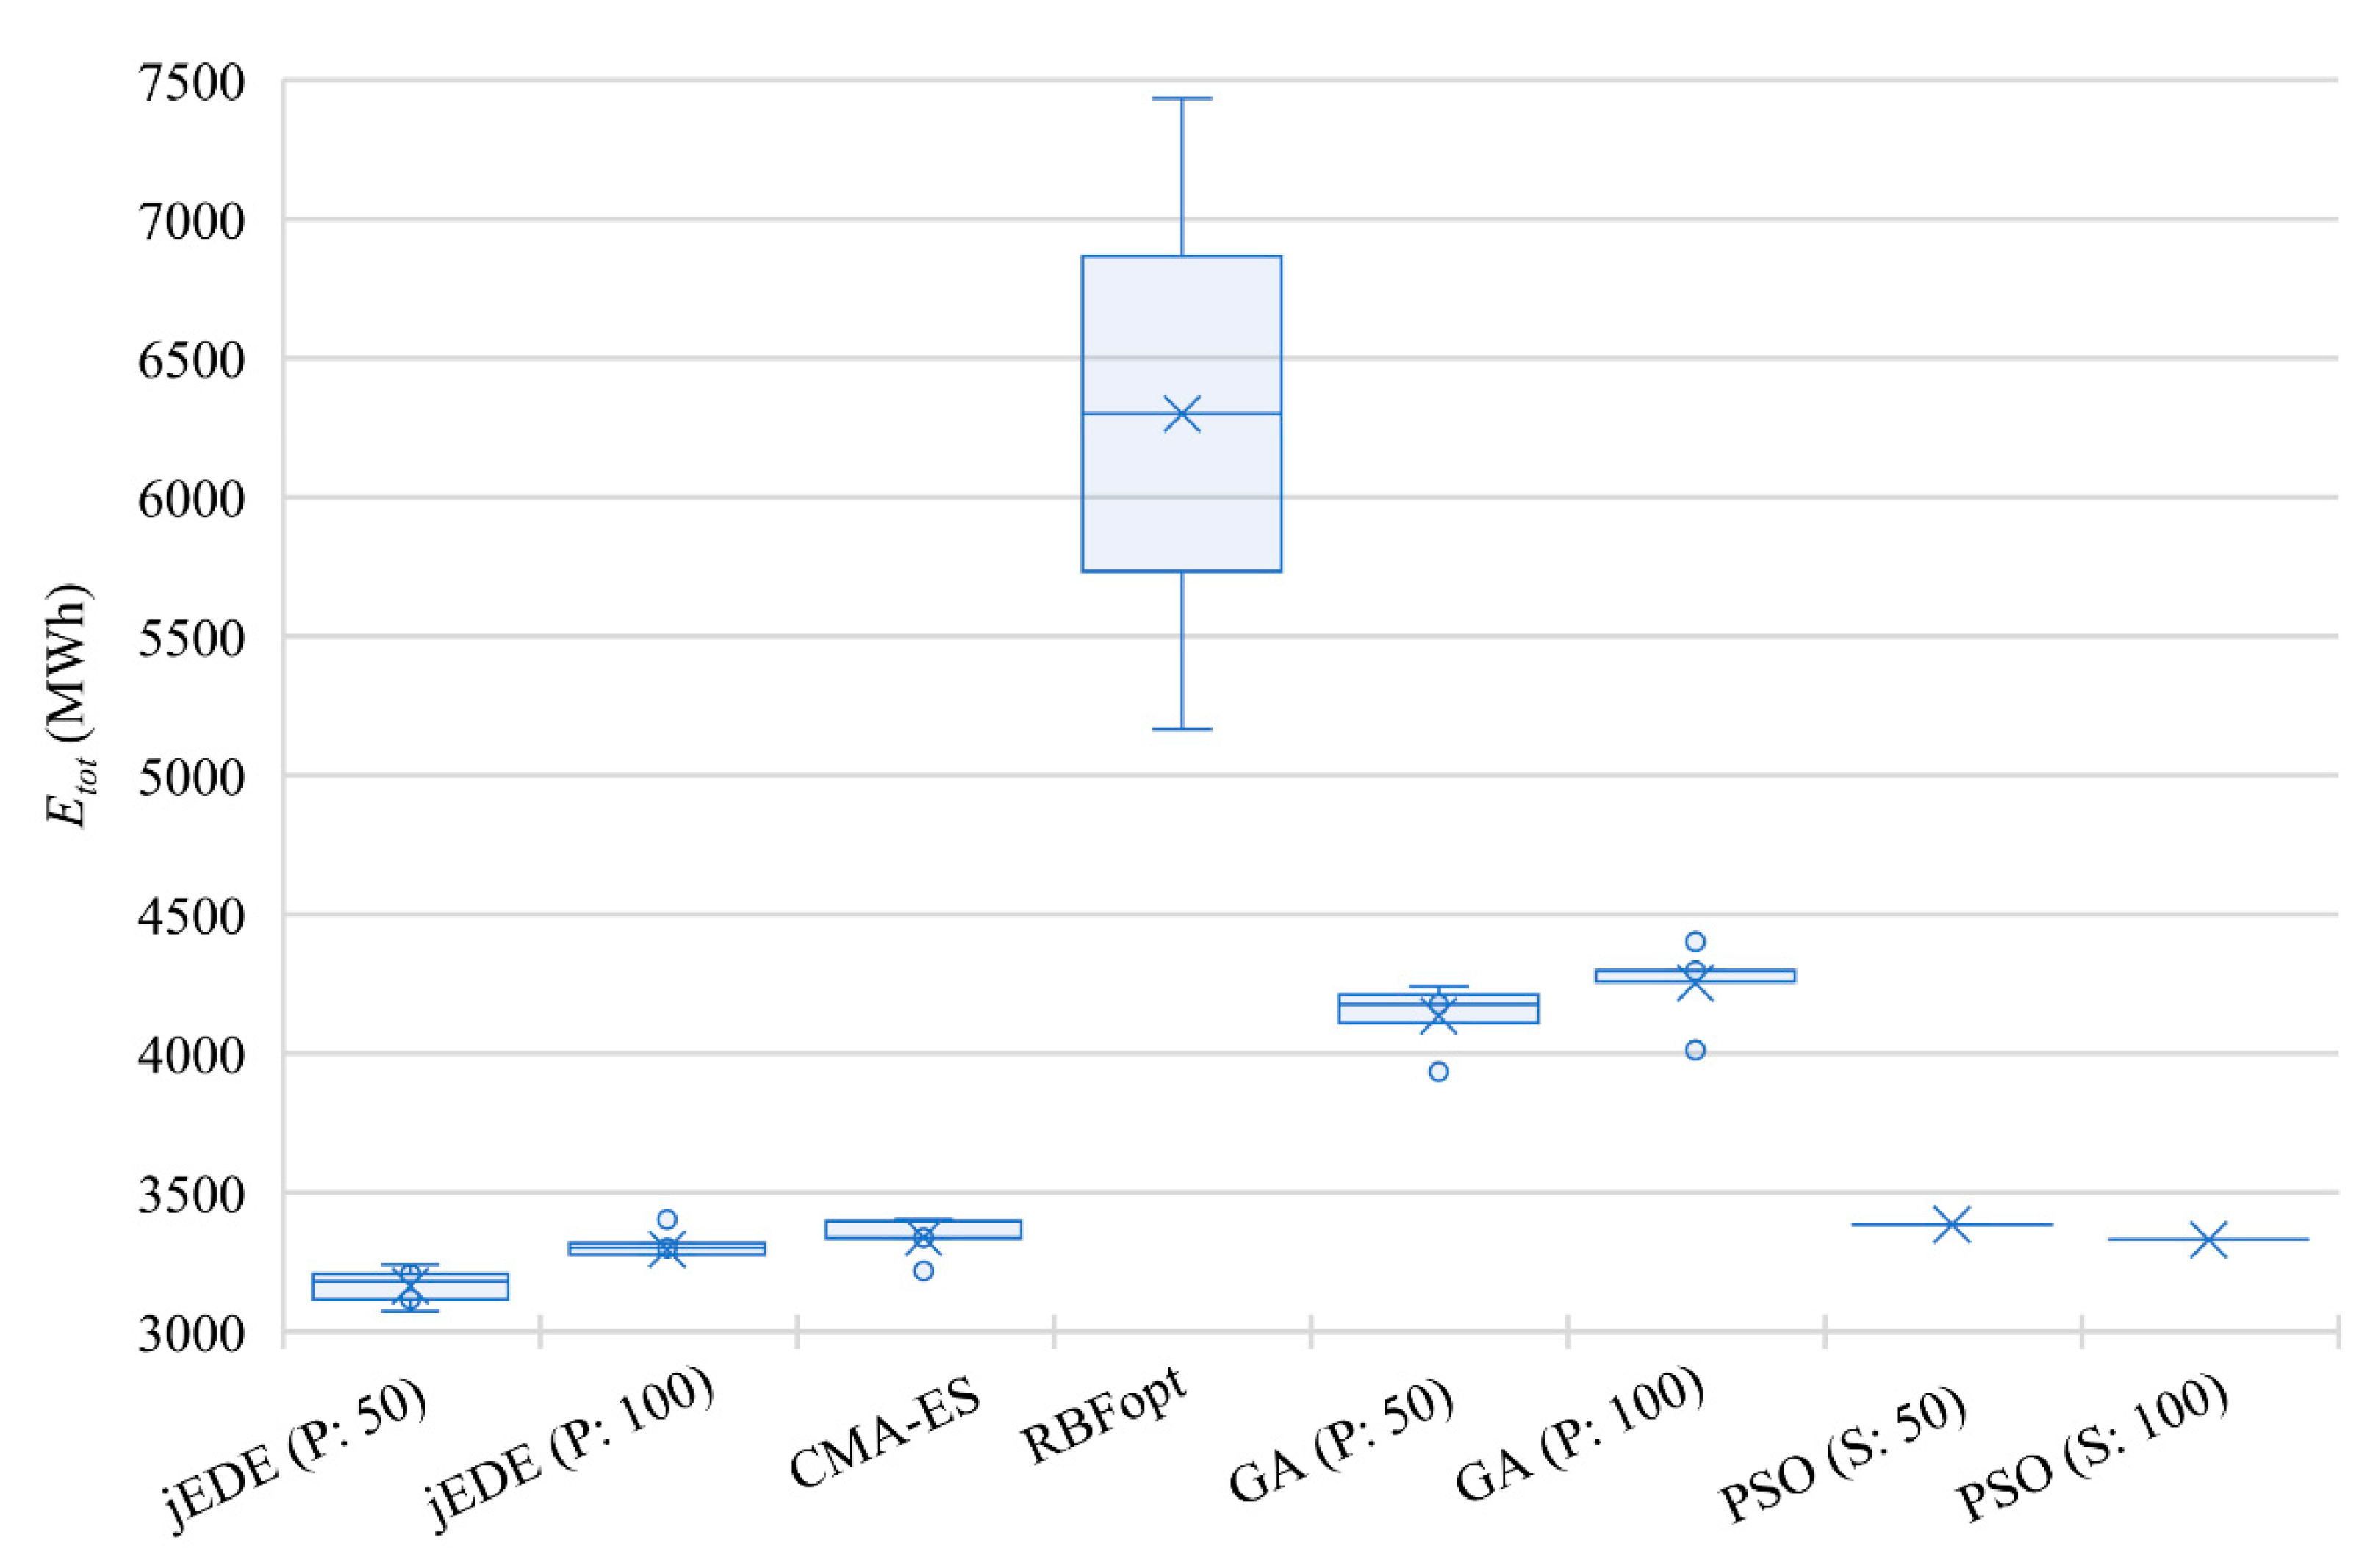
  • Computational optimisation: For the building scale, jEDE with the Optimus plug-in presented the most robust search behaviour because of it having the lowest fitness, CPU, and Std values. One reason could be that updating the number sliders in the GH environment requires additional time for each function evaluation. Another reason could be related to the procedures considered in optimisation algorithms, i.e., covariance matrix adaptation and the radial basis function. Despite updating the number sliders, GA in the Galapagos plug-in discovered near-optimal alternatives in less time when compared to other algorithms. On the other hand, CMA-ES presented promising solutions in terms of fitness and Std but required an expensive computation budget. Despite using the radial basis function, RBFopt could not perform desirable solutions that might be related to the high number of decision variables. This underlines once again an ongoing discussion for using either model-based algorithms (e.g., RBFopt) or optimisation procedures with predictive models (i.e., this paper) in architectural design [14]. The results of this paper indicated that surrogate-based optimisation algorithms are convenient to utilise in small-scale architectural design problems, whereas optimisation with surrogate models should be considered for design problems having an enormous number of design parameters. Therefore, an extensive investigation could be possible for large-scale design problems as attempted in this study. Since 7500 FES were sufficient for jEDE and CMA-ES, an investigation of a higher number of FES, which might slightly improve the results of other algorithms, was not considered. For the neighbourhood scale, the same number of FES were also considered for all algorithms. A higher number of FES with additional runs could also result in an increase in the number of conducted Pareto-front solutions. Since the purpose of the multi-objective formulation was to present the potentials of the developed model, this investigation remains limited. Additionally, the HypE and NSGA-II algorithms, and variants of the SPEA-2 algorithm presented non-dominated results in an acceptable amount of time, whereas the MACO, NSPSO, RBFMopt, and MOEA/D algorithms could not provide promising results and required an expensive computational budget. Moreover, stepwise jEDE results indicated that results of the multi-objective optimisation algorithms could be dominated in 24 solutions out of 30. This highlights a gap in the development of multi-objective optimisation algorithms, which are capable of coping with high-dimensional constrained design problems in the architecture domain. Using predictive models, 577500 FES are completed during the optimisation processes in 3 weeks. This task would take more than 19 years if simulation-based optimisation was considered for the same number of FES. This reminds us once again of the importance of selecting convenient optimisation methods during the conceptual phase of the design process.
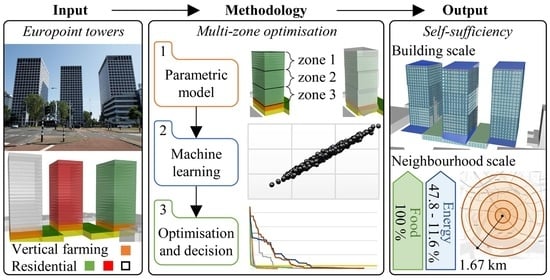
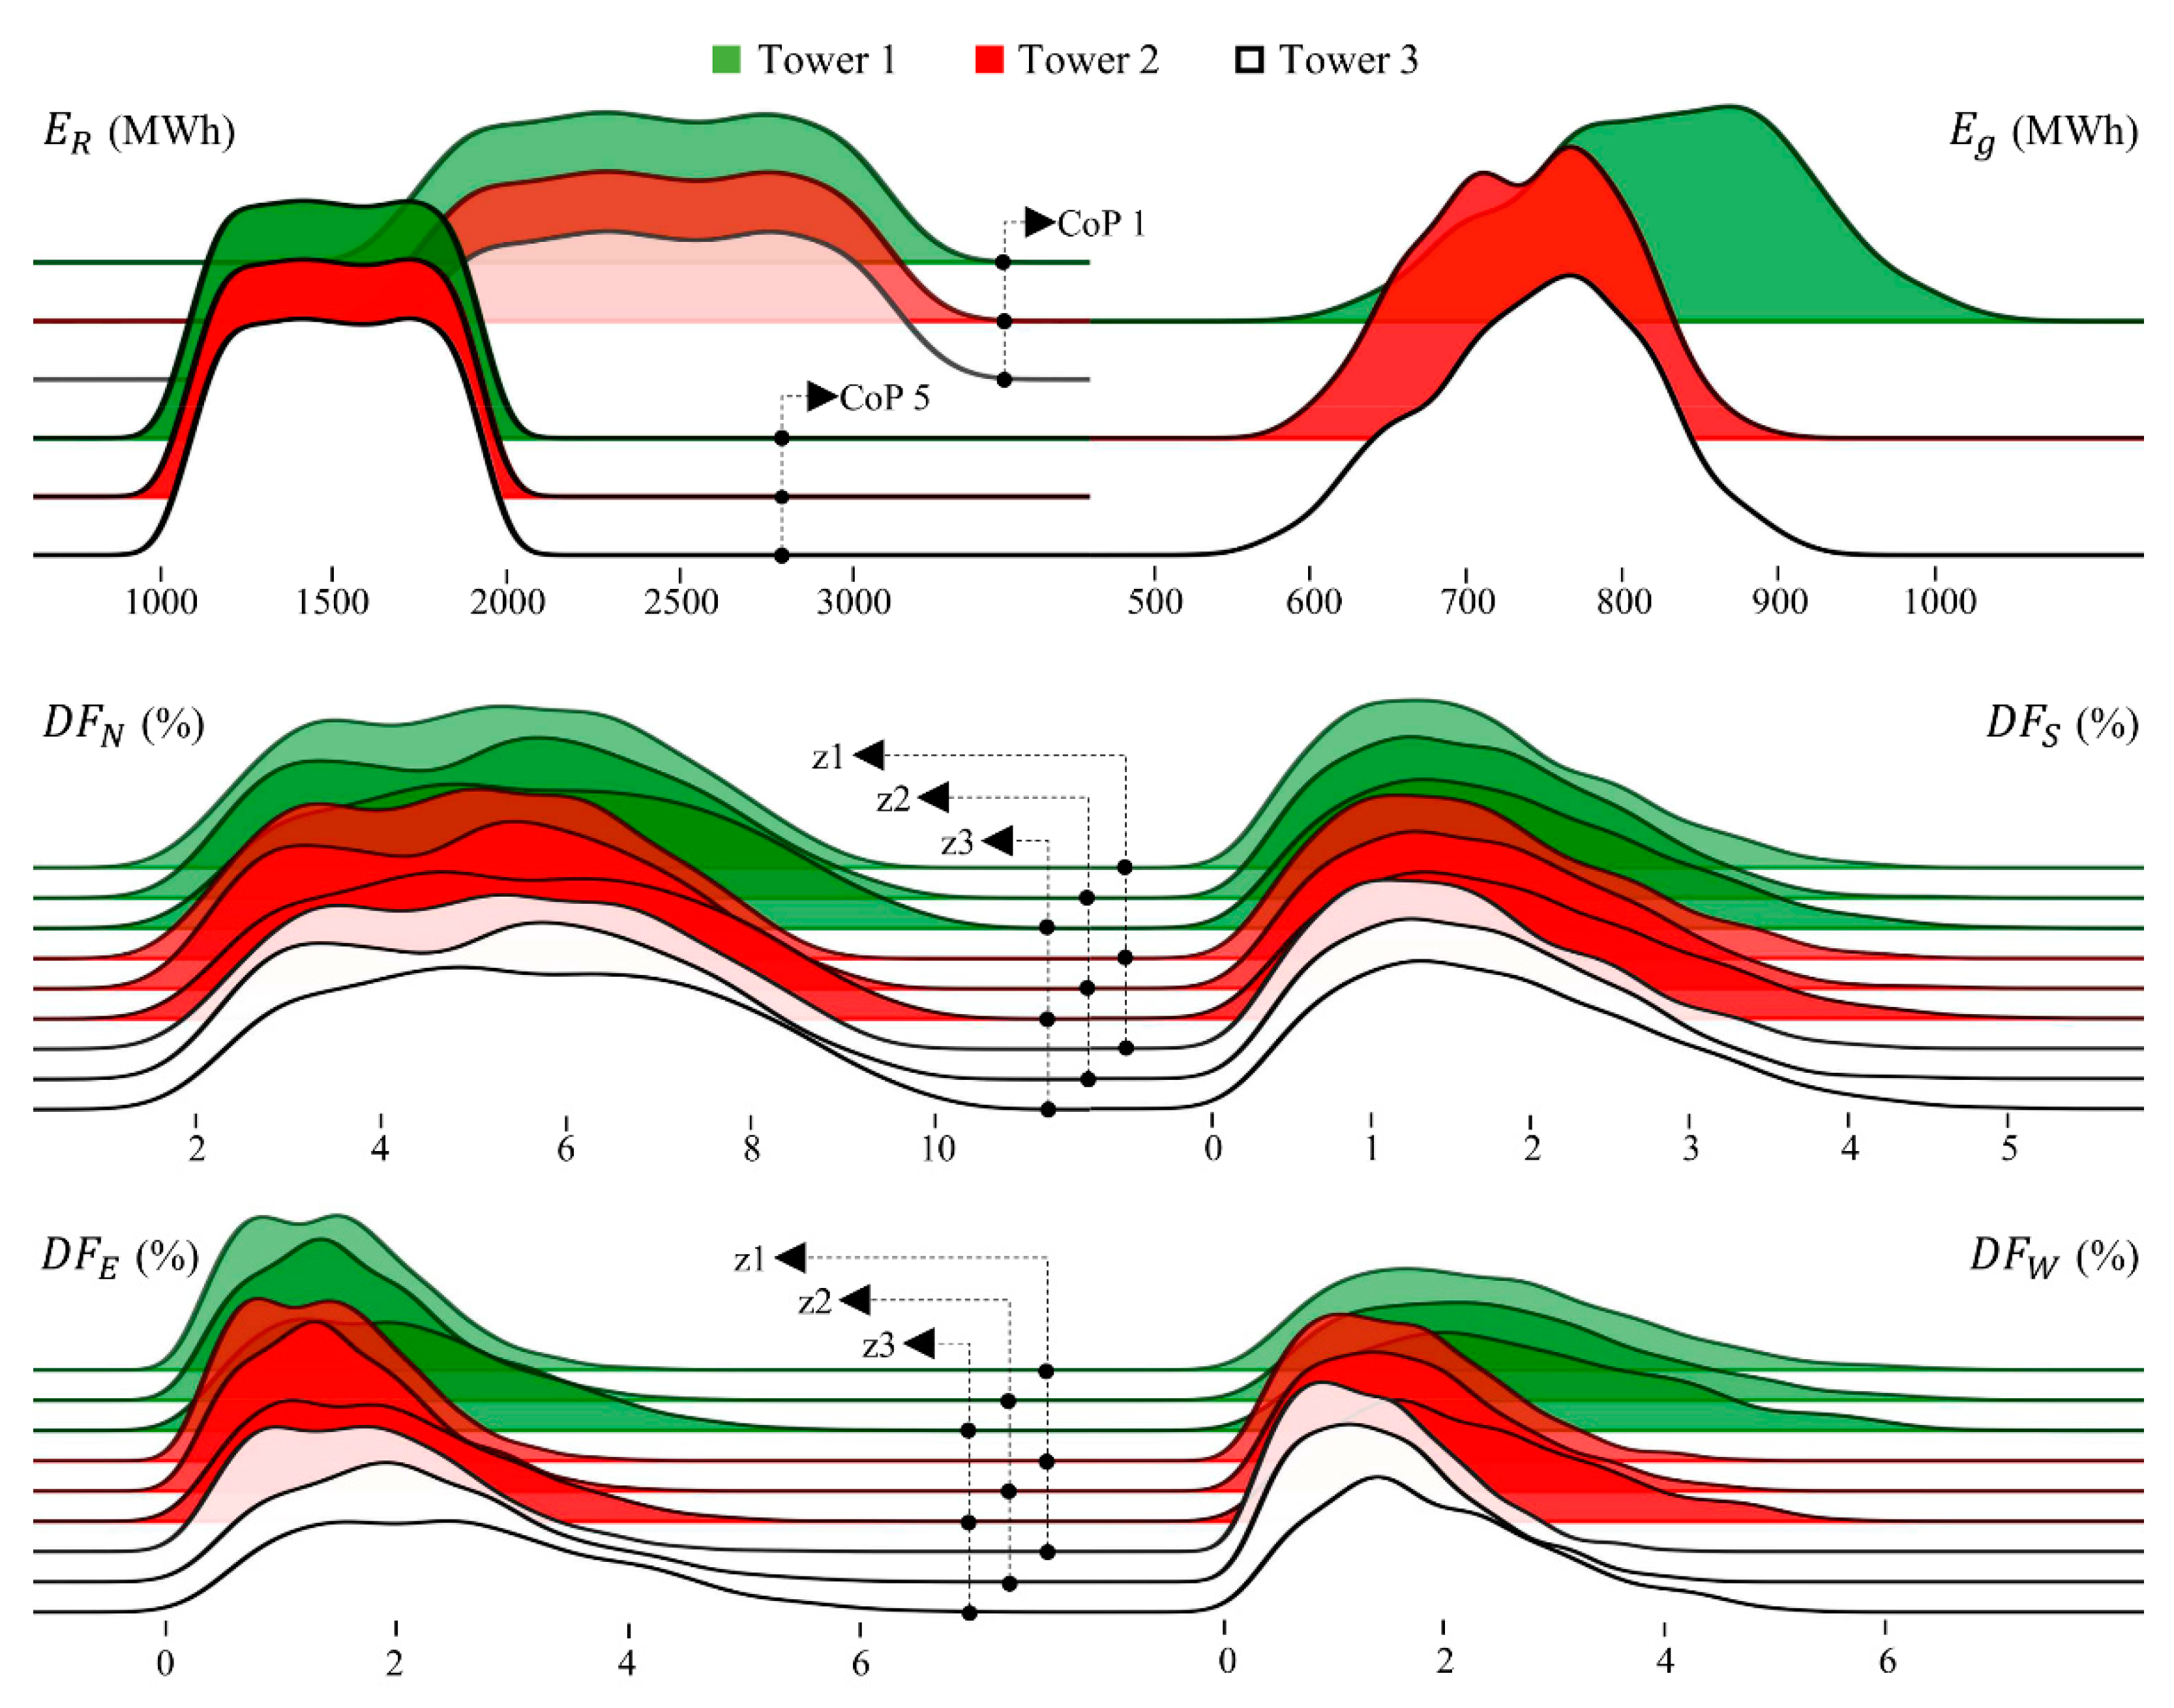
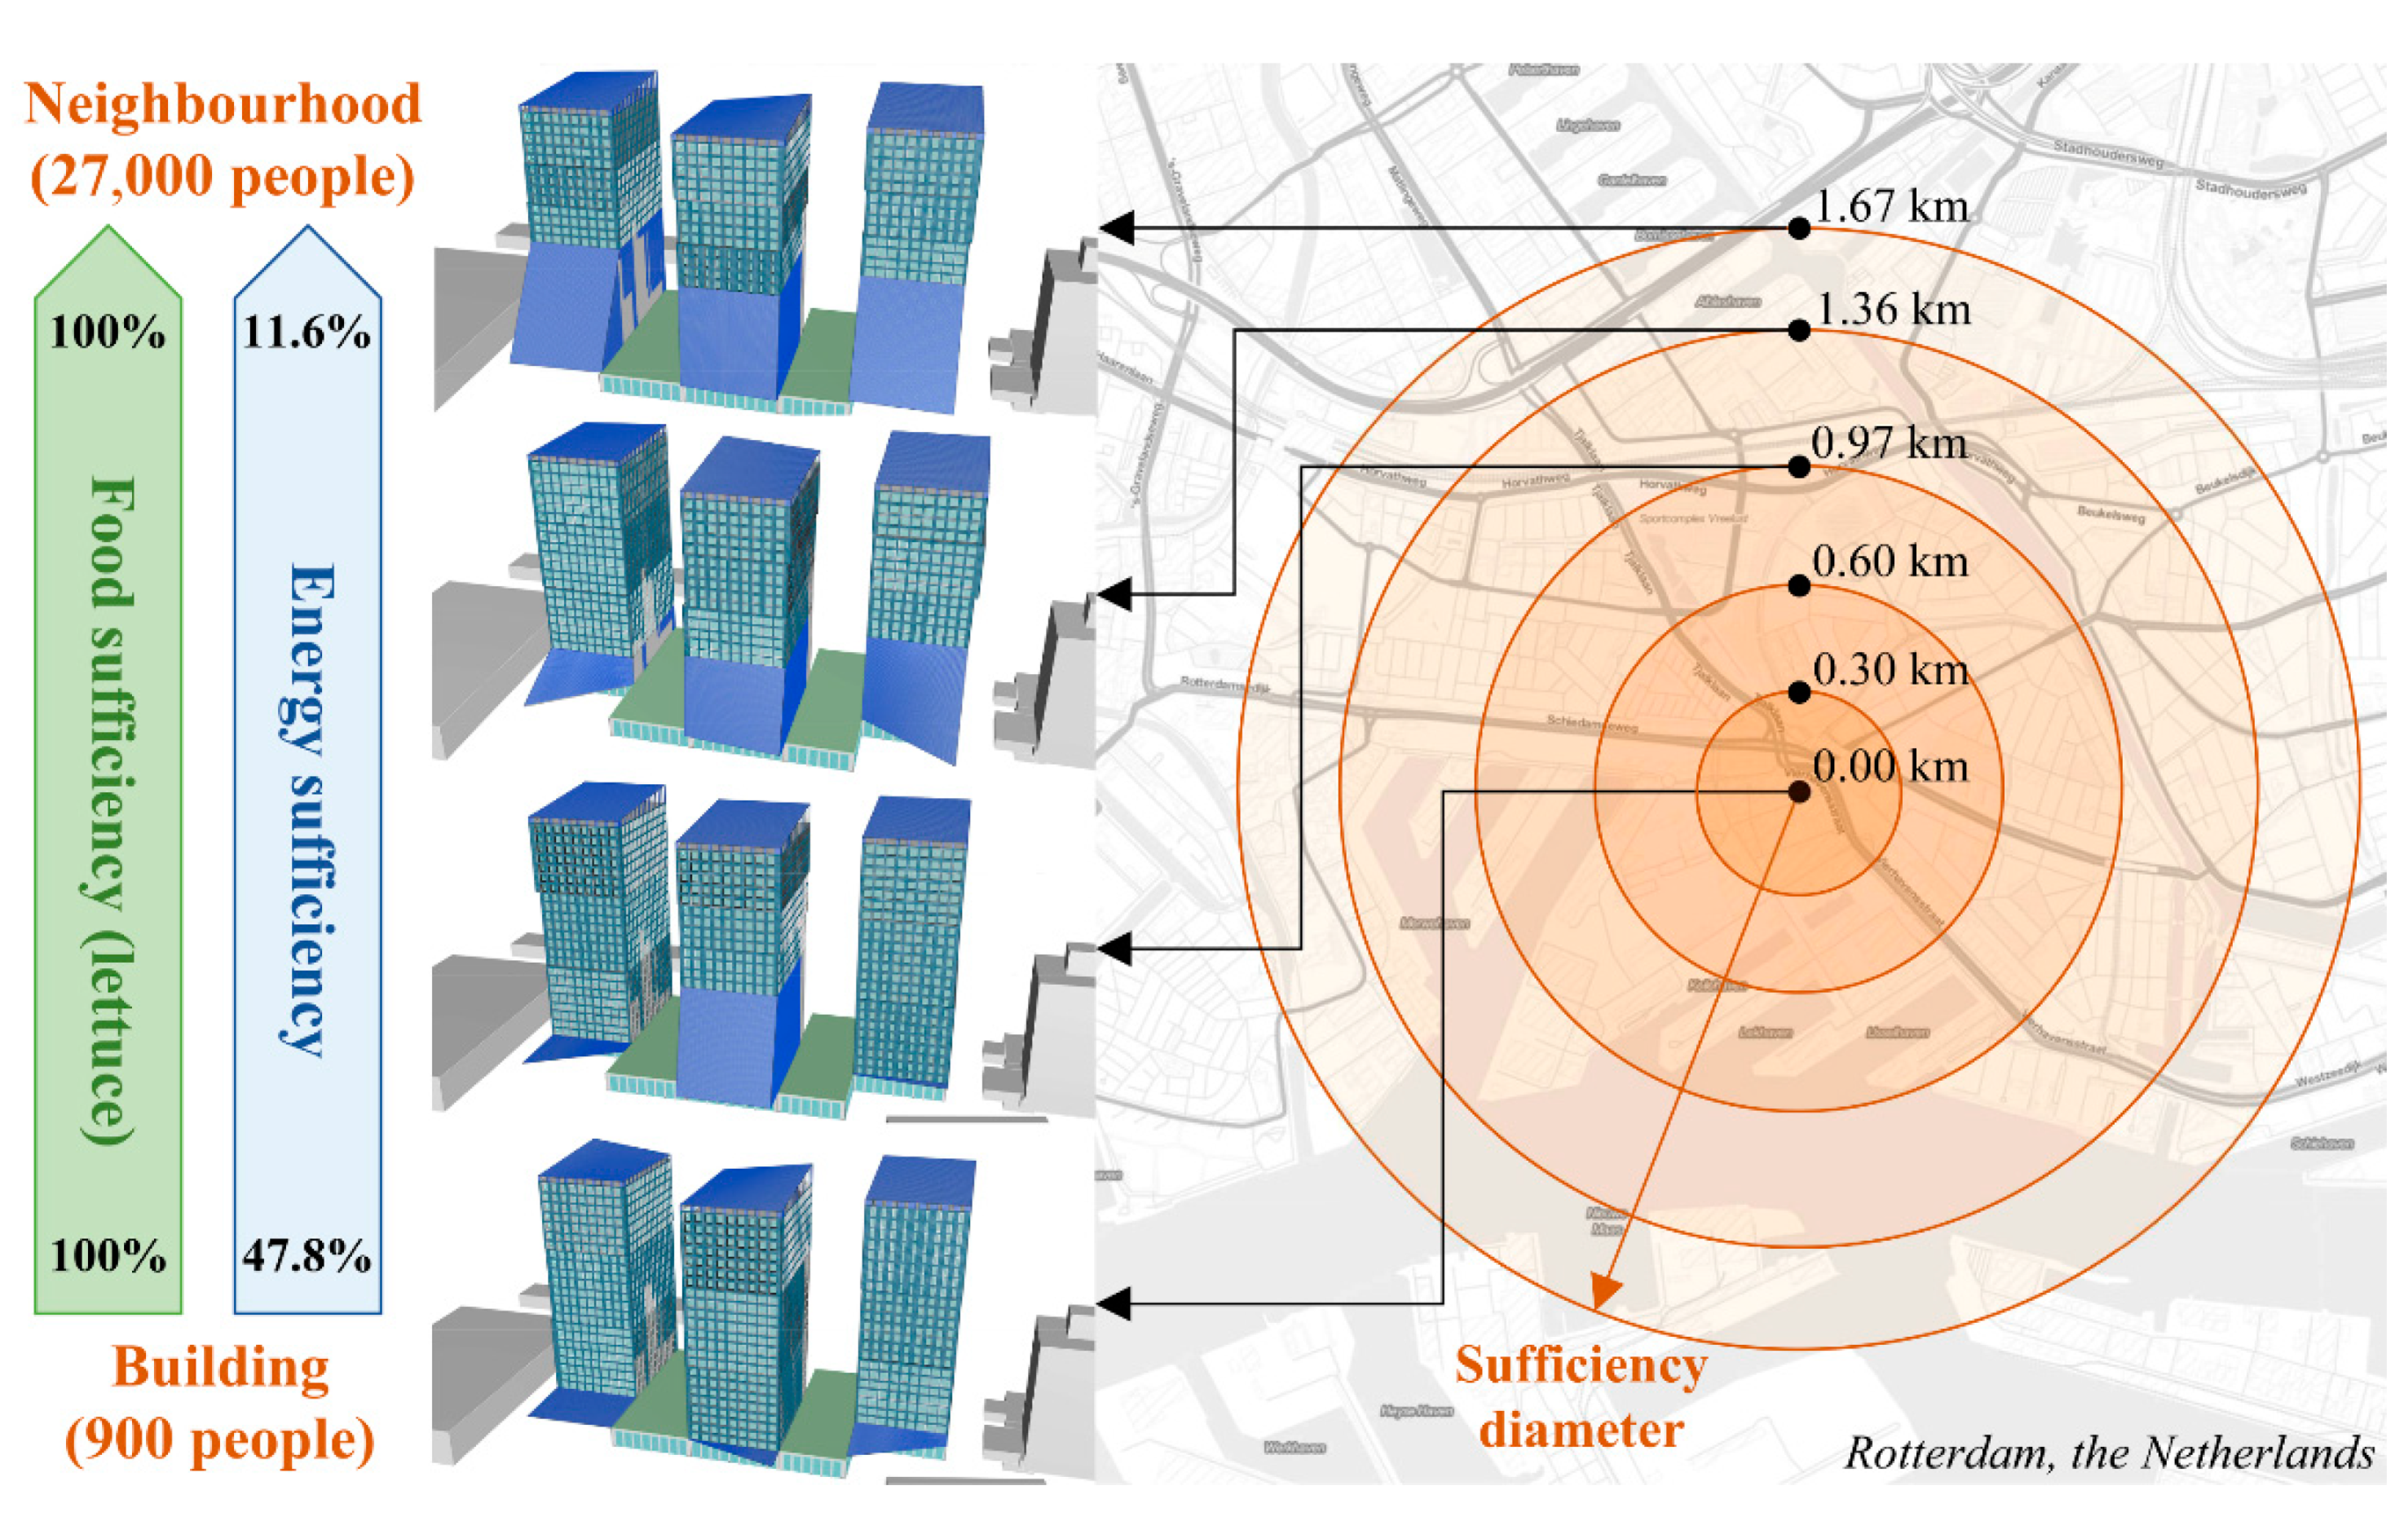
  • Self-sufficiency in energy and food: Considering the assumption concerning lettuce consumption, that 1800 people live in the three towers of Europoint complex, the E t o t of the optimised design at the building scale was reported as 3072.8 MWh y−1 (for CoP 5) while E R , E F , and E g were 4206.3 MWh y−1, 1258.6 MWh y−1, 2392.1 MWh y−1, respectively. Despite the detailed parameter investigations of glazing types, window sizes, the shapes of the BIPV surfaces, and the shading devices used for each orientation in each tower, 43.7% sufficiency could be reached in terms of electricity usage at the building scale. Moreover, the required energy consumption for self-sufficiency at the neighbourhood scale reached up to 19,639.6 MWh y−1 because of the providing of lettuce crops for 27,000 people using 30 floors for vertical farming. Considering that one floor of farming requires 629.3 MWh y−1, 96.1% of the energy demand was from food production for providing 1000 tons of lettuce for the 27,000 people. Although the energy demand of the vertical farming was decreased when fewer farming floors were considered in the entire complex, more than 10 times the energy use intensity was required when compared to the residential floors. Even though the benefits of closed farming systems for food production in the centre of the city with low CO2 emissions, high energy consumption remains one of the big challenges. This highlights the necessity of integral designs that use the potential solar and wind power of the building environment, as well as the importance of combining vertical farming with urban farming on roof-tops and in unused parts of the city to achieve self-sufficiency with lower energy consumption at the neighbourhood scale.
  • MUZO methodology for self-sufficient high-rise buildings in future cities: The MUZO methodology was utilised to conduct the self-sufficient design alternatives for energy consumption and food production (demonstrating sufficiency for lettuce crops) focusing on the Europoint complex in Rotterdam. Various advantages of considering this methodology were observed (e.g., coping with complex simulation models for sampling, investigation ability of the best prediction accuracy for multiple performance aspects, and the extensive investigation of the search space that leads to comprehensive decision-making in the design process because of employing multiple optimisation algorithms with replications). When compared to typical scenarios using the same parameter sets for the entire high-rise design, the energy consumption discovered by the MUZO methodology was improved by 21%. For self-sufficiency in food production, results suggested various floor selections on which to place the closed farming system, considering the total energy consumption as well as the total energy generation. Because of efficient agricultural production in closed farming systems, residents of the Europoint complex and habitants in the neighbourhood (up to 27,000) people could exploit the lettuce production in the Europoint complex. Self-sufficiency of lettuce crops for food production was demonstrated in this study. The variety in agricultural products could be increased by considering different simulation parameters to provide necessary indoor conditions for different crops using the same computational model. However, self-sufficiency in energy was not as achievable as food production. The results indicated that 100% self-sufficiency in energy could not be achieved at the building scale using existing BIPV technology. Therefore, combined systems for BIPV, battery, wind [27], and combined heat and power systems can be considered to improve the self-sufficiency at the building scale. Moreover, considering the potential of other buildings in the surrounding area (e.g., using their roofs for PV panels) appears to be a vital approach for future cities. The involvement of the surrounding buildings in addition to the buildings under study increases the complexity of the design problem. Considering the MUZO methodology can be a feasible approach, as it was able to present promising results for the three high-rise buildings in this paper.

4. Conclusions

This paper presents the results of an optimisation investigation of high-rise buildings for self-sufficiency in terms of energy consumption and food production for lettuce crops using AI techniques. The utilisation of MUZO for the Europoint complex located in Rotterdam managed the sampling process for 9000 design alternatives, and the development of 45 ANN models, which considered grid searches for five hyperparameters in the first two phases of the methodology. The final phase focused on optimisation of the three towers by employing the developed surrogate models with 117 decision variables, using 13 optimisation algorithms with single-objective and multi-objective problem formulations, which were subject to 37 and 36 constraints for the building and neighbourhood scales. The results showed that 100% self-sufficiency in food production for lettuce crops, and 43.7% self-sufficiency in energy consumption can be reached at the building scale, including 1800 residents. At the neighbourhood scale, sufficient lettuce production can be provided for up to 27,000 people living in a radius of 1.67 km by decreasing self-sufficiency in energy up to 11.6%. The relevance of the MUZO methodology is also shown by its discovery of self-sufficient high-rise alternatives at the building scale with an improvement of 21% in the considered performance aspects when compared to typical design scenarios. Self-sufficiency scores achieved at the building and neighbourhood scales highlight the necessity of integrating the potentials of the surrounding buildings in addition to the high-rise buildings in question. Hence, self-sufficient cities can be achieved by developing self-sufficient neighbourhoods.
  • Limitations of the study: The importance of this study for future cities is presented in the digital (virtual) environment by the obtained ML scores, optimisation results, and the validation of the utilised MUZO methodology. Validation between the results obtained from the digital environment and the monitored data from the indoor environment of the real applications is one of the limitations of this study. Regarding the HVAC system, the default setup of the HB and LB plugins is considered during the energy simulations. A detailed HVAC setup (e.g., condenser or VRF loops) may improve the optimisation results using other plug-ins of LB tools. Additionally, only lettuce crops are integrated into the closed farming system, as they are one of the most well-documented agricultural products for vertical farming. Nevertheless, the developed computational model has the potential to consider other agricultural products by changing the parameters of the energy model to provide the necessary indoor conditions for the growing process of other plants. Although plant factories use water resources effectively when compared to traditional farming, self-sufficiency in water may require additional design and operational parameters to be considered in the optimisation process. Finally, the urban heat island impact of the proposals, which may be the primary focus of future works, is not taken into consideration.
  • Future works: Higher self-sufficiency scores at the neighbourhood scale may require the use of random forests [79] and convolutional neural networks [80] for detecting the potential of roof spaces for PV panels. Considering self-sufficiency in different time frames (i.e., monthly, or weekly) can provide an overview of the sufficiency performance in different weather conditions. Since the climate region has an inevitable impact on self-sufficiency aspects, hypothetical models developed for various climate zones may guide the necessary actions to be taken while transforming our cities for a sustainable future. In this respect, providing a potential reduction in CO2 emissions, in addition to energy consumption and food production, may help policymakers to develop self-sufficient, carbon-neutral, energy-positive lives in metropolises. Energy models can also consider different set points as variables, and various occupancy scenarios to decrease consumption. The impact of creating separate farming buildings instead of considering farming and residential levels in a single building may also provide a better operation in different scenarios. Integrating daylight simulation into the energy model may also decrease the total energy demand, with an additional computation budget owing to the hourly illuminance data. In addition to daylight, optimising the view of the residential spaces can be an added value that may increase the demand for self-sufficient high-rise buildings owing to the promising city view. Using the same model, the diversity of the agricultural products can be increased to include leafy greens, vine crops, and tomatoes [7], in addition to integrating other self-sufficiency aspects (e.g., harvesting water, or adding ducted openings for wind energy [81]). Involving parameters of the façade design of the closed farming systems [23], and semi-transparent PV panels can reduce the energy demand while increasing the complexity of the optimisation problem. At the neighbourhood scale, different types of food production systems can find a place in various locations that allows for the provision of a large amount of various crops. Hence, the potential of the neighbourhood scale can be involved in providing vital food products to achieve self-sufficient cities in the future. Finally, economical aspects considering the fundamentals of the circular built environment may present an additional long-term strategy for decreasing the life-cycle cost and CO2 emissions of future cities.

Supplementary Materials

The following are available online at https://www.mdpi.com/article/10.3390/en15020660/s1, Weights and biases of the best ANN models selected after grid search to be used in optimisation process.

Author Contributions

Conceptualisation, B.E., O.F.S.F.T., M.T., I.S.S. and M.F.T.; methodology, B.E., O.F.S.F.T., M.T., I.S.S. and M.F.T.; software, B.E., I.S.S. and M.F.T.; validation, B.E., O.F.S.F.T., M.T., I.S.S. and M.F.T.; formal analysis, B.E.; investigation, B.E.; resources, B.E., O.F.S.F.T. and M.T.; data curation, B.E.; writing—original draft preparation, B.E.; writing—review and editing, B.E., O.F.S.F.T., M.T., I.S.S. and M.F.T.; visualisation, B.E.; supervision, M.T., I.S.S. and M.F.T.; project administration, I.S.S. All authors have read and agreed to the published version of the manuscript.

Funding

This research received no external funding.

Data Availability Statement

Datasets related to this article can be found at https://doi.org/10.4121/17129420.v1, an open-source online data repository hosted at 4TU Research Data [76] (accessed on: 19 December 2021).

Acknowledgments

We thank Hans Hoogenboom (Lecturer in the Chair of Design Informatics) and Aytaç Balcı (Coordinator @Hok Student ICT Support) for their support while conducting the simulation, and gathering the machine learning, and optimisation results at TU Delft, Faculty of Architecture and the Built Environment. We also thank Cemre Çubukçuoğlu (PhD candidate in the Chair of Design Informatics) for the collaborative work while developing the optimisation plug-in called OPTIMUS for the Grasshopper 3D algorithmic modelling environment. Finally, we thank the MOR team (http://mor.tudelft.nl/, accessed on 7 January 2022) for providing the materials of the Europoint complex proposal prepared for the Solar Decathlon competition in 2019.

Conflicts of Interest

The authors declare no conflict of interest.

Abbreviations

Statistics
MAEMean absolute error
MSEMean squared error
R2R-square
StdStandard deviation
Machine learning
AIArtificial intelligence
ANNArtificial neural networks
CVCross-validation
FNNFeedforward neural network
MLMachine learning
Optimisation
CMA-ESCovariance matrix adaptation with evolution strategy
CPUComputation time
DVDecision variable
FESFunction evaluations
GAGenetic algorithm
HypEHypervolume-based many-objective optimisation
jEDESelf-adaptive differential evolution with the ensemble of mutation strategies
MACOMulti-objective ant colony optimisation
MOEA/DMulti-objective evolutionary algorithm based on decomposition
NSGA-IINon-dominated sorting genetic algorithm II
NSPSONon-dominated sorting particle swarm optimisation
P&SPopulation and swarm
PSOParticle swarm optimisation
RBFoptRadial basis function optimisation
RBFMoptMulti-objective radial basis function optimisation
SPEA-2Strength Pareto evolutionary algorithm 2
HGPSPSOHybrid generalised pattern search particle swarm optimisation
NFLNo free lunch
NFTNear feasibility threshold
Performance assessment
BIPVBuilding-integrated photovoltaic
DFDaylight factor [%]
E c Cooling consumption [MWh]
E e q Equipment consumption [MWh]
E F Farming energy consumption [MWh]
E g Energy generation [MWh]
E h Heating consumption [MWh]
E L Lighting consumption [MWh]
E R Residential energy consumption [MWh]
E t o t Total energy consumption [MWh]
F p Food production [ton]
g&sGermination and seeding
GHGrasshopper 3d–Algorithmic modelling environment
g-val.Solar transmittance of the materials used in simulation models
PVPhotovoltaic
TvisVisible transmittance of the materials used in simulation models
U-val.Thermal transmittance of the materials used in simulation models [W/m2 K]

References

  1. Ali, M.M.; Al-Kodmany, K. Tall Buildings and Urban Habitat of the 21st Century: A Global Perspective. Buildings 2012, 2, 384–423. [Google Scholar] [CrossRef] [Green Version]
  2. Godoy-Shimizu, D.; Steadman, P.; Hamilton, I.; Donn, M.; Evans, S.; Moreno, G.; Shayesteh, H. Energy use and height in office buildings. Build. Res. Inf. 2018, 46, 845–863. [Google Scholar] [CrossRef] [Green Version]
  3. Benke, K.; Tomkins, B. Future food-production systems: Vertical farming and controlled-environment agriculture. Sustain. Sci. Pract. Policy 2017, 13, 13–26. [Google Scholar] [CrossRef] [Green Version]
  4. Food and Agriculture Organization of the United Nations (FAO). Database on Arable Land 2016. Available online: http://data.worldbank.org/indicator/AG.LND.ARBL.HA.PC?end%20&hx003D;2013&hx0026;start%20&hx003D;1961&hx0026;view&hx003D;chart (accessed on 10 November 2021).
  5. Graamans, L.; Baeza, E.; van den Dobbelsteen, A.; Tsafaras, I.; Stanghellini, C. Plant factories versus greenhouses: Comparison of resource use efficiency. Agric. Syst. 2018, 160, 31–43. [Google Scholar] [CrossRef]
  6. Kozai, T.; Ohyama, K.; Chun, C. Commercialized closed systems with artificial lighting for plant production. In Proceedings of the V International Symposium on Artificial Lighting in Horticulture 711, Lillehammer, Norway, 30 June 2006. [Google Scholar]
  7. Zeidler, C.; Schubert, D.; Vrakking, V. Vertical Farm 2.0: Designing an Economically Feasible Vertical Farm-A combined Eu-ropean Endeavor for Sustainable Urban Agriculture. Assoc. Vert. Farming 2017. Available online: https://elib.dlr.de/116034/ (accessed on 4 October 2021).
  8. Imam, M.; Kolarevic, B. Towards Resource-Generative Skyscrapers. Int. J. High.-Rise Build. 2018, 7, 161–170. [Google Scholar]
  9. Voss, K.; Musall, E.; Lichtmeß, M. From Low-Energy to Net Zero-Energy Buildings: Status and Perspectives. J. Green Build. 2011, 6, 46–57. [Google Scholar] [CrossRef]
  10. Vale, B.; Vale, R. The New Autonomous House: Design and Planning for Sustainability; Thames & Hudson: London, UK, 2000. [Google Scholar]
  11. Evins, R. A review of computational optimisation methods applied to sustainable building design. Renew. Sustain. Energy Rev. 2013, 22, 230–245. [Google Scholar] [CrossRef]
  12. Samuelson, H.; Claussnitzer, S.; Goyal, A.; Chen, Y.; Romo-Castillo, A. Parametric energy simulation in early design: High-rise residential buildings in urban contexts. Build. Environ. 2016, 101, 19–31. [Google Scholar] [CrossRef] [Green Version]
  13. Ekici, B.; Kazanasmaz, Z.T.; Turrin, M.; Taşgetiren, M.F.; Sariyildiz, I.S. Multi-zone optimisation of high-rise buildings using artificial intelligence for sustainable metropolises. Part 1: Background, methodology, setup, and machine learning results. Sol. Energy 2021, 224, 373–389. [Google Scholar] [CrossRef]
  14. Ekici, B.; Kazanasmaz, Z.T.; Turrin, M.; Taşgetiren, M.F.; Sariyildiz, I.S. Multi-zone optimisation of high-rise buildings using artificial intelligence for sustainable metropolises. Part 2: Optimisation problems, algorithms, results, and method validation. Sol. Energy 2021, 224, 309–326. [Google Scholar] [CrossRef]
  15. Gan, V.J.; Wong, H.; Tse, K.T.; Cheng, J.C.; Lo, I.M.; Chan, C.M. Simulation-based evolutionary optimization for ener-gy-efficient layout plan design of high-rise residential buildings. J. Clean. Prod. 2019, 231, 1375–1388. [Google Scholar] [CrossRef]
  16. Li, Y.; Li, X. Natural ventilation potential of high-rise residential buildings in northern China using coupling thermal and airflow simulations. Build. Simul. 2014, 8, 51–64. [Google Scholar] [CrossRef]
  17. Raji, B.; Tenpierik, M.J.; Dobbelsteen, A.V.D. An assessment of energy-saving solutions for the envelope design of high-rise buildings in temperate climates: A case study in the Netherlands. Energy Build. 2016, 124, 210–221. [Google Scholar] [CrossRef]
  18. Jayaweera, N.; Rajapaksha, U.; Manthilake, I. A parametric approach to optimize solar access for energy efficiency in high-rise residential buildings in dense urban tropics. Sol. Energy 2021, 220, 187–203. [Google Scholar] [CrossRef]
  19. Wang, M.; Hou, J.; Hu, Z.; He, W.; Yu, H. Optimisation of the double skin facade in hot and humid climates through altering the design parameter combinations. In Building Simulation; Springer: Berlin/Helideberg, Germany, 2021; pp. 511–521. [Google Scholar]
  20. Chen, X.; Huang, J.; Zhang, W.; Yang, H. Exploring the optimization potential of thermal and power performance for a low-energy high-rise building. Energy Procedia 2019, 158, 2469–2474. [Google Scholar] [CrossRef]
  21. Chen, X.; Yang, H. A multi-stage optimization of passively designed high-rise residential buildings in multiple building oper-ation scenarios. Appl. Energy 2017, 206, 541–557. [Google Scholar] [CrossRef]
  22. Chen, X.; Yang, H. Integrated energy performance optimization of a passively designed high-rise residential building in dif-ferent climatic zones of China. Appl. Energy 2018, 215, 145–158. [Google Scholar] [CrossRef]
  23. Graamans, L.; Tenpierik, M.; van den Dobbelsteen, A.; Stanghellini, C. Plant factories: Reducing energy demand at high in-ternal heat loads through facade design. Appl. Energy 2020, 262, 114544. [Google Scholar] [CrossRef]
  24. Chen, X.; Yang, H.; Peng, J. Energy optimization of high-rise commercial buildings integrated with photovoltaic facades in urban context. Energy 2019, 172, 1–17. [Google Scholar] [CrossRef]
  25. Chen, X.; Huang, J.; Yang, H.; Peng, J. Approaching low-energy high-rise building by integrating passive architectural design with photovoltaic application. J. Clean. Prod. 2019, 220, 313–330. [Google Scholar] [CrossRef]
  26. Giouri, E.D.; Tenpierik, M.; Turrin, M. Zero energy potential of a high-rise office building in a Mediterranean climate: Using multi-objective optimization to understand the impact of design decisions towards zero-energy high-rise buildings. Energy Build. 2019, 209, 109666. [Google Scholar] [CrossRef]
  27. Liu, J.; Wang, M.; Peng, J.; Chen, X.; Cao, S.; Yang, H. Techno-economic design optimization of hybrid renewable energy applications for high-rise residential buildings. Energy Convers. Manag. 2020, 213, 112868. [Google Scholar] [CrossRef]
  28. Wolpert, D.H.; Macready, W.G. No free lunch theorems for optimization. IEEE Trans. Evol. Comput. 1997, 1, 67–82. [Google Scholar] [CrossRef] [Green Version]
  29. Wood, A. Sustainability: A new high-rise vernacular? Struct. Des. Tall Spec. Build. 2007, 16, 401–410. [Google Scholar] [CrossRef]
  30. Coit, D.W.; Smith, A.E. Penalty guided genetic search for reliability design optimization. Comput. Ind. Eng. 1996, 30, 895–904. [Google Scholar] [CrossRef]
  31. Smith, A.E.; Coit, D.W.; Baeck, T.; Fogel, D.; Michalewicz, Z. Penalty functions. Handb. Evol. Comput. 1997, 97, C5. [Google Scholar]
  32. Ekici, B.; Cubukcuoglu, C.; Turrin, M.; Sariyildiz, I.S. Performative computational architecture using swarm and evolutionary optimisation: A review. Build. Environ. 2019, 147, 356–371. [Google Scholar] [CrossRef]
  33. Cubukcuoglu, C.; Ekici, B.; Tasgetiren, M.F.; Sariyildiz, S. OPTIMUS: Self-Adaptive Differential Evolution with Ensemble of Mutation Strategies for Grasshopper Algorithmic Modeling. Algorithms 2019, 12, 141. [Google Scholar] [CrossRef] [Green Version]
  34. Cichocka, J.M.; Migalska, A.; Browne, W.N.; Rodriguez, E. SILVEREYE–the implementation of Particle Swarm Optimization algorithm in a design optimization tool. In Proceedings of the International Conference on Computer-Aided Architectural Design Futures, Istanbul Technical University, Istanbul, Turkey, 12–14 July 2017; Springer: Singapore, 2017; pp. 151–169. [Google Scholar] [CrossRef]
  35. Rutten, D. Galapagos: On the Logic and Limitations of Generic Solvers. Arch. Des. 2013, 83, 132–135. [Google Scholar] [CrossRef]
  36. Wortmann, T. Opossum-introducing and evaluating a model-based optimization tool for grasshopper. In Proceedings of the 22nd CAADRIA Conference, Xi’an Jiaotong-Liverpool University, Suzhou, China, 5–8 April 2017; pp. 283–292. [Google Scholar]
  37. Kennedy, J.; Eberhart, R. Particle swarm optimization. In Proceedings of the ICNN’95-International Conference on Neural Networks, Perth, WA, Australia, 27 November–1 December 1995; IEEE: Piscataway, NJ, USA, 1995; pp. 1942–1948. [Google Scholar]
  38. Goldberg, D.E. Genetic Algorithms; Pearson Education India: Delhi, NCR, Noida, 2006. [Google Scholar]
  39. Hansen, N. The CMA evolution strategy: A comparing review. Towards New Evol. Comput. 2006, 192, 75–102. [Google Scholar]
  40. Costa, A.; Nannicini, G. RBFOpt: An open-source library for black-box optimization with costly function evaluations. Math. Program. Comput. 2018, 10, 597–629. [Google Scholar] [CrossRef]
  41. Makki, M.; Showkatbakhsh, M.; Tabony, A.; Weinstock, M. Evolutionary algorithms for generating urban morphology: Vari-ations and multiple objectives. Int. J. Archit. Comput. 2019, 17, 5–35. [Google Scholar]
  42. Vierlinger, R.; Hofmann, A. A Framework for Flexible Search and Optimization in Parametric Design. In Proceedings of the Rethinking Prototyping-Proceedings of the Design Modelling Symposium, University of the Arts, Berlin, Germany, 28 September–2 October 2013. [Google Scholar]
  43. Deb, K.; Pratap, A.; Agarwal, S.; Meyarivan, T. A fast and elitist multiobjective genetic algorithm: NSGA-II. IEEE Trans. Evol. Comput. 2002, 6, 182–197. [Google Scholar] [CrossRef] [Green Version]
  44. Bader, J.; Zitzler, E. HypE: An algorithm for fast hypervolume-based many-objective optimization. Evol. Comput. 2011, 19, 45–76. [Google Scholar] [CrossRef]
  45. Zitzler, E.; Laumanns, M.; Thiele, L. SPEA2: Improving the Strength Pareto Evolutionary Algorithm; TIK-Report; Eidgenössische Technische Hochschule Zürich (ETH), Institut für Technische Informatik und Kommunikationsnetze (TIK): Zürich, Switzerland, 2001; Volume 103. [Google Scholar] [CrossRef]
  46. Wortmann, T.; Natanian, J. Multi-Objective Optimization for Zero-Energy Urban Design in China: A Benchmark. Proc. Sim AUD 2020, 203–210. [Google Scholar]
  47. Li, X. A Non-dominated Sorting Particle Swarm Optimizer for Multiobjective Optimization. In Proceedings of the Genetic and Evolutionary Computation Conference, Chicago, IL, USA, July 12–16 2003; Springer: Berlin/Heidelberg, Germany; pp. 37–48. [Google Scholar] [CrossRef]
  48. Gao, Y.; Guan, H.; Qi, Z.; Hou, Y.; Liu, L. A multi-objective ant colony system algorithm for virtual machine placement in cloud computing. J. Comput. Syst. Sci. 2013, 79, 1230–1242. [Google Scholar] [CrossRef]
  49. Zhang, Q.; Li, H. MOEA/D: A Multiobjective Evolutionary Algorithm Based on Decomposition. IEEE Trans. Evol. Comput. 2007, 11, 712–731. [Google Scholar] [CrossRef]
  50. MOR, Solar Decathlon Team of TU Delft. Available online: https://mor.tudelft.nl/ (accessed on 18 December 2021).
  51. Solar Decathlon Europe. Available online: https://solardecathlon.eu/ (accessed on 18 December 2021).
  52. The European Parliament and the Council of the European Union. Amending Directive 2010/31/EU on the energy performance of buildings. Off. J. Eur. Union L 2018, L153, 13–35.
  53. McNeel, R. Rhinoceros. NURBS Modleing for Windows. Available online: http://www.rhino3d.com/ (accessed on 15 June 2021).
  54. Rutten, D.; McNeel, R. Grasshopper3D; Robert McNeel & Associates: Seattle, WA, USA, 2007. [Google Scholar]
  55. Roudsari, M.S.; Pak, M.; Smith, A. Ladybug: A parametric environmental plugin for grasshopper to help designers create an envi-ronmentally-conscious design. In Proceedings of the 13th International IBPSA Conference, Lyon, France, 26–28 August 2013; pp. 3128–3135. [Google Scholar]
  56. Ward, G.J. The RADIANCE lighting simulation and rendering system. In Proceedings of the 21st Annual Conference on Computer Graphics and Interactive Techniques, Orlando, FL, USA, 24–29 July 1994; Association for Computing Machinery: New York, NY, USA; 1994; pp. 459–472. [Google Scholar]
  57. Hammad, A.W.; Nezhad, A.A.; Grzybowska, H.; Wu, P.; Wang, X. Mathematical optimisation of location and design of windows by considering energy performance, lighting and privacy of buildings. Smart Sustain. Built Environ. 2019, 8, 117–137. [Google Scholar] [CrossRef]
  58. Wang, S.; Yi, Y.K.; Liu, N. Multi-objective optimization (MOO) for high-rise residential buildings’ layout centered on daylight, visual, and outdoor thermal metrics in China. Build. Environ. 2021, 205, 108263. [Google Scholar] [CrossRef]
  59. Kirimtat, A.; Krejcar, O.; Ekici, B.; Tasgetiren, M.F. Multi-objective energy and daylight optimization of amorphous shading devices in buildings. Sol. Energy 2019, 185, 100–111. [Google Scholar] [CrossRef]
  60. Ekici, B.; Kazanasmaz, T.; Turrin, M.; Tasgetiren, M.F.; Sariyildiz, I.S. A Methodology for daylight optimisation of high-rise buildings in the dense urban district using overhang length and glazing type variables with surrogate modelling. J. Physics Conf. Ser. 2019, 1343, 012133. [Google Scholar] [CrossRef]
  61. Sepúlveda, A.; De Luca, F.; Thalfeldt, M.; Kurnitski, J. Analyzing the fulfillment of daylight and overheating requirements in residential and office buildings in Estonia. Build. Environ. 2020, 180, 107036. [Google Scholar] [CrossRef]
  62. Yi, Y.K. Building facade multi-objective optimization for daylight and aesthetical perception. Build. Environ. 2019, 156, 178–190. [Google Scholar] [CrossRef]
  63. Lee, J.; Boubekri, M.; Liang, F. Impact of Building Design Parameters on Daylighting Metrics Using an Analysis, Prediction, and Optimization Approach Based on Statistical Learning Technique. Sustainability 2019, 11, 1474. [Google Scholar] [CrossRef] [Green Version]
  64. Epwmap—Ladybug Tools. Available online: https://www.ladybug.tools/epwmap/ (accessed on 10 June 2021).
  65. Loh, W.-L. On Latin hypercube sampling. Ann. Stat. 1996, 24, 2058–2080. [Google Scholar] [CrossRef]
  66. Roman, N.D.; Bre, F.; Fachinotti, V.D.; Lamberts, R. Application and characterization of metamodels based on artificial neural networks for building performance simulation: A systematic review. Energy Build. 2020, 217, 109972. [Google Scholar] [CrossRef]
  67. Chatzikonstantinou, I.; Sariyildiz, S. Approximation of simulation-derived visual comfort indicators in office spaces: A com-parative study in machine learning. Archit. Sci. Rev. 2016, 59, 307–322. [Google Scholar] [CrossRef]
  68. Bottou, L. Large-Scale Machine Learning with Stochastic Gradient Descent. In Proceedings of the 19th International Conference on Computational Statistics, Paris, France, 22–27 August 2010; Springer: Berlin/Heildeberge, Germany; pp. 177–186. [Google Scholar] [CrossRef] [Green Version]
  69. Srivastava, N.; Hinton, G.; Krizhevsky, A.; Sutskever, I.; Salakhutdinov, R. Dropout: A simple way to prevent neural networks from overfitting. J. Mach. Learn. Res. 2014, 15, 1929–1958. [Google Scholar]
  70. Van Rossum, G.; Drake, F. Python 3 Reference Manual; CreateSpace: Scotts Valley, CA, USA, 2009. [Google Scholar]
  71. McKinney, W. Data structures for statistical computing in python. In Proceedings of the 9th Python in Science Conference, Austin, TX, USA, 28 June–3 July 2010; pp. 51–56. [Google Scholar]
  72. Chollet, F. Keras. Available online: https://keras.io/ (accessed on 5 October 2021).
  73. Abadi, M.; Barham, P.; Chen, J.; Chen, Z.; Davis, A.; Dean, J.; Devin, M.; Ghemawat, S.; Irving, G.; Isard, M. Tensorflow: A system for large-scale machine learning. In Proceedings of the 12th {USENIX} Symposium on Operating Systems Design and Implementation ({OSDI} 16), Savannah, GA, USA, 2–4 November 2016; USENIX Association: Berkeley, CA, USA, 2016; pp. 265–283. [Google Scholar]
  74. Pedregosa, F.; Varoquaux, G.; Gramfort, A.; Michel, V.; Thirion, B.; Grisel, O.; Blondel, M.; Prettenhofer, P.; Weiss, R.; Dubourg, V. Scikit-learn: Machine learning in Python. J. Mach. Learn. Res. 2011, 12, 2825–2830. [Google Scholar]
  75. Taccari, L. Joyplots. Available online: https://github.com/sbebo/joypy/blob/master/Joyplot.ipynb (accessed on 10 September 2021).
  76. Ekici, B.; Turkcan, O.F.S.F.; Turrin, M.; Sariyildiz, I.S.; Tasgetiren, M.F. Multi-Zone Simulation Results of Europoint Complex for Self-Sufficiency in Energy Consumption and Food Production in Rotterdam. Available online: https://data.4tu.nl/articles/dataset/Multi-zone_simulation_results_of_Europoint_complex_for_self-sufficiency_in_energy_consumption_and_food_production_in_Rotterdam/17129420 (accessed on 19 December 2021).
  77. World Population Review. Available online: https://worldpopulationreview.com/world-cities/rotterdam-population (accessed on 12 November 2021).
  78. Stamen Maps. Available online: http://maps.stamen.com/#toner/12/37.7706/-122.3782 (accessed on 1 December 2021).
  79. Walch, A.; Castello, R.; Mohajeri, N.; Scartezzini, J.-L. Big data mining for the estimation of hourly rooftop photovoltaic po-tential and its uncertainty. Appl. Energy 2020, 262, 114404. [Google Scholar] [CrossRef]
  80. House, D.; Lech, M.; Stolar, M. Using Deep Learning to Identify Potential Roof Spaces for Solar Panels. In Proceedings of the 2018 12th International Conference on Signal Processing and Communication Systems (ICSPCS), Cairns, Australia, 17–19 December 2018; IEEE: Piscataway, NJ, USA, 2018; pp. 1–6. [Google Scholar]
  81. Ruiz, C.A.; Kalkman, I.; Blocken, B. Aerodynamic design optimization of ducted openings through high-rise buildings for wind energy harvesting. Build. Environ. 2021, 202, 108028. [Google Scholar] [CrossRef]
Figure 1. Utilisation of MUZO methodology for the self-sufficient Europoint complex.
Energies 15 00660 g001
Figure 2. Europoint complex in Rotterdam, the Netherlands.
Energies 15 00660 g002
Figure 3. Proposed building program.
Energies 15 00660 g003
Figure 4. Proposed façade design and building zones (subdivisions).
Energies 15 00660 g004
Figure 5. Thermal zones of energy model in residential and farming floors.
Energies 15 00660 g005
Figure 6. Schedules used in residential energy model.
Energies 15 00660 g006
Figure 7. BIPV allocation of Europoint complex.
Energies 15 00660 g007
Figure 8. Simulation result of DF for one design alternative in one floor level.
Energies 15 00660 g008
Figure 9. Monthly temperature comparisons between DB and HB.
Energies 15 00660 g009
Figure 10. Weekly temperature comparisons between DB and HB.
Energies 15 00660 g010
Figure 11. Weekly (W) temperatures of the farming system.
Energies 15 00660 g011
Figure 12. Distributions of collected samples.
Energies 15 00660 g012
Figure 13. Grid search results of the best ANN models.
Energies 15 00660 g013
Figure 14. MAE, MSE, and R2 results of training and test sets.
Energies 15 00660 g014
Figure 15. Simulated results versus predicted results.
Energies 15 00660 g015
Figure 16. Boxplots of the feasible solutions.
Energies 15 00660 g016
Figure 17. Convergence of the algorithms in time to complete 7500 FES.
Energies 15 00660 g017
Figure 18. Average air temperatures of the optimised Europoint complex.
Energies 15 00660 g018
Figure 19. MUZO design versus 7776 typical scenarios.
Energies 15 00660 g019
Figure 20. Parameters of MUZO design and the best typical scenario.
Energies 15 00660 g020
Figure 21. Illustration of the optimised design for self-sufficiency at the building scale.
Energies 15 00660 g021
Figure 22. Search space and optimisation results of jEDE for stepwise run.
Energies 15 00660 g022
Figure 23. Search space and optimisation results of multi-objective algorithms.
Energies 15 00660 g023
Figure 24. Self-sufficiency potential of Europoint complex for neighbourhood scale.
Energies 15 00660 g024
Figure 25. Sufficiency diameter of Europoint complex in Rotterdam, the Netherlands.
Energies 15 00660 g025
Table 1. Overview of previous works.
StudyLocationAspectsBuilding SufficiencyNeighbourhood
Sufficiency
SystemOptimisation Method(s)DV Size
This paperRotterdamFood
Energy
100% for 1800 people
43.7%
100% up to 27,000 people
Between 47.8–11.6%
Stacked lettuce
BIPV
given in Table 2117
[24]Hong KongEnergyup to 48.77%-BIPVHGPSPSO11
[25]Hong KongEnergyup to 71.36%-BIPVHGPSPSO
NSGA-II
11
[26]AthensEnergy33%-BIPVNSGA-II8
[27]Hong KongEnergy16.02%
53.65%
69.26%
81.29%
-
-
-
-
BIPV
BIPV-wind
BIPV-wind-battery
Optimum BIPV-wind-battery
-
-
NSGA-II
NSGA-II
-
-
1
2
Table 2. Overview of the optimisation algorithms used in this study.
ScaleObjectiveConstraintsPlug-InsAlgorithms
Building Minimise   E t o t F P
36   D F
Optimus (v1.0.2) [33]
Silvereye (v1.1.0) [34]
Galapagos (Rhino 6) [35]
Opossum (v2.2.4) [36]
jEDE [33]
PSO [37]
GA [38]
CMA-ES [39]
RBFopt [40]
Neighbourhood Minimise   E t o t
Maximise   F P
36   D F Optimus (v1.0.2) [33]
Wallacei (v2.65) [41]
Octopus (v0.4) [42]

Opossum (v2.2.4) [36]


jEDE (stepwise) [33]
NSGA-II [43]
HypE [44]
SPEA-2 (Alt Pm/Pm) [45]
RBFMopt [40,46]
NSPSO [47],
MACO [48]
MOEA/D [49]
Table 3. Decision variables and glazing properties.
ParametersExplanationTower #Zone #LocationTypeUnitBoundary
123123
x 1 Number of farming floors🗸🗸🗸--Discrete-[0, 10]
x 2 ,   x 3 Extrusion of farming BIPV🗸 --Discretem[0, 25]
x 2 ,   x 3 🗸 --Discretem[0, 10]
x 2 ,   x 3 🗸--Discretem[0, 20]
x 4 ,   x 5 Extrusion of roof BIPV🗸🗸🗸--Discretem[0, 5]
x 6 , , x 9 Glazing type🗸🗸🗸🗸🗸🗸N-S-E-WDiscrete-[1, 13]
x 10 , , x 12 Shading reflectance🗸🗸🗸🗸 S-E-WDiscrete-[0.3, 0.6, 0.9]
x 20 , , x 22 🗸🗸🗸 🗸 S-E-WDiscrete-[0.3, 0.6, 0.9]
x 30 , , x 32 🗸🗸🗸 🗸S-E-WDiscrete-[0.3, 0.6, 0.9]
x 13 , , x 15 Shading distance🗸🗸🗸🗸 S-E-WDiscretem[0.25, 1.50]
x 23 , , x 25 🗸🗸🗸 🗸 S-E-WDiscretem[0.25, 1.50]
x 33 , , x 35 🗸🗸🗸 🗸S-E-WDiscretem[0.25, 1.50]
x 16 , , x 19 Window reduction size🗸🗸🗸🗸 N-S-E-WContinuousm[0.0, 1.0]
x 26 , , x 29 🗸🗸🗸 🗸 N-S-E-WContinuousm[0.0, 1.0]
x 36 , , x 39 🗸🗸🗸 🗸N-S-E-WContinuousm[0.0, 1.0]
Glazing TypesConfigurationArgonAirKryptonTypeTvisg-val.U-val.
14–16–4🗸 Double0.80.752.6
24–12–4 🗸 Double0.790.551.6
34–16–4 🗸 Double0.790.551.3
44–16–4🗸 Double0.710.441.1
55–15–12🗸 Double0.780.631.1
65–10–4 🗸 Double0.70.490.8
74–12–4–12–4 🗸Triple0.70.60.7
89–10–4–10–13 🗸Triple0.640.350.5
94–16–4–16–4🗸 Triple0.690.480.6
104–12–4–12–4 🗸 Triple0.630.390.9
116–12–5–12–12 🗸Triple0.620.420.4
126–12–4–12–8 🗸Triple0.720.510.7
134–15–4–15–4🗸 Triple0.70.740.6
Table 4. Inputs of the energy models.
TypeSimulation
Parameter
UnitValidation
(Simulation)
Sampling (Simulation)Residential ModelFarming Model
LoadsEquipmentW/m2Residential: 5.5Residential: 5.5🗸
Core: 2.5Core: 2.5/2.0🗸🗸
-Farming: 0 🗸
-g&s: 0 🗸
LightingResidential: 1.5Residential: 1.5🗸
Core: 7.5Core: 7.5🗸🗸
-Farming: 100 🗸
-g&s: 0/1.5 🗸
Mech. Vent.l/s-m20.90.9🗸🗸
Natural vent.-OffOn🗸
Air-tightnessac/h0.10.1🗸
-1.0 🗸
Peopleppl/m2Residential: 0.04Residential: 0.04🗸
Core: 0.08Core: 0.08🗸🗸
-Farming: 0 🗸
-g&s: 0.02 🗸
Set pointsHeating°C20/1820/18🗸
-24 🗸
Cooling--🗸
-30 🗸
Ventilation-21/24🗸
Humidity%Residential: 10/90Residential: 10/90🗸
-Farming: 75/85 🗸
DaylightlxCore: 300Core: 300🗸
Residential: 250Residential: 250🗸
HVACTemplate-Ideal air loadsIdeal air loads🗸🗸
Economiser-NoneDifferential Dry Bulb🗸🗸
Heat recovery-OffOff🗸🗸
CoP-1.01.0/5.0🗸🗸
ConstructionFloor-AdiabaticAdiabatic🗸🗸
typeCeiling-AdiabaticAdiabatic🗸🗸
Exterior wall-GenericMetallic cladding/60 mm,🗸🗸
wood framing/180 mm,
cast concrete/560 mm
Interior wall-GenericCast concrete/300 mm🗸🗸
Glazing-#7 in Table 3All types in Table 3🗸
ConstructionFloorW/m2 K0.15380.22🗸🗸
U-val.Ceiling0.15380.22🗸🗸
Exterior wall0.15380.1538🗸🗸
Interior wall0.15380.40🗸🗸
Glazing#7 in Table 3All types in Table 3🗸
Table 5. Parameters of BIPV simulation.
LocationPV TypePV EfficiencyCoverageInverter Efficiency
Farming/roof façadeOpaque monocrystalline PV cells20%85%90%
Rooftop20%85%90%
Residential façadeColorblast monocrystalline PV cells14%85%90%
Table 6. Radiance parameters and material properties of the daylight simulations.
StudyAmbient
Accuracy (-aa)
Ambient
Bounces (-ab)
Ambient
Division (-ad)
Ambient
Resolution (-ar)
Ambient
Super-Samples (-as)
This paper0.14100030020
[59]0.152100030020
[60]0.152512256128
[61]0.15150030020
[62]0.152512256128
[63]0.152512256128
CategoryTypeReflectance
or Tvis
Tower #
1 2 3
Zone #
1 2 3
Exterior wallConcrete0.4🗸🗸🗸🗸🗸🗸
Interior wallPainted white wall0.7🗸🗸🗸🗸🗸🗸
CeilingPainted white ceiling0.7🗸🗸🗸🗸🗸🗸
FloorWood0.4🗸🗸🗸🗸🗸🗸
Shading deviceWhite/grey/dark (see Table 3)(see Table 3)🗸🗸🗸🗸🗸🗸
Glazing(see Table 3)(see Table 3)🗸🗸🗸🗸🗸🗸
Surrounding (city)Concrete blocks0.3🗸🗸🗸🗸🗸🗸
Surrounding (towers)-0.5🗸🗸🗸🗸🗸🗸
Ground-0.2🗸🗸🗸🗸🗸🗸
Table 7. Python libraries and grid search setup.
Python LibrariesGrid Search Setup
LibraryExplanationHyperparametersValues
Pandas [71]Data analysis libraryBatch size[25, 50, 75]
Keras [72]Deep learning libraryEpochs[250, 500, 750]
TensorFlow [73]Open-source ML platformNeuron size[50, 100, 150]
Scikit-learn [74]ML libraryLearning rate[0.01, 0.05, 0.1]
Joypy [75]Plot libraryMomentum[0.3, 0.6, 0.9]
Table 8. Overview of the optimisation results for 5 replications at the building scale.
Algorithm v ( x )   =   0 Min   E t o t Max   E t o t Avg   E t o t Std
jEDE (Pop size: 50)5 out of 53072.83240.83163.561.1
jEDE (Pop size: 100)5 out of 53182.53403.23296.171.0
CMA-ES5 out of 53217.93404.03338.666.9
RBFOpt2 out of 55165.174,456.941,559.029,261.3
GA (Pop size: 50)5 out of 53934.14241.44134.6109.3
GA (Pop size: 100)5 out of 54011.84401.54253.1129.7
PSO (Swarm size: 50)1 out of 53384.642,463.429,392.713,939.7
PSO (Swarm size: 100)1 out of 53330.341,652.123,312.714,979.3
Table 9. Parameter values used to generate typical scenarios.
Tower #Number of
Farming Floors
Extrusion of
Farming BIPV
Extrusion of Roof BIPVGlazing TypeShading
Reflectance
Shading DistanceWindow Reduction Size
1[0, 1, 2][0, 12, 24][0, 3, 5][1, 4, 8, 12][0.3, 0.6, 0.9][0.25, 0.75, 1.50][0.0, 0.3, 0.6, 0.9]
2[0, 5, 10]
3[0, 10, 20]
Table 10. Overview of the optimisation results for 1 replication at the neighbourhood scale.
AlgorithmNumber of Non-Dominated Solutions in v ( x ) = 0 Number of Non-Dominated Solutions Outperformed Other AlgorithmsCPU
jEDE (stepwise)30 out of 3024 out of 30 1   d   21   h   14   m   ( for   30   F p )
NSGA-II20 out of 300 out of 301 h 58 m (for 1 run)
HypE20 out of 306 out of 301 h 41 m (for 1 run)
SPEA-2 (Alt Pm)30 out of 300 out of 302 h 36 m (for 1 run)
SPEA-2 (Pm)28 out of 300 out of 302 h 36 m (for 1 run)
MACO0 out of 300 out of 305 h 34 m (for 1 run)
NSPSO5 out of 300 out of 305 h 35 m (for 1 run)
RBFMopt0 out of 300 out of 302 d 10 h 10 m (for 1 run)
MOEA/D0 out of 300 out of 305 h 32 m (for 1 run)
Publisher’s Note: MDPI stays neutral with regard to jurisdictional claims in published maps and institutional affiliations.

