Article

Alternative Fuel Generation from Dangerous Solid Waste in a Protected Environmental Area

1
Department of Geological and Mining Engineering, Universidad Politécnica de Madrid, ETSI Minas y Energía, c/ Ríos Rosas 21, 28003 Madrid, Spain
2
Department of the Environment and Land Use Planning, Regional Government of Madrid, c/ Alcalá 16, 28014 Madrid, Spain
3
GVC Valorización, c/ Tecnología 2, 28096 Madrid, Spain
*
Author to whom correspondence should be addressed.
Energies 2022, 15(2), 659; https://doi.org/10.3390/en15020659
Submission received: 17 November 2021 / Revised: 3 January 2022 / Accepted: 12 January 2022 / Published: 17 January 2022

Abstract

:
The present investigation project aims to evaluate the extraction of contaminant material from two settling ponds to be used as alternative fuel in two cement plants. The extraction is carried out through mechanical means, and after that extraction, two options are compared: energy recovery and incineration. Through energy recovery, a potentially contaminated area is decontaminated and its waste is used; its high calorific value makes this option a viable one. The waste extraction is carried out through mechanical means due to the high density and viscosity of the waste. Because of these characteristics, the waste undergoes an on-site security adaptation to stabilize it, reduce declivity risk and make it suitable to be handled and moved. The second treatment is carried out in external installations where the final product is obtained (alternative fuel), which is to be used at industrial kilns. The entire described process shows a difference on the consumed energy of 6060.42 kWh/twaste between the two options under study: waste incineration and energy recovery. In addition, it also reduces CO2 emissions on 2.178 tCO2/twaste.

1. Introduction

In today’s world, the current environmental crisis is gaining increasing attention and has been expressed in terms of complex problems such as global warming, the degradation of ecosystems, the extinction of species or the contamination of environments [1]. This is why every discipline is developing environmental approaches and every science feels obligated to define its ecological dimension [2].
The concept Circular Economy (CE) became popular since its introduction from policy makers in China and the European Union as a solution that will allow countries, companies and consumers to reduce the damage to the environment and close the product life cycle [3]. The linear model originated during the industrial revolution of the 17th century with exploitative scientific and technological innovations that ignored the limits of the environment and the long-term damage they were causing to society [4]. The concept of “end of life” is replaced with recycling and recovery, incorporating the use of renewable energy and the removal toxic chemicals (which prevents reuse), and it aims at the transformation of waste through superior design of materials and products, as well as associated new business models [5]. Thus, CE is the manifestation of a paradigm shift and will require changes in the way society legislates, produces and consumes innovations while using nature as an inspiration to respond to social and environmental needs [6].
Up to 90% of our planet’s energy needs are met by the use of fossil fuels, which will become extinct in the near future and are highly polluting and used inefficiently [7]. The high cost of fossil fuels, the concern about their depletion, the environmental protection (mainly the greenhouse effect) and the energy dependence of countries with scarce conventional energy resources are driving the development of clean energies [8]. A current problem is that the accumulation of waste without proper management can lead to air, water and soil pollution, as well as public health problems [9]. However, in the context of lubricating oils, by using a technology similar to that applied to crude oil (through a process called regeneration), it is possible to recover the hydrocarbons contained in the used oil with a quality similar to the original one [10]. Furthermore, due to its high calorific value, it is one of the wastes with the greatest potential to be used as fuel in domestic, industrial and low-power commercial boilers [11]. Both characteristics give used oil an economic value that has led to the development of a relevant market. Recycling lubricating oils into feedstock or fuel oil can be a suitable option to protect the environment from hazardous waste [12].
The energy recovery of wastes produced by the different industrial process is starting to become a reality is Spain as a better solution to landfills, only after recycling and reuse [13]. Cement plants have proved to be a suitable and controlled environment for the recycling and energy recovery of a large amount of solid and liquid waste [14]. Most of the research reported in the literature on waste pyrolysis has focused on solid waste from different sources [15], including tires [16] and plastic waste [17]. In general, it is required that the waste is prepared by authorised managers so that it is homogeneous and has physical and chemical characteristics that facilitate treatment in cement plants, thus providing “safe” alternative fuels that do not cause unwanted combustion inside the kiln [18]. In the cement-manufacturing process, these wastes can be used as partial substitutes for conventional fuels and as crude raw materials [19].
The current transport behaviour is leading to increasing infrastructure congestion, growing dependence on fossil fuels, rising energy demand and increasing CO2 [20]. The advantages of energy recovery include lower CO2 emissions by replacing “precious” and non-renewable fossil fuels [21] and using instead waste that would be destined for landfill or incineration. The United Nations Framework Convention on Climate Change aims to stabilize greenhouse gas concentrations in the atmosphere to prevent dangerous anthropogenic interferences with the climate system [22]. Understanding the drivers of CO2 emissions is therefore essential to formulating climate change mitigation policies and meeting applicable targets [23], in order to achieve a 50–60% reduction in industrialised countries’ emissions from current levels by mid-century, as some governments have proposed, which would bring their economies closer to the current global per capita average [24].
The following research work aims to decontaminate a protected environmental area that has a major pollution problem; in addition, the pollutant is used as an alternative fuel. With all this, it is also possible to replace fossil fuels in an industry such as the cement industry with a high polluting potential. This is the first time that an area with these characteristics has been decontaminated in Spain.

2. Materials and Methods

2.1. Settling Ponds Description

The settling ponds are located in the nature site Boca Alta, inside a protected environmental area (Parque Regional del Sureste), inside the administrative territory of Arganda del Rey, in Madrid. They were caused by mining activities below the ground-water table and by discharge of petroleum sulphonate from the regeneration of waste oils until the end of the 1980s. In the area under study, there are two settling ponds: the Laguna Principal (main settling pond), with an area of 12,750 m2 and a volume of 50,000 m3 of petroleum sulphonate oil, and the Laguna Sureste (South-east settling pond), with an area of approximately 1989 m2 and volume of 10,200 m3 of solid petroleum sulphonate (Figure 1).
Geologically, the Parque Regional del Sureste is characterized by the presence of two fundamental lithological domains: the Neogene tertiary and the Quaternary [25]. The geological location of the settling pond is the Vega Baja del Jarama, characterized by the development of a large number of stream terraces, associated with Quaternary climatic oscillations, isostatic uplift tectonics and block adjustments, and lithological-structural controls [26]. The main lithology of these terraces is formed by gravel bars and/or sand with limited sand fraction [27], besides alterations in the conglomerate, silt and clay.
The ponds are located within the Parque Regional del Sureste, which is a protected natural area of the European Natura 2000 Network. For this reason, in 2008, the government of the Community of Madrid purchased the plot of land where the ponds are located in order to undertake their environmental restoration. The work to extract and recover the hazardous waste has been underway since 2014 with funding from the Community of Madrid and is expected to be completed in 2022.

2.2. Characterization of the Waste

The contaminant material of the settling ponds is fluid and semisolid petroleum sulphonate that it is estimated to come from highly viscous tar. To properly assess the semisolid material of the Laguna Sureste (LSE), trial pits have been made, and the following results have been obtained:
  • It is a material with an absence of stratification and without differences, but it does have punctual intercalations of calcareous filler of 20 to 50 cm in strength.
  • The contaminant material is black and solid, and it occasionally looks like plastic. Additionally, when in repose, its state is semisolid.
  • In 8 out of the 15 trial pits made, it was possible to reach the base of the settling pond, obtaining irregular depth and impermeable materials, such as gravel and sand, from those trial pits.
The material of the Laguna Sureste is similar in composition to the fluid main layer (Layer C), already extracted from the Laguna Principal, which will be described next [28]. The material of the Laguna Sureste is more solid, and it has higher viscosity, higher quantity of volatile compounds, higher acidity, lower pH and higher sulphur content (Figure 2). These characteristics make this pollutant harmful to the environment; it is therefore dangerous waste. The material to be extracted from the Laguna Principal is Layer D.
  • Layer C: this layer has the highest volume of the Laguna Principal, mainly formed by oily petroleum sulphonates, highly viscous and black. Its thickness varies depending on the topography of the settling pond, so it is not constant, reaching a depth of 6 m. Its density, fluidity and viscosity vary depending on the depth: the deeper it is, the more viscous the material becomes.
  • Layer D: this layer is denser and deeper than Layer C. It is black and is formed by heavy hydrocarbon that makes it possible to carry out extraction pumping at ambient temperature. It is highly viscous, even though it is also slightly fluid. The density varies, with an average density of 0.5 m. The origin of the material is the thermal de-asphalting carried out to recover oils.
  • Silt Layer: This is a deeper layer that occupies the bottom and part of the talus. It is formed by silt and sandy silts that make the layer impermeable and act as a containment for heavy hydrocarbons, PAHs and metals, followed by sands and gravels.
All the semisolid material of the Laguna Principal and the Laguna Sureste will be extracted through mechanical methods, that is to say, backhoe, through the 2020–2022 period. The high sulphur content of the material causes strong sulphur fumes and backhoe mining makes it a safe extraction. Table 1 shows the characteristics of the contaminant material from Layer D and the Sureste Ponds.
Furthermore, 15% of the remaining Layer C will be extracted through pump, with a total of 6468 tonnes that were left unextracted during the first phase of the project, even though this material will not be under study for only the solid material will be quantified. The pumpable material has already been studied and quantified in [28].

2.3. Alternative for the Use of Waste

Once the material is extracted, two alternatives for this solid waste are compared: the incineration of the material if it is unused, and the generation of fuel from the contaminant material to later be used in the cement industry. Of all the “terminal” treatment technologies, properly designed incineration systems are capable of achieving the highest degree of destruction and control for the widest range of hazardous waste streams [29]. This alternative consists in a small treatment after the material extraction and its transport to the incinerator to be burnt.
The first alternative (incineration of the waste at the same time that the cement is produced in the two industries by using traditional fossil fuels) will be the base case used to compare the second alternative (fuel generation from the contaminant material, which will substitute the traditional fossil fuel in the two cement industries), so the energies of each alternative and the CO2 emissions avoided by carrying out the second alternative instead of the first alternative will be compared. The second alternative will distribute the derived fuel of the settling pond waste to two cement companies: Carboneras and Oural. This alternative has the following phases: first, the material extraction; second, its on-site treatment so it can be transported; third, the transportation to the plant that will generate the fuel; four, transportation and cement industry use.

2.4. Waste Treatment

The material of the settling ponds will be subjected to two treatments: an initial on-site security adaptation and a second treatment in two management plants outside the site where the settling ponds are located. The first treatment will be carried out after the material extraction, and it is necessary to adapt its characteristics and to transport it safely. The physio-chemical characteristics to be changed are the following:
  • Highly contaminated and acidic water.
  • Semisolid viscosity through all of the settling pond.
  • Highly corrosive material with a very low pH.
  • Organic and inorganic vapour emissions.
Due to these characteristics, the material must be conditioned and suitable in a mixing plant in which the pH is raised to neutral or alkaline, the aqueous phase is minimized, gaseous fumes are eliminated and the material is a non-viscous solid.
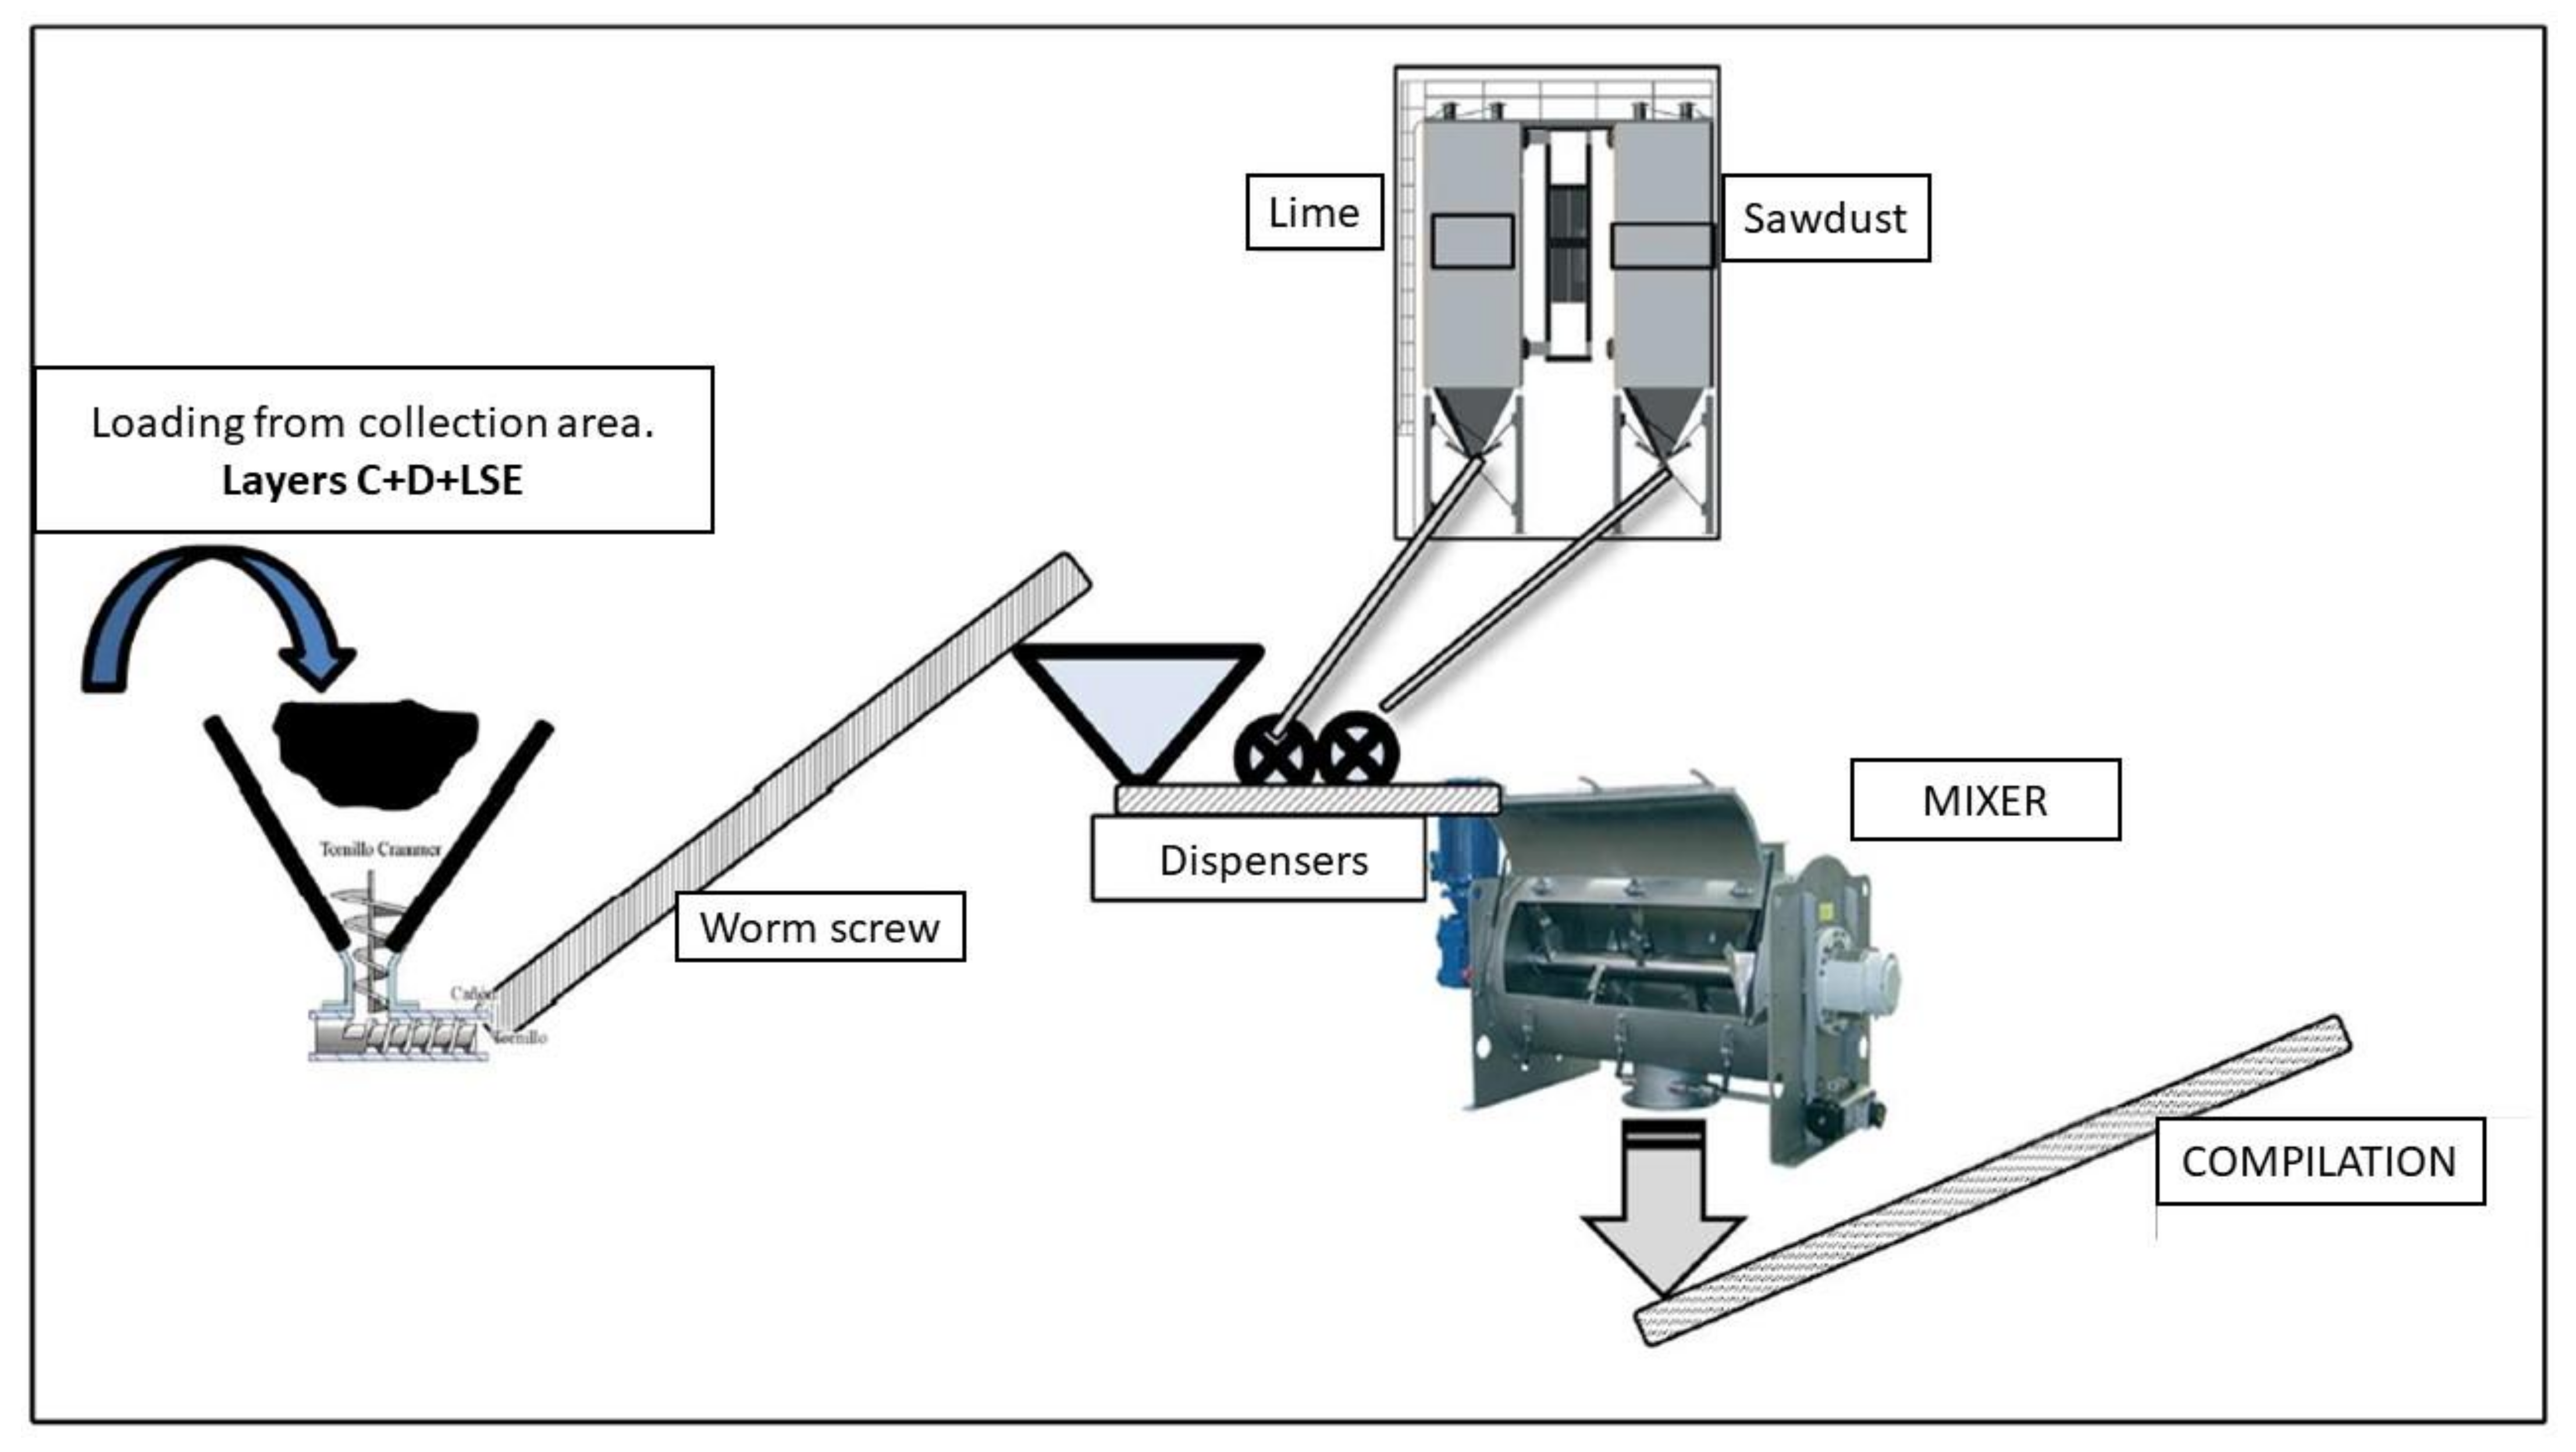
The adjustment of the mixing plant consists, first, of passing the material through a hopper with a worn drive at the bottom, whose function is to mix, degas and convey the product to the dosing hopper. The dosing hopper consists of a weighing element for lime. A premix is made and 10% by weight of lime is added. The hopper is made of stainless steel and is resistant to high temperatures because exothermic reactions will occur. From the dosing hopper, it passes to a batch drum mixer with blades and propellers for mixing, which, like the hopper, is also made of stainless steel and is resistant to high temperatures. The mixer is equipped with a degassing and outgassing system because toxic gases are released during the mixing process. These gases are fed into a chimney with a gas treatment system.
The material is discharged from the mixer into a sieve that ensures that the product is correctly mixed and has the desired granulometry. The process ends with conveyor belt transport to the stockpile areas, where analytical controls are carried out before the material is transported to the management plant. The whole treatment of the waste is shown in Figure 3.
The second treatment will be carried out in two plants where it will be the same in both plants. According to the theoretical model, the material destined for the Carboneras cement industry will be treated at Albox (Almería), and the material destined for Oural will be treated at Arganda (Madrid), near the settling ponds. In the management plants, the material undergoes a physical–chemical treatment, where the final product is a solid fuel with the necessary characteristics to be accepted and used in the cement industry.
If the material contains concentrations of PCBs higher than 50 ppm, it will be sent to incineration. Theoretically, the material as a whole has concentrations of less than 50 ppm in PCBs and will therefore be treated in the management plants. First, when the material is received, a sample is conducted to determine the origin of the waste. Then, at the installation laboratory, all of the complementary parameters stipulated by the company, according to its own criteria of admission and expedition, are analysed. Once it is confirmed that they are settling ponds waste and that they comply with the complementary parameters, they are discharged.
The unloading area is a pit shed where the first crushing of the material is carried out with a low-speed double shaft crusher. Once this crushing is finished, the material is passed to the mixing tower. In the tower, it is mixed with other waste and sawdust to stabilize the waste. This installation is equipped with a sawdust reception hopper and a closed continuous vertical mixer with O2 analyser and nitrogen purging system.
The material is passed from the tower to the screening and refining area, where it is fed to a double screw belt that connects to the trommel inlet for the first screening; from the trommel, it is passed to the magnetic separation. The treatment is completed with storage and dispatch. The storage area consists of venting systems connected to an air treatment network, an extraction system in the lower area and a discharge area with grids connected to the contaminated water network.
Table 2 shows the tonnes extracted during the process and its heat of combustion. The heat of combustion is the average data of the material samples carried out before its extraction.
As mentioned above, the extracted tonnes will be distributed to two cement industries equally, i.e., the alternative fuel for each industry will contain 8404.5 tonnes of waste. Similarly, the percentage of waste to be allocated to each industry in the fuel will be 50%.

2.5. Environmental Specifications in the Cement Sector

In the cement industry, there are emission limit values for pollutants, so it has become increasingly urgent to develop new methods of collecting these pollutants in order to obtain more representative samples, collected over a longer period of time [30]. In the Directive 2010/75/UE on industrial emissions, there are legally binding limit values for the emission of dioxin and furan, namely 0.1 ng/m3 ET (toxicity equivalents) for installations that co-incinerate more than 1 tonne per hour of dangerous waste [31]. The measurements of the dioxin and furan emissions in the cement industry are carried out separately if co-incineration waste is used.
The RD 508/2007, 20 of April, which regulates the provision of information on emissions from the E-PRTR Regulation and integrated environmental authorisations, establishes that in industries that do not use waste, cement and/or clinker manufacturing, facilities in rotary kilns with a production capacity of more than 500 tonnes per day must comply with environmental information requirements [32]. These requirements pertain to water, energy and fuel consumption.
Industries that do use waste are required to monitor emissions of heavy metals, dioxins and furans, as established by the RD 815/2013, which approves the Industrial Emissions Regulation [33]. This control consists of at least four measurements per year and during the first 12 months at least one measurement every two months. These requirements are set out in the Integrated Environmental Authorisation for each installation.

2.6. Energy Balance

To calculate the energy consumed, the following energy balance, Equation (1), of the entire settling pond extraction process is carried out. This energy balance considers the different energies involved in the process, namely the gross energy of the waste (Egross), the energy of waste extraction (Eextr), the energy of in situ adaptation of the waste (Etr1), the energy of transportation to the cement industry in Carboneras (Et1), the energy of treatment in the management plants (Etr2) and the energy of transportation to the cement industry in Oural (Et2).
C o n s u m e d   e n e r g y w 2 f = E g r o s s + E e x t r + E t r 1 + E t r 2 + E t 1 + E t 2
The energy balance of the case in which the waste is incinerated, the following energies involved in the process are considered: the energy of the petroleum coke used to produce cement ( E c o k e ) , the gross energy of the waste ( E g r o s s ), the energy extraction of the waste (Eextr), the energy of the on-site treatment (Etr1) and the transportation energy from some settling ponds to the incineration plant for dangerous waste (Et). The energy consumed during the process is calculated with Equation (2).
C o n s u m e d   e n e r g y i n c i n e r a t i o n = E c o k e + E g r o s s + E e x t r + 1 + E t r 1 + E t
Petroleum coke is the fuel used in cement industry kilns when waste is not used. In this case, the settling pond waste is the substitute of the petroleum coke. The waste energy (Egross) is the same as the petroleum coke energy (Ecoke), as shown in Equation (3).
E c o k e = E g r o s s
In Equation (4) the difference between the two energy balances of the cases of study is shown, and it is shown graphically in Figure 4. If the result is positive in this equation, it means that the energy recovery case is the energy-efficient one; if the result is negative, it means that the waste incineration case is the energy-efficient one.
C o n s u m e d   e n e r g y i n c i n e r a t i o n w 2 f = E c o k e + E t E t 1 E t r 2 E t 2

2.7. CO2 Emissions

The cement industry contributes about 5% to global anthropogenic CO2 emissions, making the cement industry an important sector for CO2 emission mitigation strategies [34]: in addition to combustion-related emissions, cement production also release CO2 during the calcination of limestone [35]. As it is a sector with high CO2 emissions, the aim is to avoid emissions with alternatives such as the one described: using the waste as opposed to incinerating the waste. To calculate the emissions of this gas, the following emission factors for each energy have been used: emission intensity of diesel fuel type C of 2.868 kgCO2/l [36] for the extraction process, emission intensity of electricity of 0.181 kgCO2/kWh [37] in the treatment processes, emission intensity of diesel of 2.79 kgCO2/l [37] for transport and 0.35748 kgCO2/kWh [38] emission intensity of the petroleum coke for the actual case of petroleum coke burning. The last factor is used because petroleum coke is the fuel frequently used in the kilns of cement industry, so, by using the alternative fuel, it is possible to replace the petroleum coke.
Substituting waste for fossil fuels reduces the potential long-term pollution that waste can generate, both at controlled and uncontrolled sites, as well as the pollution associated with the production of traditional fossil fuels. Therefore, the CO2 tonnes avoided are calculated with Equation (5), which is the difference between the two alternatives.
A v o i d e d   C O 2 = E c o k e · E F c o k e + E t · E F d i e s e l E t 1 · E F d i e s e l E t r 2 · E F e l e c t r i c i t y E t 2 · E F d i e s e l

3. Results

The results obtained by using the extracted material from the settling ponds as alternative fuel are shown here; throughout the extraction process, the fuel will be distributed equally to two Spanish cement industries.

3.1. Energy Balance: Waste Fuel

The gross energy, shown in Table 3, is the energy provided by the waste, and it is calculated based on the amount of waste that needs to be extracted and its heat of combustion Table 2.
In Table 4, the consumed energy of the process is shown: energy extraction (Eextraction), which is the energy consumed by the backhoe during the waste extraction process, the on-site treatment energy (Etreatment1) and the treatment energy (Etreatment2) in both management plants.
In the extraction energy the energy consumed by a backhoe of 120 kW is taken into account; once extracted, the waste goes to a mixing plant (on-site treatment), where, to calculate the energy consumed, the material is treated with machines with 0.5 to 2 kW (Figure 3). When the first treatment is finished, the material is transported to the management plants in tank trucks of 24 tonnes. At the management plants, the second treatment is carried out, and in order to calculate the energy consumed during the alternative fuel generation process from waste, it is known that the energy consumption of the whole process is 32,298.34 kWh.
In Table 5, the energy consumed by transportation is shown, where the energy of the Carboneras case is referred to as the Etransport1 of Equation (1) and Oural is Etransport2 from the same equation. To calculate the transport energy, two transports have been considered: the first one is the route between the settling pond and the management plant in Albox, 500 km away, and the second one is the route between the management plant and the cement facility, 50 km away. Similarly, to calculate the transport energy (Etransport2) of Oural, the first one is the route between the settling pond and the management plant in Arganda, 10 km away, and the second one is the route between the management plant and the cement industry, 527 km away.
To calculate the energy of the two transports, the number of trucks, the litres of fuel consumed by the trucks on the outward and return routes, the tonnes of waste transported and the distance travelled are considered. Finally, by using all of the energies obtained, as shown in Table 4 and Table 5, and by applying Equation (1), the energy consumed by the use of waste in the two cement industries is obtained in Table 6.
With these results, the energy consumed values for the whole process is obtained: 6504.05 kWh/twaste. It can be concluded that the process is viable in terms of energy input.

3.2. Energy Balance: Waste Incineration

In Table 7, the energies of the process are shown, they are necessary to calculate the energy consumed.
These energies are calculated the same way as the energies in Table 3 and Table 4. Therefore, with the results from Table 7, it is possible to know the energy balance of this process, that is to say, the energy consumed: 12,564.47 kWh/twaste. This energy consumed is far superior to the energy consumed from the energy recovery of waste, which means that the case with the greatest efficiency is energy recovery.

3.3. Comparison of the Two Case Studies: Energy Recovery vs. Incineration

When comparing the energy consumed by the two alternatives, it is possible to show that using waste as fuel is better than the waste incineration alternative. This comparison is carried out with Equation (4). Results are shown in Figure 4; 6060.42 kWh/twaste of energy was consumed, and on the other hand the average consumed energy value was 6504.05 kWh/twaste in the period 2020–2021 with 16,809 tonnes of material extracted.
Compared to the previous study carried out in [28], the energy consumed by the two alternatives (energy recovery vs. incineration) was 6032.65 kWh/twaste, and the average consumed energy value was 6156.55 kWh/twaste in the period 2015–2018 with a quantity of material extracted, namely 42,246.83 tonnes. Energy content in waste is slightly higher (5.6%) in the latest period (2020–2021) in comparison with the first period (2015–2018); this is because the material is pumpable in the first period and solid in the second period, and it has a higher calorific value in the first period.
With these data, it can be seen that the energy consumed is similar due to the consumption in transport. By decreasing the transport distances, the energy consumed would be reduced, which means that more use is made of the calorific value of the material, which is similar in terms of the material extracted in both studies.
At the same time, this study achieves environmental benefits by decontaminating a protected area, increasing biodiversity and giving a second use to a material that no other recycling methodology is known.

3.4. CO2 Emissions

The calculation of the avoided CO2 emissions is carried out by comparing the two alternatives mentioned and the petroleum coke burnt at the cement industries, and it is shown in Table 8.
The result from Equation (5) is 37,271.07 tCO2; this is the number of tonnes avoided in the process by using waste as an alternative fuel in the cement sector instead of burning fossil fuels such as petroleum coke. The greatest reduction in emissions comes from not using petroleum coke in the cement kilns, allowing a second use for the waste extracted from the settling ponds, a direct application of the CE concept.

4. Conclusions

Dangerous wastes with similar characteristics to those extracted from the settling ponds are usually incinerated, but with this waste, this incineration has been avoided. The energy of the waste is used and, when mixed with another waste, is transformed into alternative fuel. Therefore, this investigation not only reduces pollution but also reutilizes and recycles the waste from the settling ponds and other external waste (waste from the treatment mix).
From the energy recovery of the waste, it can be concluded that the energy balance is positive because there is a contribution of energy from the waste, and within the energy balance, it can be seen that the processes that consume the most energy are transports due to the long distances involved. The value of energy consumed is very similar for each cement industry because the transport distances are practically the same.
Thanks to the generation of alternative fuels from waste, it was also possible to reduce greenhouse gas emissions: 37,271.07 tonnes was avoided, which is to say, 2.18 tonnes of CO2 for each tonne of waste used.
Environmentally, this method will have a positive impact on the flora and fauna of the Parque Regional del Sureste and on the contamination of the soil of the area under study.

Author Contributions

P.M.: investigation, conceptualization, methodology and supervision; D.B.: resources, methodology and supervision; A.P.: formal analysis and validation; L.S.-M.: investigation, writing—original draft preparation; B.L.: investigation and supervision. All authors have read and agreed to the published version of the manuscript.

Funding

Not applicable.

Institutional Review Board Statement

Not applicable.

Informed Consent Statement

Not applicable.

Data Availability Statement

Not applicable.

Acknowledgments

The authors of this work would like to thank Rocío Sánchez Ramos for her contribution as translator, proof-reader, and editor of the text.

Conflicts of Interest

The authors declare no conflict of interest.

References

  1. Bolaños, V.H.; Ortega, F.; Reyes, D. Dossier Medio Ambiente, Ciencia y Sociedad. Andamios 2015, 12, 7–14. [Google Scholar]
  2. Schulz, C.; Whitney, B.S.; Rossetto, O.C.; Neves, D.M.; Crabb, L.; de Oliveira, E.C.; Lima, P.L.T.; Afzal, M.; Laing, A.F.; Fernandes, L.C.D.S.; et al. Physical ecological and human dimensions of environmental change in Brazil’s Pantanal wetland: Synthesis and research agenda. Sci. Total Environ. 2019, 687, 1011–1027. [Google Scholar] [CrossRef]
  3. OECD. Towards a Circular Economy: A Zero Waste Programme for Europe. Available online: https://www.oecd.org/env/outreach/EC-Circular-econonomy.pdf (accessed on 17 May 2021).
  4. Prieto-Sandoval, V.; Jaca, C.; Ormazabal, M. Towards a consensus on the circular economy. J. Clean. Prod. 2017, 179, 605–615. [Google Scholar] [CrossRef]
  5. Rosa, P.; Sassanelli, C.; Urbinati, A.; Chiaroni, D.; Terzi, S. Assessing relations between Circular Economy and Industry 4.0: A systematic literature review. Int. J. Prod. Res. 2020, 58, 1662–1687. [Google Scholar] [CrossRef] [Green Version]
  6. Cohen-Rosenthal, E. A walk on the human side of industrial ecology. Am. Behav. Sci. 2000, 44, 245–264. [Google Scholar] [CrossRef]
  7. Severiche, C.A.; Acevedo, R.L. Biogás a partir de residuos orgánicos y su apuesta como combustibles de segunda generación. Rev. Fac. Ing. 2013, 14, 6–15. [Google Scholar] [CrossRef]
  8. Romero, A. Aprovechamiento de la biomasa como fuente de energía alternativa a los combustibles fósiles. Rev. R. Acad. Cien. Exact Fis. Nat. 2010, 104, 331–345. [Google Scholar]
  9. Aguilar-Virgen, Q.; Armijo-de Vega, C.; Taboada-González, P.; Aguilar, X.M. Potencial de recuperación de residuos sólidos domésticos dispuestos en un relleno sanitario. Rev. Ing. 2010, 32, 16–27. [Google Scholar] [CrossRef]
  10. Arner, A.; Barberán, R.; Mur, J. La política de gestión de residuos: Los aceites usados. Rev. Econ. Apl. 2006, 42, 81–100. [Google Scholar]
  11. Fong, W.; Quiñonez, E.; Tejada, C. Caracterización físico-química de aceites usados de motores para su reciclaje. Prospectiva 2017, 15, 135–144. [Google Scholar]
  12. Bhaskar, T.; Uddin, A.; Muto, A.; Sakata, Y.; Omura, Y.; Kimura, K.; Kawakami, Y. Recycling of waste lubricant oil into chemical feedstock or fuel oil over supported iron oxide catalysts. Fuel 2004, 83, 9–15. [Google Scholar] [CrossRef]
  13. Medina-Mijangos, R.; Seguí-Amórtegui, L. Technical-economic analysis of a municipal solid waste energy recovery facility in Spain: A case study. Waste Manag. 2021, 119, 254–266. [Google Scholar] [CrossRef]
  14. Puertas, E.; Blanco-Valera, M.T. Empleo de combustibles alternativos en la fabricación de cemento. Efecto en las características y propiedades de los clínkeres y cementos. Mater. Construc. 2004, 54, 51–64. [Google Scholar] [CrossRef]
  15. Abdallah, R.; Juaidi, A.; Assad, M.; Salameh, T.; Manzano-Agugliaro, F. Energy Recovery from Waste Tires Using Pyrolysis: Palestine as Case of Study. Energies 2020, 13, 1817. [Google Scholar] [CrossRef] [Green Version]
  16. The Development of a National Master Plan for Hazardous Waste Management for the Palestinian National Authority. Available online: http://environment.pna.ps/ar/files/Part_one_Final_Report_on_The_Development_of_a_National_Master_Plan_for_Hazardous_Waste_Management_for_the_Palestinian_National_Authority_en.pdf (accessed on 17 May 2021).
  17. Sakata, Y.; Bhasker, T.; Uddin, M.A.; Muto, A.; Matsui, T. Development of a catalytic dehalogenation (Cl, Br) process for municipal. J. Mater. Cycles Waste Manag. 2003, 5, 113–124. [Google Scholar] [CrossRef]
  18. Lopez, A.; Blanco, F.; Gutierrez, M. Mejora del rendimiento de una cementera mediante el empleo de combustibles alternativos. Rev. Electrónica Medioambiente 2012, 12, 47–61. [Google Scholar] [CrossRef] [Green Version]
  19. Elkhadiri, I.; Diouri, A.; Boukhari, A.; Puertas, F.; Vázquez, T. Obtención de cementos belíticos de sulfonaluminatos a partir de residuos industriales. Mater. Construc. 2003, 53, 57–69. [Google Scholar]
  20. Guzmán, L.; de la Hoz, D.; Pfaffenbichler, P.; Shepherd, S. Impact of fuel consumption taxes on mobility patterns and CO2 emissions using a system dynamic approach. In Proceedings of the 10th International Conference on Application of Advanced Technologies in Transportation, Athens, Greece, 27–31 May 2008. [Google Scholar]
  21. Barredo, I.; Casla, M. Biocombustibles, una industria en transición. DYNA Ing. Ind. 2012, 87, 31–34. [Google Scholar]
  22. Council Decision of 25 April 2002 Concerning the Approval, on Behalf of the European Community, of the Kyoto Protocol to the United Nations Framework Convention on Climate Change and the Joint Fulfilment of Commitments Thereunder. Available online: https://eur-lex.europa.eu/legal-content/EN/TXT/?uri=celex%3A32002D0358 (accessed on 8 June 2021).
  23. O´Mahony, T.; Zhou, P.; Sweeney, J. The driving forces of change in energy-related CO2 emissions in Ireland: A multi-sectoral decomposition from 1990 to 2007. Energy Policy 2012, 44, 256–267. [Google Scholar] [CrossRef] [Green Version]
  24. Grubb, M. Technology innovation and climate change polity: An overview of issues and options. Keio Econ. Stud. 2004, 41, 103–132. [Google Scholar]
  25. Valorización Ambiental y Caracterización de los Ecosistemas Acuáticos Leníticos del Parque Regional en Torno a los Ejes de los Cursos Bajos de los Ríos Manzanares y Jarama. Available online: https://www.researchgate.net/publication/297387060_Valoracion_ambiental_y_caracterizacion_de_los_ecosistemas_acuaticos_leniticos_del_Parque_Regional_en_torno_a_los_ejes_de_los_cursos_bajos_de_los_rios_Manzanares_y_Jarama (accessed on 8 June 2021).
  26. Carreño, F.; García, S.; Lillo, J.; Fernández, R.; Mabeth-Montoya, A. Building a 3D geomodel for water resources management: Case study in the Regional Park of the lower courses of Manzanares and Jarama Rivers (Madrid, Spain). Environ. Earth Sci. 2013, 71, 61–66. [Google Scholar] [CrossRef]
  27. Panera, J.; Torres, T.; Pérez-González, A.; Ortiz, J.E.; Rubio-Jara, S.; Del Val, D.U. Geocronología de la Terraza Compleja de Arganda en el valle del río Jarama (Madrid, España). Estud. Geol. 2011, 67, 495. [Google Scholar] [CrossRef] [Green Version]
  28. Mora, P.; Barettino, D.; Ponce, A.; Sánchez-Martín, L.; Llamas, B. Waste-to-Energy Process to Recover Dangerous Pollutants in an Environmental Protected Area. Appl. Sci. 2021, 11, 1324. [Google Scholar] [CrossRef]
  29. Block, C.; Van, J.; Van, A.; Wauters, G.; Vandecasteele, C. Incineration of Hazardous Waste: A Sustainable Process? Waste Biomass Valorization 2015, 6, 137–145. [Google Scholar] [CrossRef]
  30. Rivera-Austrui, J.; Martinez, K.; Abad, E.; Rivera, J. El control de emisiones de contaminantes persistentes en la utilización de combustibles alternativos en la industria del cemento. Rev. Técnica Cem. Hormigón 2010, 939, 74–81. [Google Scholar]
  31. Directive 2000/76/EC of the European Parliament and of the Council of 4 December 2000 on the Incineration of Waste. Available online: https://eur-lex.europa.eu/legal-content/ES/ALL/?uri=celex%3A32000L0076 (accessed on 8 June 2021).
  32. Real Decreto 508/2007, de 20 de Abril, por el que se Regula el Suministro de Información sobre Emisiones del Reglamento E-PRTR y de las Autoridades Ambientales Integradas. Available online: https://www.boe.es/buscar/doc.php?id=BOE-A-2007-8351 (accessed on 9 June 2021).
  33. Real Decreto 815/2013, de 18 de Octubre, por el que se Aprueba el Reglamento de Emisiones Industriales y de Desarrollo de la Ley 16/2002, de 1 de Junio, de Prevención y Control Integrados de la Contaminación. Available online: https://www.boe.es/buscar/doc.php?id=BOE-A-2013-10949 (accessed on 9 June 2021).
  34. Worell, E.; Price, L.; Martin, N.; Hendriks, C.; Meida, L. Carbon dioxide emissions from the global cement industry. Ann. Rev. Environ. Resour. 2001, 26, 303–329. [Google Scholar] [CrossRef]
  35. Hanle, L. Understanding CO2 emissions. Word Cement 2006, 37, 69–72. [Google Scholar]
  36. Ministerio para la Transición Ecológica y el Reto Demográfico. Factores de Emisión: Registro de Huella de Carbono, Compensación y Proyectos de Absorción de Dióxido de Carbono. Available online: https://www.miteco.gob.es/es/cambio-climatico/temas/mitigacion-politicas-y-medidas/factoresemision_tcm30-479095.pdf (accessed on 9 June 2021).
  37. Guía Práctica para el Cálculo de Emisiones de Gases de Efecto Invernadero (GEI). Available online: https://canviclimatic.gencat.cat/es/detalls/Article/Guia-de-calcul-demissions-de-GEI (accessed on 9 June 2021).
  38. Fabricación de Cemento (Combustión). Available online: https://www.miteco.gob.es/es/calidad-y-evaluacion-ambiental/temas/sistema-espanol-de-inventario-sei-/030311-combust-fabric-cemento_tcm30-430164.pdf (accessed on 9 June 2021).
Figure 1. Aerial photo of the area under study.
Energies 15 00659 g001
Figure 2. Laguna Sureste. Solid hydrocarbon waste.
Energies 15 00659 g002
Figure 3. Treatment of the waste.
Energies 15 00659 g003
Figure 4. Graphical representation of the two alternatives.
Energies 15 00659 g004
Table 1. Characteristics of the contaminant material of the settling pond.
UnitsD LayerSureste Ponds
Volumem3423810,200
DensityKg/m31379.801074.60
WeightT584810,961
ViscositycP304,872.29
Water%7.119.03
T157536
Volatile matter%13.6563.67
Ash content at 815 °C%51.304.85
Gross Calorific ValueKcal/Kg4030.526698.95
Net Calorific ValueKcal/Kg35176285
pH 6.20<1
Total cyanidesmg/Kg 0.69
Aciditymg KOH/g25.7184.80
t KOH57
Sulphur%3.098.61
T68.2942
Chlorine%0.020.05
Flash point°C>100243
PAHs
Sum 16 PAHSmg/Kg28.8734.27
PCBs UNE 12766
Sum PCB 7mg/Kg10.0313.85
PCBs UNE 61619
Sum PCBmg/Kg10.345.93
Metals
Vanadium (V)mg/Kg2.670.89
Chromium (Cr)mg/Kg15.259.47
Cobalt (Co)mg/Kg 0.69
Nickel (Ni)mg/Kg1.505.33
Copper (Cu)mg/Kg37.7547.08
Zinc (Zn)mg/Kg4401702.5
Arsenic (As)mg/Kg2.771.03
Molybdenum (Mo)mg/Kg5.339.78
Cadmium (Cd)mg/Kg0.3
Tin (Sn)mg/Kg7.333.88
Barium (Ba)mg/Kg316.6766.88
Lead (Pb)mg/Kg4757.54275
Mercury (Hg)mg/Kg1.700.38
Table 2. Characterization of the extracted waste.
2020–2021
Weight of waste
(t)
16,809
Heat of combustion
(Kcal/Kg)
5336.51
Table 3. Gross energy.
kWh/twaste2020–2021
Egross6206.36
Table 4. Extraction energy and treatment.
kWh/twaste2020–2021
Eextraction14.34
Etreatment10.38
Etreatment21.92
Table 5. Transport energy.
kWh/twaste2020–2021
Ponds–Albox129.28
Albox–Carboneras12.93
Carboneras142.21
Ponds-Arganda2.59
Arganda-Oural136.26
Oural138.85
Table 6. Energies consumed.
kWh/twaste2020–2021
Carboneras6365.20
Oural6361.84
Table 7. Gross energy, extraction energy, treatment energy and transport energy.
kWh/twaste2020–2021
Egross6206.36
Eextraction14.34
Etreatment0.38
Etransport137.04
Table 8. Avoided CO2 emissions (tonnes).
Tonnes of CO2Total
Extraction57.59
Treatment in situ1.14
Treatment centre5.85
Transport 1333.46
Transport 2325.58
Petroleum coke equivalent37,293.29
Publisher’s Note: MDPI stays neutral with regard to jurisdictional claims in published maps and institutional affiliations.

