1. Introduction
As the demand for sustainable development and renewable energy sources surges, so does the need to continually improve technologies, design, and safety in the renewable energy industry [
1]. Fixed offshore wind turbines (OWTs) continue to be developed for high latitude areas where not only wind and wave loads need to be considered but also moving sea ice [
2].
Based on current climate change projections, the decline in icing frequency and sea ice extent will likely continue and benefit the wind energy industry [
3,
4]; however, while sea ice extents are decreasing, wind parks are progressively moving into the northern hemisphere. In this harsh environment, OWTs are subjected to severe loading. The effects of ice-induced variable loads due to drifting ice sheets and the consequences for fatigue life of offshore structures are not yet fully understood [
5,
6,
7]; nevertheless, it is generally known that loads from ice action on offshore structures can be much higher than those from wind and wave loading [
8,
9,
10,
11], and fatigue is the main failure cause for such structures [
12].
Fatigue design of OWTs under variable-amplitude loading (VAL) is typically performed by means of stress-based fatigue assessment methods, linear damage accumulation hypothesis, and standardized load spectra or time series [
13,
14,
15,
16,
17]. In this regard, standardized refers to the process of creating time series that represent a repeated sequence of loads, e.g., one flight journey, a year of loading of an offshore structure, etc.
Alternatively, VAL testing can be based on real-time load sequences, including load frequency information; however, such sequences are typically too long and complex to be suitable for structures exposed to high numbers of load cycles like ships and offshore structures [
18]. Nevertheless, VAL fatigue assessment based on the linear damage accumulation hypothesis also has several restrictions; see Heim [
17] for an extensive summary. Most notably, for scenarios that differ from the usual loading scenarios, calibration using VAL testing is required to verify applicable damage sums. Thus far, the contribution of ice loads on fatigue damage is based on the knowledge on design for regions without ice loading. Thus, only simple damage superposition for the different loading conditions (i.e., wave and ice) was performed using fatigue design methods and curves not developed with ice loading in mind [
19,
20].
As the magnitude of loads due to ice action can be much higher than those related to wind and wave loading, differences in fatigue life under the combined wind, wave, and ice action are expected. This is exacerbated by the fact that similar effects are well-known from overloading events in tension and compression, e.g., during storms [
21,
22,
23].
There has never been any fatigue testing for combined wind, wave, and ice load spectra to this day. Thus, this study presents a design approach for OWTs that considers VAL due to wind, wave, and ice action. This is achieved by determining a standardized load sequence from a numerical model that represents a case study for an OWT subjected to several drifting ice events during its lifetime. To this goal, the occurrence of different load cases on an OWT in the southern Baltic Sea was simulated to obtain the structural response of an exemplary monopile support structure as load measurements on OWTs under ice action are limited, see Nord et al. [
24]. This data was then analyzed using the rainflow counting method to derive load spectra at an exemplary welded joint of the OWT. The presented method and results of this study are expected to serve as a foundation for future investigations on the fatigue strength of OWTs under the combined wind, wave, and ice action.
2. Fatigue Design of Offshore Wind Turbine Support Structures including Ice Loading and Sub-Zero Temperatures
The structural design of OWTs is based on international standards like IEC 61400-3-1 [
25] and design rules, e.g., DNVGL-ST-0126 [
26]. For the estimation of ice loads (for ultimate strength and fatigue assessment), IEC 61400-3 [
25] refers to the international standard for Arctic Offshore Structures of the Petroleum and natural gas industry ISO 19906:2019 [
27]. This standard, however, focuses on static ice loads for ultimate strength assessment. Consequently, there is a need to test the applicability of state-of-the-art design methods for the fatigue assessment of OWTs subjected to combined wind, wave, and ice action.
The most important ice-structure interaction modes for design are intermittent crushing and the frequency lock-in [
24,
28]. Their interaction with the structure induces large global loads and displacements; however, their occurrence is typically limited in locations with mild ice conditions such as the Baltic Sea. Hence, designers of OWTs try to avoid such scenarios by preventive measures.
Rare large magnitudes loads, e.g., due to ice-structure interaction, are known to alter fatigue crack propagation by crack retardation or acceleration [
29]. This effect is extensively studied for single or periodic load cycles; however, it is also known that events with a series of large cycles may affect crack propagation. A typical example of such over-load effects for ships and offshore structures are storm events, see [
21,
22,
23]. Fatigue design methods for OWTs are supposed to design against crack initiation, i.e., a through-thickness crack; however, for large plate thickness, this also includes a period of macro-crack growth, see [
13].
Besides the effect of ice loading on fatigue strength, another important aspect for the design of OWTs in cold regions is the effect of sub-zero temperatures on fatigue strength [
27,
30,
31,
32]. In many recent studies, an increase in fatigue strength with decreasing temperatures was observed [
33,
34,
35,
36,
37]. This effect is currently not considered in any design standard. Under variable amplitude loading, small changes in the fatigue limit can have significant effects on the fatigue life of OWTs. However, the current study focuses on the determination of a novel combined VAL spectrum for an offshore wind energy support structure that accounts for wind, wave, and ice action. Nonetheless, the presented methodology is applicable for different types of offshore structures and is not limited to OWTs. The methodology will subsequently be presented based on a case study of an OWT support structure.
3. Determination of Structural Response of an Offshore Wind Turbine Support Structure from Numerical Simulations
3.1. Background of the Numerical Model of an Offshore Wind Turbine Support Structure
The fatigue design of offshore structures is prone to large uncertainties. For OWTs, Velarde et al. [
38] found that fatigue damage is more sensitive to uncertainties in the wind, wave, and soil parameters than uncertainties in structural inputs. This study does not aim to account for all uncertainties in fatigue design, but rather to present a general approach to performing fatigue assessment for combined wind, wave, and ice action. For this purpose, a case study of an OWT located in the southern Baltic Sea was set up, and loading conditions were chosen to resemble this region’s typical weather and ice conditions.
A circumferential butt-weld of an offshore wind turbine support structure at a height of about 75 m above the mean sea level was chosen for the case study. At this position, the tower section has a plate thickness of 17 mm and a diameter of 3.5 m. In order to obtain the structural responses at this location, numerical simulations were performed under the influence of the design load cases (DLC). This has been achieved using the structural finite element and aeroelastic model for OWTs (BHawC) and coupling it with the ice crushing model Variation of contact Area model for Numerical Ice Load Level Analyses (VANILLA) [
39]. This model’s brittle crushing load estimation is based on the continuous brittle crushing equation of ISO 19906:2019 [
27].
The ice model parameters in VANILLA are subsequently scaled to a pre-defined probability of exceeding the peak load
FG in a simulated standard crushing event. This is defined by a drifting ice speed
vice and an associated crushing length
Lcrush to create a continuous brittle crushing on the structure. In the VANILLA project, the defined parameters were based on the Nordströmsgrund light-house (
vice = 0.15 m/s and
Lcrush = 90 m [
39]). The ice-structure interaction in the VANILLA model has been validated with model-scale ice tests at Hamburg Ship Model Basin (HSVA) and full-scale data from Validation of Low Level Ice Forces (LOLEIF) and Measurements on Structures in Ice (STRICE) [
40].
3.2. Design Load Cases
In the first pre-processing step, a critical load case assumption must be defined for the fatigue limit state. According to IEC61400-3-1 [
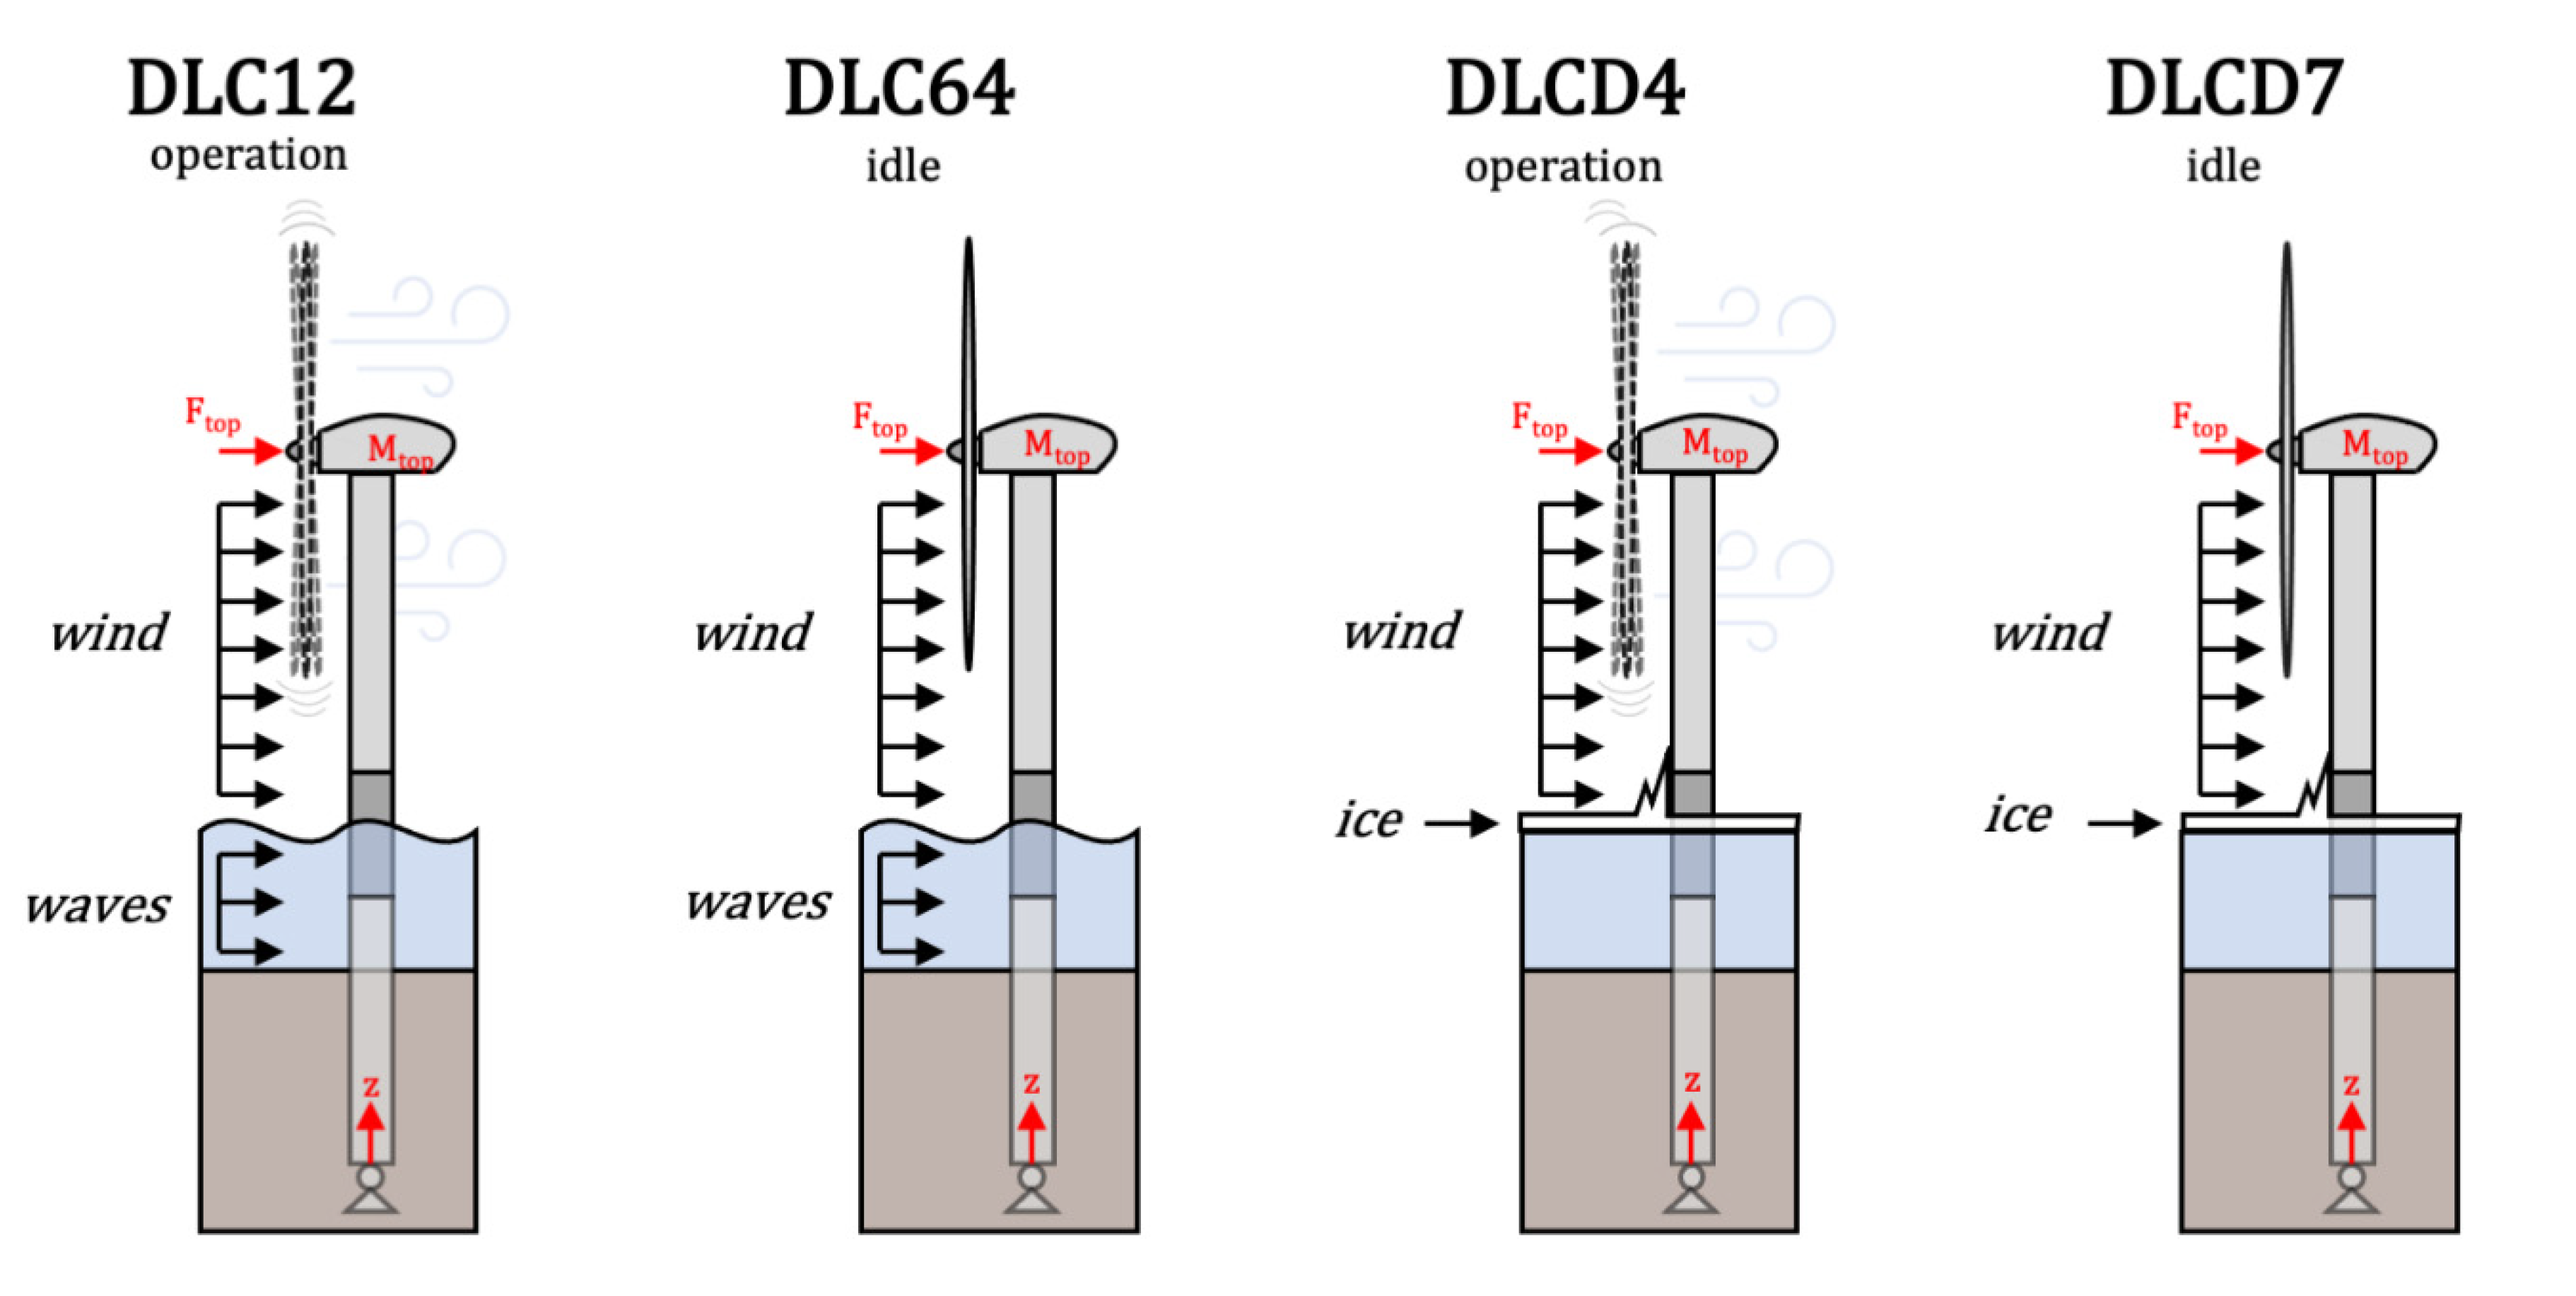
25], this has been done for an exemplary monopile support structure in the southern Baltic Sea with site-specific wind and wave data and estimated ice event conditions. These loads have been applied in two different modes of the turbine (idling and in operation). The defined scenarios are originally categorized in 11 DLCs, regrouped into four main DLCs. These four load conditions are illustrated in
Figure 1. For simplification, waves are considered to be absent during ice events.
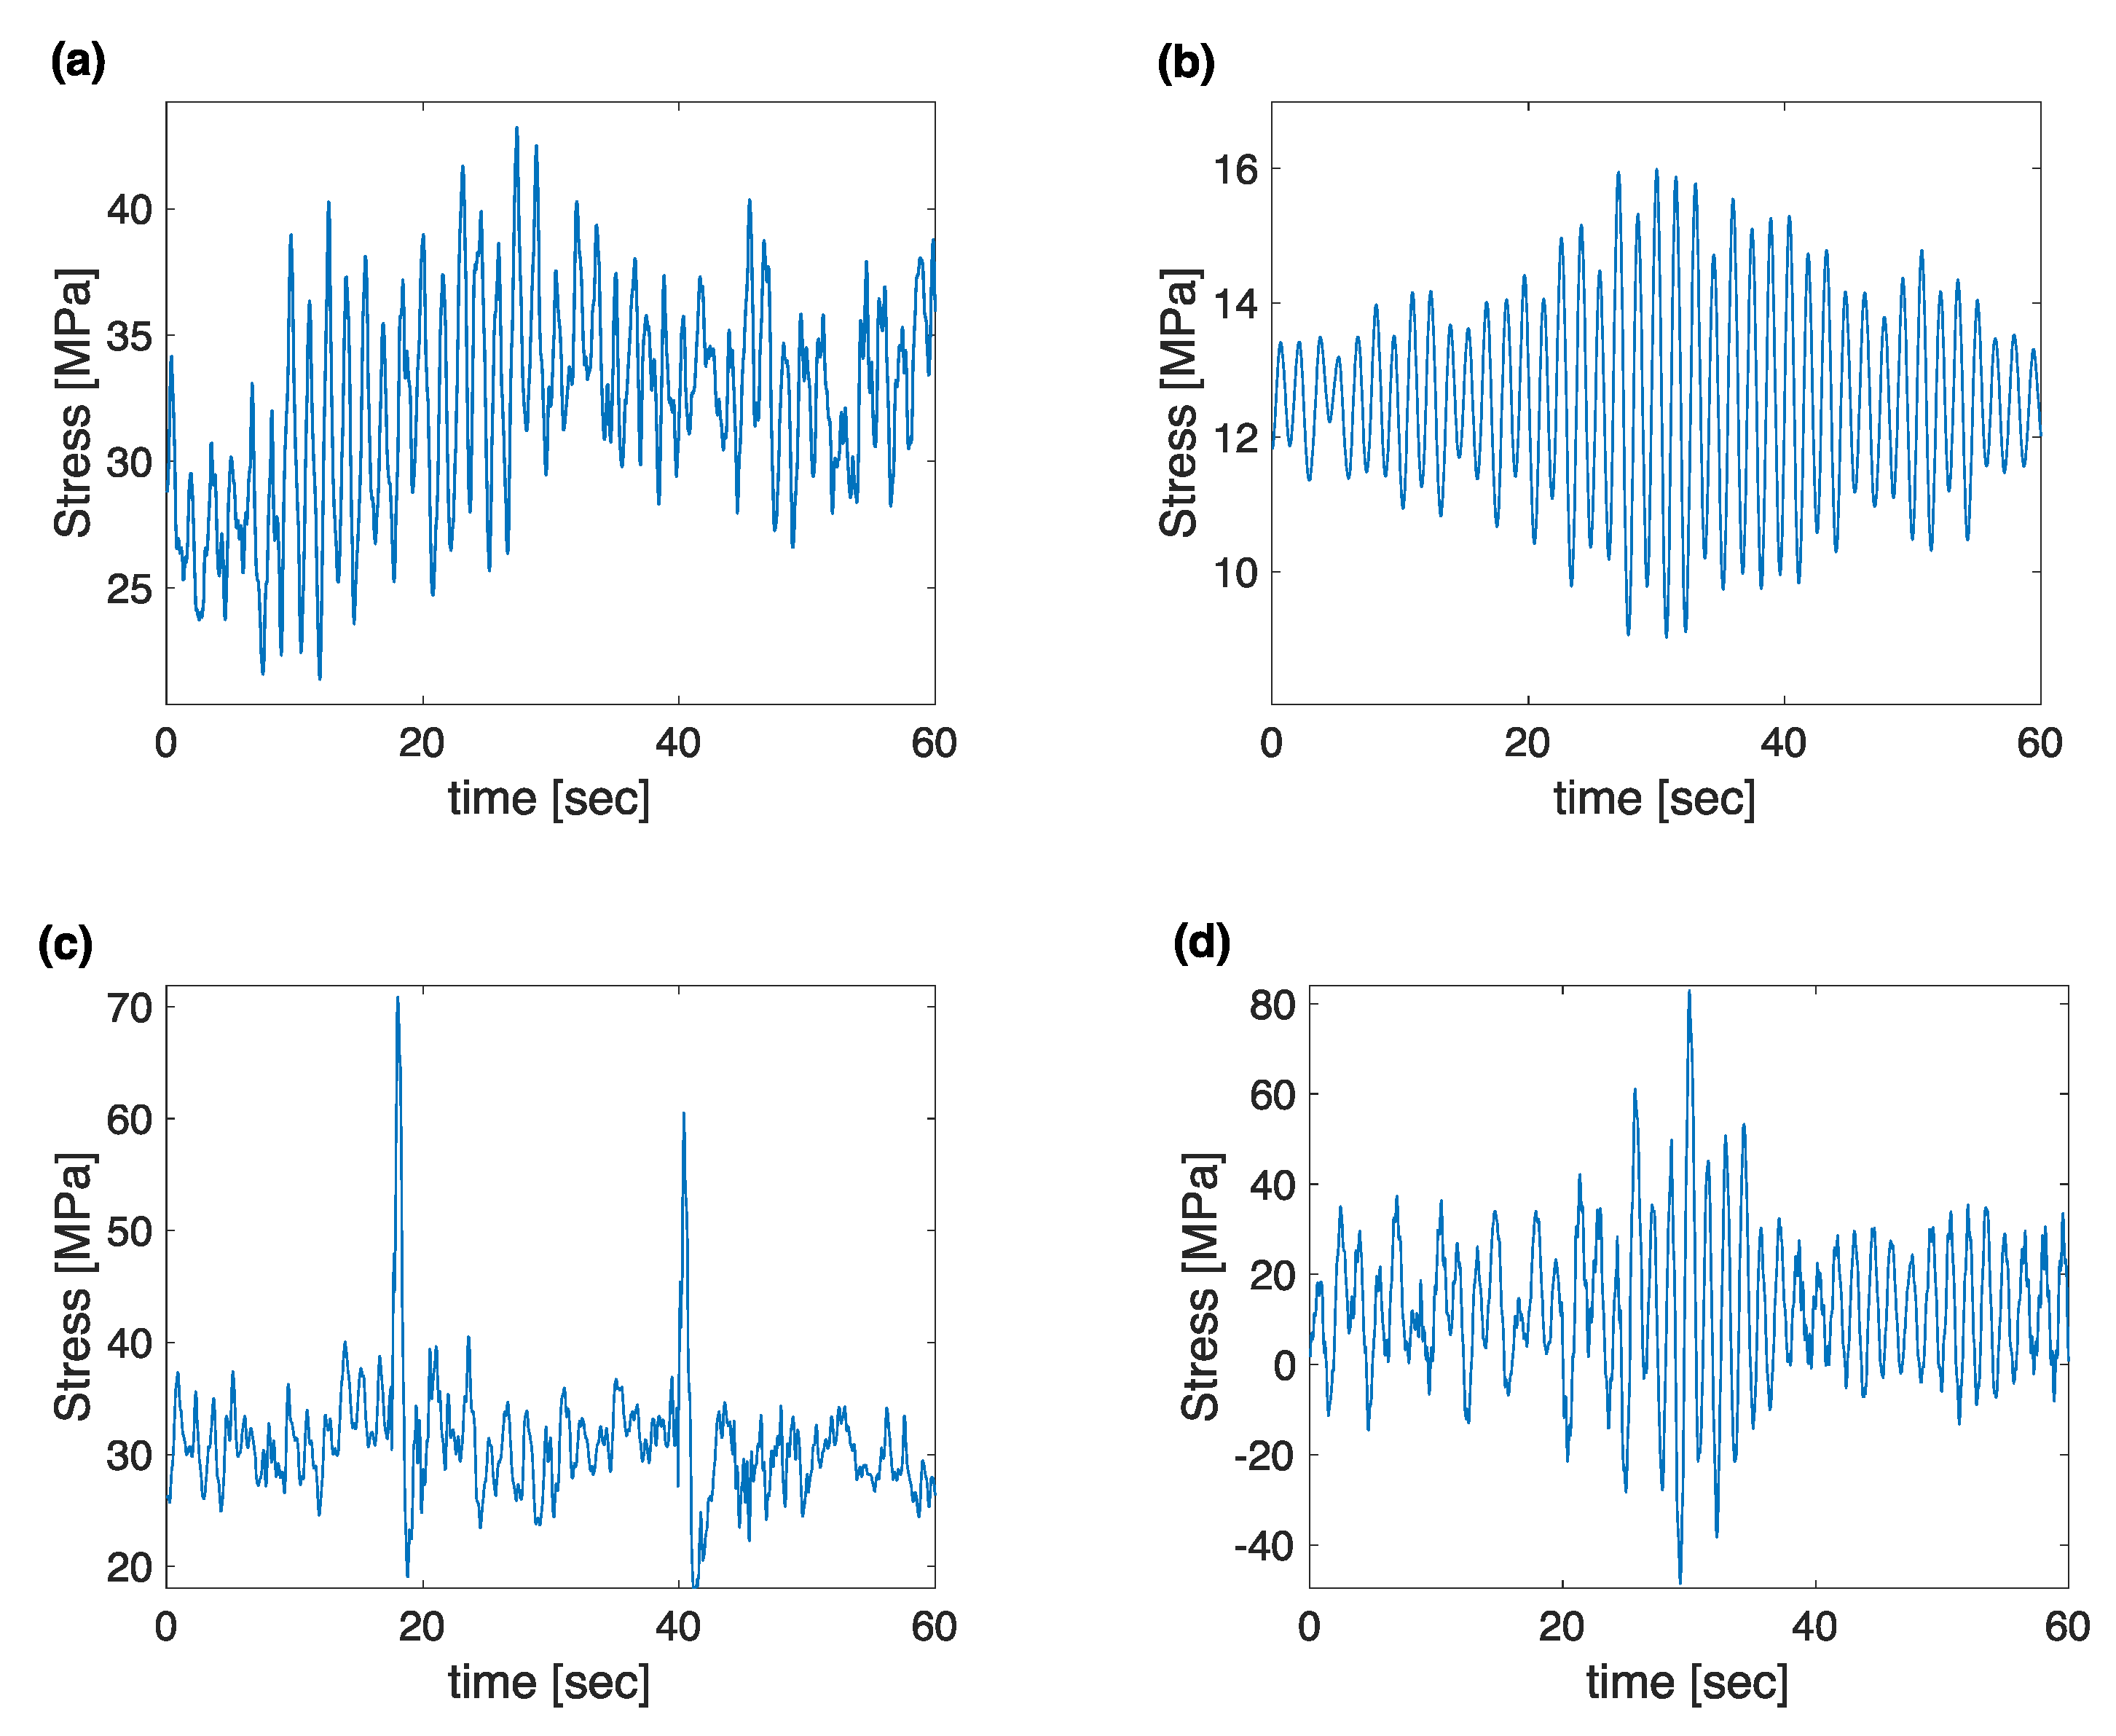
Due to the differences in loading on the OWT and in aeroelastic damping, large differences in load levels are observed. Exemplarily, stress-time responses at the investigated circumferential butt-welded joint are presented in
Figure 2. DLC12 (a) results in much higher stresses than during turbine idling (b). This can be traced back to the boundary conditions of the load cases. The idling state (DLC64) represents wind speeds too low for turbine operation. On the other hand, the operational mode simulated high wind speeds. Additionally, a misalignment between wind and wave loading is considered. This leads to a fluctuation in the load history and a higher irregularity.
The stress-time series of DLC12 and DLC64 that occurs with the highest probability has been selected and presented in
Figure 2 to show a typical VAL sequence for each DLC, together with examples for DLCD4 (operation at an ice speed of 220 mm/s) and DLCD7 (idling at an ice speed of 90 mm/s). All four stress-time series are shortened to present 60 s around the sample’s max stress. Due to the development of frequency lock-in in the second global bending mode of the structure, recognizable by the harmonic oscillation of the stress pattern, the average stress amplitudes are higher in DLCD7 than in DLCD4. It is noted that this is not an effect of just the difference between the aerodynamic damping between the two cases, as the velocity for the example from DLCD4 is so high that a different interaction regime develops. The two peaks in stress in
Figure 2c are related to periods of time where the wind load causes the relative speed between ice and structure to become close to zero for a while, thereby resulting in a sudden short load build-up.
Furthermore, the substantially higher stress ranges in the idling mode (d) are observed. These differences can be explained by the low aerodynamic damping of the turbine while idling. This leads to higher displacement amplitudes and dynamic amplification in the structure caused by ice-induced vibrations.
In total, 15,000 load scenarios with an individual duration of 600 s were simulated. From each simulation, bending moment histories about the x- and y-axis of a defined position of the tower were extracted and used to determine the stress response at the chosen location. Each of the simulations is associated with a weight factor W that defines the occurrence probability of each scenario. These weight factors are based on Weibull distributions of environmental data for wind, wave, and ice conditions and their misalignment. The total duration of the simulations sums up to 23.27 years.
4. Development of Combined Load Spectra from Short-Term Stress-Time Series
4.1. Data Processing
Due to different probabilities of load scenarios (for instance, different directions of wind and waves), the structural response around the circumference of the butt joint varies significantly. Thus, the methodology proposed by Milaković et al. [
5], presented in
Figure 3, was adopted to determine combined load spectra. To this goal, the stress-time series obtained from the numerical simulations are assessed using rainflow counting according to the ASTM E1049-85 [
41]. Next, the obtained range pairs are grouped into cumulative distribution functions (CDF) and superimposed. Finally, to shorten fatigue testing based on the combined load spectra, an omission level can be introduced to remove low load cycles that do not contribute significantly to fatigue damage; see [
42,
43].
4.2. Stress-Time Series Analysis
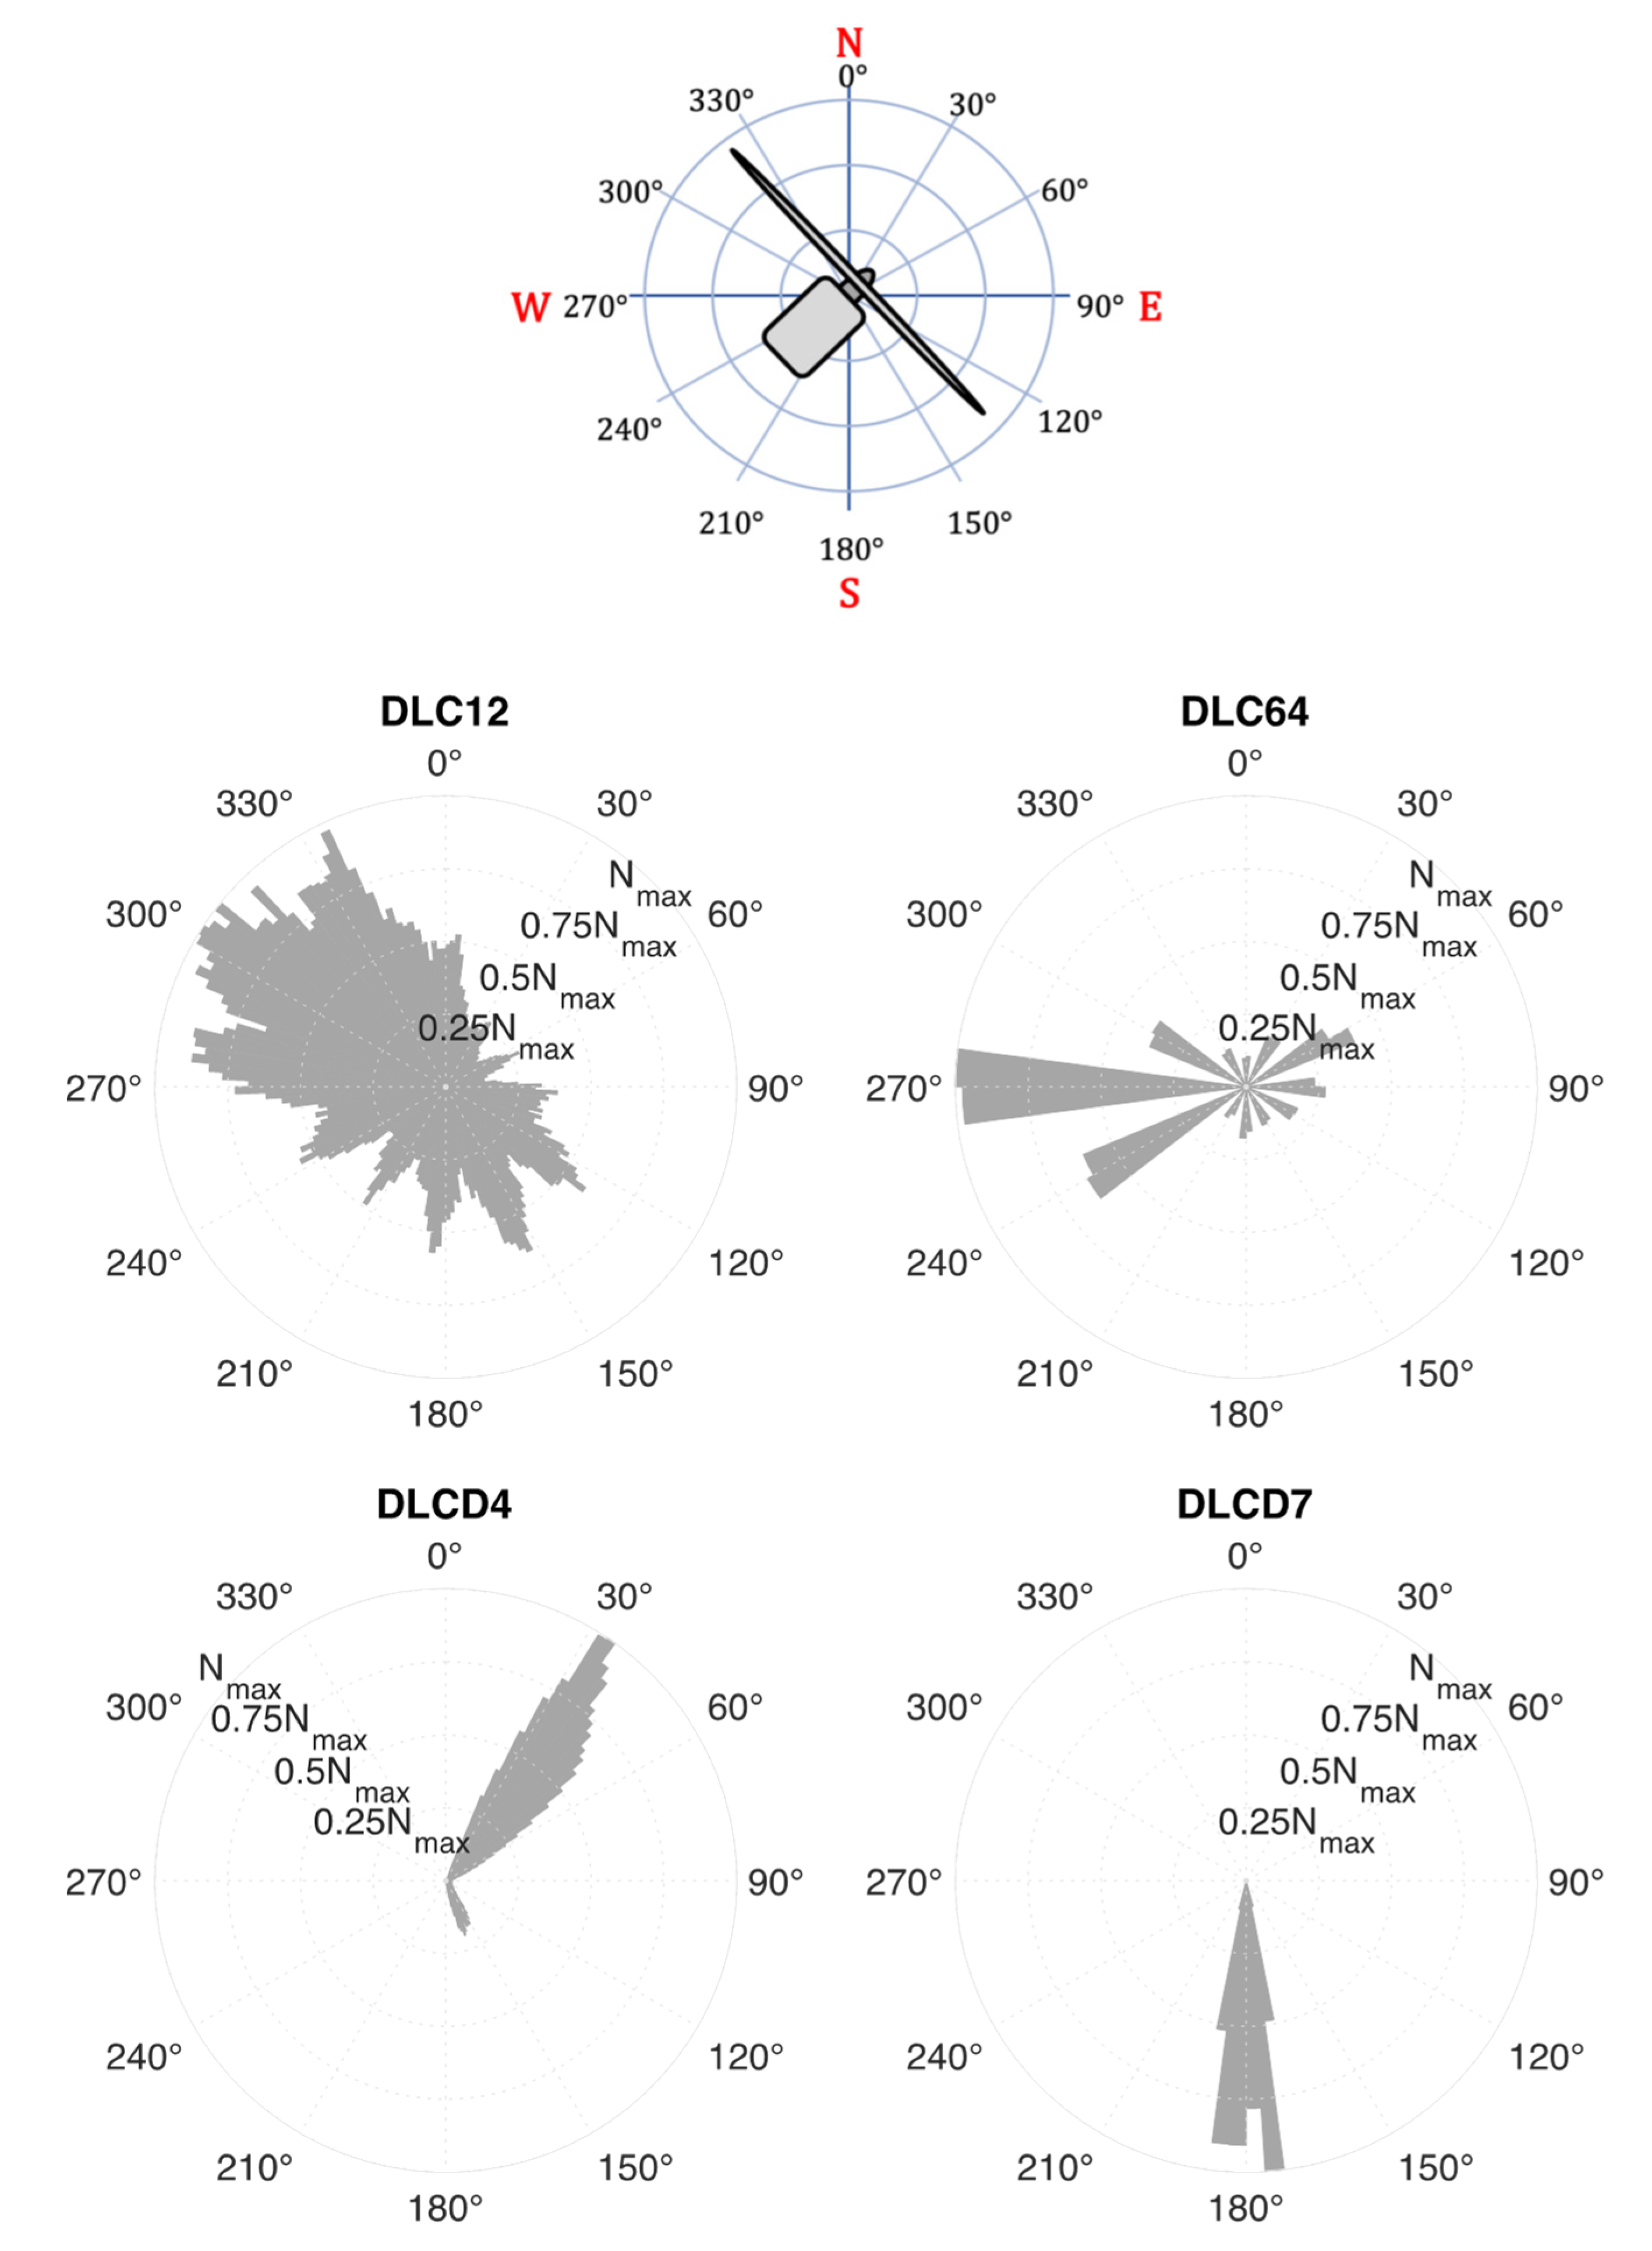
First, the data was reduced from the simulation states which do not occur. Second, the simulations are filtered to reduce the data points to relevant turning points and convert the moments into tensile and compression stresses in the structure. Third, the direction of each stress cycle is determined and weighted by the occurrence probability of the corresponding simulation, see
Figure 4.
From
Figure 4, the prevailing loading directions can be seen in addition to the number of load cycles for each DLC. Due to the predominant wind and wave direction, many cycles are created in the northwest direction within DLC12. Compared to the large number of load cycles for DLC12, the number of cycles associated with the ice load case in DLCD4 (operation) and DLCD7 (idling) is predominantly acting in one direction. This is related to the design location’s assumed ice load drift direction.
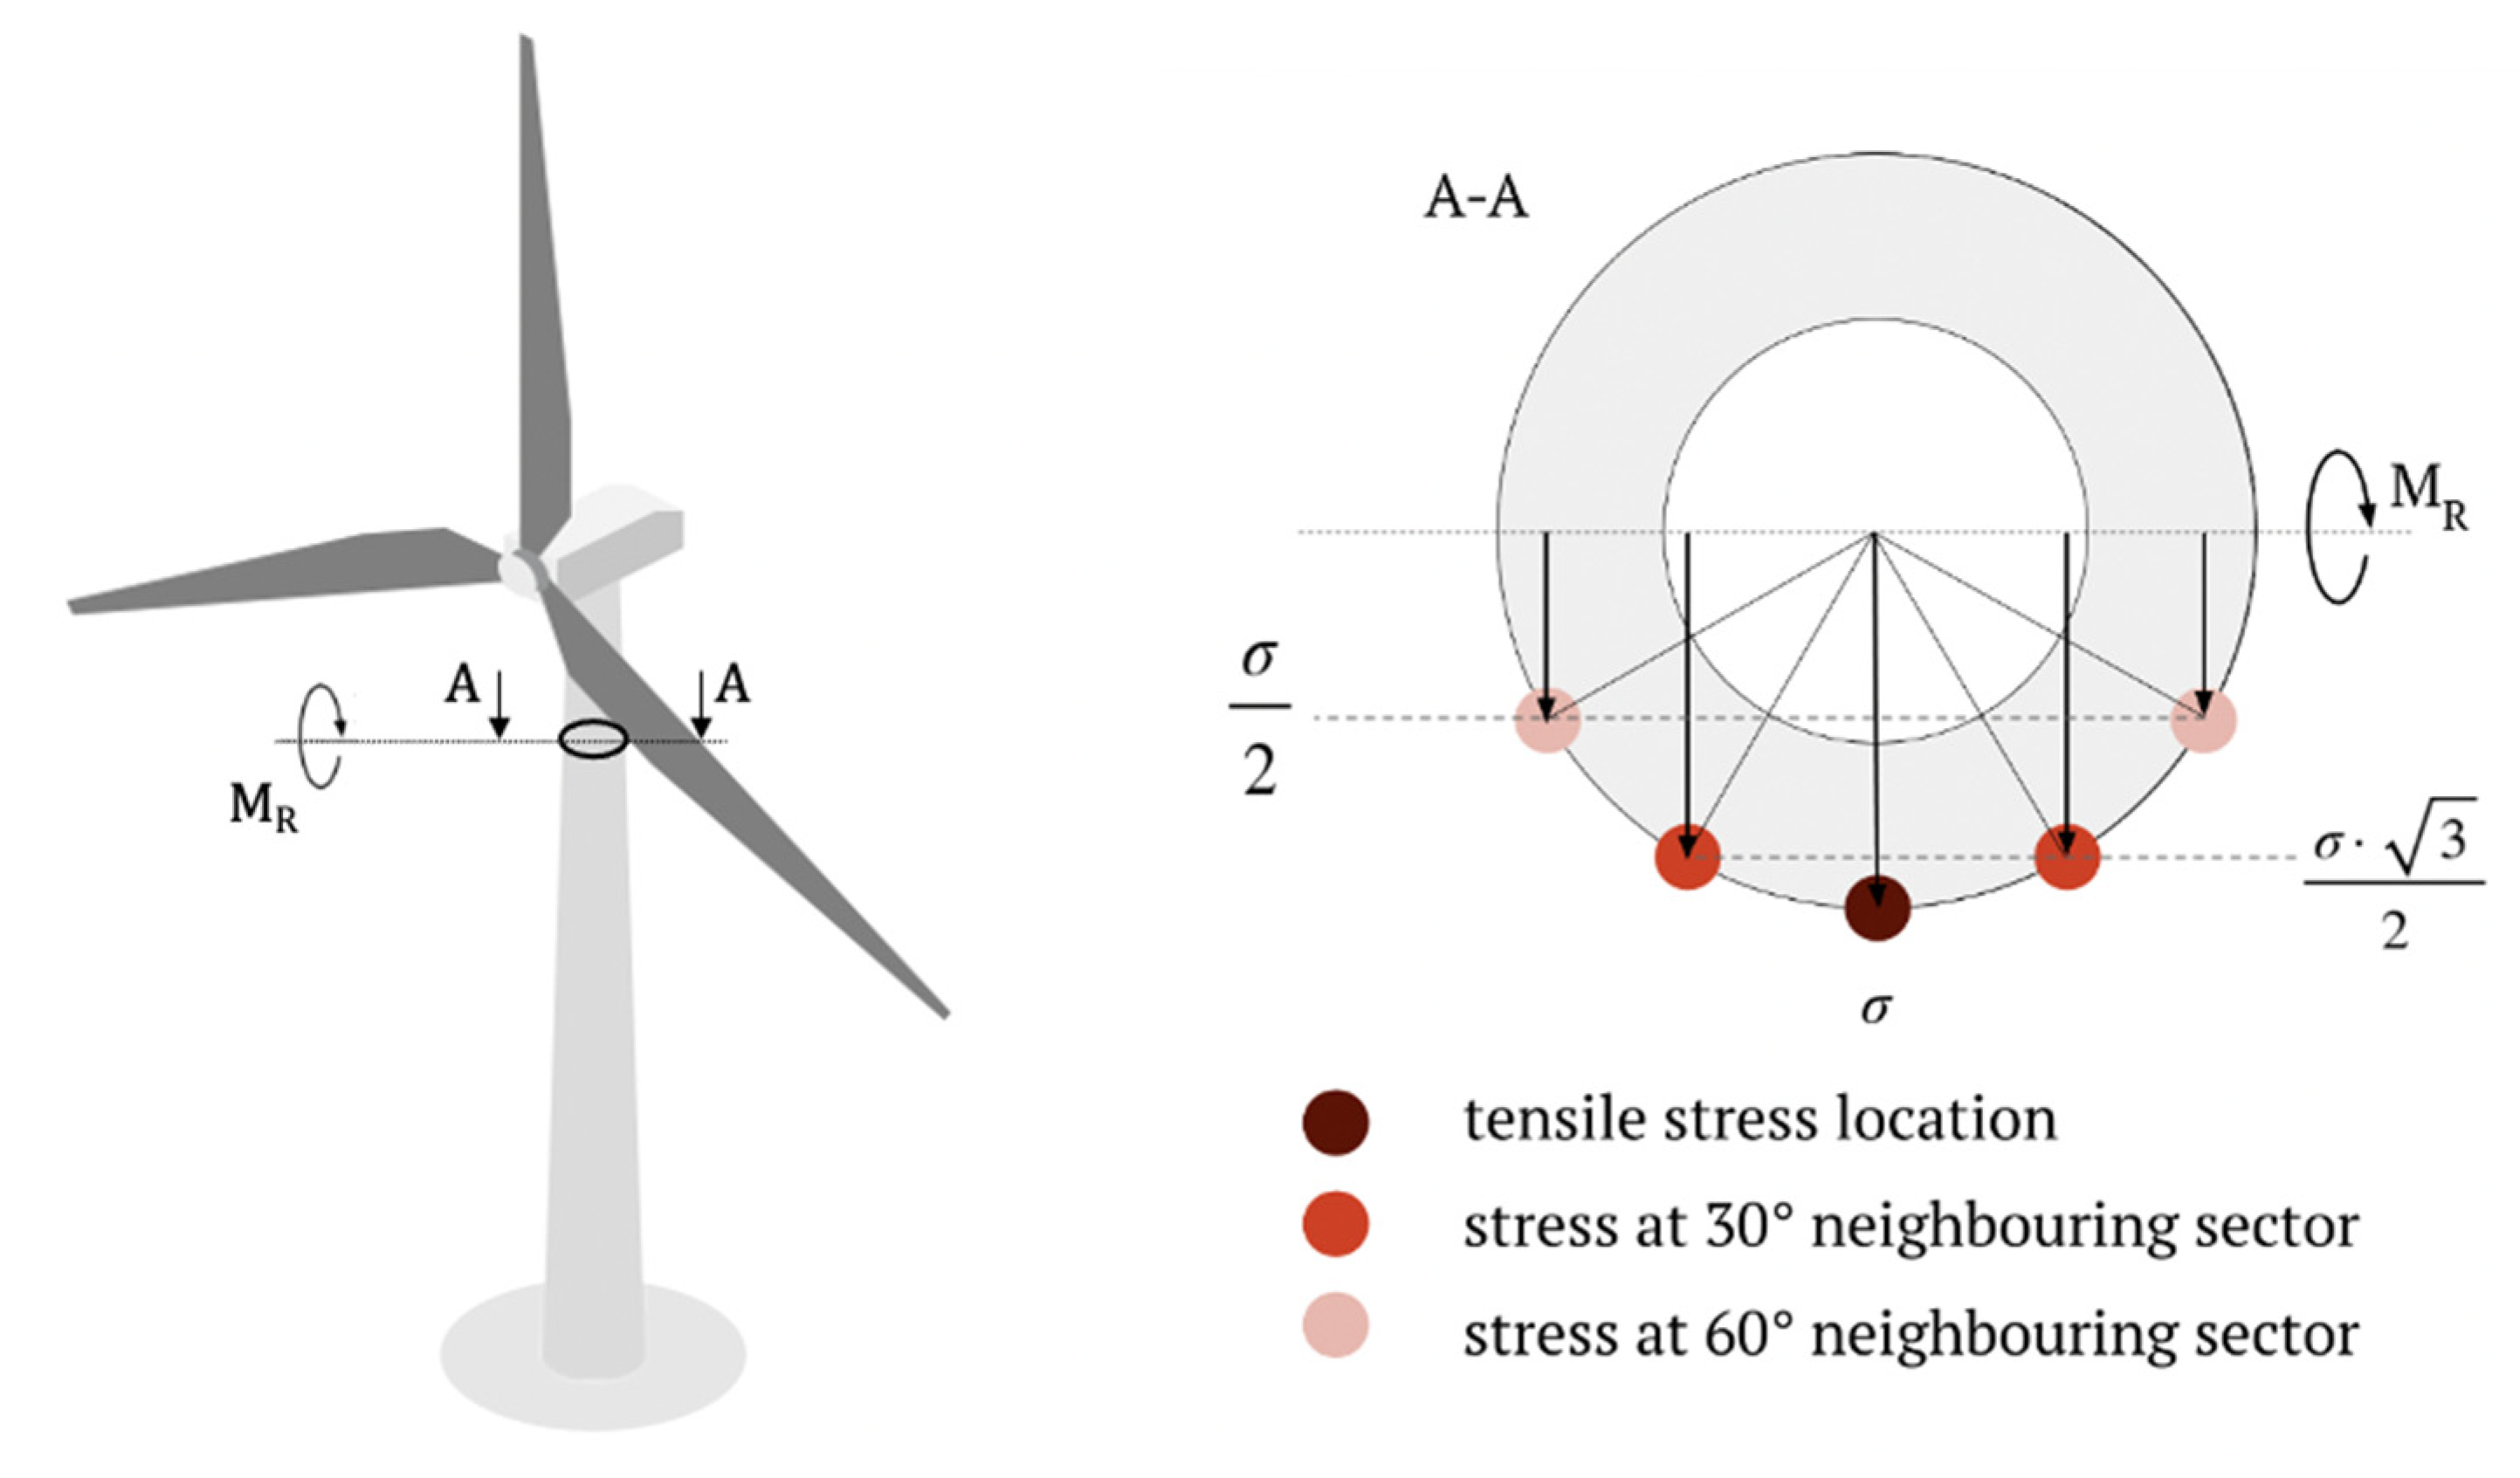
The edited load history for the twelve sectors and four load conditions are then assessed using rainflow counting according to the ASTM E1049-85(2017) [
41]. In order to find the position around the circumference of the tower with the greatest estimated fatigue damage, the loads are subsequently assessed in 30° sectors. To account for load cycles in neighboring sectors, trigonometrical relations are used to calculate the load contribution of each cycle within ±60°, see
Figure 5.
4.3. Combined Load Spectra for Wind, Wave, and Ice Action
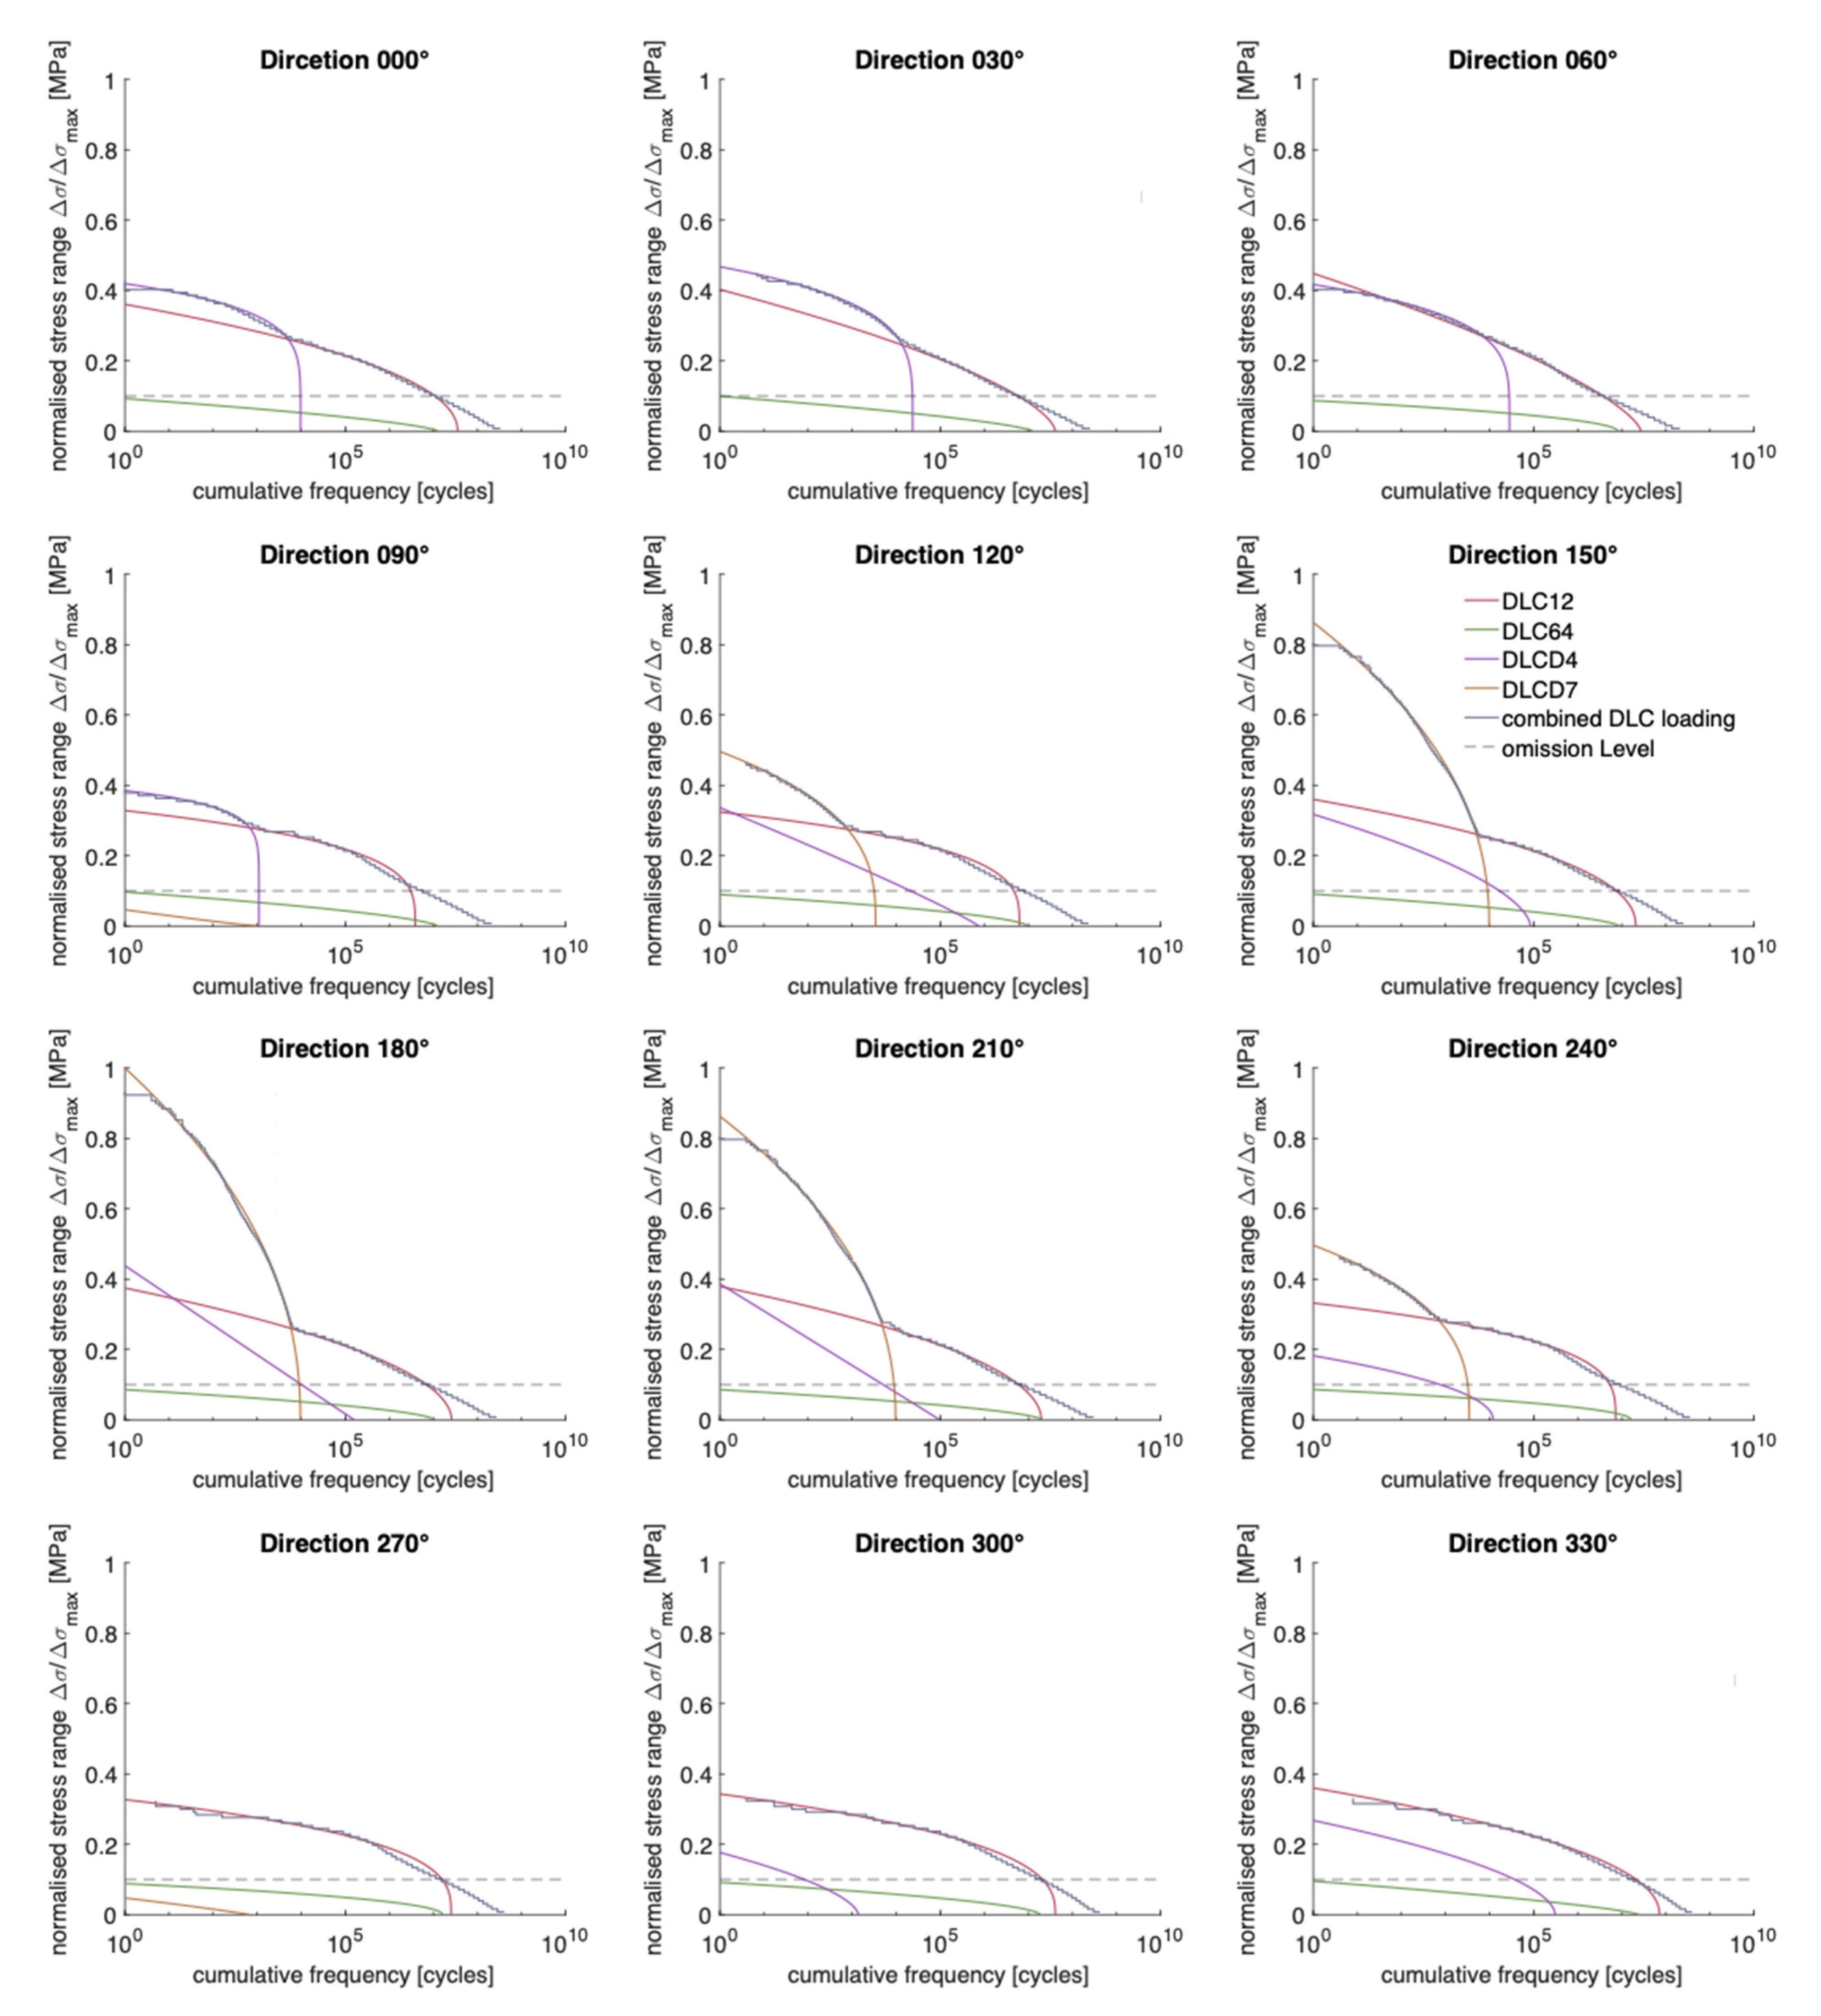
Once the stresses are distributed into 12 different positions around the circumference, CDFs of stresses can be calculated for each DLC and 30° sector. Next, the stress spectra obtained for each DLC are added up to determine combined load spectra for wind, wave, and ice action for each 30° sector. This is presented in
Figure 6 as a staircase function with 1 MPa steps.
Similar to
Figure 4, the sectors between 150° and 210° are dominated by ice loading. This can be seen from the staircase function being separated in a region with high loads and a low number of cycles and one with lower loads but a higher number of cycles. These two regions are associated with ice-loading (DLCD4 and DLCD7) and wind and wave loading (DLC12).
For visual purposes and to permit fatigue damage calculation based on closed-form solutions, the individual stress spectra for each DLC in
Figure 6 are fitted by Weibull functions. Only the parts of the stress spectra above the omission level are used for fitting to maximize accuracy in the relevant parts of the stress spectra.
It is well known that long-term geophysical processes such as stress spectra of ships and offshore structures can be approximated by Weibull functions [
43]. To enhance comparability, all stress spectra are normalized by the maximum load cycles observed during the simulated lifetime of the structure. The parameters of the Weibull functions are summarized in
Table 1. This simplification leads to some deviation from the original data; however, the fitted Weibull functions match the combined load spectra well in the regions of high loads and a high number of cycles. For fatigue testing, the superimposed combined loading can be used to create a random stress-time series; nevertheless, the fitted curves are suitable for quick damage calculations. The Weibull function has the form:
where
is the cumulative frequency of load cycles for the stress range
,
is the maximum stress range,
is the maximum number of load cycles, and
is the shape exponent of the Weibull function.
An omission level is applied to reduce the number of cycles for the S-N testing. The omission level was chosen to be 10% of the maximum stress. This significantly reduces the test duration if the stress spectra are used to determine suitable damage sums for this application. There are estimations that omission levels up to 50% of the fatigue limit do not significantly affect fatigue life under VAL [
42]; however, for welded joints, typically lower omission levels of up to 20% are applied [
16,
45,
46]. For ships and offshore structures, where a large fraction of fatigue damage is related to cycles with low amplitudes, typically lower omission levels are recommended, see Fricke et al. [
47]. They applied a level of 11% for the WASH spectrum [
48,
49]. Thus, an omission of 10% was assumed to be suitable in this study.
5. Derivation of Stress-Time Series for Fatigue Testing
In order to transfer the spectra into stress-time series that can be used for fatigue testing, random times series are required that reproduce the counted stress cycle. For this purpose, the Markov chain method is applied. This method is a stochastic method based on Markov transition matrices and is well suited to sample stress spectra from the cumulative distribution function of stationary processes like wind and wave loading [
43,
50]. It captures the probability of different stress ranges and the number of occurred transitions; see also [
49]. Based on this information, a random stochastic VAL series can be constructed. The reproduced load sequence represents upper and lower extrema which can be used as turning points for servo-hydraulic testing machines [
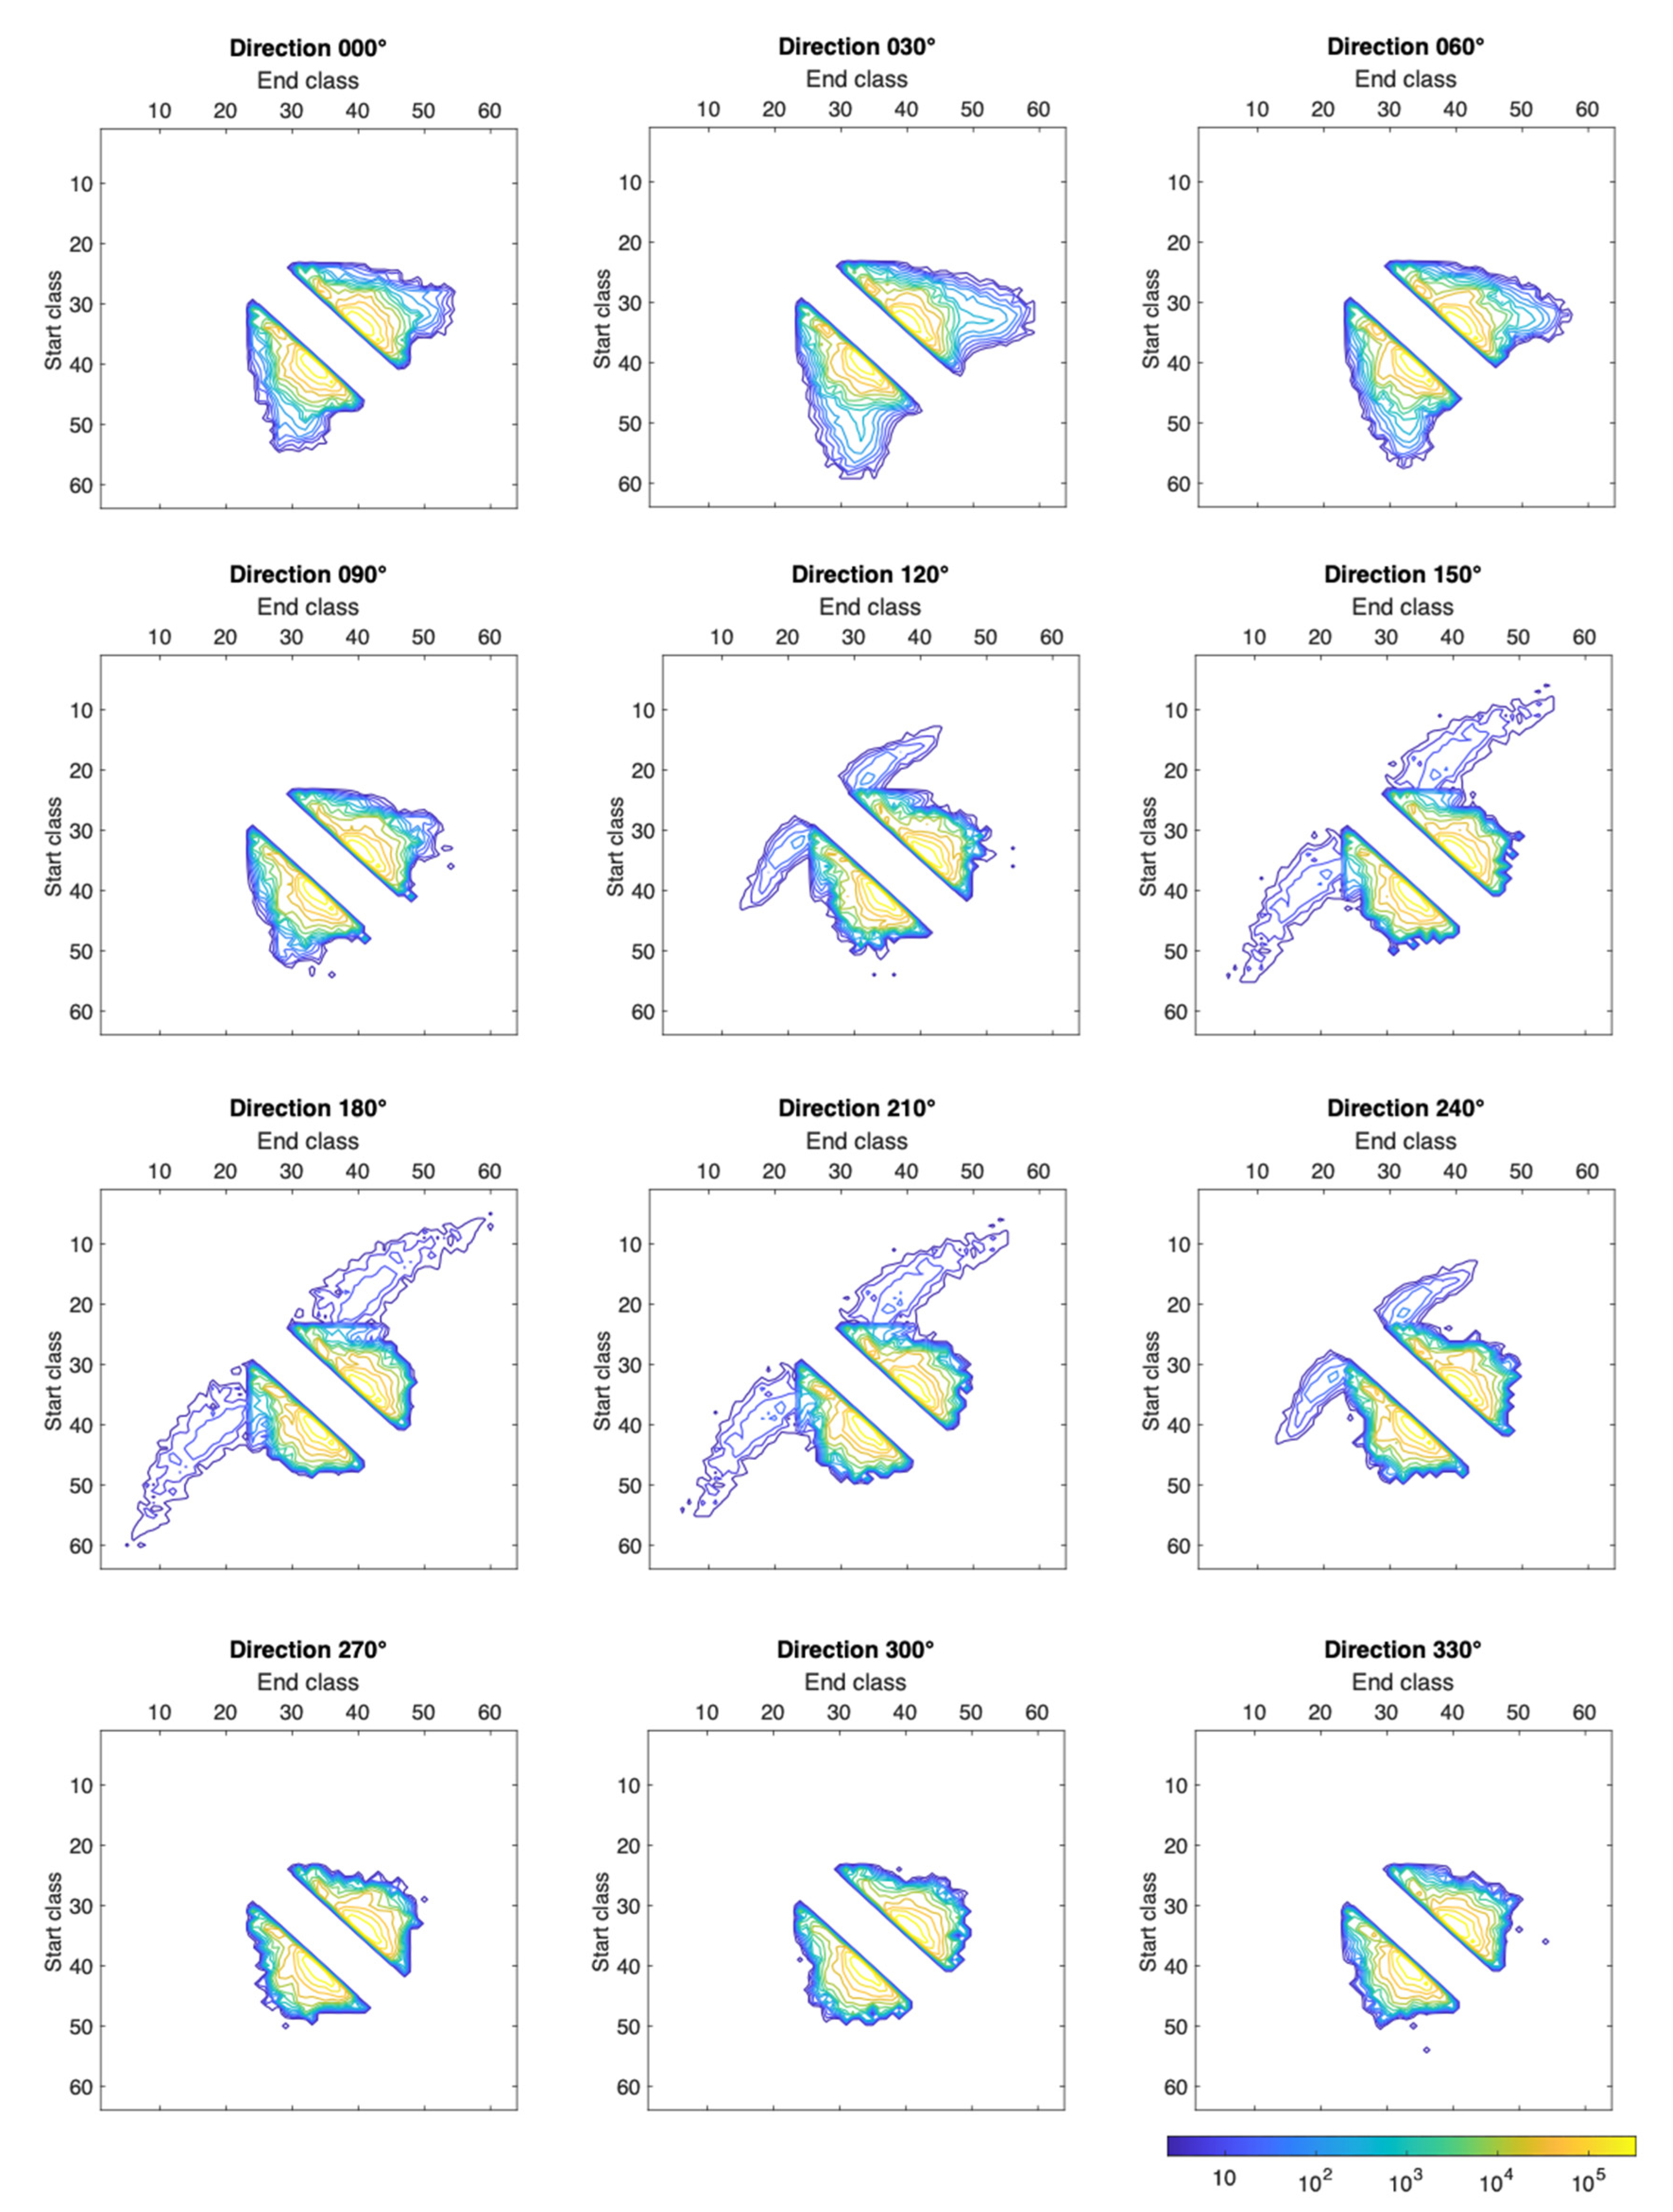
51]. The transition matrices obtained for each 30° sector are presented in
Figure 7 using 64 classes. Such matrices present distributions of stress ranges based on start class (lower stress) and end class (upper stress).
The highest and lowest stress value of all positions within all cross-sections is selected. This leads to maximum stress in class 64 of 79.64 MPa, and the lowest value in class 1 is defined as −43.67 MPa. The associated step width between the classes is consequently 1.93 MPa. The number of cycles in the figure is logarithmically scaled to ease the presentation of the turning point distribution.
Again, the ice-related cycles lead to high stresses in the structure with low occurrence probability than the frequently acting wind and wave loads. Thus, cycles related to ice loading are found along the diagonal from bottom left to top right. Interestingly, differences in transition matrices can be traced back to the two different ice DLCs. Cycles from DLCD7 (see directions 150° to 210°) show the highest ranges, e.g., from class 10 to class 50, and are located closer to the diagonal from bottom left to top right. Cycles related to DLCD4 lead to the highest stresses in the 30° sector and have higher starting classes (higher mean stress level). This is related to different ice-structure interaction processes developing for the turbine’s idling (DLCD7) and operation (DLCD4). Cycles from wind and wave loading are found close to the diagonal from top left to bottom right.
The calculated matrices include the transition counts from the simulated data, with an applied omission of 10%. Due to the applied omission, the Markov matrices do not contain values along the diagonal from top left to bottom right. The reason for applying the omission before reproducing the random series is the vast number of cycles. This also mitigates the need to remove small cycles once time series were created.
The Markov chain method then creates a discrete sequence after a probability of transferring from one state into another state. A stochastically distributed probability of an occurring state can be selected by normalizing the matrix row by row and creating a single uniformly distributed random number in the interval (0,1) used to determine the starting state. After selecting one state, the associated column chooses the next row to find the subsequent stress state. The Markov method is a commonly used technique [
51,
52,
53,
54,
55] and is also included in the international standard for VAL testing ISO 12110-1:2013 [
56].
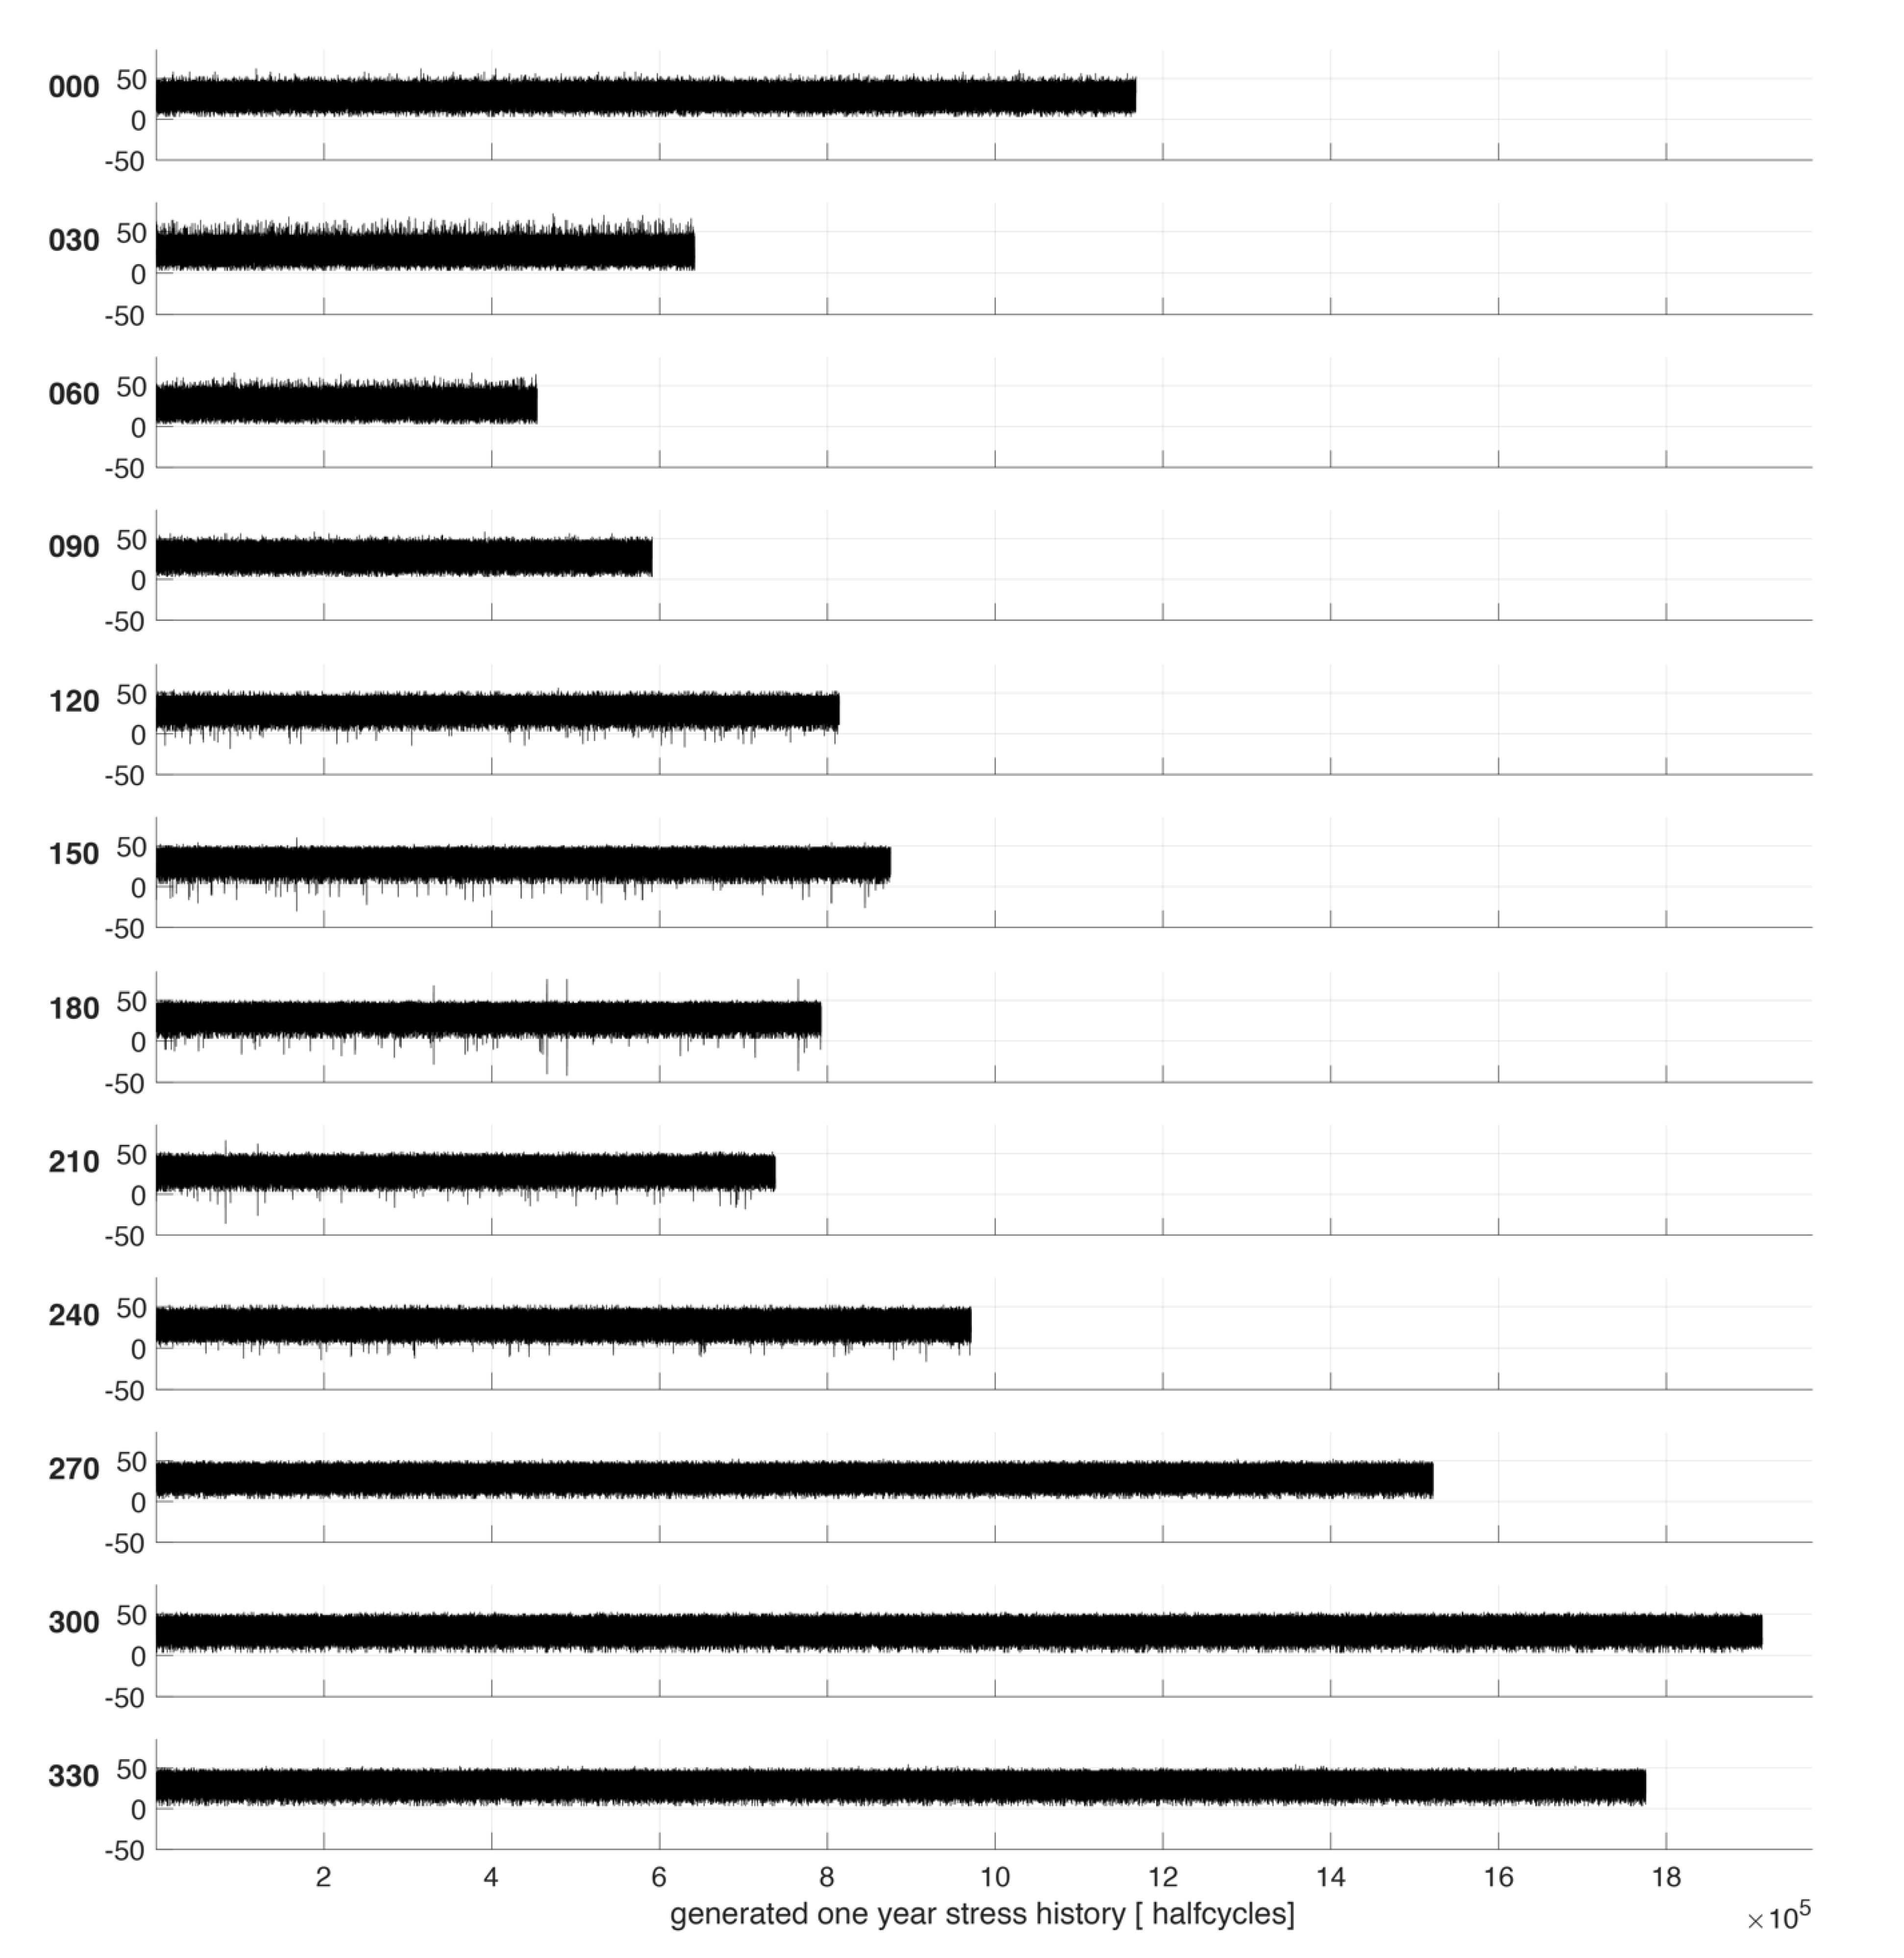
Figure 8 presents the stress-time series for one year. Therein, large ice loads are clearly visible. Furthermore, there are clear differences in length of the time series related to the prevailing wind and wave loading directions in the western to northern direction (270° to 0°). In addition, differences in mean stress levels for DLCD7 and DLCD4 lead to predominantly tensile or compressive stress peaks. For example, high tensile stress peaks are clearly visible in the stress-time series for 30°, related to DLCD4, i.e., ice loading during operation. In contrast, while idling the global structural response results in several distinct compressive load peaks in 180° direction and neighboring sectors.
In order to determine the critical loading direction, each time series has to be evaluated separately. Due to the superimposed stress spectra, it is not straightforward to determine the most critical configuration based on the length and height of a time series or spectrum.
These stress-time series could now be used for fatigue testing in order to determine suitable damage sums for combined wind, wave, and ice action. This is, however, outside of the scope of this study. The main goal of this study was to present a methodology to determine combined stress spectra and highlight differences to typical fatigue loading of OWTs, which is only related to wind and wave loading. Several important aspects for the design of OWTs for regions with seasonal ice cover and low temperatures are thus subsequently discussed.
6. Discussion
6.1. Sequence Effects of Variable Amplitude Load Sequences
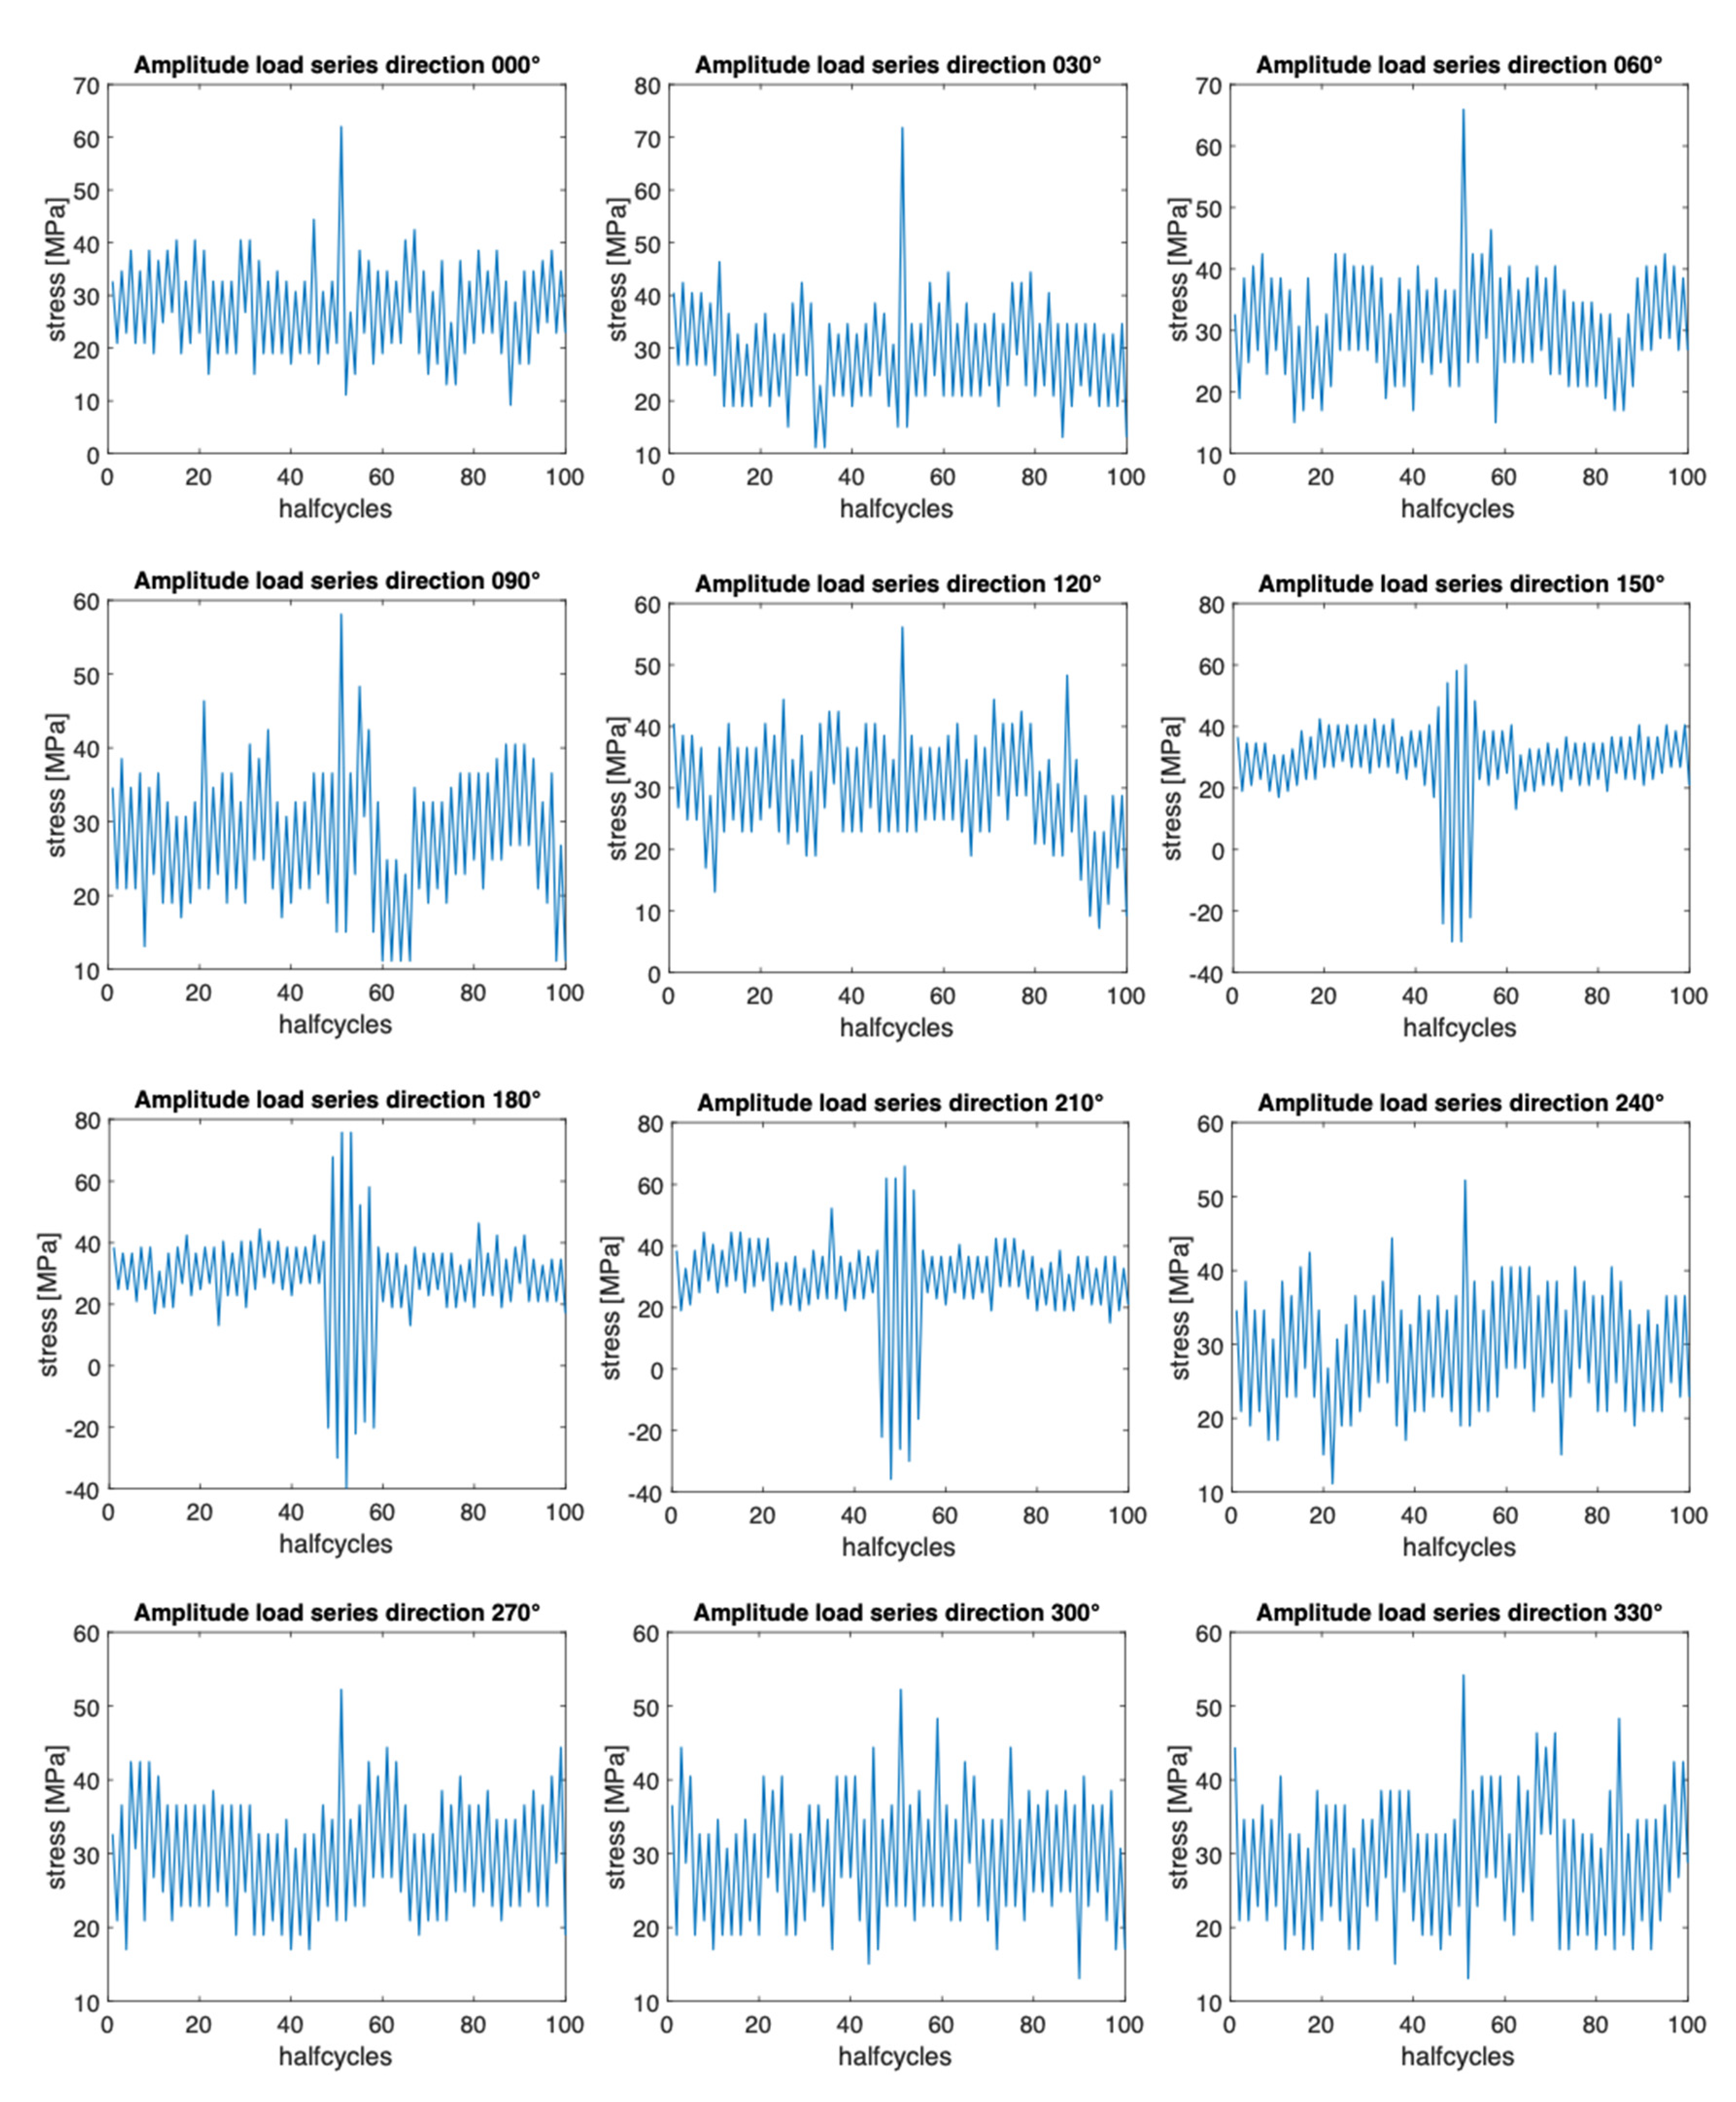
In this study, ice, wind, and wave amplitudes are randomly superimposed. This leads to an unnatural sequence of the loads, see
Figure 9. This figure presents 50 turning points before and after the maximum load simulated for each direction. Thus, pronounced ice loads are particularly visible between wind and wave-related load cycles for the direction of 150° to 210°.
Typically, ice loads are only expected during a few winter days and not randomly distributed between wind and wave cycles; nevertheless, randomly distributing loads is the typical approach to achieve conservative test results; (see [
16,
43]. The reason for this conservative approach is that the linear damage accumulation hypothesis does not account for sequence effects [
17]. Furthermore, any sequence information is lost during rainflow counting; however, this is the state-of-the-art approach to handling large loading datasets for ships and offshore structures. VAL fatigue testing is sometimes also performed using combinations of harmonic and stochastic signals in other engineering industries, see Decker [
18]. This approach is, nevertheless, currently unfeasible due to several reasons. First, data of only a few measurement campaigns are available on real ice loading, and ice-structure interaction is known to vary significantly with partially high differences in load frequency, see Nord et al. [
24]. This requires high sampling rates to determine all load contributions sufficiently, which is difficult in instrumented real structures. Second, the numerical and test basin representation of ice-structure interaction is an ongoing field of study, see [
40,
57,
58], and third, offshore structures are exposed to load cycles in the order 10
8 cycles during their lifetime. This can realistically not be applied to fatigue test specimens.
Another approach to applying realistic seasonal loading to fatigue test specimens could be successively exposing the specimens to the four load series. This could, for example, be achieved by a method proposed by Li et al. [
21]. Their idea could be adopted to ice load conditions; however, this can only be achieved without superimposing the different load conditions before generating the standardized stress-time series.
The idea of deriving a standardized load sequence with random order of loads was to derive a suitable basis for future fatigue testing of welded joints in OWTs to determine applicable damage sums and to create a basis for comparison of combined load spectra for OWTs subjected to wind, wave, and ice action. Future tests could investigate the difference between random and successive ice load events for the fatigue life of welded joints in OWTs.
6.2. Consideration of Temperature Effects on Fatigue Strength
Another important aspect of ships and offshore structures—operating in regions with seasonal ice cover—is temperature effects on material properties and, in particular, fatigue strength. There are several recent studies that observed increases in fatigue strength with decreasing temperatures, as long as the temperature remains above the ductile-brittle transition regime, see [
30,
32,
33,
34,
35,
36]. For example, at −20 °C, changes of fatigue strength of around 7% were determined from fatigue tests on different welded joints [
30]. To this day, this effect is not considered in international standards and guidelines for fatigue design; however, there are studies that present approaches to consider temperature effects during fatigue assessment by means of nominal stress or local fatigue assessment methods, see [
59,
60,
61].
This effect is of particular importance under VAL, as small changes of the fatigue limit can significantly affect the fatigue life of OWTs. The reason for this behavior is that most of the fatigue damage for an OWT is accumulated below the S-N curve knee-point of its welded joints.
7. Summary and Conclusions
This study presented the development of combined load spectra and standardized stress-time sequences for OWTs that account for wind, wave, and ice action. To this goal, the load interaction of an exemplary monopile support structure in the Baltic Sea was numerically assessed. This was achieved by simulating over 3000 different load conditions of 600 s duration for four DLCs and accounting for each scenario’s occurrence probability during the structure’s service life. From the simulations, bending moments at an exemplary location in the support structure of the OWT were determined and used to calculate stress responses.
Next, load spectra were obtained at different locations (30° sectors) around the circumference of the tower. Due to differences in prevailing loading directions, the number and magnitude of load cycles were found to vary significantly around the tower’s circumference. Based on the combined load spectra, it was possible to derive standardized stress-time sequences of one-year duration, which can be used in future studies to determine suitable damage sums for OWTs subjected to wind, wave, and ice action. For this purpose, the Markov chain method and an omission level of 10% (based on the maximum stress response) were applied. This level was found to be a good compromise between reducing the cycles and existing knowledge on suitable omission levels. From the current study, the following conclusions are obtained:
Comparing the stress-time series, it becomes apparent that the wind and wave loads dominate the length of the sequences. This phenomenon can be explained by the significantly lower occurrence probability of ice events in the southern Baltic Sea which was used for the case study. On the contrary, the highest stresses are caused by ice-structure interaction. This behavior might be different for other regions like the northern Baltic Sea.
Thus, combined stress spectra for wind, wave, and ice action on an OWT are very different from standard load spectra without ice contribution. This is because of very high ice-related load cycles that can cause overload effects similar to what is known from storm events. Applicable damage sums for such spectra should consequently be determined experimentally.
The sequence of load events is lost by rainflow counting. Thus, it is impossible to reconstruct the real-loading sequence exactly; however, the Markov chain method is a suitable tool for creating standardized random stress-time series. High ice-related loads are randomly distributed between wind- and wave-related loads, so conservative results are expected if the stress-time series is used for VAL fatigue testing.
The reported Weibull distributions can be used for comparison fur future projects and to obtain fatigue damage based on closed-form solutions once applicable damage sums are experimentally determined.
Finally, the presented methodology is suitable for different types of offshore structures and not limited to OWTs. The main requirement is a verified numerical model of the structures that accurately depict wave, wind, and ice action. The relation between the ice and non-ice load contributions will vary; yet the overall structural behavior and the methodology remain the same.
The methods and conclusions of this work can be continued by forthcoming investigation of interactions between different load conditions on OWTs in regions with seasonal ice cover. Some influences are pointed out, and a method to generate combined VAL series is elaborated. To extend the conclusions, several aspects worth investigating are mentioned. Further work will focus on determining applicable damage sums for combined wind, wave, and ice action.
Author Contributions
Conceptualization, M.B.; methodology, M.B., A.D. and K.F.t.V.; software, T.W., K.F.t.V. and A.D.; validation, T.W., H.H., M.S. and K.V.H.; investigation, M.B., A.D., K.F.t.V. and T.W.; resources, T.W.; data curation, T.W.; writing—original draft preparation, M.B. and A.D.; writing—review and editing, C.F., T.W., M.S., H.H., K.V.H. and S.E.; visualization, A.D. and K.F.t.V.; supervision, S.E.; project administration, S.E.; funding acquisition, S.E., M.B., K.V.H. and H.H. All authors have read and agreed to the published version of the manuscript.
Funding
The authors wish to acknowledge to support to the FATICE project from the MarTERA partners, the Research Council of Norway (RCN), German Federal Ministry of Economic Affairs and Energy (BMWi) through (MarTERA—FATICE (03SX465B)), the European Union through European Union’s Horizon 2020 research and innovation programme under grant agreement No 728053-MarTERA and the support of the FATICE partners.
Institutional Review Board Statement
Not applicable.
Informed Consent Statement
Not applicable.
Data Availability Statement
Restrictions apply to the availability of these data. Data was obtained from Siemens Gamesa Renewable Energy GmbH & Co. KG and are available from the corresponding author with the permission of Siemens Gamesa Renewable Energy GmbH & Co. KG.
Acknowledgments
Publishing fees supported by Funding Programme * Open Access Publishing * of Hamburg University of Technology (TUHH).
Conflicts of Interest
The authors declare no conflict of interest.
References
- Rodrigues, S.; Restrepo, C.; Kontos, E.; Teixeira Pinto, R.; Bauer, P. Trends of offshore wind projects. Renew. Sustain. Energy Rev. 2015, 49, 1114–1135. [Google Scholar] [CrossRef]
- Shi, W. Offshore Wind Turbine-Ice Interactions. In Encyclopedia of Ocean Engineering; Cui, W., Fu, S., Hu, Z., Eds.; Springer: Singapore, 2020; pp. 1–13. [Google Scholar] [CrossRef]
- Pryor, S.C.; Barthelmie, R.J. Climate change impacts on wind energy: A review. Renew. Sustain. Energy Rev. 2010, 14, 430–437. [Google Scholar] [CrossRef]
- Pryor, S.C.; Barthelmie, R.J.; Bukovsky, M.S.; Leung, L.R.; Sakaguchi, K. Climate change impacts on wind power generation. Nat. Rev. Earth Environ. 2020, 1, 627–643. [Google Scholar] [CrossRef]
- Milaković, A.-S.; Braun, M.; Willems, T.; Hendrikse, H.; Fischer, C.; Ehlers, S. Methodology for estimating offshore wind turbine fatigue life under combined loads of wind, waves and ice at sub-zero temperatures. In Proceedings of the International Conference on Ships and Offshore Structures ICSOS 2019, Cape Carnival, FL, USA, 4–8 November 2019. [Google Scholar]
- Zhou, L.; Ding, S.; Song, M.; Gao, J.; Shi, W. A Simulation of Non-Simultaneous Ice Crushing Force for Wind Turbine Towers with Large Slopes. Energies 2019, 12, 2608. [Google Scholar] [CrossRef] [Green Version]
- Von Bock und Polach, R.U.F.; Klein, M.; Kubiczek, J.; Kellner, L.; Braun, M.; Herrnring, H. State of the Art and Knowledge Gaps on Modelling Structures in Cold Regions. In Proceedings of the ASME 2019 38th International Conference on Ocean, Offshore and Arctic Engineering Glasgow, Scotland, UK, 9–14 June 2019. [Google Scholar]
- McGovern, D.J.; Bai, W. Experimental study of wave-driven impact of sea ice floes on a circular cylinder. Cold Reg. Sci. Technol. 2014, 108, 36–48. [Google Scholar] [CrossRef]
- Hou, J.; Shao, W. Structural Design for the Ice-Resistant Platform. In Proceedings of the Twenty-fourth International Ocean and Polar Engineering Conference, Busan, Korea, 15–20 June 2014. [Google Scholar]
- Shi, W.; Tan, X.; Gao, Z.; Moan, T. Numerical study of ice-induced loads and responses of a monopile-type offshore wind turbine in parked and operating conditions. Cold Reg. Sci. Technol. 2016, 123, 121–139. [Google Scholar] [CrossRef]
- Popko, W. Impact of Sea Ice Loads on Global Dynamics of Offshore Wind Turbines; Fraunhofer Verlag: Stuttgart, Germany, 2020. [Google Scholar]
- Dehghani, A.; Aslani, F. A review on defects in steel offshore structures and developed strengthening techniques. Structures 2019, 20, 635–657. [Google Scholar] [CrossRef]
- Lotsberg, I. Fatigue Design of Marine Structures; Cambridge University Press: Cambridge, UK, 2016. [Google Scholar] [CrossRef] [Green Version]
- Braun, M.; Ehlers, S. Review of methods for the high-cycle fatigue strength assessment of steel structures subjected to sub-zero temperature. Mar. Struct. 2022, 82. [Google Scholar] [CrossRef]
- Wu, X.; Hu, Y.; Li, Y.; Yang, J.; Duan, L.; Wang, T.; Adcock, T.; Jiang, Z.; Gao, Z.; Lin, Z.; et al. Foundations of offshore wind turbines: A review. Renew. Sustain. Energy Rev. 2019, 104, 379–393. [Google Scholar] [CrossRef] [Green Version]
- Sonsino, C.M. Spectrum loading effects on structural durability of components. Struct. Integr. Life 2011, 11, 157–171. [Google Scholar]
- Heim, R. Structural Durability: Methods and Concepts; Springer: Berlin/Heidelberg, Germany, 2020. [Google Scholar] [CrossRef]
- Decker, M. Vibration fatigue analysis using response spectra. Int. J. Fatigue 2021, 148. [Google Scholar] [CrossRef]
- Zhang, D.Y.; Wang, G.; Yue, Q.J. Evaluation of ice-induced fatigue life for a vertical offshore structure in the Bohai Sea. Cold Reg. Sci. Technol. 2018, 154, 103–110. [Google Scholar] [CrossRef]
- Zhang, S.; Bridges, R.; Tong, J. Fatigue Design Assessment of Ship Structures Induced by Ice Loading—An introduction to the ShipRight FDA ICE Procedure. In Proceedings of the Twenty-first International Offshore and Polar Engineering Conference, International Society of Offshore and Polar Engineers, Maui, HI, USA, 19–24 June 2011. [Google Scholar]
- Li, S.; Cui, W.; Paik, J.K. An improved procedure for generating standardised load-time histories for marine structures. Proc. Inst. Mech. Eng. Part M J. Eng. Marit. Environ. 2015, 230, 281–296. [Google Scholar] [CrossRef]
- Hesseler, J.; Baumgartner, J.; Bleicher, C. Consideration of the transient material behavior under variable amplitude loading in the fatigue assessment of nodular cast iron using the strain-life approach. Fatigue Fract. Eng. Mater. Struct. 2021, 44, 2845–2857. [Google Scholar] [CrossRef]
- Ziegler, L.; Schafhirt, S.; Scheu, M.; Muskulus, M. Effect of load sequence and weather seasonality on fatigue crack growth for monopile-based offshore wind turbines. Energy Procedia 2016, 94, 115–123. [Google Scholar] [CrossRef] [Green Version]
- Nord, T.S.; Samardžija, I.; Hendrikse, H.; Bjerkås, M.; Høyland, K.V.; Li, H. Ice-induced vibrations of the Norströmsgrund lighthouse. Cold Reg. Sci. Technol. 2018, 155, 237–251. [Google Scholar] [CrossRef]
- International Electrotechnical Commission. IEC 61400-3-1:2019, Wind Energy Generation Systems—Part 3-1: Design Requirements for Fixed Offshore Wind Turbines, 1st ed.; International Electrotechnical Commission: Geneva, Switzerland, 2019. [Google Scholar]
- DNVGL-ST-0126; Support Structures for Wind Turbines. DNV GL AS: Høvik, Norway, 2018.
- European Committee for Standardization. Petroleum and Natural Gas Industries—Arctic Offshore Structures; EN ISO 19906:2019; European Committee for Standardization: Brussels, Belgium, 2019; Volume EN ISO 19906. [Google Scholar]
- Hendrikse, H.; Nord, T.S. Dynamic response of an offshore structure interacting with an ice floe failing in crushing. Mar. Struct. 2019, 65, 271–290. [Google Scholar] [CrossRef]
- Sunder, R.; Biakov, A.; Eremin, A.; Panin, S. Synergy of crack closure, near-tip residual stress and crack-tip blunting in crack growth under periodic overloads—A fractographic study. Int. J. Fatigue 2016, 93, 18–29. [Google Scholar] [CrossRef]
- Braun, M. Assessment of Fatigue Strength of Welded Steel Joints at Sub-Zero Temperatures Based on the Micro-Structural Support Effect Hypothesis. Ph.D. Thesis, Technische Universität Hamburg, Hamburg, Germany, 2021. [Google Scholar]
- Hauge, M.; Maier, M.; Walters, C.L.; Østby, E.; Kordonets, S.M.; Zanfir, C.; Osvoll, H. Status update of ISO TC67/SC8/WG5: Materials for arctic applications. In Proceedings of the 25th International Ocean and Polar Engineering Conference, Kona, HI, USA, 21–26 June 2015. [Google Scholar]
- Walters, C.L.; Alvaro, A.; Maljaars, J. The effect of low temperatures on the fatigue crack growth of S460 structural steel. Int. J. Fatigue 2016, 82, 110–118. [Google Scholar] [CrossRef]
- Braun, M.; Milaković, A.-S.; Ehlers, S.; Kahl, A.; Willems, T.; Seidel, M.; Fischer, C. Sub-Zero Temperature Fatigue Strength of Butt-Welded Normal and High-Strength Steel Joints for Ships and Offshore Structures in Arctic Regions. In Proceedings of the ASME 2020 39th International Conference on Ocean, Offshore and Arctic Engineering, Fort Lauderdale, FL, USA, 28 June–3 July 2020. [Google Scholar]
- Braun, M.; Kahl, A.; Willems, T.; Seidel, M.; Fischer, C.; Ehlers, S. Guidance for Material Selection Based on Static and Dynamic Mechanical Properties at Sub-Zero Temperatures. J. Offshore Mech. Arct. Eng. 2021, 143, 1–45. [Google Scholar] [CrossRef]
- Braun, M.; Scheffer, R.; Fricke, W.; Ehlers, S. Fatigue strength of fillet-welded joints at subzero temperatures. Fatigue Fract. Eng. Mater. Struct. 2020, 43, 403–416. [Google Scholar] [CrossRef]
- Wang, Y.T.; Liu, J.J.; Hu, J.J.; Garbatov, Y.; Soares, C.G. Fatigue strength of EH36 steel welded joints and base material at low-temperature. Int. J. Fatigue 2021, 142. [Google Scholar] [CrossRef]
- Braun, M. Statistical analysis of sub-zero temperature effects on fatigue strength of welded joints. Weld. World 2021. [Google Scholar] [CrossRef]
- Velarde, J.; Kramhøft, C.; Sørensen, J.D. Global sensitivity analysis of offshore wind turbine foundation fatigue loads. Renew. Energy 2019, 140, 177–189. [Google Scholar] [CrossRef]
- Willems, T.; Hendrikse, H. Coupled Simulation of Ice-Structure Interaction of Offshore Wind Turbines in Bhawc Using Vanilla. In Proceedings of the 25th International Conference on Port and Ocean engineering under Arctic Conditions, Delft, The Netherlands, 9–13 June 2019. [Google Scholar]
- Høyland, K.V.; Nord, T.; Turner, J.; Hornnes, V.; Gedikli, E.D.; Bjerkås, M.; Hendrikse, H.; Hammer, T.; Ziemer, G.; Stange, T.; et al. Fatigue damage from dynamic ice action—The FATICE project. In Proceedings of the 26th International Conference on Port and Ocean Engineering under Arctic Conditions, Moscow, Russia, 14–18 June 2021. [Google Scholar]
- ASTM International. ASTM E1049-85(2017) Standard Practices for Cycle Counting in Fatigue Analysis; ASTM: West Conshohocken, PA, USA, 2017. [Google Scholar] [CrossRef]
- Heuler, P.; Seeger, T. A criterion for omission of variable amplitude loading histories. Int. J. Fatigue 1986, 8, 225–230. [Google Scholar] [CrossRef]
- Heuler, P.; Klätschke, H. Generation and use of standardised load spectra and load-time histories. Int. J. Fatigue 2005, 27, 974–990. [Google Scholar] [CrossRef]
- Wind Turbine Icon Icograms Licensed Under CC BY-NC 3.0. Available online: https://icograms.com/ (accessed on 8 December 2021).
- Sonsino, C.M. Principles of Variable Amplitude Fatigue Design and Testing; McKeighan, P.C., Ranganathan, N., Eds.; ASTM International: West Conshohocken, PA, USA, 2005; pp. 3–23. [Google Scholar] [CrossRef]
- Leitner, M.; Ottersböck, M.; Pußwald, S.; Remes, H. Fatigue strength of welded and high frequency mechanical impact (HFMI) post-treated steel joints under constant and variable amplitude loading. Eng. Struct. 2018, 163, 215–223. [Google Scholar] [CrossRef]
- Fricke, W.; von Lilienfeld-Toal, A.; Paetzold, H. Fatigue investigation of a complex ship structural detail. In Proceedings of the 2nd International Conference on Material and Component Performance under Variable Amplitude Loading, Darmstadt, Germany, 23–26 March 2009. [Google Scholar]
- Pook, L.P.; Dover, W.D. Progress in the Development of a Wave Action Standard History (WASH) for Fatigue Testing Relevant to Tubular Structures in the North Sea. In Development of Fatigue Loading Spectra; Potter, J.M., Watanabe, R.T., Eds.; ASTM International: West Conshohocken, PA, USA, 1989; pp. 99–120. [Google Scholar] [CrossRef]
- Schütz, W.; Klätschke, H.; Hück, M.; Sonsino, C.M. Standardized Load Sequence for Offshore Structures—Wash 1. Fatigue Fract. Eng. Mater. Struct. 1990, 13, 15–29. [Google Scholar] [CrossRef]
- Haibach, E.; Fischer, R.; Schütz, W.; Hück, M. A standard random load sequence of Gaussian type recommended for general application in fatigue testing; its mathematical background and digital generation. Fatigue Test. Des. 1976, 2, 29.1–29.21. [Google Scholar]
- Sonsino, C.M. Fatigue testing under variable amplitude loading. Int. J. Fatigue 2007, 29, 1080–1089. [Google Scholar] [CrossRef]
- Haibach, E. Betriebsfestigkeit: Verfahren und Daten zur Bauteilauslegung, 3rd ed.; Springer: Berlin/Heidelberg, Germany; New York, NY, USA, 2006. [Google Scholar]
- Köhler, M.; Jenne, S.; Pötter, K.; Zenner, H. Zählverfahren und Lastannahme in der Betriebsfestigkeit; Springer: Berlin/Heidelberg, Germany, 2012. [Google Scholar] [CrossRef]
- Ling, Y.; Shantz, C.; Mahadevan, S.; Sankararaman, S. Stochastic prediction of fatigue loading using real-time monitoring data. Int. J. Fatigue 2011, 33, 868–879. [Google Scholar] [CrossRef]
- Carboni, M.; Cerrini, A.; Johannesson, P.; Guidetti, M.; Beretta, S. Load spectra analysis and reconstruction for hydraulic pump components. Fatigue Fract. Eng. Mater. Struct. 2008, 31, 251–261. [Google Scholar] [CrossRef]
- International Standards Organisation. ISO 12110-1:2013(E): Metallic Materials—Fatigue Testing—Variable Amplitude Fatigue Testing—Part 1: General Principles, Test Method and Reporting Requirements; ISO: Geneva, Switzerland, 2013. [Google Scholar]
- Hendrikse, H. Ice-Induced Vibrations of Vertically Sided Offshore Structures. Ph.D. Thesis, TU Delft, Delft, The Netherlands, 2017. [Google Scholar]
- Nord, T.S.; Petersen, Ø.W.; Hendrikse, H. Stochastic subspace identification of modal parameters during ice–structure interaction. Philos. Trans. R. Soc. A Math. Phys. Eng. Sci. 2019, 377. [Google Scholar] [CrossRef] [PubMed] [Green Version]
- Braun, M.; Milaković, A.-S.; Renken, F.; Fricke, W.; Ehlers, S. Application of Local Approaches to the Assessment of Fatigue Test results obtained for Welded Joints at Sub-Zero Temperatures. Int. J. Fatigue 2020, 138, 105672. [Google Scholar] [CrossRef]
- Braun, M.; Fischer, C.; Fricke, W.; Ehlers, S. Extension of the strain energy density method for fatigue assessment of welded joints to sub-zero temperatures. Fatigue Fract. Eng. Mater. Struct. 2020, 43, 2867–2882. [Google Scholar] [CrossRef]
- Braun, M.; Milaković, A.-S.; Ehlers, S. Fatigue Assessment of Welded Joints at Sub-Zero Temperatures by means of Stress Averaging Approach. Ships Offshore Struct. 2021, 16, 216–224. [Google Scholar] [CrossRef]
| Publisher’s Note: MDPI stays neutral with regard to jurisdictional claims in published maps and institutional affiliations. |
© 2022 by the authors. Licensee MDPI, Basel, Switzerland. This article is an open access article distributed under the terms and conditions of the Creative Commons Attribution (CC BY) license (https://creativecommons.org/licenses/by/4.0/).


 ,
, 


