Article

Numerical Simulation of Magnesium Dust Dispersion and Explosion in 20 L Apparatus via an Euler–Lagrange Method

1
School of Chemical Engineering and Technology, Xi’an Jiaotong University, Xi’an 710049, China
2
Engineering Research Center, New Energy System Engineering and Equipment, Xi’an Jiaotong University, Xi’an 710049, China
3
State Key Laboratory of Multiphase Flow in Power Engineering, Xi’an Jiaotong University, Xi’an 710049, China
*
Author to whom correspondence should be addressed.
Energies 2022, 15(2), 402; https://doi.org/10.3390/en15020402
Submission received: 19 November 2021 / Revised: 14 December 2021 / Accepted: 17 December 2021 / Published: 6 January 2022
(This article belongs to the Special Issue Advances in Thermophysics of Multiphase Flow)

Abstract

:
Computational fluid dynamics (CFD) was used to investigate the explosion characteristics of a Mg/air mixture in a 20 L apparatus via an Euler–Lagrange method. Various fluid properties, namely pressure field, velocity field, turbulence intensity, and the degree of particle dispersion, were obtained and analyzed. The simulation results suggested that the best delayed ignition time was 60 ms after dust dispersion, which was consistent with the optimum delayed ignition time adopted by experimental apparatus. These results indicate that the simulated Mg particles were evenly diffused in the 20 L apparatus under the effect of the turbulence. The simulations also reveal that the pressure development in the explosion system can be divided into the pressure rising stage, the maximum pressure stage, and pressure attenuation stage. The relative error of the maximum explosion pressure between the simulation and the experiments is approximately 1.04%. The explosion model provides reliable and useful information for investigating Mg explosions.

Graphical Abstract

1. Introduction

In recent years, the problems of pollution and energy have attracted a lot of attention around the world. Hydrogen (H2) has advantages including high reserves, low pollution, and reproducibility, and it is gradually becoming an important clean energy. However, H2 has high flammability, which can leads to a risk of fire and explosion during storage and transportation. Therefore, the safe use of H2 is of high importance [1,2,3,4,5,6]. Magnesium (Mg) is an important H2 storage material because it has a high H2 storage capacity [7,8]. However, Mg also carries a high risk of explosion [9]. Many serious industrial accidents have occurred due to explosions caused by Mg or Mg mixed with H2 [10,11]. To prevent explosions, many previous studies have investigated Mg explosion behavior via explosion experiments [12,13,14]. However, explosion experiments have high operational hazards, and fluid behavior is difficult to observe in experiments. Therefore, the computational fluid dynamics (CFD) method is used in this study to investigate the characteristics of Mg explosion.
More specifically, a pioneering modelling study was published in [15], and simulation results have shown that the particle diameter [16] and size [17,18] affect the dust distribution inside the explosion vessel and, thus, the explosion parameters. In addition, the passage through the dispersion system may affect the integrity of dust particles and, thus, the particle size distribution [19]. Vizcaya et al. used CFD to simulate the explosion characteristics of dust with various physical properties in a 20 L apparatus. The results revealed that the explosion exhibited a high reproducibility when delayed ignition time was set to 60–80 ms [20]. Li et al. investigated the influence of different levels of injection pressure on the dispersion of methane/coal mixtures in a 20 L apparatus through CFD simulations. The results showed that a higher injection pressure led to a better fluid dispersion, resulting in the coal dust particles reaching their best dispersion state in a short time [21]. Both Li (2020) and Portarapillo (2020) used an Euler–Lagrange method to individually investigate the dust explosion characteristics of cornstarch and niacin. To reduce the calculation amounts, a particle parcel was used to decrease the number of particles. The turbulence model adopted was the standard k-ε model. Both of their models indicated good fit between the simulation and the experimental data for the curves of the explosion pressure [22,23]. Therefore, these models are suitable for simulating dust explosions.
However, the CFD simulation of a Mg explosion has rarely been explored via an Euler–Lagrange method in the previous literature. Moreover, the fluid characteristics, namely the particles’ velocity and turbulence intensity during dust dispersion, are difficult to obtain through experiments. These characteristics are useful for revealing the spatiotemporal evolution of the dust explosion. Therefore, this study developed a three-dimensional (3D) explosion model of a Mg/air mixture and of pure air via an Euler–Lagrange method based on a standard 20 L apparatus, which revealed the particle’s dispersion behavior before ignition, as well as the explosion characteristics and combustion products after ignition. The explosion experimental data and simulation results were compared in order to examine the reliability of model. The results can be used to provide a rapid evaluation of explosion risk in industrial contexts and to improve the devices used in explosion experiments.

2. Materials and Methods

2.1. Explosion Experiments via 20 L Apparatus

ASTM E1226 was used for determining the explosion characteristics of Mg/air mixtures. Mg powders were purchased from Sinopharm (Jinshan, Shanghai, China). The purity of Mg was over 99.5%. The average diameter (D50) of Mg particles was 75 μm, and particle size analysis is shown in Figure 1. The experimental data were measured via a standard 20 L apparatus (Jilin Hongyuan; Changchun, Jilin, China), as depicted in Figure 2. In total, 5 g of Mg and 2 MPa air was loaded into dust container. Subsequently, the 20 L container was evacuated to 0.04 MPa. At the beginning of the experiment, the pneumatic valve between dust container and 20 L container was opened. Mg powder was introduced into the 20 L container through rebound nozzle. The delayed ignition time was set to 60 ms. The ignition energy was 2 kJ. The maximum explosion pressure (Pmax) and maximum explosion pressure rise rate [(dP/dt)max] versus time were automatically recorded by the control system. The experimental data were compared with the simulations to examine the reliability of the model.

2.2. Geometric Model

ANSYS Workbench 6.0 software was used to develop the 3D geometric model of the 20 L apparatus, which included the sphere structure, spray nozzle, and dust container, as displayed in Figure 3. Table 1 displays the main physical and kinetic parameters for simulation.

2.3. Meshing

The developed 3D geometric model was meshed using an unstructured grid. Because the location of the inlet and spray nozzle experienced a high flow velocity and pressure gradient, it was treated using adaptive mesh refinement based on the pressure gradient. Figure 4 displays the meshing results (a) before and (b) after adaptive mesh refinement. The grid sensitivity was studied using total grid numbers of 999,065, 1,263,581, and 1,463,910. These three total grid numbers were denoted coarse grid, medium grid, and fine grid, respectively. Further increases in grid numbers resulted in a negligible change in the simulation results.

2.4. Control Equation and Numerical Method

2.4.1. Gas-Phase Model

The CFD simulations of the gas phase followed the mass, kinetic, and energy conservations laws [21,26]. The mass conservation of the gas phase can be given as
ρ t + x i ( ρ u i ) = S m
where the subscript “i” indicates the coordinate direction; ρ, t, and ui refer to gas density (kg/m3), time (s), and gas velocity (m/s), respectively; and Sm refers to mass source term (kg/m3·s) due to the reaction of oxygen and Mg.
The relationship between the mass source term Sm and the burning rate of Mg Rf can be given as
S m = W O 2 W F R f
where WF and WO are the fuel molecular weight (%) and oxygen molecular weight (%), respectively.
The momentum conservation of gas phase is given as
t ( ρ u i ) + x i ( ρ u i u j ) = P x j + x j μ ( u i x j + u j x i ) x i ( ρ u i u j ¯ ) + ρ g i + S v
where P is pressure (Pa), μ is gas viscosity (Pa·s), gi is gravitational acceleration (N/kg), Sv is the momentum source term (N/m3) caused by gas-solid force, and ρ u i u j ¯ refers to Reynolds stresses (N/m3).
The momentum source term Sv can be obtained by
S v = i = 1 i = N ( m p F D ( u u p ) + V p g ( ρ p ρ ) ) i
The first term and second term on the right-hand side of Equation (4) represent drag force and buoyancy force per particle. In Equation (4), N is the particle number per unit volume, ρ p is density of the particles (kg/m3), and mp (kg) and Vp (m3) are, respectively, the mass and volume of particles.
According to the Boussinesq hypothesis, the Reynolds stresses term ρ u i u j ¯   is written as
ρ u i u j ¯ = μ t ( u i x j + u j x i ) 2 3 ( ρ k + μ t u k x k ) δ i j
where k (J) refers to the turbulence kinetic energy, and μ t   ( Pa · s ) is the turbulent viscosity. Both turbulence kinetic energy k and turbulent viscosity μ t need to be closed by the turbulence model.
The energy conservation of the gas phase can be given as
t ( ρ C p T ) + x i ( ρ C p u i T ) = x i ( λ + C p μ t P r t ) T x j + S h
where Cp refers to gas specific heat (J/kg·K), T is gas temperature (K), λ is gas thermal conductivity (W/m·K), µt is the turbulent viscosity (Pa·s), Prt (dimensionless) is the Prandtl number of turbulence, and Sh is the energy source term (W·m−3) [27].

2.4.2. K-ε Turbulence Model

The standard k-ε model was adopted. The turbulence kinetic energy transport equation and turbulence dissipation rate transport equation are individually given, according to [28], as
( ρ k ) t + ( ρ k u i ) x i = x j [ ( μ + μ t σ k ) k x j ] + G k + G b ρ ε Y M
( ρ ε ) t + ( ρ ε u i ) x i = x j [ ( μ + μ t σ ε ) ε x j ] + C 1 ε ε k ( G k + C 3 ε G b ) C 2 ε ρ ε 2 k
The turbulent viscosity   μ t is calculated by combining k and ε as follows:
μ t = ρ C μ k 2 ε
where, Gk (J/(m3·s)), Gb (J/(m3·s)), and YM (J/(m3·s)) refer to the turbulent kinetic energy induced by the average velocity gradient, the turbulent kinetic energy induced by the buoyancy, and the influence on the diffusion rate due to the turbulence expansion, respectively; C1ε, C2ε, C3ε, and Cµ (dimensionless) are empirical constants (C1ε = 1.44, C2ε = 1.92, C3ε = −0.373 and Cµ = 0.09); σk, and σε (dimensionless) are the turbulent Prandtl numbers for k and ε (σk = 1.0, σε = 1.3), respectively.

2.4.3. Particle-Phase Model

An Euler–Lagrange method was used to solve the dispersion and explosion of Mg particles in the 20 L apparatus. The fluid phase served as the continuous phase, and N-S equations were developed for solving the flow, heat transfer, and reaction characteristics in the Euler coordinate. Moreover, Newton’s second law was used to describe the whole discrete particle field by solving the kinetic trajectory of each discrete particle in the Lagrange coordinate. The interaction of the continuous and discrete phases had to follow Newton’s third law.
The motion of particles followed the following equations:
d u p t = F D ( u u p ) + g ( ρ p ρ ) ρ p + F
F D = 18 μ ρ p d p 2 C D R e 24
C D = a 1 + a 2 R e + a 3 R e 2
R e = ρ d p | u p u | μ
where, d u p t denotes the inertial force on each particle, F (N) refers to additional forces including pressure gradient force, Magnus lift force, virtual mass force, and Saffman lift force. In the gas-solid flow, F is approximately regarded as zero. u p is particle velocity (m/s), µ gas dynamic viscosity (kg/m), ρ p is particle density (kg/m), d p is particle diameter (m), C D is drag coefficient (dimensionless), R e is particle Reynolds number (dimensionless), and a 1 , a 2 , a 3 are empirical constants (dimensionless) that apply over several ranges of R e given by Morsi and Alexander [29,30].

2.4.4. Species Transport Model

Because the chemical reaction of Mg/air mixtures involves an explosion, which is violent and complex, the numerical simulation needs considerable amounts of calculation time during the solving process. Therefore, this reaction was considered to be one irreversible step, which means 2Mg + O2 → 2MgO. The finite rate model (FRM) was used to calculate the source term of the chemical reaction using Arrhenius chemical kinetics. The effect of turbulent fluctuation can be ignored in this model. FRM offers a high calculation accuracy for turbulent flame.
Furthermore, due to the strong nonlinearity in the source term of the chemical reaction, the use of the traditional Reynolds-averaged closure method would not close all the source terms. Therefore, the mean species mass fractions, temperature, and density were used for directly calculating source terms using FRM.
Moreover, one further assumption was needed: the reaction rate followed the activation collision theory of molecules, and the chemical reaction rate was an exponential function of temperature. The FRM can be given as [27]:
R f = A ρ p ( α + β ) W F 1 α W O β Y F α Y O β e x p ( E R T )
where YF (%) and YO (%) are fuel mass fraction and oxygen mass fraction, respectively; α and β (dimensionless) are the stoichiometric factor constants of fuel and oxygen, respectively; R is the gas constant [R = 8.314 (Pa·m3·mol−1·K−1)].
Conservation equations for chemical species were used. The conservation of gas can be given as
t ( ρ Y i ) + · ( ρ v Y i ) = · ( ρ J i Y i ) + R i + S i
where Yi, Ri, and Si indicate the local mass fraction of each species, the net rate of production of species i by chemical reaction (mentioned above), and the rate of creation by addition from the dispersed phase plus any user-defined sources, respectively [27,31]. (The gas phase is composed of 22% oxygen and 78% nitrogen.)
The species equation of particles was directly tracked based on the chemical reactions. The mass of particles was calculated by
d m p d t = n = 1 N s R s , n
where R s , n is the reaction speed of species n.
The mass fraction of species n (Xn) is:
d X n d t = 1 m p ( R s , n X n n = 1 N s R s , n )
To capture the shrinkage of Mg particles during gasification, the model assumed that the density of Mg particles was constant. During the combustion reaction, the diameter of the particles decreased and the particles remained spherical [32].
Other conditions for simulation are illustrated as follows:
(1)
Mg particles were spherical and regular in shape;
(2)
The initial pressure of the 20 L apparatus and of the dust bin were −0.6 barg and 20 barg, respectively;
(3)
Initial temperature was set to 298 K;
(4)
All boundary condition functioned as the wall without slide;
(5)
Semi-Implicit Method for Pressure Linked Equations, SIMPLE, was developed for solving discrete process.

3. Results

3.1. Grid Sensitivity Studies

Figure 5 displays the simulation of pressure distribution after the pure air at 2 MPa pressure was introduced to the 20 L container from the dust container using the coarse grid, medium grid, and fine grid. The selected range of parameters were located at the center point of sphere. The pressure values calculated by coarse grid, medium grid, and fine grid were 1.01 × 10⁴ Pa, 1.05 × 10⁴ Pa, and 1.07 × 10⁴ Pa, respectively; the relative errors between simulations and experimental data were 7.5%, 4.7%, and 1.9%, respectively; the calculation times were 3 h, 8 h, and 48 h, respectively. Although fine grid posed the lowest relative error, it took too much time. To consider computational efficiency and cost, the medium grid was used for calculation. Figure 5 displays the pressure profile between simulations and experimental data for pure air using the medium grid.

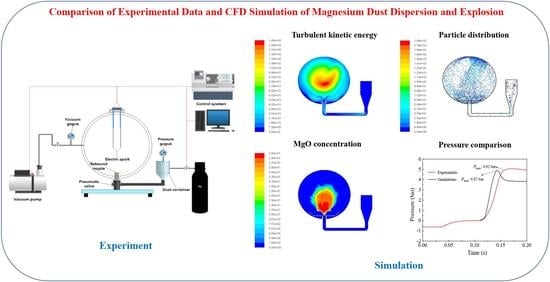
3.2. Dispersion Simulation of Dust–Air Mixtures

Figure 6 shows (a) the velocity and (b) the magnitude of velocity vector of each particle profile for the Mg/air mixture during the dispersion process. The results indicate that when the fluid was introduced into the sphere from the dust container, the flow velocity was very fast in the initial stage. Because the 20 L container was evacuated to negative pressure before dispersion, the fluid rapidly diffused and reached a maximum velocity after dispersion. When the dispersion time reached 60 ms, the flow velocity at the location of the spray nozzle reached 0 m/s, and the velocity vector moved up. This suggests that all fluid came into the sphere. Subsequently, the fluid moved down because it underwent the effects of gravity and pressure difference. Vortex gradually formed, which increased the flow velocity in location of spray nozzle.
Figure 7 displays the (a) turbulence kinetic energy of the Mg/air mixture, (b) turbulence kinetic energy of pure air, and (c) magnitude of particle position and velocity distribution during the dispersion process. The results reveal that the location of the spray nozzle exhibited a considerably high turbulence kinetic energy in the feeding stage when the Mg/air mixture was introduced to the sphere. Simultaneously, the turbulence kinetic energy in the center of the sphere was almost zero. When the dispersion time reached 60 ms, turbulence kinetic energy was evenly distributed inside the sphere, and the maximum turbulence kinetic energy appeared at the center of the sphere. The ignitor was located in the center of the sphere, and Pmax occurred in a strong and uniform turbulence kinetic energy. Pmax refers to the most serious consequence of Mg dust explosions. Therefore, 60 ms is the best ignition time. Moreover, in contrast to the distribution of turbulence kinetic energy for pure air at the center of the sphere at 60 ms, the distribution of the Mg/air mixture was spread toward the bottom section of sphere. Therefore, the addition of particles can notably affect the distribution of the turbulence kinetic energy on fluid, thereby affecting the explosion results.
In summary, the particle’s dispersion characteristics were divided into three stages. When the dispersion time reached 0–40 ms (feeding stage), Mg/air mixture came into the upper section of sphere because the fluid underwent a strong drag force from the rising airflow. When the time reached 41–70 ms, the fluid evenly distributed in inside of the sphere due to the effect of turbulence. After 71 ms, because the effect of own gravity increased, the fluid moved toward the bottom section of sphere. It is worthwhile mentioning that the simulation results support the ASTM E1226 method’s suggestion of a 60 ms delay in ignition time. The time point of 60 ms is in the narrow range in which the particles were evenly distributed in the sphere.

3.3. Explosion Simulation of Dust–Air Mixture

Figure 8 depicts the explosion pressure profile after ignition for the 250 g/m3 Mg/air mixture. Figure 9 is the comparison of experimental data and simulation of explosion for 250 g/m3 Mg. The explosion pressure profile of the Mg/air mixture exhibited a trend of increase-highest-decrease. A Pmax of 4.73 × 10⁵ Pa appeared at 40 ms. The simulations are slightly smaller than the experimental data. The relative error is 1.02%. Because model assumptions and simplifications can result in the ineluctable calculation error, this value is acceptable. However, in the simulation, the explosion profile reached a Pmax and then immediately descended, which considerably differed from the experimental data. The simulation found that when explosion pressure increased, high pressures forced the gas or particle to go back into the pipe and dust container. In fact, it is possible to rapidly close the pneumatic valve between the dust container and sphere after the Mg/air mixture is introduced into sphere. The gas or particle’s return was not obvious. Therefore, the wall boundary condition at the location of the pneumatic valve should be a main concern for increasing calculation accuracy.
Figure 10 shows MgO generation after ignition for the 250 g/m3 Mg/air mixture. After ignition, MgO formed in the center of the sphere, and the center’s temperature reached 2500 °C. Subsequently, this temperature can trigger the unreacted Mg oxidation, to form considerable amounts of MgO until the complete consumption of oxidant or Mg.

4. Conclusions

This study investigated the dynamic evolution of pressure, velocity, turbulence kinetic energy, and combustion products for Mg/air explosions via an Euler–Lagrange method. The results illustrate that the simulation fitted the experimental data. Because the particles’ velocity and turbulence conditions constitute a critical factor affecting explosion experiments under different scales, the results are useful for improving explosion devices and for revealing the explosion mechanism. In future studies, the flame behavior of the Mg/air mixture explosion can be explored in different initial condition of oxygen concentration, ignition temperature, and particle size. Moreover, CFD combined with deep learning, molecular dynamics, and uncertainty analysis can be used for increasing calculation accuracy. The main findings are illustrated as follows:
(1)
When gas and particles came into the sphere, the pressure and mass differences caused them to move downwards, and then the vortex formed. When delay ignition time reached 60 ms, the particles were evenly distributed in the sphere. Therefore, 60 ms is the optimum delay ignition time for the Mg/air explosion. This is in line with the delay ignition time as suggested in the ASTM E1226 method.
(2)
The explosion simulation indicated that the explosion pressure profile went through an increase-highest-decrease trend. Moreover, the simulation favorably agreed with the experimental data, and the relative error was approximately 1.02%. Therefore, the developed model is reliable for further investigating the explosion mechanism of the Mg/Air mixture.

Author Contributions

Investigation, T.F.; data curation, Y.-T.T.; writing—original draft preparation, T.F. and Y.-T.T.; writing—review and editing, Q.Z.; supervision, Q.Z.; funding acquisition, Q.Z. All authors have read and agreed to the published version of the manuscript.

Funding

This project was supported by National Natural Science Foundation of China (Grant Nos. 2180–8180) and the Fundamental Research Funds for the Central Universities (Grant No. xyz012019034).

Conflicts of Interest

The authors declare no conflict of interest.

References

  1. Zhang, F.; Zhao, P.; Niu, M.; Maddy, J. The survey of key technologies in hydrogen energy storage. Int. J. Hydrogen Energy 2016, 41, 14535–14552. [Google Scholar] [CrossRef]
  2. Guo, H.; Yang, H.H. Current status and future prospect of research on solid-state hydrogen storage material. New Chem. Mater. 2016, 44, 19–21. [Google Scholar]
  3. Yang, M.; Wang, S.; Zhang, Y.; Han, B.; Wu, J.; Cheng, H. Current status and future prospects of research on hydrogen storage materials. J. Chin. Ceram. Soc. 2011, 39, 1053–1060. [Google Scholar]
  4. Li, Y.; Bi, M.; Li, B.; Zhou, Y.; Gao, W. Effects of hydrogen and initial pressure on flame characteristics and explosion pressure of methane/hydrogen fuels. Fuel 2018, 233, 269–282. [Google Scholar] [CrossRef]
  5. Zheng, X.; Xu, K.; Wang, Y.; Wang, Q. Hydrogen inhibition method for preventing hydrogen explosion accident in wet dust removal systems. Int. J. Hydrogen Energy 2019, 44, 17195–17201. [Google Scholar] [CrossRef]
  6. Salzano, E.; Cammarota, F.; Benedetto, A.D.; Sarli, V.D. Explosion behavior of hydrogen–methane/air mixtures. J. Loss Prevent. Proc. 2012, 25, 443–447. [Google Scholar] [CrossRef]
  7. Potapov, S.N.; Gvozdkov, I.A.; Belyaev, V.A.; Verbetsky, V.N.; Mitrokhin, S.V. Magnesium hydride based hydrogen chemical source: Development and application perspectives. Int. J. Hydrogen Energy 2019, 44, 28578–28585. [Google Scholar] [CrossRef]
  8. Schlapbach, L.; Züttel, A. Hydrogen-storage materials for Mobile Applications. Nature 2001, 414, 353–358. [Google Scholar] [CrossRef]
  9. Chen, J.; Hu, S.Q.; Hu, L.S.; Ren, R.; Huang, F. Experimental study on minimum ignition temperature and suppression technology of magnesium dust cloud. Sci. Technol. Eng. 2015, 15, 96–100. [Google Scholar]
  10. Wei, J.; Wen, L.Q. Numerical simulation of explosion characteristics of gas and coal dust mixture. J. North Univ. China 2015, 36, 208–213. [Google Scholar]
  11. Li, R.Z. Numerical simulation of coal dust explosion induced by gas explosion. Explos. Shock Waves 2010, 30, 529–534. [Google Scholar]
  12. Tsai, Y.T.; Ho, S.C.; Huang, A.C.; Shu, C.M. Potential explosion hazard of polyester resin dust formed from a granulation process: Limiting oxygen concentration with different pressures. Appl. Therm. Eng. 2018, 135, 74–82. [Google Scholar] [CrossRef]
  13. Tsai, Y.T.; Yang, Y.; Huang, H.C.; Shu, C.M. Inhibitory effects of three chemical dust suppressants on nitrocellulose dust cloud explosion. AIChE J. 2020, 66, e16888. [Google Scholar] [CrossRef]
  14. Tsai, Y.; Huang, G.; Zhao, J.; Shu, C. Dust cloud explosion characteristics and mechanisms in MgH2-based hydrogen storage materials. AIChE J. 2021, 67, e17302. [Google Scholar] [CrossRef]
  15. Benedetto, A.D.; Russo, P.; Sanchirico, R.; Sarli, V.D. CFD simulations of turbulent fluid flow and dust dispersion in the 20 liter explosion vessel. AIChE J. 2013, 59, 2485–2496. [Google Scholar] [CrossRef]
  16. Sarli, V.D.; Russo, P.; Sanchirico, R.; Benedetto, A.D. CFD simulations of dust dispersion in the 20 L vessel: Effect of nominal dust concentration. J. Loss Prevent. Proc. 2014, 27, 8–12. [Google Scholar] [CrossRef]
  17. Sarli, V.D.; Russo, P.; Sanchirico, R.; Benedetto, A.D. CFD simulations of the effect of dust diameter on the dispersion in the 20 L bomb. Chem. Eng. Tran. 2013, 31, 727–732. [Google Scholar]
  18. Portarapillo, M.; Sarli, V.D.; Sanchirico, R.; Benedetto, A.D. CFD simulation of the dispersion of binary dust mixtures in the 20 L vessel. J. Loss Prevent. Proc. 2020, 67, 104231. [Google Scholar] [CrossRef]
  19. Sanchirico, R.; Sarli, V.D.; Russo, P.; Benedetto, A.D. Effect of the nozzle type on the integrity of dust particles in standard explosion tests. Powder Technol. 2015, 279, 203–208. [Google Scholar] [CrossRef]
  20. Vizcaya, D.; Pinilla, A.; Amín, M.; Ratkovich, N.; Munoz, F.; Murillo, C.; Bardin-Monnier, N.; Dufaud, O. CFD as an approach to understand flammable dust 20 L standard test: Effect of the ignition time on the fluid flow. AIChE J. 2018, 64, 42–54. [Google Scholar] [CrossRef]
  21. Li, H.; Deng, J.; Chen, X.; Shu, C.M.; Kuo, C.H.; Hu, X. Influence of ignition delay on explosion severities of the methane–coal particle hybrid mixture at elevated injection pressures. Powder Technol. 2020, 367, 860–876. [Google Scholar] [CrossRef]
  22. Li, H.; Chen, X.; Deng, J.; Shu, C.M.; Kuo, C.H.; Yu, Y.; Hu, X. CFD analysis and experimental study on the effect of oxygen level, particle size, and dust concentration on the flame evolution characteristics and explosion severity of cornstarch dust cloud deflagration in a spherical chamber. Powder Technol. 2020, 372, 585–599. [Google Scholar] [CrossRef]
  23. Murillo, C.; Bardin-Monnier, N.; Blanchard, C.; Funfschilling, D.; Munoz, F.; Ratkovich, N.; Vizcaya, D.; Dufaud, O. CFD to improve the repeatability and accuracy of dust explosion tests in the 20-liters sphere. Chem. Eng. Tran. 2016, 48, 115–120. [Google Scholar]
  24. Tsai, Y.-T.; Fu, T.; Zhou, Q. Explosion characteristics and suppression of hybrid Mg/H2 mixtures. Int. J. Hydrogen Energy 2021, 46, 38934. [Google Scholar] [CrossRef]
  25. Kashireninov, O.E.; Kuznetsov, V.A.; Manelis, G.B. Kinetics of alkaline-earth atoms reactions with molecular oxygen. AIAA J. 1977, 15, 860–876. [Google Scholar] [CrossRef]
  26. Liu, M.; Yang, M.; Chen, M.; Yu, D.; Zheng, J.; Chang, J.; Wang, X.; Ji, C.; Wei, Y. Numerical optimization of membrane module design and operation for a full-scale submerged MBR by computational fluid dynamics. Bioresour. Technol. 2018, 269, 300–308. [Google Scholar] [CrossRef]
  27. ANSYS Inc. ANSYS Fluent Theory Guide; Release-15.0; ANSYS Inc.: Canonsburg, PA, USA, 2015; Volume 15317, pp. 1–759. [Google Scholar]
  28. Shih, T.H.; Liou, W.W.; Shabbir, A.; Yang, Z.; Zhu, J. A new k-ϵ eddy viscosity model for high reynolds number turbulent flows. Comput. Fluids 1995, 24, 1035. [Google Scholar] [CrossRef]
  29. Li, H.; Deng, J.; Shu, C.M.; Kuo, C.H.; Yu, Y.; Hu, X. Flame behaviours and deflagration severities of aluminium powder–air mixture in a 20-L sphere: Computational fluid dynamics modelling and experimental validation. Fuel 2020, 276, 118028. [Google Scholar] [CrossRef]
  30. Morsi, S.A.; Alexander, A.J. An investigation of particle trajectories in two-phase flow systems. J. Fluid Mech. 1972, 55, 193–208. [Google Scholar] [CrossRef]
  31. Yu, J.; Lu, L.; Gao, X.; Xu, Y.; Shahnam, M.; Rogers, W.A. Coupling reduced-order modeling and coarse-grained CFD-DEM to accelerate coal gasifier simulation and optimization. AIChE J. 2021, 67, e17030. [Google Scholar] [CrossRef]
  32. Xu, T.; Chen, Q.; Zhang, B.; Lu, S.; Mo, D.; Zhang, Z.; Gao, X. Effects of electric field on micro-scale flame properties of biobutanol fuel. Sci. Rep. 2016, 6, 32938. [Google Scholar] [CrossRef] [PubMed] [Green Version]
Figure 1. Particle size distribution of Mg.
Energies 15 00402 g001
Figure 2. Schematic diagram of 20 L apparatus [24].
Energies 15 00402 g002
Figure 3. 3D geometric model for (a) appearance of 20 L apparatus and (b) rebound nozzle.
Energies 15 00402 g003
Figure 4. Meshing results (a) before and (b) after adaptive mesh refinement.
Energies 15 00402 g004
Figure 5. Pressure profile between simulations and experimental data for pure air using medium grid.
Energies 15 00402 g005
Figure 6. (a) Velocity and (b) magnitude of velocity vector of each particle profile for 250 g/m3 Mg/air mixture during dispersion process.
Energies 15 00402 g006
Figure 7. (a) Turbulence kinetic energy of Mg/air mixture, (b) turbulence kinetic energy of pure air, and (c) magnitude of particle position and velocity distribution during dispersion process.
Energies 15 00402 g007
Figure 8. Explosion pressure profile after ignition for 250 g/m3 Mg/air mixture.
Energies 15 00402 g008
Figure 9. Comparison of experimental data and simulation of explosion for 250 g/m3 Mg/air mixture.
Energies 15 00402 g009
Figure 10. MgO generation after ignition for 250 g/m3.
Energies 15 00402 g010
Table 1. Main physical parameters and kinetic parameters for simulation [25].
ParameterValueUnit
Particle diameter75μm
Particle density1738kg/m3
Particle dynamic viscosity1.72 × 10−5P·s
Gas density1.29kg/m3
Gas dynamic viscosity1.79 × 10−5P·s
Apparent activation energy (E)16.0kcal/mol
Pre-exponential factor (A)2.1 × 10⁸m3/mol·s
Publisher’s Note: MDPI stays neutral with regard to jurisdictional claims in published maps and institutional affiliations.

