In this section of the article, data obtained from the laboratory research are presented and analyzed. Ten different grouts concentrations were prepared for both thermal conductivity coefficient (λ) and strength tests. The additive contents used in tested cement-basal dust mixes were 0%; 1%; 2.5%; 5%; 7.5%; 10%; 20%; 30%; 40% and 50% BWOC (by weight of cement). For thermal response tests and both strengths, five samples were made for each concentration of basalt dust. For concentrations in which significant differences in either strength or thermal conductivity values occurred, additional tests were performed. The updated data obtained after additional tests were introduced. Additional tests were performed for concentrations where there was too much variation in results. The “results” section includes updated data.
3.1. Thermal Conductivity Test
Table 5,
Table 6 and
Table 7 and
Figure 9,
Figure 10 and
Figure 11 summarize the average values of the thermal conductivity coefficient and contain the results obtained for basalt dust A for water–mix ratios 0.5, 0.6 and 0.7, respectively. Similarly, results for basalt dust B are included in
Table 8,
Table 9 and
Table 10 and
Figure 12,
Figure 13 and
Figure 14 for water–mix ratios 0.5, 0.6 and 0.7. The thermal conductivity coefficient values in
Figure 9,
Figure 10 and
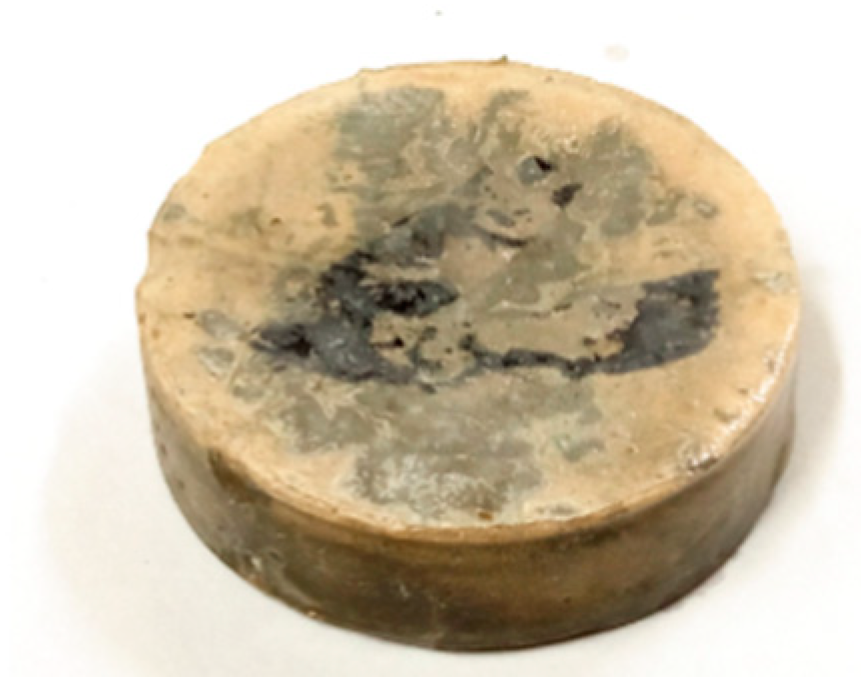
Figure 11 are presented to 3 decimal places. For the purpose of testing the thermal conductivity coefficient, about 280 disks were made and tested.
Table 5.
Average thermal conductivity for basalt dust A for all samples for water −mix ratio = 0.5.
Table 5.
Average thermal conductivity for basalt dust A for all samples for water −mix ratio = 0.5.
| | |
|---|
| | Statistics |
| Minimum | 0.571 |
| Maximum | 0.721 |
| Median | 0.600 |
| Average | 0.606 |
| Standard deviation | 0.042 |
| The range of variation | 0.146 |
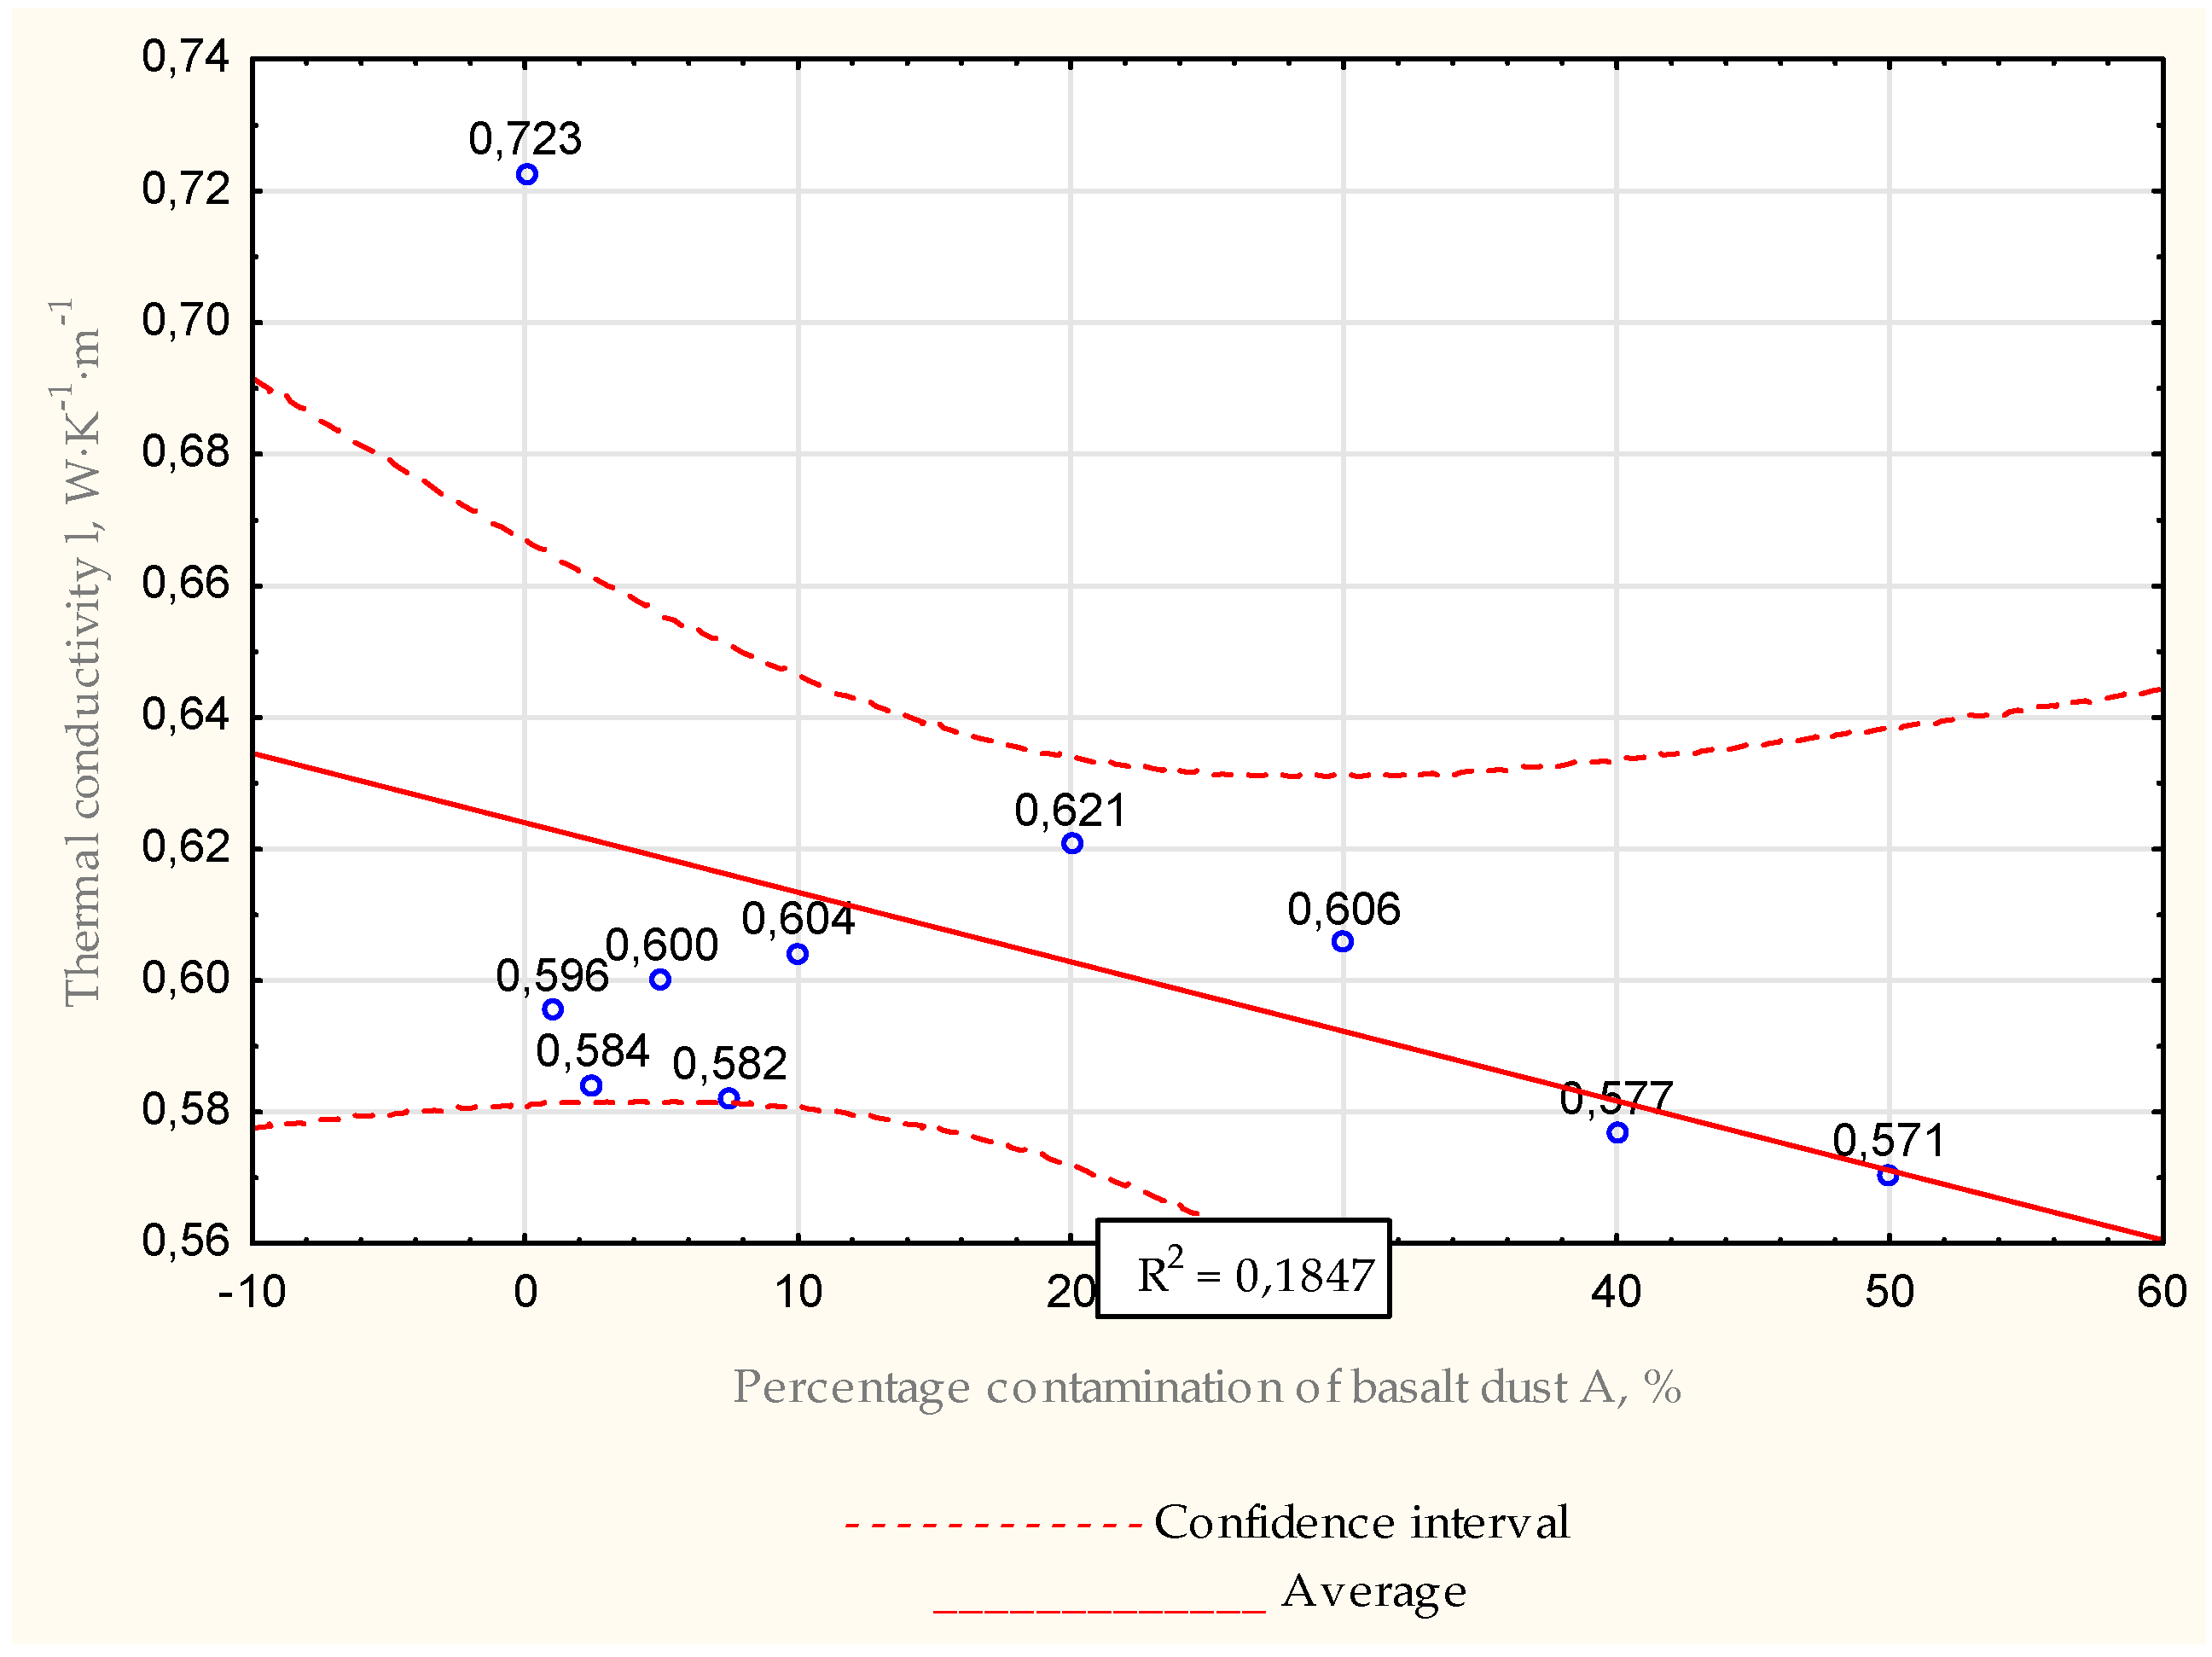
Figure 9.
Average thermal conductivity for basalt dust A for water −mix ratio = 0.5.
Figure 9.
Average thermal conductivity for basalt dust A for water −mix ratio = 0.5.
As can be seen in
Figure 9, all samples containing basalt dust A as an additive had lower thermal conductivity values than the zero sample. The lowest value was obtained for the slurry with 50% dust content. In this case, the thermal conductivity value was about 21% lower than that of the zero sample. For remaining grout mixtures, values were lower by about 14% to 20%.
Table 6.
Average thermal conductivity for basalt dust A for all samples for water −mix ratio = 0.6.
Table 6.
Average thermal conductivity for basalt dust A for all samples for water −mix ratio = 0.6.
| | |
|---|
| | Statistics |
| Minimum | 0.497 |
| Maximum | 0.721 |
| Median | 0.616 |
| Average | 0.618 |
| Standard deviation | 0.063 |
| The range of variation | 0.225 |
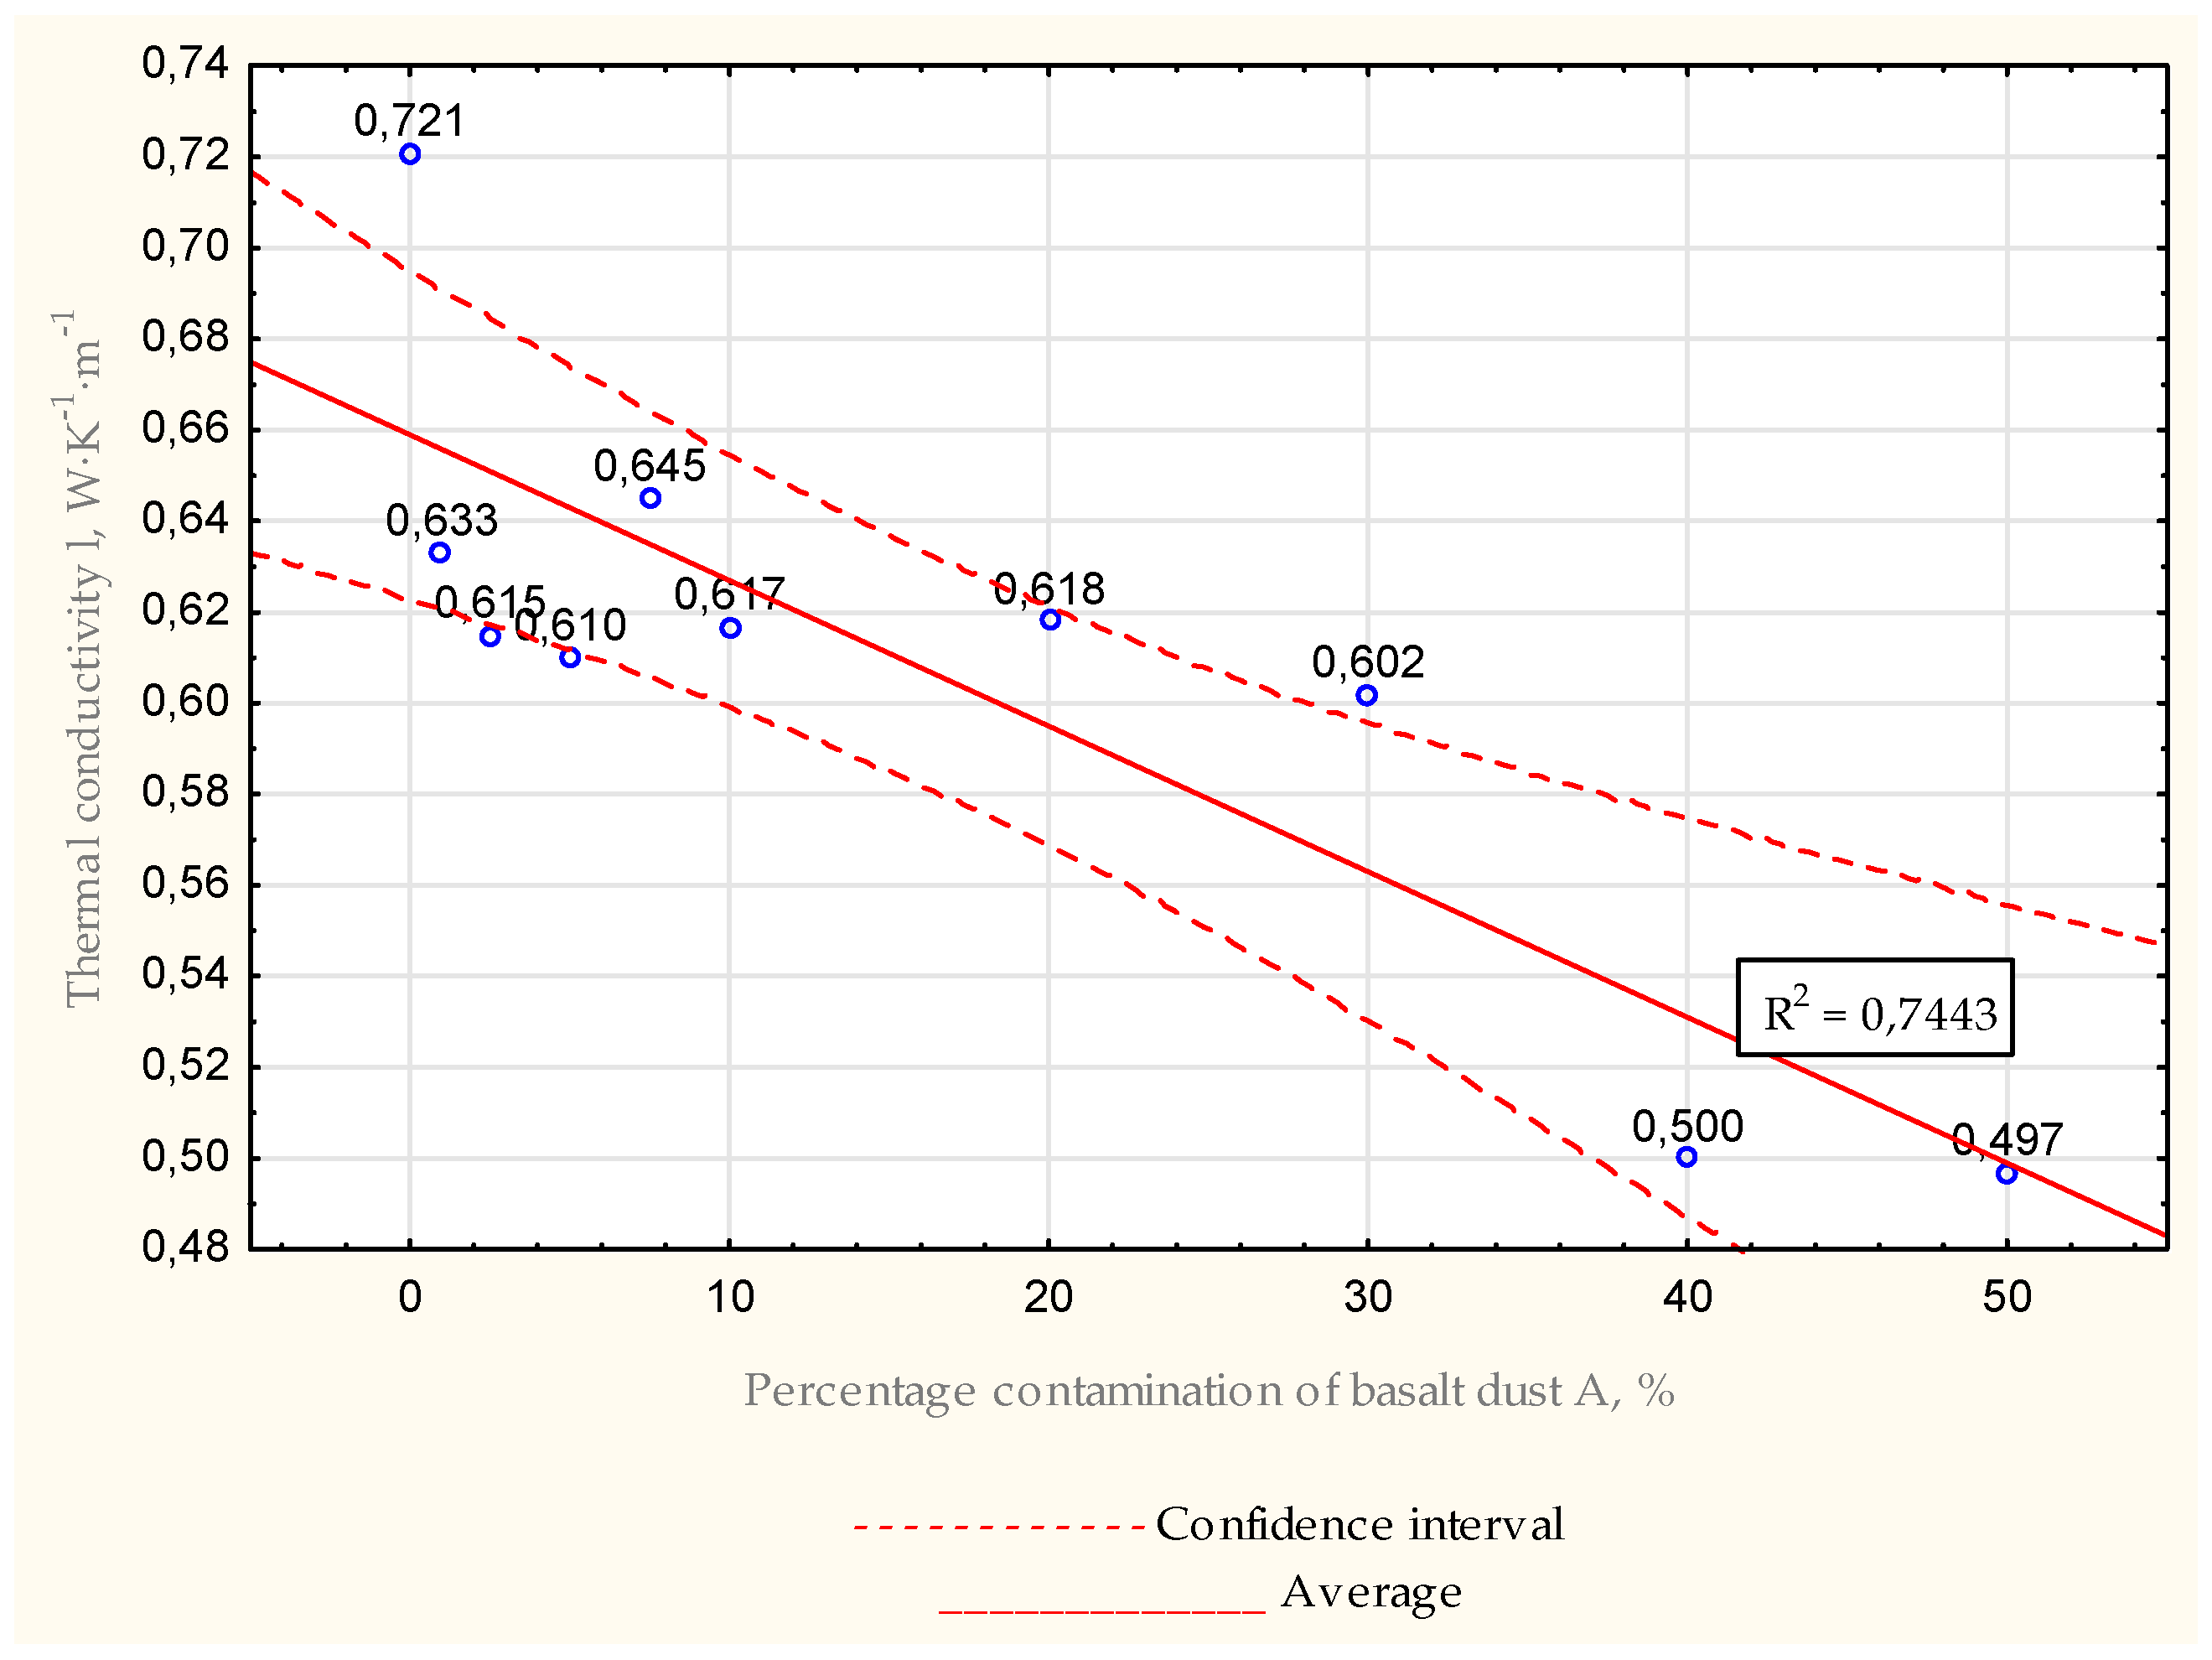
Figure 10.
Average thermal conductivity for basalt dust A for water −mix ratio = 0.6.
Figure 10.
Average thermal conductivity for basalt dust A for water −mix ratio = 0.6.
Figure 10 indicates that, similar to
Figure 9, the thermal conductivity values of the samples containing basalt dust were lower than those of the zero sample. Here, the lowest conductivity value occurred for the formula containing 50% dust in the mixture. For this sample, the thermal conductivity coefficient was about 31% lower than the zero sample value. For the rest of the grout mixtures, decreases in thermal conductivity values varied between 10% and 30%.
Table 7.
Average thermal conductivity for basalt dust A for all samples for water −mix ratio = 0.7.
Table 7.
Average thermal conductivity for basalt dust A for all samples for water −mix ratio = 0.7.
| | |
|---|
| | Statistics |
| Minimum | 0.505 |
| Maximum | 0.634 |
| Median | 0.586 |
| Average | 0.573 |
| Standard deviation | 0.039 |
| The range of variation | 0.129 |
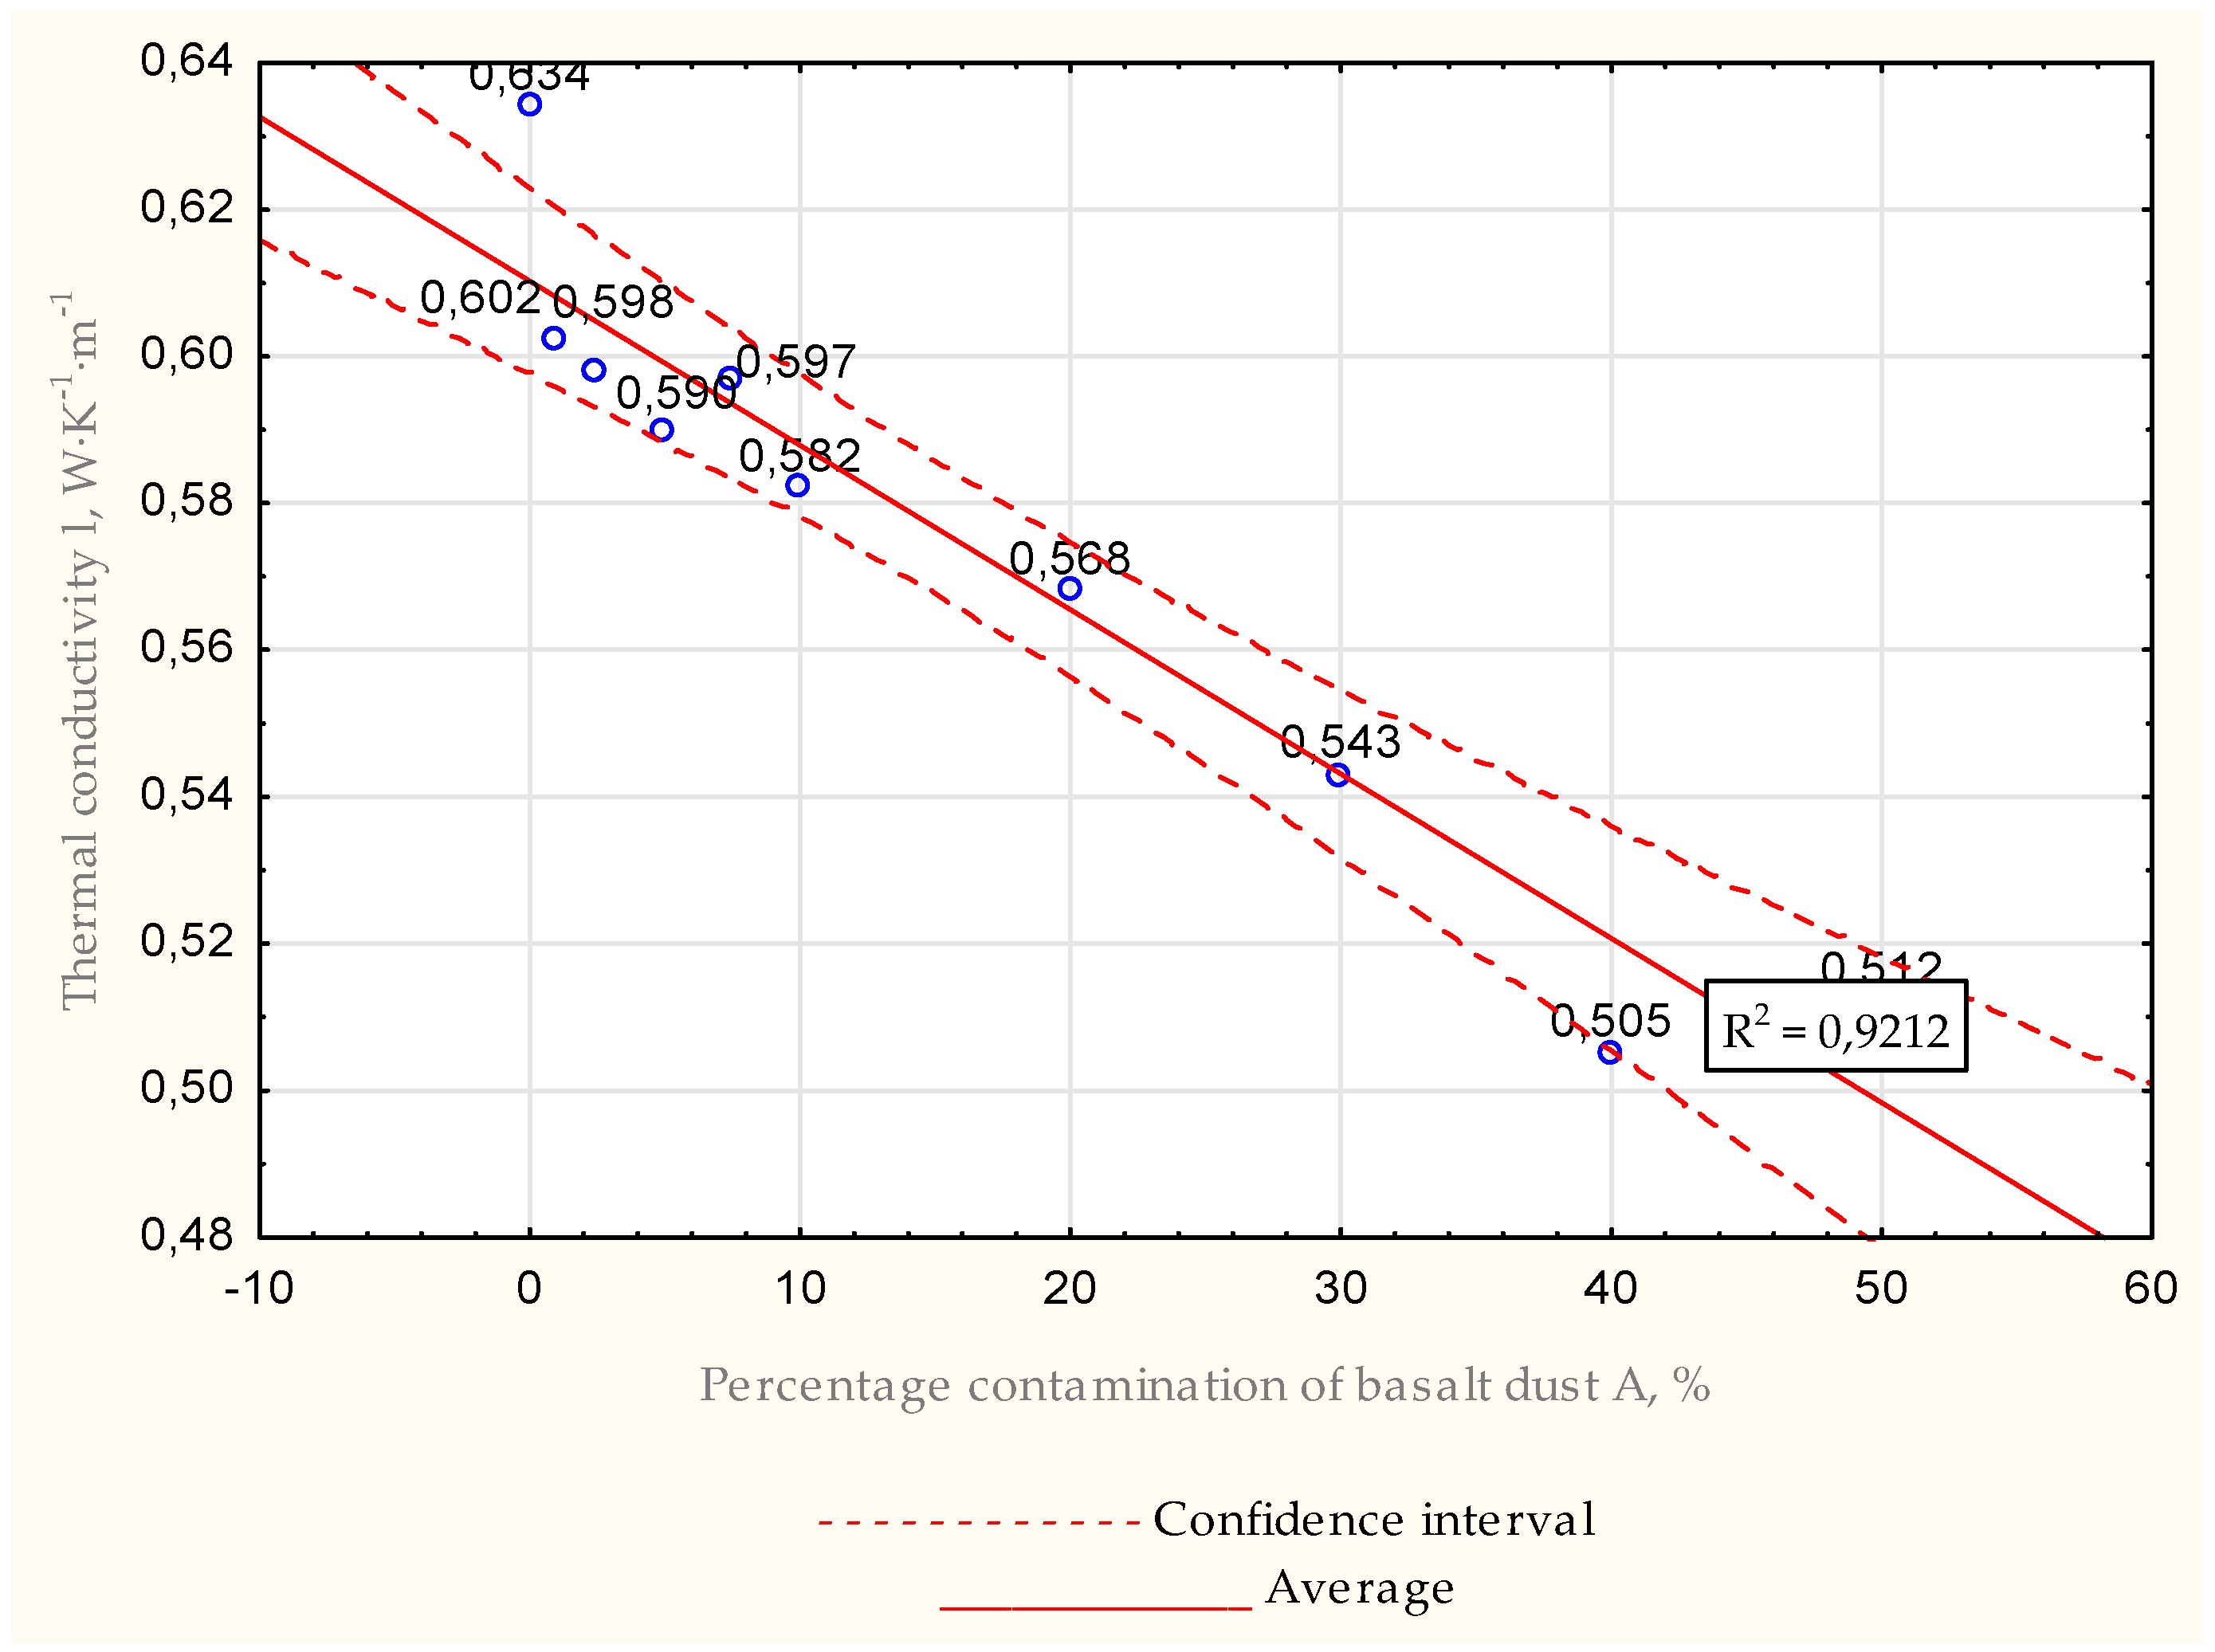
Figure 11.
Average thermal conductivity for basalt dust A for water −mix ratio = 0.7.
Figure 11.
Average thermal conductivity for basalt dust A for water −mix ratio = 0.7.
Analysis of the results for basalt dust A with a water mix–ratio = 0.7 shows a decreasing trend in the value of the thermal conductivity. This trend occurred as the concentration of basalt dust in the slurry increased. The lowest value of thermal conductivity was obtained for the sample containing 40% basalt dust in its composition. The value of the thermal conductivity coefficient in this case was lower than that of the zero sample by almost 20%. For the remaining samples, reduction varied by about 5% to 19%.
Table 8.
Average thermal conductivity for basalt dust B for all samples for water −mix ratio = 0.5.
Table 8.
Average thermal conductivity for basalt dust B for all samples for water −mix ratio = 0.5.
| | |
|---|
| | Statistics |
| Minimum | 0.482 |
| Maximum | 0.628 |
| Median | 0.588 |
| Average | 0.586 |
| Standard deviation | 0.040 |
| The range of variation | 0.146 |
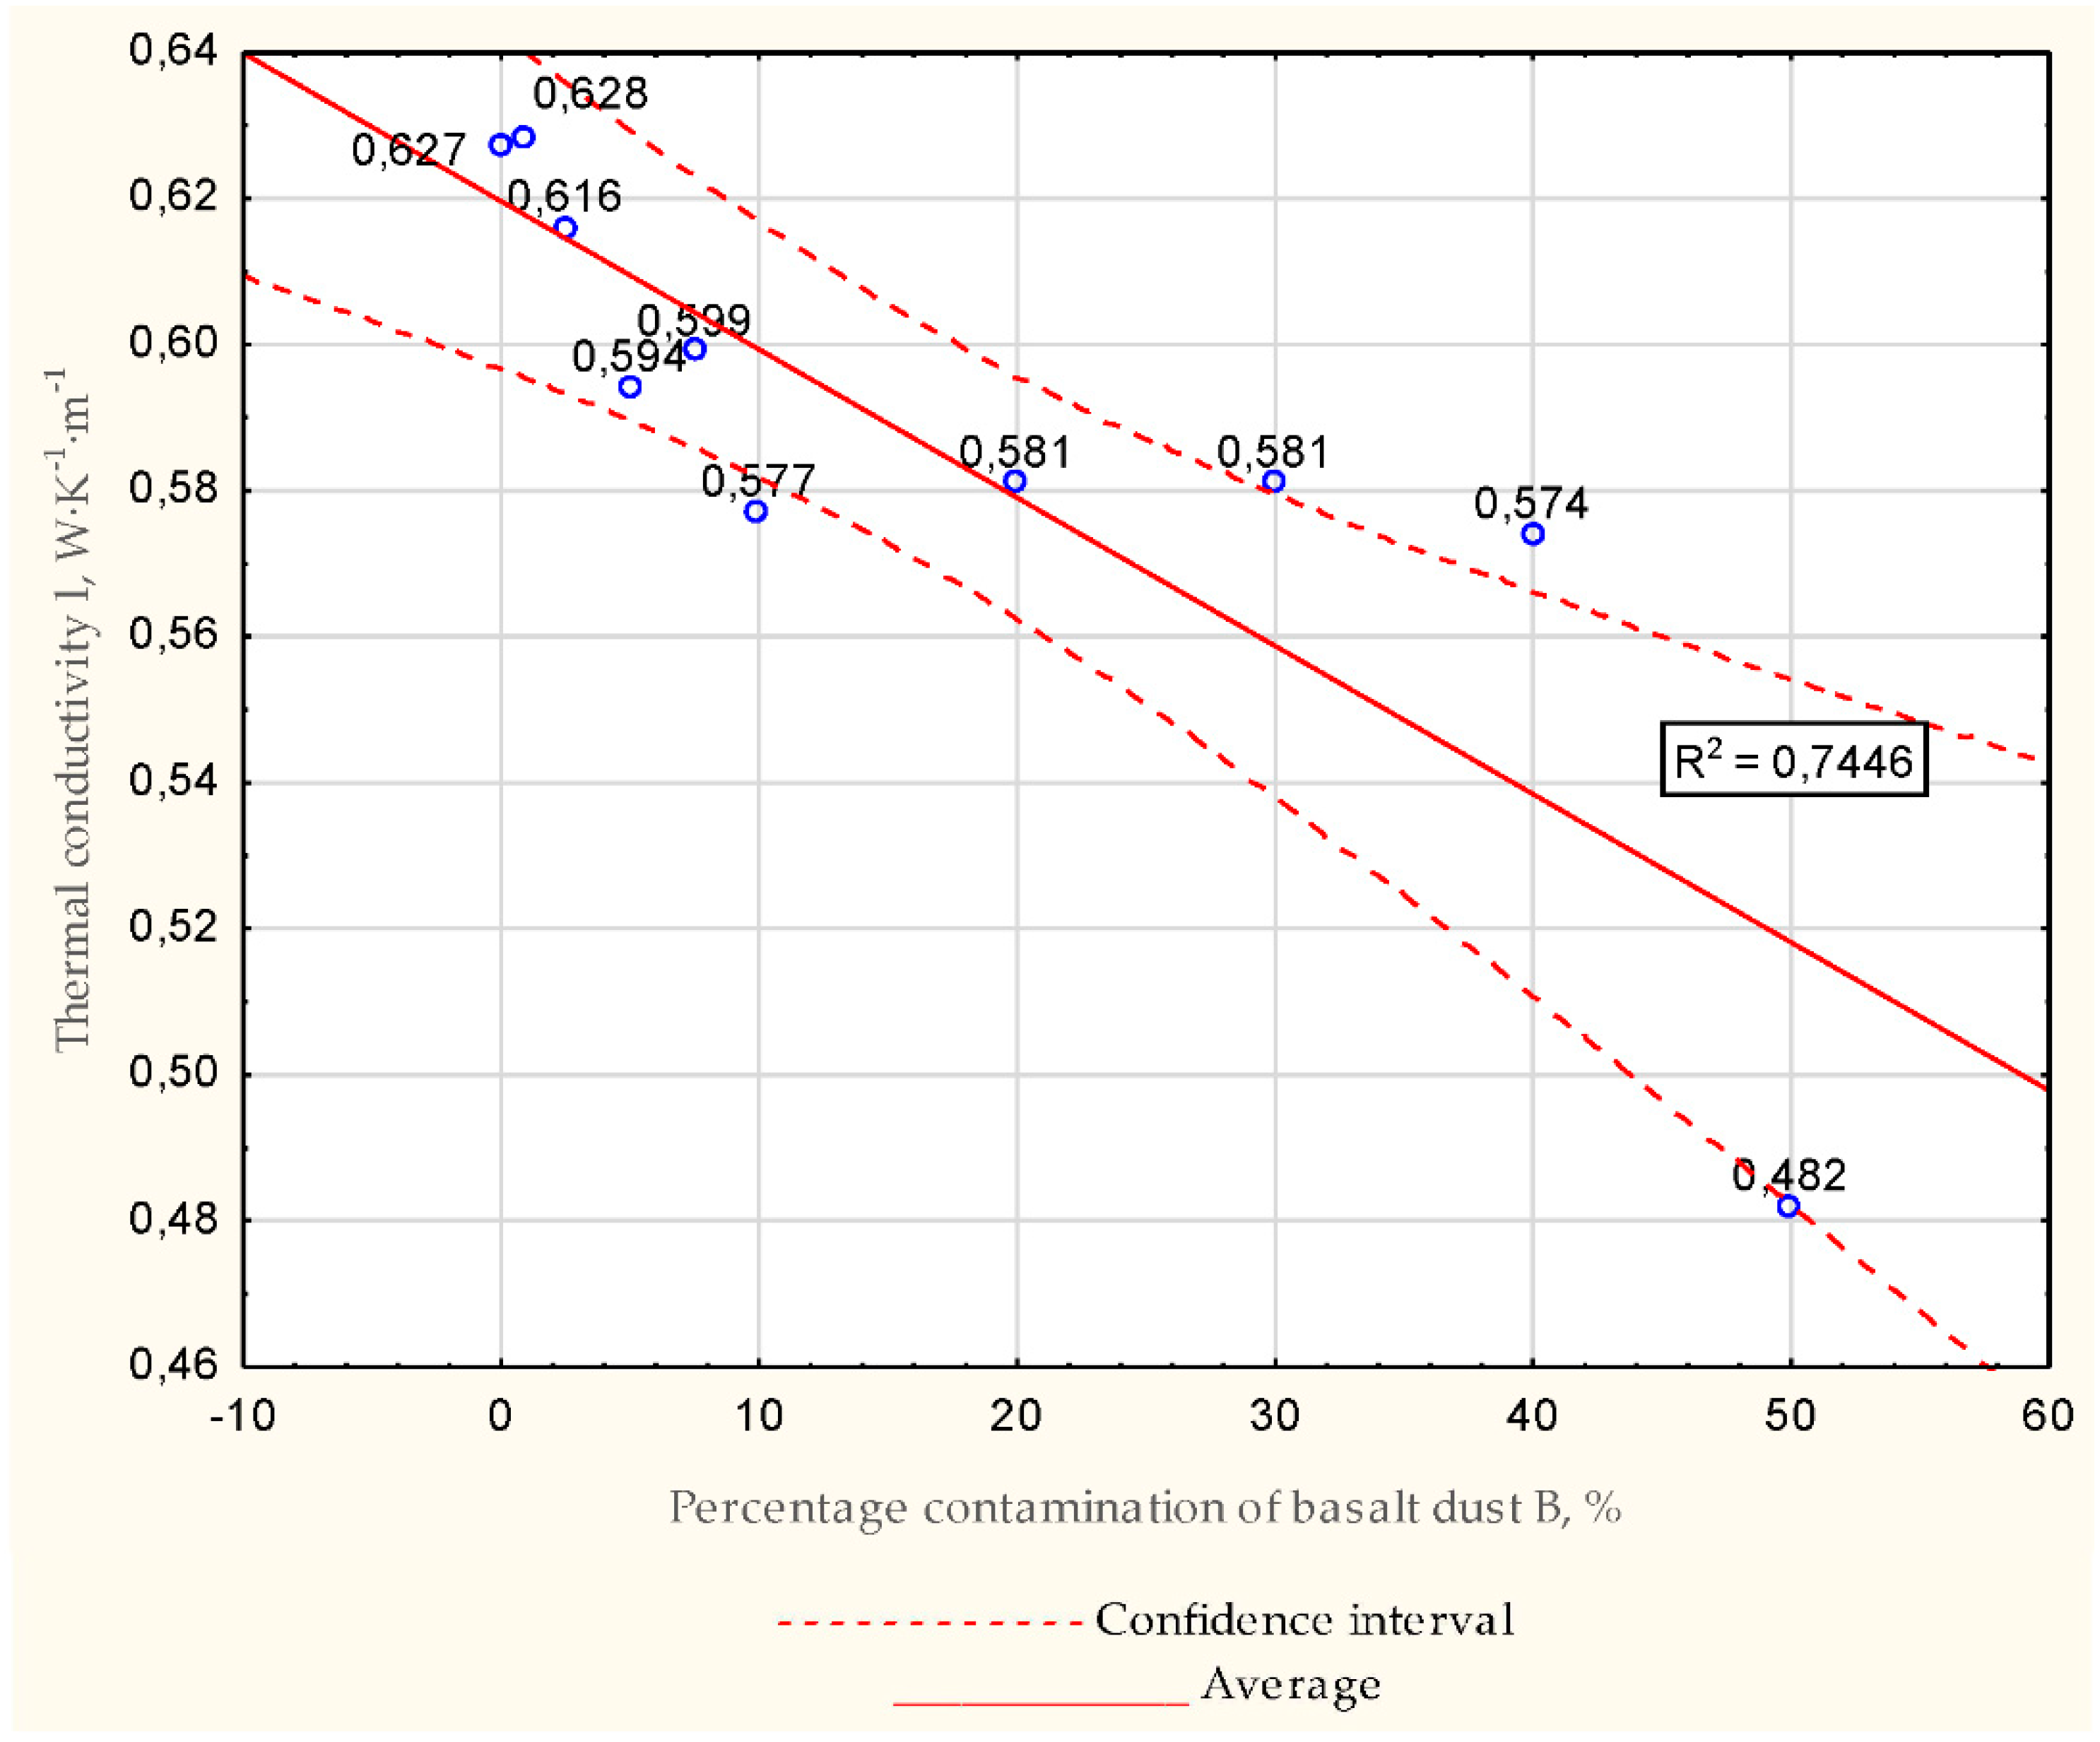
Figure 12.
Average thermal conductivity for basalt dust B for water −mix ratio = 0.5.
Figure 12.
Average thermal conductivity for basalt dust B for water −mix ratio = 0.5.
According to
Figure 12, the slurries with dust content of 1% had values about 0.1% greater than the zero sample. For remaining concentrations, a decrease in thermal conductivity values was observed. The decreases in these values varied from about −1.7% to about −23% compared to the zero sample. The lowest conductivity value was found for the grout with a basalt dust content of 50%.
Table 9.
Average thermal conductivity for basalt dust B for all samples for water −mix ratio = 0.6.
Table 9.
Average thermal conductivity for basalt dust B for all samples for water −mix ratio = 0.6.
| | |
|---|
| | Statistics |
| Minimum | 0.566 |
| Maximum | 0.677 |
| Median | 0.623 |
| Average | 0.625 |
| Standard deviation | 0.034 |
| The range of variation | 0.111 |
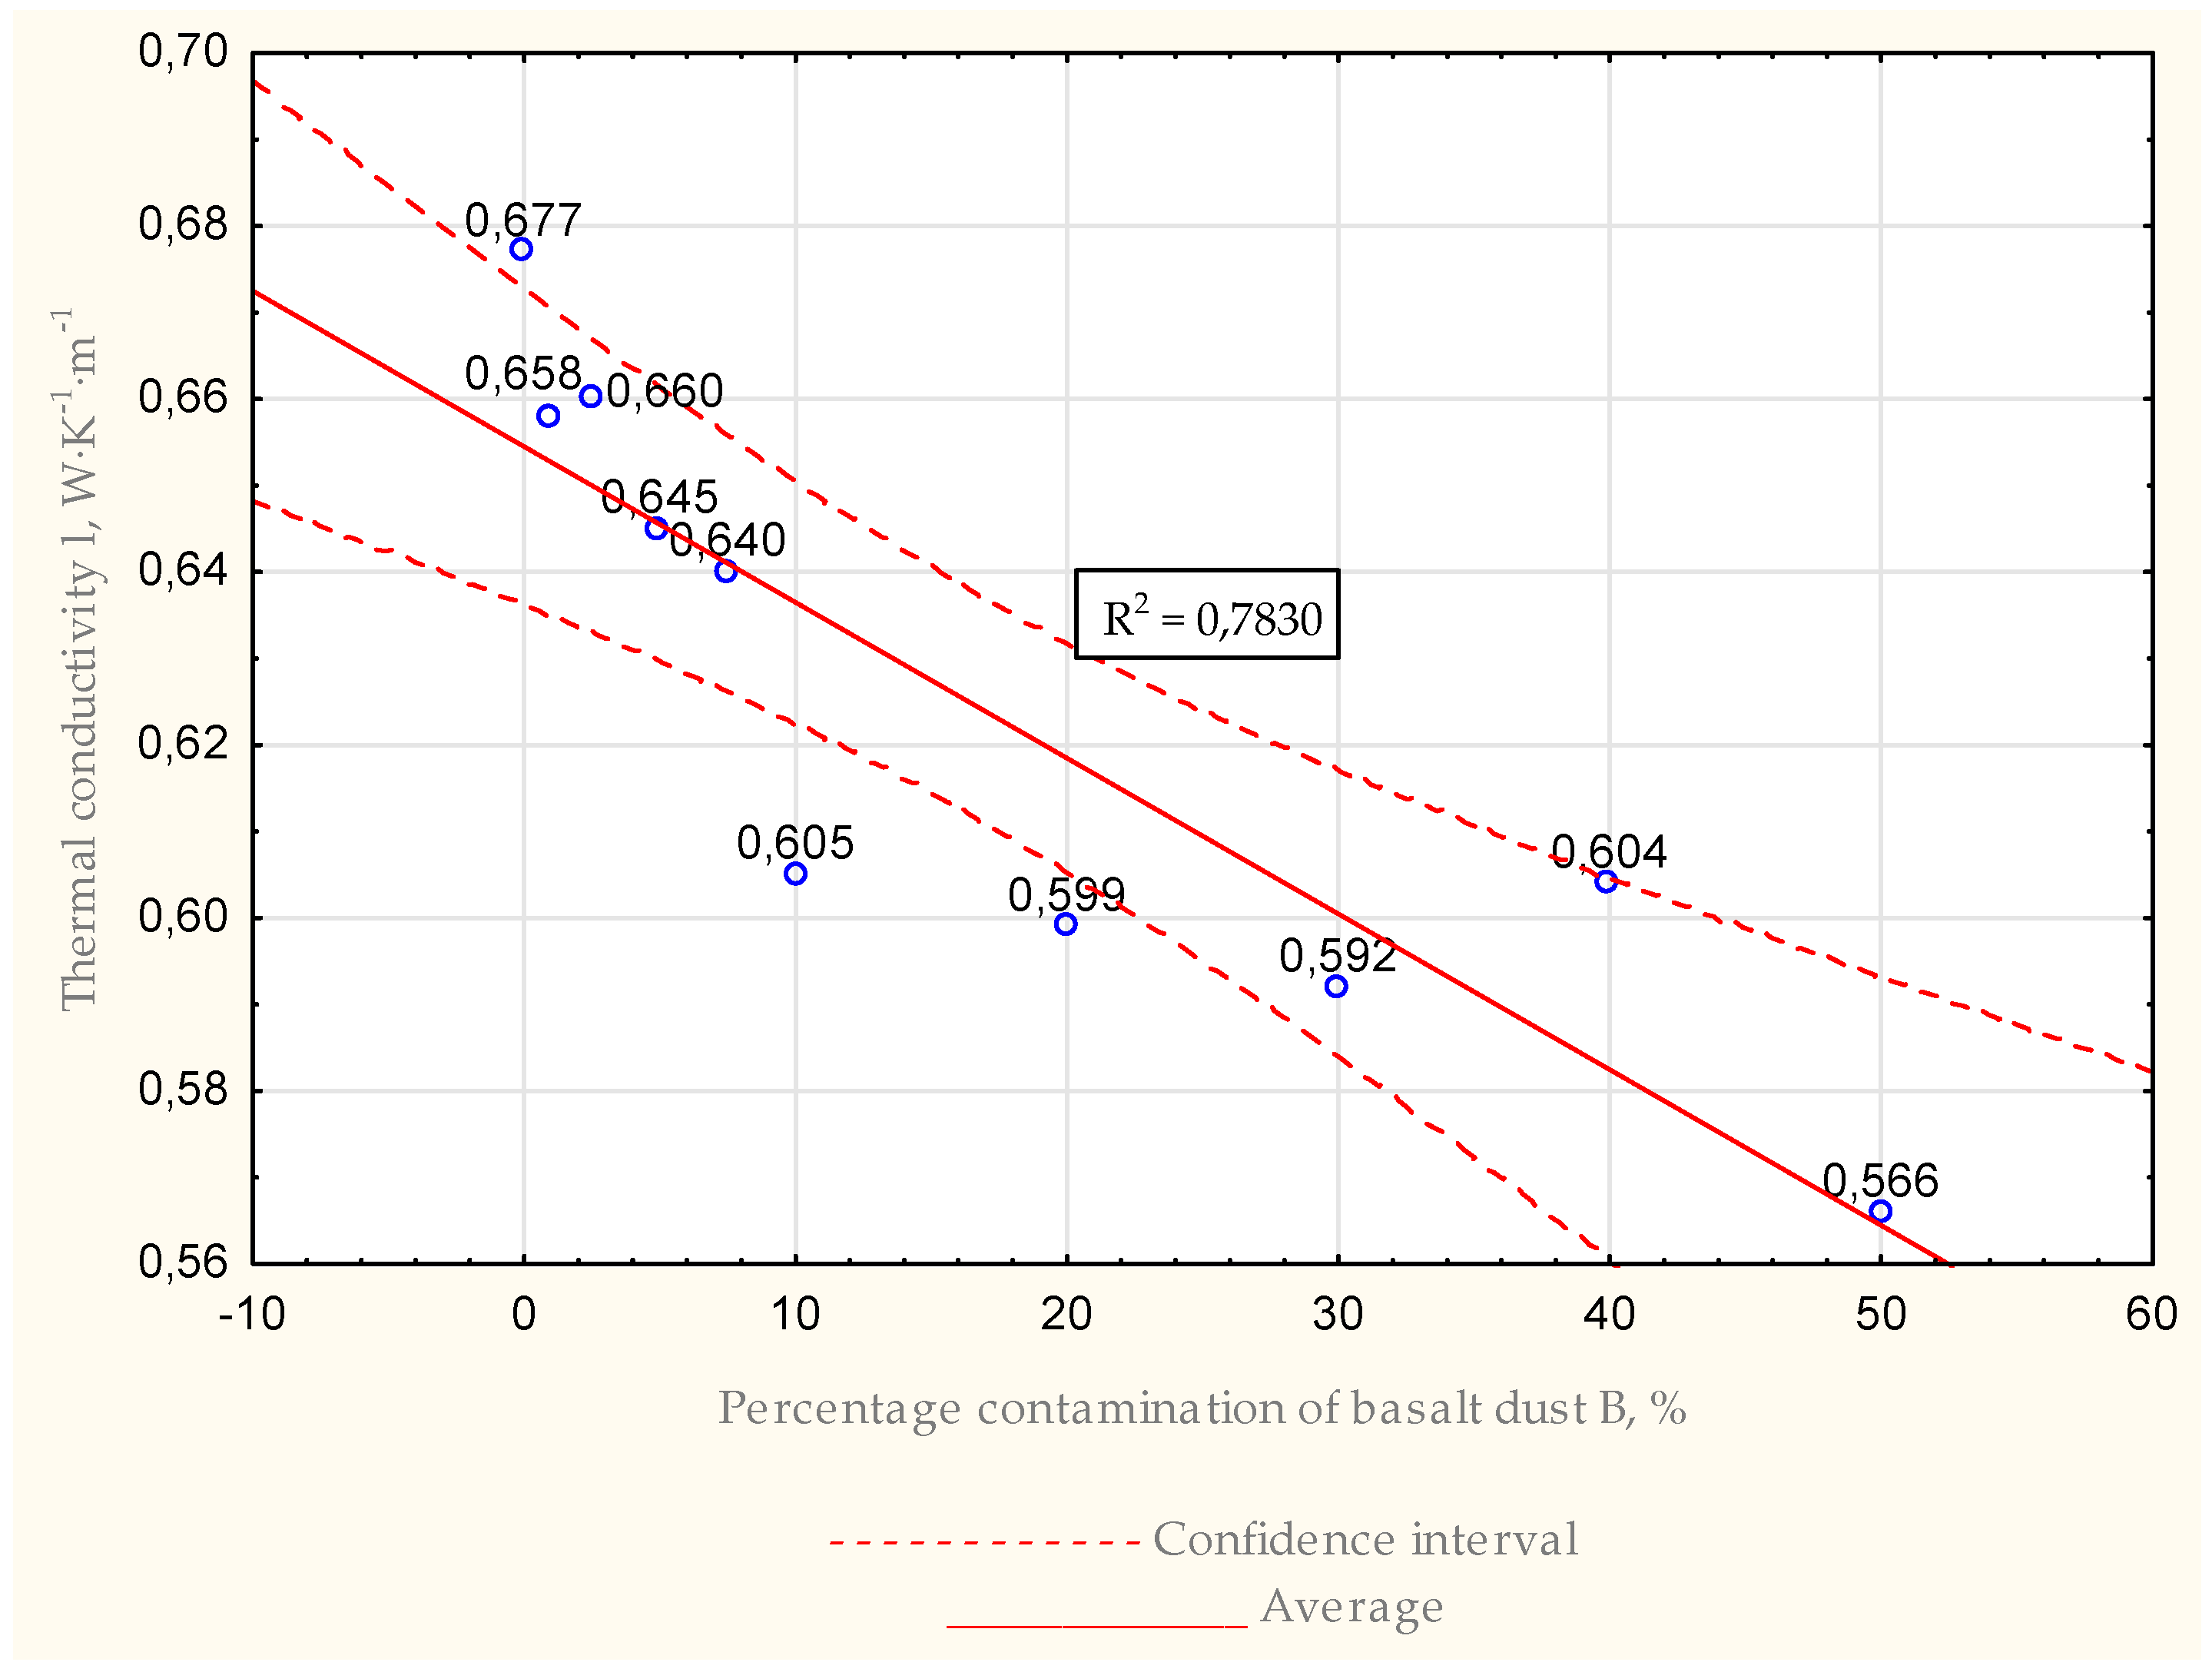
Figure 13.
Average thermal conductivity for basalt dust B for water −mix ratio = 0.6.
Figure 13.
Average thermal conductivity for basalt dust B for water −mix ratio = 0.6.
Data contained in
Table 9 again shows a decreasing trend in the value of the thermal conductivity coefficient. All samples containing basalt B dust as an additive had thermal conductivity values less than those of the zero sample. The lowest value was observed for the grout with a dust content of 50%; in this case the thermal conductivity value was about 16% lower than that of the zero sample. For other grout mixtures, the thermal conductivity coefficient was about 3% to 12.5% lower.
Table 10.
Average thermal conductivity for basalt dust B for all samples for water −mix ratio = 0.7.
Table 10.
Average thermal conductivity for basalt dust B for all samples for water −mix ratio = 0.7.
| | |
|---|
| | Statistics |
| Minimum | 0.581 |
| Maximum | 0.659 |
| Median | 0.614 |
| Average | 0.615 |
| Standard deviation | 0.022 |
| The range of variation | 0.078 |
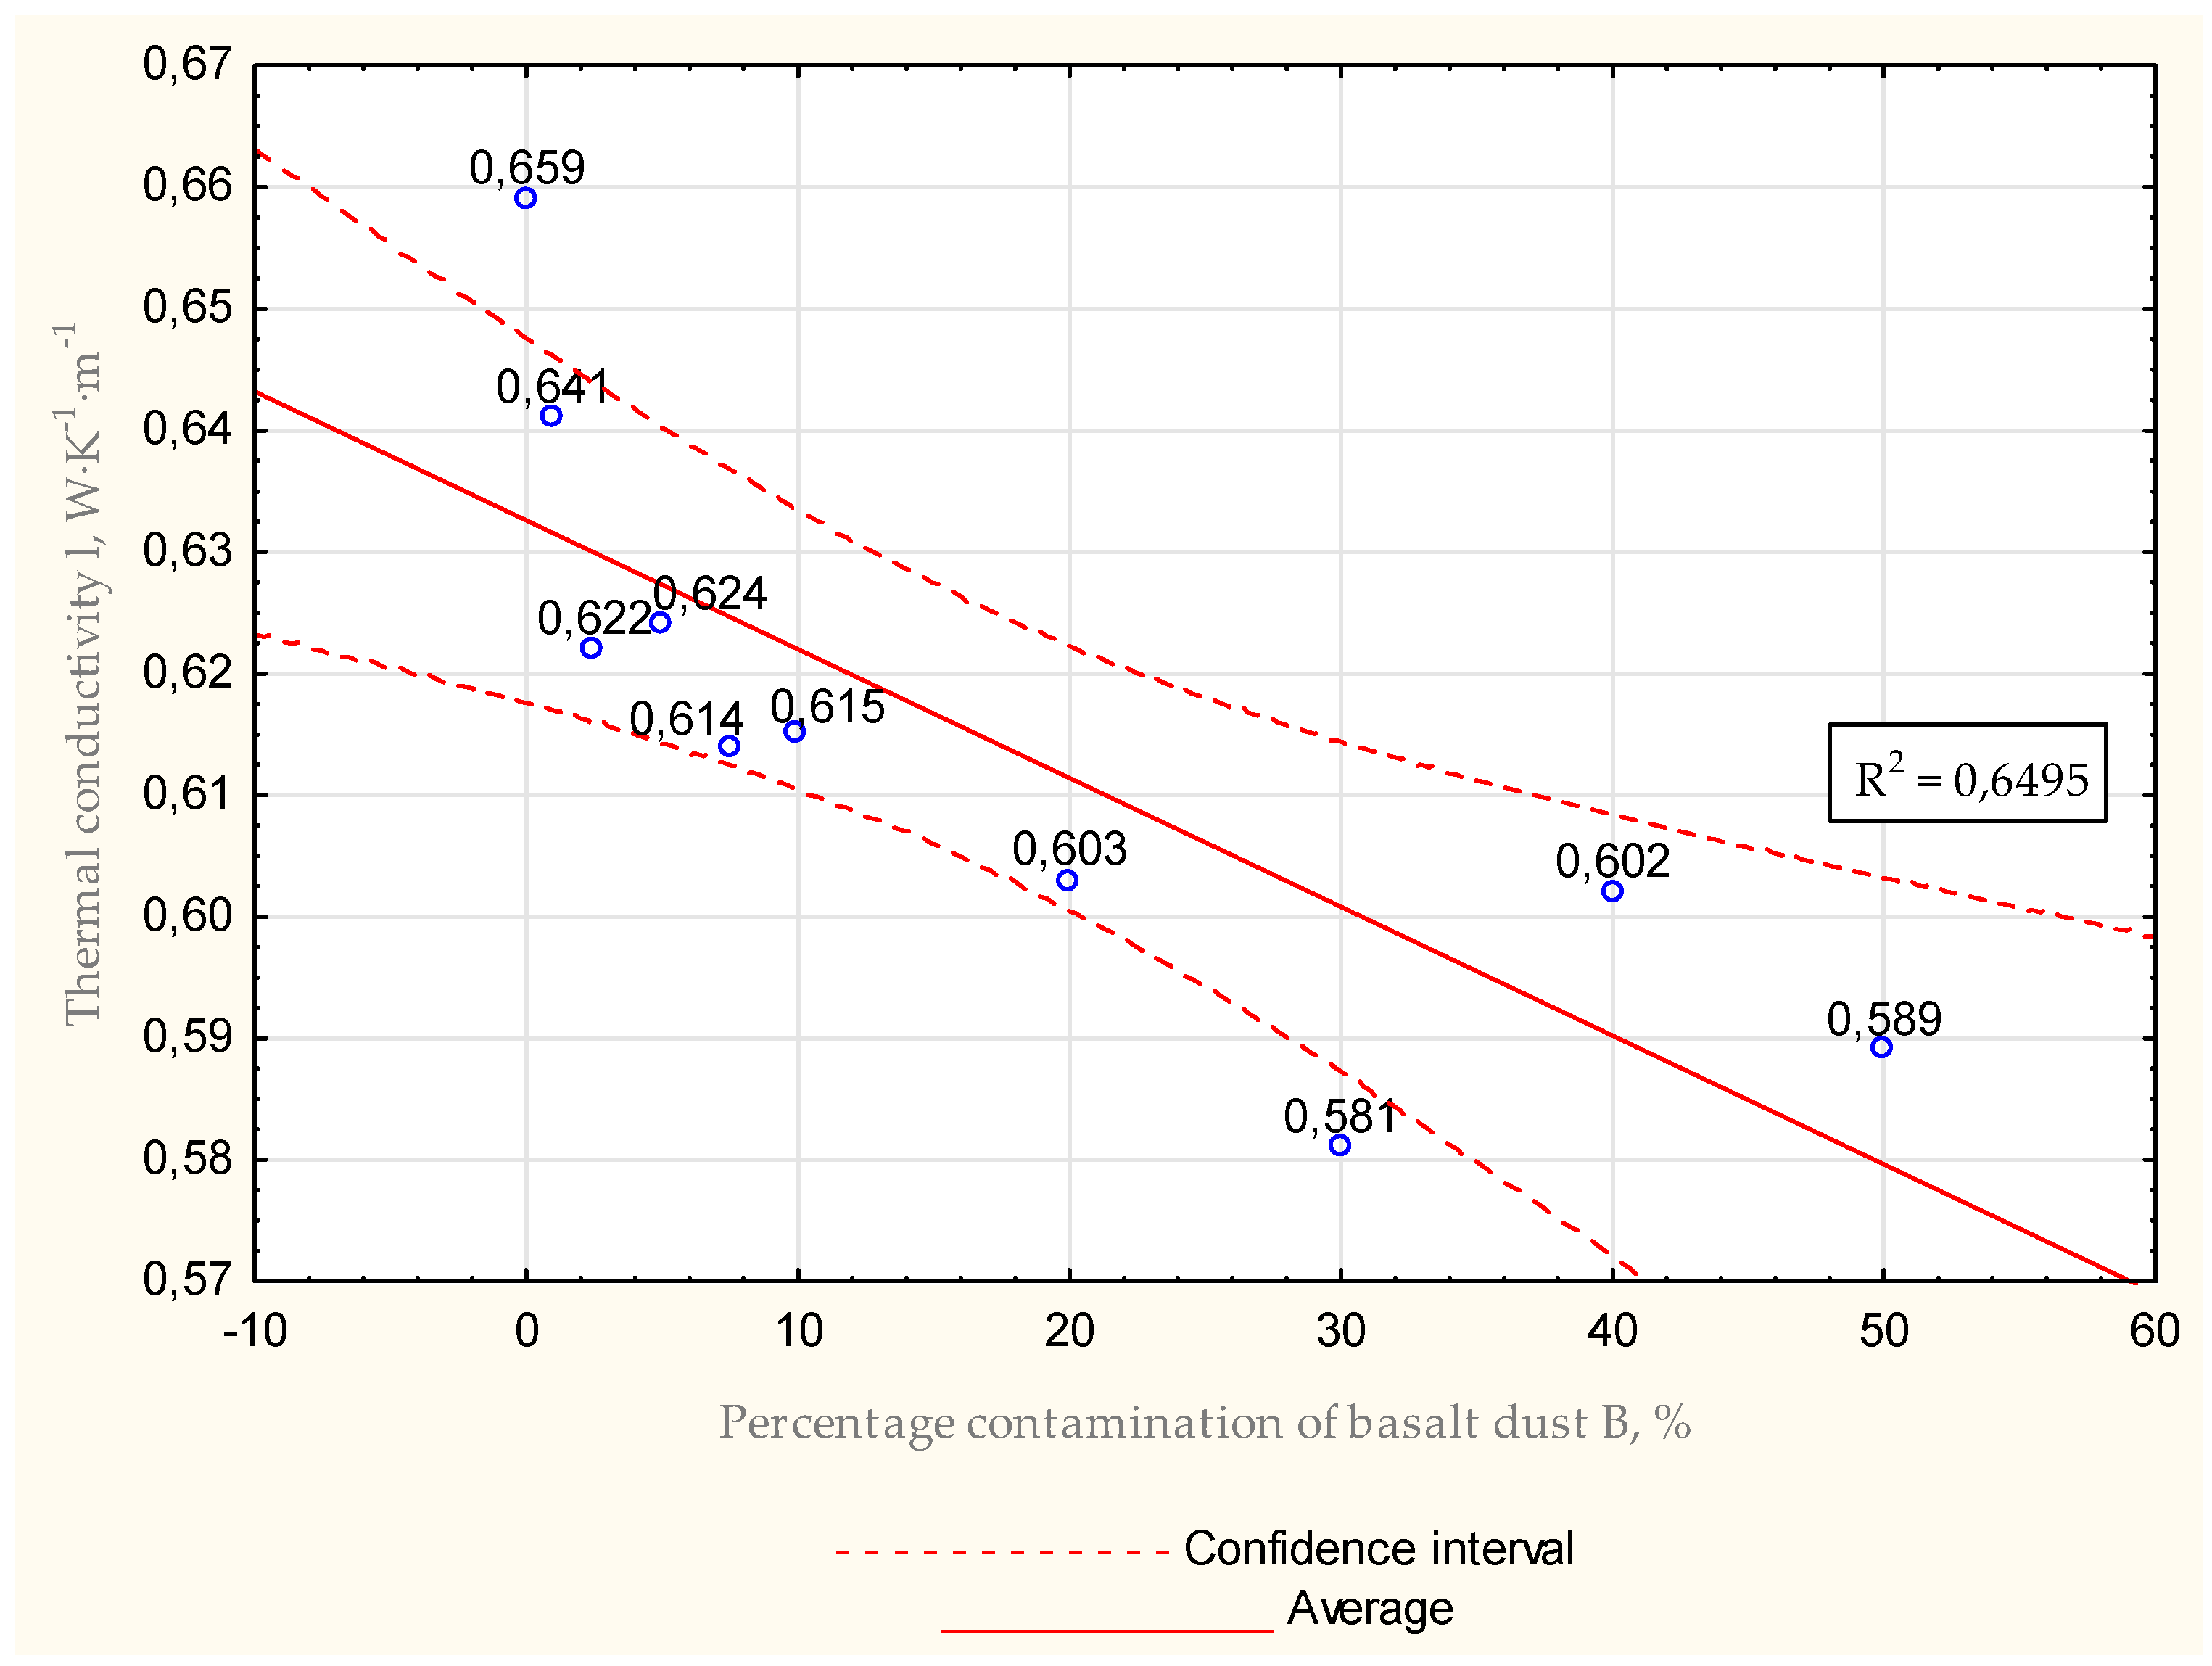
Figure 14.
Average thermal conductivity for basalt dust B for water −mix ratio = 0.7.
Figure 14.
Average thermal conductivity for basalt dust B for water −mix ratio = 0.7.
Upon analysis of the data in
Table 10, the trend of decreasing thermal conductivity values relative to the zero sample was again noted. Once again for basalt dust B, all grout mixtures had lower values of thermal conductivity compared to the base specimen. The lowest thermal conductivity value was found for samples containing this additive at 30%. In this case, the thermal conductivity value compared to the zero sample was about 12% lower. For all remaining grout mixtures, the thermal conductivity coefficient was about 2.5% to 10% lower.
Thermal conductivity coefficient tests require a very strict, repeatable (under the same conditions) experimental procedure since many factors influence the final test results. Cement slurry must be prepared carefully. Care should be taken when mixing dry ingredients with water to avoid the formation of vortices that would allow air to enter the freshly prepared grout.
3.2. Flexural and Compressive Strength Tests
The effect of basalt dust on the strength of depletion grouts was tested. These tests are very important because for geothermal wells as well as deep borehole heat exchangers, the strength of cement slurry is a parameter equally important as thermal conductivity. If the grout strength is too low, the function of the borehole may be adversely affected, and the borehole may fail [
6,
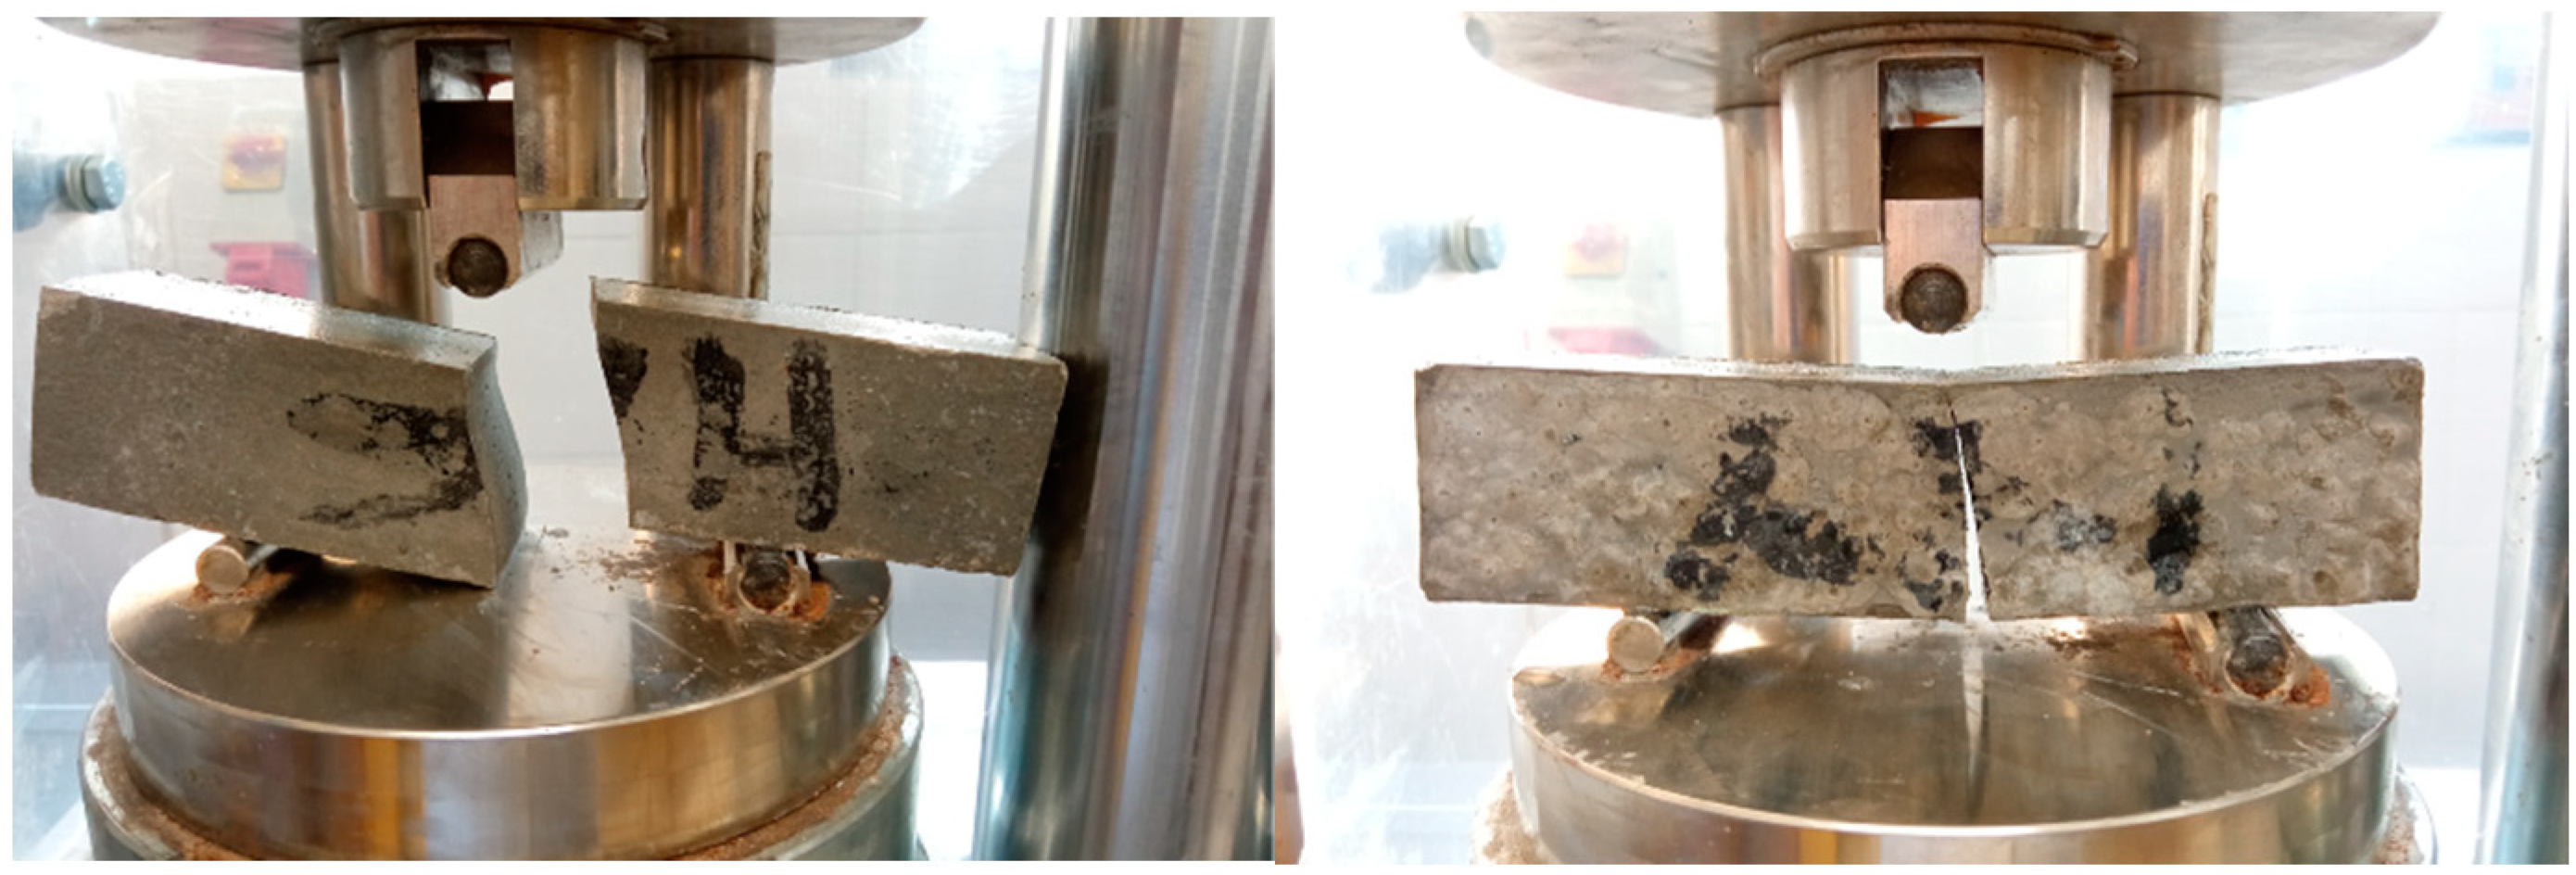
55]. For this reason, strength values at least equal to the zero sample are required. Two types of strength tests were performed on the hardened samples: flexural strength, and compressive strength. In both cases, the maximum force and maximum pressure are given. For each water–cement ratio of 0.5, 0.6 and 0.7, respectively, the results are collected in two tables.
Table 11,
Table 12,
Table 13,
Table 14,
Table 15 and
Table 16 contains both strengths results.
Table 11,
Table 13 and
Table 15 show flexural strength test results.
Table 12,
Table 14 and
Table 16 include compressive strength tests. Figures 15, 16, 19, 20, 23 and 24 show the results obtained from the flexural strength tests and Figures 17, 18, 21, 22, 25 and 26 show the results from the compressive strength tests.
Table 11,
Table 12,
Table 13,
Table 14,
Table 15 and
Table 16 and
Figure 15,
Figure 16,
Figure 17,
Figure 18,
Figure 19,
Figure 20,
Figure 21,
Figure 22,
Figure 23,
Figure 24,
Figure 25 and
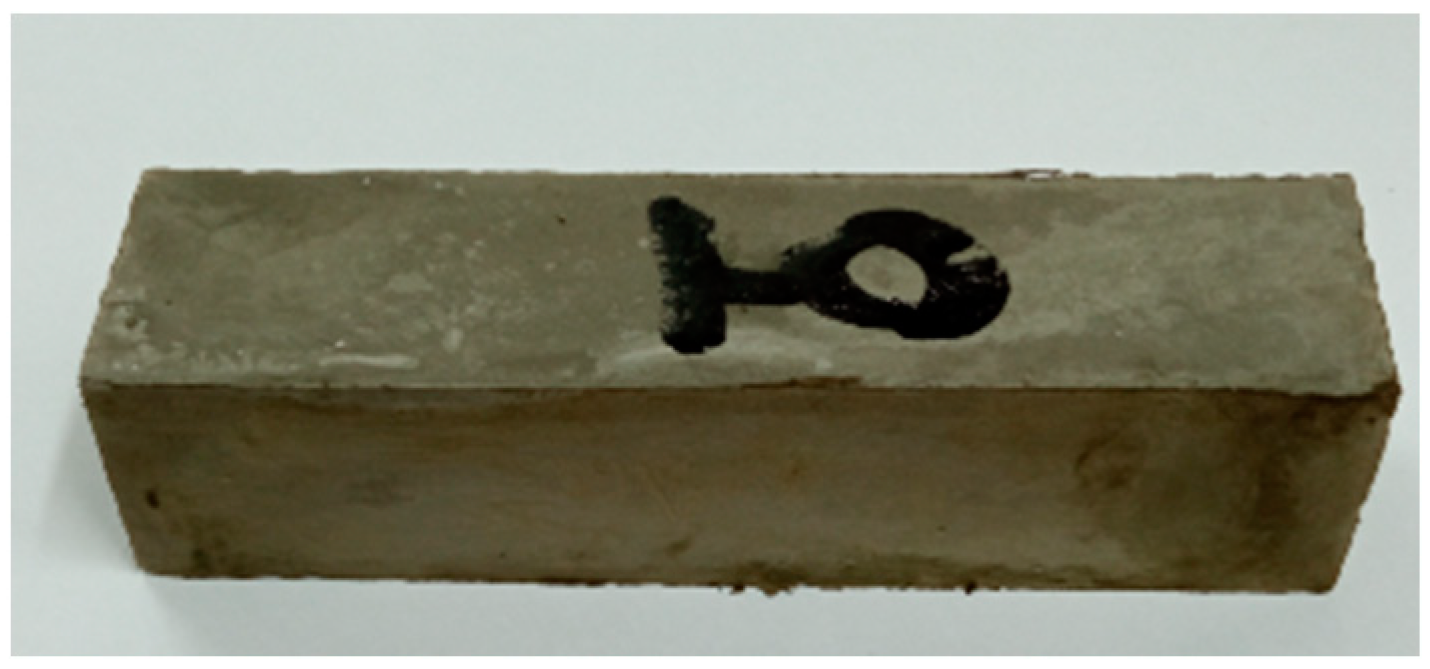
Figure 26 refer to the results obtained for basalt dust A. For the purpose of strength testing, about 320 beams were made and tested.
Table 11.
Flexural strength tests for basalt dust A for all samples for water −mix ratio = 0.5.
Table 11.
Flexural strength tests for basalt dust A for all samples for water −mix ratio = 0.5.
| | Maximum Strength [kN] | Maximum Press Force [MPa] |
|---|
| | Statistic | |
| Minimum | 2.333 | 5.641 |
| Maximum | 4.634 | 10.465 |
| Median | 4.063 | 9.441 |
| Average | 3.787 | 8.745 |
| Standard deviation | 0.753 | 1.632 |
| The range of variation | 2.301 | 4.824 |
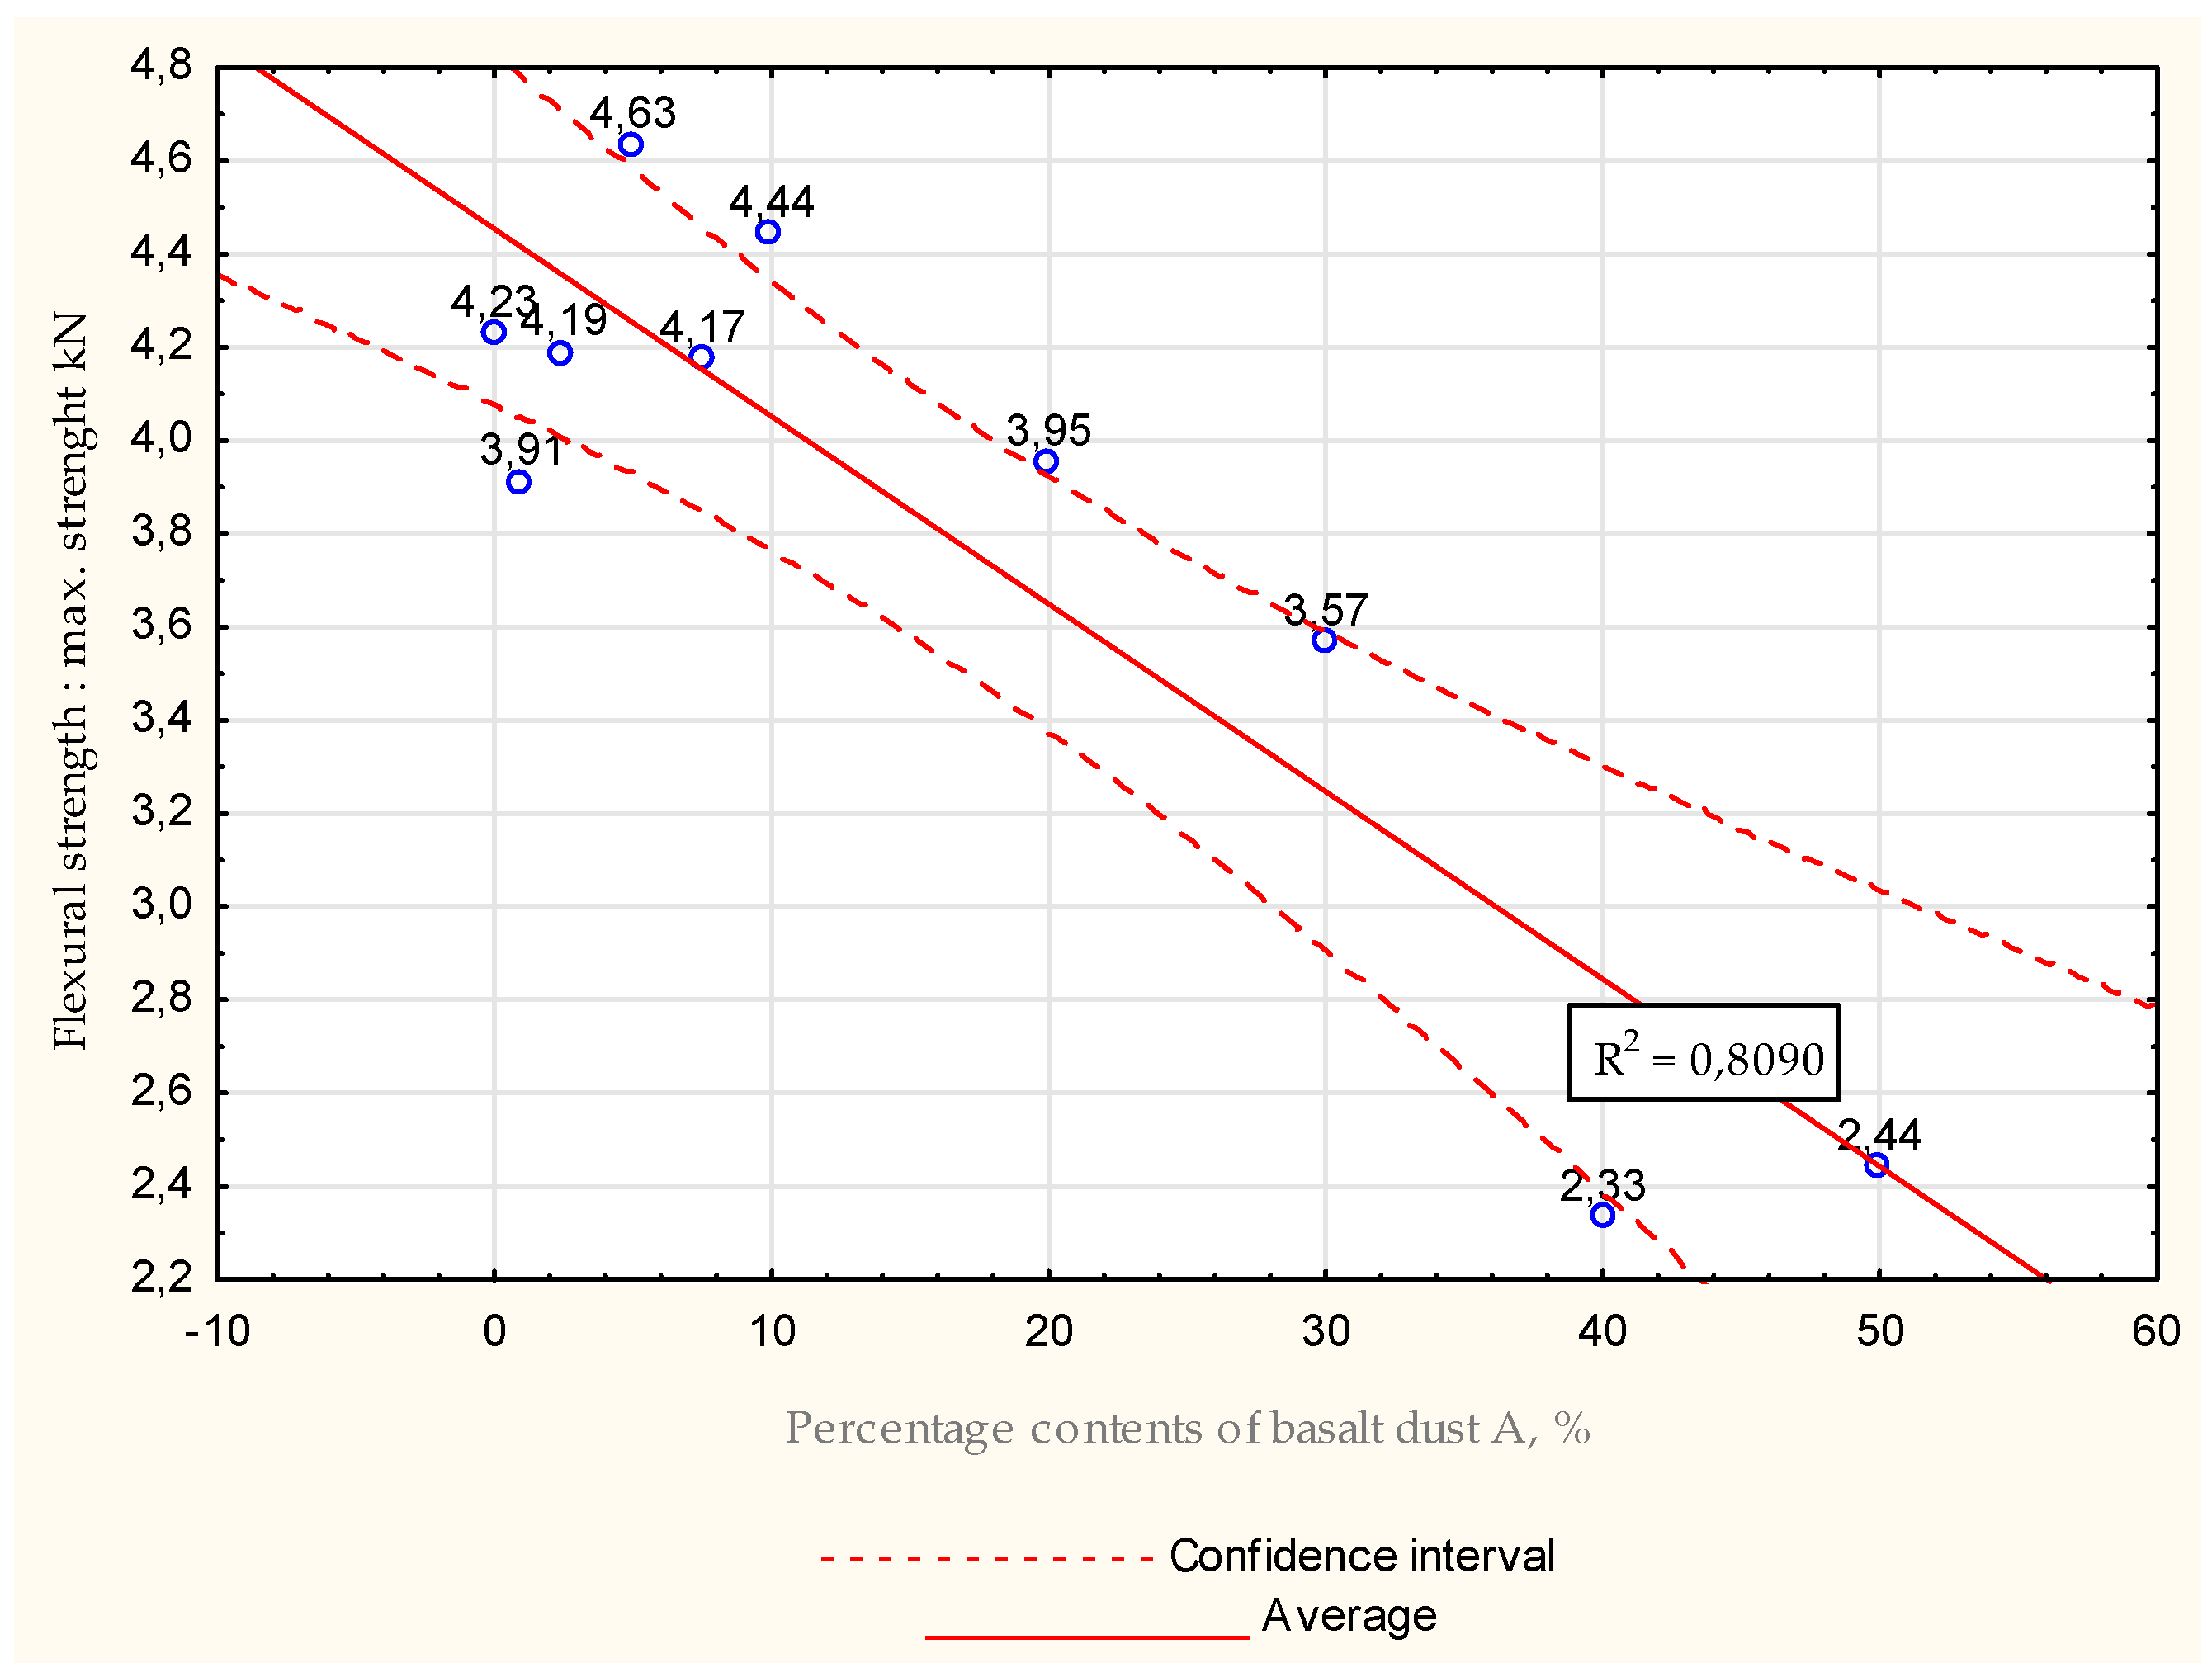
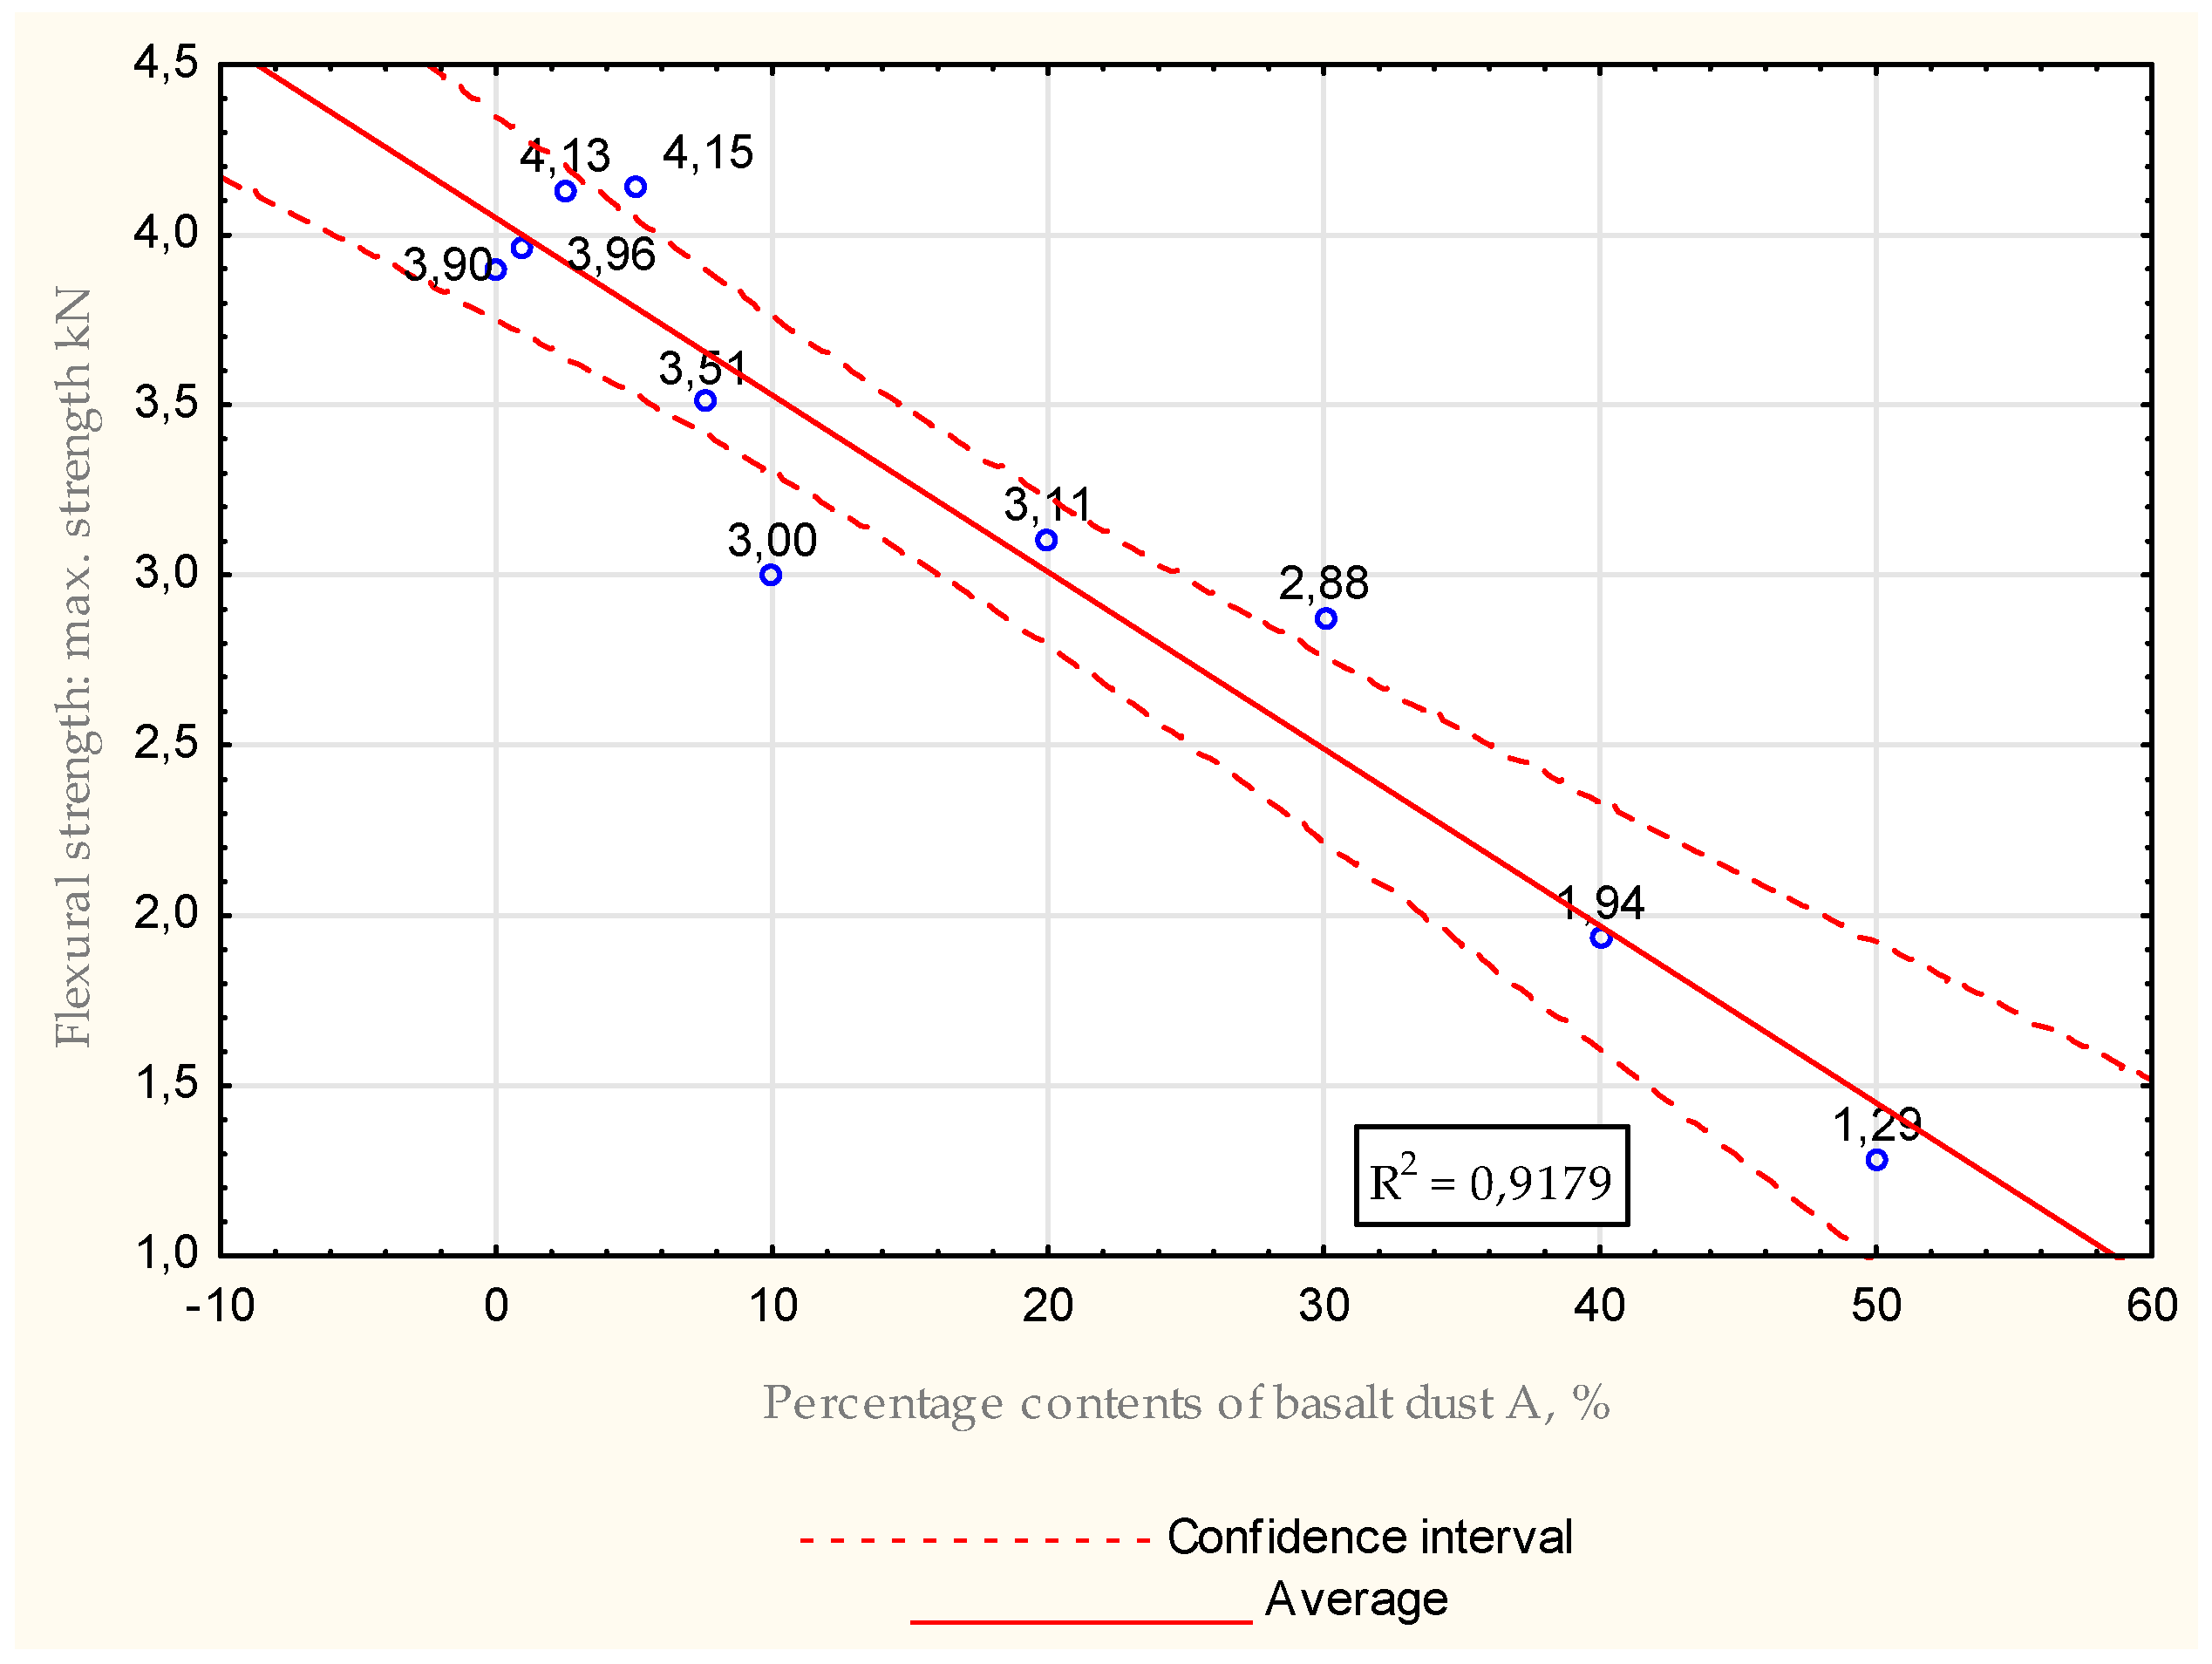
Figure 15.
Average values received during flexural strength tests for water −mix ratio = 0.5, maximal strength.
Figure 15.
Average values received during flexural strength tests for water −mix ratio = 0.5, maximal strength.
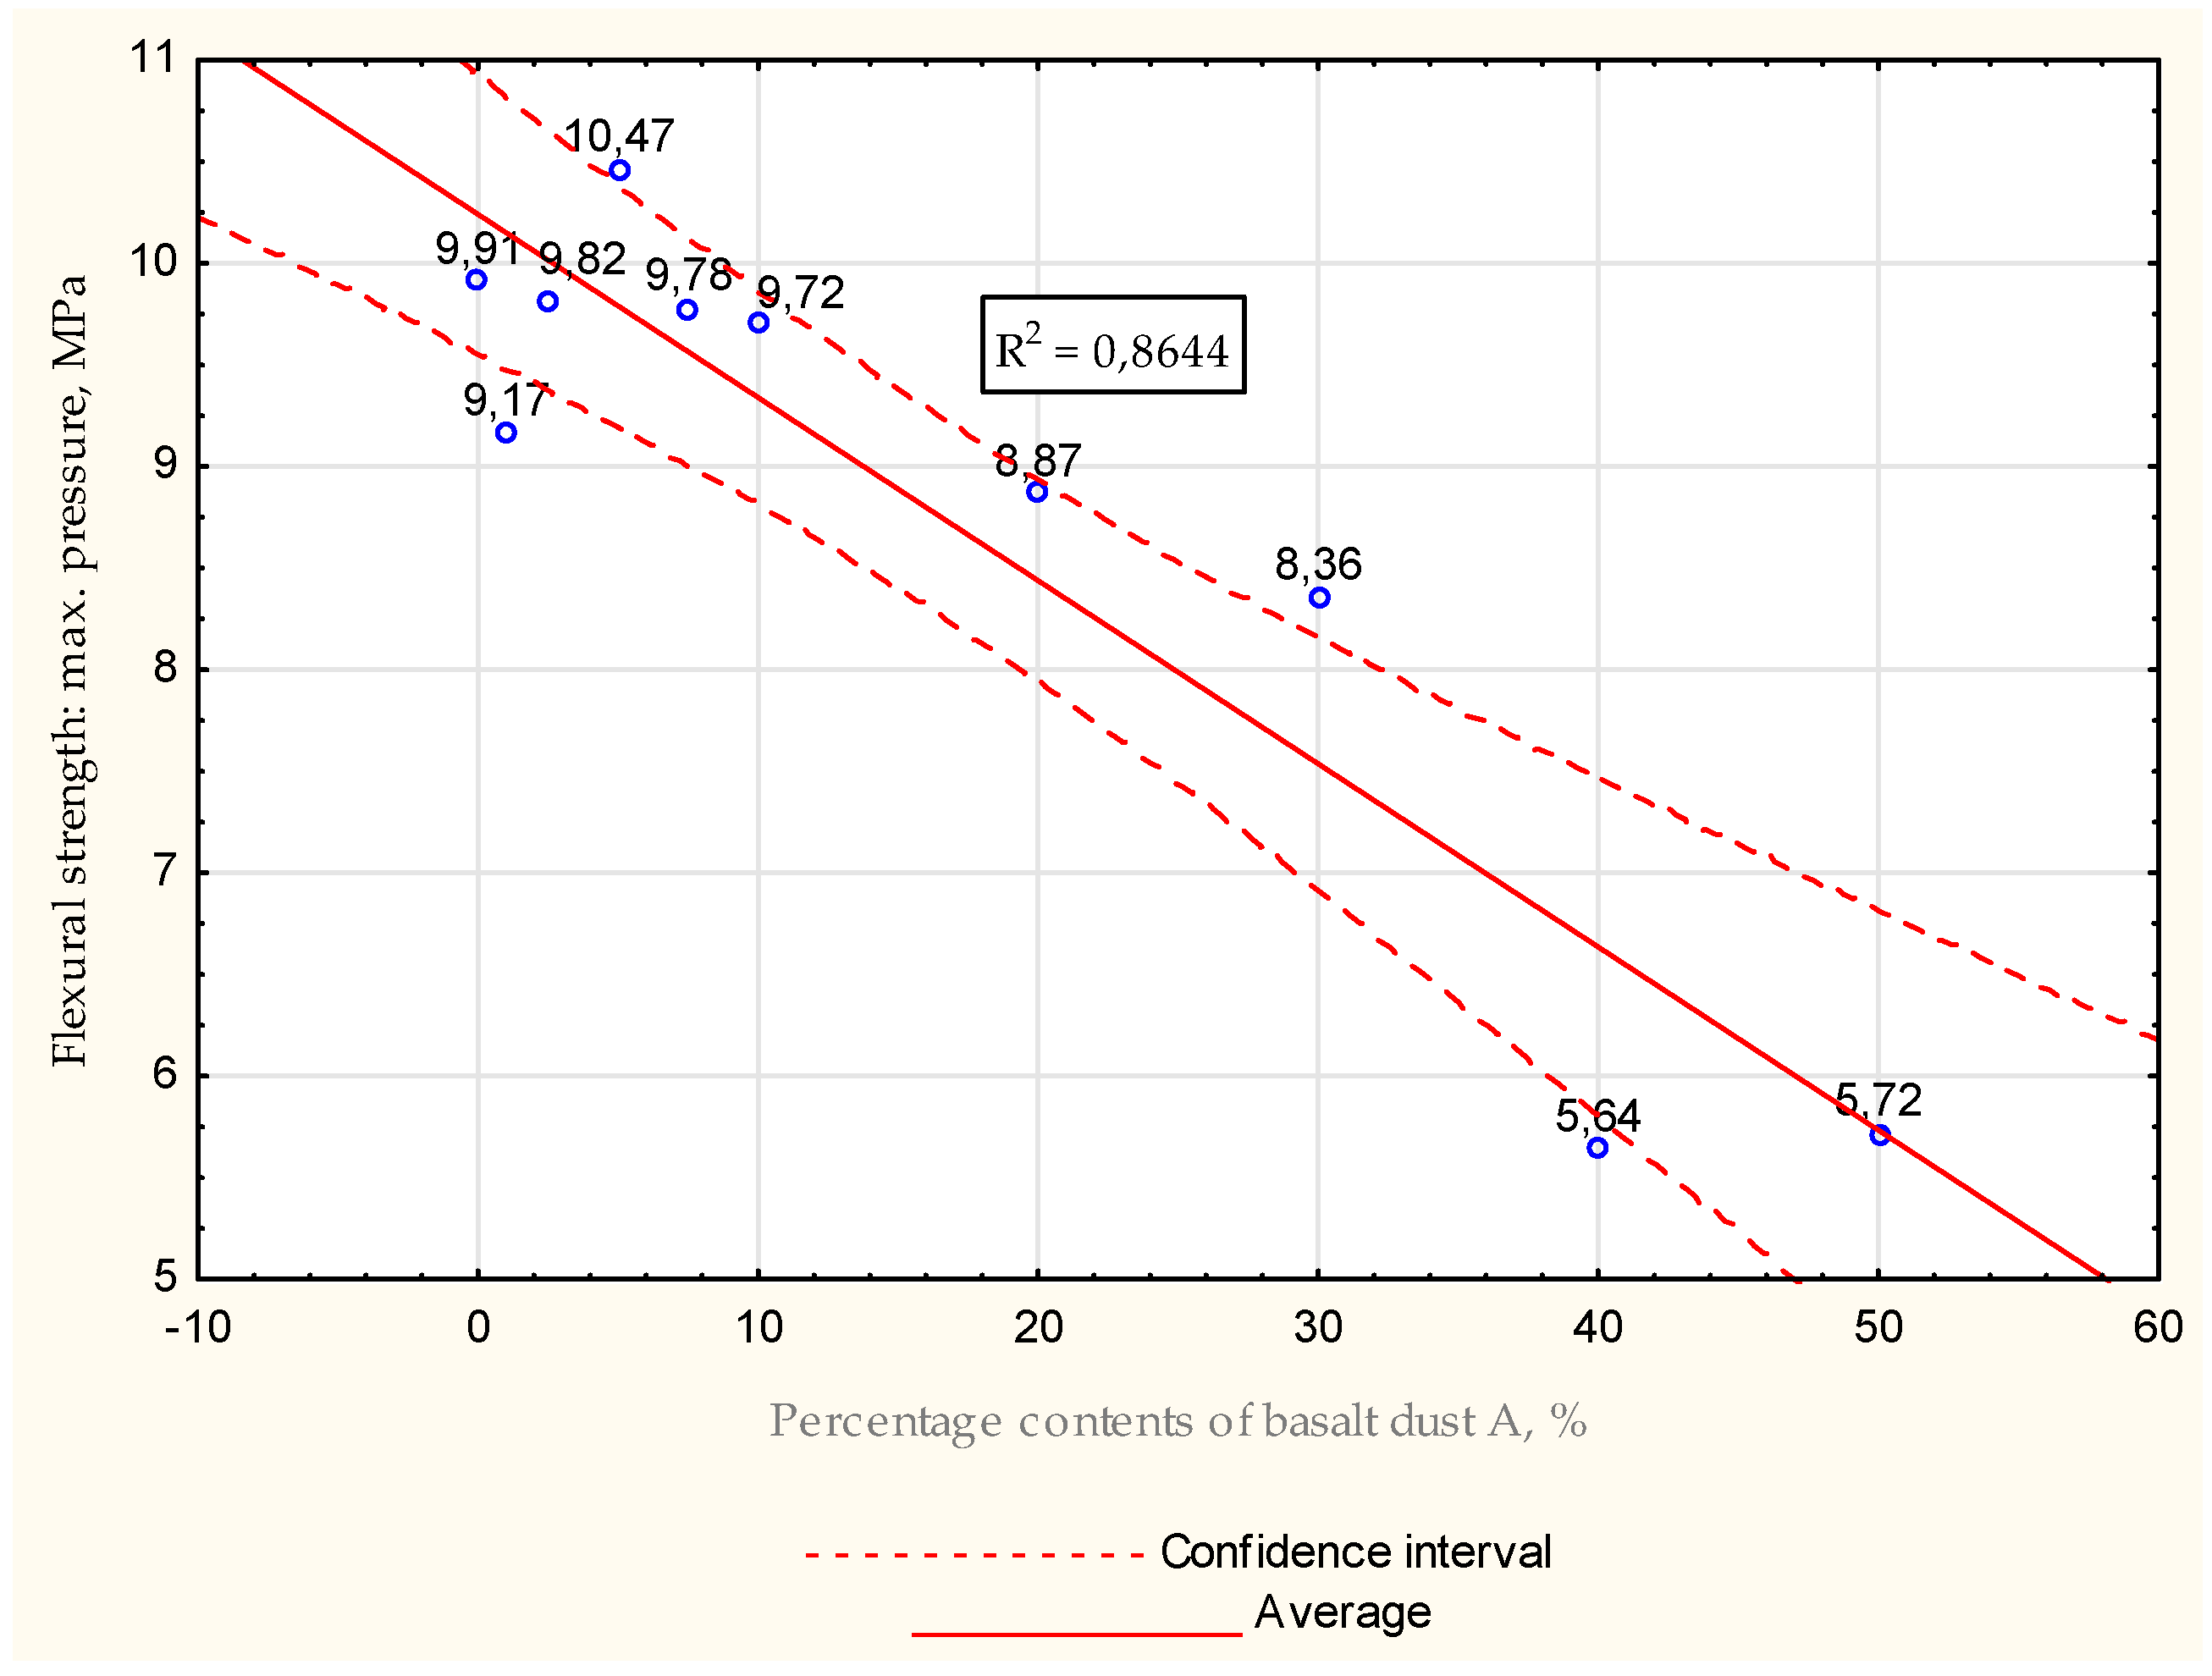
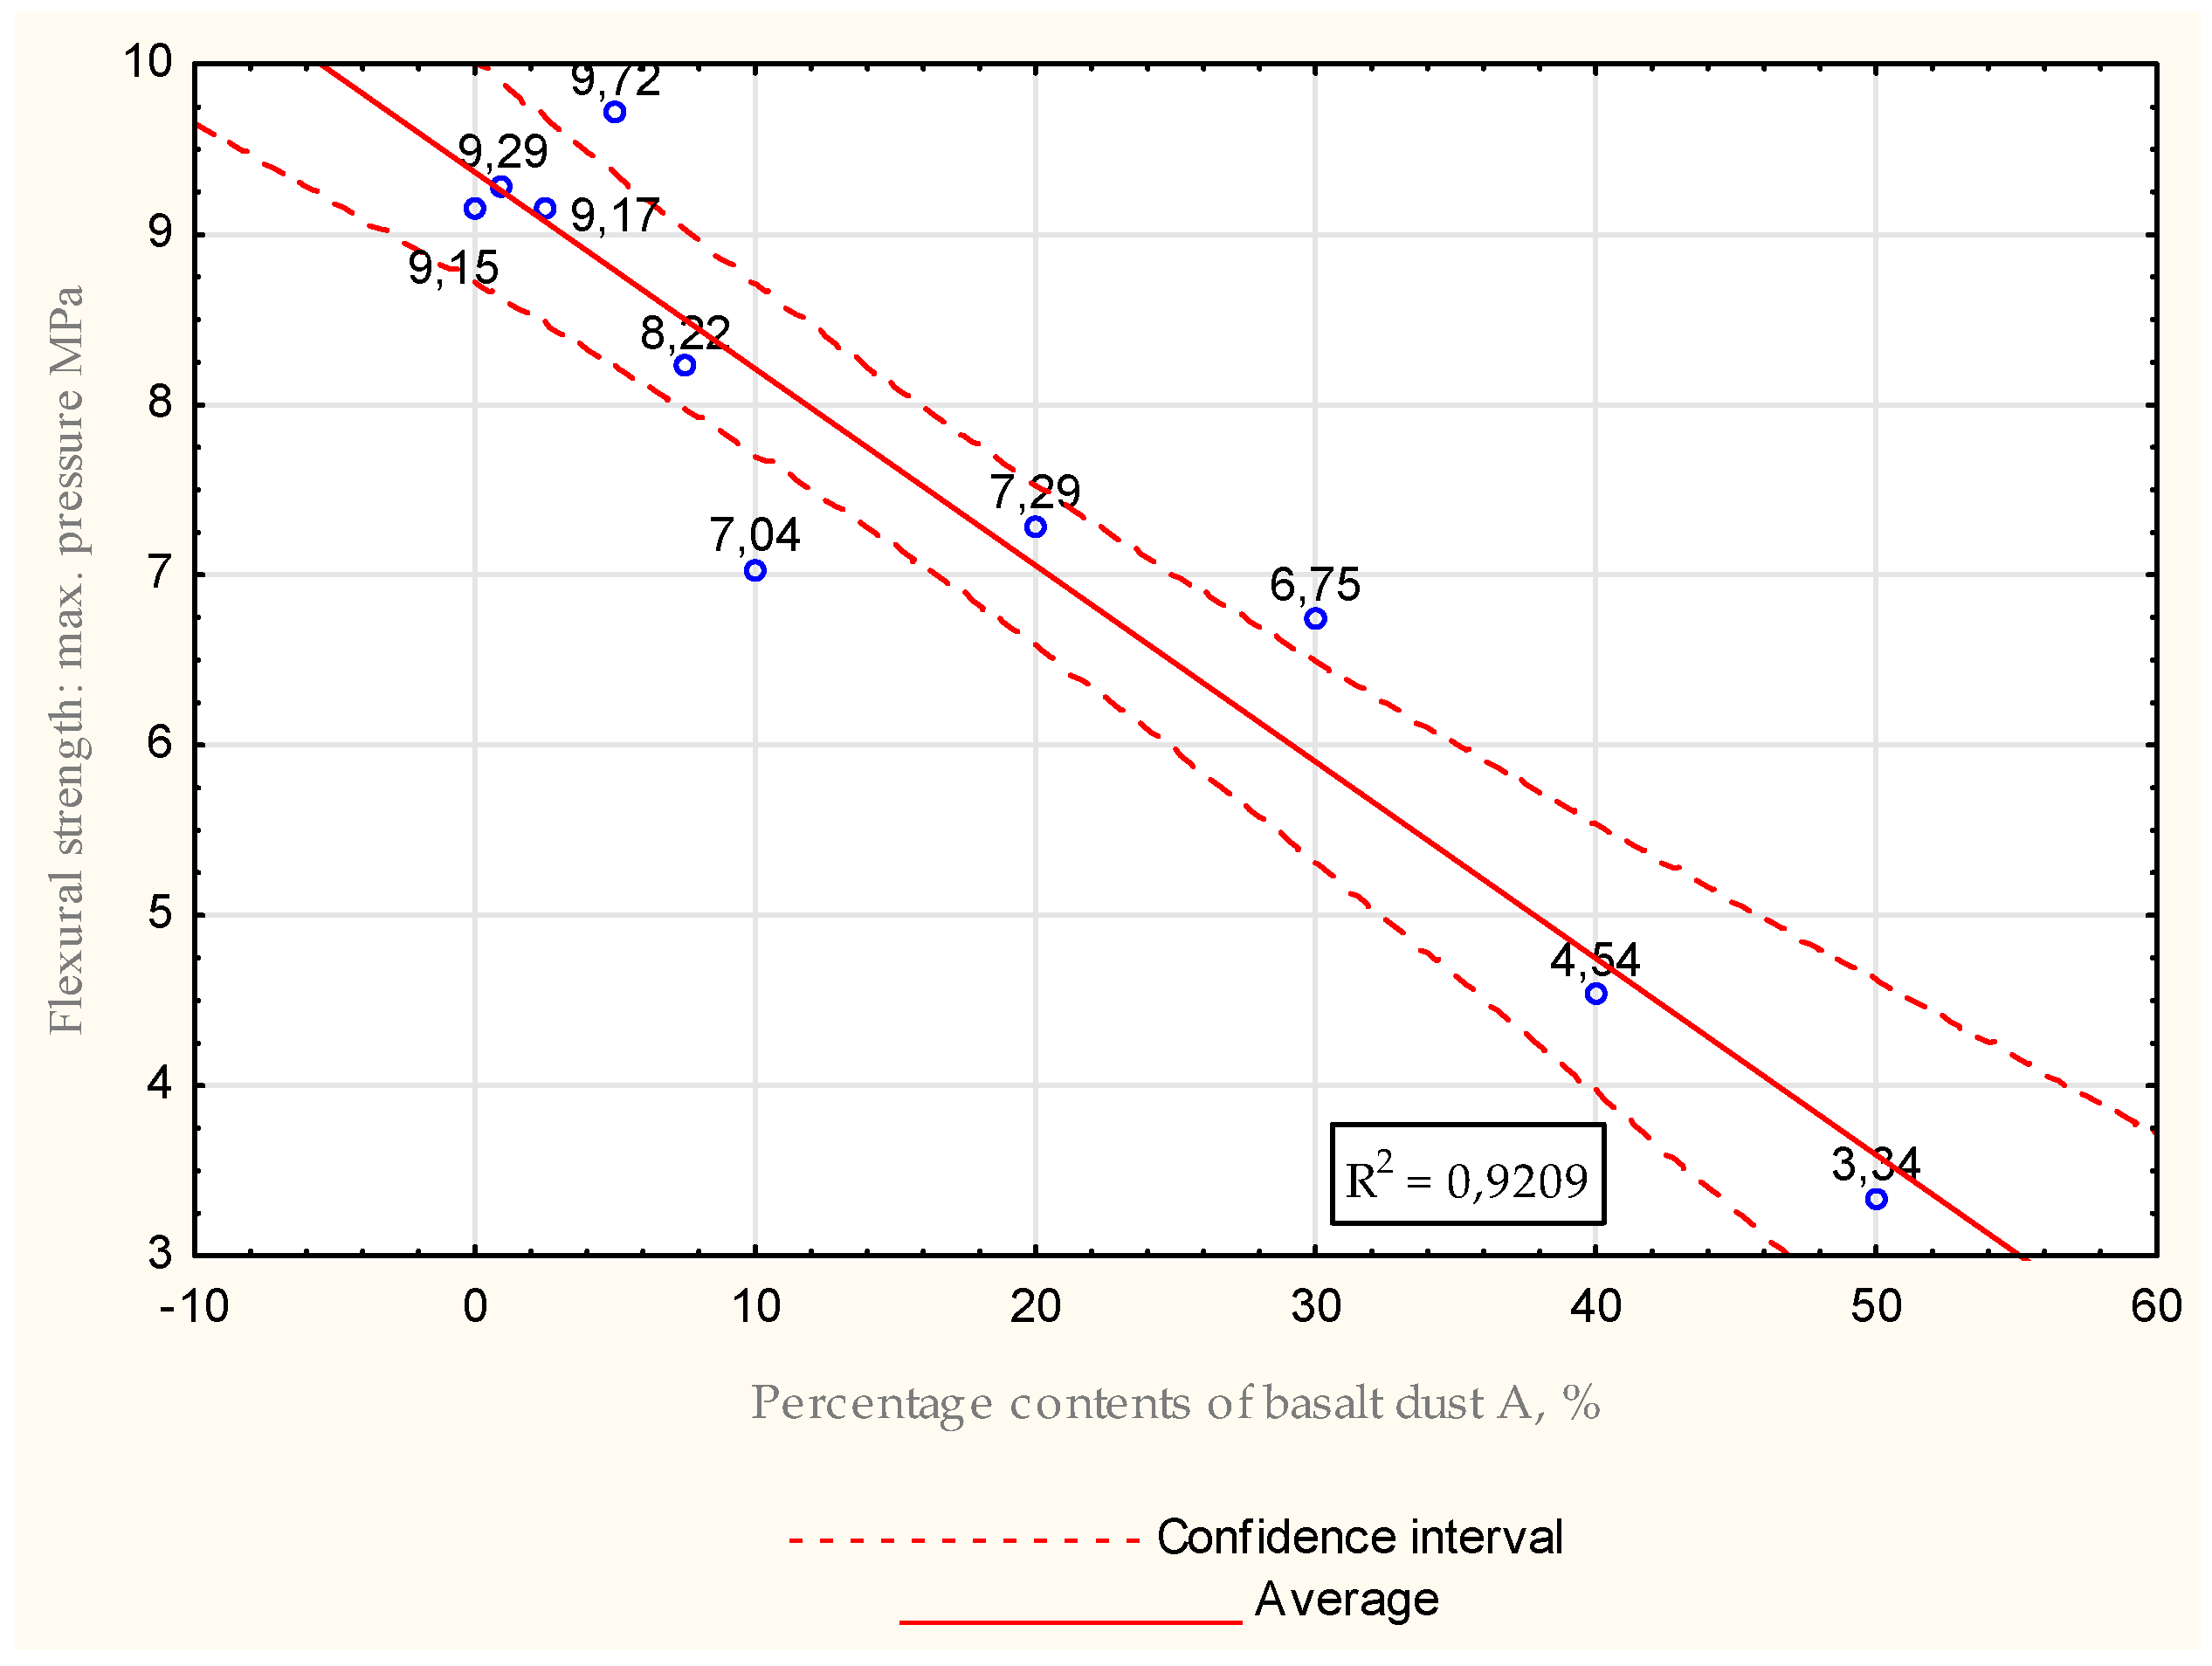
Figure 16.
Average values received during flexural strength tests for water −mix ratio = 0.5, maximal pressure.
Figure 16.
Average values received during flexural strength tests for water −mix ratio = 0.5, maximal pressure.
Figure 15 and
Figure 16 show that there was a decreasing trend in strength values as the concentration of additive in the grout increased. Hardened slurries containing dust with a concentration of 40% had flexural strength values reduced by approximately 43%. For other samples, the reduction in strength values varied between 16% for a concentration of 1% and 18% for a dust content of 30%.
Table 12.
Compressive strength tests for basalt dust A for all samples for water −mix ratio = 0.5.
Table 12.
Compressive strength tests for basalt dust A for all samples for water −mix ratio = 0.5.
| | Maximum Strength [kN] | Maximum Press Force [MPa] |
|---|
| | Statistic | |
| Minimum | 30.526 | 18.599 |
| Maximum | 78.696 | 47.127 |
| Median | 71.259 | 44.240 |
| Average | 64.061 | 39.238 |
| Standard deviation | 17.027 | 10.257 |
| The range of variation | 48.170 | 28.528 |
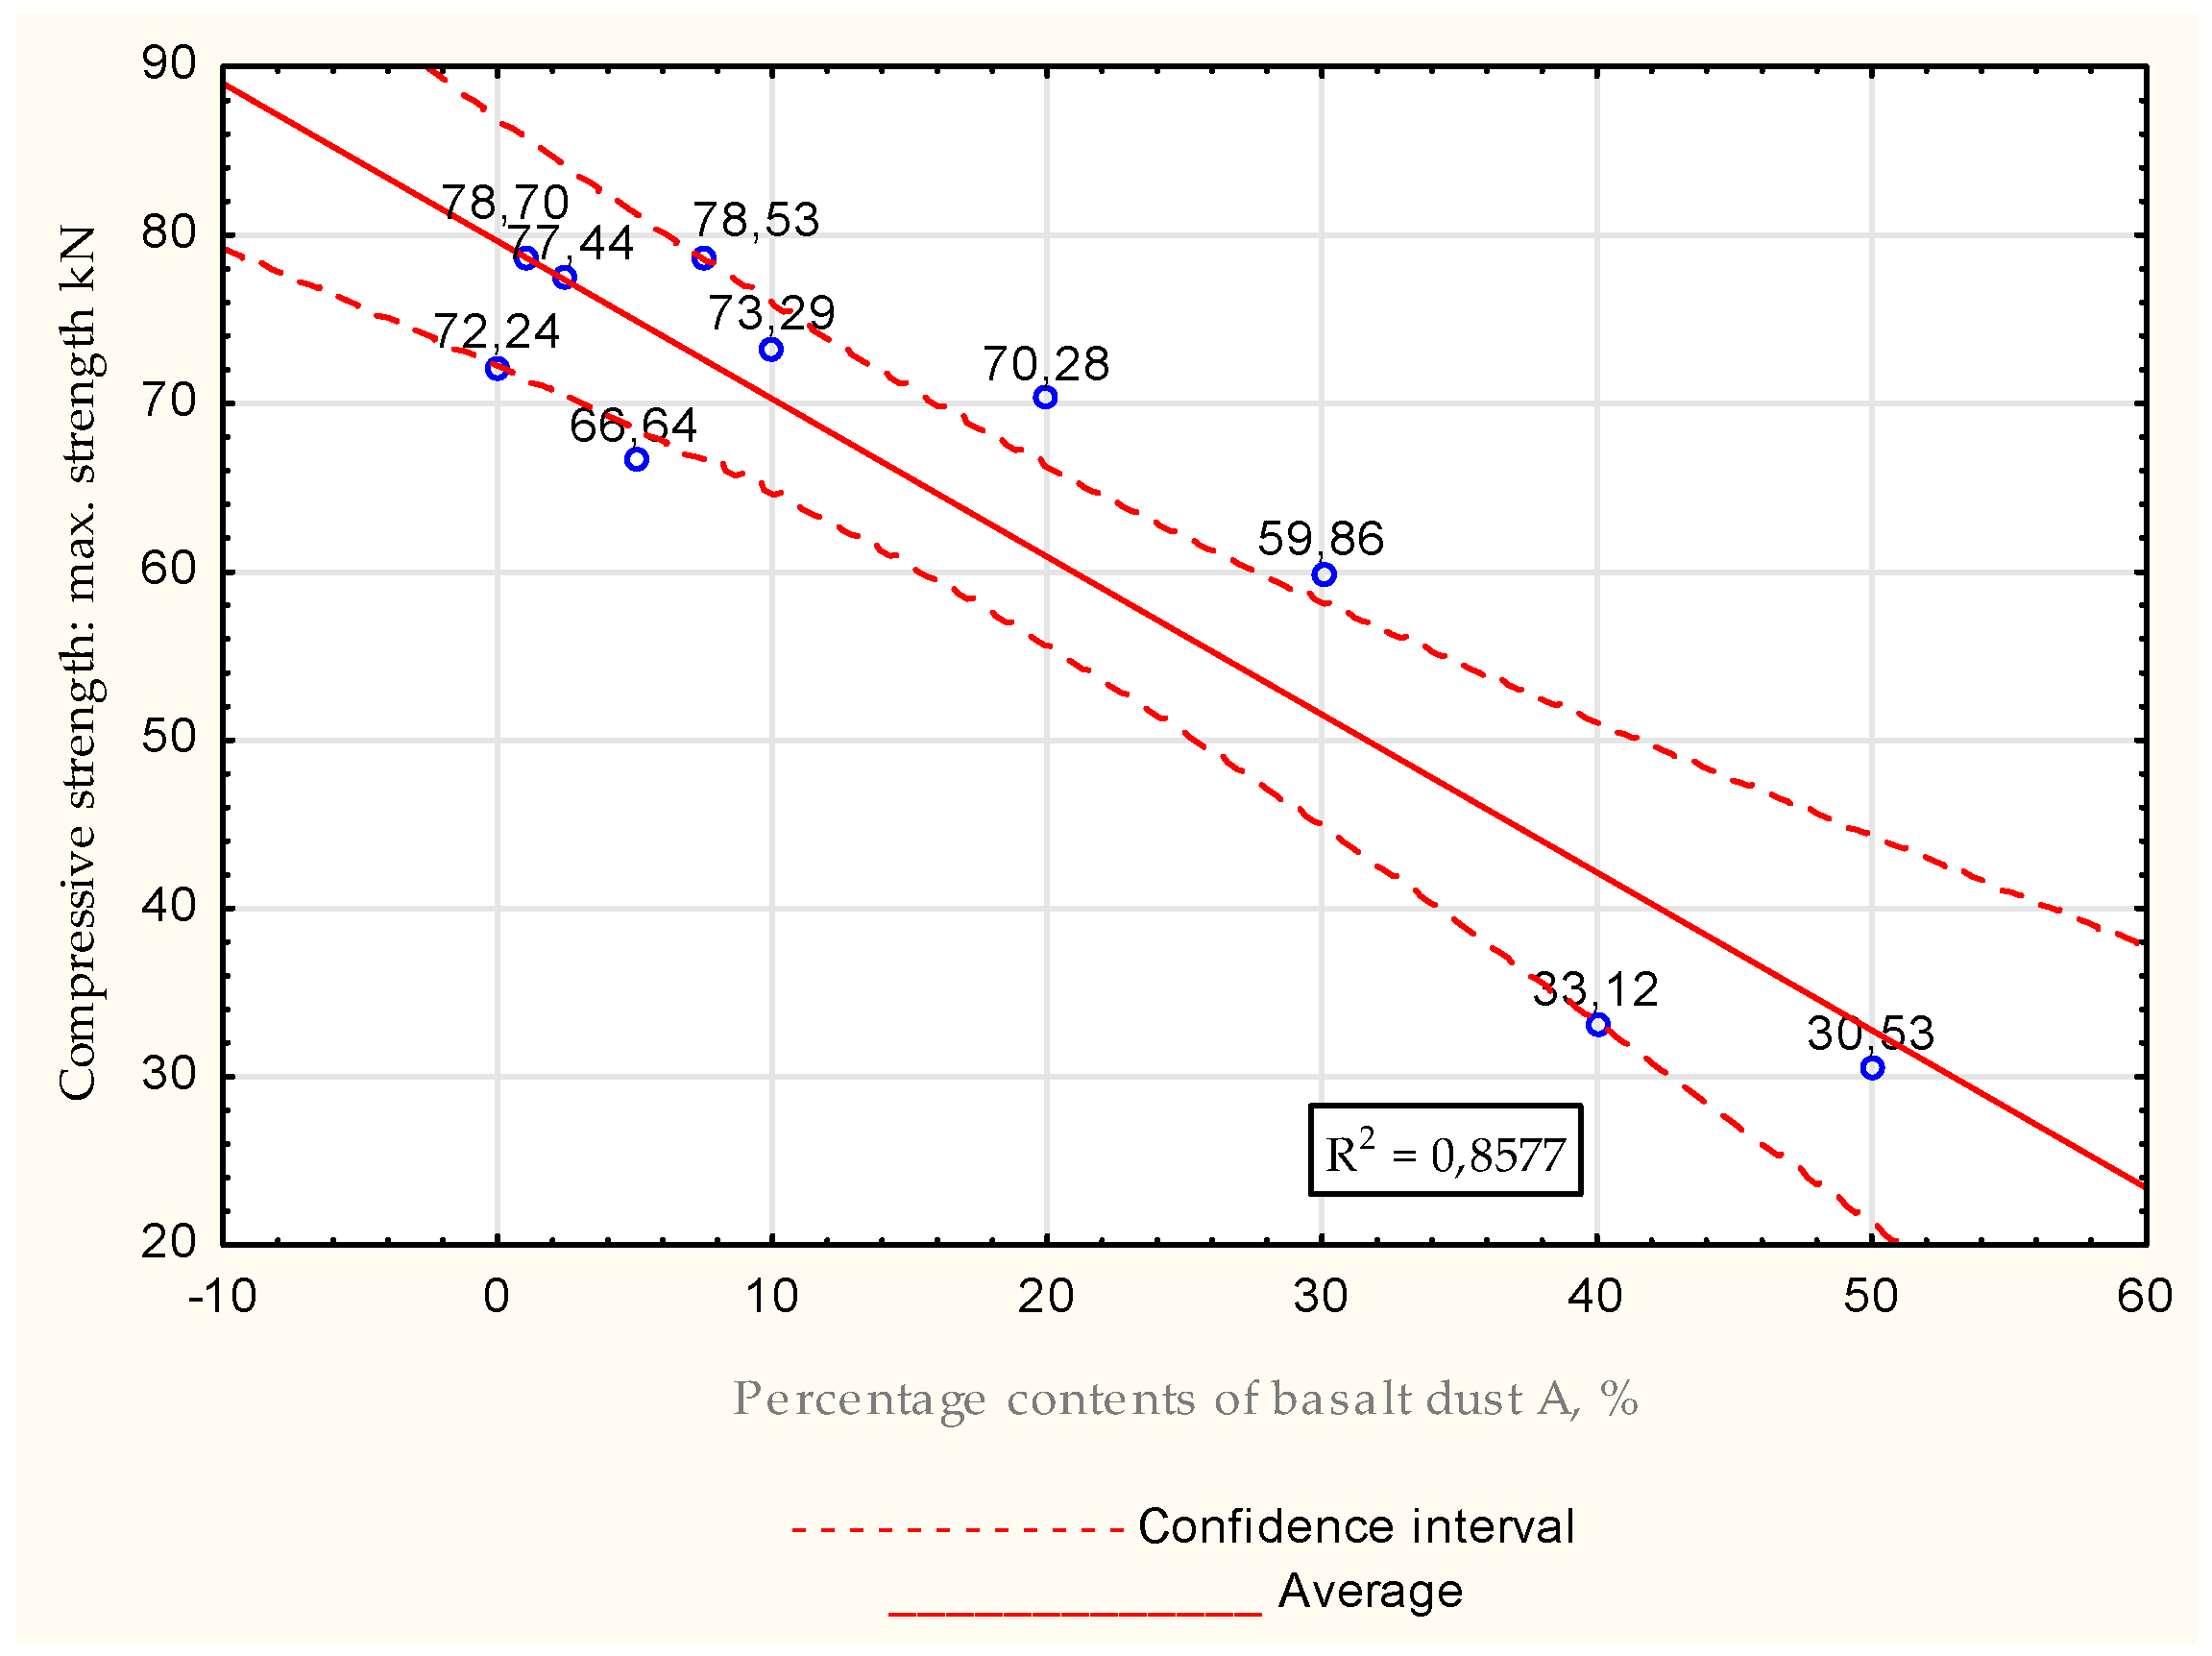
Figure 17.
Average values received during compressive strength tests for water −mix ratio = 0.5, max. strength.
Figure 17.
Average values received during compressive strength tests for water −mix ratio = 0.5, max. strength.
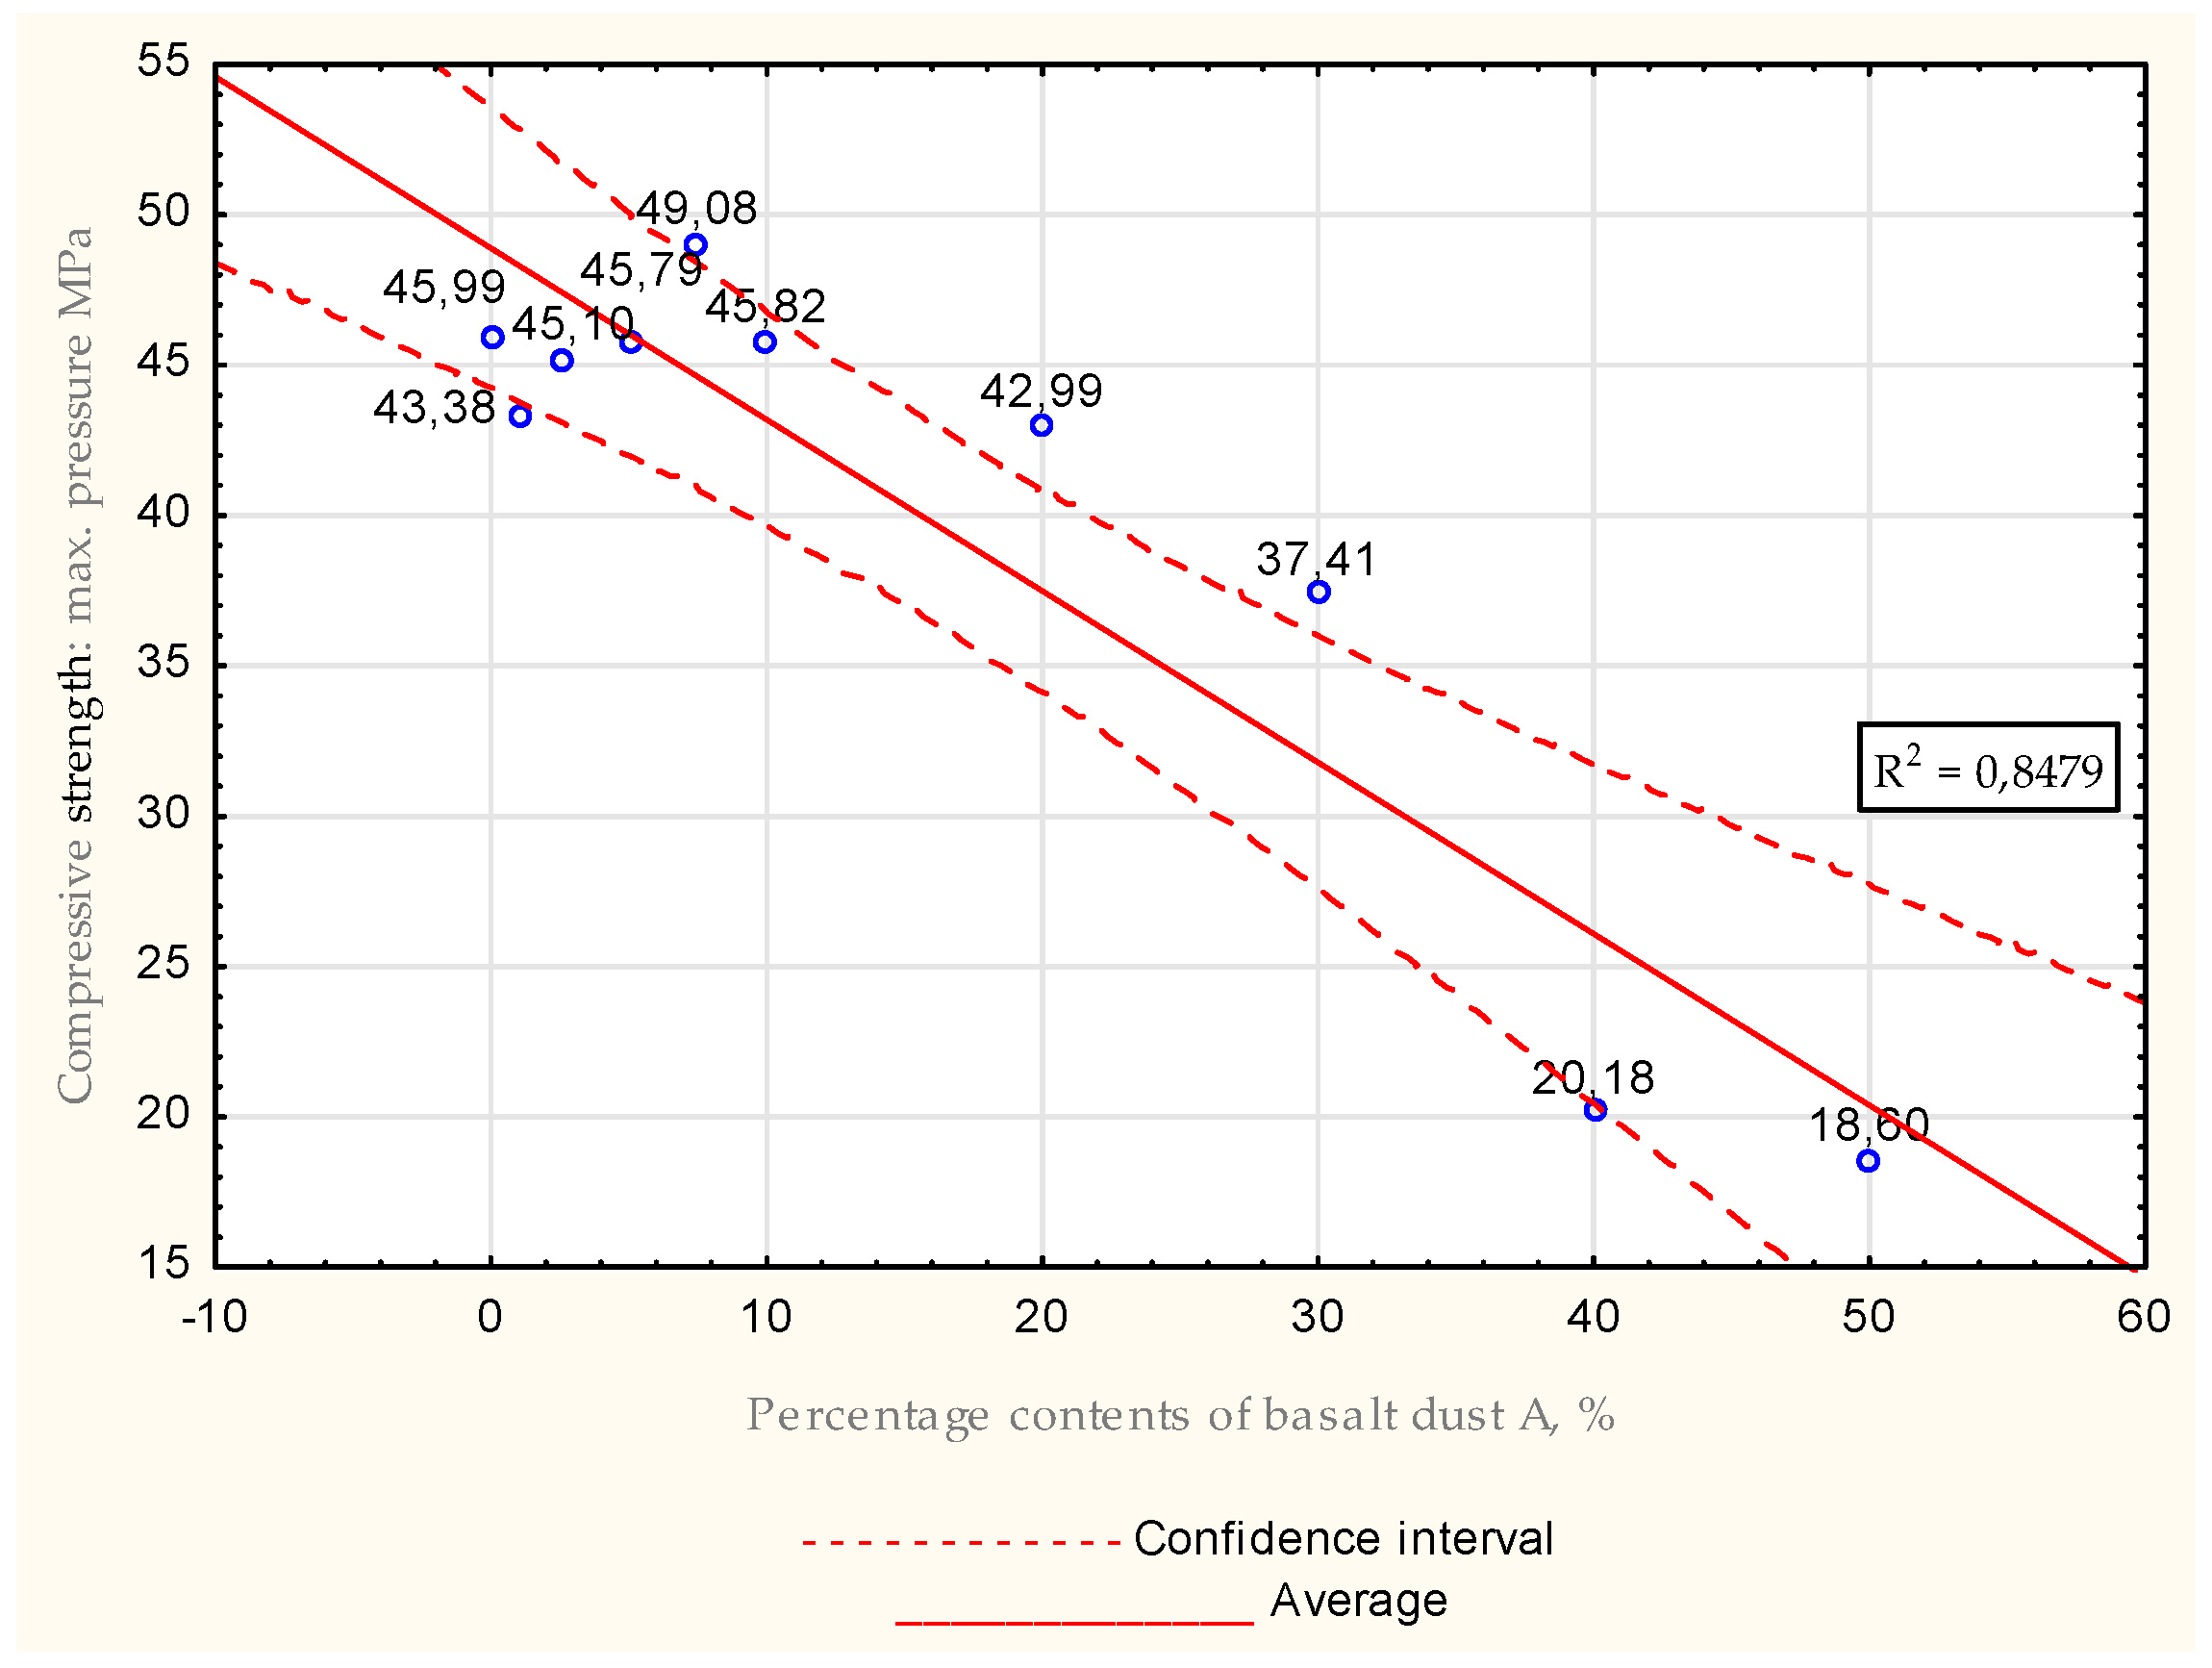
Figure 18.
Average values received during compressive strength tests for water −mix ratio = 0.5, max. pressure.
Figure 18.
Average values received during compressive strength tests for water −mix ratio = 0.5, max. pressure.
Compressive strength values again showed a decreasing trend in strength with increasing basalt dust concentration. The lowest strength value was obtained for the sample containing 40% basalt dust, for which the strength value was 55% lower than that of the zero sample. In the remaining samples, the reduction in conductivity values varied by a maximum of 11%.
For a water −mix ratio of 0.5, there was a decreasing trend in flexural and compressive strength values for formulations containing dust concentrations of 10% and above for both strength tests.
Table 13.
Flexural strength tests for basalt dust A for all samples for water −mix ratio = 0.6.
Table 13.
Flexural strength tests for basalt dust A for all samples for water −mix ratio = 0.6.
| | Maximum Strength [kN] | Maximum Press Force [MPa] |
|---|
| | Statistic | |
| Minimum | 1.286 | 3.340 |
| Maximum | 4.145 | 9.715 |
| Median | 3.309 | 7.756 |
| Average | 3.186 | 7.450 |
| Standard deviation | 0.913 | 2.025 |
| The range of variation | 2.860 | 6.375 |
Figure 19.
Average values received during flexural strength tests for water −mix ratio = 0.6, maximal strength.
Figure 19.
Average values received during flexural strength tests for water −mix ratio = 0.6, maximal strength.
Figure 20.
Average values received during flexural strength tests for water −mix ratio = 0.6.
Figure 20.
Average values received during flexural strength tests for water −mix ratio = 0.6.
For water −mix ratio 0.6, for samples with an additive concentration above 7.5%, there was a trend of decreasing flexural and compressive strength values as the additive concentration of the grout increased. For flexural strength, it was noted that increased strengths occurred for formulations with low additive contents of 1%, 2.5% and 5%. Comparing the values of these strengths to those of the zero sample, it can be seen that the difference was a maximum of 15%. For samples that had dust concentrations of 7.5% and above in their composition, the values of flexural strength decreased by up to 26%.
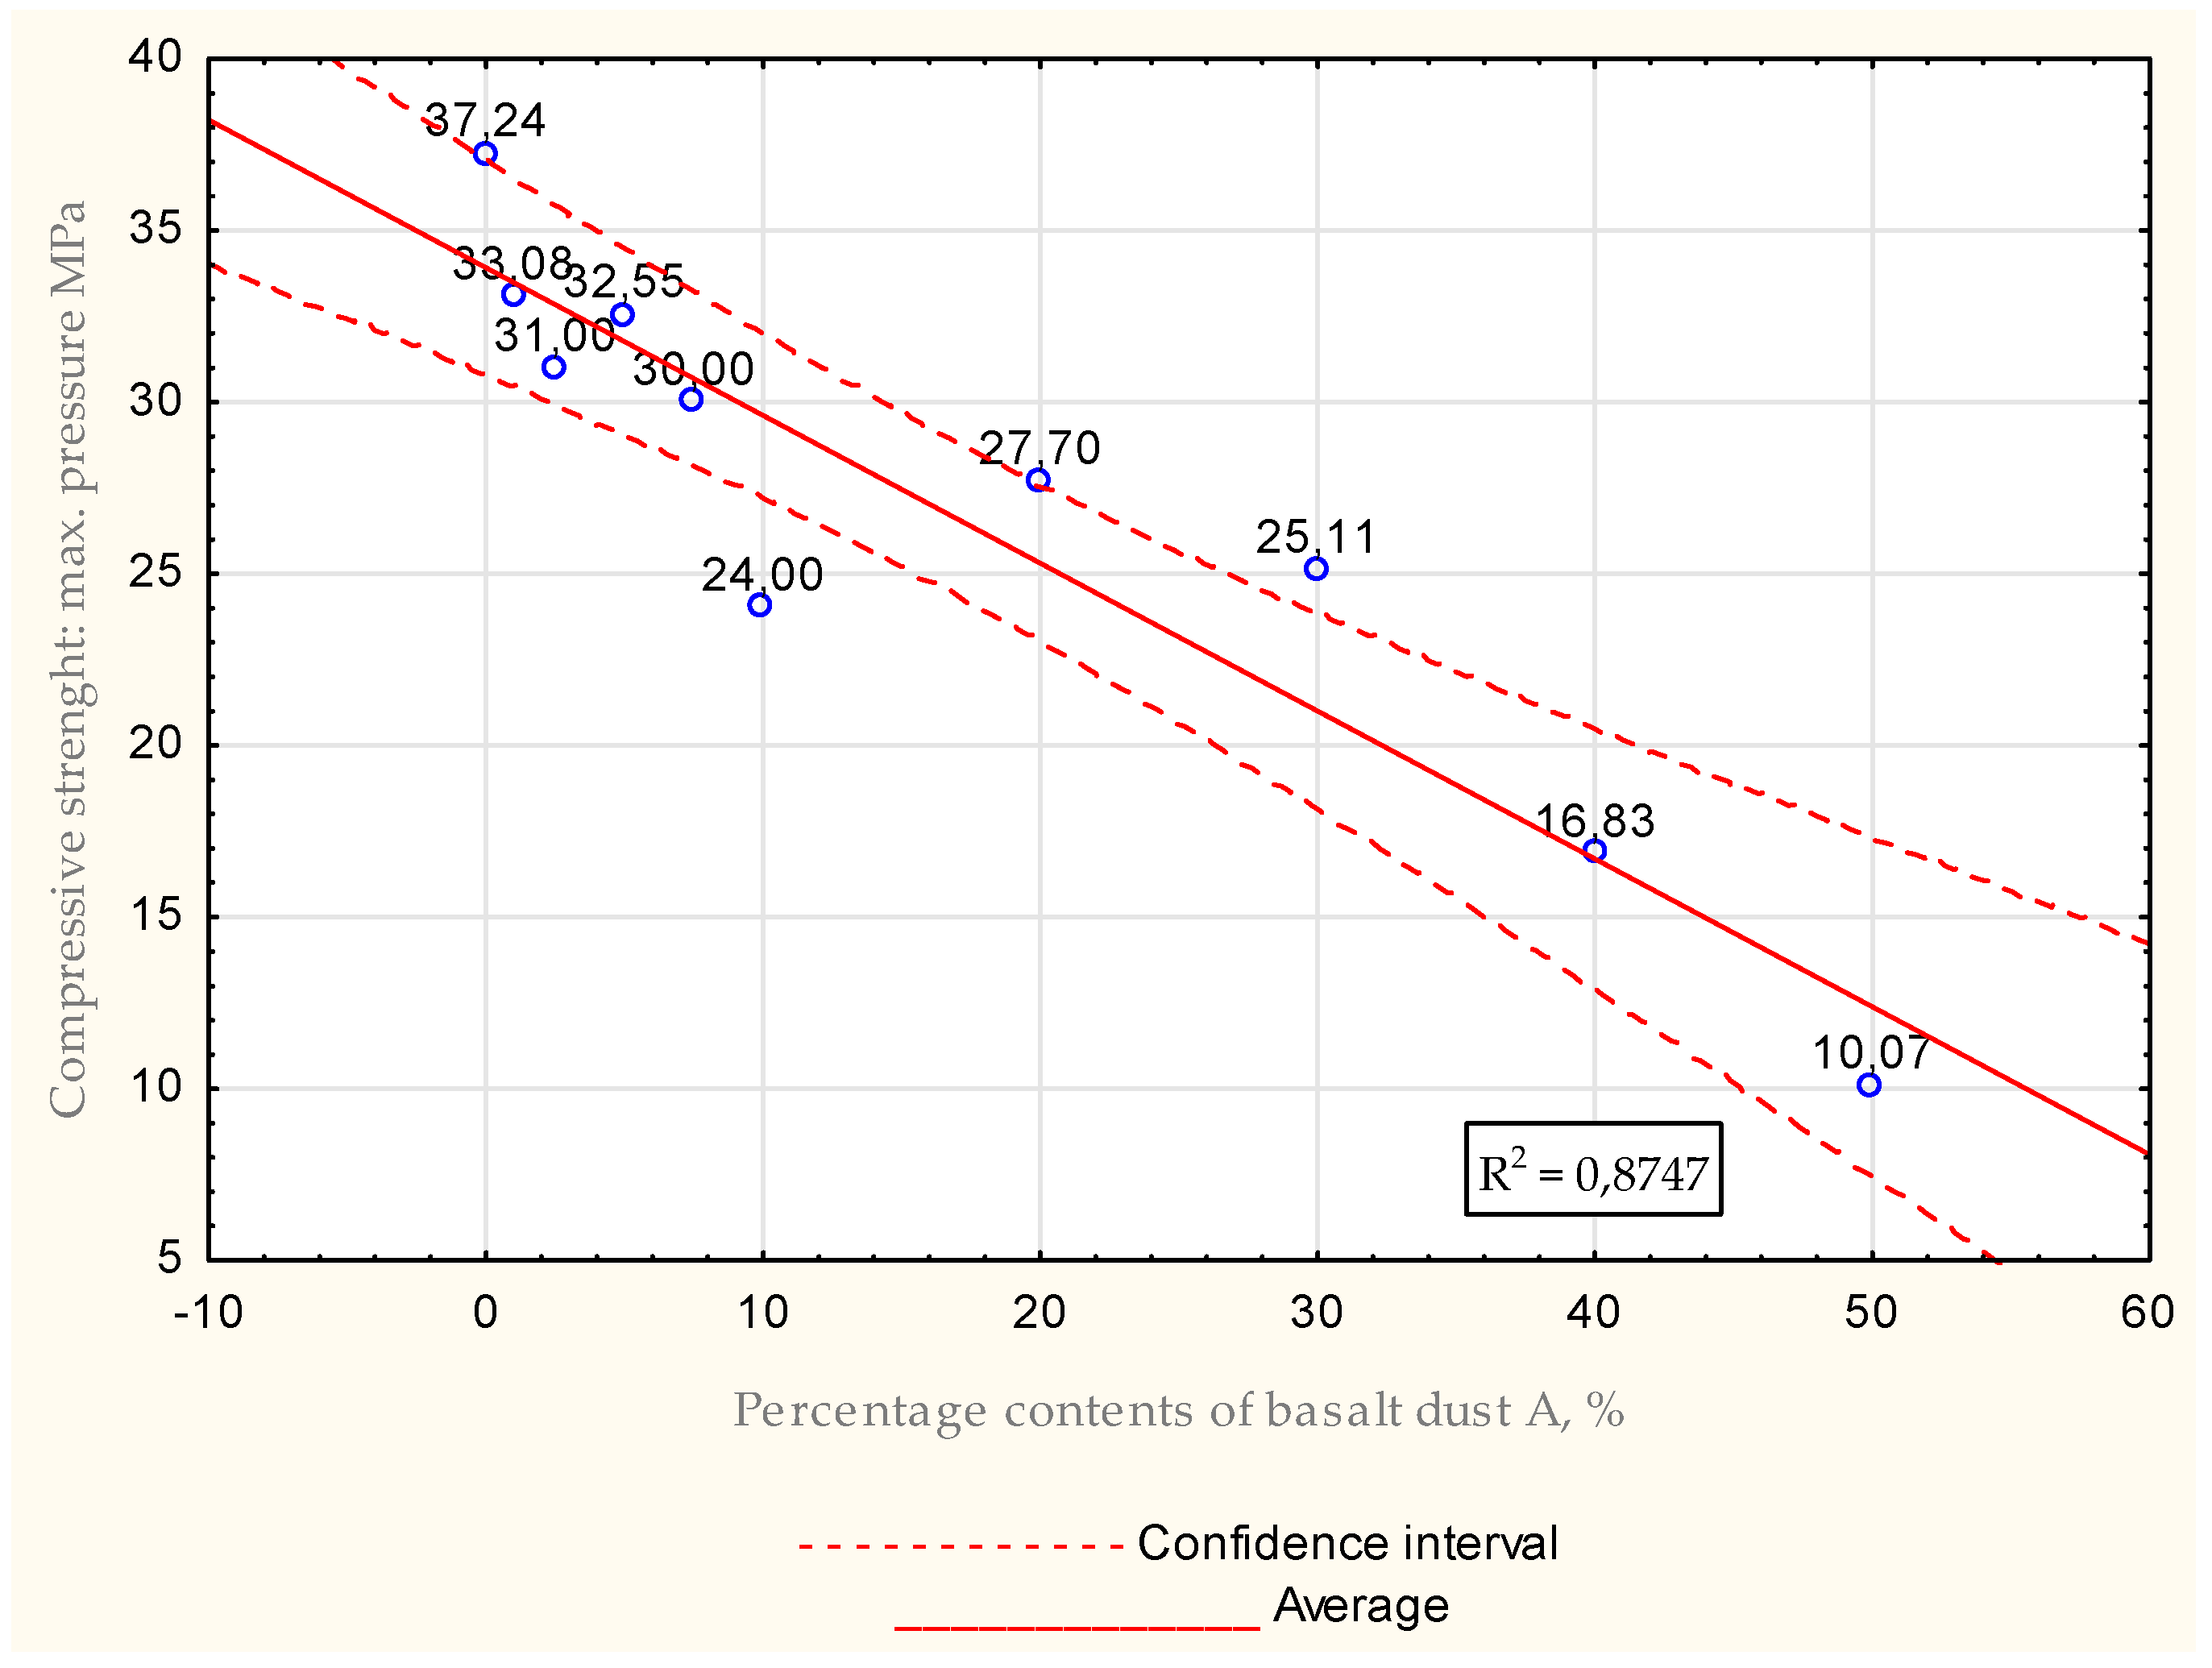
Table 14.
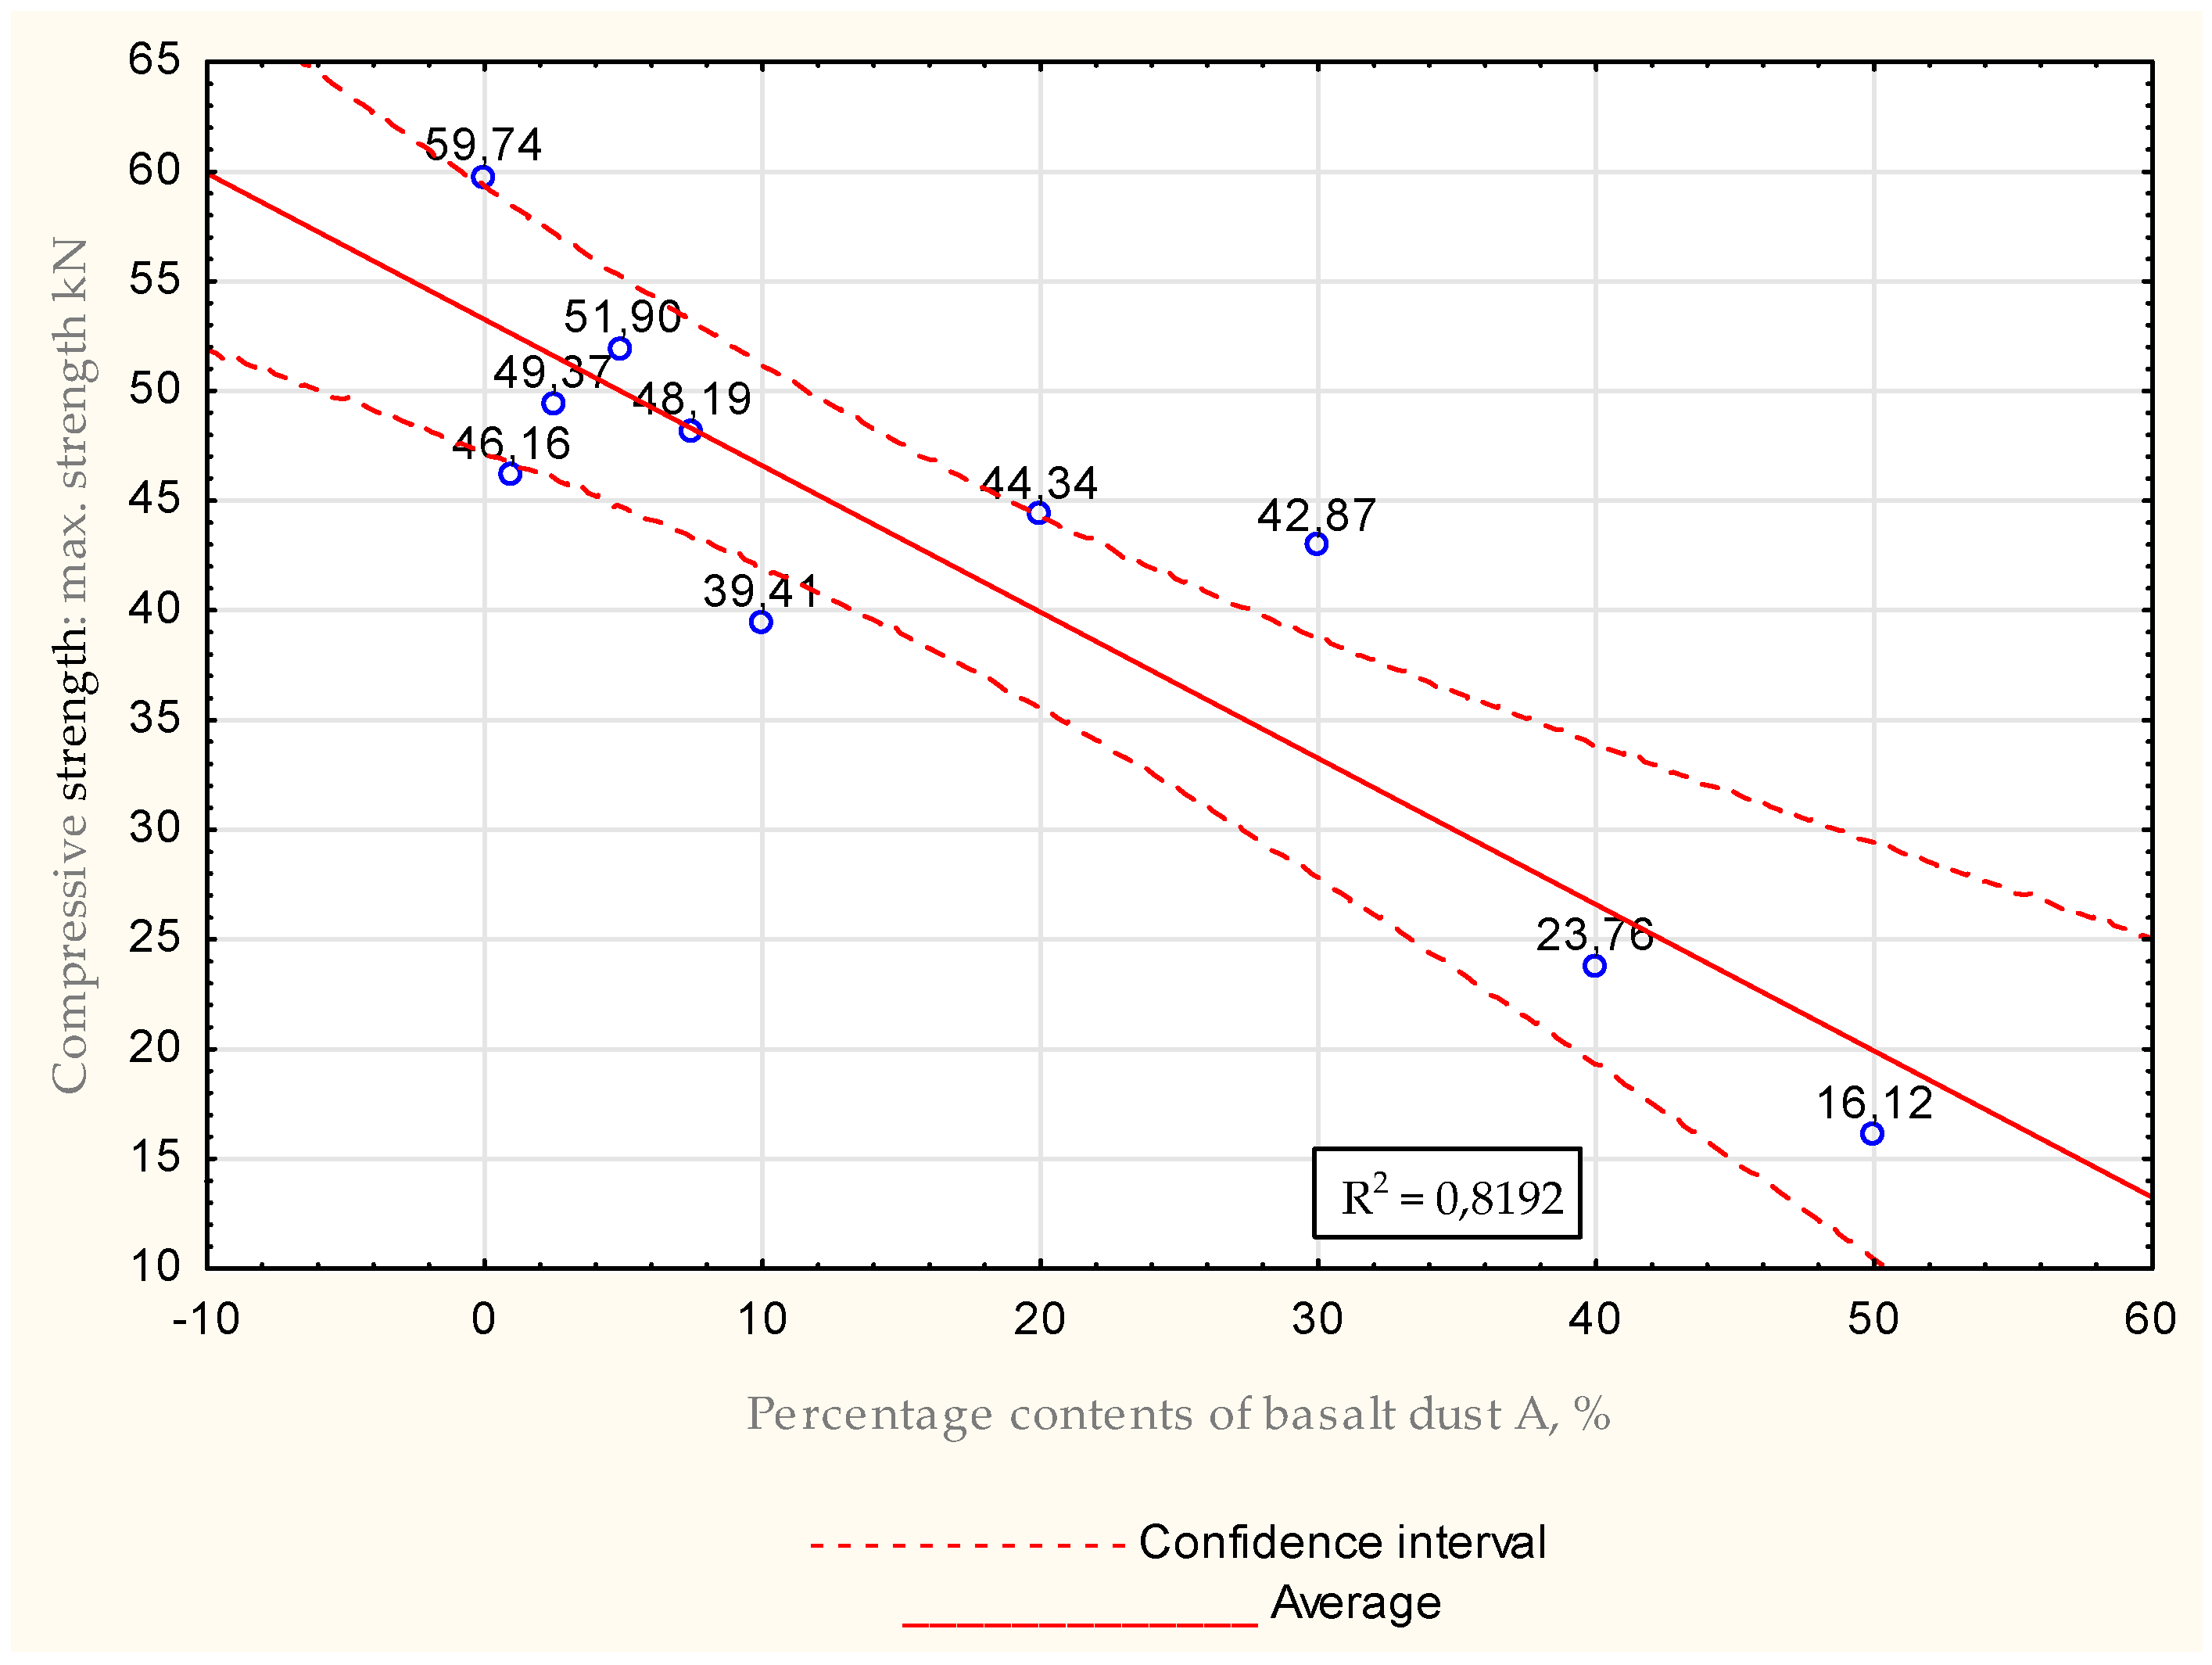
Compressive strength tests for basalt dust A for all samples for water −mix ratio = 0.6.
Table 14.
Compressive strength tests for basalt dust A for all samples for water −mix ratio = 0.6.
| | Maximum Strength [kN] | Maximum Press Force [MPa] |
|---|
| | Statistic | |
| Minimum | 16.116 | 10.073 |
| Maximum | 59.736 | 37.243 |
| Median | 45.249 | 28.850 |
| Average | 42.185 | 26.758 |
| Standard deviation | 12.401 | 7.747 |
| The range of variation | 43.620 | 27.170 |
Figure 21.
Average values received during compressive strength tests for water −mix ratio = 0.6, maximal strength.
Figure 21.
Average values received during compressive strength tests for water −mix ratio = 0.6, maximal strength.
Figure 22.
Average values received during compressive strength tests for water −mix ratio = 0.6, maximal pressure.
Figure 22.
Average values received during compressive strength tests for water −mix ratio = 0.6, maximal pressure.
The compressive strength values of the cement slurries for all tested formulas were lower than those of the zero sample. The closest to the zero sample was the formula containing 5% dust in its composition, for which the values were about 1.5% lower. For the other samples, the compressive strength values were reduced in the range of 6–37% compared to the zero sample.
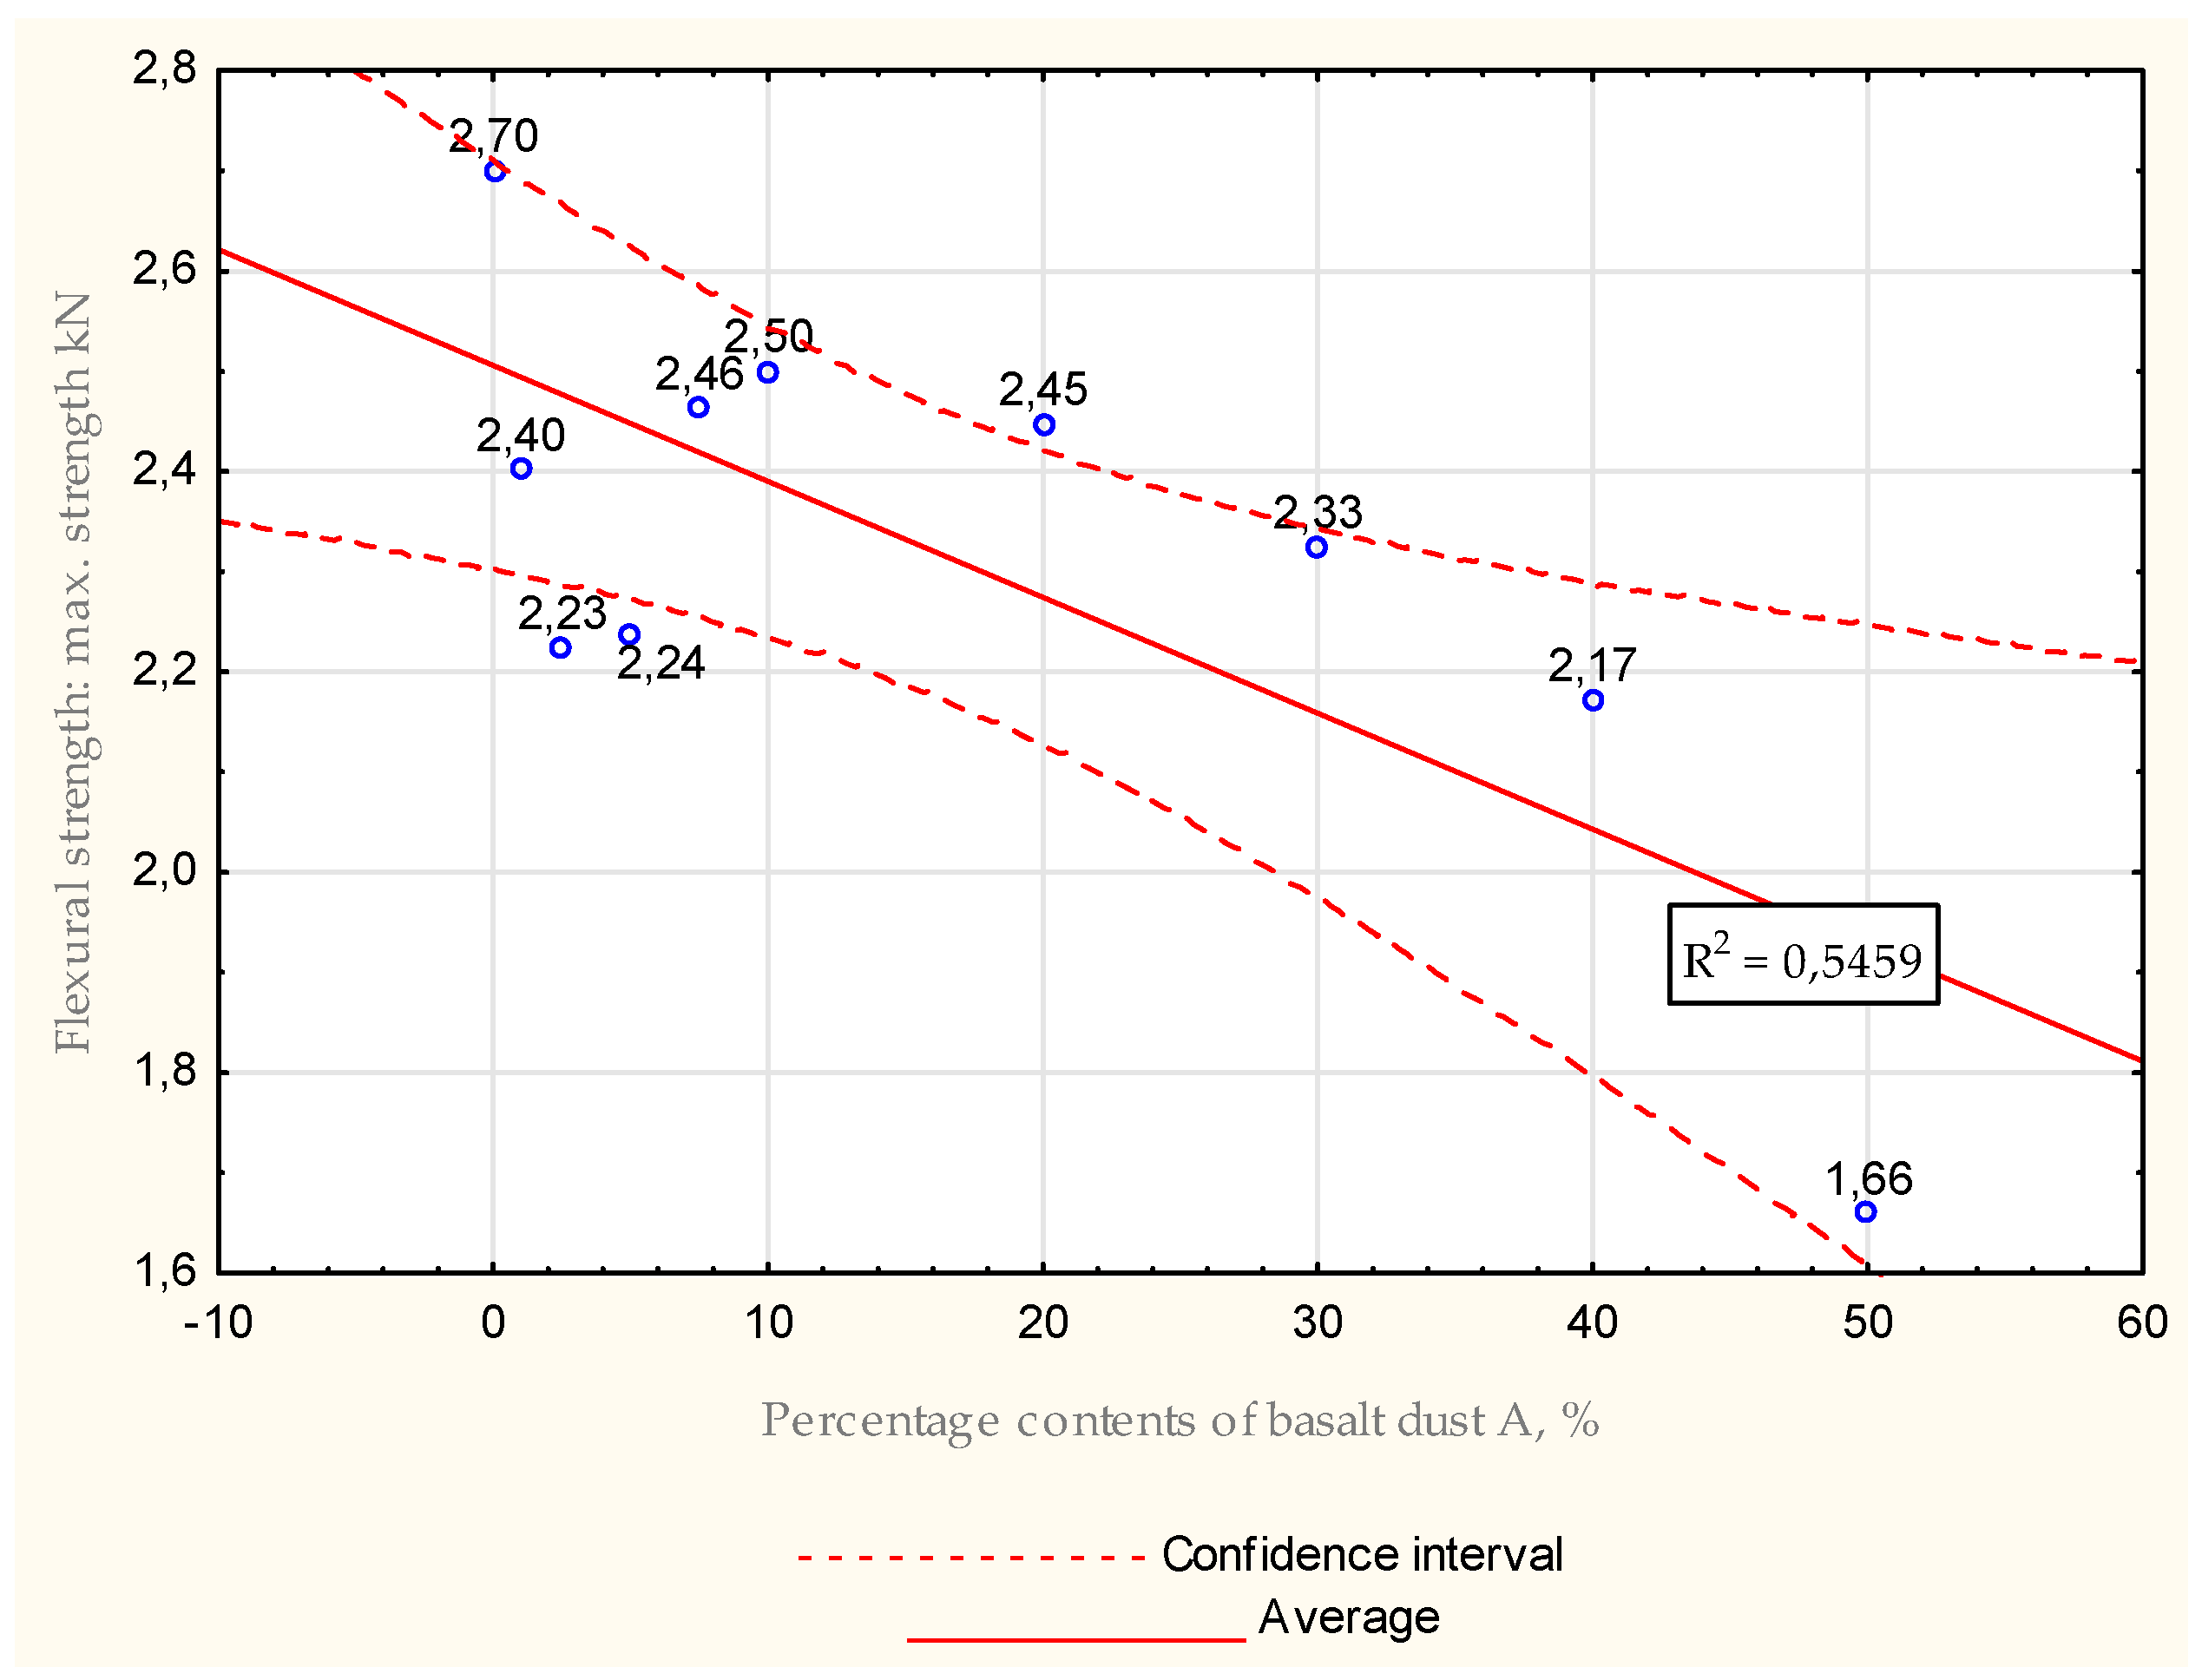
Table 15.
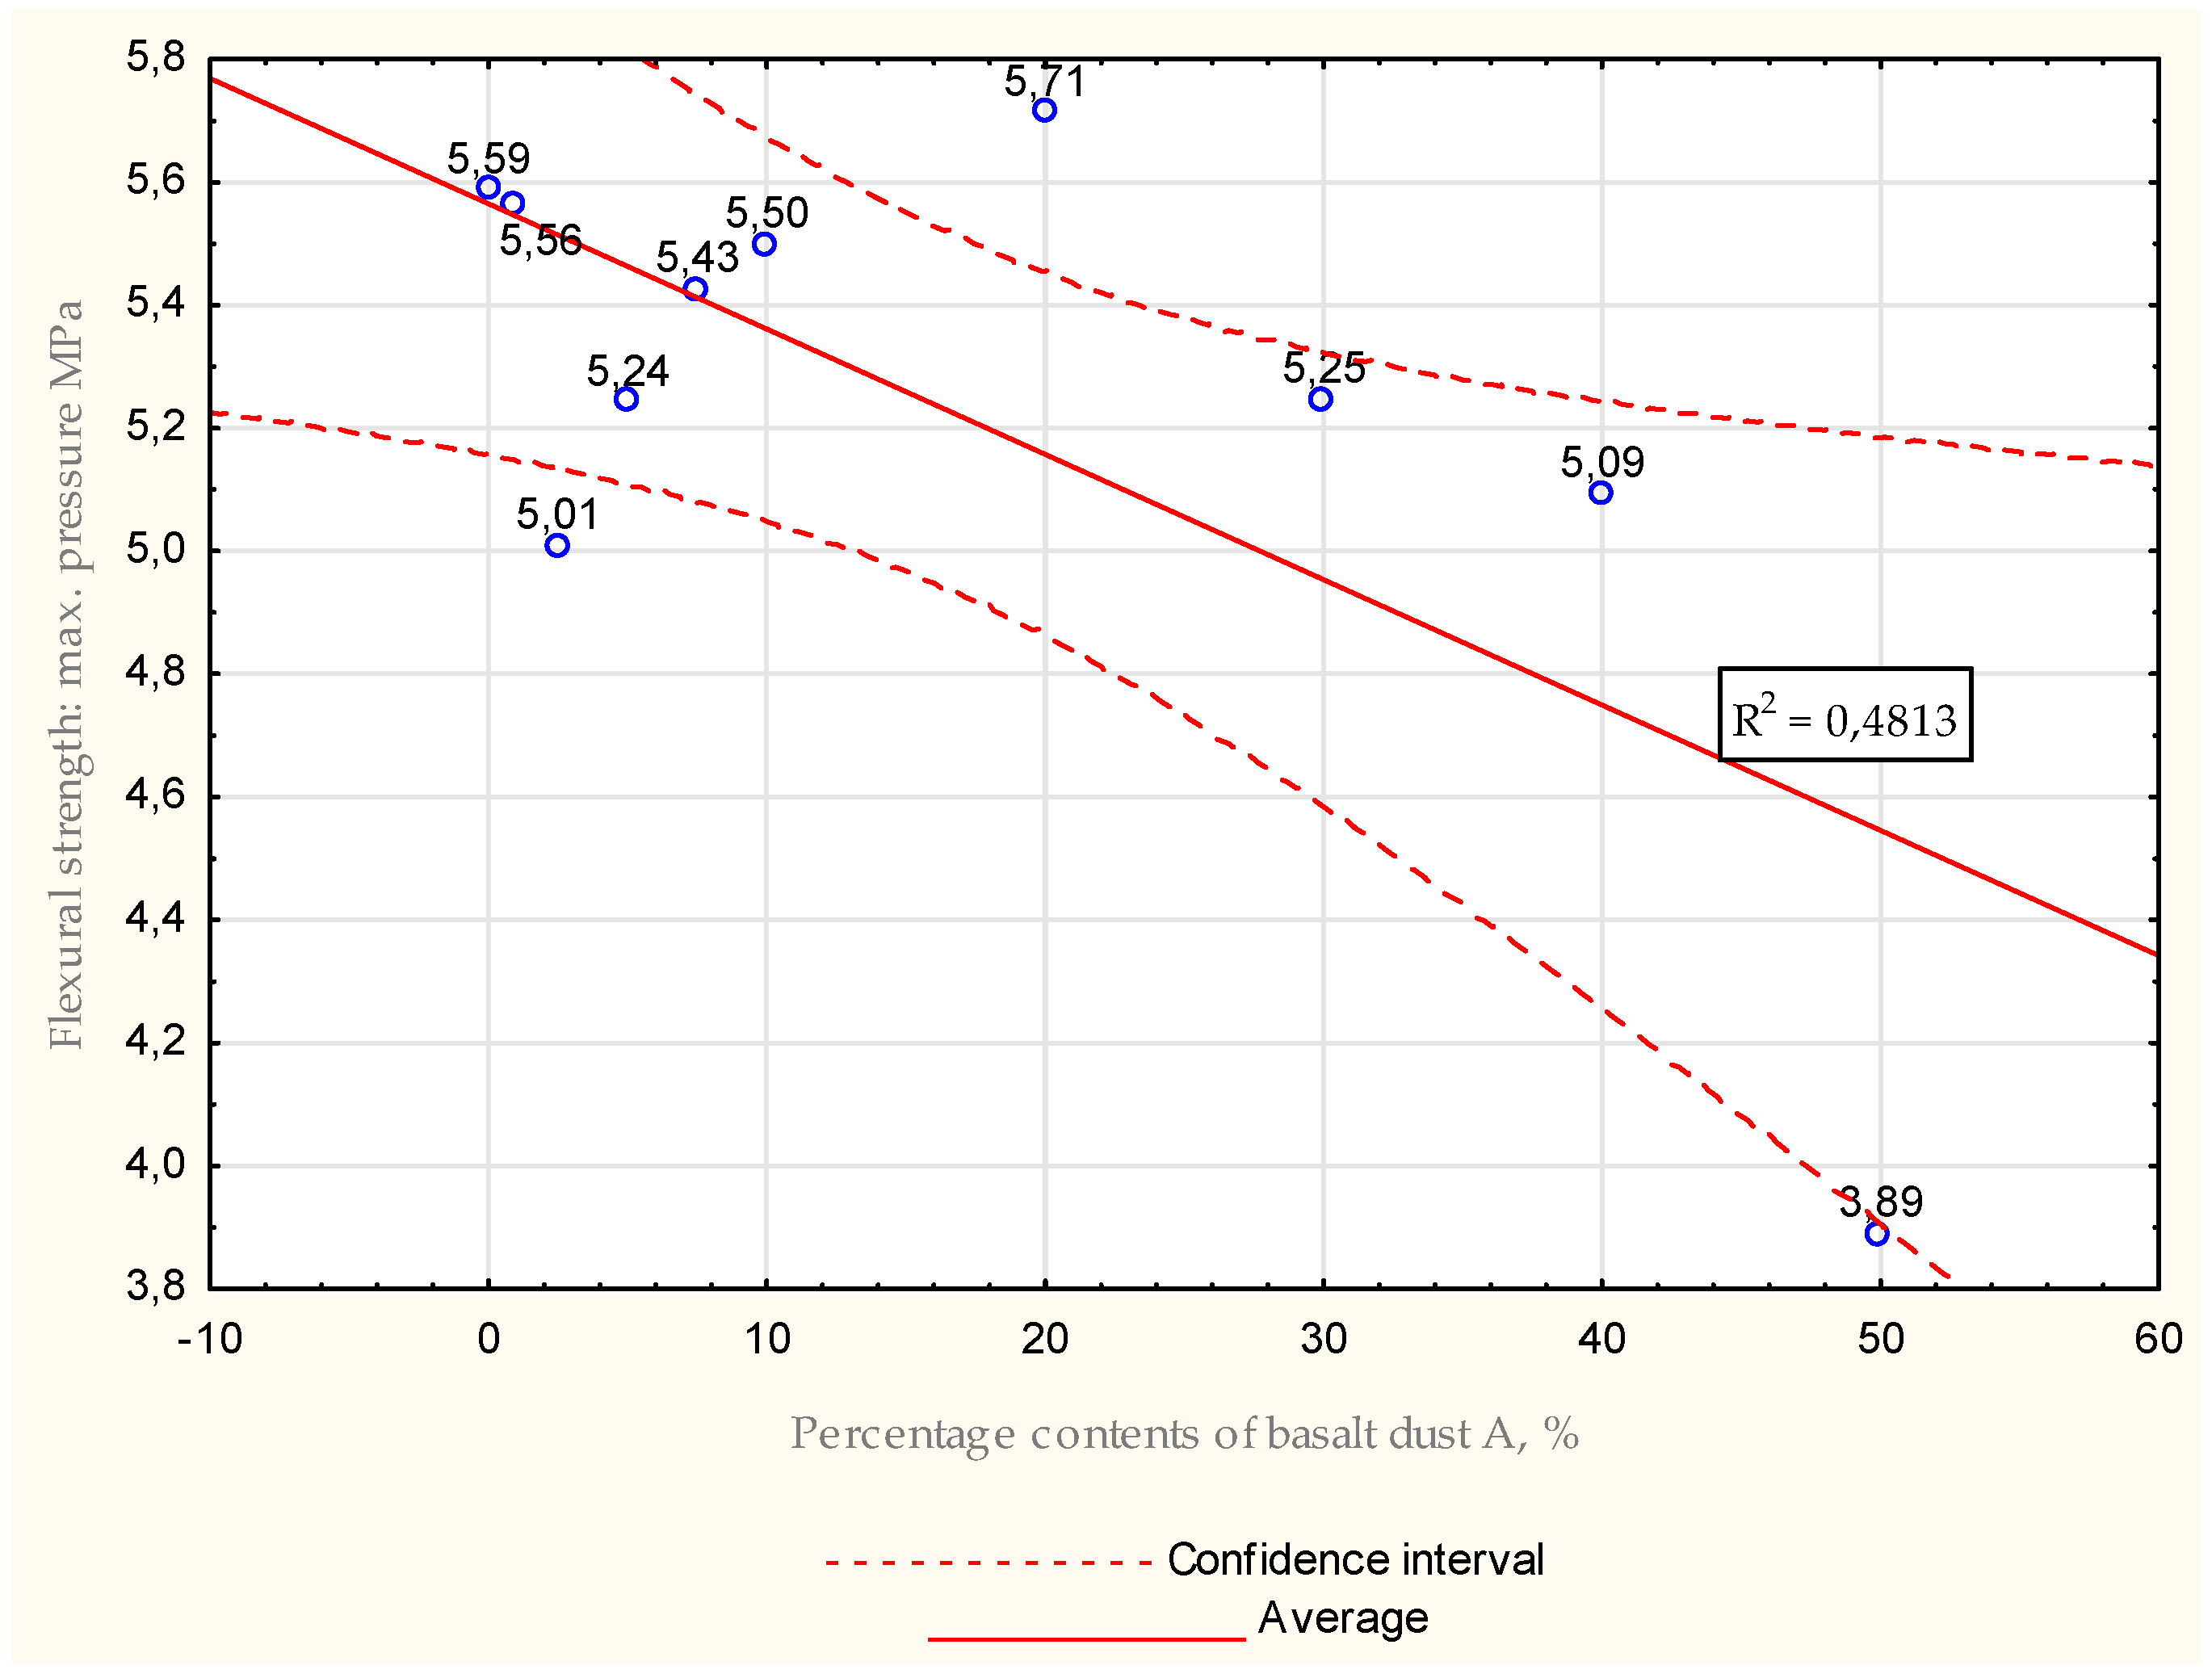
Flexural strength tests for basalt dust A for all samples for water −mix ratio = 0.7.
Table 15.
Flexural strength tests for basalt dust A for all samples for water −mix ratio = 0.7.
| | Maximum Strength [kN] | Maximum Press Force [MPa] |
|---|
| | Statistic | |
| Minimum | 1.660 | 3.890 |
| Maximum | 2.701 | 5.713 |
| Median | 2.364 | 5.336 |
| Average | 3.314 | 5.226 |
| Standard deviation | 0.264 | 0.494 |
| The range of variation | 1.041 | 1.823 |
Figure 23.
Average values obtained during flexural strength tests for water −mix ratio = 0.7, maximal strength.
Figure 23.
Average values obtained during flexural strength tests for water −mix ratio = 0.7, maximal strength.
Figure 24.
Average values obtained during flexural strength tests for water −mix ratio = 0.7, maximal pressure.
Figure 24.
Average values obtained during flexural strength tests for water −mix ratio = 0.7, maximal pressure.
For a water −mix ratio of 0.7, an overall decreasing trend was observed. The greatest reduction in flexural strength values was observed for samples with an additive concentration of more than 20% basalt dust A in the sealing grout. Samples with dust concentrations of 1%, 7.5%, 10% and 20% had increased flexural strength values compared to the zero sample. However, the difference in these values was small and did not exceed 12%. Such an increase may be due to uneven mixing of the additive in the sample.
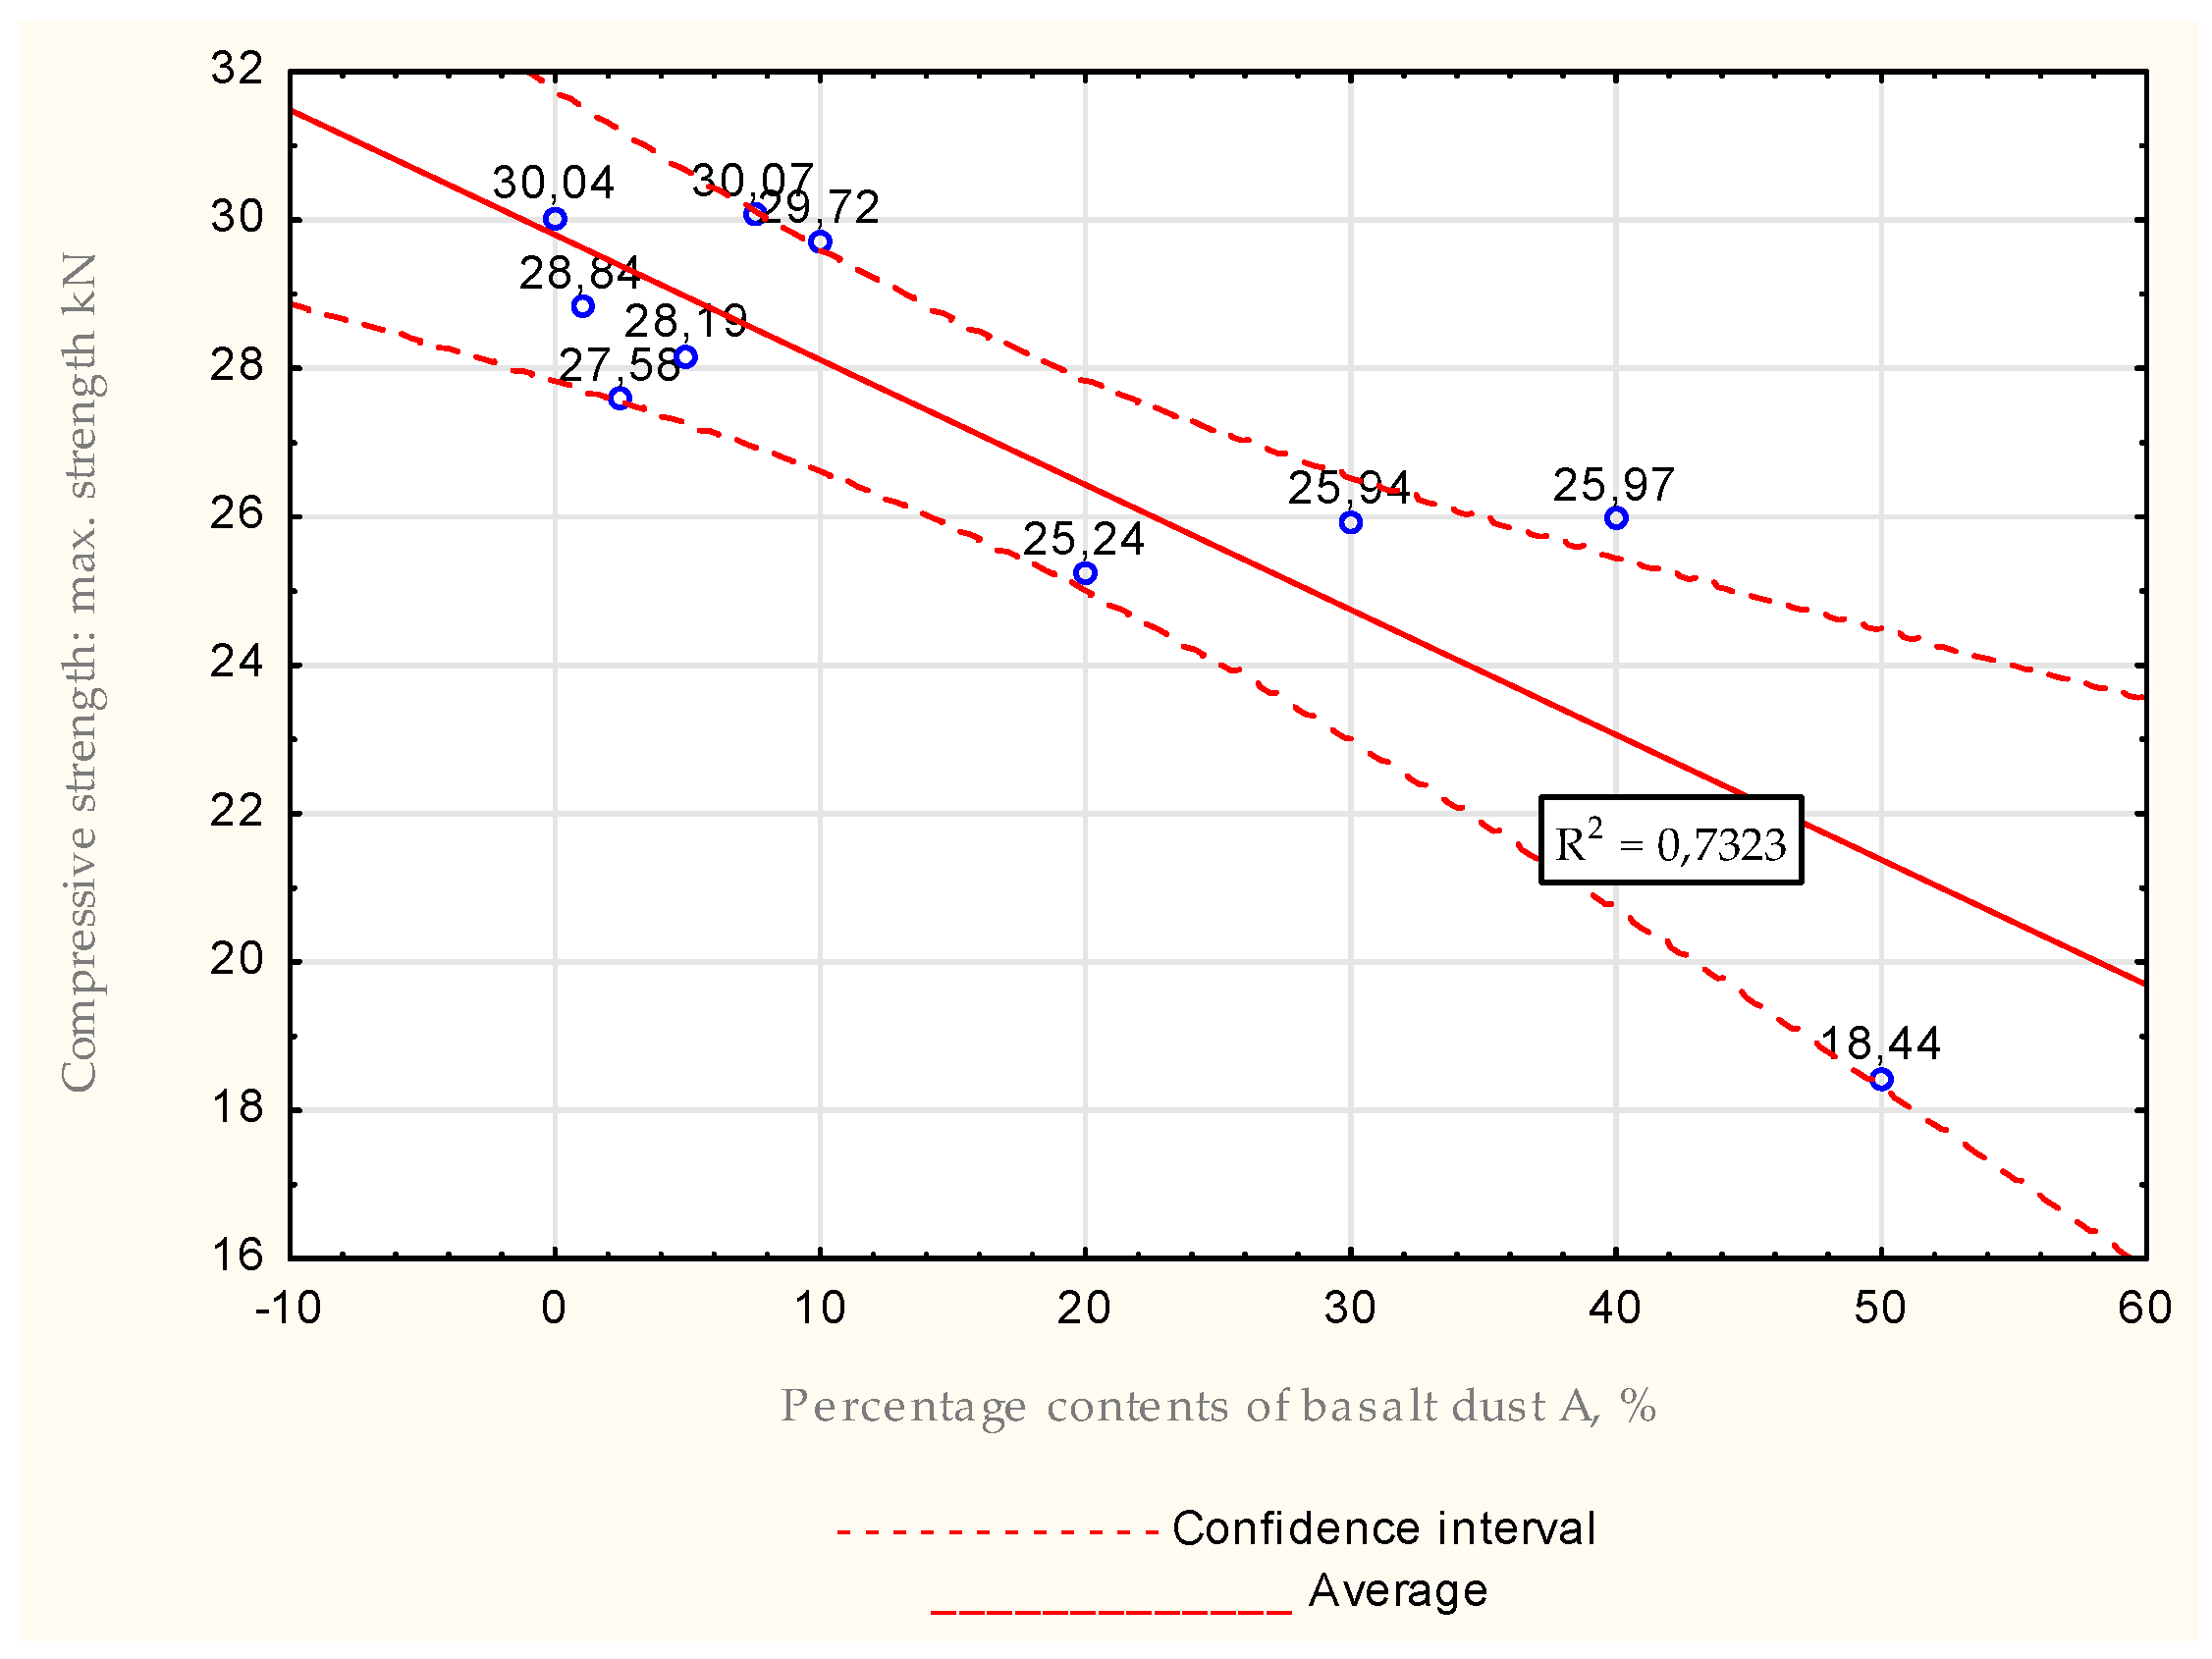
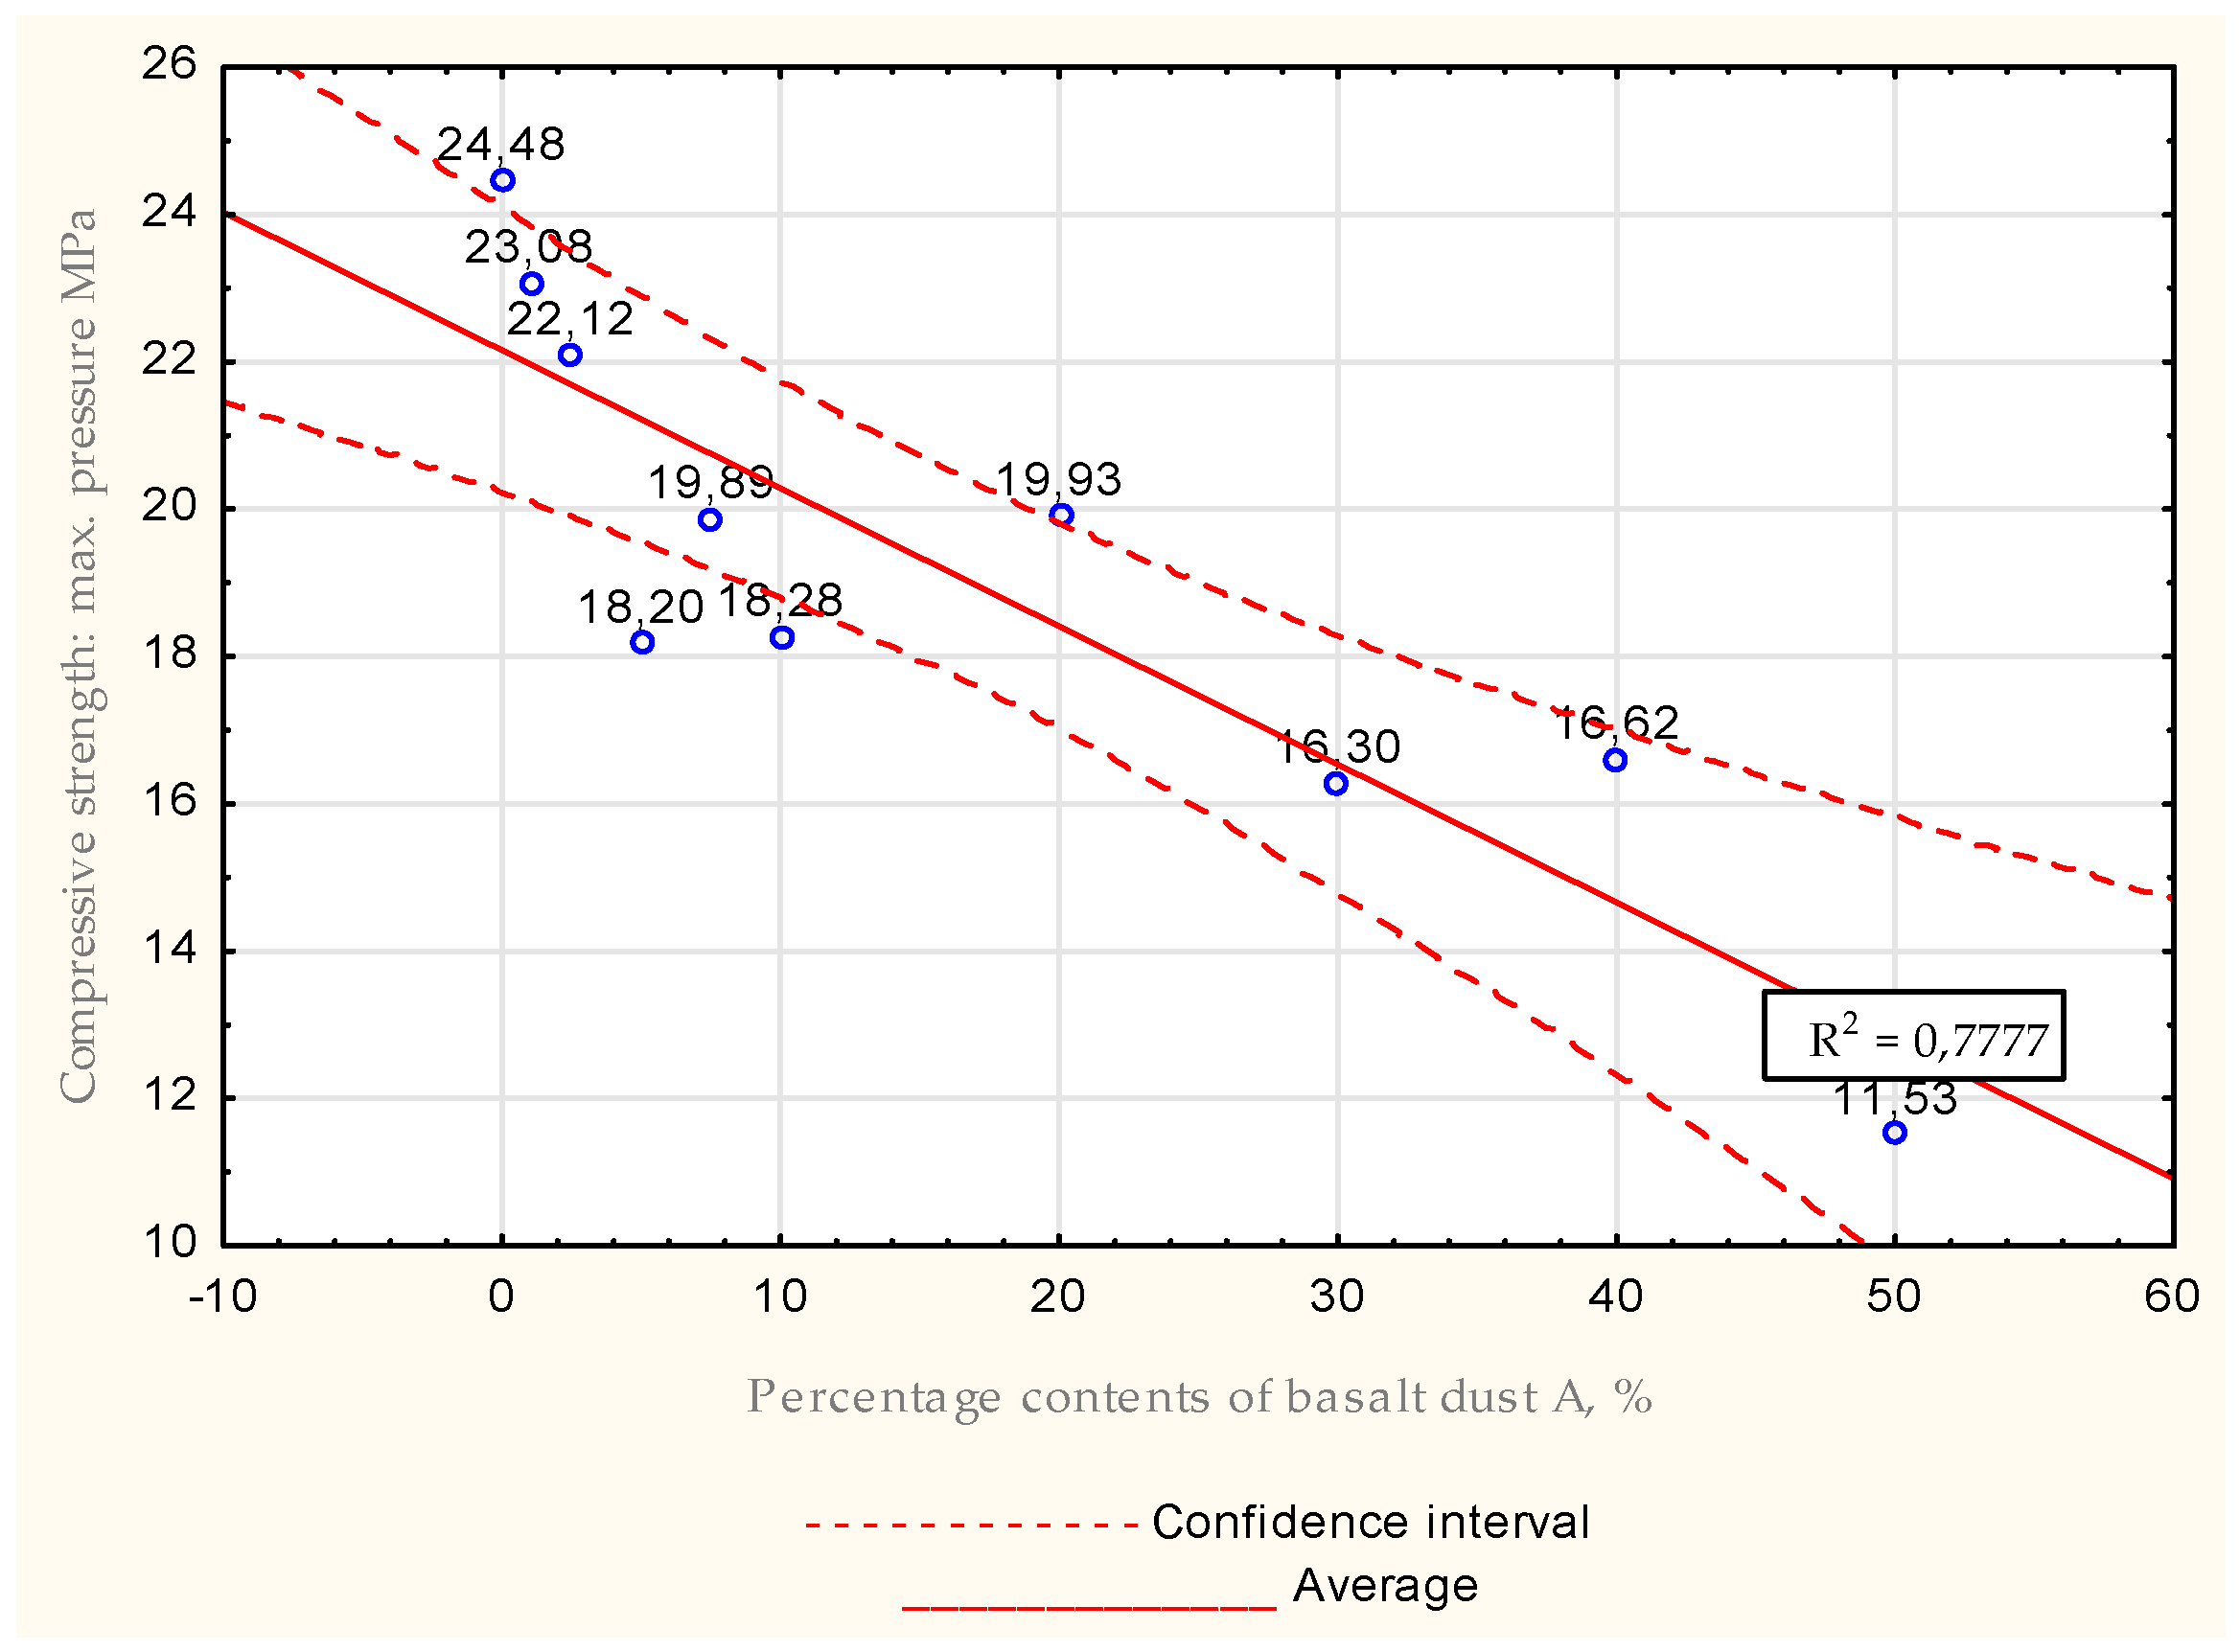
Table 16.
Compressive strength tests for basalt dust A for all samples for water −mix ratio = 0.7.
Table 16.
Compressive strength tests for basalt dust A for all samples for water −mix ratio = 0.7.
| | Maximum Strength [kN] | Maximum Press Force [MPa] |
|---|
| | Statistic | |
| Minimum | 18.444 | 11.528 |
| Maximum | 30.074 | 24.483 |
| Median | 27.884 | 19.086 |
| Average | 27.004 | 19.043 |
| Standard deviation | 3.312 | 3.578 |
| The range of variation | 11.630 | 12.955 |
Figure 25.
Average values obtained during compressive strength tests for water −mix ratio = 0.7, maximal strength.
Figure 25.
Average values obtained during compressive strength tests for water −mix ratio = 0.7, maximal strength.
Figure 26.
Average values obtained during compressive strength tests for water −mix ratio = 0.7.
Figure 26.
Average values obtained during compressive strength tests for water −mix ratio = 0.7.
The compressive strength values of basalt A dust cement slurries also showed a decreasing trend with increasing additive value. The lowest compressive strength value was obtained for a dust concentration of 30%. Comparing it to the zero sample value, it was about 41% lower. For the other concentrations, the reduced compressive strength values were lower compared to the zero sample value by up to 40%.
Samples having similar or higher strength values than the zero sample can be successfully used as a replacement for cement components.
All tables (
Table 17,
Table 18,
Table 19,
Table 20,
Table 21 and
Table 22) and figures (
Figure 27,
Figure 28,
Figure 29,
Figure 30,
Figure 31,
Figure 32,
Figure 33,
Figure 34,
Figure 35,
Figure 36,
Figure 37 and
Figure 38) presented below concern basalt dust B.
Table 17,
Table 19 and
Table 21 and
Figure 27,
Figure 28,
Figure 31,
Figure 32,
Figure 35 and
Figure 36 present data obtained during flexural strength tests.
Table 18,
Table 20 and
Table 22 and
Figure 29,
Figure 30,
Figure 33,
Figure 34,
Figure 37 and
Figure 38 include compressive strength tests results.
Table 17,
Table 18,
Table 19,
Table 20,
Table 21 and
Table 22 and
Figure 27,
Figure 28,
Figure 29,
Figure 30,
Figure 31,
Figure 32,
Figure 33,
Figure 34,
Figure 35,
Figure 36,
Figure 37 and
Figure 38 describe samples which lay 28 days in containers filled with water.
Table 17.
Flexural strength tests for basalt dust B for all samples for water −mix ratio = 0.5 after 28 days.
Table 17.
Flexural strength tests for basalt dust B for all samples for water −mix ratio = 0.5 after 28 days.
| | Maximum Strength [kN] | Maximum Press Force [MPa] |
|---|
| | Statistic | |
| Minimum | 2.363 | 5.538 |
| Maximum | 4.173 | 9.782 |
| Median | 3.430 | 7.724 |
| Average | 3.330 | 7.668 |
| Standard deviation | 0.539 | 1.241 |
| The range of variation | 1.810 | 4.244 |
Figure 27.
Average values obtained during flexural strength tests after 28 days for water −mix ratio = 0.5, maximal strength.
Figure 27.
Average values obtained during flexural strength tests after 28 days for water −mix ratio = 0.5, maximal strength.
Figure 28.
Average values obtained during flexural strength tests after 28 days for water −mix ratio = 0.5, maximal pressure.
Figure 28.
Average values obtained during flexural strength tests after 28 days for water −mix ratio = 0.5, maximal pressure.
For water–mix ratio 0.5, once again a decreasing trend was observed.
For flexural strength tests, the lowest value was obtained for samples with 50% basalt dust. The value was about 43% lower than that of the zero sample. Remaining grout mixtures had lower results, which varied between 6% and about 34%.
Table 18.
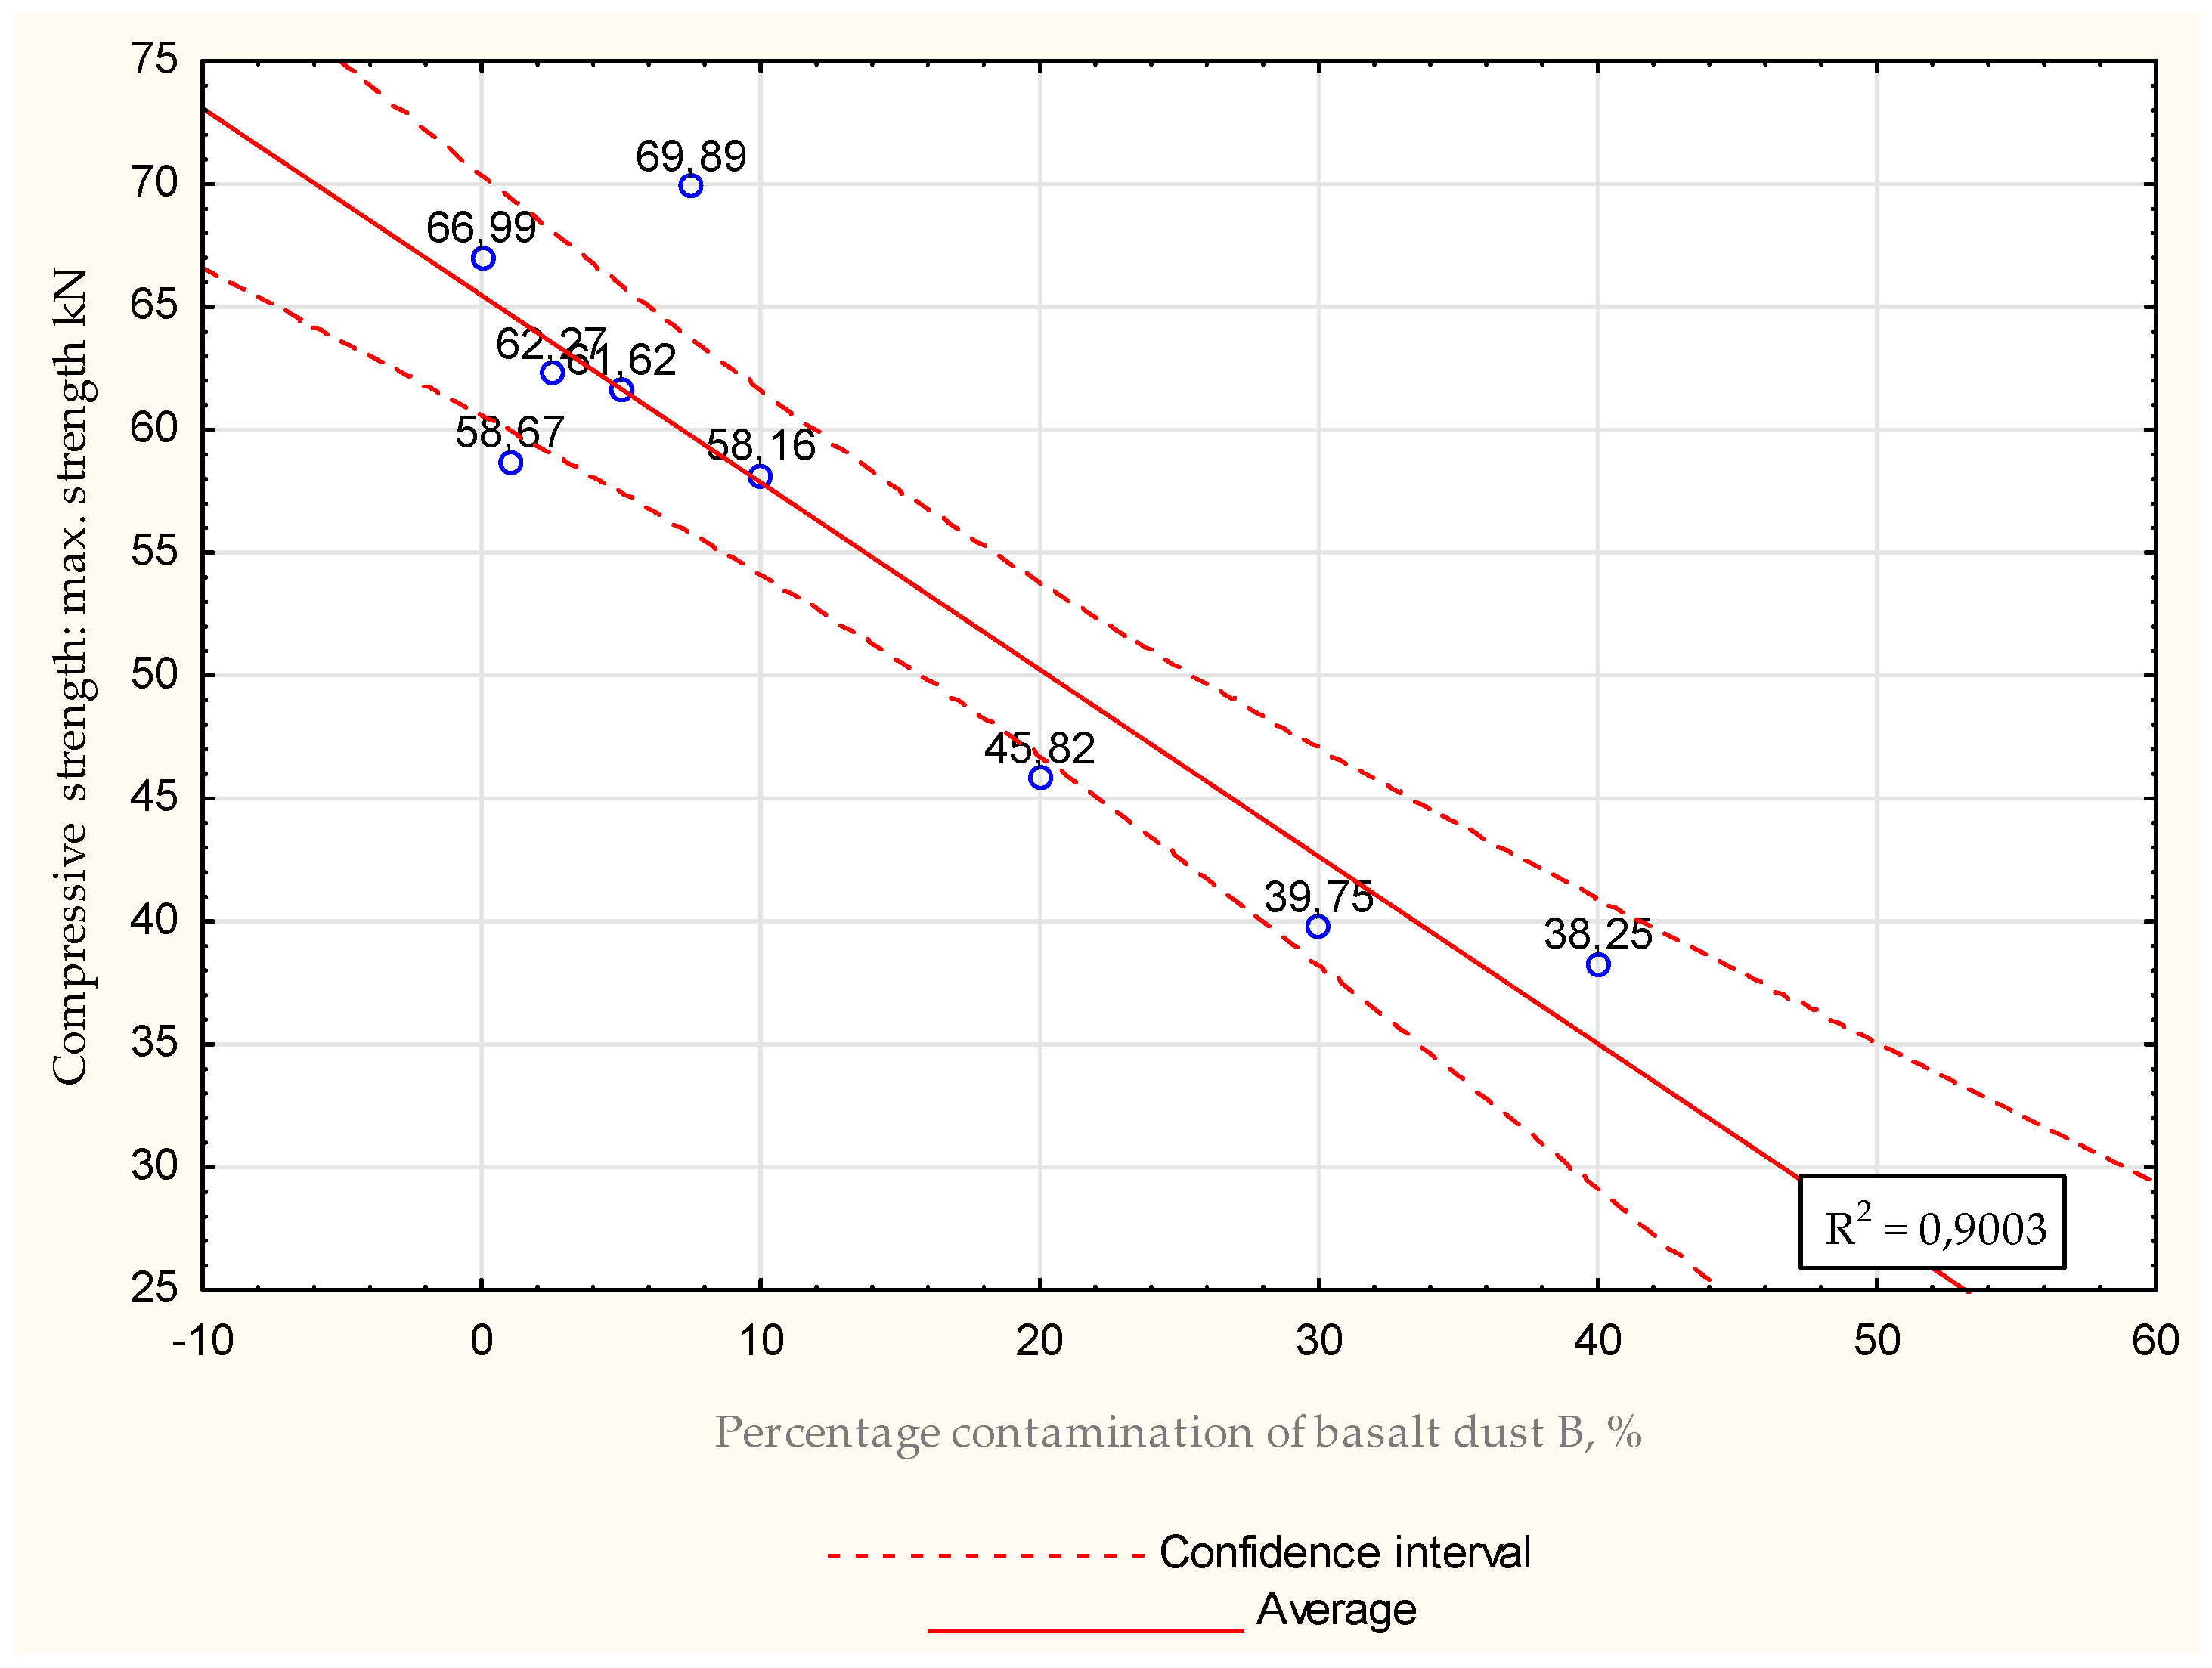
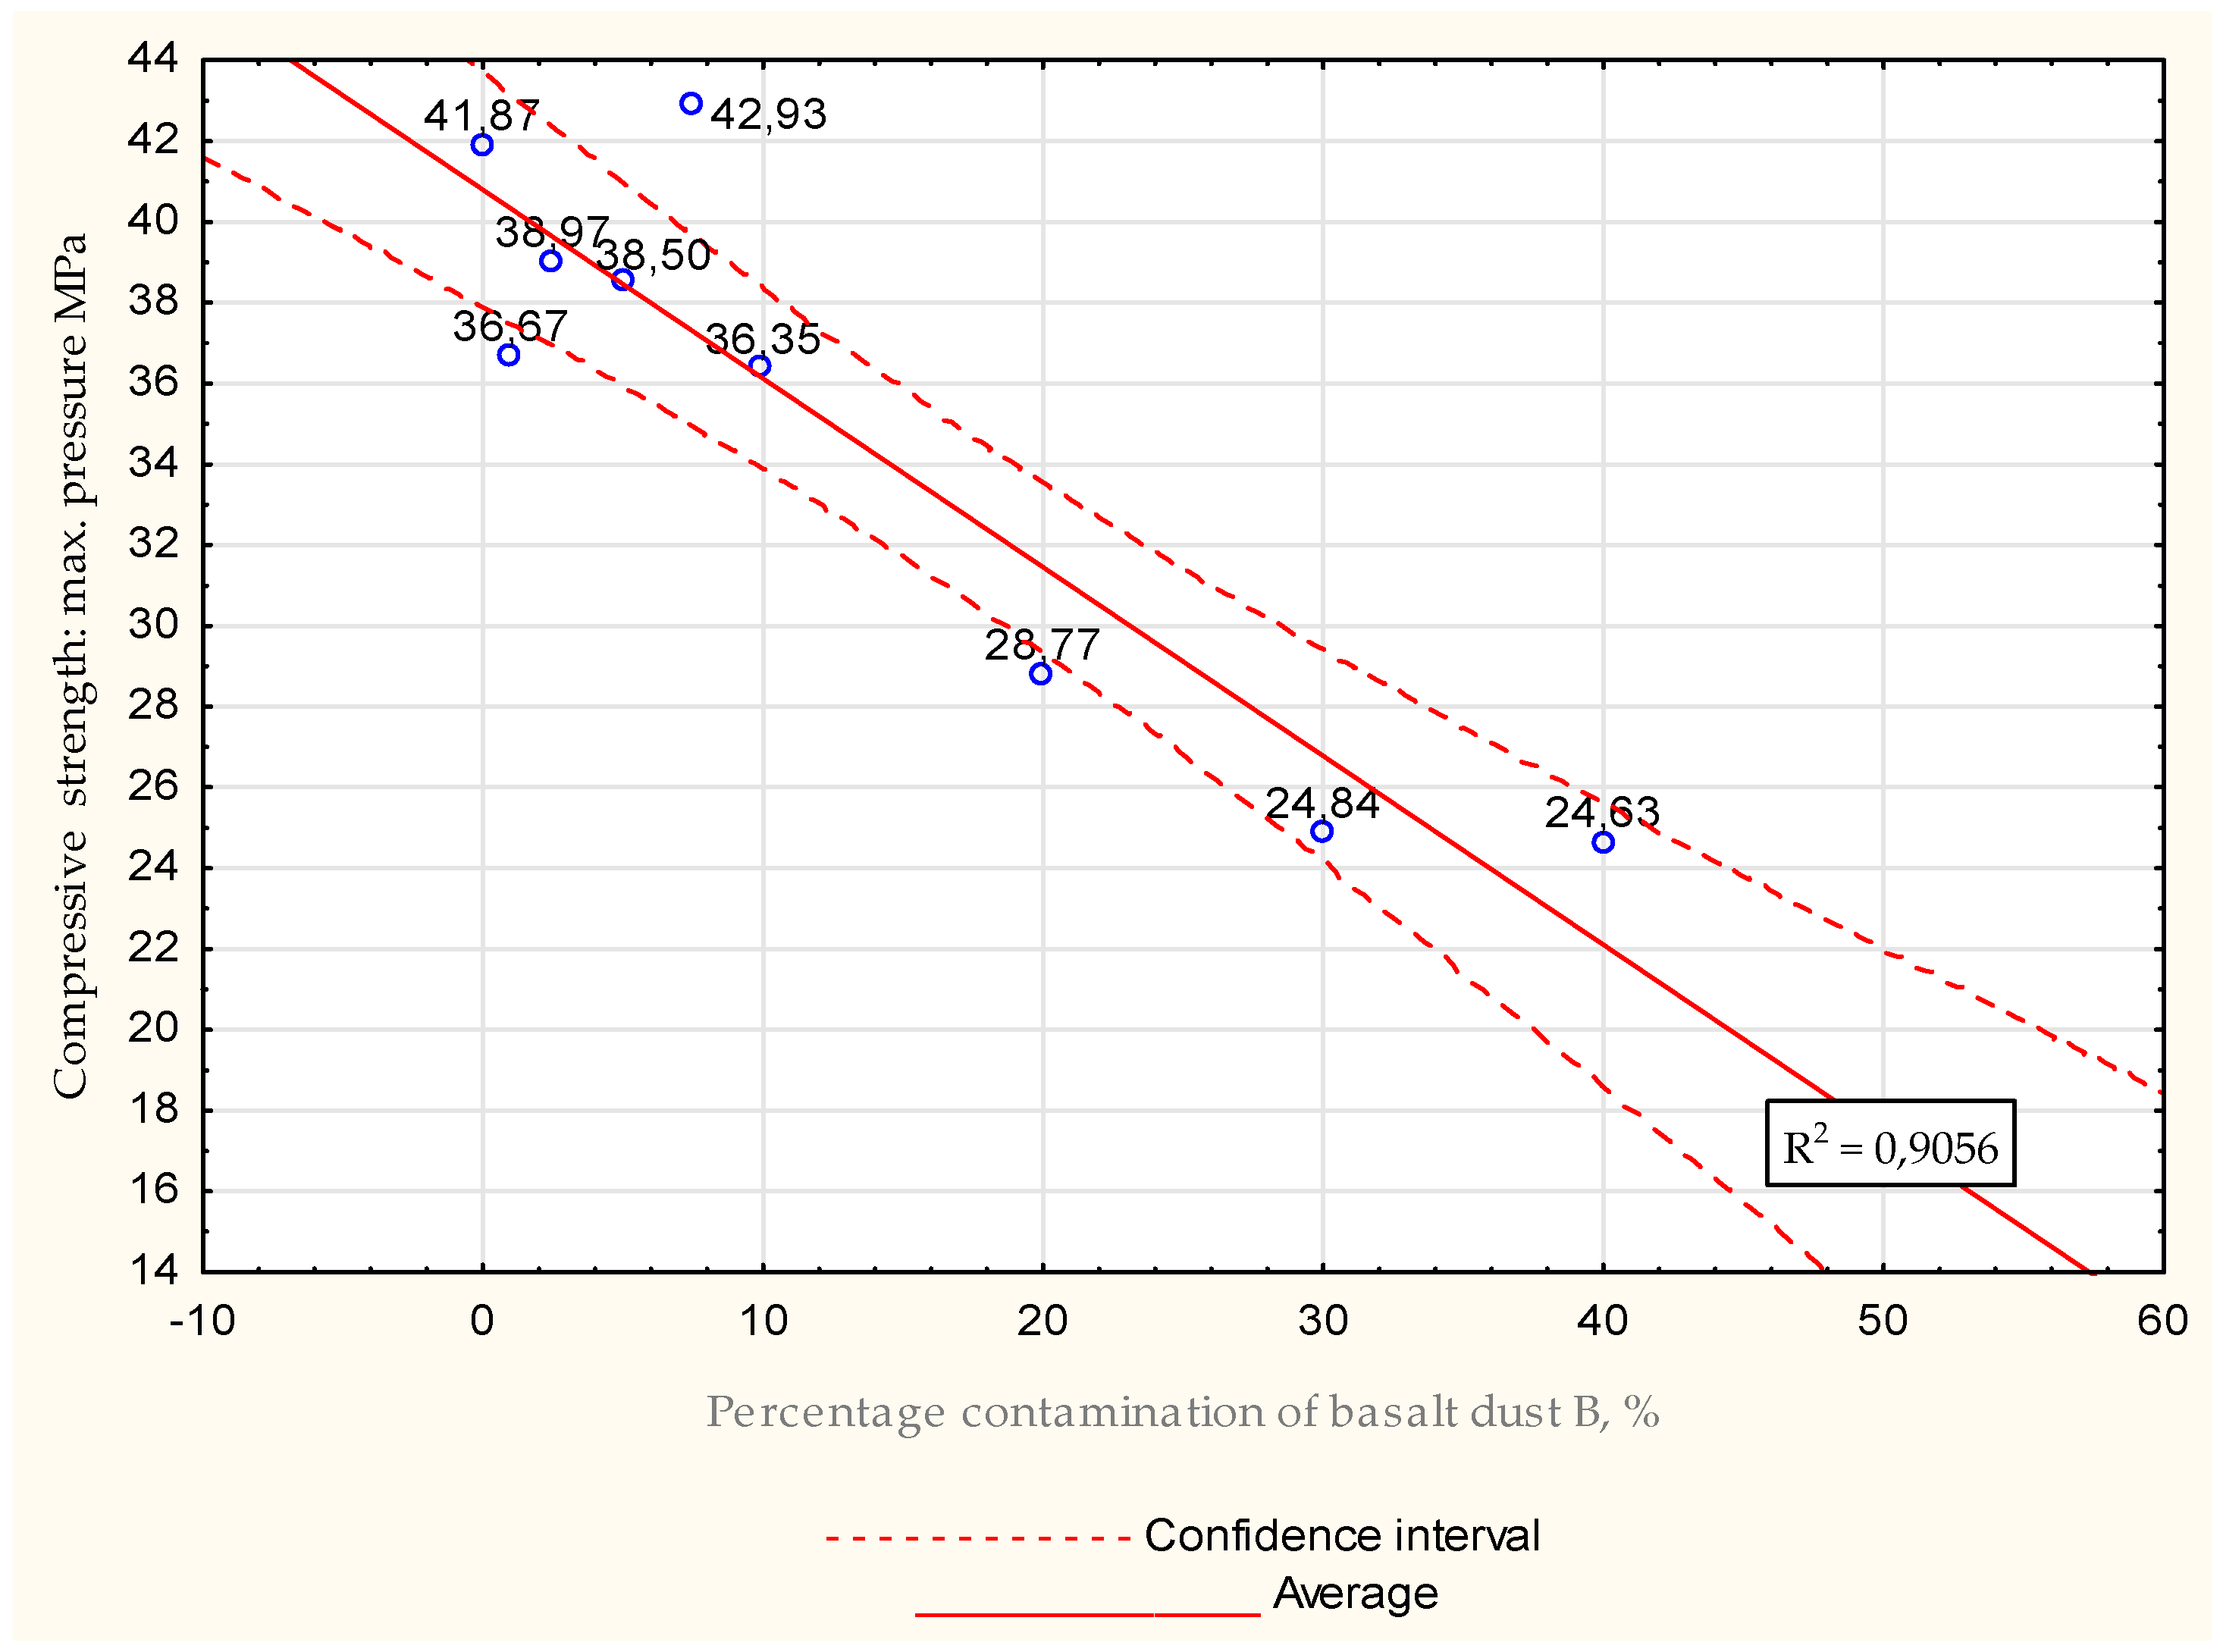
Compressive strength tests for basalt dust B for all samples for water −mix ratio = 0.5 after 28 days.
Table 18.
Compressive strength tests for basalt dust B for all samples for water −mix ratio = 0.5 after 28 days.
| | Maximum Strength [kN] | Maximum Press Force [MPa] |
|---|
| | Statistic | |
| Minimum | 26.969 | 16.855 |
| Maximum | 69.891 | 42.930 |
| Median | 58.413 | 36.508 |
| Average | 52.838 | 33.038 |
| Standard deviation | 13.498 | 8.265 |
| The range of variation | 42.922 | 28.075 |
Figure 29.
Average values obtained during compressive strength tests after 28 days for water −mix ratio = 0.5, max. strength.
Figure 29.
Average values obtained during compressive strength tests after 28 days for water −mix ratio = 0.5, max. strength.
Figure 30.
Average values obtained during compressive strength tests after 28 days for water −mix ratio = 0.5, max. pressure.
Figure 30.
Average values obtained during compressive strength tests after 28 days for water −mix ratio = 0.5, max. pressure.
Almost all results obtained from compressive strength tests were lower than those of the zero sample. The lowest value was obtained for contamination of basalt dust of 50%, which decreased its strength by about 60%. For remaining results the difference varied between 7% and 42%.
Table 19.
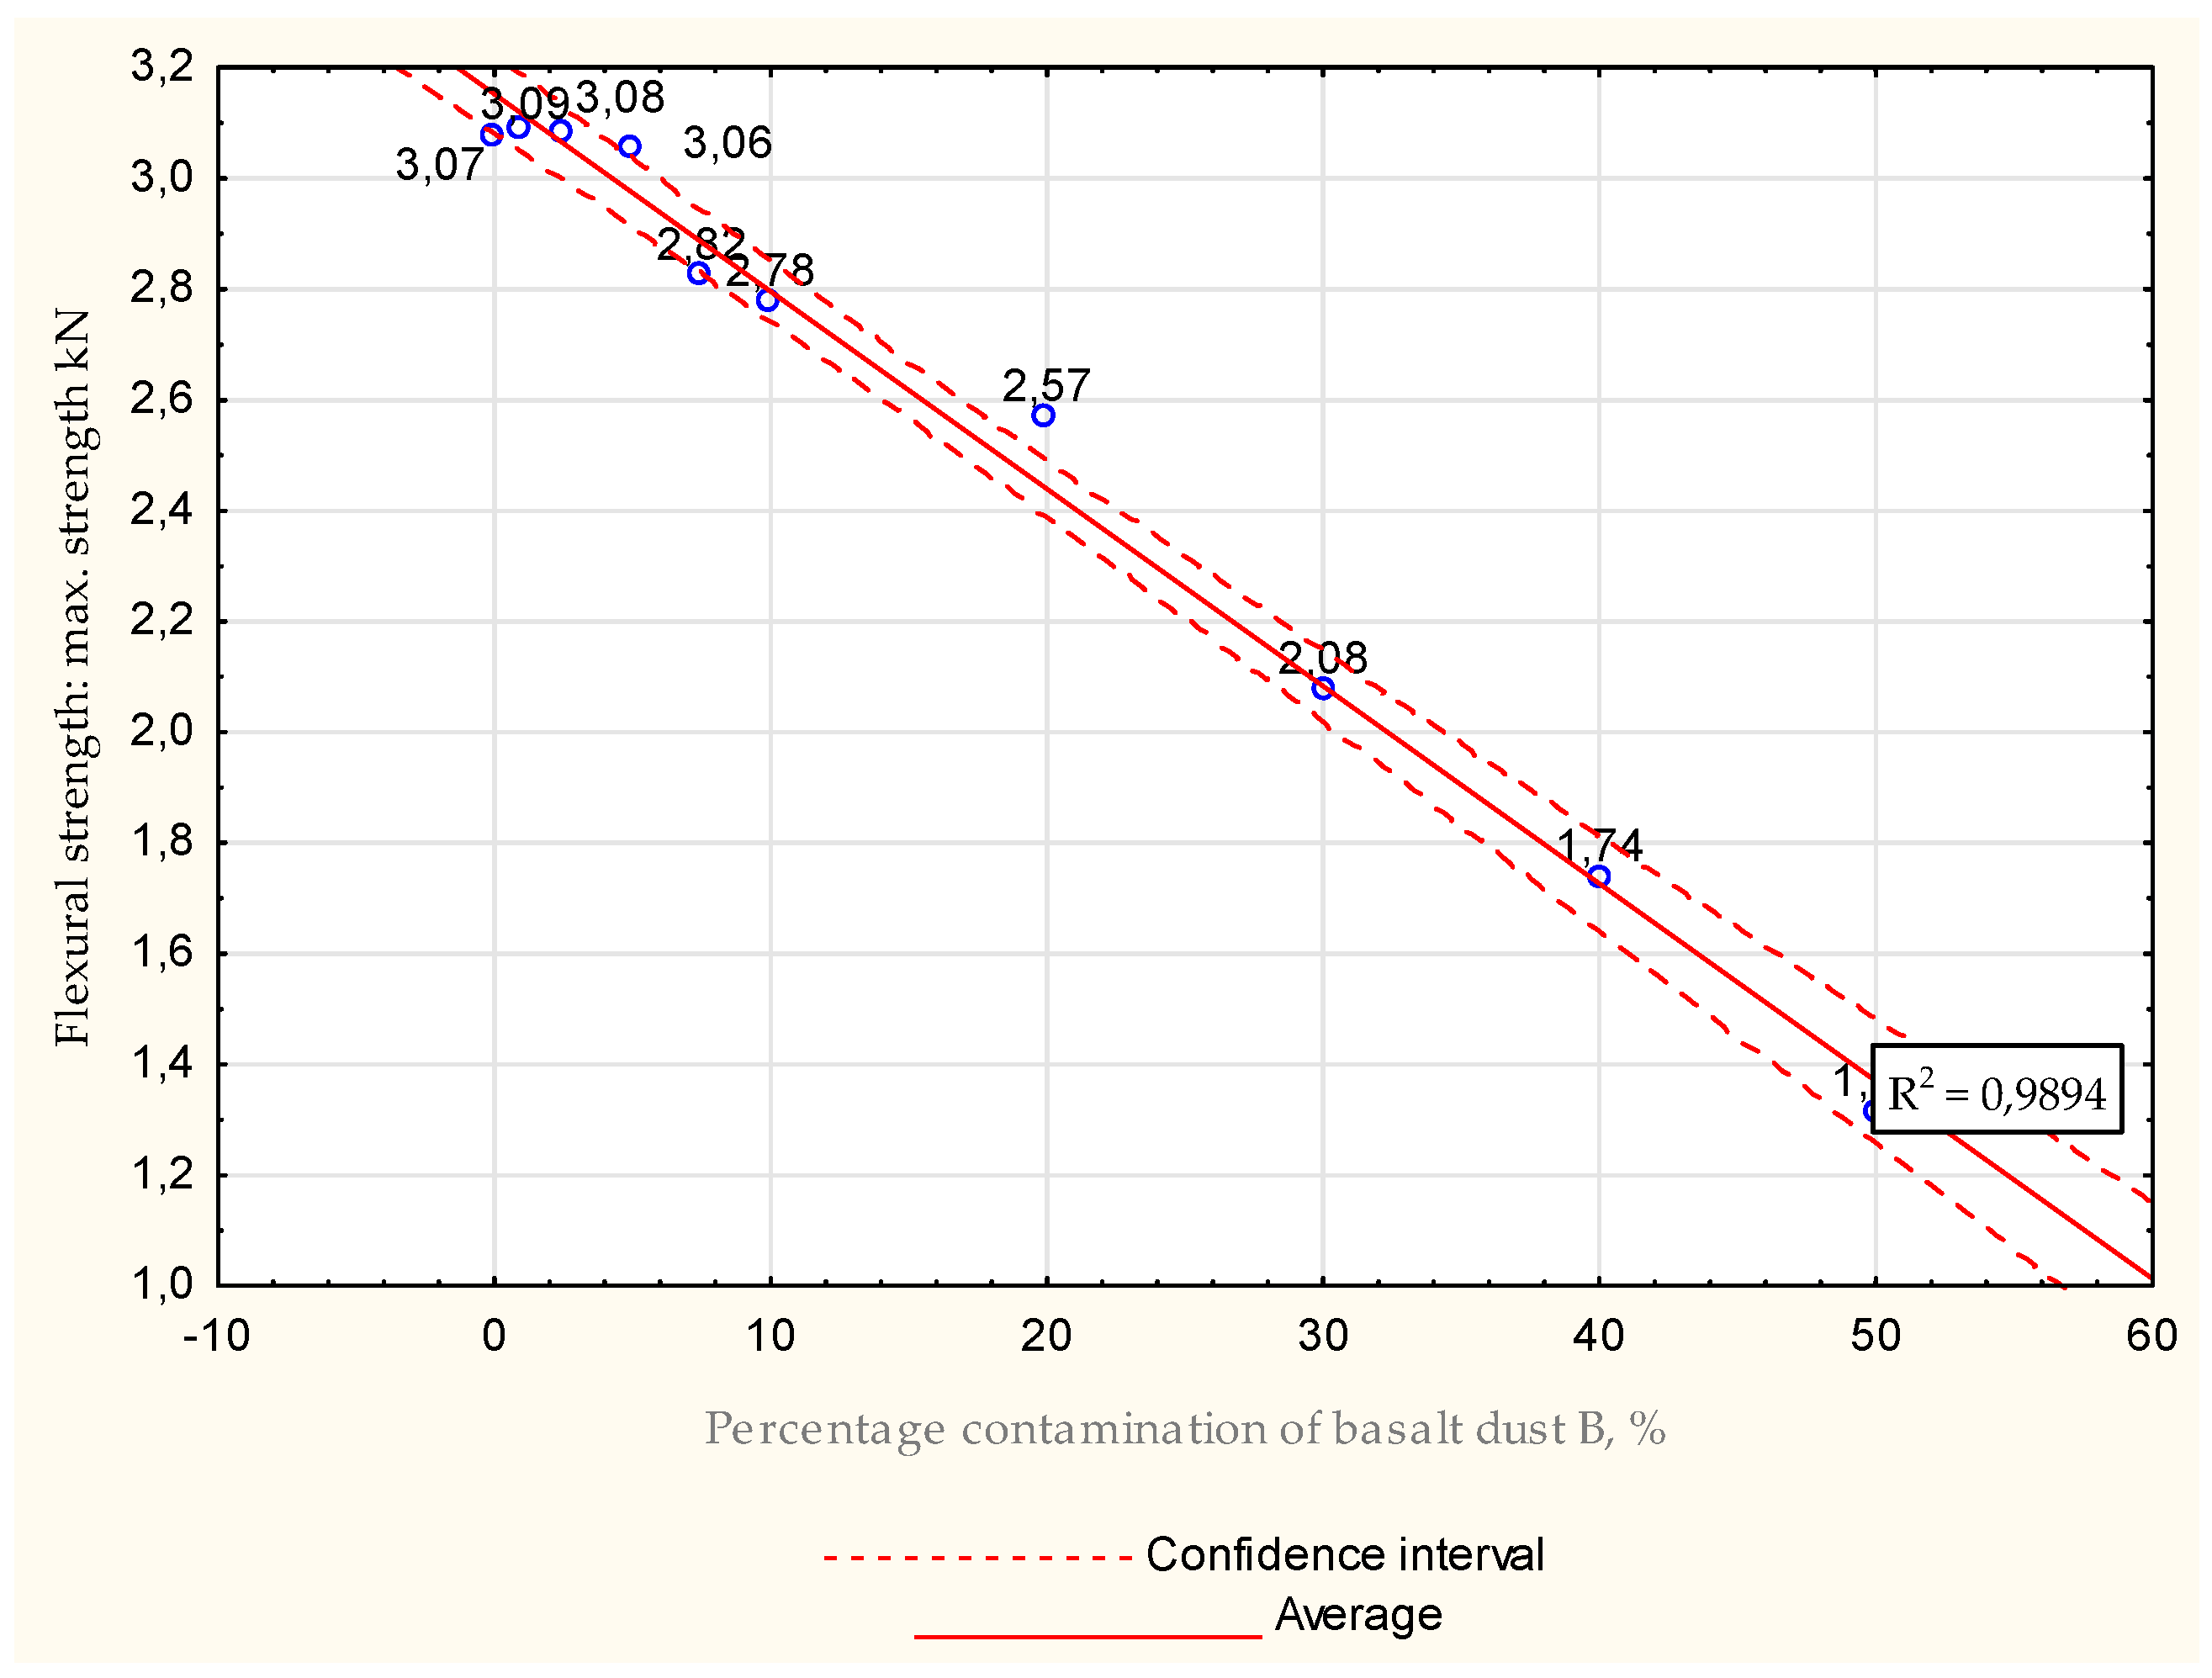
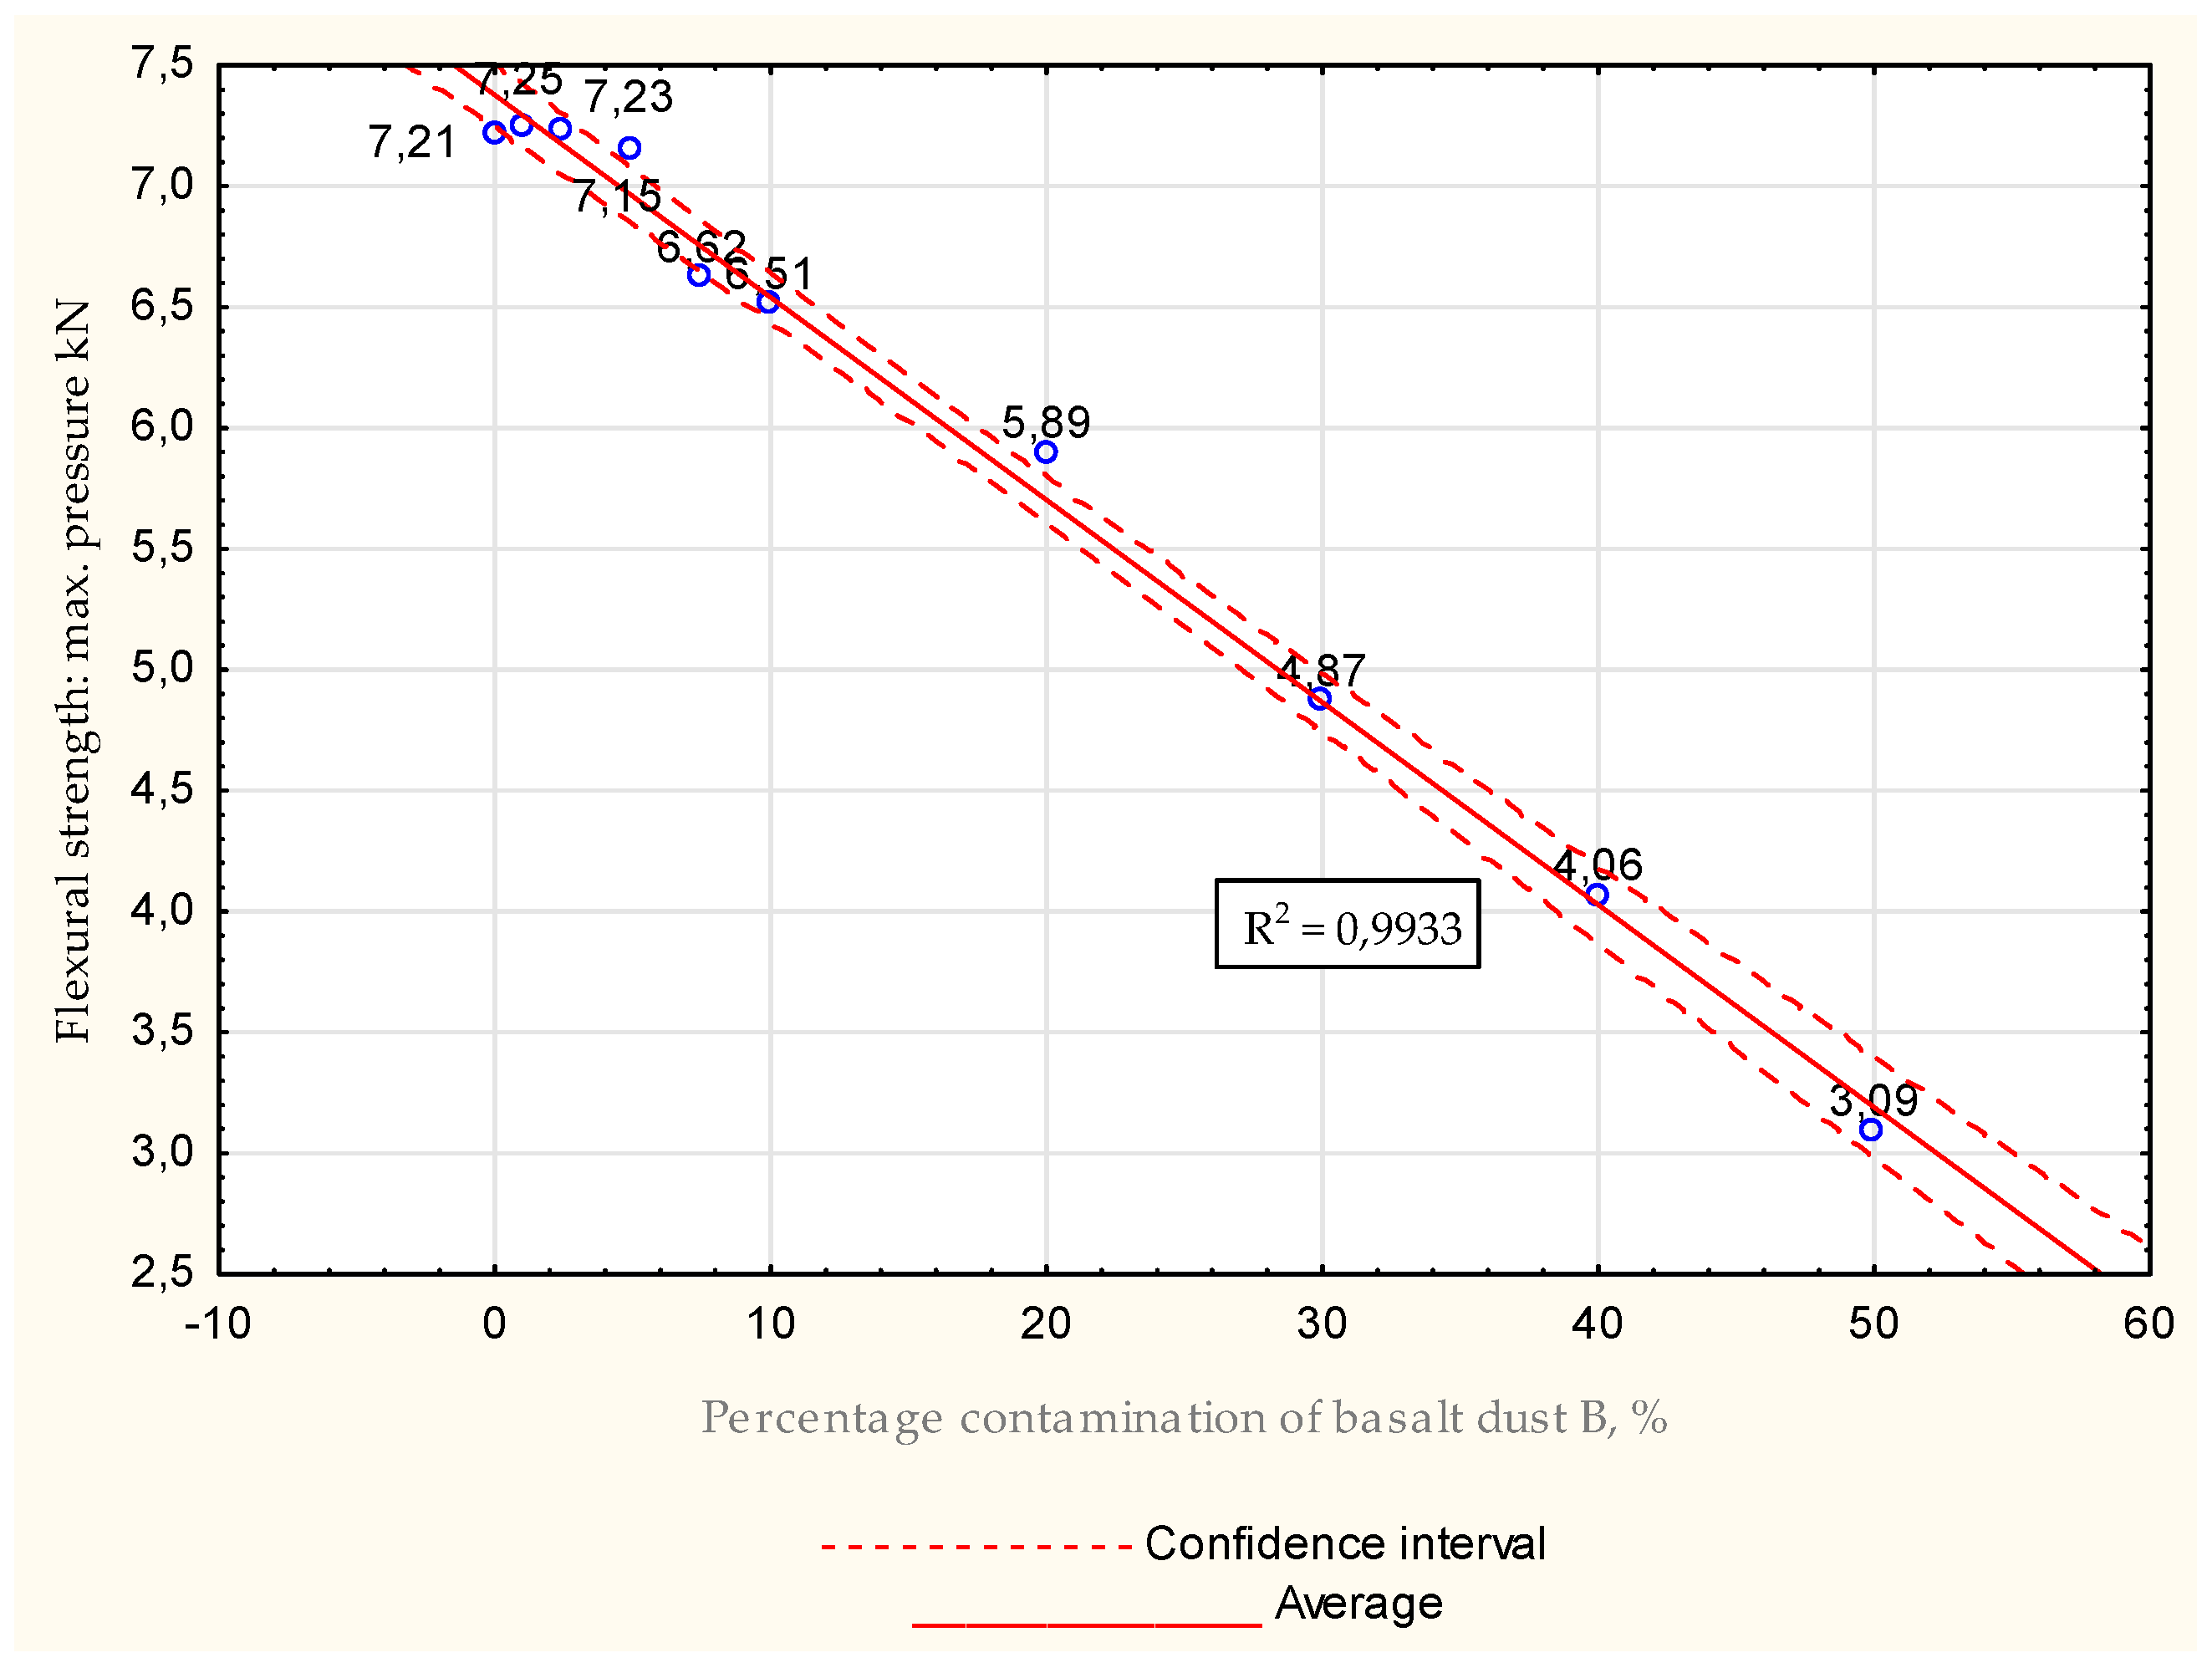
Flexural strength tests for basalt dust B for all samples for water −mix ratio = 0.6 after 28 days.
Table 19.
Flexural strength tests for basalt dust B for all samples for water −mix ratio = 0.6 after 28 days.
| | Maximum Strength [kN] | Maximum Press Force [MPa] |
|---|
| | Statistic | |
| Minimum | 1.315 | 3.089 |
| Maximum | 3.093 | 7.248 |
| Median | 2.801 | 6.564 |
| Average | 2.561 | 5.987 |
| Standard deviation | 0.604 | 1.414 |
| The range of variation | 1.778 | 4.159 |
Figure 31.
Average values obtained during flexural strength tests after 28 days for water −mix ratio = 0.6, maximal strength.
Figure 31.
Average values obtained during flexural strength tests after 28 days for water −mix ratio = 0.6, maximal strength.
Figure 32.
Average values obtained during flexural strength tests after 28 days for water −mix ratio = 0.6, maximal pressure.
Figure 32.
Average values obtained during flexural strength tests after 28 days for water −mix ratio = 0.6, maximal pressure.
As can we see above, the data obtained from flexural strength tests for the water–mix ratio 0.6 present a decreasing trend in strength values as basalt dust concentration in slurry increased. The lowest value was obtained for grout mixture with 50% additive in its composition. For it, the result was about 57% lower. In other cases, differences varied by about +0.33% to about −43.5%.
Table 20.
Compressive strength tests for basalt dust B for all samples for water −mix ratio = 0.6 after 28 days.
Table 20.
Compressive strength tests for basalt dust B for all samples for water −mix ratio = 0.6 after 28 days.
| | Maximum Strength [kN] | Maximum Press Force [MPa] |
|---|
| | Statistic | |
| Minimum | 13.957 | 8.346 |
| Maximum | 52.373 | 32.733 |
| Median | 44.001 | 27.467 |
| Average | 37.354 | 22.808 |
| Standard deviation | 12.838 | 8.014 |
| The range of variation | 38.416 | 24.387 |
Figure 33.
Average values obtained during compressive strength tests after 28 days for water −mix ratio = 0.6, max. strength.
Figure 33.
Average values obtained during compressive strength tests after 28 days for water −mix ratio = 0.6, max. strength.
Figure 34.
Average values obtained during compressive strength tests after 28 days for water −mix ratio = 0.6, max. pressure.
Figure 34.
Average values obtained during compressive strength tests after 28 days for water −mix ratio = 0.6, max. pressure.
For compressive strength tests, all grout mixtures had lower values than the zero sample. The lowest result was obtained for an additive concentration of 50%, whose value was about 74% lower. For remaining samples, the reduction varied between 5% and 63%.
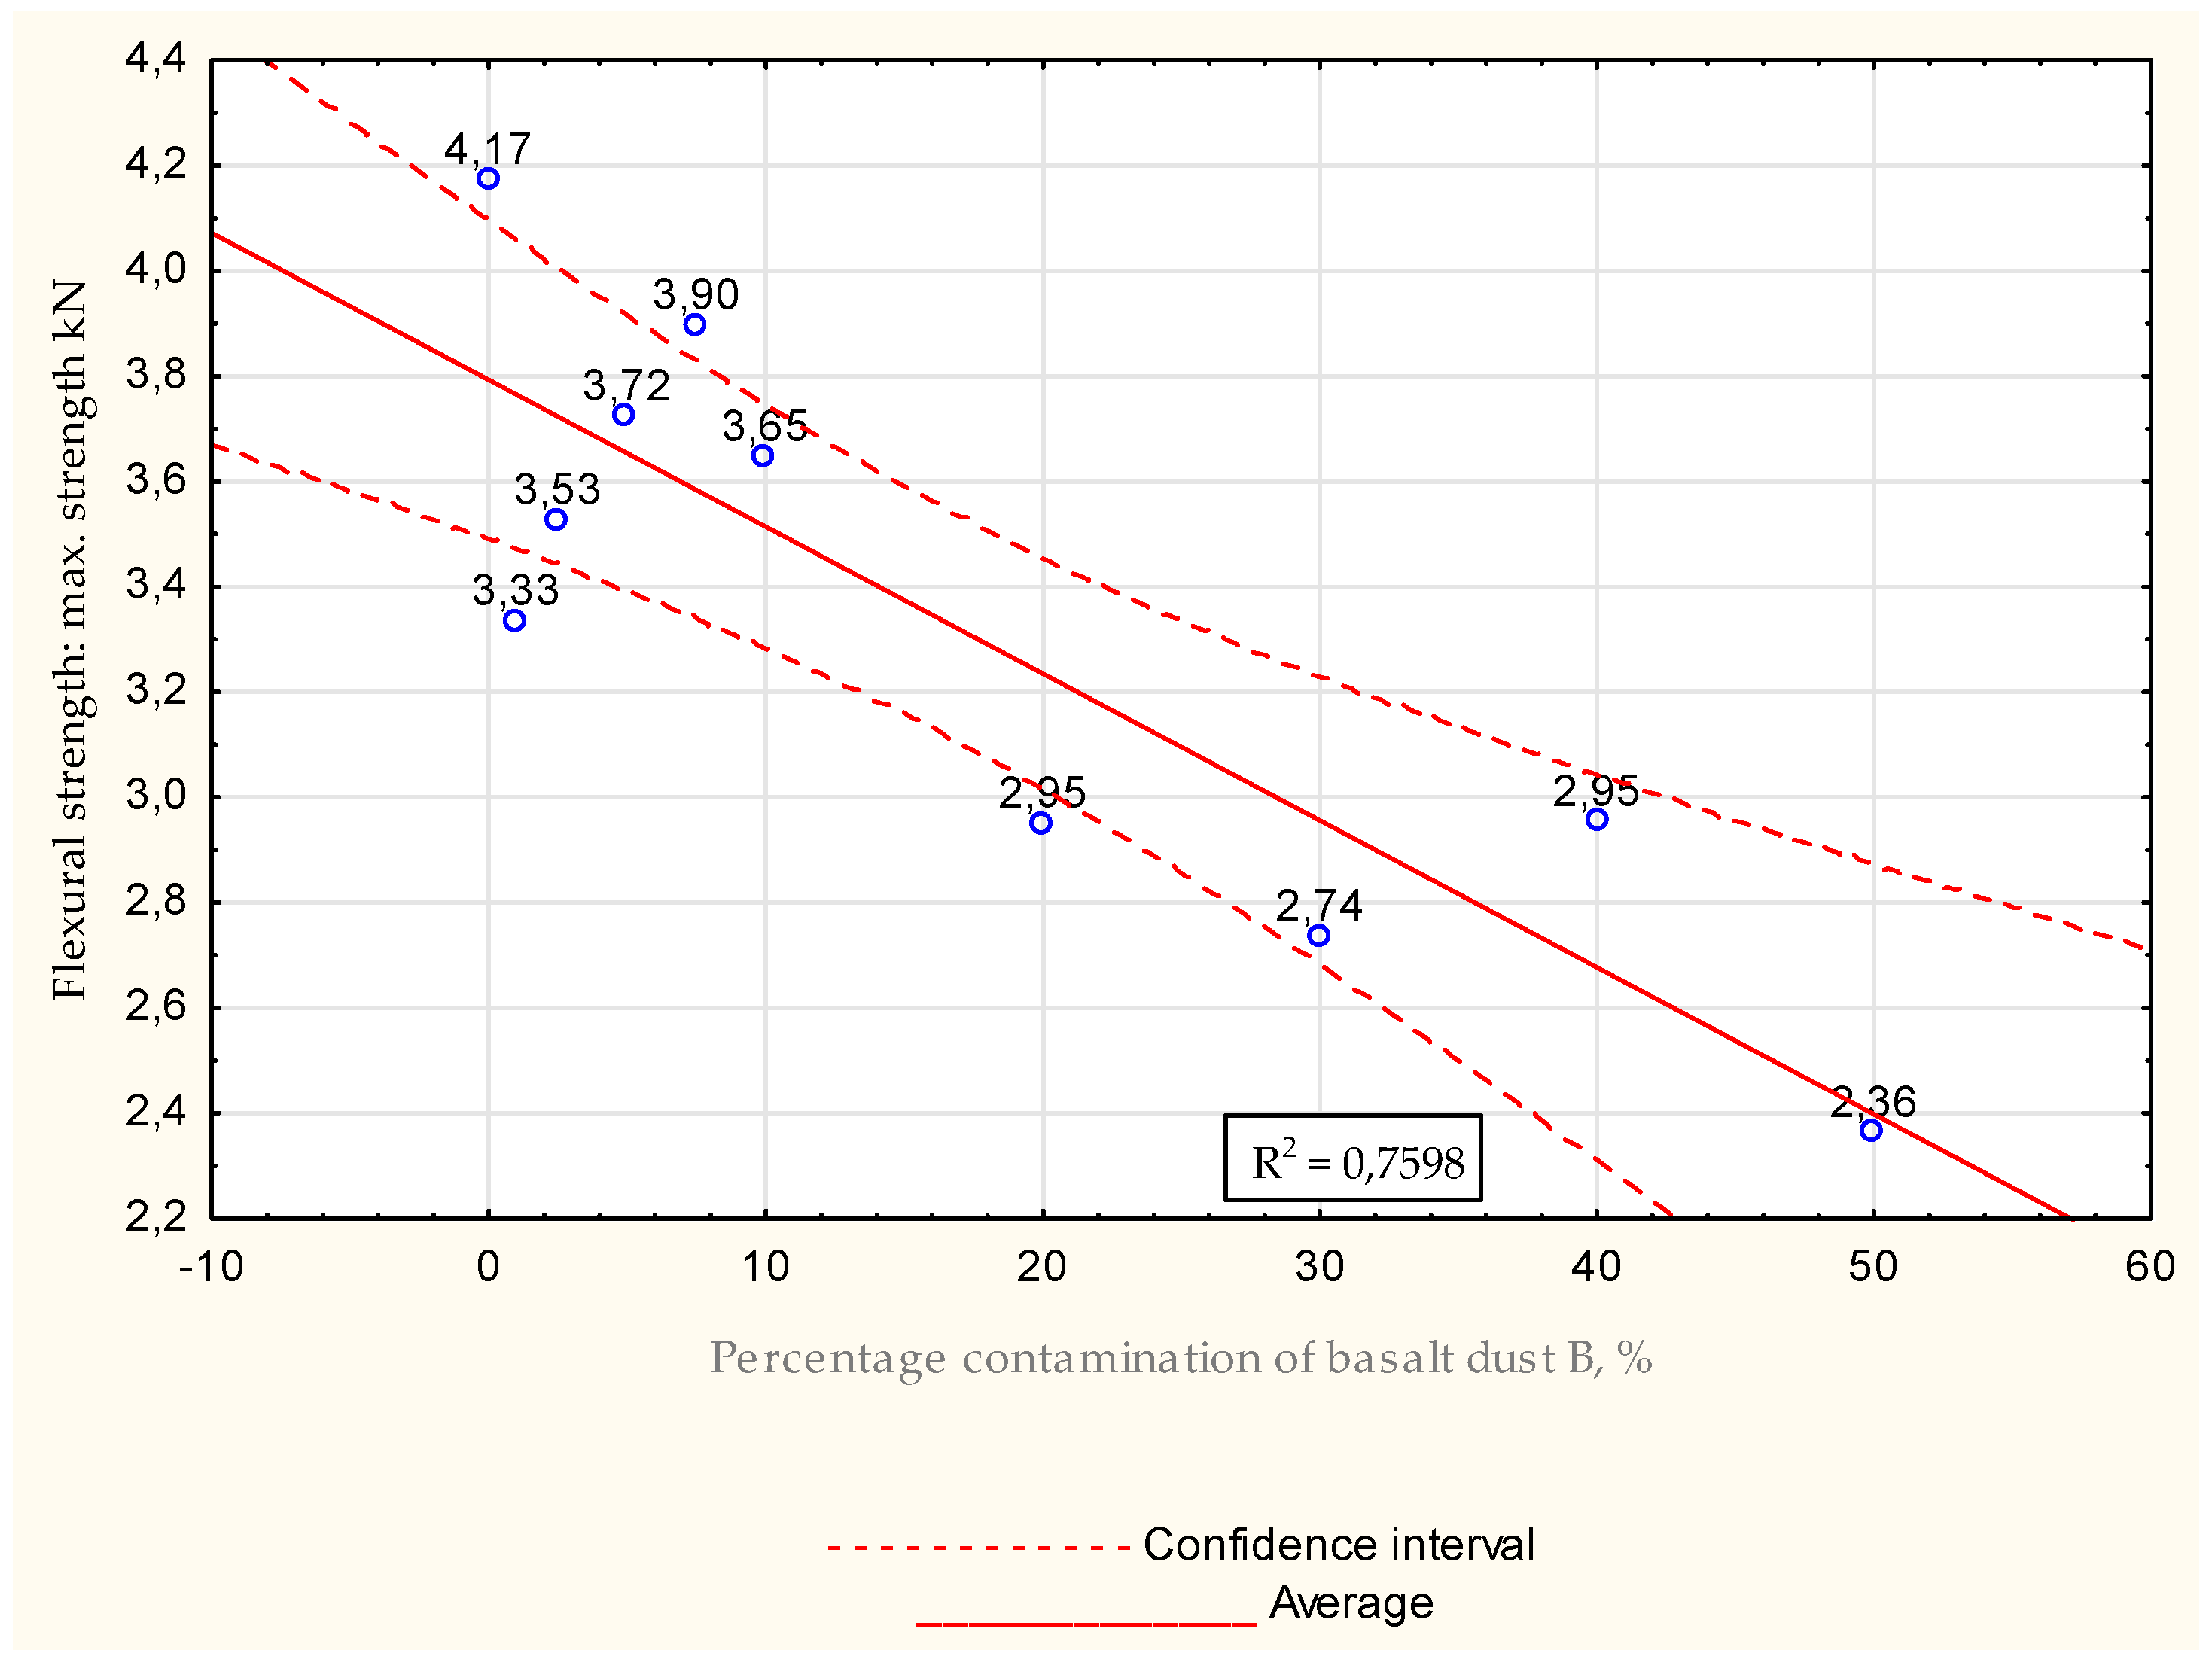
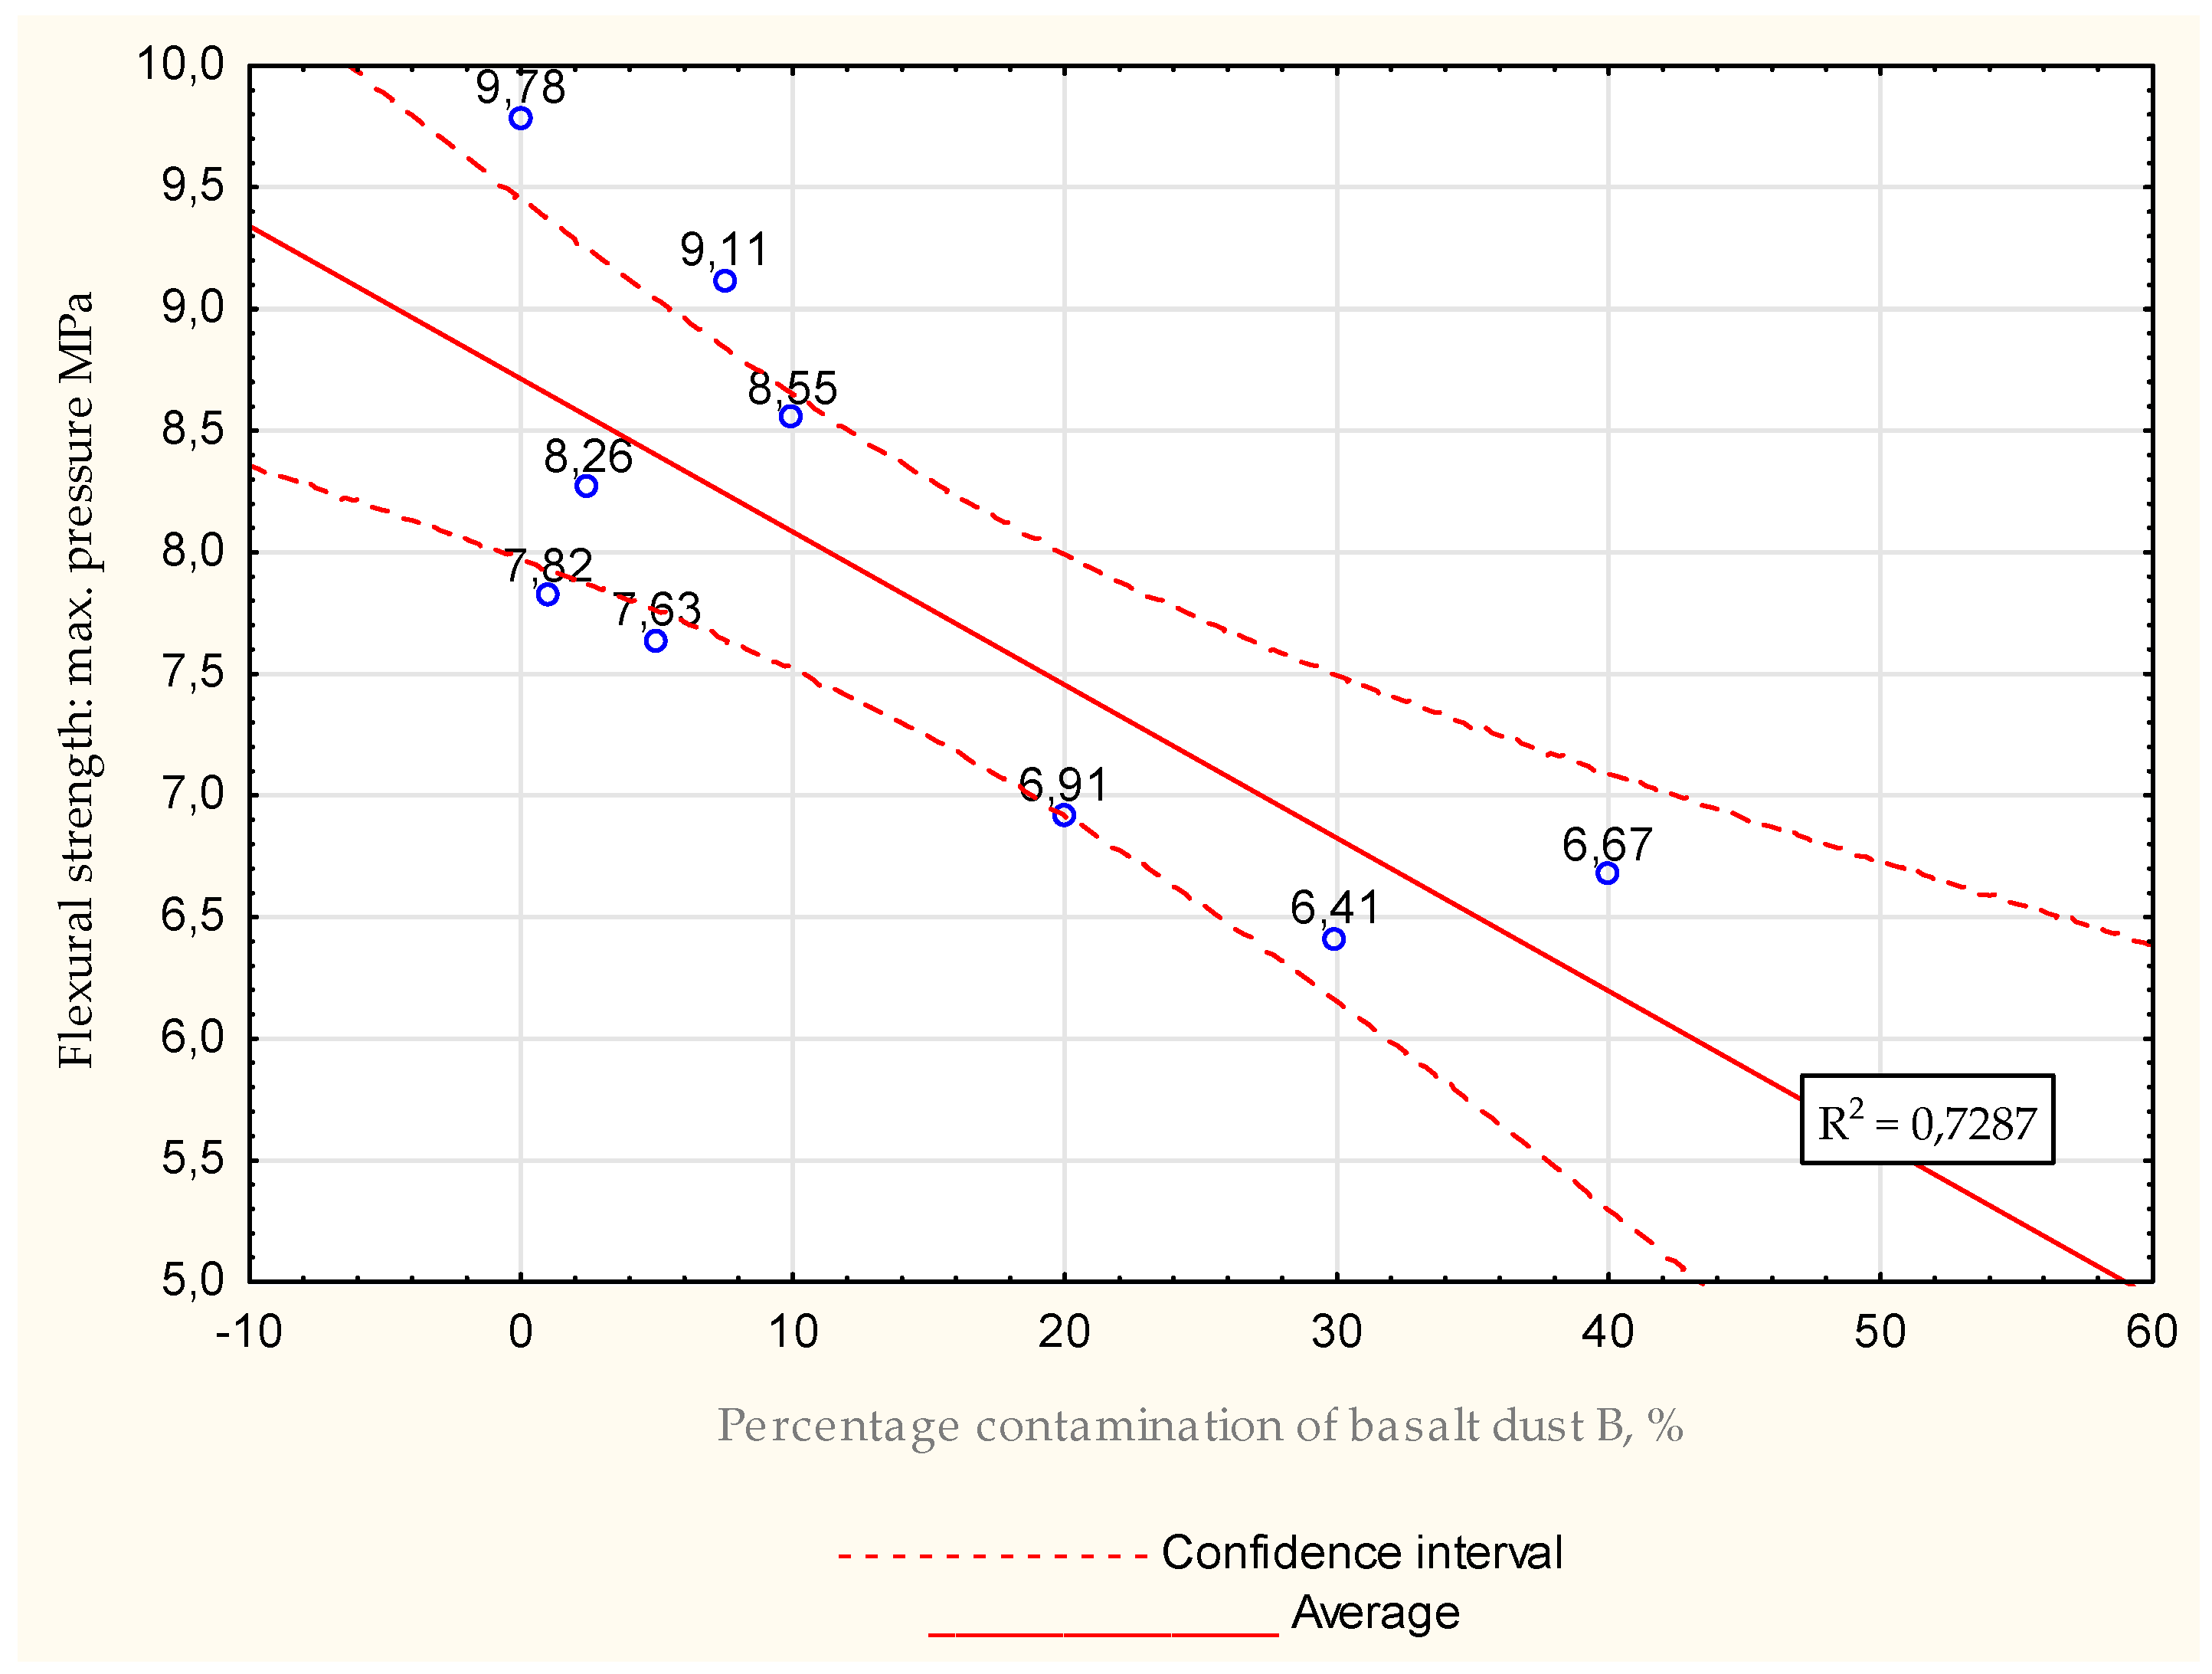
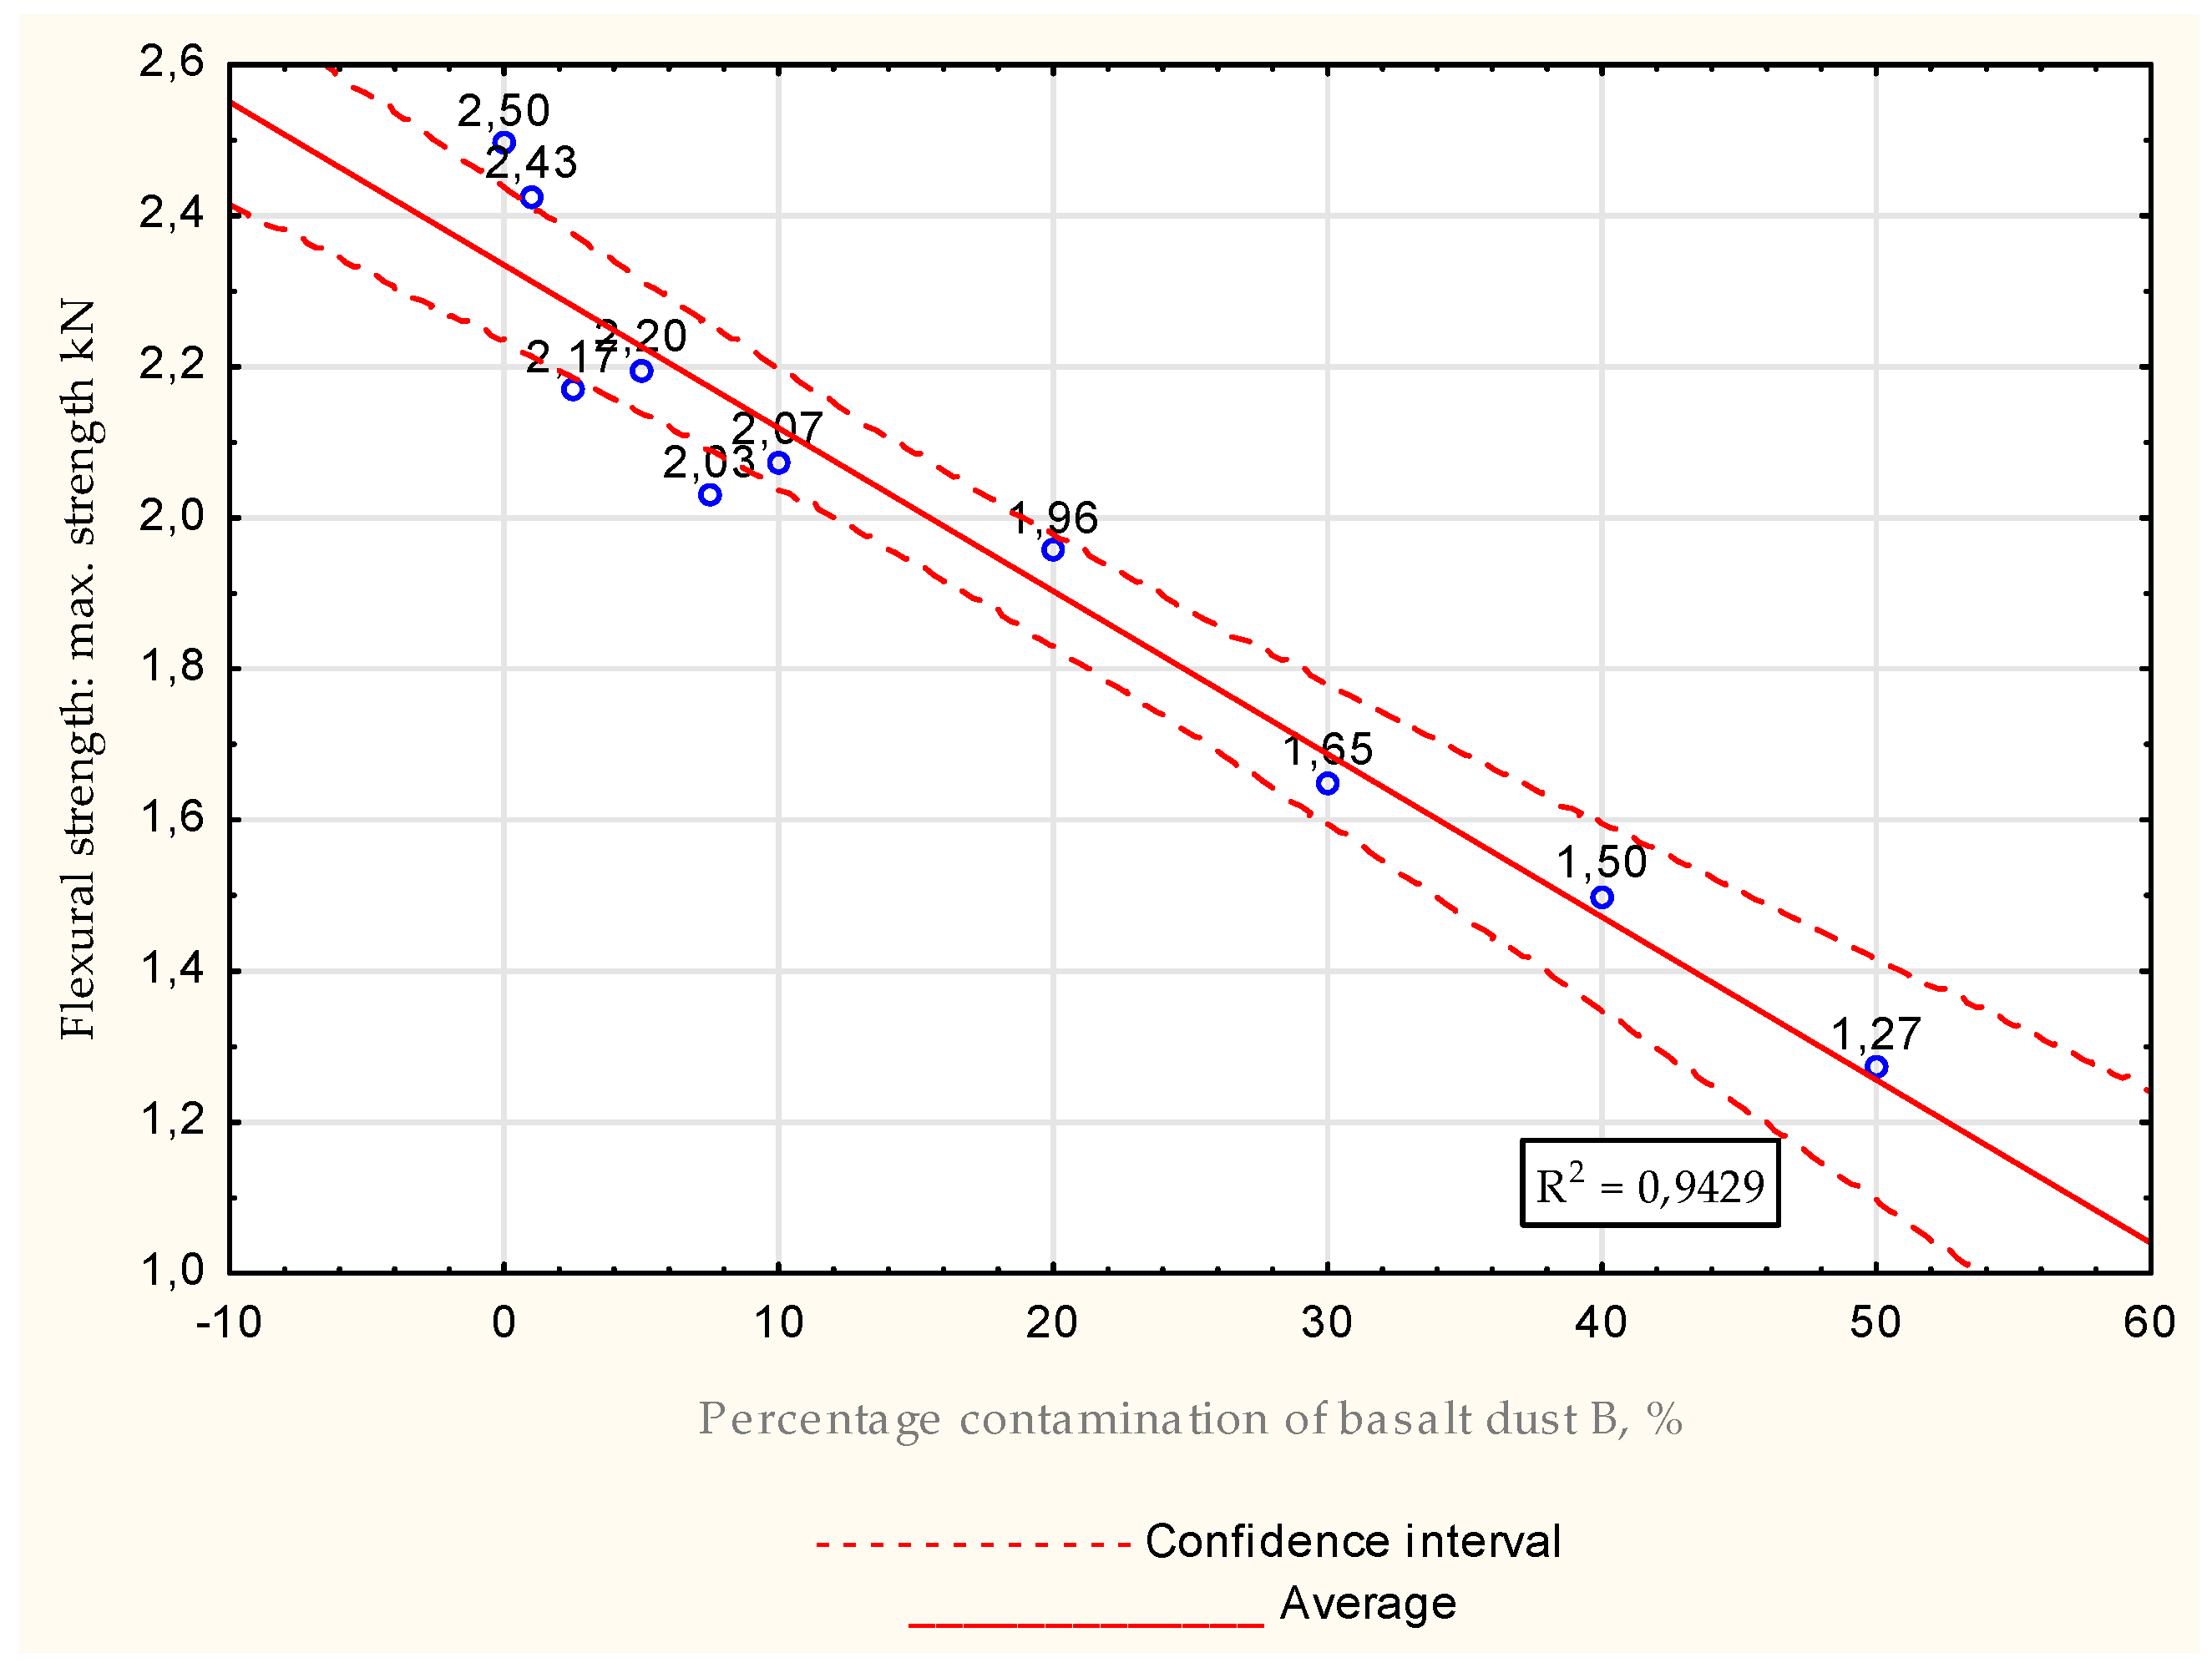
Table 21.
Flexural strength tests for basalt dust B for all samples for water −mix ratio = 0.7 after 28 days.
Table 21.
Flexural strength tests for basalt dust B for all samples for water −mix ratio = 0.7 after 28 days.
| | Maximum Strength [kN] | Maximum Press Force [MPa] |
|---|
| | Statistic | |
| Minimum | 1.272 | 2.962 |
| Maximum | 2.495 | 5.685 |
| Median | 2.057 | 4.926 |
| Average | 1.978 | 4.818 |
| Standard deviation | 0.374 | 0.695 |
| The range of variation | 1.223 | 2.723 |
Figure 35.
Average values obtained during flexural strength tests after 28 days for water −mix ratio = 0.7, maximal strength.
Figure 35.
Average values obtained during flexural strength tests after 28 days for water −mix ratio = 0.7, maximal strength.
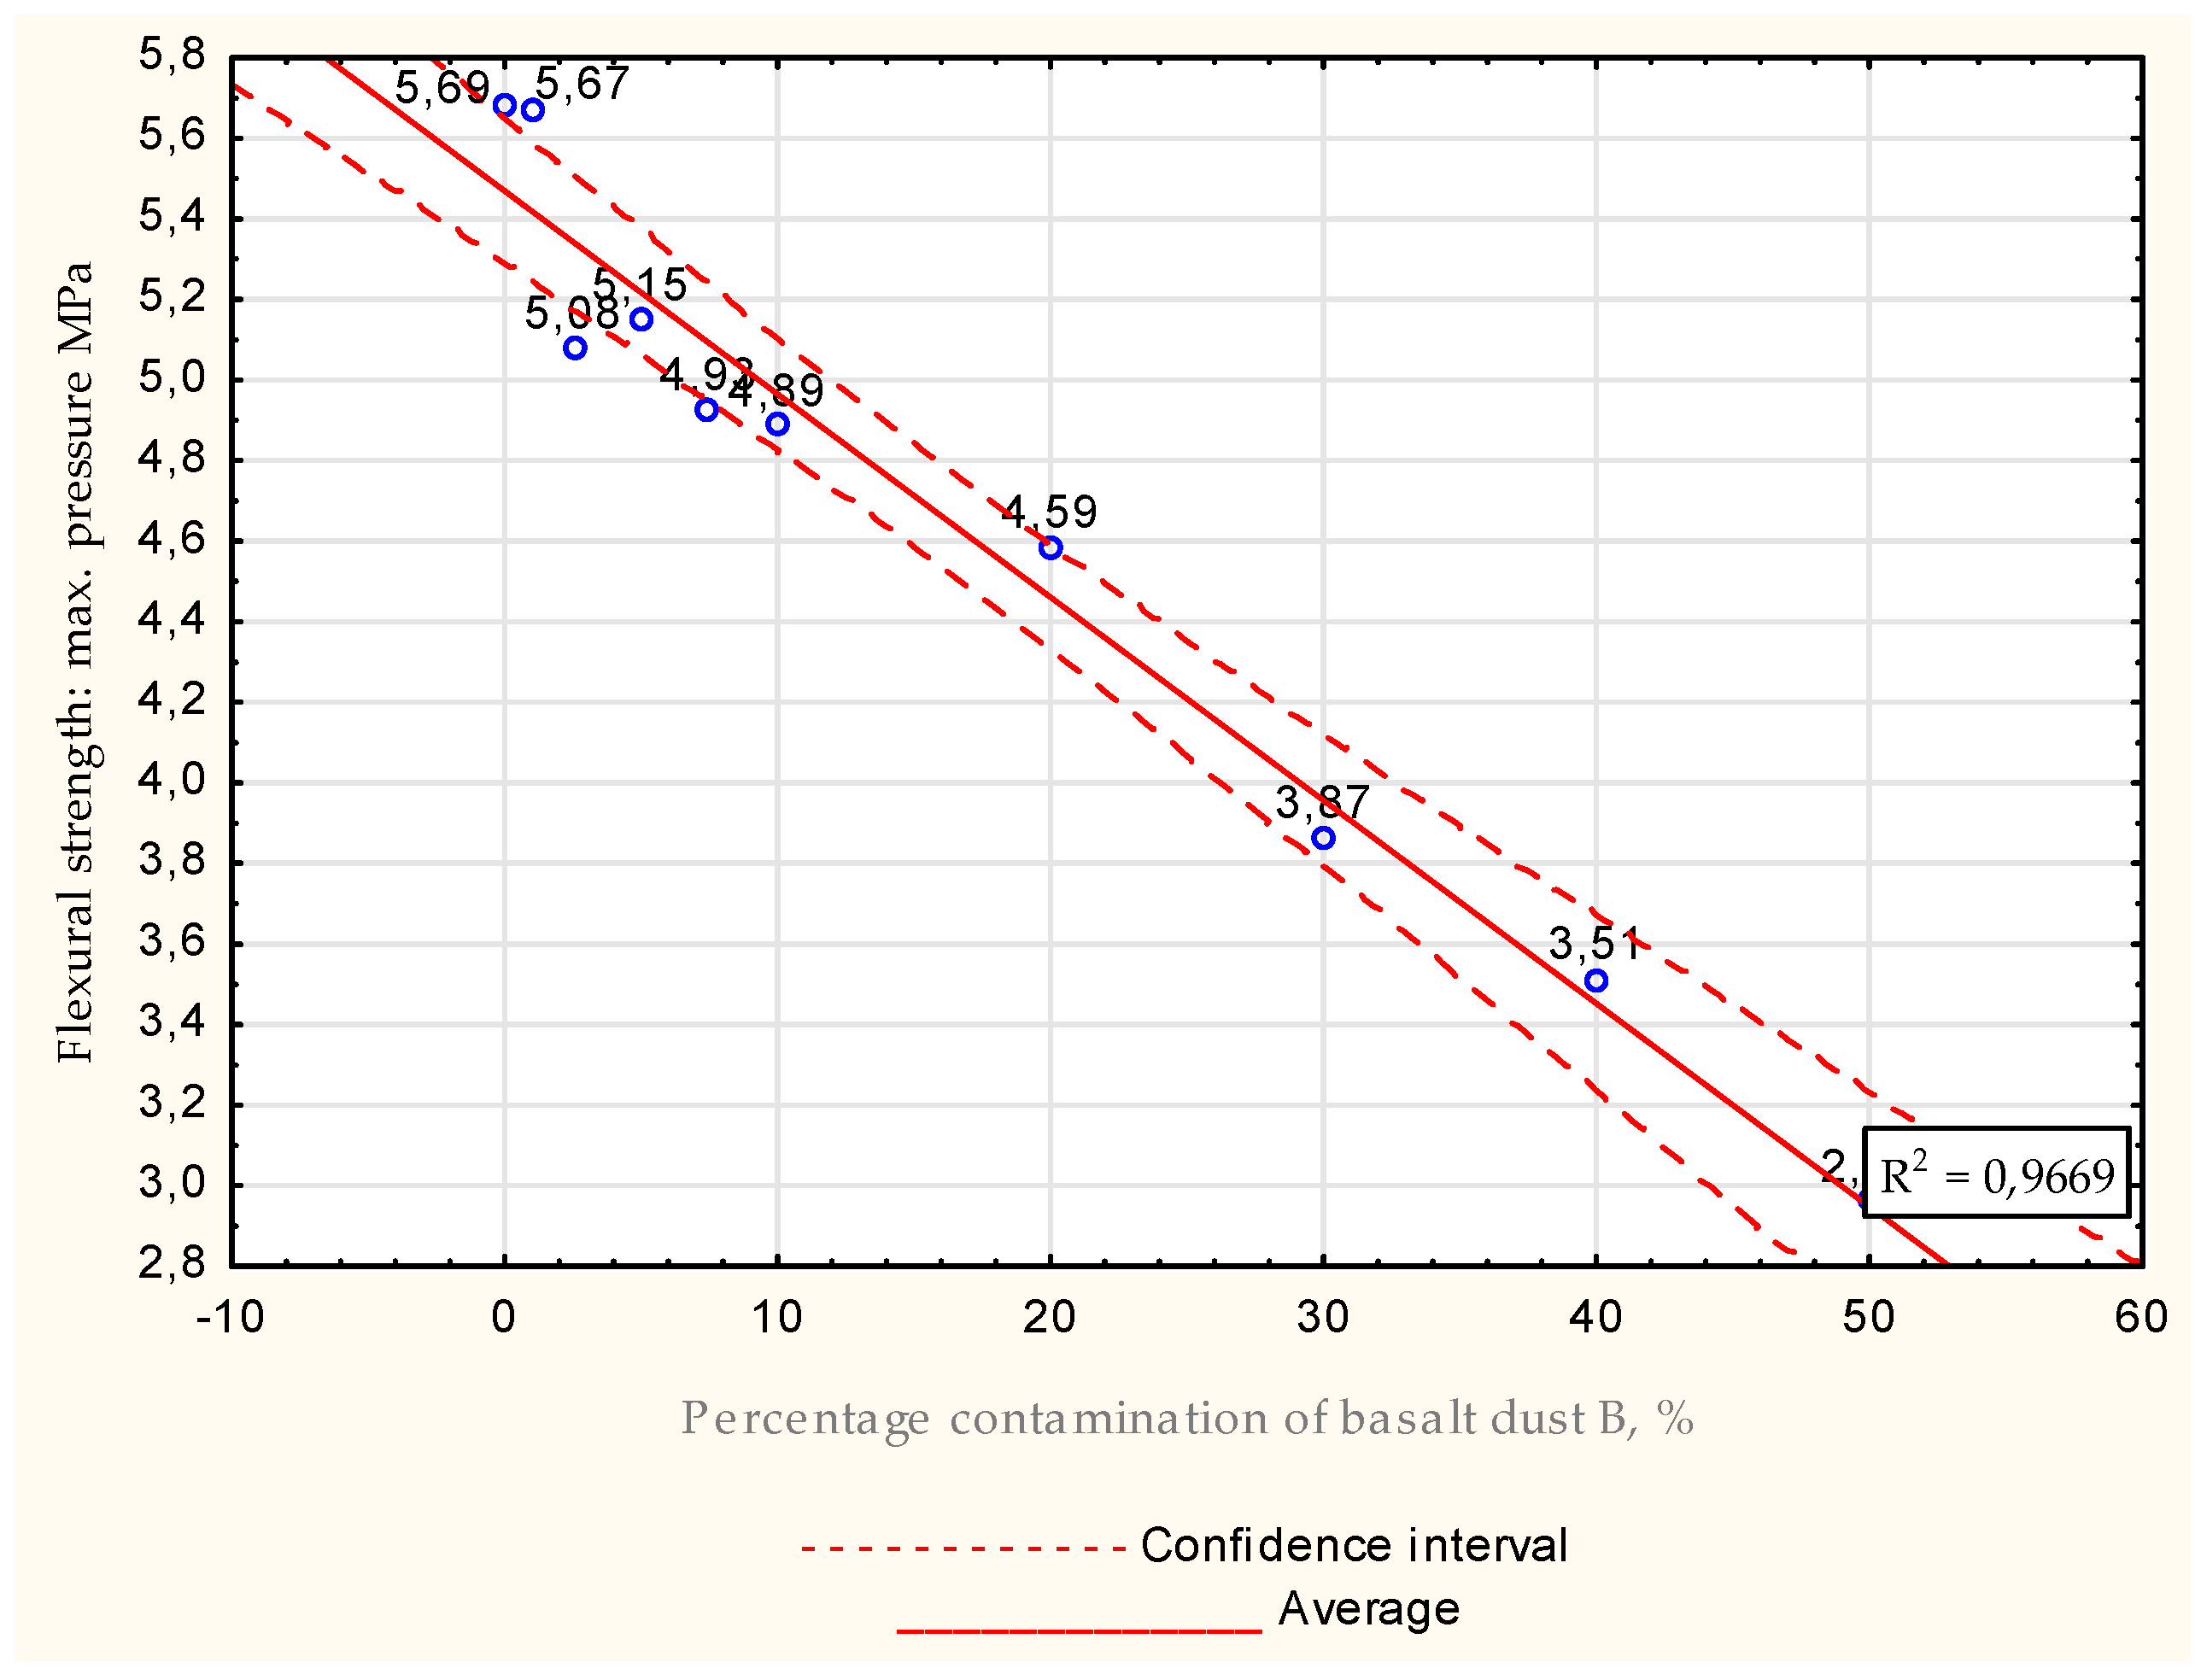
Figure 36.
Average values obtained during flexural strength tests after 28 days for water −mix ratio = 0.7, maximal pressure.
Figure 36.
Average values obtained during flexural strength tests after 28 days for water −mix ratio = 0.7, maximal pressure.
For water–mix ratio 0.7, flexural strength values once again showed a trend of decreasing strength. For both max. strength and max. pressure, the lowest value was obtained for the mixture with 50% basalt dust. Results were about 49% lower for max. strength and about 48% lower for max. pressure compared to those of the base slurry. For the remaining samples, the reduction in values varied between 0.2% and 40%.
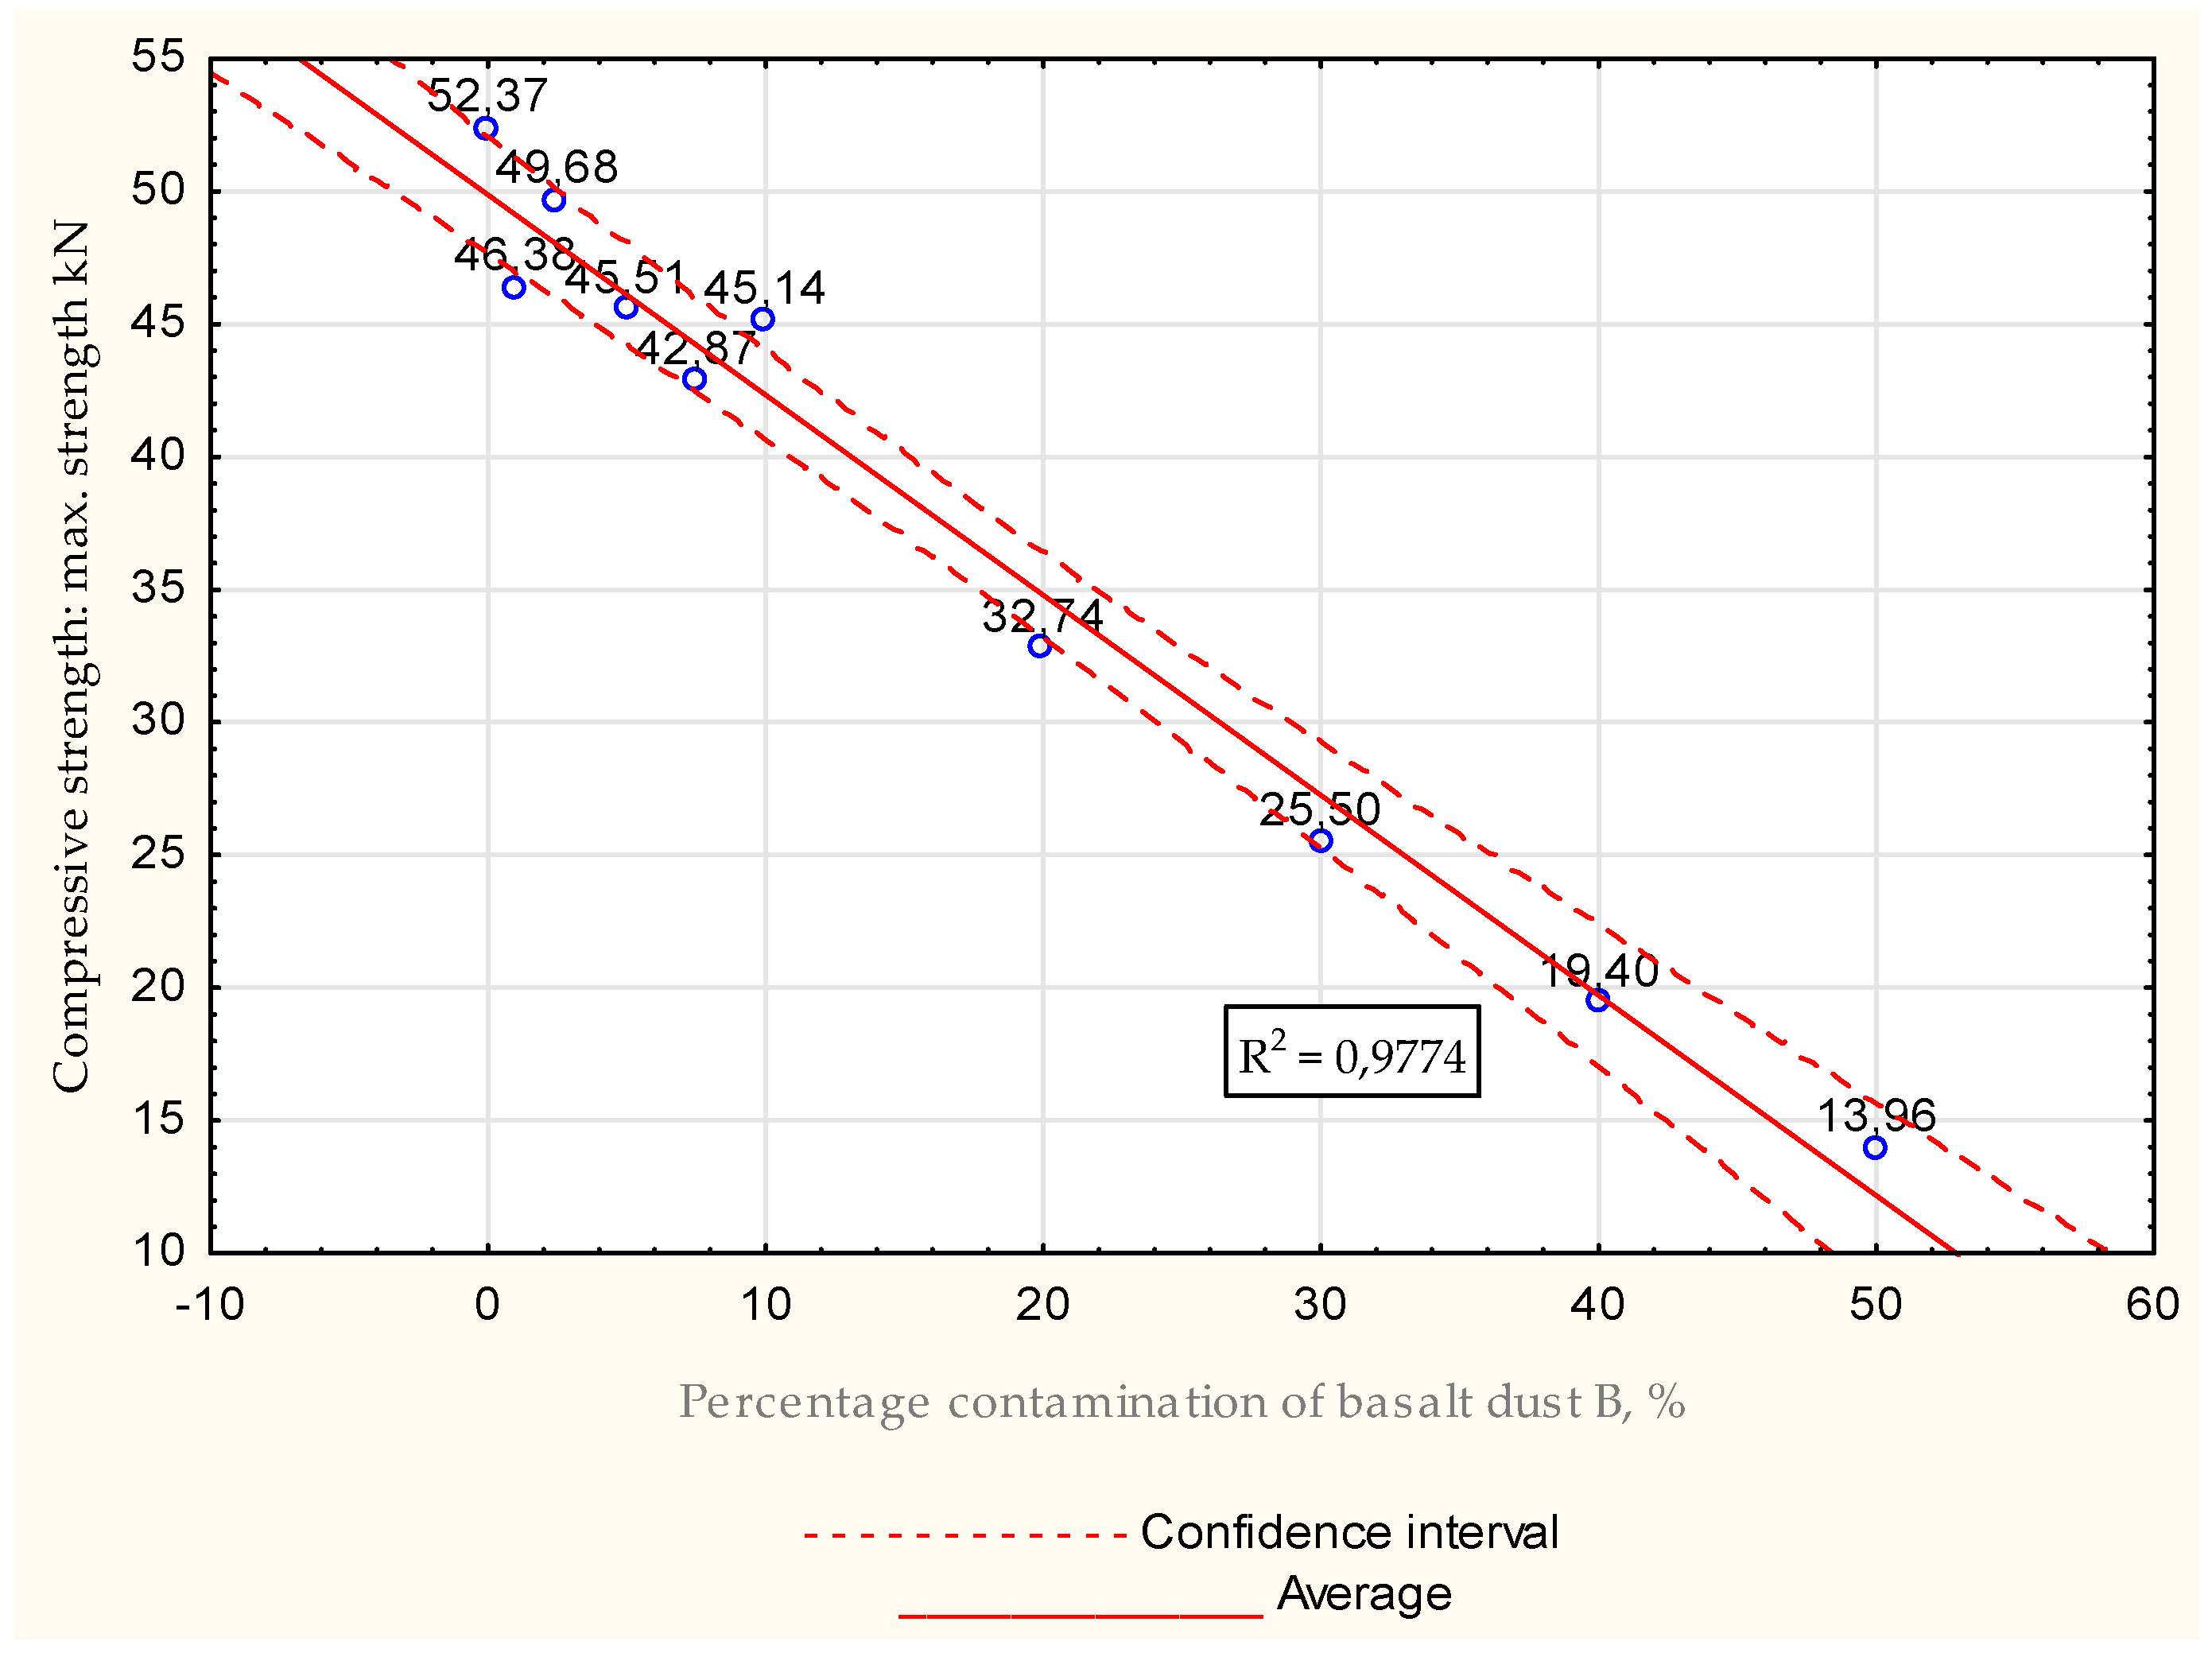
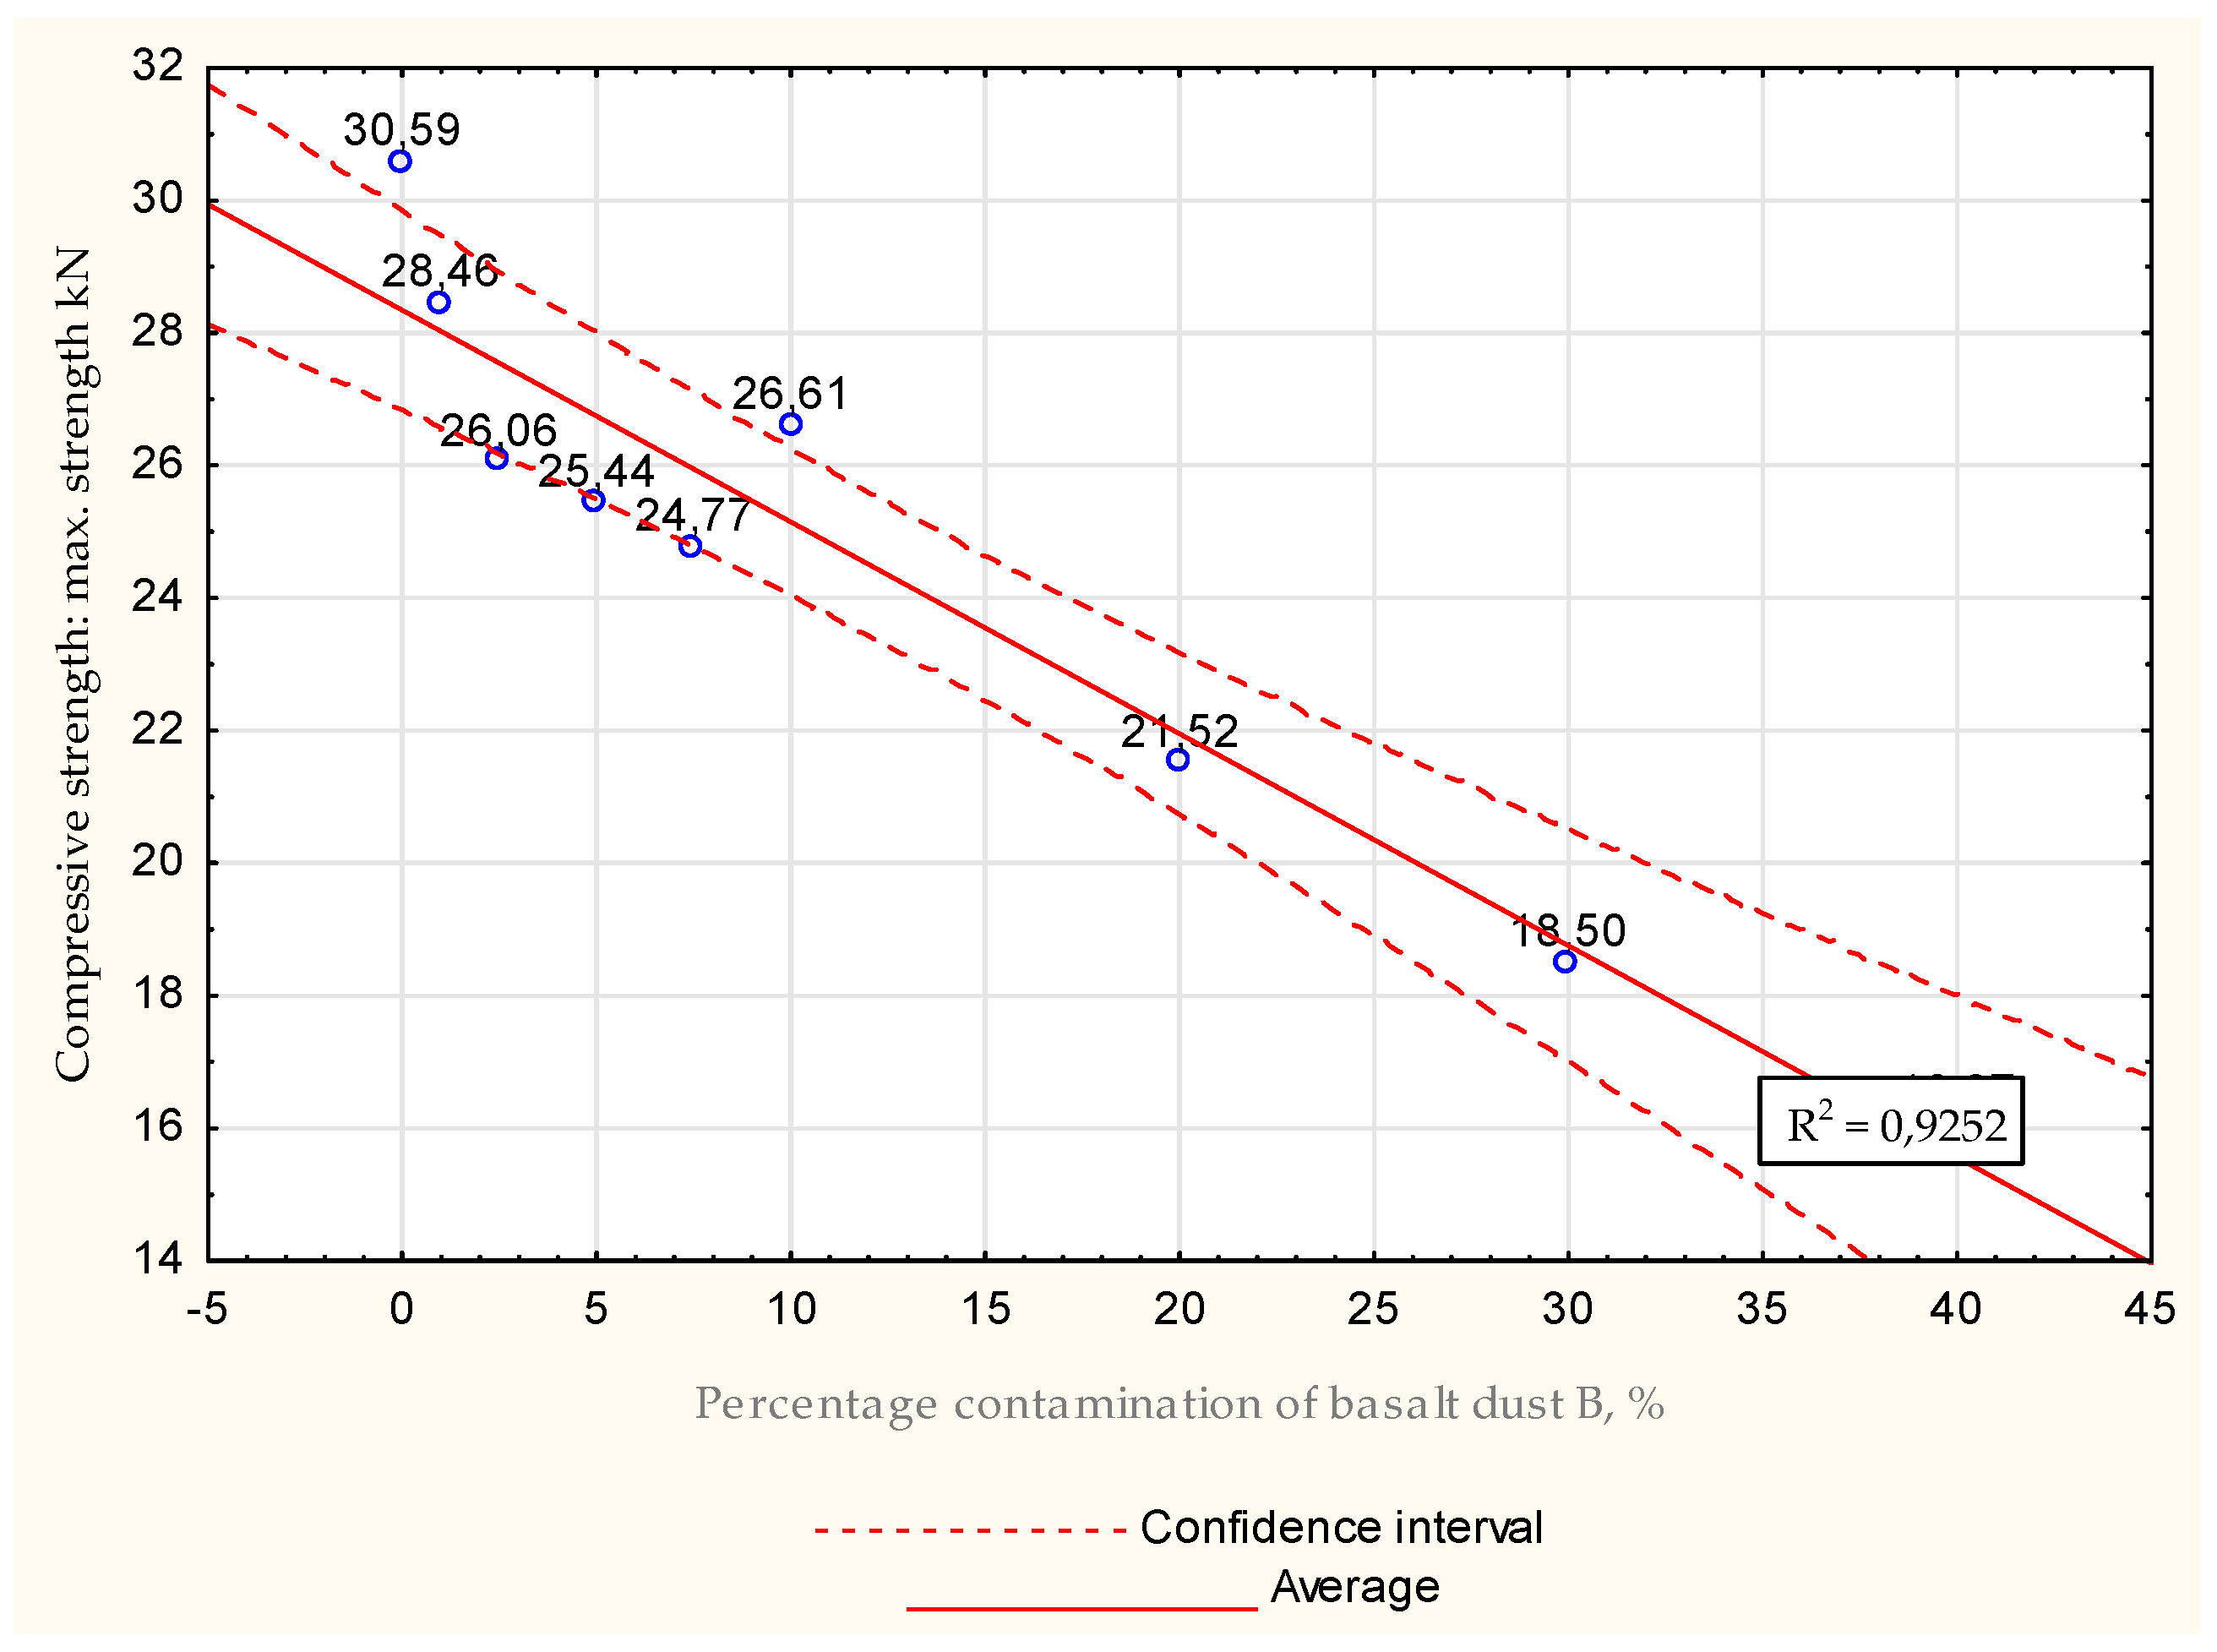
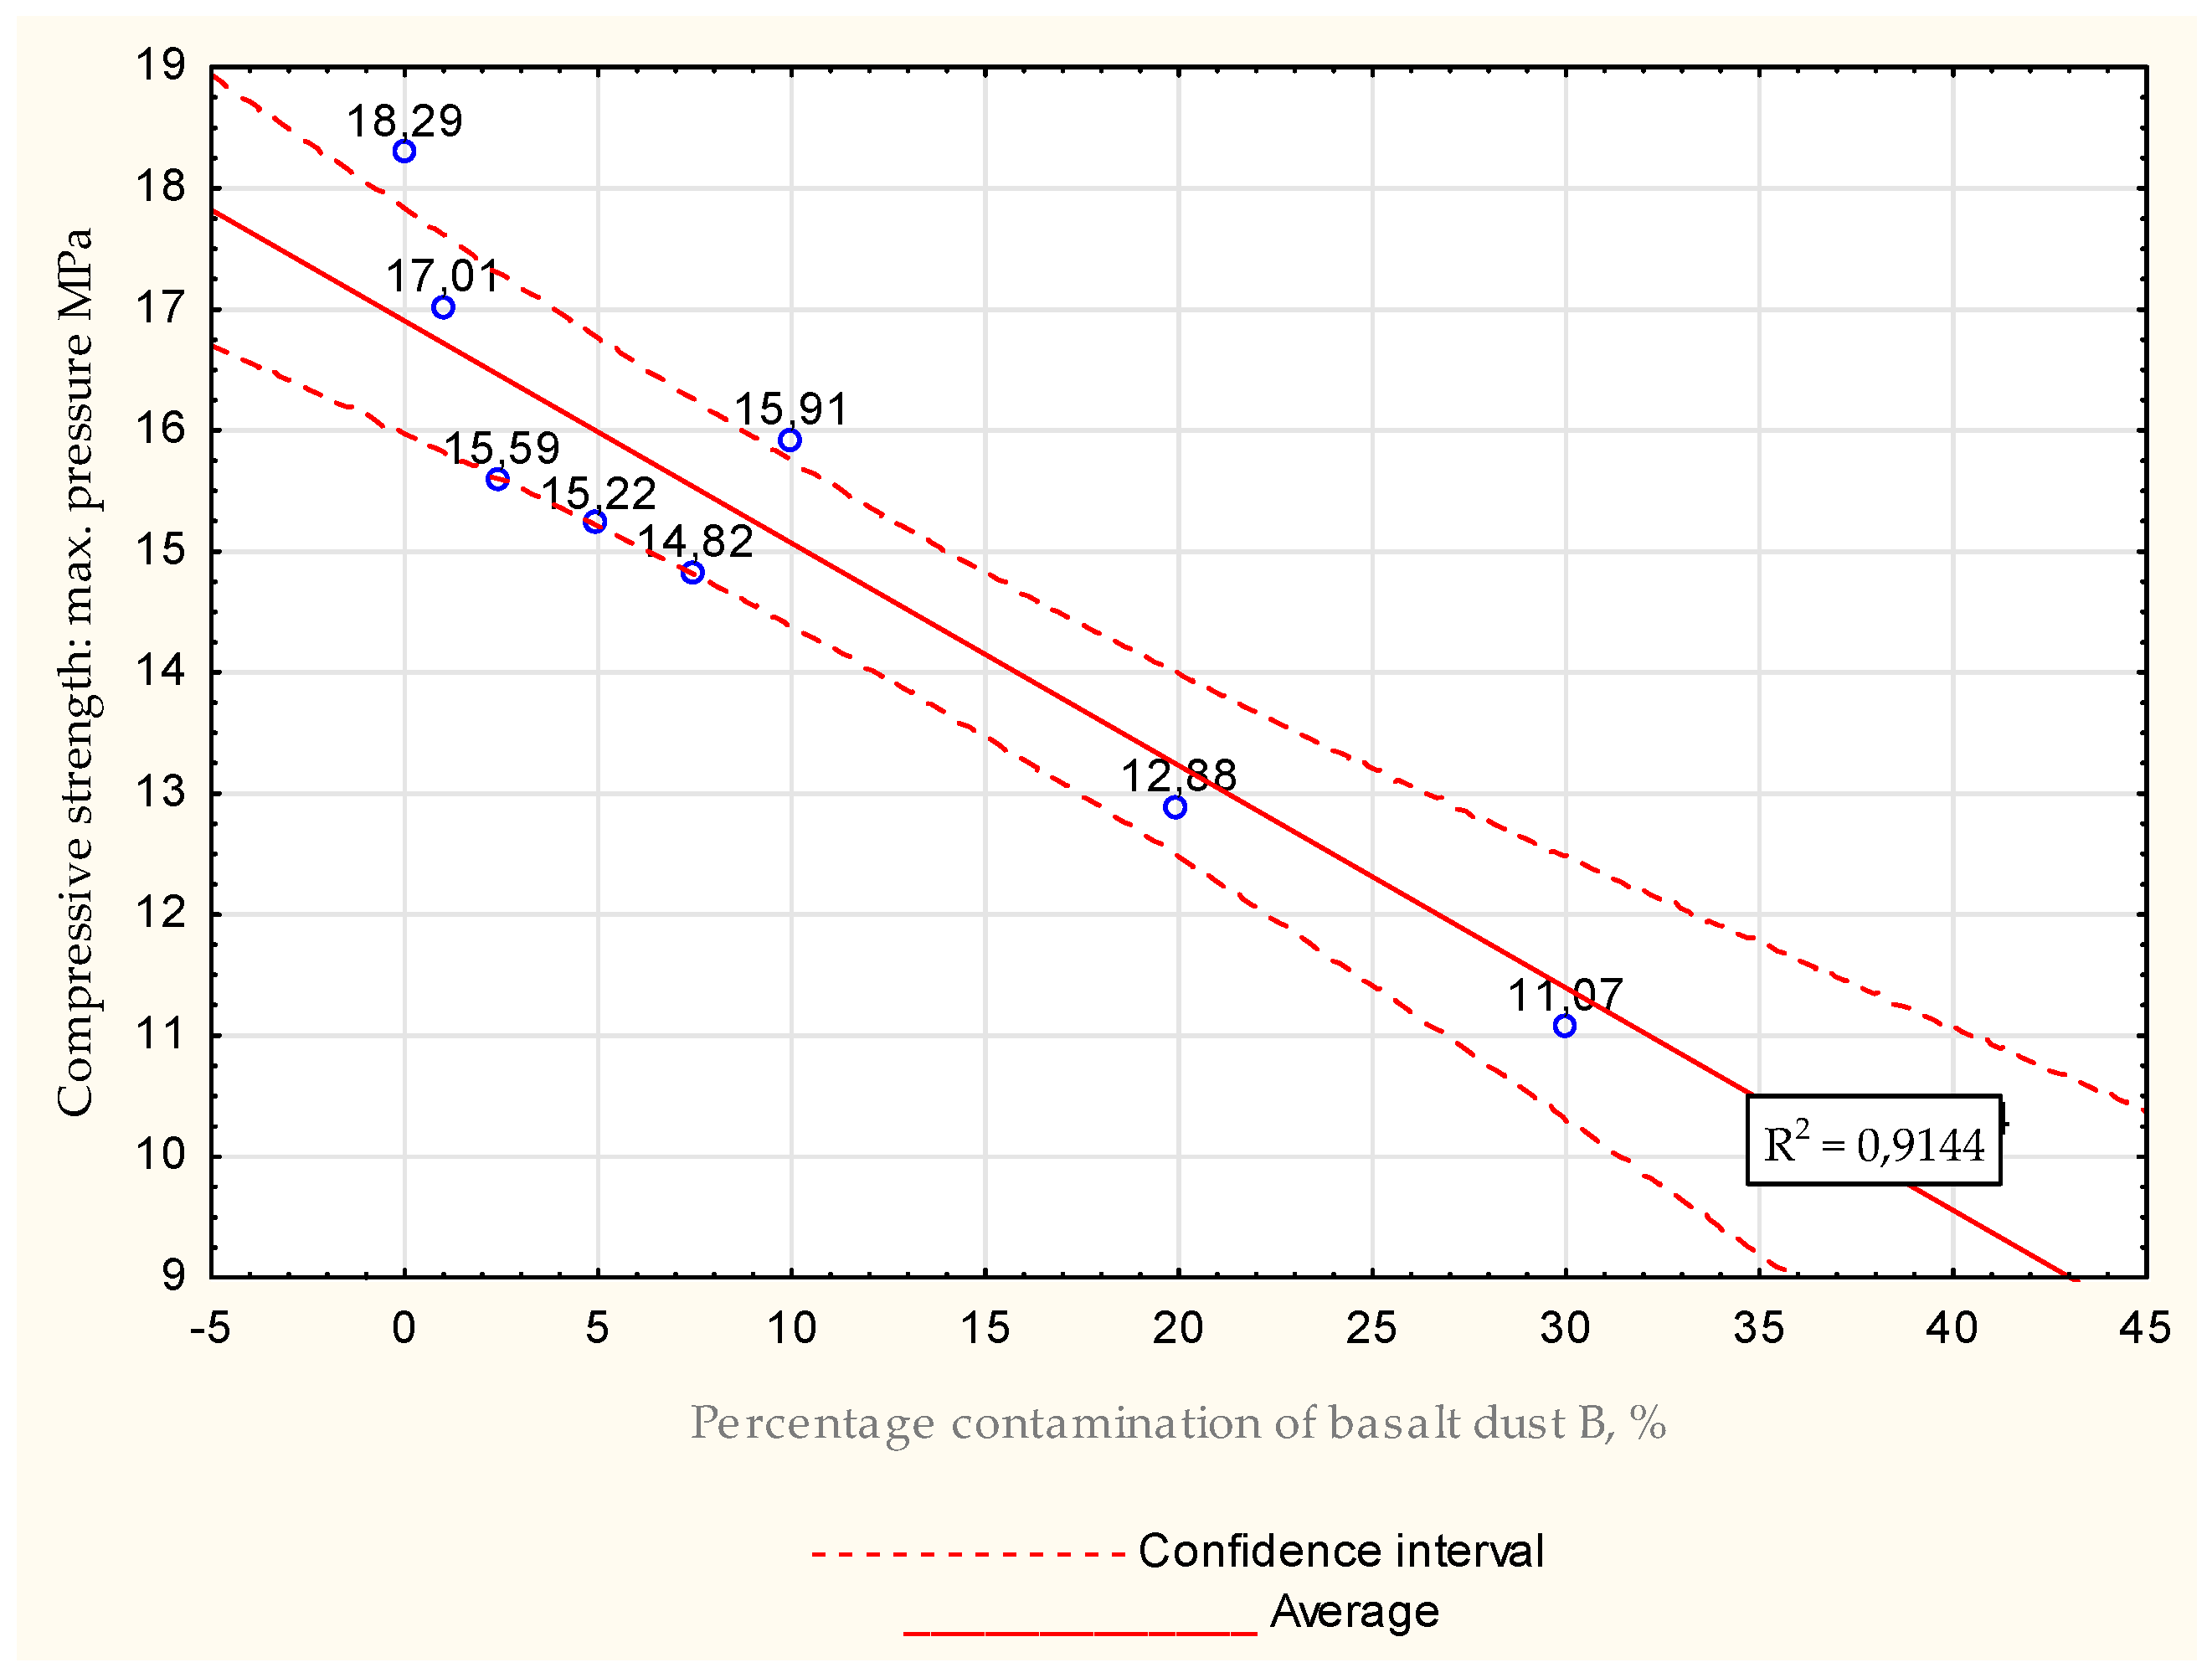
Table 22.
Compressive strength tests for basalt dust B for all samples for water −mix ratio = 0.7 after 28 days.
Table 22.
Compressive strength tests for basalt dust B for all samples for water −mix ratio = 0.7 after 28 days.
| | Maximum Strength [kN] | Maximum Press Force [MPa] |
|---|
| | Statistic | |
| Minimum | 12.770 | 7.981 |
| Maximum | 30.586 | 18.292 |
| Median | 25.108 | 15.016 |
| Average | 23.079 | 13.880 |
| Standard deviation | 5.421 | 3.122 |
| The range of variation | 17.816 | 10.311 |
Figure 37.
Average values obtained during compressive strength tests after 28 days for water −mix ratio = 0.7, max. strength.
Figure 37.
Average values obtained during compressive strength tests after 28 days for water −mix ratio = 0.7, max. strength.
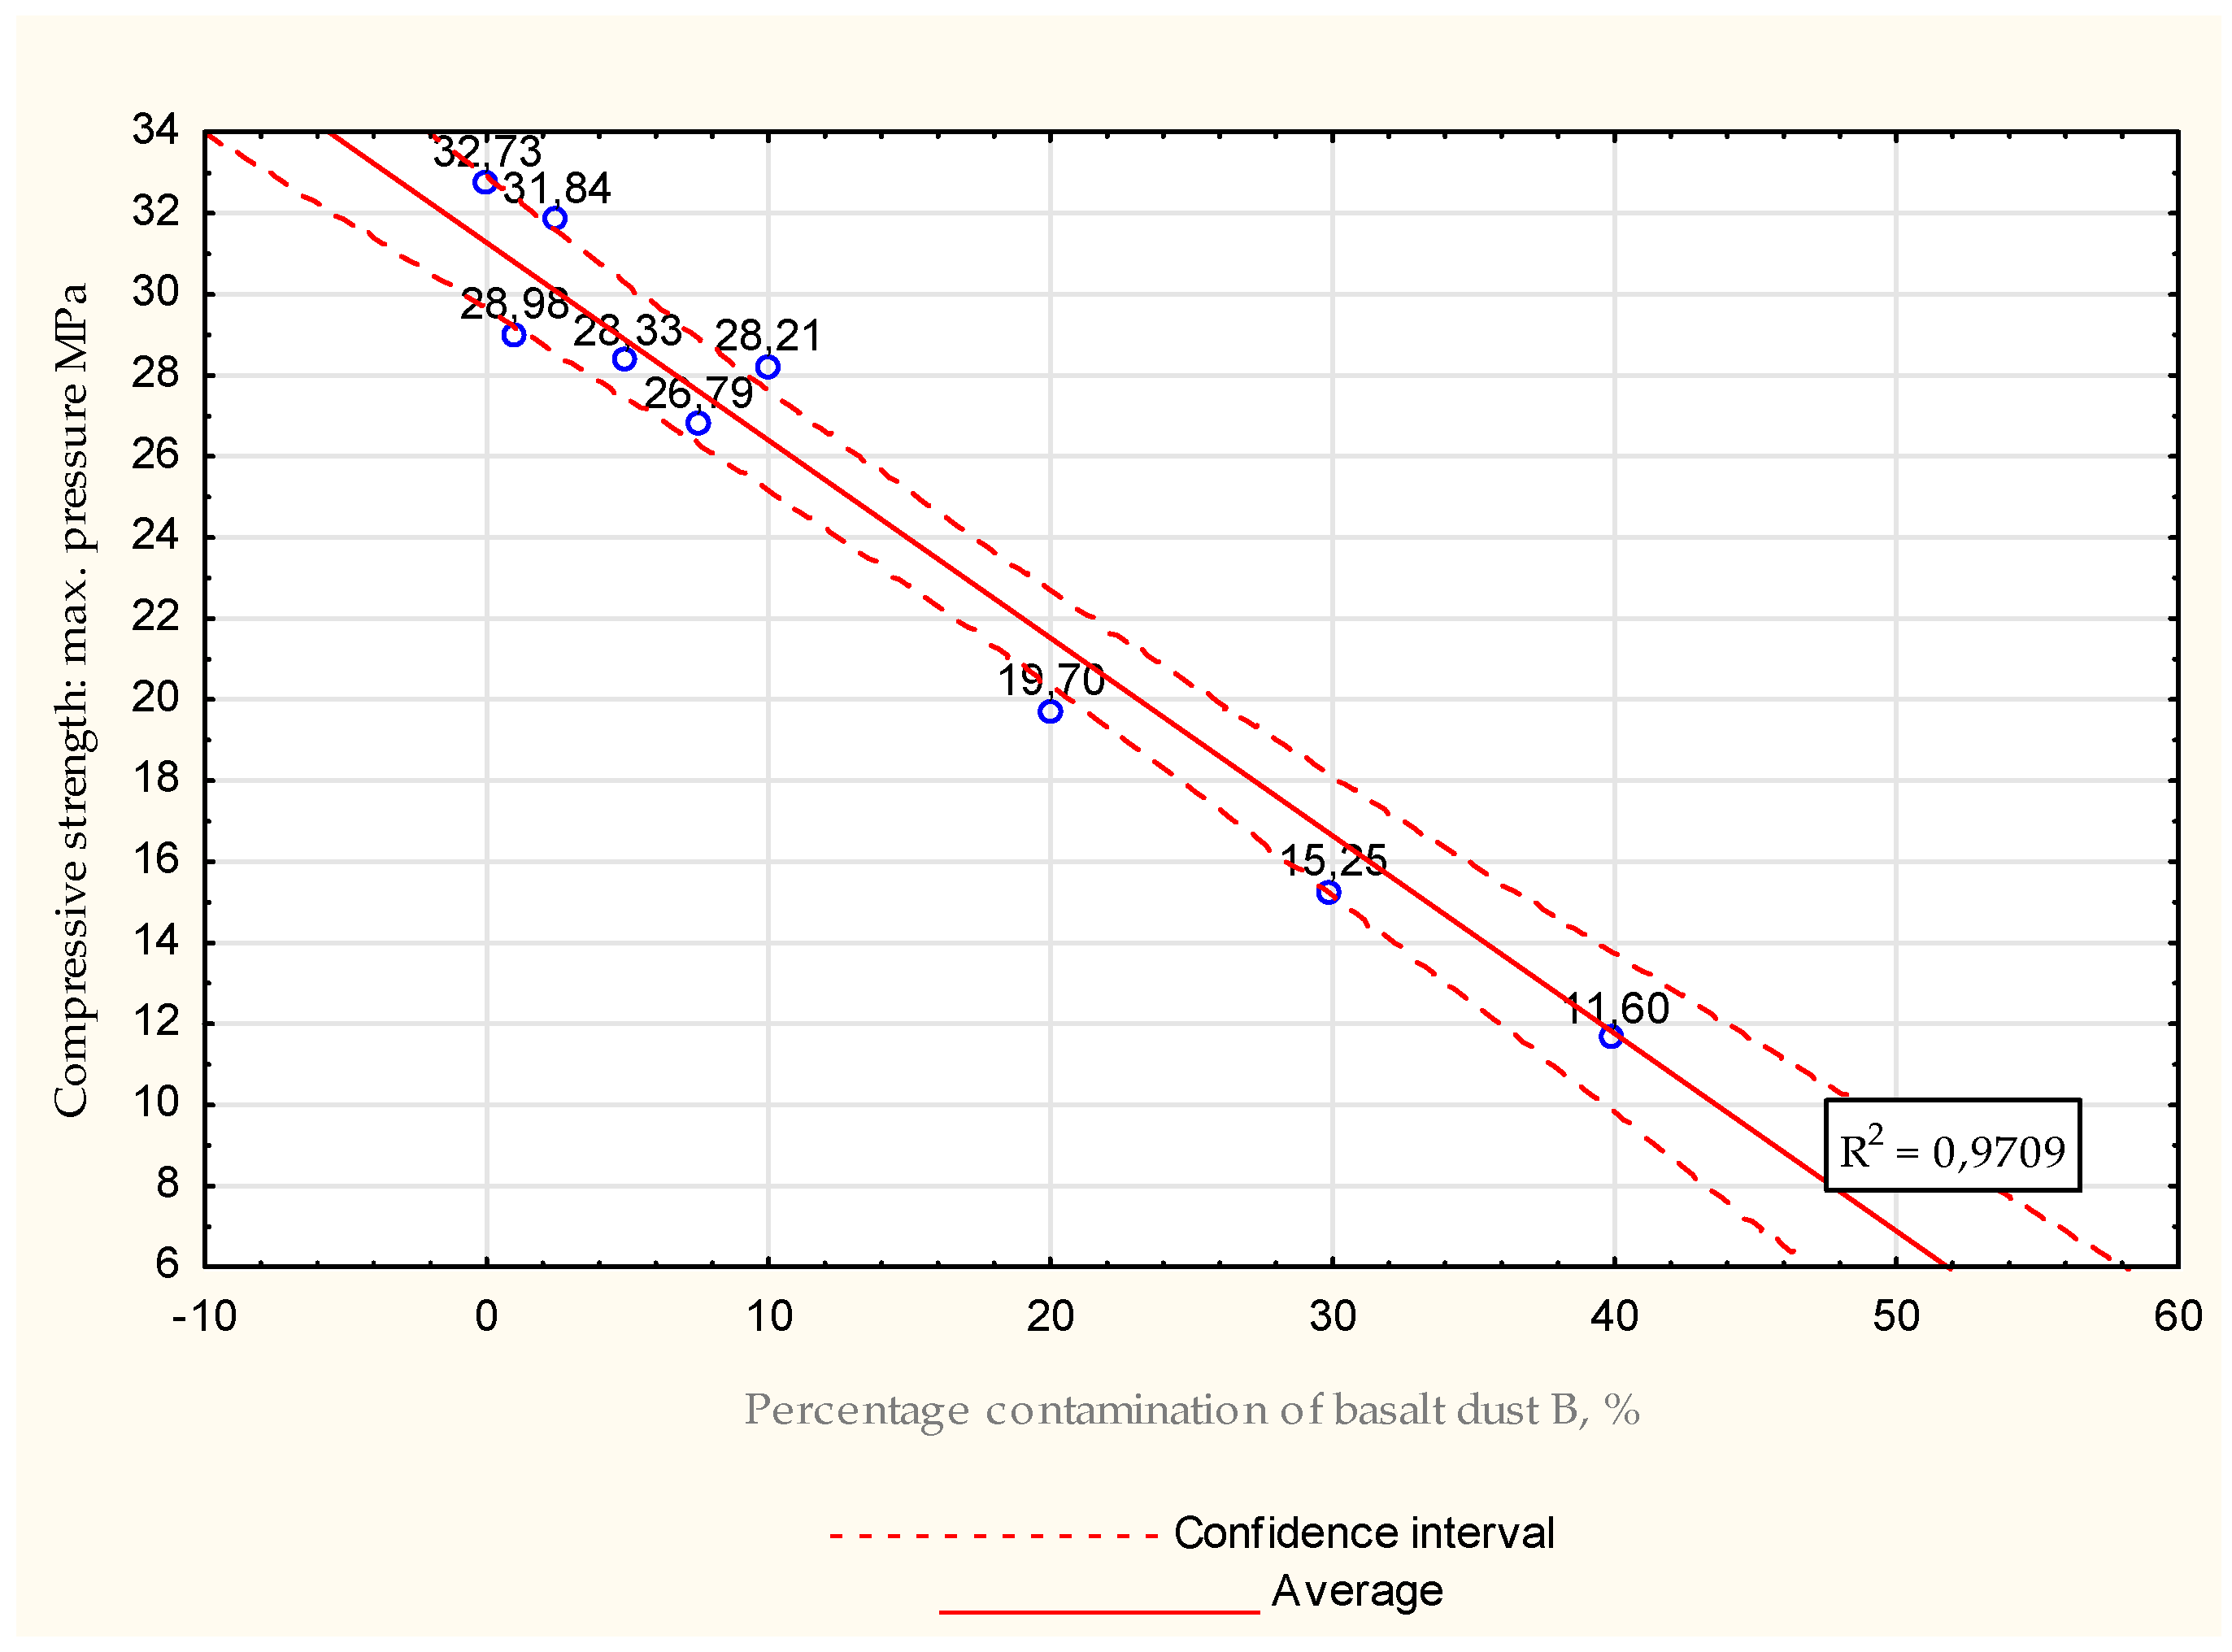
Figure 38.
Average values obtained during compressive strength tests after 28 days for water −mix ratio = 0.7, max. pressure.
Figure 38.
Average values obtained during compressive strength tests after 28 days for water −mix ratio = 0.7, max. pressure.
Similar to those for flexural strength, compressive strength test results showed decreasing values with an increased concentration of basalt dust. The lowest value was obtained for samples with 50% additive. The decrease in strength was about 58% compared to the zero sample. For other grout mixtures, the decrease in values varied between −7% and −47%.


