
Thermodynamic Optimization of Advanced Organic Rankine Cycle Configurations for Geothermal Energy Applications


Abstract
:1. Introduction
2. Methodology
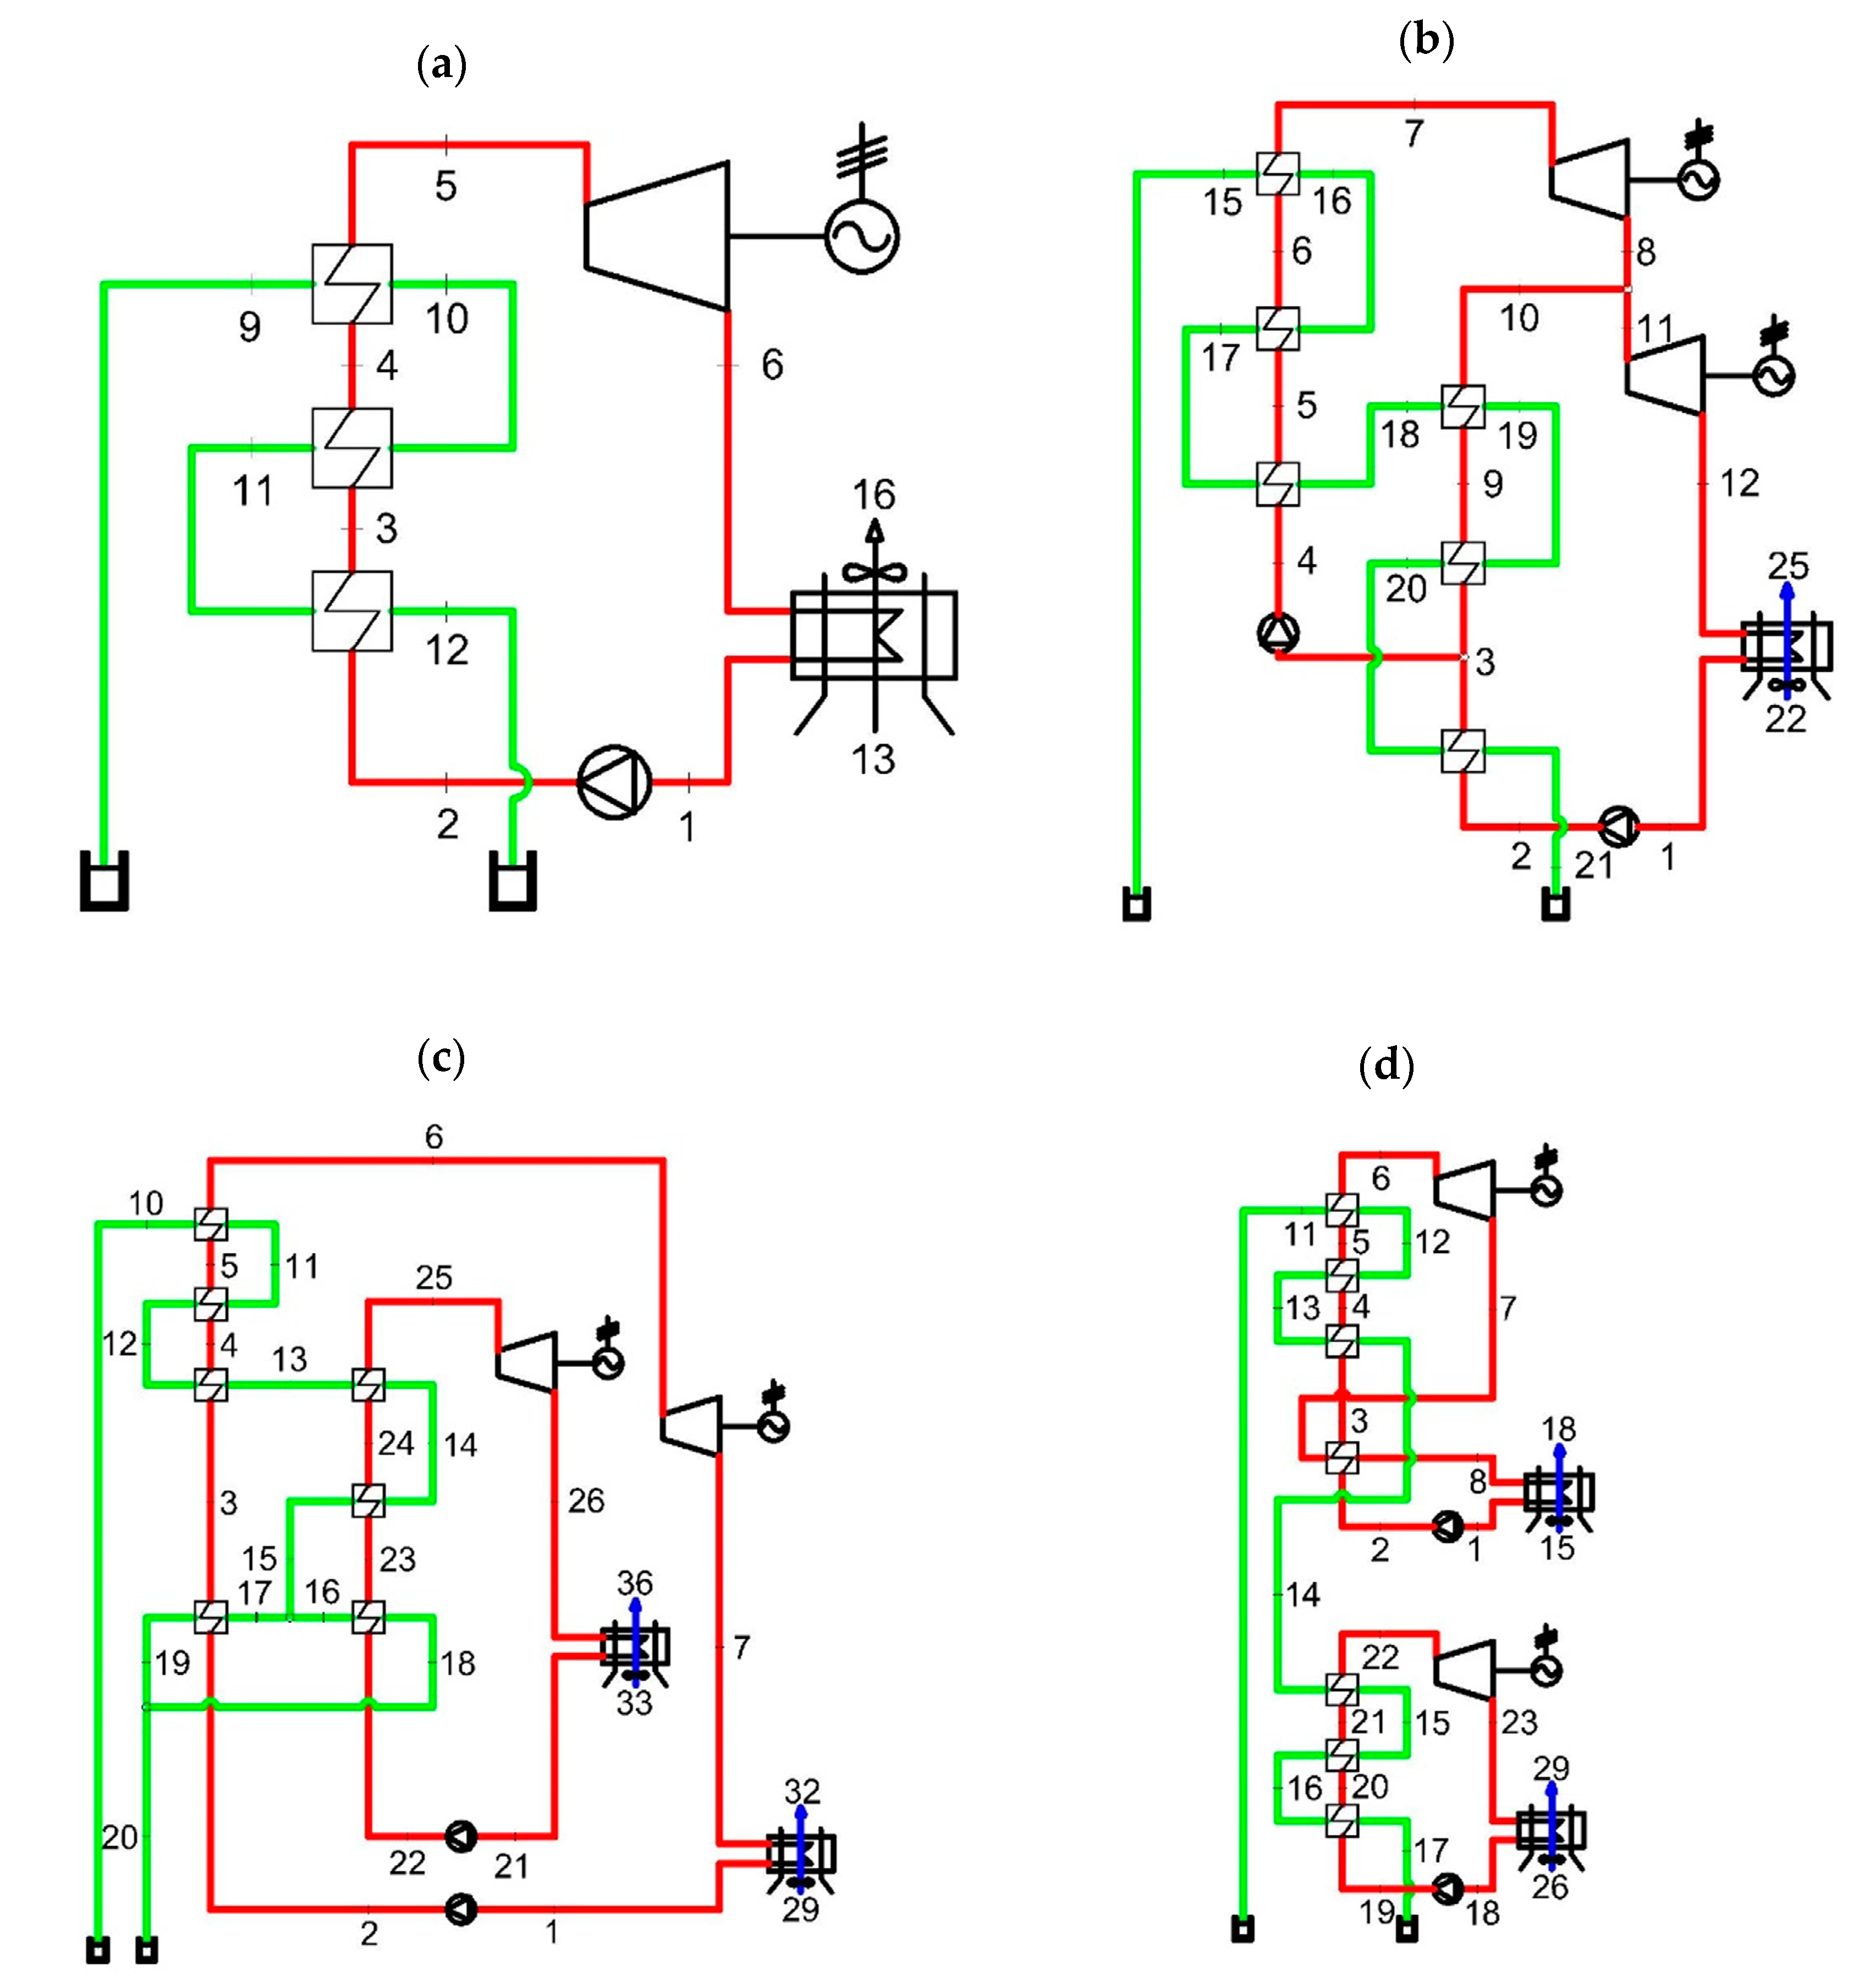
2.1. System Description
2.2. Thermodynamic Modeling and Assumptions
- The mass flow rate of the working fluid in all considered ORC configurations is 1.0 kg/s;
- The systems operate in a steady-state condition;
- Changes in kinetic and potential energies are neglected;
- The pumps and the turbines operate adiabatically with appropriate isentropic and mechanical efficiencies, as given in Table 2;
- Pressure losses are neglected through the heat exchangers and in the pipelines;
- The geothermal field is considered to be a water-dominated reservoir and geothermal brine is assumed to be a saturated liquid state.
2.2.1. Energy System Models and Assumptions
2.2.2. Conventional Exergy System Models
2.3. Selected Working Fluids
2.4. Systems Optimization Procedures
3. Results and Discussion
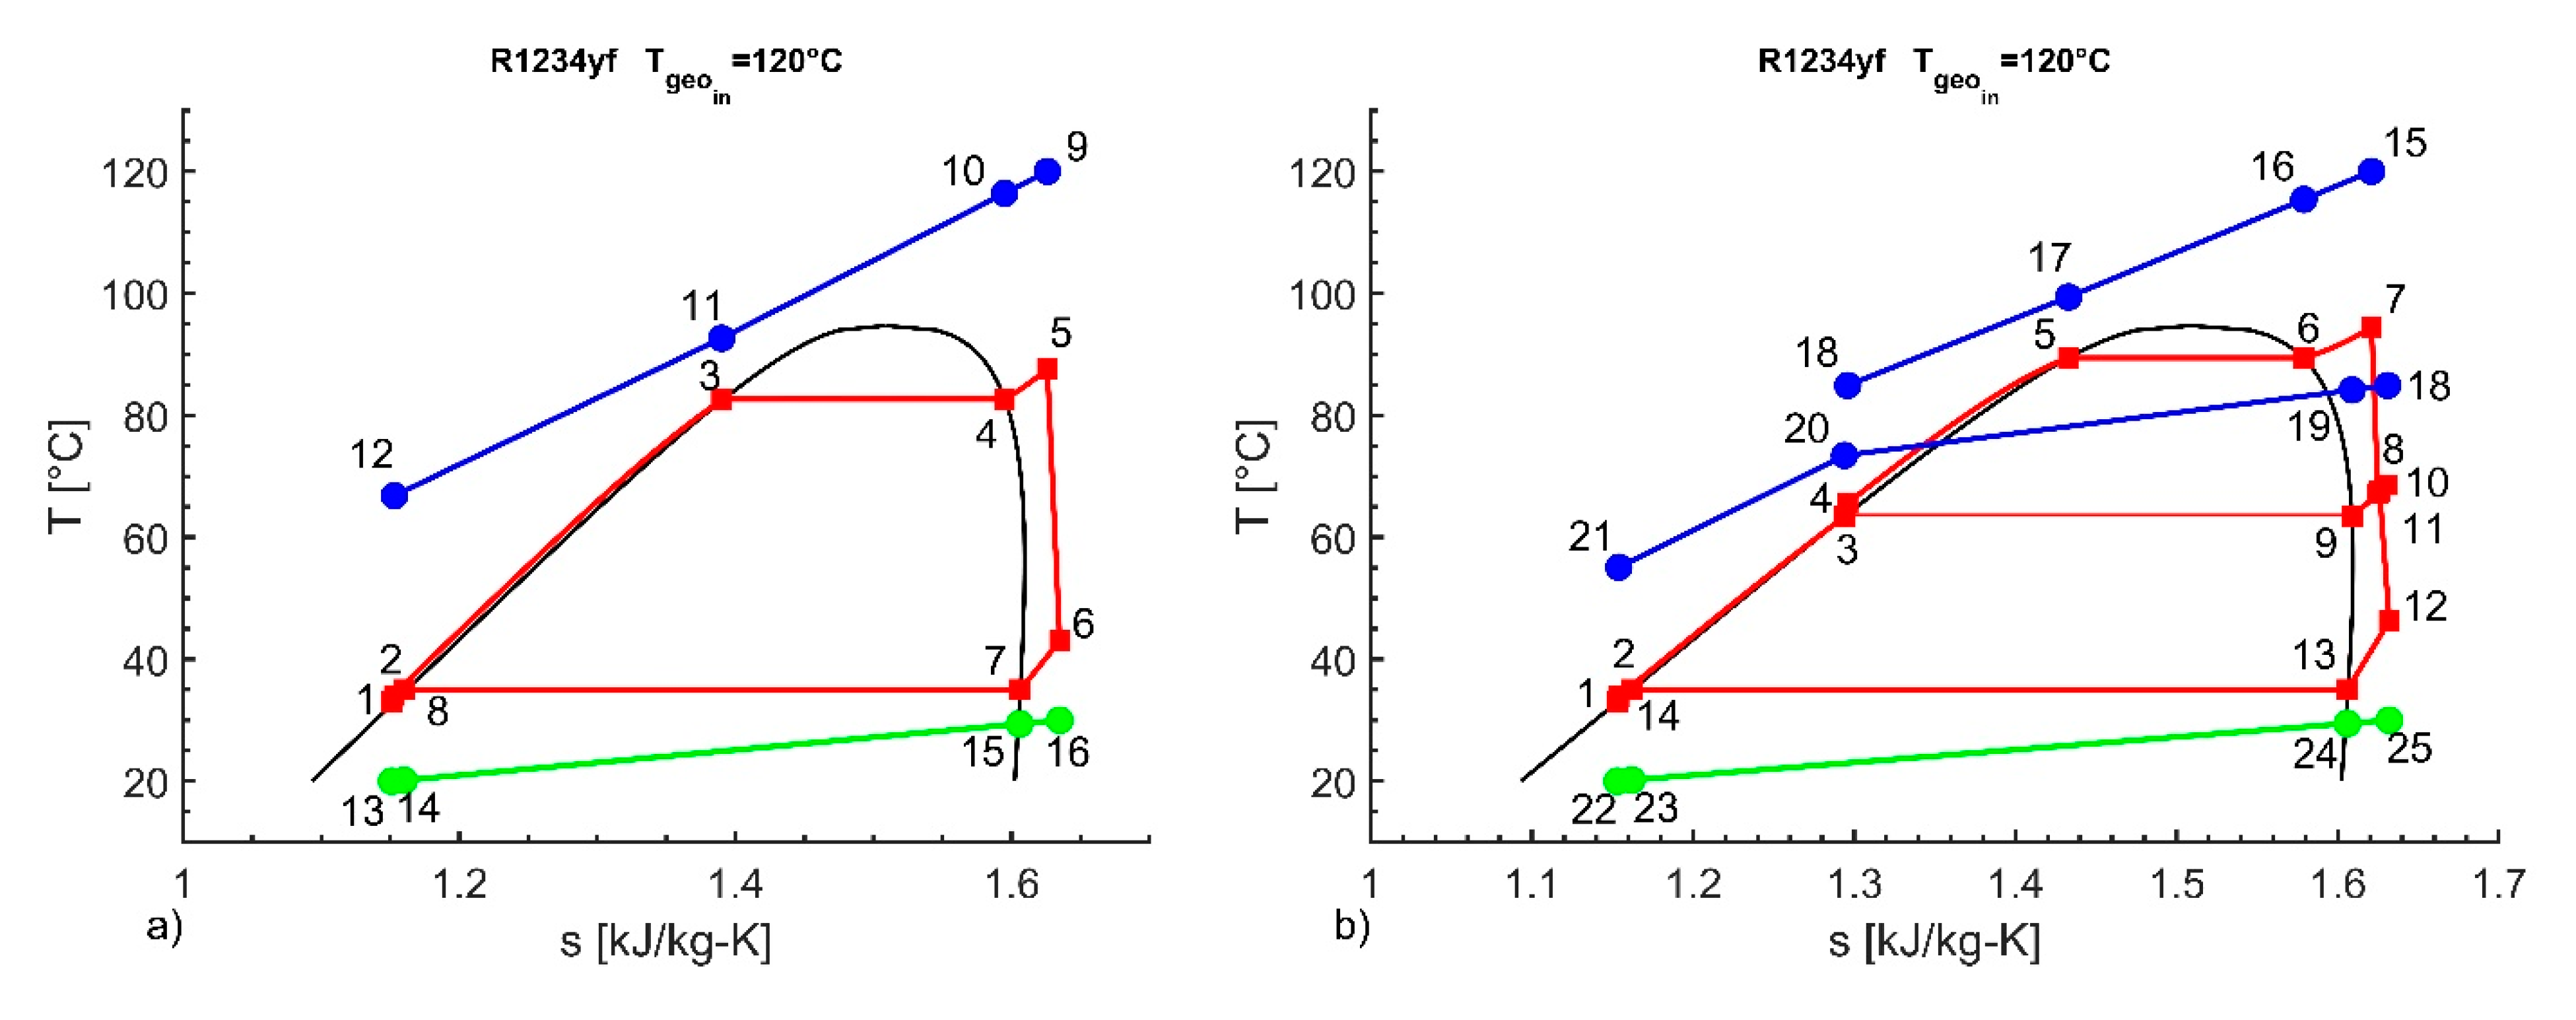
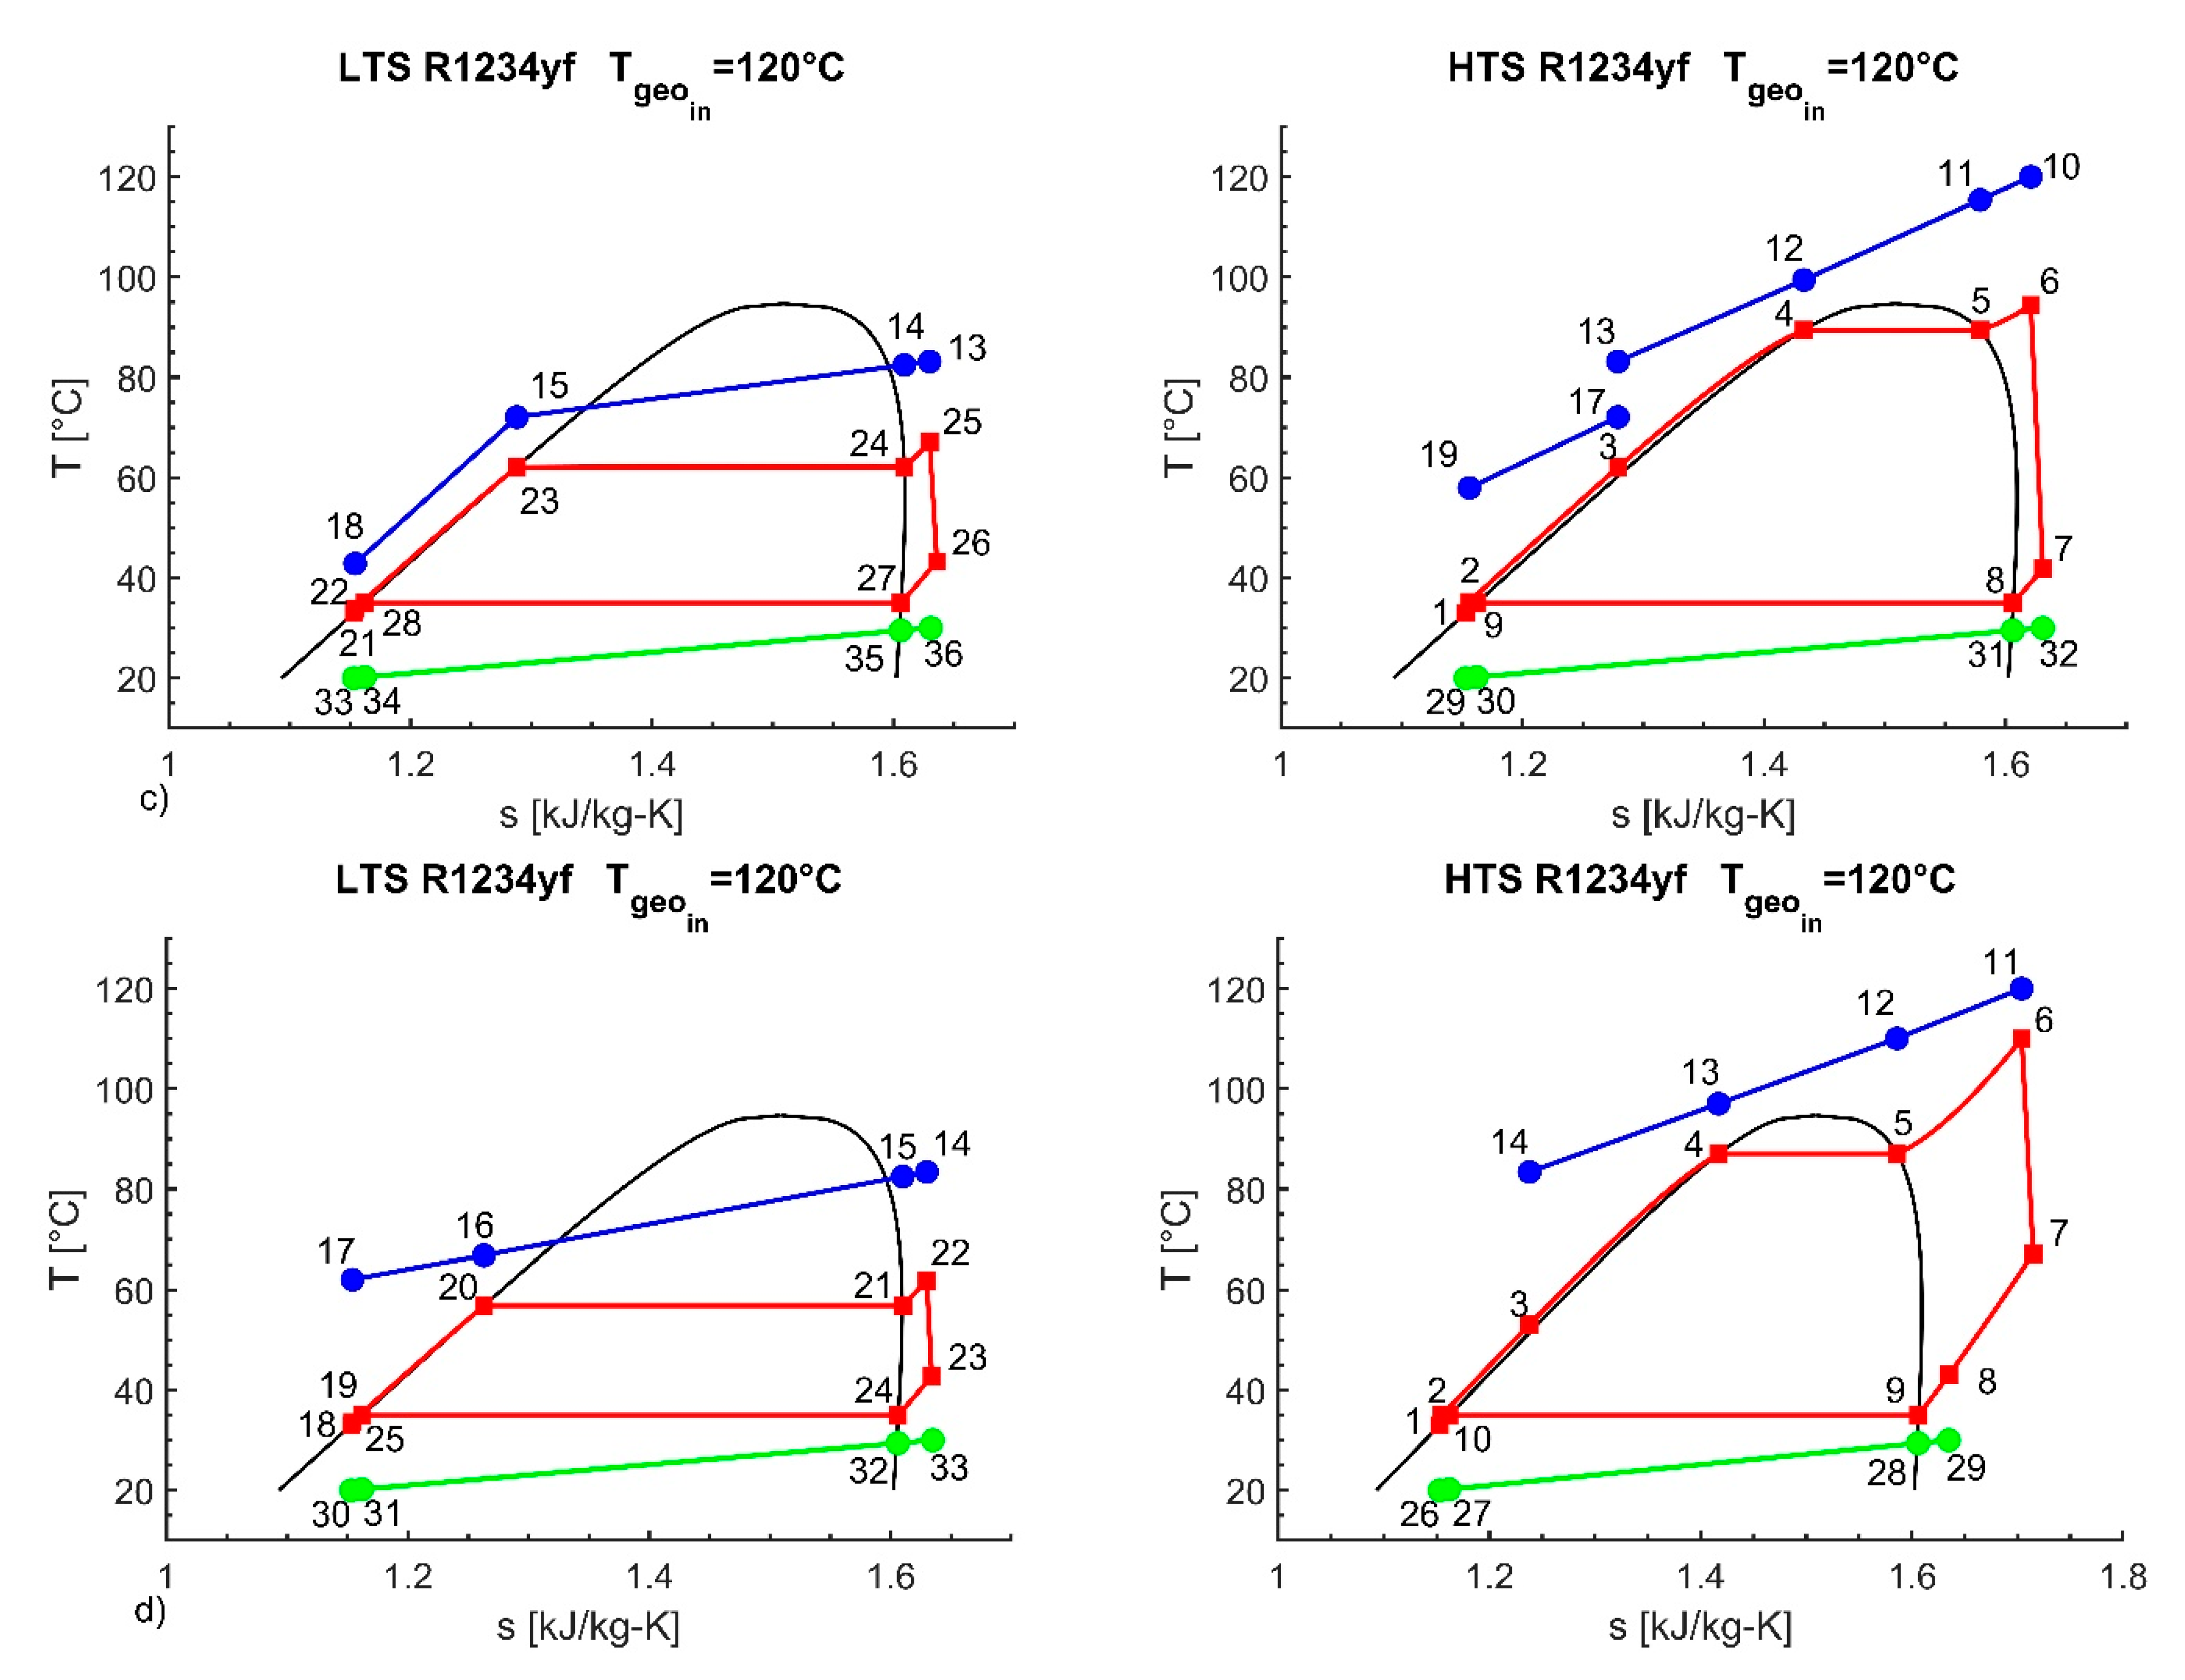
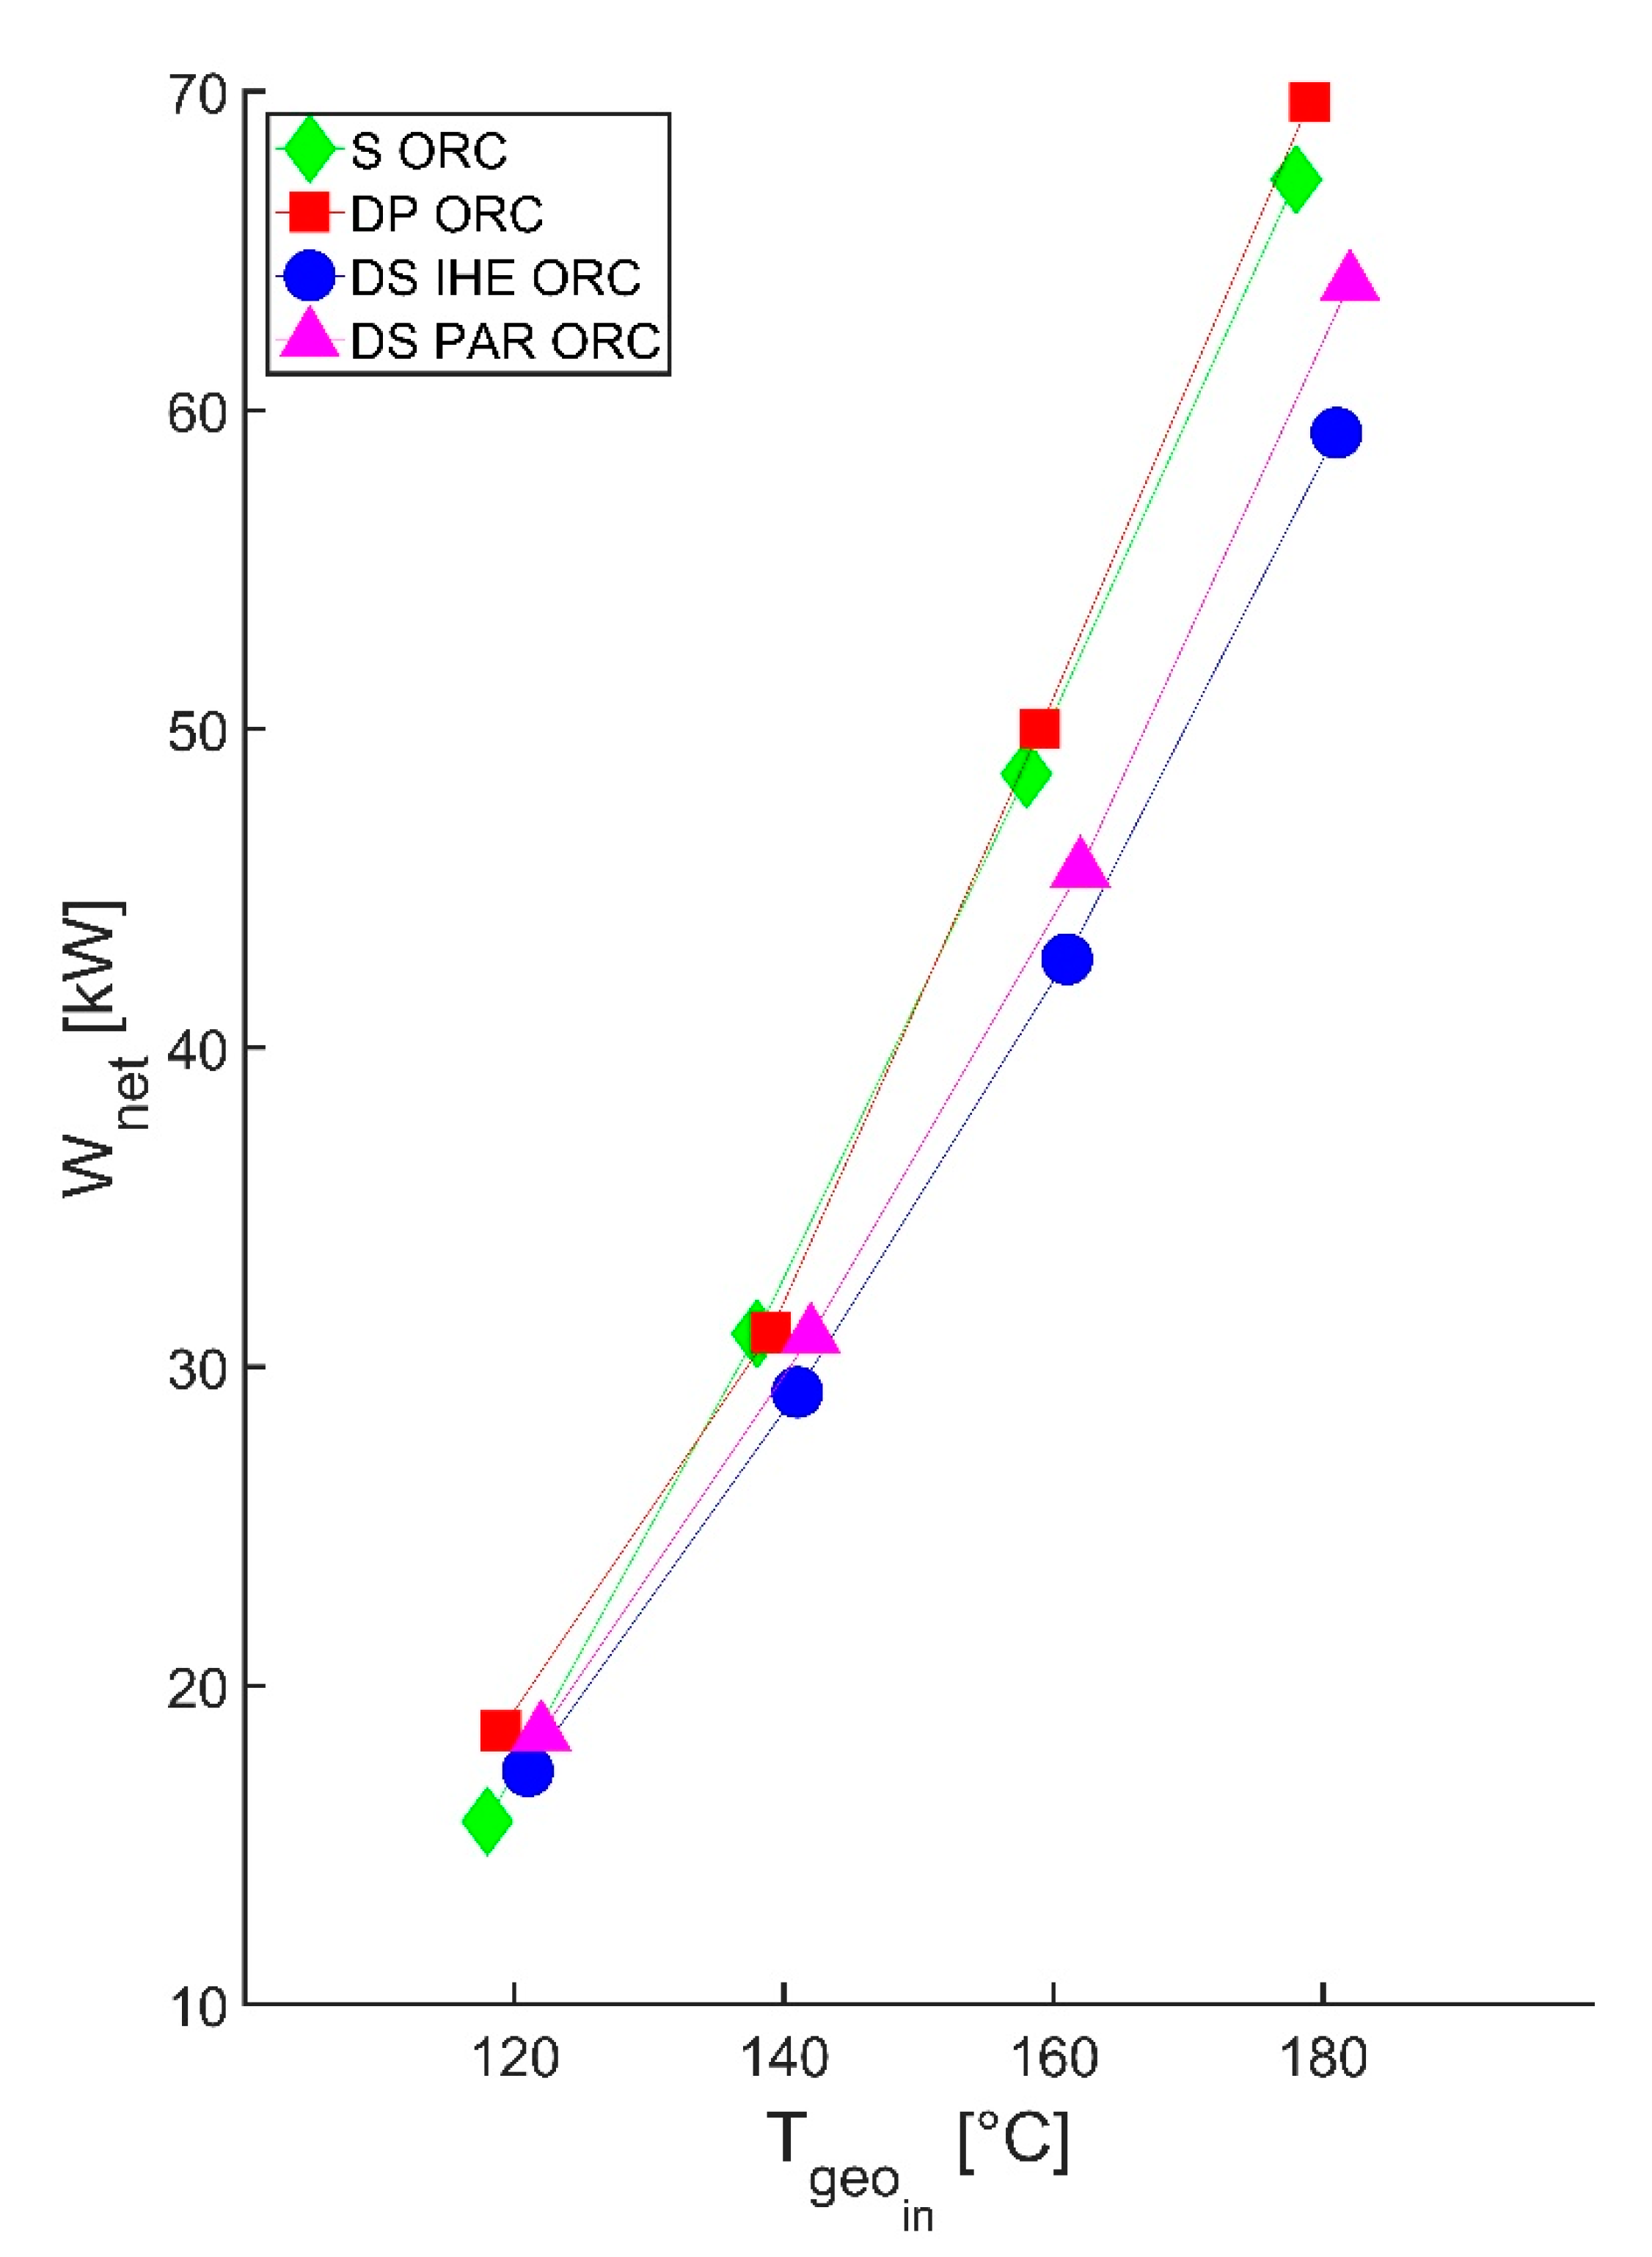
3.1. Thermodynamic Optimization Proposed ORC Configurations
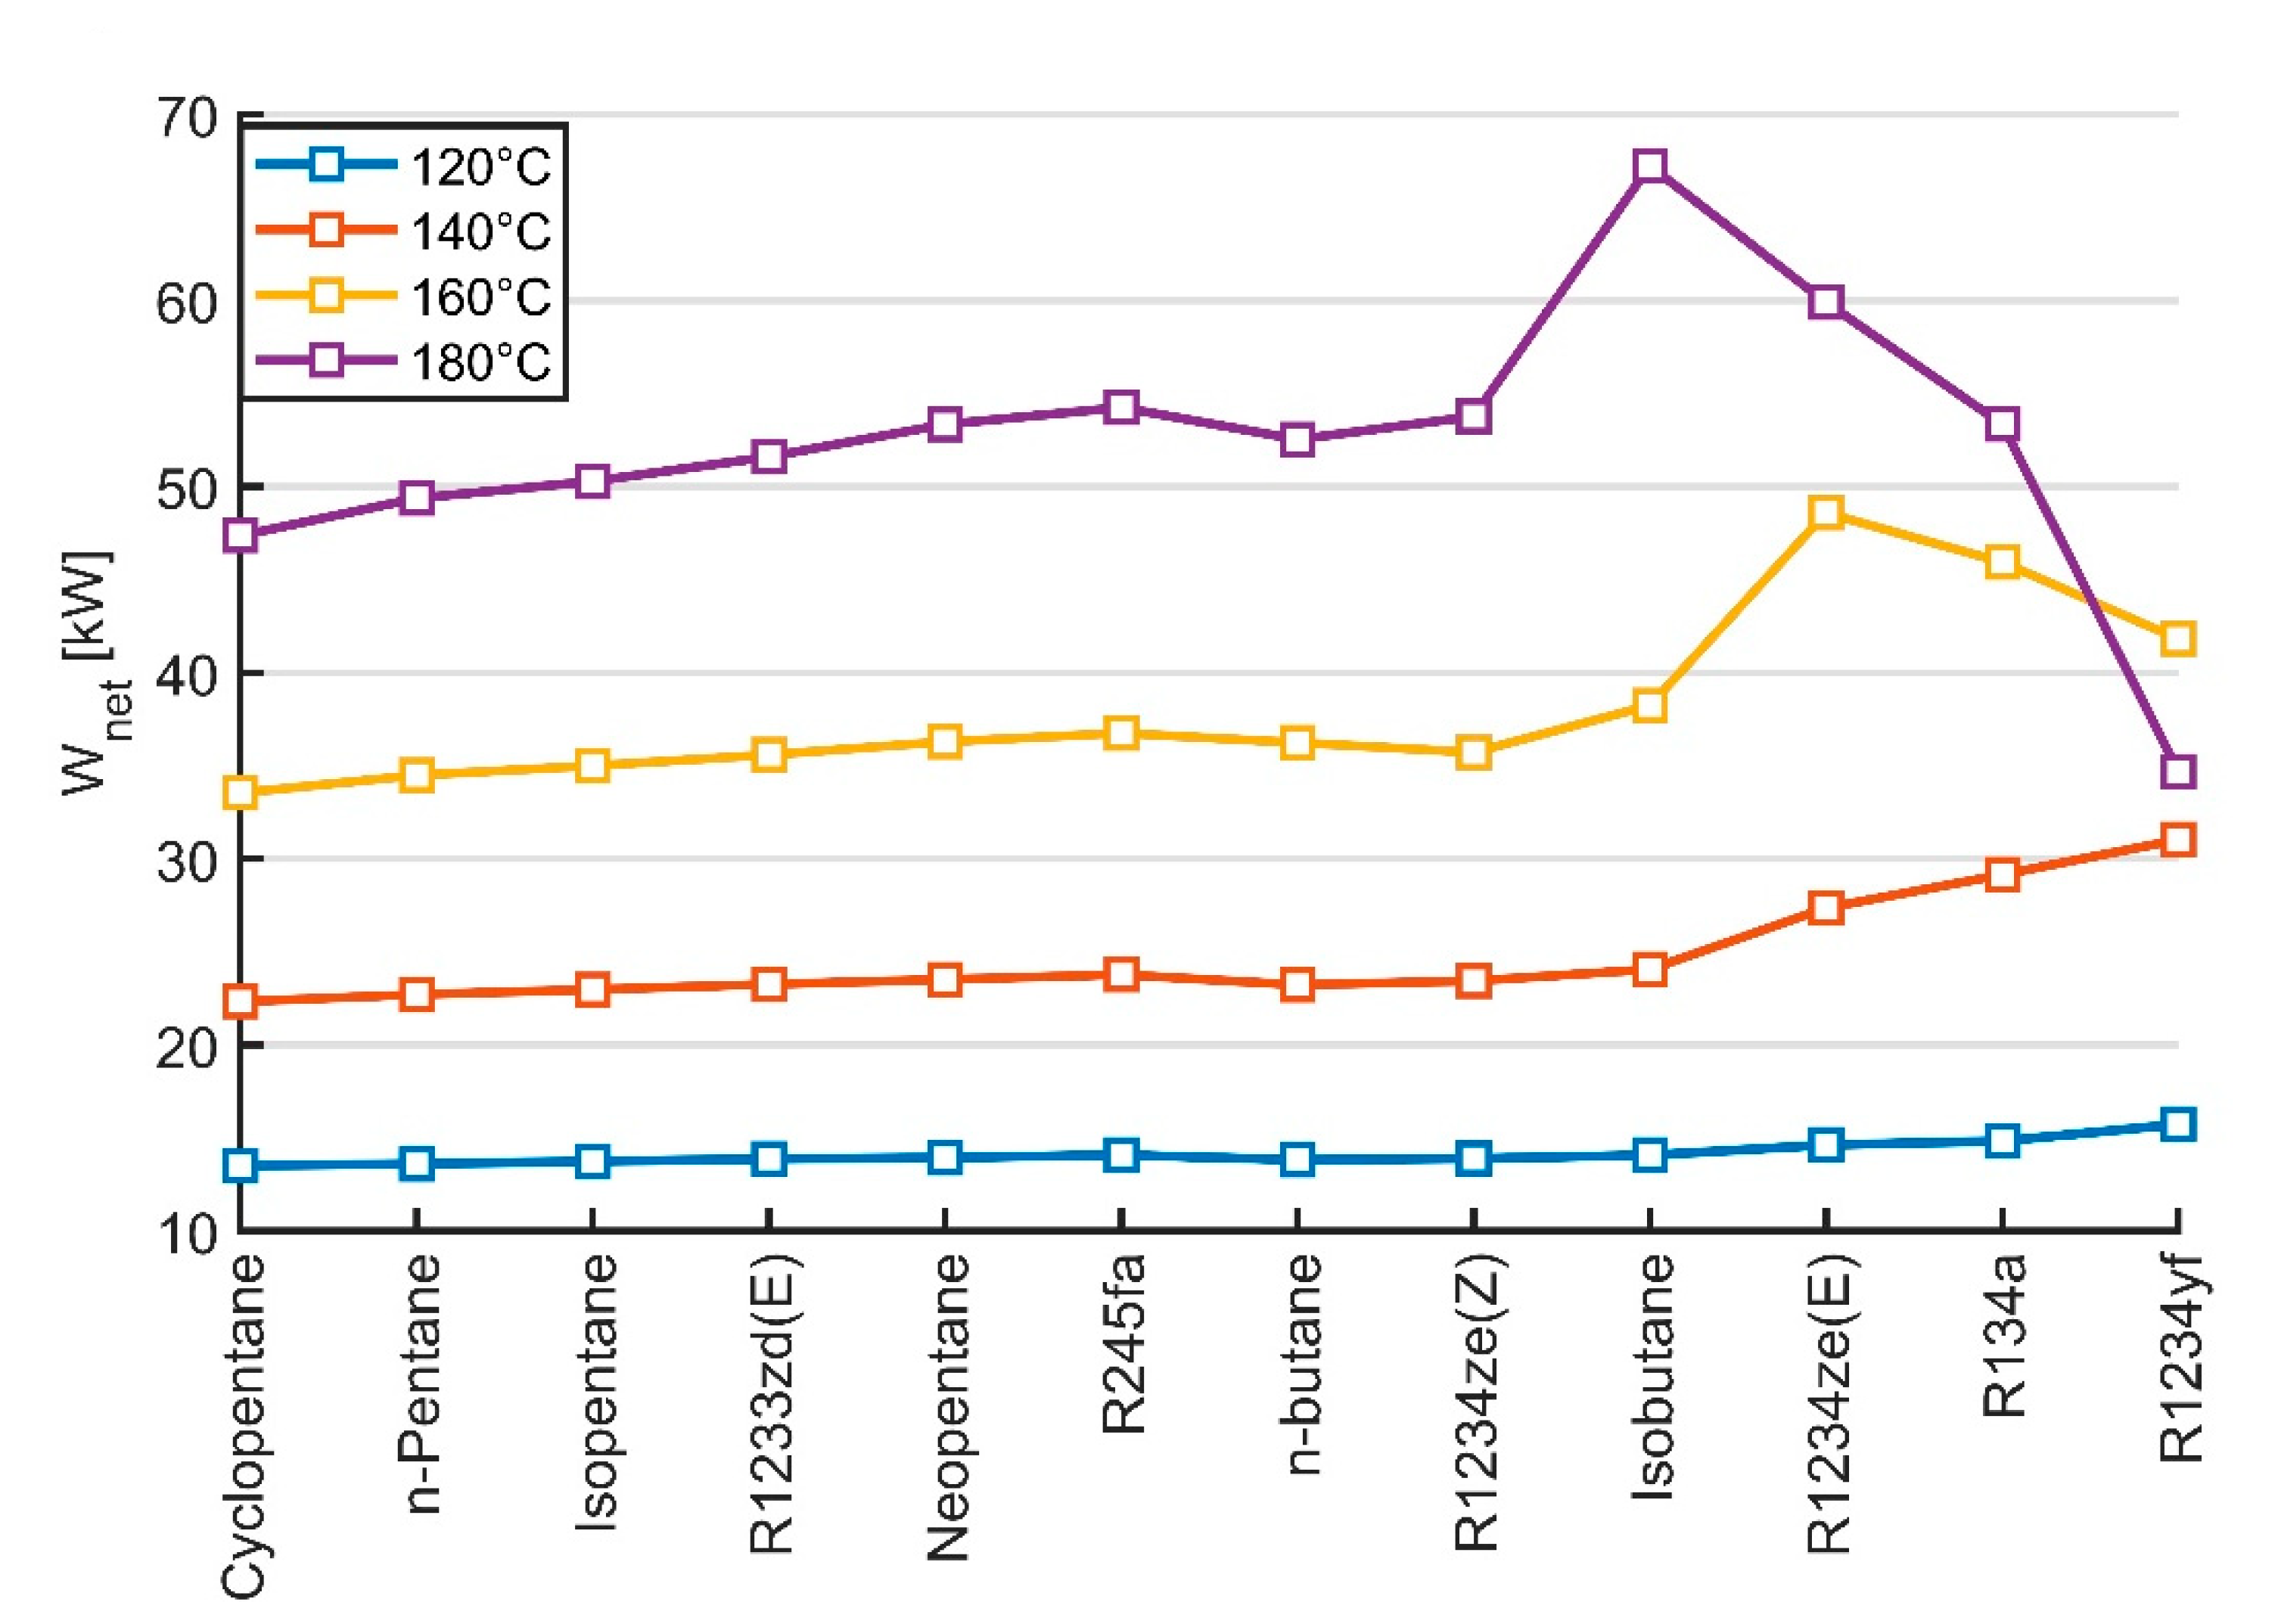
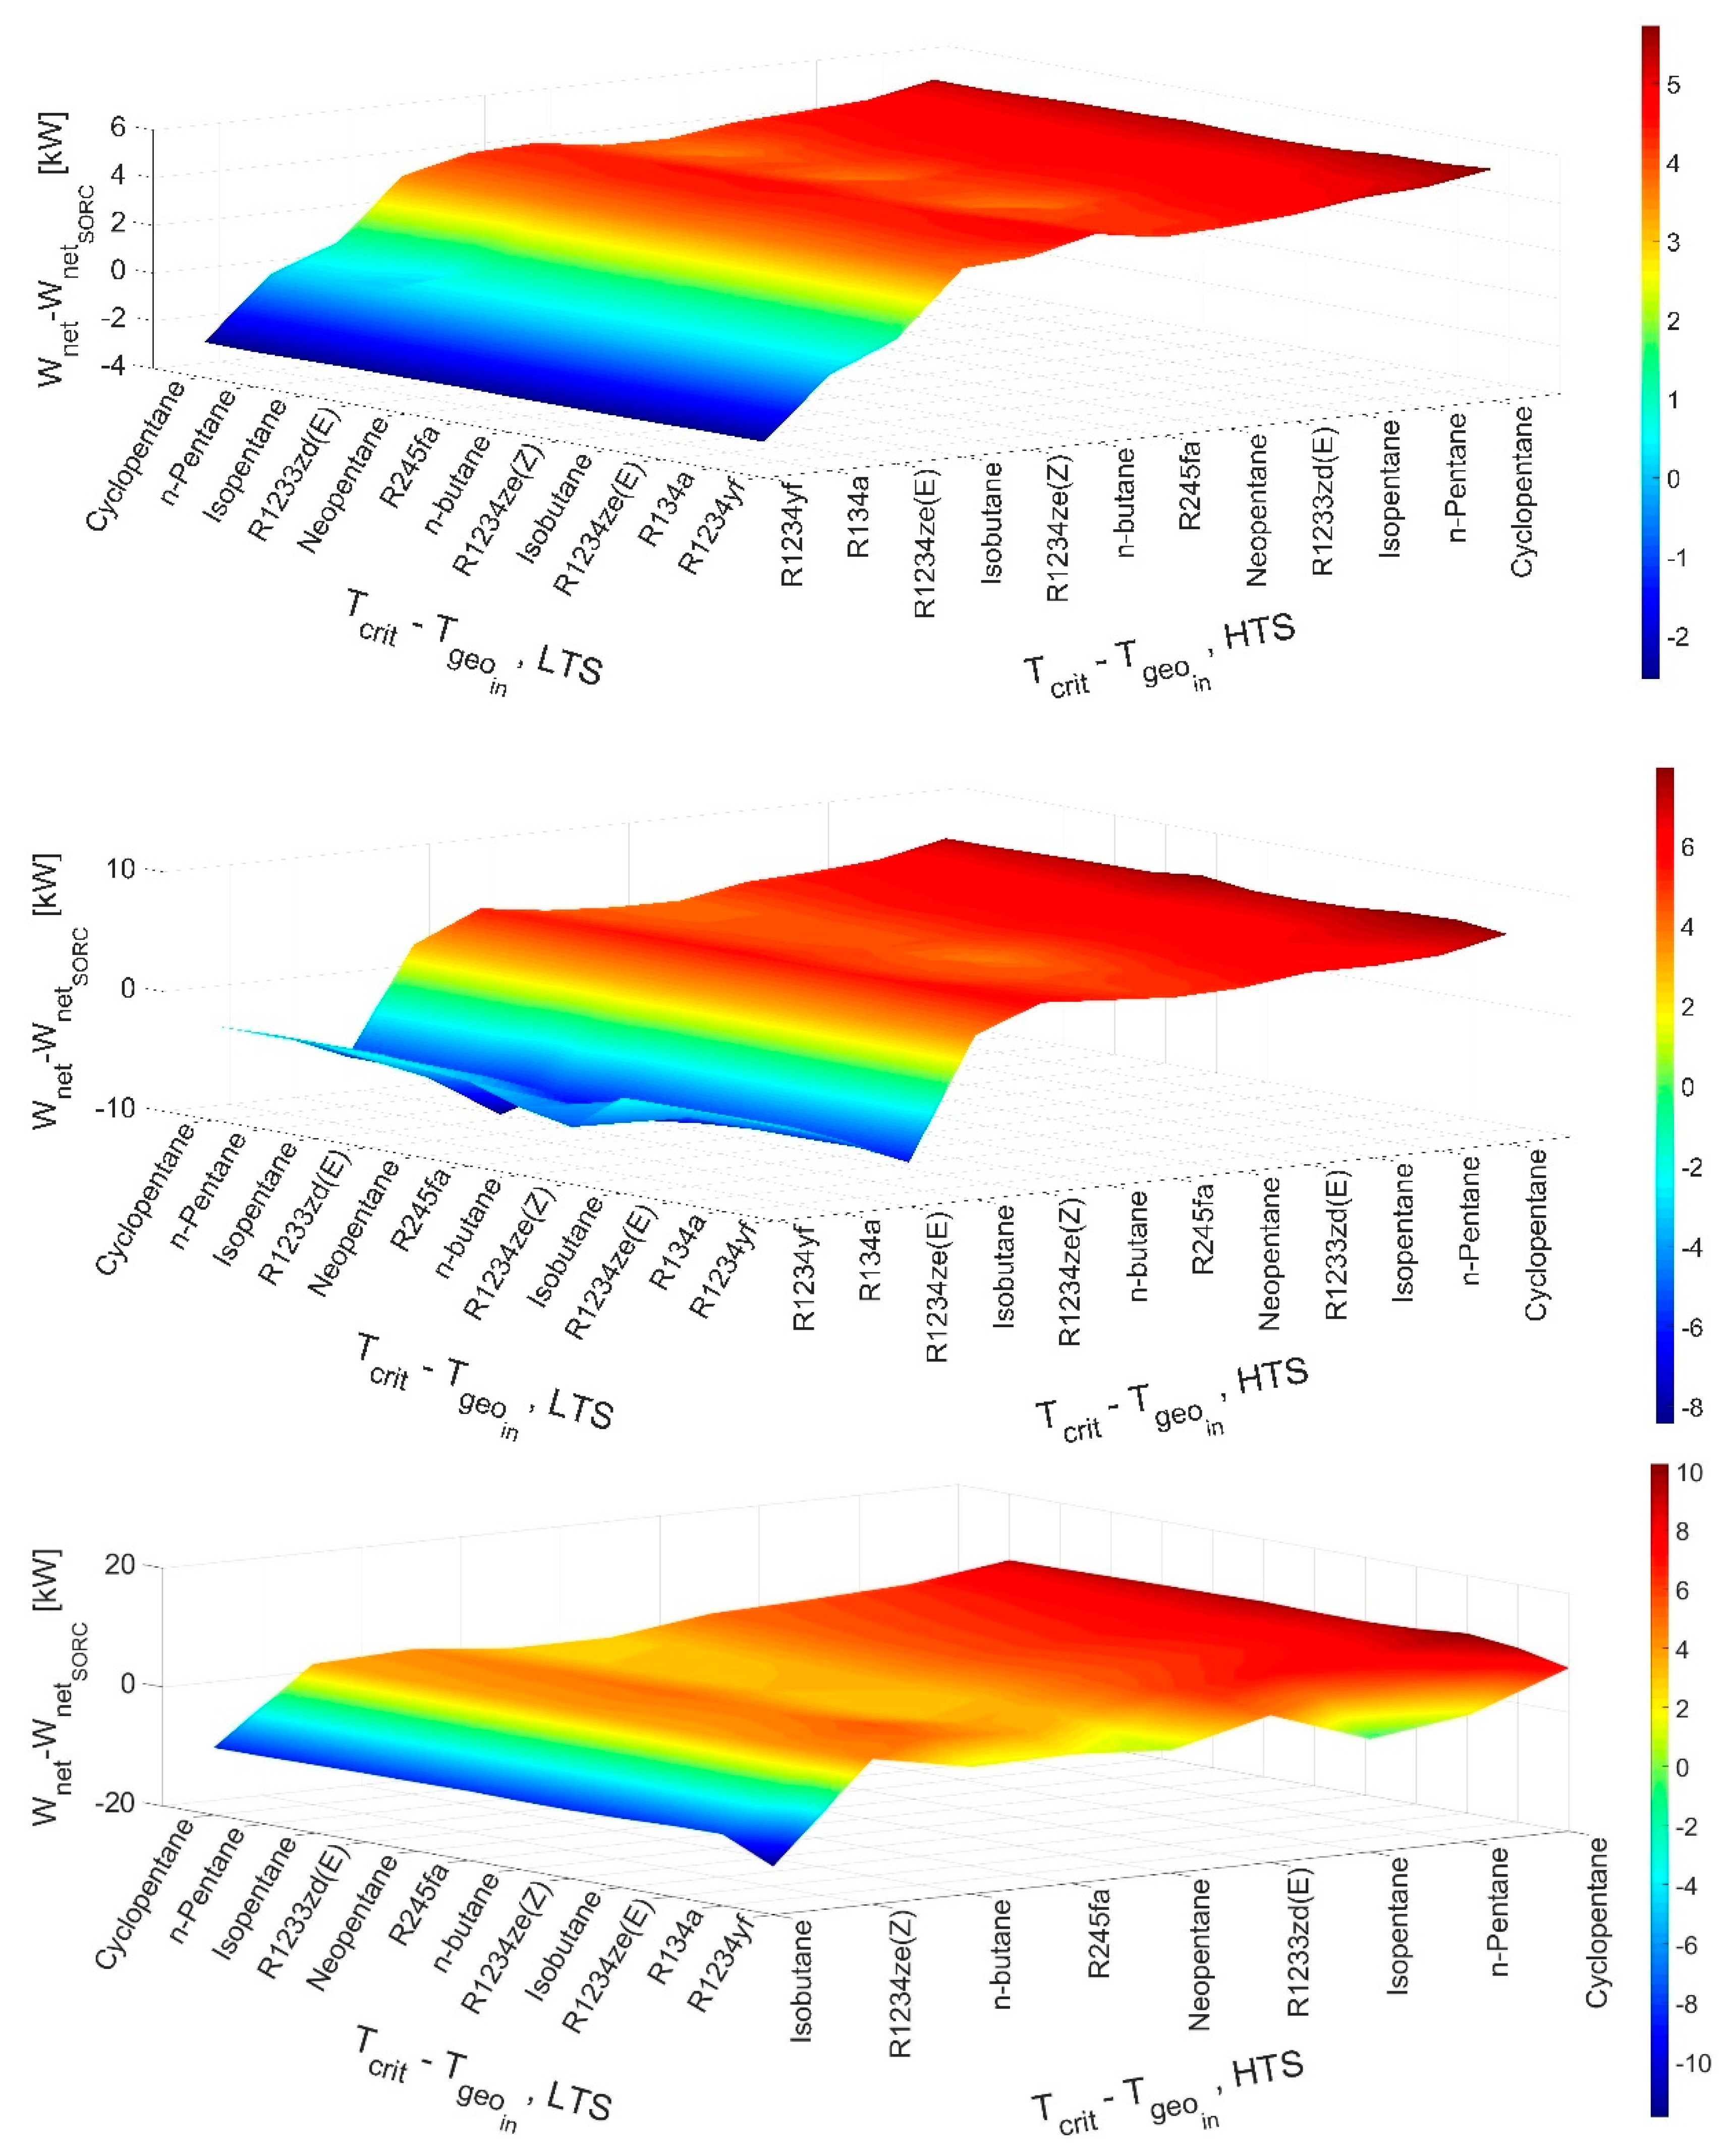
3.2. Analysis of Thermodynamic Optimization Results
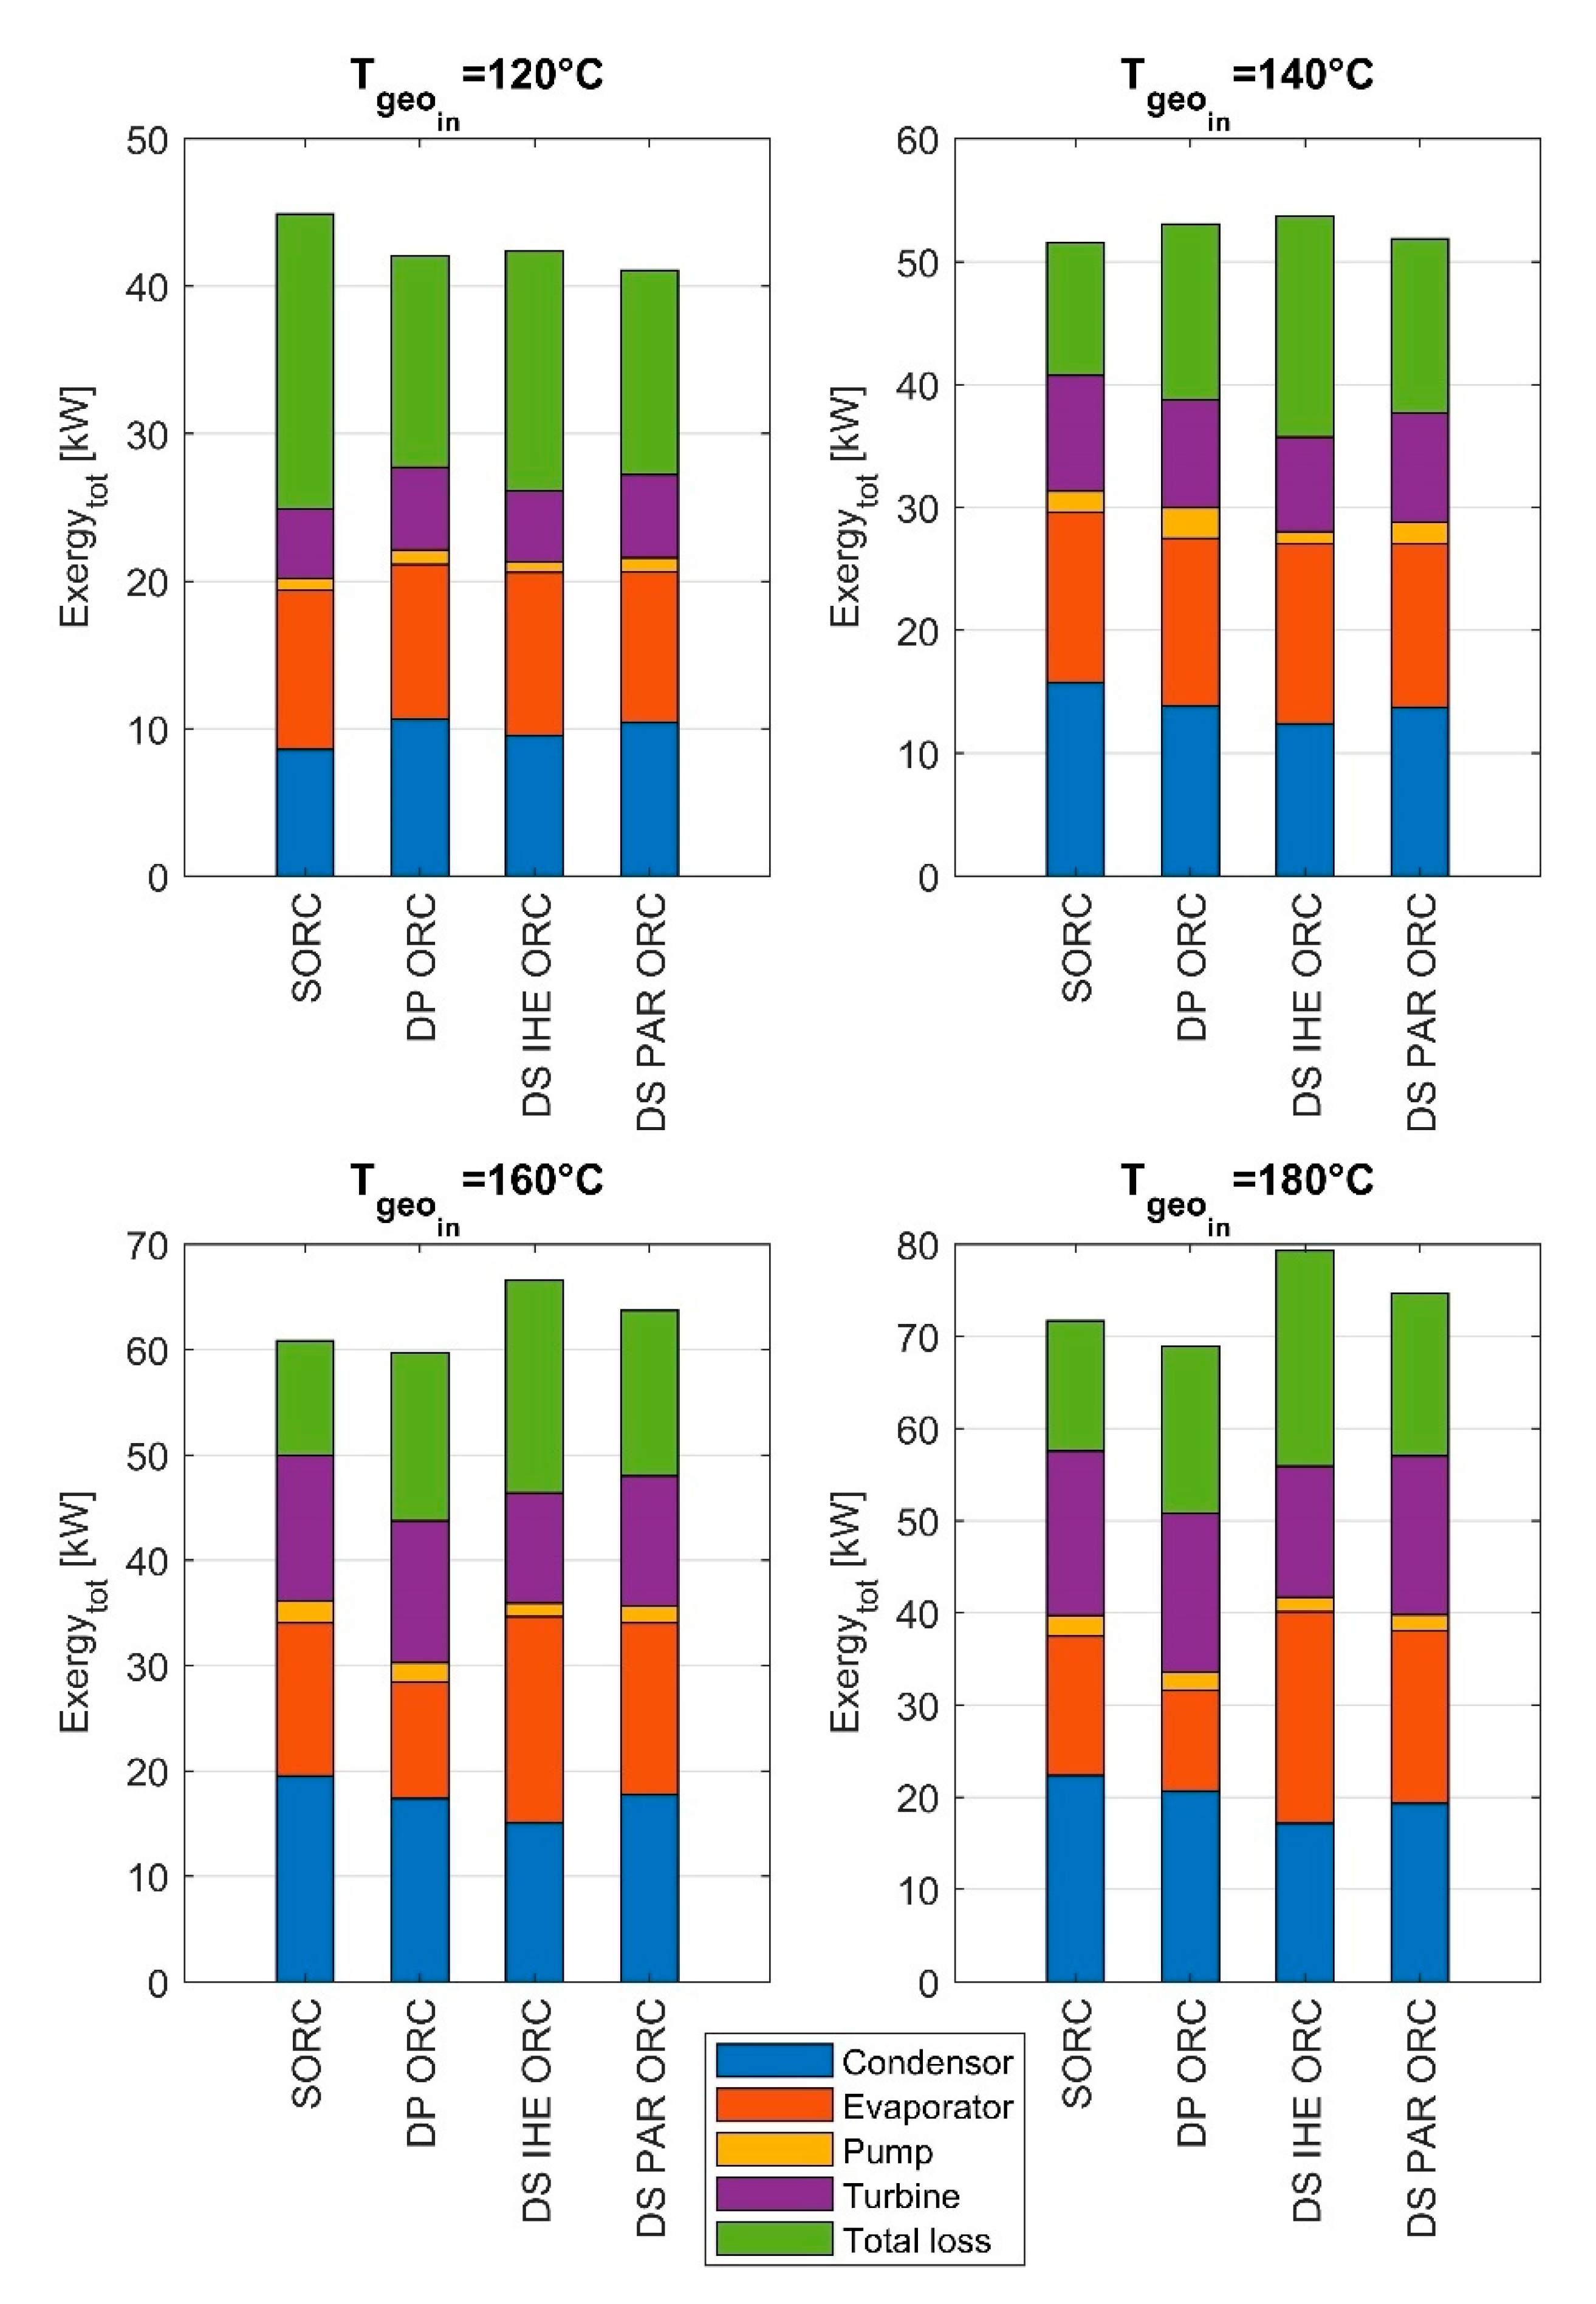
3.3. Conventional Exergy Analysis
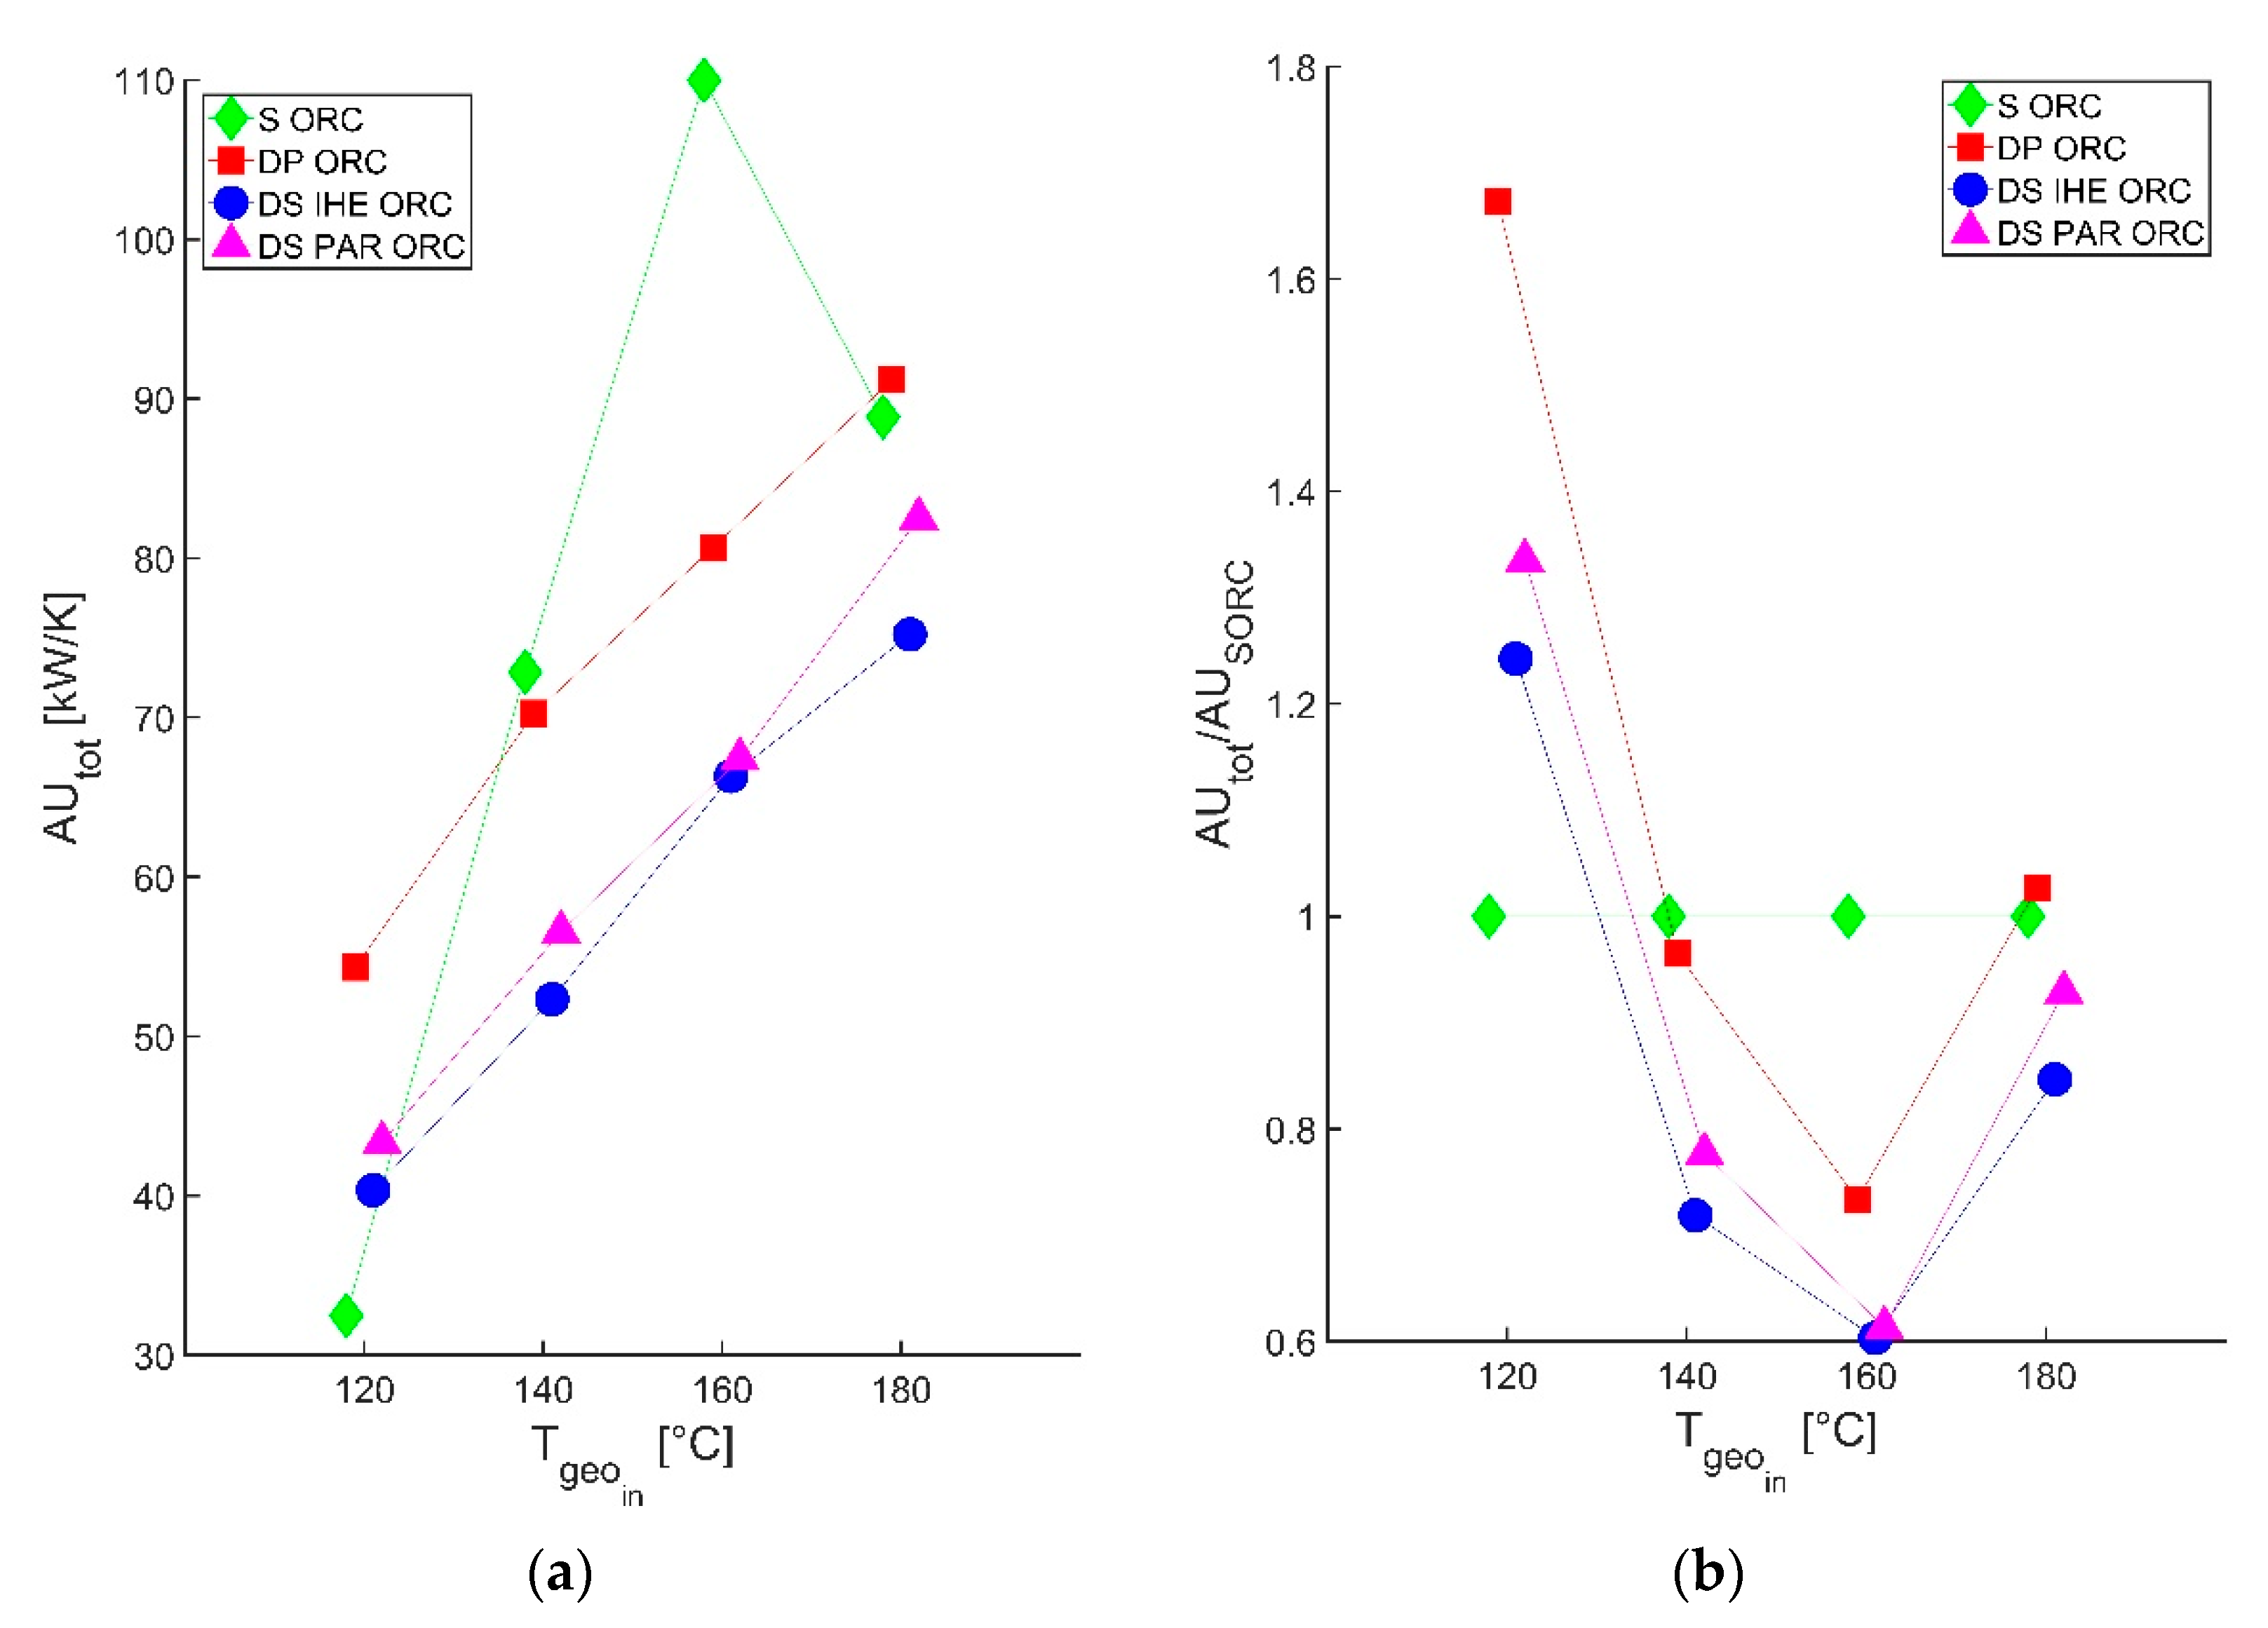
3.4. Indirect Economic Indicators Analysis
4. Conclusions
Author Contributions
Funding
Institutional Review Board Statement
Informed Consent Statement
Data Availability Statement
Conflicts of Interest
Nomenclature
| Specific enthalpy | ||
| Mass flow rate | ||
| Work flow rate power | ] | |
| Heat flow rate | ] | |
| Exergy | ] | |
| Specific entropy | ||
| Temperature | ||
| Thermal conductance | ||
| Specific heat capacity | ||
| Pressure | ||
| Greek symbols | ||
| Thermal efficiency | ||
| Temperature difference | ||
| Work rate difference | ||
Appendix A

| Configuration Component | SORC | DP ORC |
|---|---|---|
| Pump | ||
| Preheater | ||
| Evaporator | ||
| Superheater | ||
| Turbine | ||
| Desuperheater | ||
| Condenser | ||
| Subcooler | ||
| Mixer/Splitter |
| Configuration Component | DS parHTSLTPH ORC | DS HTSIHE ORC |
|---|---|---|
| Pump | ||
| Preheater | ||
| Evaporator | ||
| Superheater | ||
| Turbine | ||
| Desuperheater | ||
| Condenser | ||
| Subcooler | ||
| Mixer/Splitter | ||
| IHE |
| Configuration Component | SORC | DP ORC | ||||
|---|---|---|---|---|---|---|
| Pump | ||||||
| Preheater | ||||||
| Evaporator | ||||||
| Superheater | ||||||
| Turbine | ||||||
| Condenser | ( ) | ( ) | ( ) | ( ) | ||
| Mixer/Splitter | ||||||
| Configuration Component | DS parHTSLTPH ORC | DS HTSIHE ORC | ||||
|---|---|---|---|---|---|---|
| Pump | ||||||
| Preheater | ||||||
| Evaporator | ||||||
| Superheater | ||||||
| Turbine | ||||||
| Condenser | () | () | () | () | ||
| IHE | ||||||
| SORC | 120 °C | 140 °C | 160 °C | 180 °C | |
|---|---|---|---|---|---|
| Cyclopentane | 13.52 | 22.33 | 33.54 | 47.36 | |
| 2.169 | 2.863 | 3.74 | 4.861 | ||
| n-Pentane | 13.61 | 22.71 | 34.49 | 49.37 | |
| 3.24 | 4.247 | 5.552 | 7.282 | ||
| Isopentane | 13.75 | 22.98 | 35 | 50.28 | |
| 4.059 | 5.28 | 6.857 | 8.969 | ||
| R1233zd(E) | 13.88 | 23.26 | 35.59 | 51.6 | |
| 5.858 | 7.669 | 10.09 | 13.59 | ||
| Neopentane | 13.95 | 23.52 | 32.29 | 53.34 | |
| 6.68 | 8.589 | 11.15 | 15.04 | ||
| R245fa | 14.09 | 23.78 | 36.75 | 54.25 | |
| 7.087 | 9.44 | 12.72 | 18.12 | ||
| n-butane | 13.9 | 23.44 | 36.24 | 53.77 | |
| 9.196 | 11.79 | 15.36 | 21.5 | ||
| R1234ze(Z) | 13.83 | 23.23 | 35.72 | 52.53 | |
| 7.678 | 10.04 | 13.35 | 19.03 | ||
| Isobutane | 14.08 | 24.06 | 38.24 | 67.23 | |
| 12.41 | 15.99 | 21.96 | 32.76 | ||
| R1234ze(E) | 14.63 | 27.36 | 48.58 | 59.89 | |
| 19.23 | 32.69 | 32.69 | 32.06 | ||
| R134a | 14.84 | 29.15 | 45.94 | 53.35 | |
| 25.84 | 36.53 | 36.53 | 33.01 | ||
| R1234yf | 15.74 | 31.03 | 41.81 | 34.69 | |
| 27.3 | 30.44 | 30.44 | 20.37 | ||
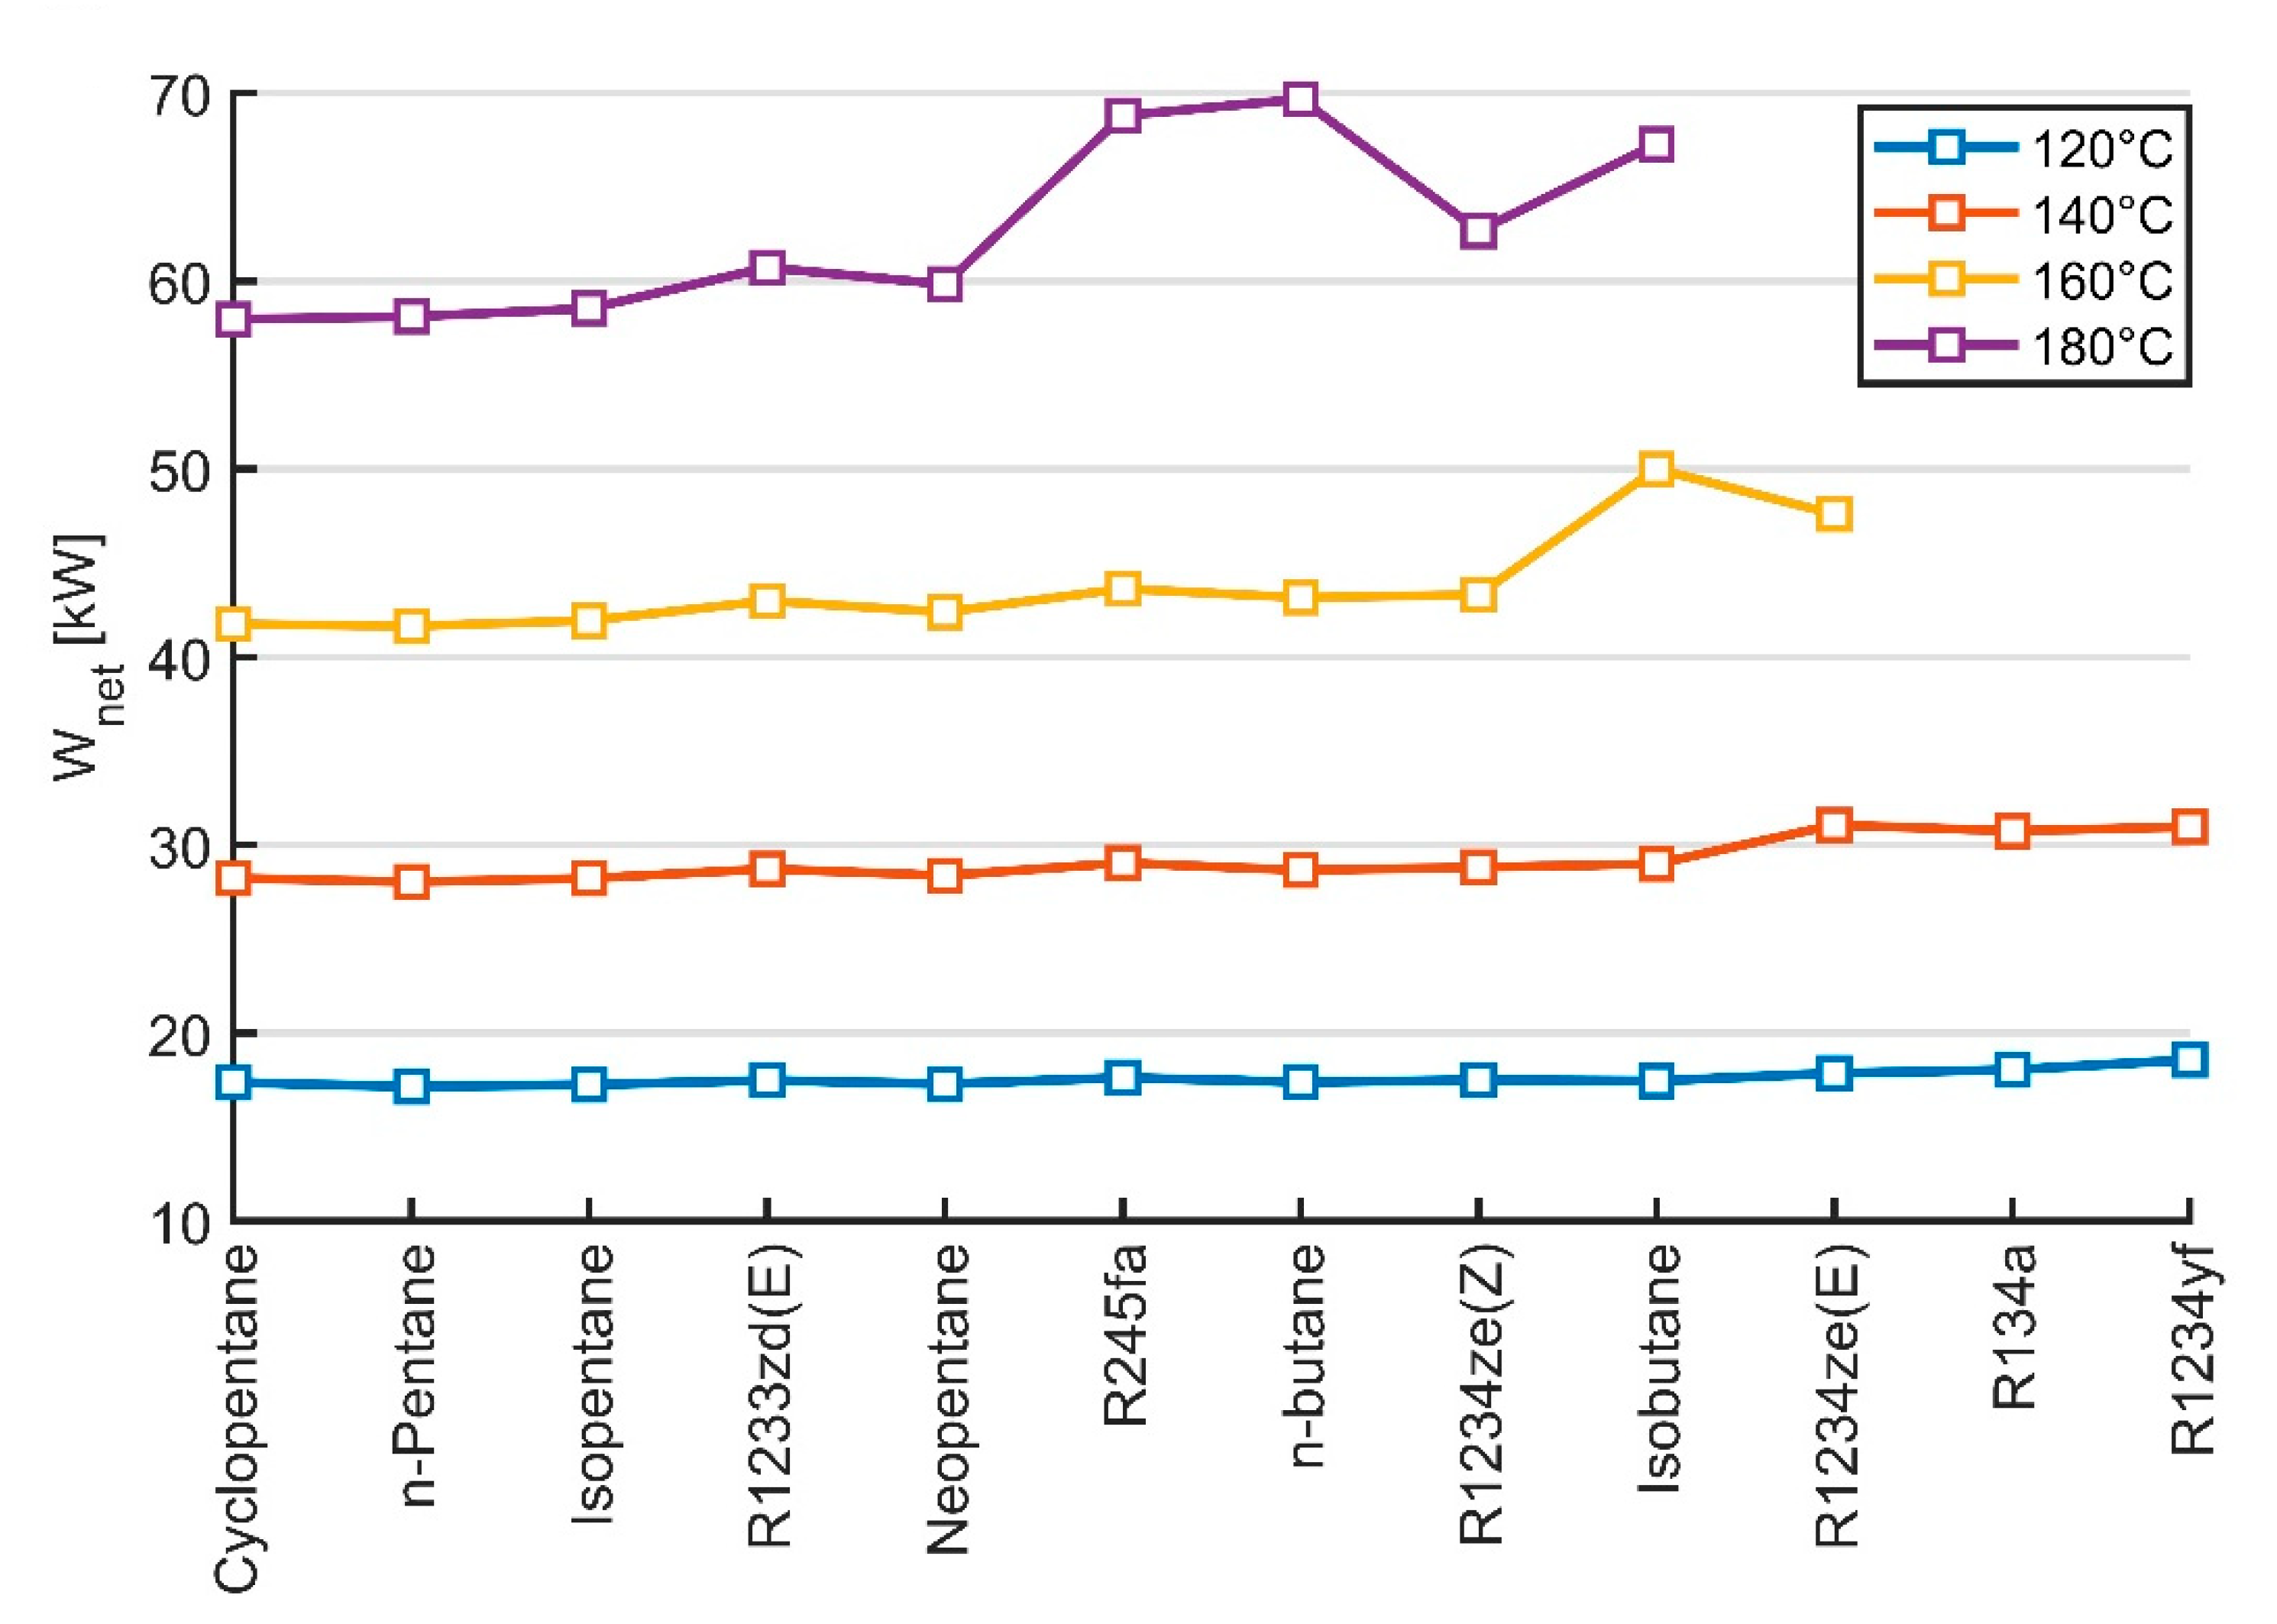
| DP ORC | 120 °C | 140 °C | 160 °C | 180 °C | ||
|---|---|---|---|---|---|---|
| Cyclopentane | 17.38 | 28.24 | 41.75 | 57.96 | ||
| 3.86 | 5.91 | 8.21 | 10.6 | |||
| 2.989 | 4.189 | 5.544 | 7.688 | |||
| 1.549 | 1.87 | 2.244 | 2.727 | |||
| 5.287 | 5.468 | 5.001 | 5 | |||
| 5.492 | 5.993 | 5.093 | 5.151 | |||
| n-Pentane | 17.15 | 28.04 | 41.64 | 58.1 | ||
| 3.54 | 5.33 | 7.15 | 8.73 | |||
| 4.35 | 6.001 | 8.19 | 11 | |||
| 2.234 | 2.846 | 3.42 | 4.107 | |||
| 5 | 5 | 5.17 | 5.017 | |||
| 5.051 | 5.005 | 5.003 | 5.02 | |||
| Isopentane | 17.26 | 28.23 | 41.94 | 58.53 | ||
| 3.51 | 5.25 | 6.94 | 8.25 | |||
| 5.38 | 7.329 | 9.941 | 13.25 | |||
| 2.954 | 3.569 | 4.297 | 5.136 | |||
| 5.009 | 5.007 | 5.002 | 5.001 | |||
| 5.003 | 5.001 | 5.004 | 5.067 | |||
| R1233zd(E) | 17.49 | 28.73 | 42.98 | 60.71 | ||
| 3.61 | 5.47 | 7.39 | 9.11 | |||
| 7.786 | 10.73 | 14.56 | 20.81 | |||
| 4.267 | 5.18 | 6.275 | 7.89 | |||
| 5.013 | 5.019 | 5.012 | 5.004 | |||
| 5.056 | 5.044 | 5.111 | 5.021 | |||
| Neopentane | 17.3 | 28.38 | 42.39 | 59.82 | ||
| 3.35 | 4.86 | 6.1 | 6.48 | |||
| 8.626 | 11.66 | 15.47 | 21.53 | |||
| 5.006 | 6.003 | 7.104 | 8.594 | |||
| 5.001 | 5 | 5.001 | 5.002 | |||
| 5.011 | 5.001 | 5.001 | 5.012 | |||
| R245fa | 17.63 | 29.05 | 43.63 | 68.79 | ||
| 3.54 | 5.27 | 6.88 | 14.54 | |||
| 9.468 | 13.23 | 18.34 | 36.39 | |||
| 5.096 | 6.261 | 7.724 | 7.49 | |||
| 5.004 | 5.002 | 5.008 | 5.021 | |||
| 5.012 | 5 | 5.027 | 5.139 | |||
| DP ORC | 120 °C | 140 °C | 160 °C | 180 °C | ||
| n-butane | 17.4 | 28.66 | 43.16 | 69.67 | ||
| 3.5 | 5.22 | 6.92 | 15.9 | |||
| 11.83 | 15.76 | 22 | 37.96 | |||
| 6.923 | 8.221 | 10 | 10.2 | |||
| 5 | 5.005 | 5 | 5.015 | |||
| 5.001 | 5.001 | 5 | 5.014 | |||
| R1234ze(Z) | 17.5 | 28.82 | 43.31 | 62.67 | ||
| 3.67 | 5.59 | 7.59 | 10.14 | |||
| 10.11 | 13.93 | 19.45 | 31.8 | |||
| 5.606 | 6.784 | 8.42 | 10.64 | |||
| 5.058 | 5.075 | 5.01 | 5.004 | |||
| 5.66 | 5.078 | 5.607 | 5.102 | |||
| Isobutane | 17.46 | 29 | 50 | 67.27 | ||
| 3.38 | 4.94 | 11.84 | 0.04 | |||
| 15.7 | 21.13 | 36.4 | 32.76 | |||
| 9.454 | 11.31 | 11.21 | 6.904 | |||
| 5 | 5.004 | 5.024 | 5.063 | |||
| 5.014 | 5.006 | 6.02 | 9.138 | |||
| R1234ze(E) | 17.87 | 31.07 | 47.6 | |||
| 3.24 | 3.71 | −0.98 | ||||
| 24.40 | 32.67 | 32.69 | ||||
| 14.22 | 15.49 | 9.021 | ||||
| 5.035 | 5.005 | 5.828 | ||||
| 5.003 | 5.229 | 5.927 | ||||
| R134a | 18.05 | 30.75 | ||||
| 3.21 | 1.6 | |||||
| 32.98 | 36.52 | |||||
| 18.9 | 16.51 | |||||
| 5.809 | 5.027 | |||||
| 6 | 7.257 | |||||
| R1234yf | 18.58 | 30.97 | ||||
| 2.84 | −0.06 | |||||
| 30.44 | 30.44 | |||||
| 17 | 9.079 | |||||
| 5 | 5.019 | |||||
| 5 | 6.588 | |||||
| State | Fluid | T (°C) | P (bar) | H (kJ/kg) | S (kj/kgK) | M (kg/s) |
|---|---|---|---|---|---|---|
| 1 | wf HTS | 33 | 8.952 | 244.8 | 1.153 | 1.273 |
| 2 | 35.2 | 30.44 | 247.6 | 1.156 | ||
| 3 | 62.07 | 30.44 | 287.4 | 1.279 | ||
| 4 | 89.41 | 30.44 | 341.1 | 1.433 | ||
| 5 | 89.41 | 30.44 | 394.3 | 1.579 | ||
| 6 | 94.41 | 30.44 | 409.5 | 1.621 | ||
| 7 | 41.81 | 8.952 | 392.1 | 1.631 | ||
| 8 | 35 | 8.952 | 384.6 | 1.606 | ||
| 9 | 35 | 8.952 | 247.6 | 1.162 | ||
| 10 | geofluid | 120 | 10 | 504.4 | 1.527 | 1 |
| 11 | 115.4 | 10 | 485 | 1.478 | ||
| 12 | 99.41 | 10 | 417.3 | 1.3 | ||
| 13 | 83.15 | 10 | 349 | 1.112 | ||
| 14 | 82.46 | 10 | 346.1 | 1.104 | ||
| 15 | 72.07 | 10 | 302.5 | 0.9789 | ||
| 16 | 72.07 | 10 | 302.5 | 0.9789 | ||
| 17 | 72.07 | 10 | 302.5 | 0.9789 | ||
| 18 | 42.86 | 10 | 180.4 | 0.61 | ||
| 19 | 57.95 | 10 | 243.4 | 0.805 | ||
| 20 | 55.8 | 10 | 234.4 | 0.777 | ||
| 21 | wf LTS | 33 | 8.952 | 244.8 | 1.153 | 0.4046 |
| 22 | 33.86 | 17.2 | 245.9 | 1.154 | ||
| 23 | 62.07 | 17.2 | 289 | 1.288 | ||
| 24 | 62.07 | 17.2 | 396.6 | 1.609 | ||
| 25 | 67.07 | 17.2 | 403.7 | 1.63 | ||
| 26 | 43.29 | 8.952 | 393.7 | 1.636 | ||
| 27 | 35 | 8.952 | 384.6 | 1.606 | ||
| 28 | 35 | 8.952 | 247.6 | 1.162 | ||
| 29 | air | 20 | 1 | 293.3 | 6.845 | 18.64 |
| 30 | 20.19 | 1 | 293.5 | 6.846 | ||
| 31 | 29.49 | 1 | 302.9 | 6.878 | ||
| 32 | 30 | 1 | 303.4 | 6.879 | ||
| 33 | 20 | 1 | 293.3 | 6.845 | 5.989 | |
| 34 | 20.19 | 1 | 293.5 | 6.846 | ||
| 35 | 29.39 | 1 | 302.8 | 6.877 | ||
| 36 | 30 | 1 | 303.4 | 6.879 |
| State | Fluid | T (°C) | P (bar) | h (kJ/kg) | s (kj/kgK) | m (kg/s) |
|---|---|---|---|---|---|---|
| 1 | wf HTS | 33 | 8.952 | 244.8 | 1.153 | 0.928 |
| 2 | 35.06 | 29.02 | 247.5 | 1.155 | ||
| 3 | 53.03 | 29.02 | 273.6 | 1.238 | ||
| 4 | 87.01 | 29.02 | 335.2 | 1.417 | ||
| 5 | 87.01 | 29.02 | 396.3 | 1.586 | ||
| 6 | 110 | 29.02 | 439.9 | 1.704 | ||
| 7 | 67.16 | 8.952 | 419.6 | 1.715 | ||
| 8 | 43.06 | 8.952 | 393.5 | 1.635 | ||
| 9 | 35 | 8.952 | 384.6 | 1.606 | ||
| 10 | 35 | 8.952 | 247.6 | 1.162 | ||
| 11 | geofluid | 120 | 10 | 504.4 | 1.527 | 1 |
| 12 | 110.5 | 10 | 464 | 1.423 | ||
| 13 | 97.01 | 10 | 407.3 | 1.273 | ||
| 14 | 83.4 | 10 | 350 | 1.115 | ||
| 15 | 82.49 | 10 | 346.2 | 1.104 | ||
| 16 | 66.81 | 10 | 280.5 | 0.9155 | ||
| 17 | 62.03 | 10 | 260.5 | 0.8562 | ||
| 18 | wf LTS | 33 | 8.952 | 244.8 | 1.153 | 0.5746 |
| 19 | 33.66 | 15.27 | 245.6 | 1.154 | ||
| 20 | 56.81 | 15.27 | 280.5 | 1.263 | ||
| 21 | 56.81 | 15.27 | 394.8 | 1.61 | ||
| 22 | 61.81 | 15.27 | 401.5 | 1.63 | ||
| 23 | 42.85 | 8.952 | 393.2 | 1.634 | ||
| 24 | 35 | 8.952 | 384.6 | 1.606 | ||
| 25 | 35 | 8.952 | 247.6 | 1.162 | ||
| 26 | air | 20 | 1 | 293.3 | 6.845 | 13.71 |
| 27 | 20.19 | 1 | 293.5 | 6.846 | ||
| 28 | 29.4 | 1 | 302.8 | 6.877 | ||
| 29 | 30 | 1 | 303.4 | 6.879 | ||
| 30 | 20 | 1 | 293.3 | 6.845 | 8.478 | |
| 31 | 20.2 | 1 | 293.5 | 6.846 | ||
| 32 | 29.42 | 1 | 302.8 | 6.877 | ||
| 33 | 30 | 1 | 303.4 | 6.879 |
References
- Loni, R.; Mahian, O.; Najafi, G.; Sahin, A.Z.; Rajaee, F.; Kasaeian, A.; Mehrpooya, M.; Bellos, E.; le Roux, W.G. A critical review of power generation using geothermal-driven organic Rankine cycle. Therm. Sci. Eng. Prog. 2021, 25, 101028. [Google Scholar] [CrossRef]
- Astolfi, M.; Romano, M.C.; Bombarda, P.; Macchi, E. Binary ORC (Organic Rankine Cycles) power plants for the exploitation of medium-low temperature geothermal sources—Part A: Thermodynamic optimization. Energy 2014, 66, 423–434. [Google Scholar] [CrossRef]
- Liu, Q.; Duan, Y.; Yang, Z. Performance analyses of geothermal organic Rankine cycles with selected hydrocarbon working fluids. Energy 2013, 63, 123–132. [Google Scholar] [CrossRef]
- Jouhara, H.; Khordehgah, N.; Almahmoud, S.; Delpech, B.; Chauhan, A.; Tassou, S.A. Waste heat recovery technologies and applications Therm. Sci. Eng. Prog. 2018, 6, 268–289. [Google Scholar]
- Moya, D.; Aldás, C.; Kaparaju, P. Geothermal energy: Power plant technology and direct heat applications Renew. Sustain. Energy Rev. 2018, 94, 889–901. [Google Scholar] [CrossRef]
- DiPippo, R. Chapter 8. Binary Cycle Power Plant. In Geothermal Power Plant Principles, Applications, Case Studies and Environmental Impact; Elsevier Ltd.: Amsterdam, The Netherlands, 2015; pp. 193–239. [Google Scholar]
- Nemati, A.; Nami, H.; Ranjbar, F.; Yari, M. Case Studies in Thermal Engineering A comparative thermodynamic analysis of ORC and Kalina cycles for waste heat recovery: A case study for CGAM cogeneration system. Case Stud. Therm. Eng. 2017, 9, 1–13. [Google Scholar] [CrossRef]
- Lecompte, S.; Huisseune, H.; van den Broek, M.; Vanslambrouck, B.; De Paepe, M. Review of organic Rankine cycle (ORC) architectures for waste heat recovery. Renew. Sustain. Energy Rev. 2015, 47, 448–461. [Google Scholar] [CrossRef]
- Stijepovic, M.Z.; Papadopoulos, A.I.; Linke, P.; Grujic, A.S.; Seferlis, P. An exergy composite curves approach for the design of optimum multi-pressure organic Rankine cycle processes. Energy 2014, 69, 285–298. [Google Scholar] [CrossRef]
- Li, T.; Zhang, Z.; Lu, J.; Yang, J.; Hu, Y. Two-Stage Evaporation Strategy to Improve System Performance for Organic Rankine Cycle. Appl. Energy 2015, 150, 323–334. [Google Scholar] [CrossRef]
- Li, J.; Ge, Z.; Liu, Q.; Duan, Y.Y.; Yang, Z. Thermo-economic performance analyses and comparison of two turbine layouts for organic Rankine cycles with dual-pressure evaporation. Energy Convers. Manag. 2018, 164, 603–614. [Google Scholar] [CrossRef]
- Guzovic, Z.; Raskovic, P.; Blataric, Z. The comparision of a basic and a dual-pressure ORC (Organic Rankine Cycle): Geothermal Power Plant Velika Ciglena case study. Energy 2014, 76, 175–186. [Google Scholar] [CrossRef]
- Manante, G.; Lazzaretto, A.; Bonamico, E. Design guidelines for the choice between single and dual pressure layouts in organic Rankine cycle (ORC) systems. Energy 2017, 123, 413–431. [Google Scholar] [CrossRef]
- Li, X.; Liu, T.; Chen, L. Thermodynamic Performance Analysis of an Improved Two-Stage Organic Rankine Cycle. Energies 2018, 11, 2864. [Google Scholar] [CrossRef]
- Ayachi, F.; Ksayer, E.B.; Zoughaib, A.; Neveu, P. ORC optimization for medium grade heat recovery. Energy 2014, 68, 47–56. [Google Scholar] [CrossRef]
- Braimakis, K.; Karellas, S. Exergetic optimization of double stage Organic Rankine Cycle. Energy 2018, 149, 296–313. [Google Scholar] [CrossRef]
- Kanoglu, M. Exergy analysis of a dual-level binary geothermal power plant. Geothermics 2002, 31, 709–724. [Google Scholar] [CrossRef]
- Heberle, F.; Jahrfeld, T.; Brüggemann, D. Thermodynamic Analysis of Double-Stage Organic Rankine Cycles for Low-Enthalpy Sources Based on a Case Study for 5.5 MWe Power Plant Kirchstockach (Germany). In Proceedings of the World Geothermal Congress 2015, Melbourne, Australia, 19–25 April 2015. [Google Scholar]
- Liu, G.; Wang, Q.; Xu, J.; Miao, Z. Exergy Analysis of Two-Stage Organic Rankine Cycle Power Generation System. Entropy 2021, 23, 43. [Google Scholar] [CrossRef]
- Ge, Z.; Li, J.; Duan, Y.; Yang, Z.; Xie, Z. Thermodynamic Performance Analyses and Optimization of Dual-Loop Organic Rankine Cycles for Internal Combustion Engine Waste Heat Recovery. Appl. Sci. 2019, 9, 680. [Google Scholar] [CrossRef]
- Song, J.; Gu, C. Parametric analysis of a dual loop Organic Rankine Cycle (ORC) system for engine waste heat recovery. Energy Convers. Manag. 2015, 105, 995–1005. [Google Scholar] [CrossRef]
- Nami, H.; Nemati, A.; Fard, F.J. Conventional and advanced exergy analyses of a geothermal driven dual fluid organic Rankine cycle (ORC). Appl. Therm. Eng. 2017, 122, 59–70. [Google Scholar] [CrossRef]
- Klein, S.A. EES, Engineering Equation Solver; Versio: Madison, WI, USA, 2004. [Google Scholar]
- Chen, H.; Goswami, D.Y.; Stefanakos, E.K. A review of thermodynamic cycles and working fluids for the conversion of low-grade heat. Renew. Sustain. Energy Rev. 2010, 14, 3059–3067. [Google Scholar] [CrossRef]
- Hu, K.; Zhu, J.; Zhang, W.; Liu, K.; Lu, X. Effects of evaporator superheat on system operation stability of an organic Rankine cycle. Appl. Therm. Eng. 2017, 111, 793–801. [Google Scholar] [CrossRef]
- Seider, W.D.; Seader, J.D.; Lewin, D.R. Product & Process Design Principles: Synthesis, Analysis and Evaluation; John Wiley & Sons: Hoboken, NJ, USA, 2009. [Google Scholar]
- Groniewsky, A.; Györke, G.; Imre, A.R. Description of wet-to-dry transition in model ORC working fluids. Appl. Therm. Eng. 2017, 125, 963–971. [Google Scholar] [CrossRef]
- Montreal Protocol on Substances that Deplete the Ozone Layer; US Government Printing Office: Washington, DC, USA, 1987; pp. 128–136.
- Yang, J.; Gao, L.; Ye, Z.; Hwang, Y.; Chen, J. Binary-objective optimization of latest low-GWP alternatives to R245fa for organic Rankine cycle application. Energy 2021, 217, 119336. [Google Scholar] [CrossRef]
- Liu, W.; Meinel, D.; Wieland, C.; Spliethoff, H. Investigation of hydro fluoroolefins as potential working fluids in organic Rankine cycle for geothermal power generation. Energy 2014, 67, 106–116. [Google Scholar] [CrossRef]
- Eyerer, S.; Dawo, F.; Kaind, J.; Wieland, l.; Spliethoff, H. Experimental investigation of modern ORC working fluids R1224yd(Z) and R1233zd(E) as replacements for R245fa. Appl. Energy 2019, 240, 946–963. [Google Scholar] [CrossRef]
- Bahrami, M.; Pourfayaz, F.; Kasaeian, A. Low global warming potential (GWP) working fluids (WFs) for Organic Rankine Cycle (ORC) applications. Energy Rep. 2022, 8, 2976–2988. [Google Scholar] [CrossRef]
- Noriega Sanchez, C.J.; Gosselin, L.; da Silva, A.K. Designed binary mixtures for subcritical organic Rankine cycles based onmultiobjective optimization. Energy Convers. Manag. 2018, 156, 585–596. [Google Scholar] [CrossRef]


| Advanced two-stage evaporation ORC configurations | DP | Serial Pump Arrangements and Serial or Induction Turbine Arrangement | 1×WF | ||||
| DS | serial | DS HTSIHE ORC | DS LTSIHE ORC | DS 2×IHE ORC | DS 2×SORC ORC | 1×WF or 2×WF | |
| ser./par. | DS parHTSLTPH ORC | DS par2×LTPH ORC | |||||
| cascaded | DS casLTSPH ORC | DS casnoLTSPH ORC | |||||
| Pump isotropic efficiency | (%) | 70 |
| Turbine isotropic efficiency | (%) | 85 |
| Pump and turbine mechanical efficiency | (%) | 95 |
| Condenser cooling medium | - | Air |
| Geothermal heat source temperature | (°C) | 120/140/160/180 |
| Evaporator pinch point | (°C) | 10 |
| Condenser pinch point | (°C) | 5 |
| Condensation temperature | (°C) | 35 |
| Mass flow value of the heat source medium | (kg/s) | 1 |
| Pressure of the heat sink medium | (bar) | 1 |
| Temperature of the heat sink medium | (°C) | 20 |
| Pressure of the heat source medium | (bar) | 10 |
| Heat source medium | - | (geothermal) water |
| Subcooling temperature difference | (°C) | 2 |
| Name | Pcr (bar) | Tcr (°C) | Safety Group | ODP | GWP |
|---|---|---|---|---|---|
| Cyclopentane | 45.15 | 238.54 | A3 | 0 | 11 |
| N-pentane R601 | 33.6 | 196 | n.a. | 0 | 20 |
| Isopentane (ic5) R601a | 33.78 | 187.2 | A3 | 0 | 20 |
| Neopentane R601b | 31.96 | 160.6 | n.a. | 0 | 20 |
| R1233zd(E) | 35.7 | 165.6 | A1 | 0.00034 | 7 |
| R245fa | 36.51 | 154.01 | B1 | 0 | 1050 |
| R1234ze(Z) | 35.3 | 153.7 | A2L | 0 | 6 |
| n-butane R600 | 37.9 | 152 | A3 | 0 | 3 |
| isobutane (ic4) R600a | 36.29 | 135 | A3 | 0 | 3.3 |
| R1234ze(E) | 36.4 | 109.4 | A2 | 0 | 6 |
| R134a | 40.59 | 101 | A1 | 0 | 1430 |
| R1234yf | 33.8 | 94.7 | A2Lr | 0 | 4.4 |
Publisher’s Note: MDPI stays neutral with regard to jurisdictional claims in published maps and institutional affiliations. |
© 2022 by the authors. Licensee MDPI, Basel, Switzerland. This article is an open access article distributed under the terms and conditions of the Creative Commons Attribution (CC BY) license (https://creativecommons.org/licenses/by/4.0/).
Share and Cite
Mustapić, N.; Brkić, V.; Duić, Ž.; Kralj, T. Thermodynamic Optimization of Advanced Organic Rankine Cycle Configurations for Geothermal Energy Applications. Energies 2022, 15, 6990. https://doi.org/10.3390/en15196990
Mustapić N, Brkić V, Duić Ž, Kralj T. Thermodynamic Optimization of Advanced Organic Rankine Cycle Configurations for Geothermal Energy Applications. Energies. 2022; 15(19):6990. https://doi.org/10.3390/en15196990
Chicago/Turabian StyleMustapić, Nenad, Vladislav Brkić, Željko Duić, and Toni Kralj. 2022. "Thermodynamic Optimization of Advanced Organic Rankine Cycle Configurations for Geothermal Energy Applications" Energies 15, no. 19: 6990. https://doi.org/10.3390/en15196990