1. Introduction
The need to reduce energy consumption has been recognized for many years due to the depletion of non-renewable energy sources and increasing environmental requirements. Its significance is particularly noticeable in the European Union, which is implementing legislative initiatives for stringent climate policy targets involving considerable reductions in greenhouse gas emissions and achieving climatic neutrality by 2050 [
1]. Currently, the pressure to increase energy efficiency is becoming even stronger given the rapidly rising prices of energy carriers as a result of global supply chain disruptions due to the COVID-19 pandemic, among other reasons [
2].
Energy consumption concerns are also very relevant when considering requirements for recycling. The implementation of a circular economy concept involves returning increasingly higher amounts of post-consumer waste to production processes to close material cycles. To be used as raw materials, the recyclables have to meet high quality standards. The recycling process of any material must be preceded by the separation of this material from contaminations by relatively thorough cleaning. Any foreign matter may result in the substantial deterioration of the quality of the secondary raw material and make the recycling process more difficult [
3].
Obtaining material of acceptable quality is performed by a system for collecting post-consumer packaging waste and separating recyclable materials. With regard to the order of the key operations, two major models of recycling systems can be distinguished: (1) with separation performed before the collection and (2) with separation performed after the collection (post-separation). In the former case, the separation is made ‘at source’ in households, while in the latter case, the separation takes place in a waste treatment plant. The specific schemes of the systems affect their economic performance. The main components of the costs of post-consumer packaging waste collection are transportation (broken down into vehicle and personnel costs), containers, and bags. In the case of a collection system with waste separation at source, the total cost amounts to around 350 € per 1 tonne of waste. The largest contribution to this amount is transport (around 240 €/t). The collection cost in the case of the post-separation system is almost 4-times lower. The difference is mainly due to the reduced cost of transportation by engaging a smaller number of garbage truck operators (1 instead of 3). The determined costs do not include a segregation process [
4]. According to another study, the total cost of a recycling system for household waste separated ‘at source’ equals 677 €/t [
5]. The analysis covered a wider scope, including material processing. The cost of recycling processes was estimated at 269 €/t; however, this also did not take into account the cost incurred by householders for the preliminary waste preparation for later collection.
The problem is particularly common in the case of small, individual food packaging contaminated with kitchen residues. This waste is easiest to clean up right after the product is consumed, when the food remains are fresh and can be simply washed away. This is possible in households; however, it requires the involvement of the residents as well as the consumption of water, energy, and dishwashing liquid that increase the total cost of the selective collection system and its environmental impact. Washing of post-consumer packaging waste can be done at a later stage by the recycling plant, but this solution has certain disadvantages:
Householders often decide to wash their food packaging waste to avoid the inconvenience, despite various local regulations and specific recommendations concerning waste handling resulting from the local waste management system that provides washing of waste packaging at the treatment plant.
The waste selection at source carried out in households contributes to the recovery of valuable secondary raw materials, but it requires the residents’ efforts and time spent on washing the waste packaging, which can be expressed as costs. Moreover, a decrease in householders’ quality of life due to inconvenience related to odors and insects can be also classified as a kind of cost. While considering the whole financial balance of recycling systems, various authors took into account the costs incurred by householders in different ways:
As costs of extra collections of municipal waste [
6];
As cost of time devoted to sorting waste [
7];
As willingness to pay (WTP) to be exempted from the duty [
8];
Using green moral index while calculating WTP [
9];
As social cost, combining external and internal costs [
10].
However, the literature also presents other positions, which state that sorting activity is a kind of moral effort and hence it may be assumed to be balanced by the non-economic benefit of taking part in a noble idea leading to sustainability, and, furthermore, monetizing this type of effort is very complex since sorting activity involves two different social attitudes at the same time: First, it is specific for acting as citizens, and second, it is specific for individual consumers [
11,
12].
However, washing the post-consumer packaging waste involves consumption of hot and cold water that undoubtedly represents particular economic cost incurred by households. Such an assumption was the foundation of the cost–benefit analysis comparing the value of recovered glass and plastic packaging with the economic loss associated with use of water, energy, and dishwashing liquid. The survey results were presented in the form of 374 experimental points that indicate the profitability level of washing the food packaging waste in households. In most cases, the water consumption cost turned out to be higher than the value of the recovered materials. This is particularly evident for plastic packaging, for which 84% of the results revealed unprofitability. In comparison, for glass packaging, 46% of the cases were profitable—mostly where cold water was used. In general, when hot water was used, the cost-benefit balance was negative in 72% of cases. The results of the survey pointed out that the cost of energy used for heating water exceeded the value of recyclable materials [
13]. However, this pessimistic conclusion was drawn from the analysis carried out a decade ago, when the costs of materials were different. Given the passage of time, inflation, and global supply chain disruptions, the prices of recyclables could change significantly, but, at the same time, the market of energy carriers has also changed. The new circumstances justify carrying out an updated cost–benefit analysis. This study attempts to fill the research gap in a broader context as well. This study addresses the scarcity of current publications investigating the costs of pre-treatment of food packaging incurred by householders. Most studies analyzing separate waste collection and recycling systems exclude waste sorting efforts ‘at source’ from the scope of the research. Accordingly, the main objectives of this article are:
Determining the particular costs of washing glass and plastic post-consumer food packaging and the economic benefits resulting from recyclable materials;
Comparing the present outcomes with the results obtained ten years ago [
13] and identifying the most important differences between the balances due to price changes;
Determining the effect of the application of particular heat sources on the total cost of pre-treatment of post-consumer food packaging.
In relation to the previous article [
13], the scope of this study was expanded. Originally, hot water was assumed to be supplied by a municipal network, so the analyzed provider of heating energy was local heating or a CHP plant. In this article, other sources of energy for water heating were also analyzed: electricity, natural gas, heating oil, and, eventually, a heat pump—representing a renewable source. Moreover, domestic dishwasher use for cleaning the packaging was also surveyed. Thanks to a variety of energy supplies assumed, a wider range of possible results might be obtained; as well, more and less favorable water heating options could be identified. The scope of the study includes the economic analyses of the washing issues and does not include an assessment of the environmental impact for the different solutions studied.
2. Materials and Methods
One of the objectives of this study was to compare the outcomes obtained presently with the results of the analogous analysis, which was carried out ten years ago. Therefore, the method applied for this survey was adopted after the previously published article. [
13]. Contrary to previous publications, the method used in this study took into account various hot water preparation systems, including renewable energy sources. The essence of the survey was to determine the economic value of the recyclable material of post-consumer food packaging as well as costs of cold water, energy for water heating, and dishwashing liquid or tablets for dishwashers. Primarily, glass and plastic containers were analyzed, but steel and aluminum lids were also considered. Originally, they were packaging for ketchup, tomato concentrate, mayonnaise, cream, yoghurt, chocolate, pudding, honey, cottage cheese, cucumber paste, meatballs, salads, etc. The numerical data were obtained from experiments carried out by people studying interdisciplinary degrees, such as management engineering and production management. They represented 118 households demonstrating various washing-up habits. The particular groups of students were chosen on account of their high environmental awareness due to their program of study, including issues on the need to recycle, conserve resources, and reduce environmental impact. The research sample was selected ten years ago, so it remained the same in the current study. The procedure of the experiments included measurements of the packaging mass (with breakdown by individual materials), water consumption (cold and hot water were registered separately), and detergent use. The material mass was determined using a scale with an accuracy of 1 g. Water consumption was measured with domestic water meters with an accuracy of 0.1 dm
3. The market values of recyclables were assumed as average prices from current pricelists of 17 Polish recycling companies [
14,
15,
16,
17,
18,
19,
20,
21,
22,
23,
24,
25,
26,
27,
28,
29,
30]. Given the current EUR/PLN exchange rate (4.6590 [
31]), the prices were:
Glass—2.15 €/1000 kg;
Plastic—118 €/1000 kg;
Steel—208 €/1000 kg;
Aluminum—298 €/1000 kg.
However, dirty material prior to washing (with remains of food) was assumed to not be suitable for recycling, and therefore its economic value was zero.
The price of cold water (1.91 €/m3) was taken from the water supply bill and included the cost of sewage collection. The cost of hot water consisted of two components: cold water price and cost of energy needed for water heating. To determine the energy costs, 40 °C of temperature difference between hot and cold water was assumed, as well as other parameters specific for analyzed methods of water heating. Unit costs for individual energy sources were:
Municipal network (local CHP plant)—6.56 €/m3;
Low-voltage electricity—7.97 €/m3 (from Polish grid);
Natural gas—3.00 €/m3 (assuming gas calorific value of 11.2 kWh/m3 and condensing boiler efficiency of 100%);
Light heating oil—7.15 €/m3 (assuming oil calorific value of 10 kWh/dm3 and condensing boiler efficiency of 95%);
Air source heat pump—3.32 €/m3 (assuming the seasonal average coefficient of performance of 2.4).
The prices of dishwashing liquid and tablets for dishwashers were assumed to be 2.83 €/dm
3 and 0.17 €/1 tablet, respectively [
32,
33]. A dishwasher with a capacity of 13 table settings was analyzed. It was assumed that separate packaging took the place of one piece of tableware, which corresponded to 1.28% of the total dishwasher capacity. The appliance consumed 0.92 kWh of electricity and 9.9 dm
3 of cold water per cycle [
34]. The comparison of the input data are depicted in
Table 1.
Based on the data presented, the economic value of the recovered materials was determined using Equation (1):
where V
M is the economic value of the recyclables; m
C is the mass of glass or plastic; m
L is the mass of steel or aluminum; p
C is the price of glass cullet or waste plastic; and p
L is the price of scrap steel or aluminum.
The cost of washing the packaging was obtained with Equation (2):
where C
W is the washing cost; a
W is the amount of water consumed (cold and hot water together); p
W is the price of cold water; a
HW is the amount of hot water consumed; c
WH is the cost of water heating (specific for the particular water heating system); a
D is the amount of detergent used (dishwashing liquid or dishwasher tablet); and p
D is the the respective price of the detergent.
It should be emphasized that according to the method adopted, a positive cost–benefit balance implies that the cleaning process is not profitable from the perspective of households involved in the washing process. From an individual householder’s point of view, the washing activity always has a loss as they do not earn any money for supplying the recyclables to the economy, and instead, they incur the costs of water and detergent consumption (obviously, households receive overall benefits from the recycling performed as they are part of the entire society that takes advantage of the economic use of recyclables, but householders do not receive direct financial benefits from their selective collection efforts). However, if the water cost exceeds the value of the recovered materials, cleaning the waste packaging is considered to not be economically justified, despite the fact that waste collection companies achieve some benefit as they receive recyclables, thereby avoiding incurring costs from the washing that is carried out in households. The method adopted did not take into account non-economic costs associated with householders’ efforts to select and wash the waste, so this approach is a simplification of the problem. On the other hand, it makes it possible to avoid issues concerning the moral dimension of the efforts that still may stir controversy. This approach introduces specific definitions of ‘profit’ (P
W) (and related term ‘profitability’) for the purposes of this study only, which was formulated with Equation (3):
Hereinafter, a ‘profitable’ washing process means the process in which V
M is greater than C
W. In an analogous meaning, the terms ‘economically justified’ and ‘beneficial’ are also used in this study. The percentage of experiments that demonstrated a positive profit (%P
W>0) relative to the total number of experiments was calculated from the Equation (4):
where N
Pw>0 is the number of experiments that demonstrated a positive profit (P
W > 0), and N
Pw>0 is the number of experiments that demonstrated a negative profit (P
W < 0).
The percentage of experiments that turned out to be unprofitable (PW < 0) was determined analogously. No cases were recorded in which PW = 0.
3. Results and Discussion
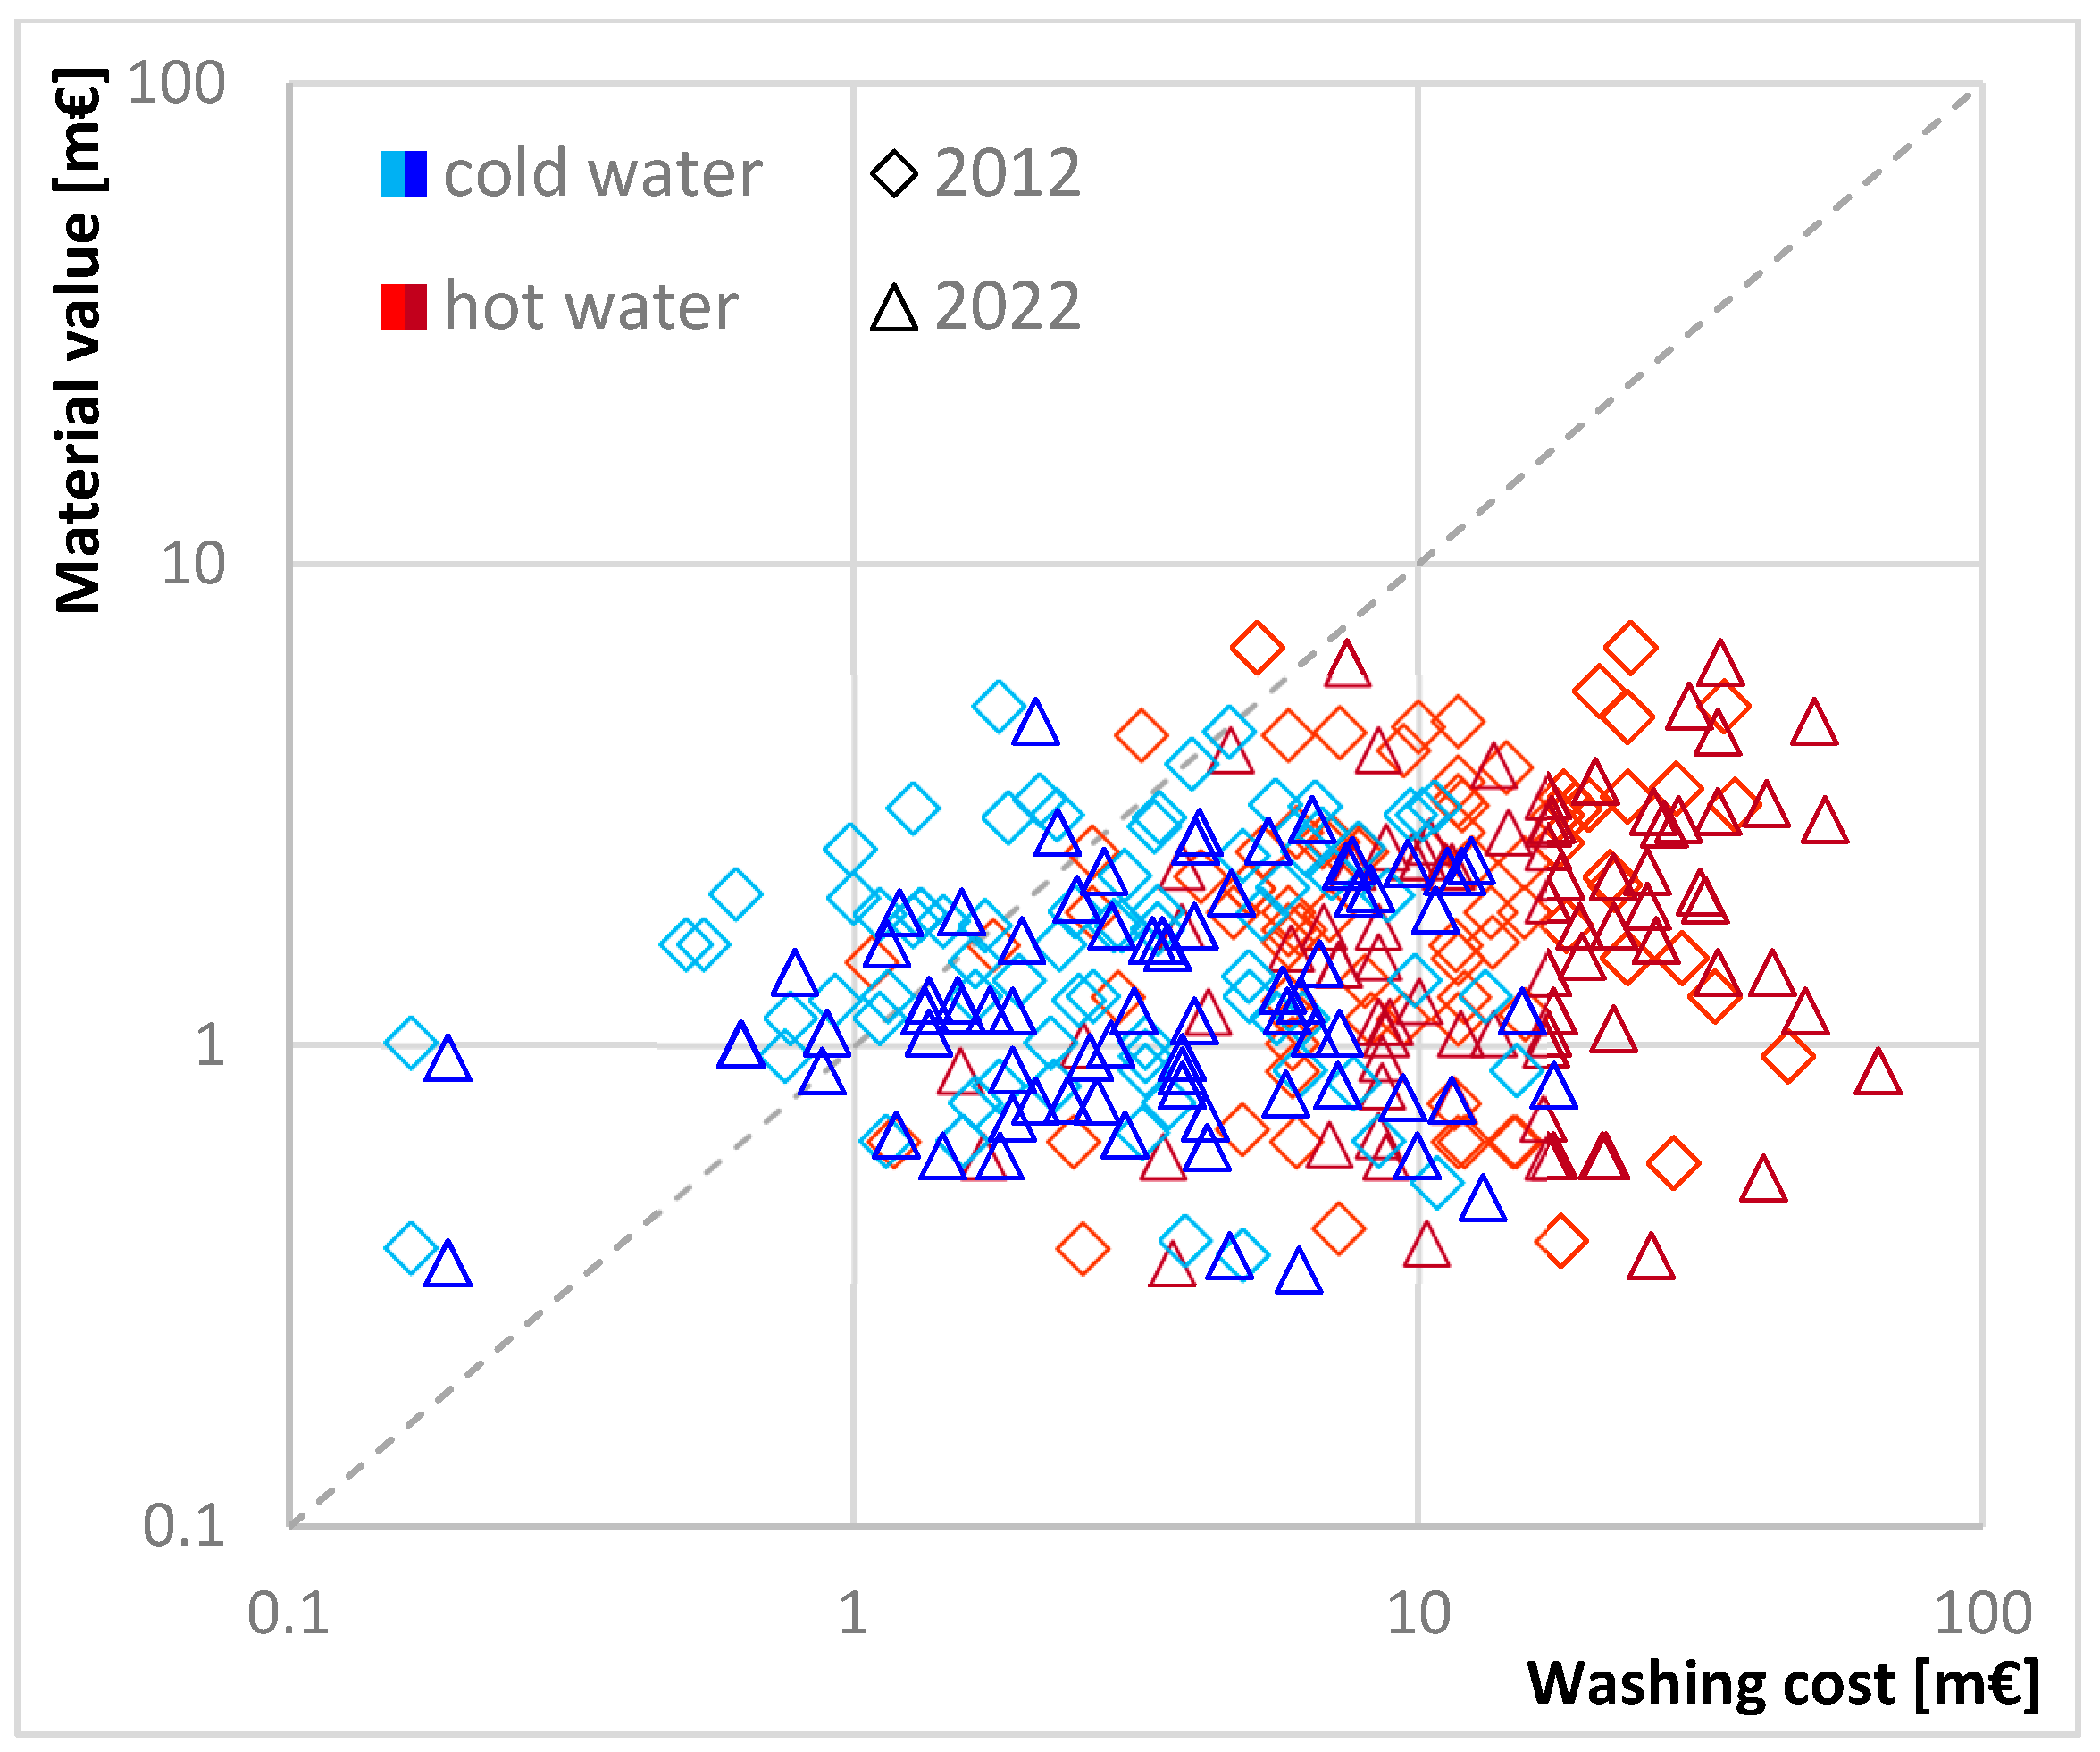
A comparison of the washing costs and the economic value of recyclable materials for glass packaging is shown in
Figure 1. Both the benefits and costs related to individual packaging were very small, thus for better legitimacy of the results, they were expressed in 1 m€ = 0.001 €. The results were presented in a double logarithmic system. The diagonal represents a situation where the value of the materials and washing costs are equal, which means zero profit is gained. The experimental points above the diagonal indicate an economic benefit, where the material value is higher than the washing cost (V
M > C
W). Analogously, points below the diagonal indicate an economic loss (V
M < C
W). The blue and red points symbolize cold and hot water consumption, respectively. The diamonds show data from 2012, while the triangles depict data obtained in 2022. The experimental points form four irregular clouds, two for cold water and two for hot water, which are divided into analyzed years. For washing with cold water, part of the points—70% for 2012 and 40% for 2022—are located above the diagonal (P
W > 0). In the case of hot water consumption, the situation is different: most of the points are placed below the diagonal (P
W < 0), and a positive profit is indicated by a smaller proportion of the data—31% for 2012 and 5% for 2022. Both the percentages depicted and the location of the points (the clouds representing current data are shifted below the diagonal relative to clouds obtained a decade ago) indicate a decline in the profitability of the washing process over the last ten years. The change is apparent regardless of whether cold or hot water was used for washing; however, the largest relative reduction in the process profit can be observed in the case of cleaning with hot water.
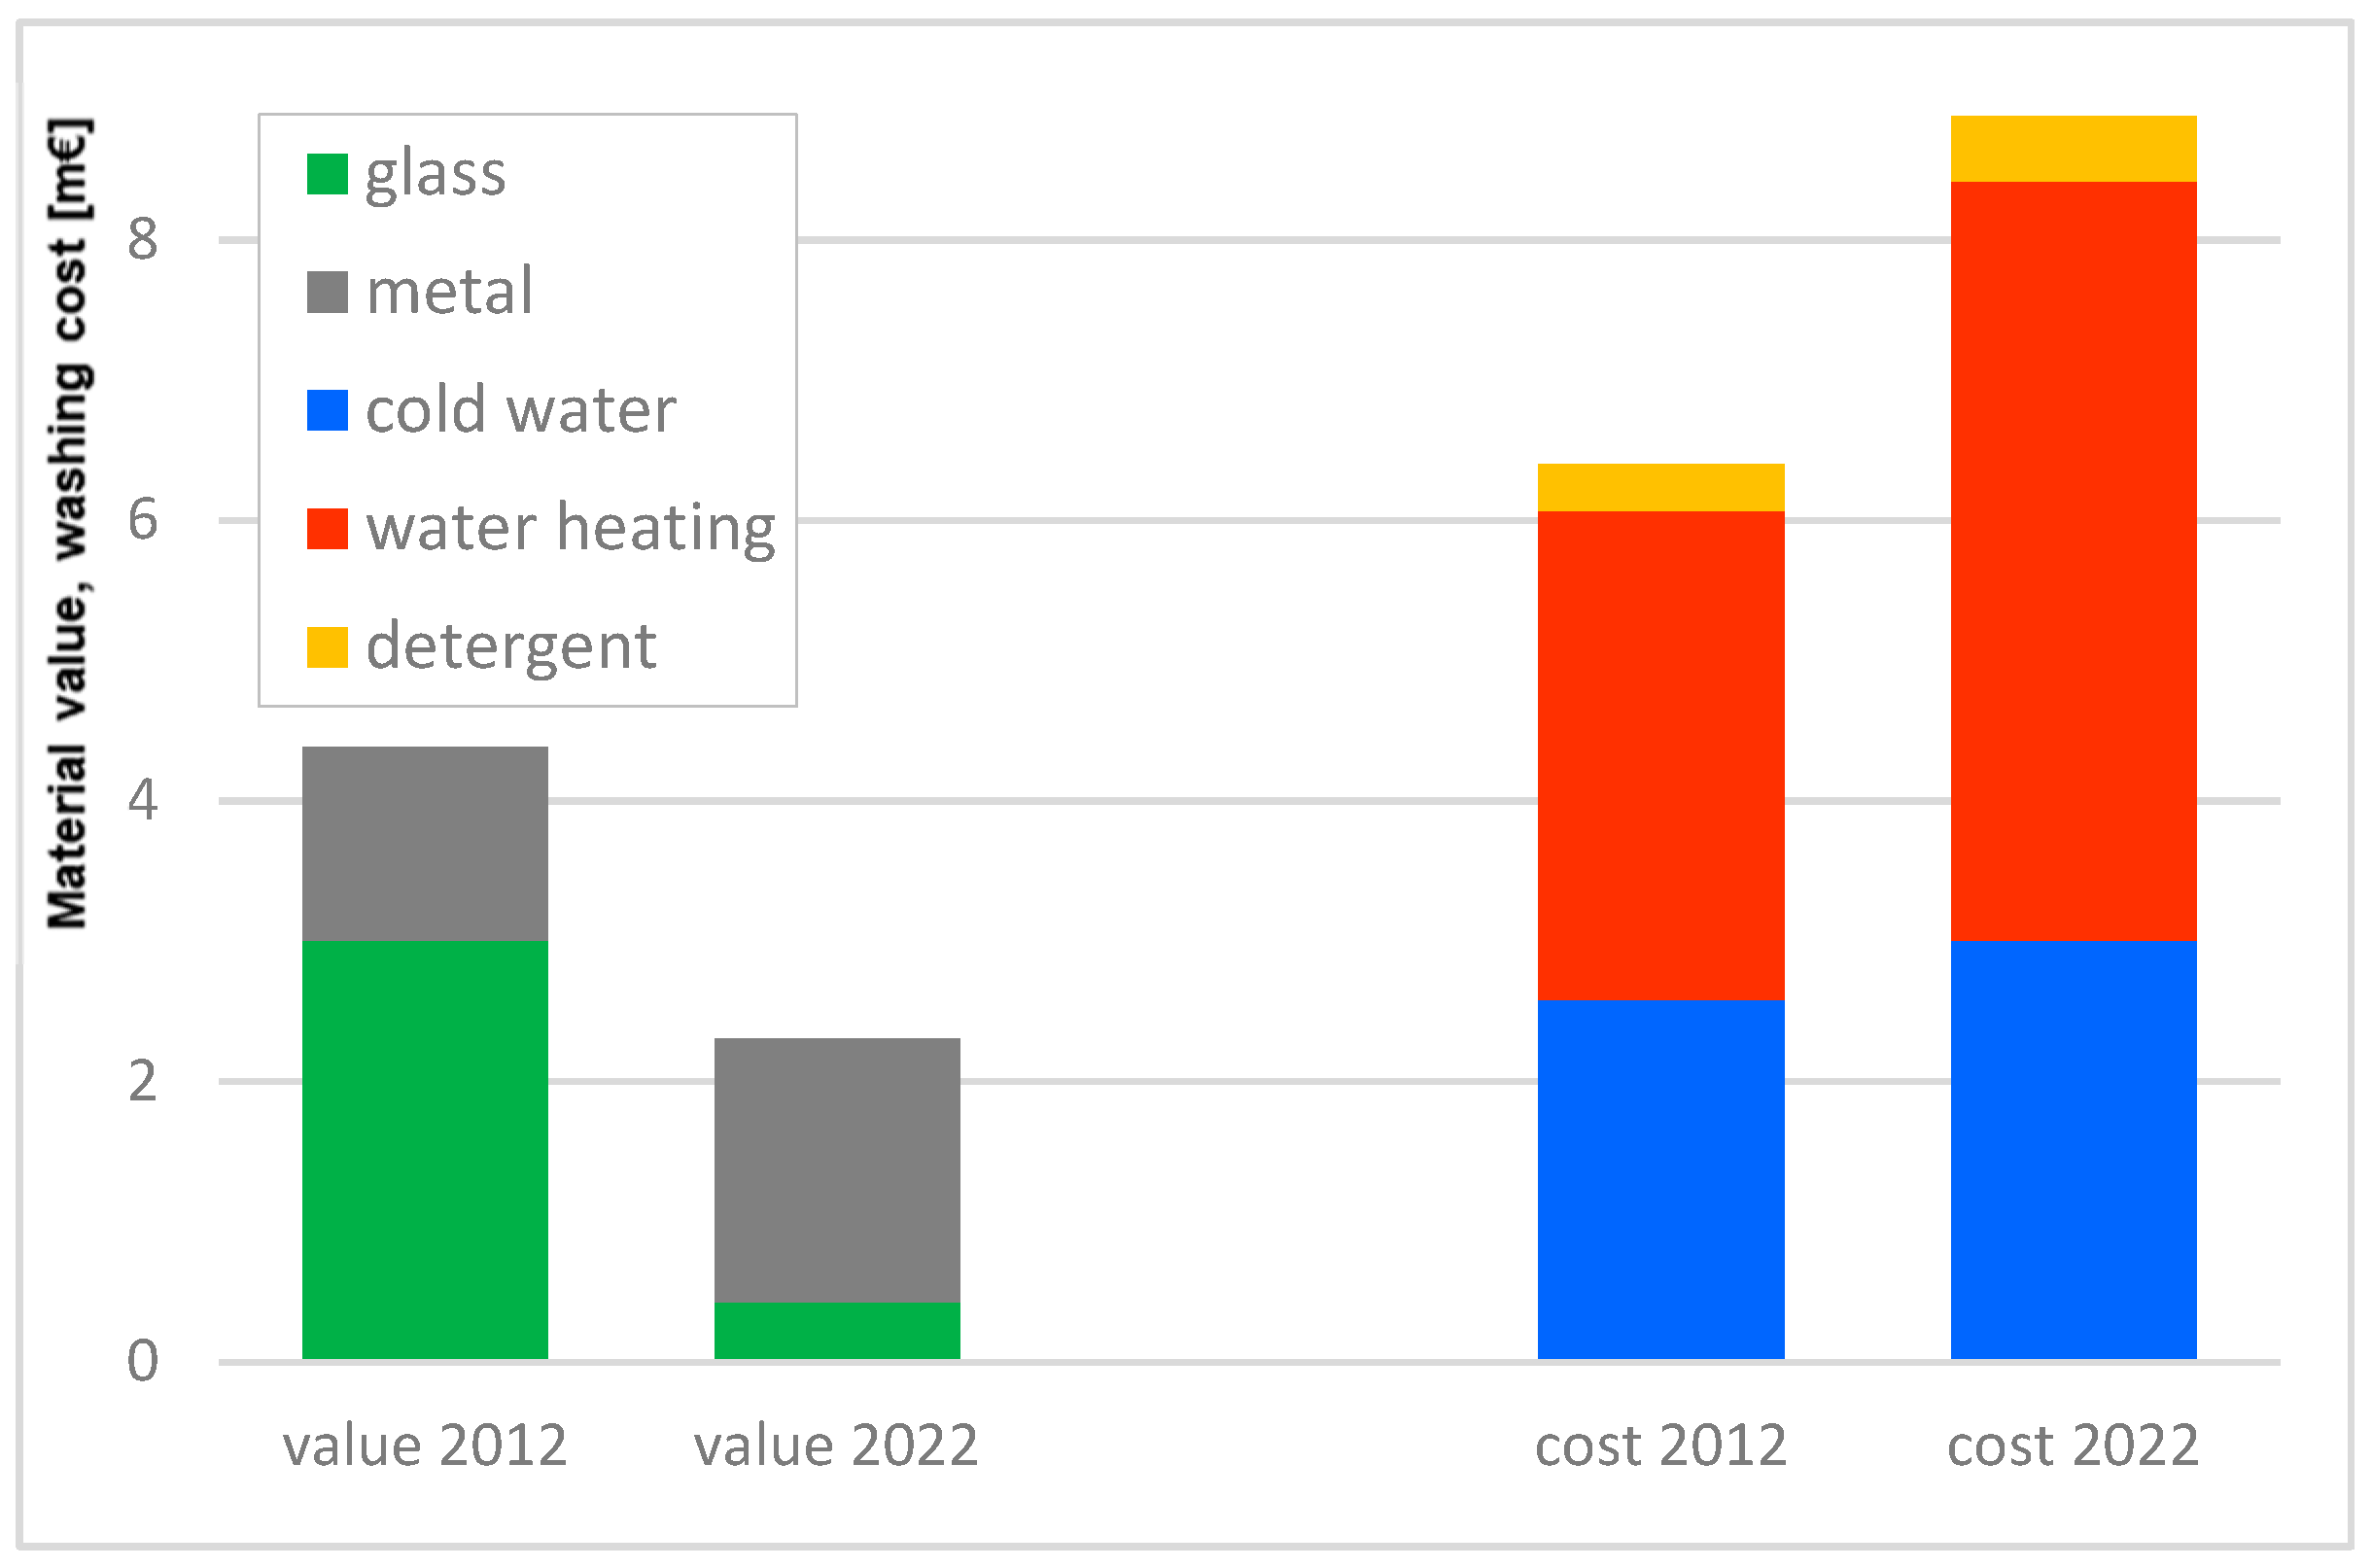
The reasons for the decline in profitability are visible in
Figure 2, which depicts the comparison of mean values of recyclable materials obtained from glass packaging with components of the average washing cost. There are a few factors driving the change. On the one hand, the growing costs of cold water (+16%), energy for water heating (+55%), and dishwashing liquid (+39%), and on the other hand, the decrease in the value of packaging material (−47%). This is remarkable that the value of recyclables dropped despite a considerable increase in the price of steel (+37%), since this increase was accompanied by a decrease in the price of glass (−86%), which dominated the composition of the average package (over 95% of total packaging mass was glass)—compare bars named ‘value 2012’ and ‘value 2022’ in
Figure 2. The reason for the drop in glass cullet price at recycling companies seems to be complex. In recent years, selective waste collection has become more common and efficient as local authorities have taken over the responsibility for its organization and have achieved the required levels of materials collection. The municipalities have sold the glass cullet obtained from municipal county systems directly to wholesale collectors, thus less glass cullet has flowed outside the system. Consequently, this activity has become less profitable for individual scrap yards due to the reduced waste packaging supply. Therefore, they have decreased their prices for glass cullet or withdrawn them from this business.
A comparison of the economic value of recyclables and the cost of cleaning plastic food packaging is shown in
Figure 3. In this case, the vast majority of the analyzed points—84% for 2012 and 92% for 2022—are located below the diagonal. The percentage of points indicating profitability declined over the last decade, which is similar to glass packaging. Regardless, whether it was ten years ago or currently, washing with hot water turned out to be unjustified, as the cost of heating energy exceeded the value of the recyclables in 96% and 100% of cases, respectively. In the case of cold-water use, unprofitability was demonstrated by over 70% of the points.
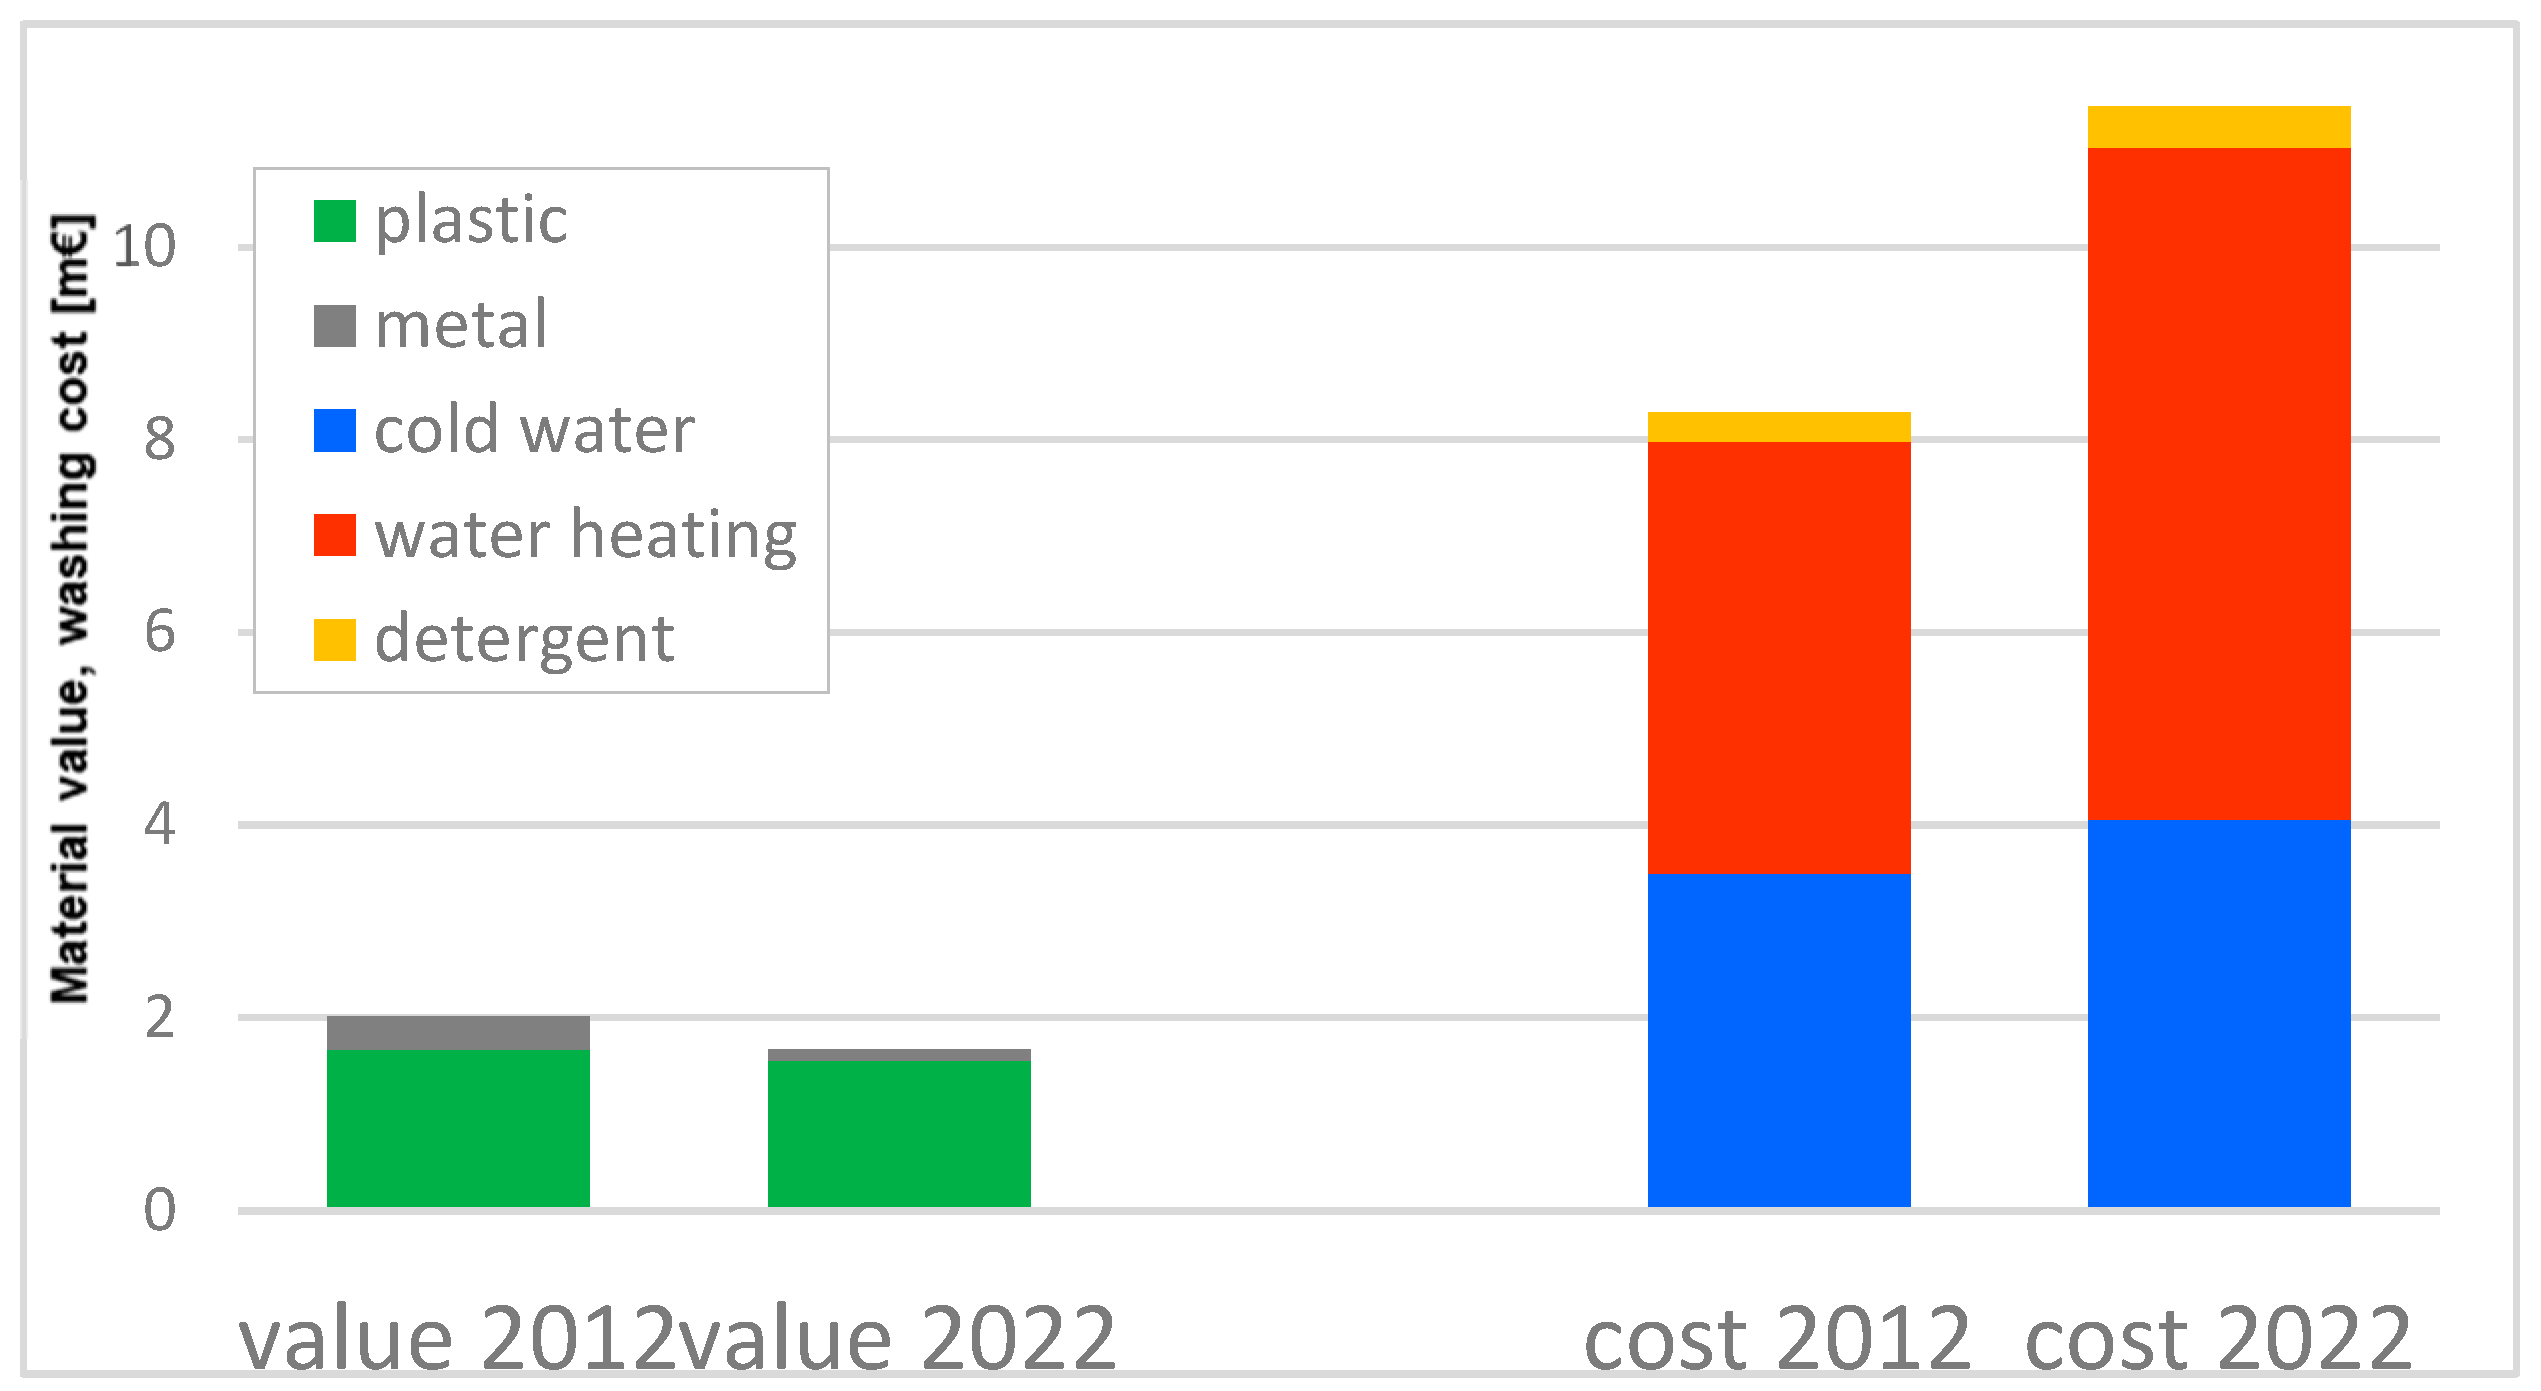
Figure 4 presents the comparison of the components of the average economic balance analyzed for washing the post-consumer plastic containers. Again, over the last ten years, mostly unbeneficial changes could be noted. The cost of cold water, energy consumed for water heating, and dishwashing liquid increased at the same rate as the glass packaging. The mean value of recyclable materials decreased by 17% mainly due to the drop in waste plastic price (−7%) accompanied by a decrease in the price of lid material—scrap aluminum (−65%). Generally, the price of aluminum is higher than ten years ago. However, the foil (which often forms the lids of plastic packaging) is one of the less valuable forms of metal scrap (4–6-times cheaper than aluminum cans and even around 9-times cheaper than aluminum profiles). Apparently, the survey carried out in 2012 assumed the price of general aluminum scrap, which may be the reason for such an unexpected price difference.
Based on
Figure 2 and
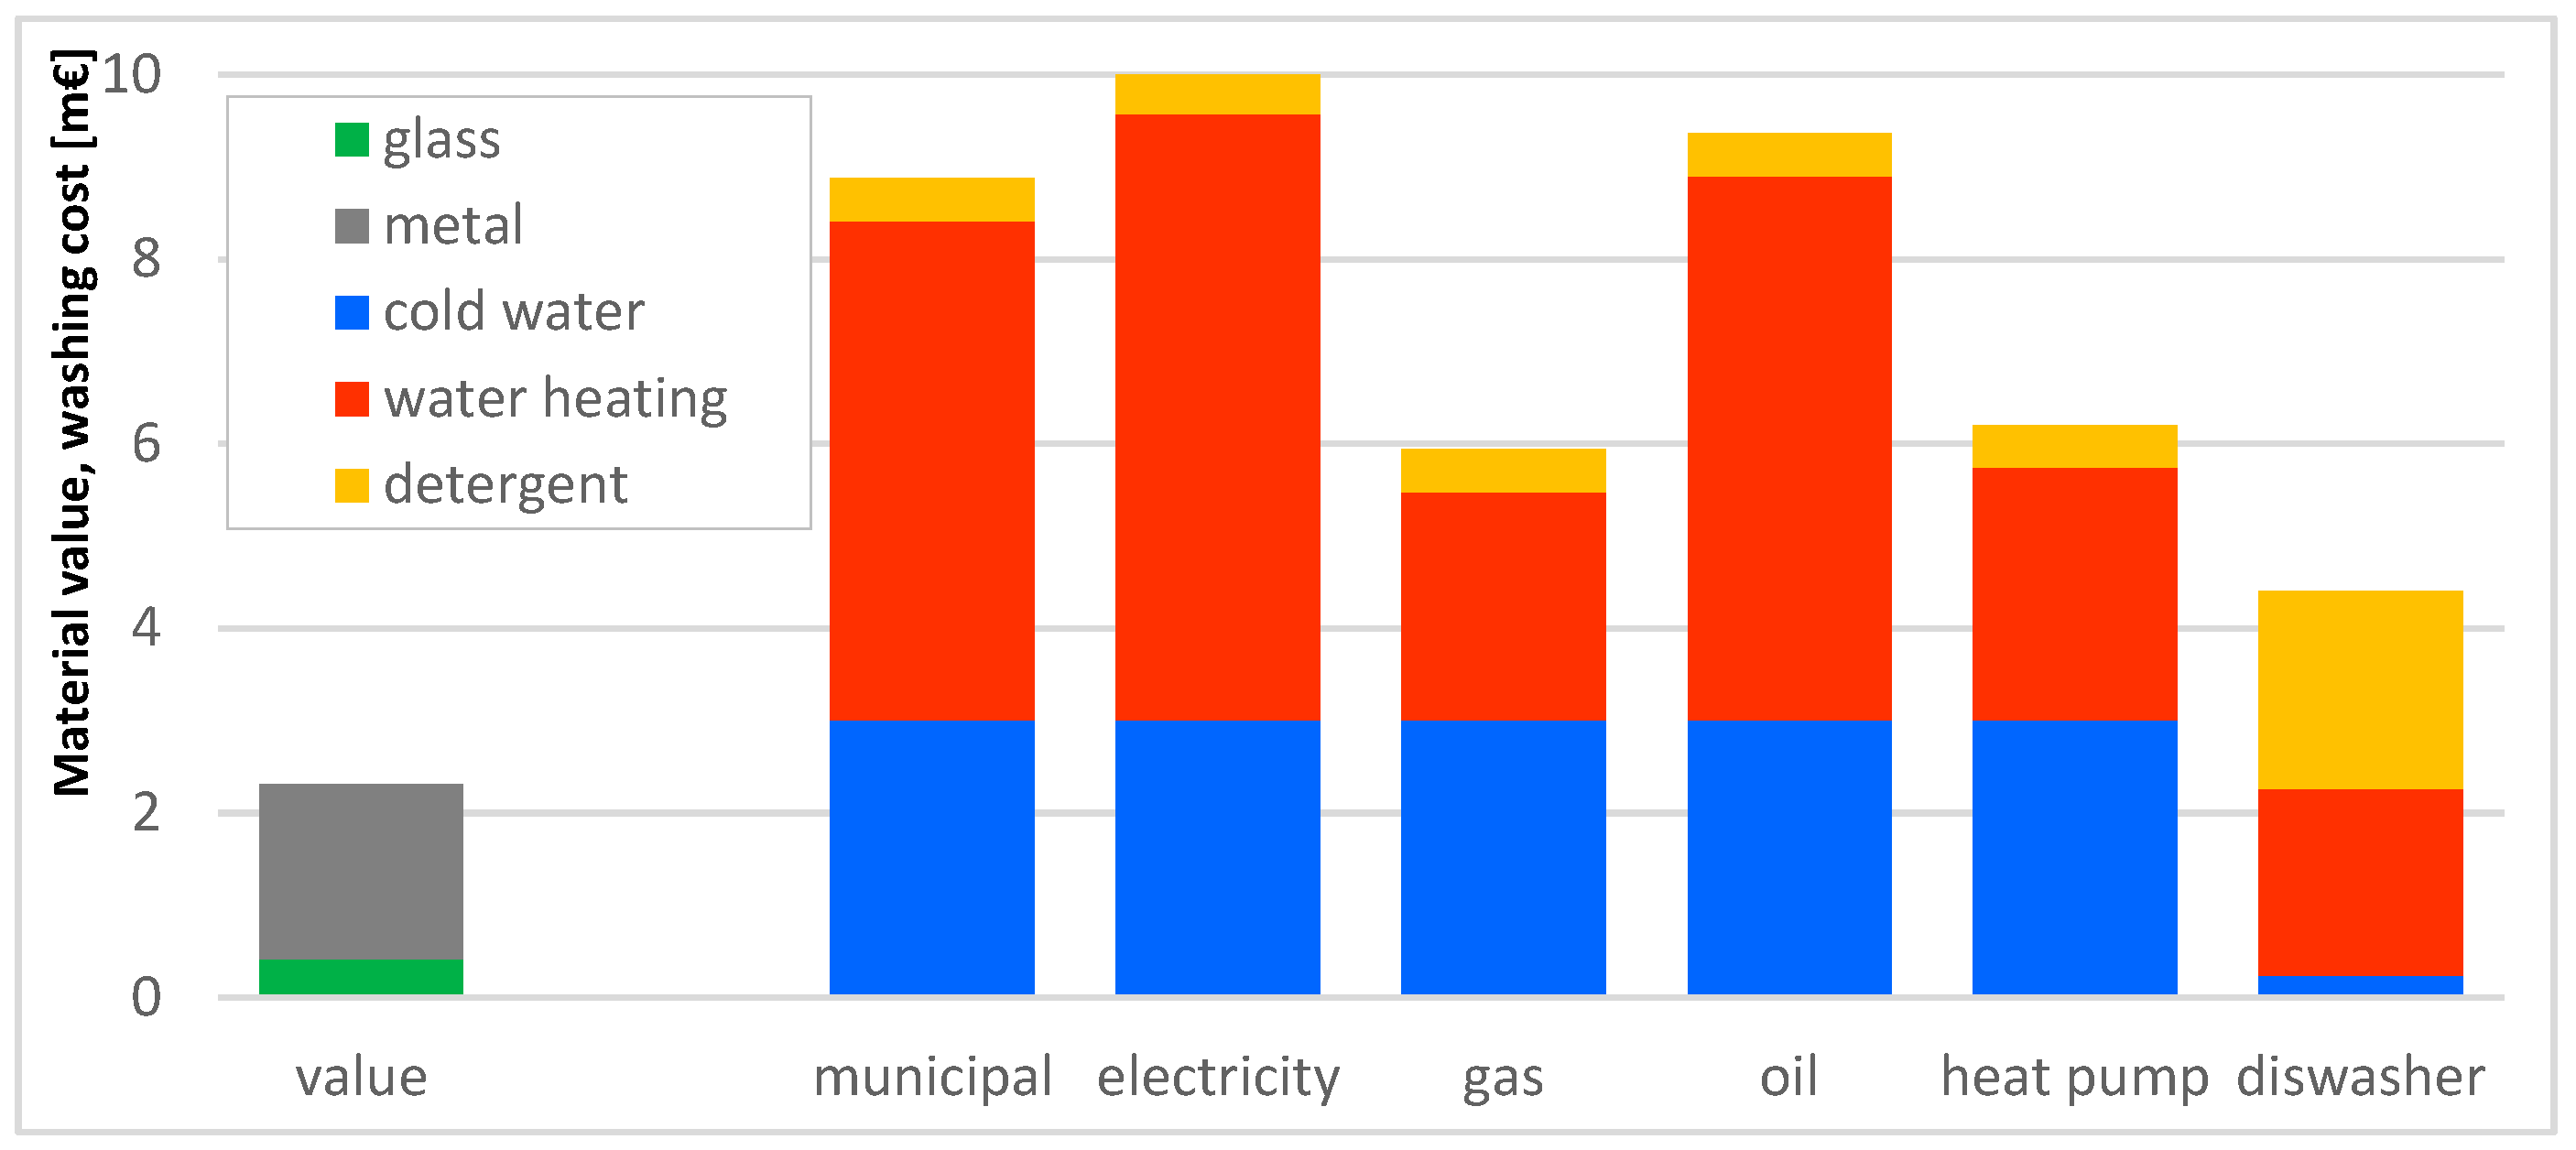
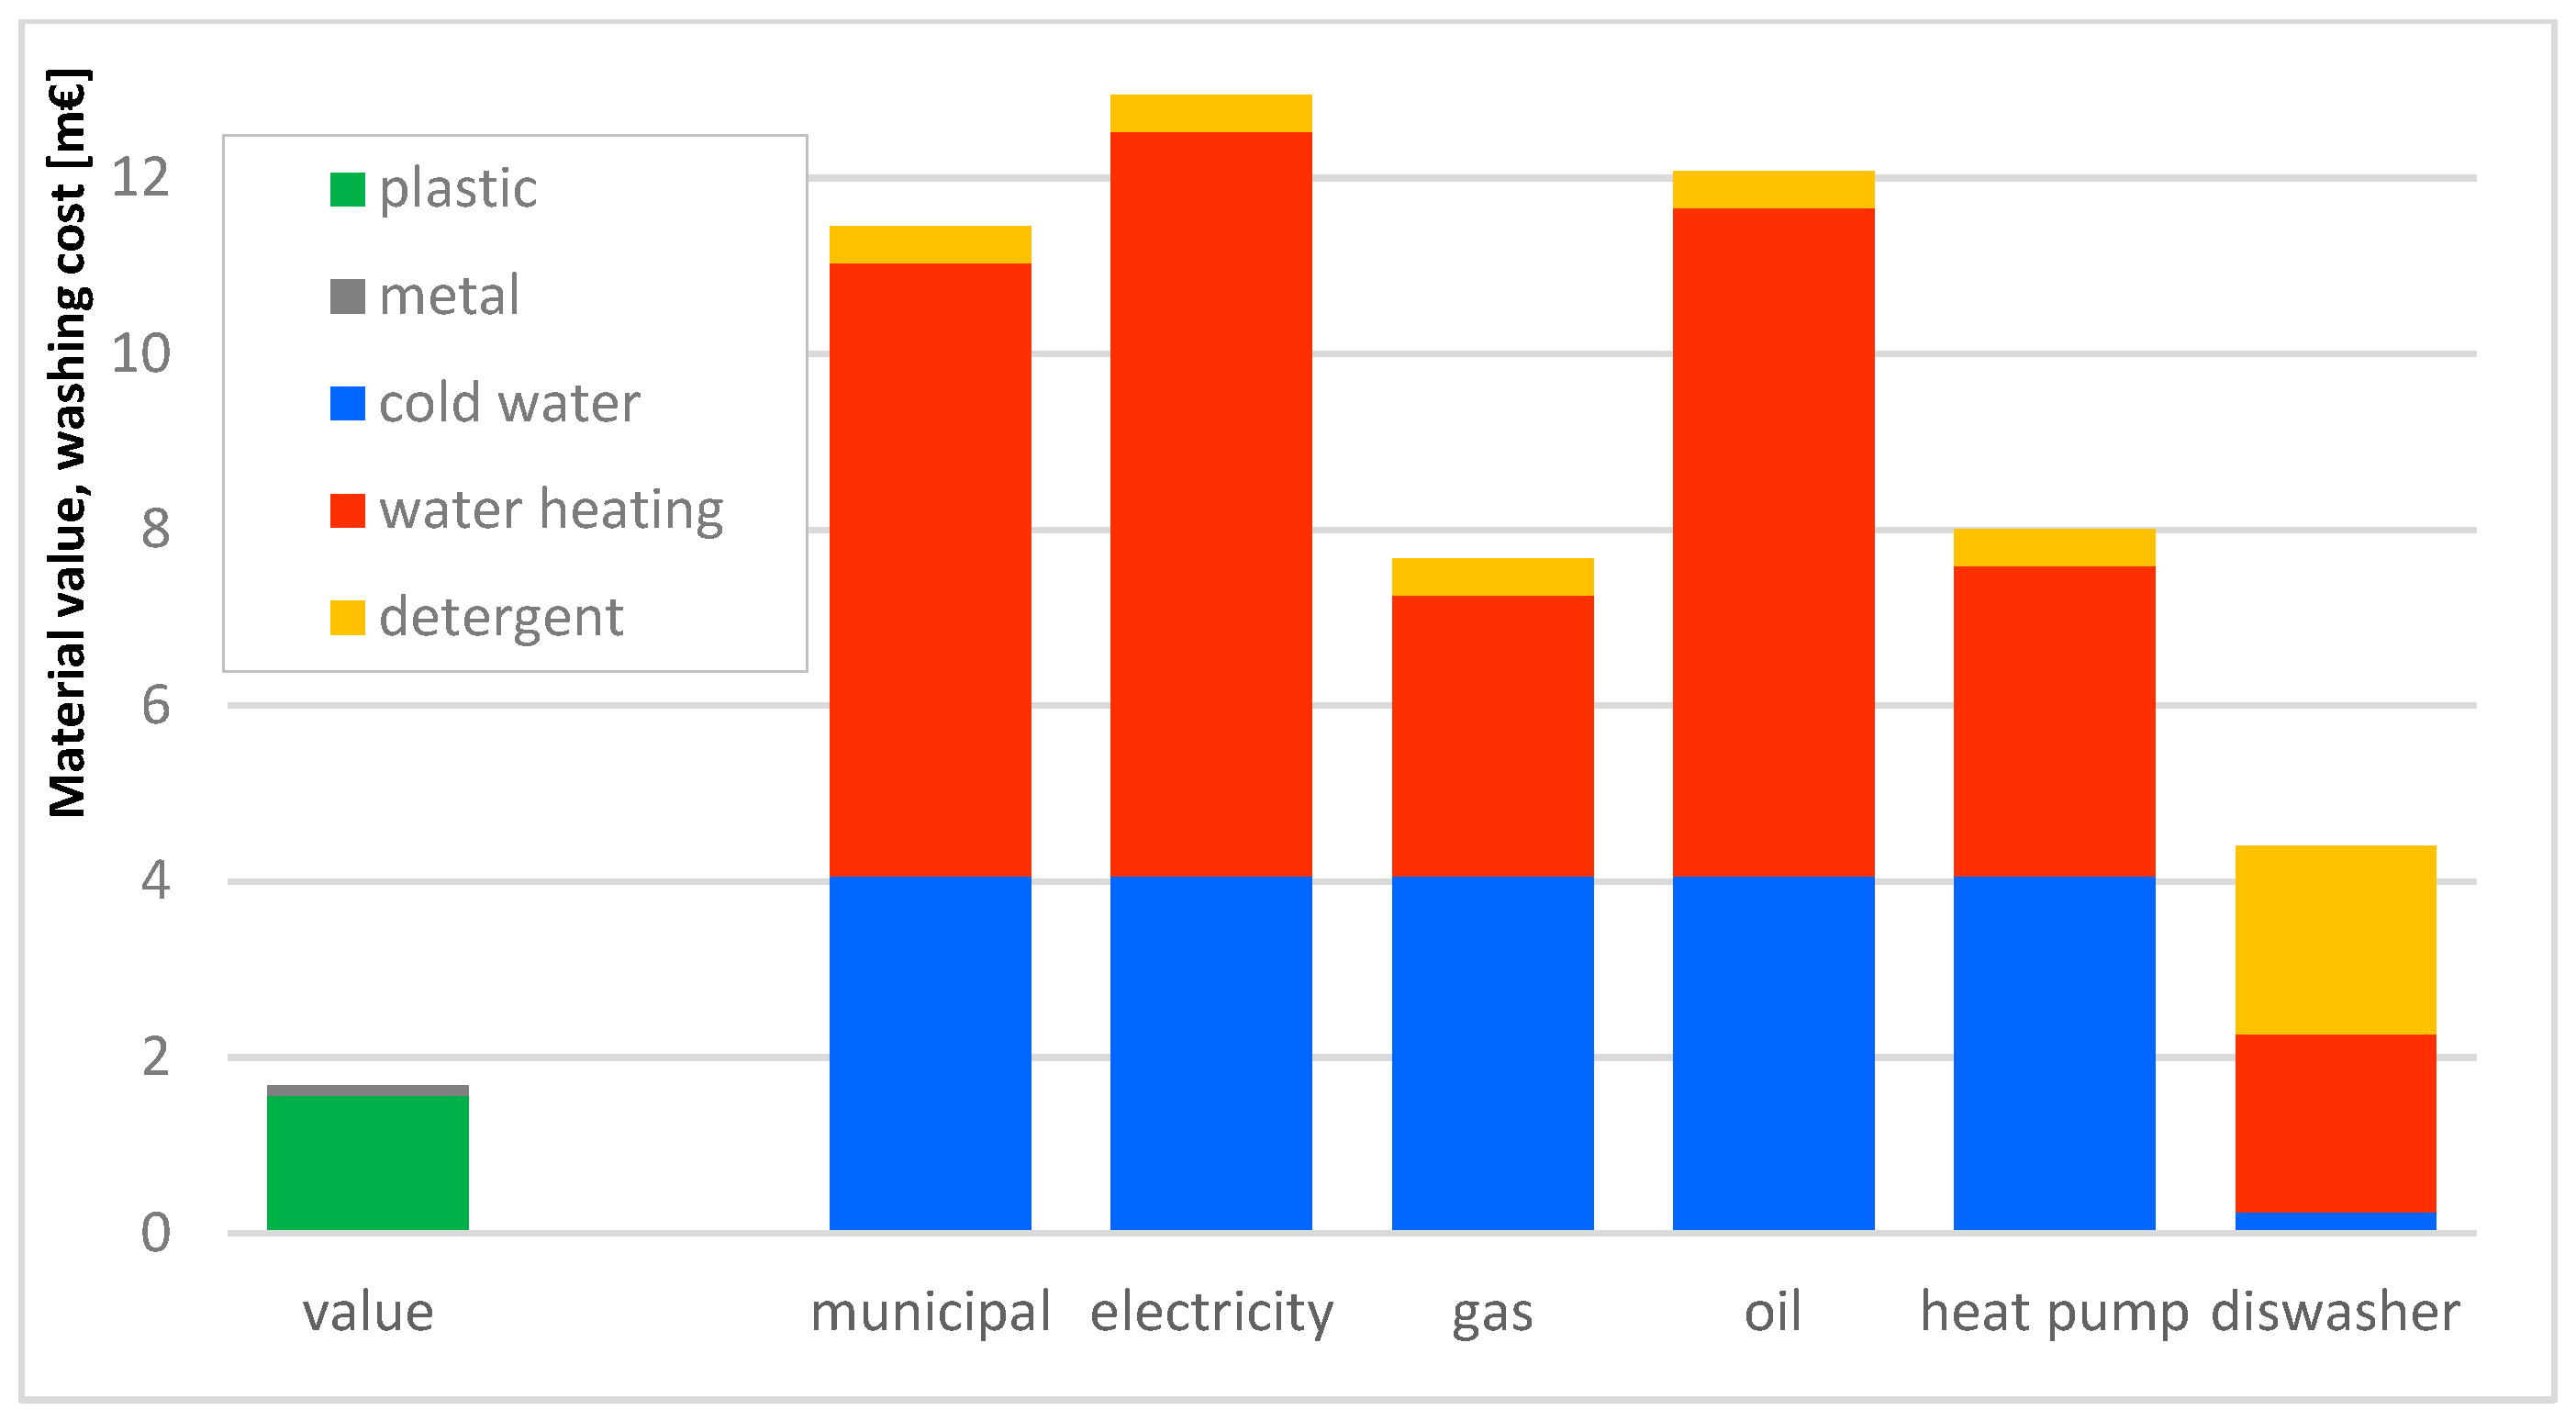
Figure 4, a uniform conclusion could be drawn from both charts: the most relevant component of the balance was the energy for water heating. The contribution of this factor grew during the time it was analyzed—the heating cost represented 53% of total washing costs in 2012 and up to 61% of the cost in 2022. However, the presented results took into account only one energy source, namely, the municipal heating network with a local CHP plant as an energy provider. Many houses, particularly those located outside the main residential estates of towns and beyond the municipal heating network, are equipped with individual systems of water heating; therefore, it seemed advisable to carry out an additional survey by considering the most popular of the solutions. The supplementary analysis included the costs of water heating with four various individual systems using: an electric water heater, a natural gas boiler, a heating oil boiler, and an air source heat pump.
The comparisons of the costs attributable to the particular solutions are presented in
Figure 5 and
Figure 6 for cleaning glass and plastic packaging, respectively. As the graphs show, the municipal network turned out to be one of the most expensive sources of hot water. Slightly higher costs were obtained only in the case of the electric heater (20%) and the oil boiler (9%). The heat pump and the boiler fired with natural gas turned out to be considerably less expensive solutions (49% and 54%, respectively). Despite the fact that the air source heat pump is powered by electricity, its seasonal average coefficient of performance of 2.4 allows it to achieve such a good result. However, even for the most economical solution (gas system), the entire washing costs still exceeded the value of the recyclables. In the case of glass packaging, the value of recovered materials accounted for 39% of the cleaning cost, whereas for plastic packaging the ratio was far less beneficial and accounted for 22%.
This pessimistic observation was the motivation to analyze one more solution: washing the post-consumer packaging with domestic dishwashers, which have become increasingly popular in recent years. The related cost is represented by the last bar (on the right) in
Figure 5 and
Figure 6. The cost of washing the glass packaging with the dishwasher turned out to be the least compared to the remaining energy sources and amounted to 74% of the total washing costs obtained for the gas system. For plastic, the ratio is even lower and equals to 57%. Water heating and detergent use amounted to 95% of the total costs of washing the packaging in the dishwasher, while only 5% of the costs were related to cold water consumption. However, a very relevant observation concerns the cost–benefit analysis in this case: the total cost of cleaning the food containers using a dishwasher is higher compared to the value of the recyclable materials by 91% for glass and as high as 163% for plastic packaging.
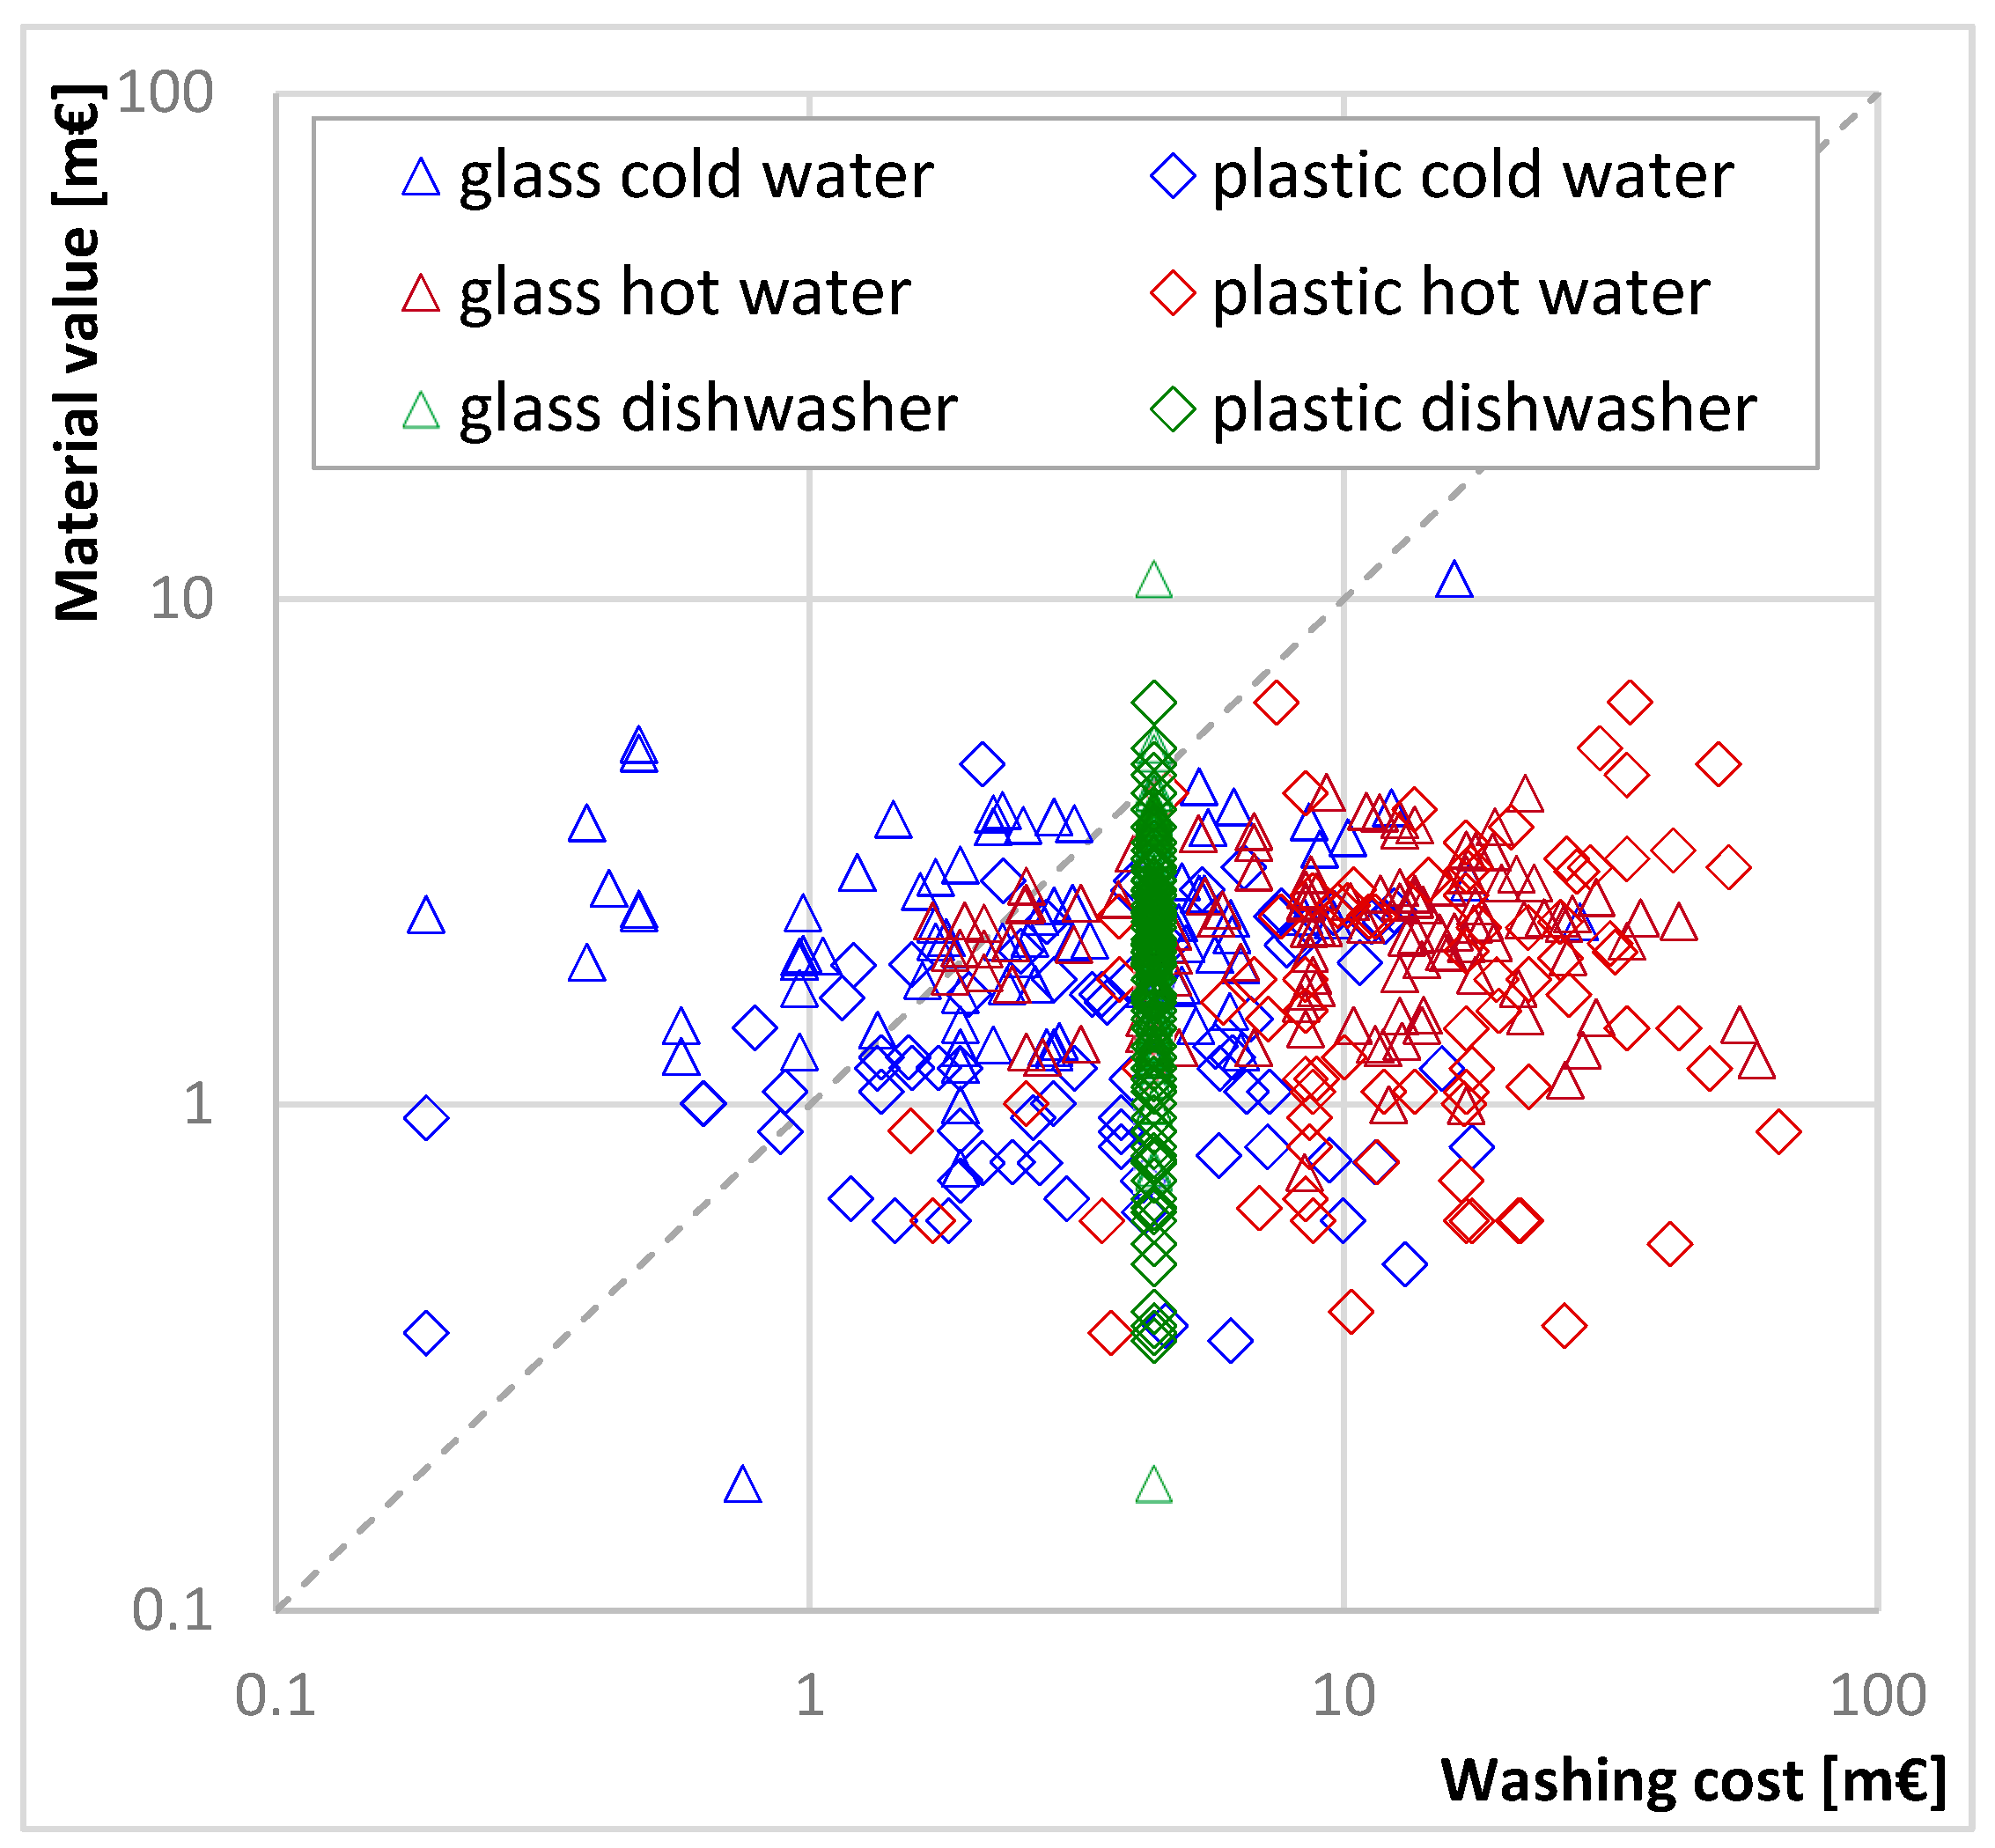
Figure 5 and
Figure 6 presented the components of the economic analysis for average cases. In order to show the relation between cost and benefit, including dishwasher performance in individual cases, another chart (
Figure 7) was prepared by overlaying additional points on a combination of
Figure 1 and
Figure 3.
Figure 7 depicts a comparison of the material value and washing costs for glass and plastic packaging in 2022. Red triangles and diamonds represent the municipal heating network as an energy provider for washing, whereas the green points represent domestic dishwasher use. All of the experimental points for washing packaging with the dishwasher, regardless of the packaging mass and material, indicate the same washing cost, as a constant proportion of space occupied by a single container was assumed. The majority of the points are located below the diagonal, which means that in most single cases, the washing cost exceeded the benefit resulting from the material value. Compared to washing-up by hand, using the dishwasher provided more efficient results in 61% of cases. The general conclusion could be drawn that, on average, using a dishwasher for cleaning post-consumer food packaging presented slightly better results than washing-up by hand; however, in particular cases, householders provided higher washing-up efficiency—in 46% of cases—when they used cold water.
The results presented are comparable to those obtained by other authors. Wikström et al. assumed similar input data associated with water heating needed for washing plastic packages for minced meat. The amount of water used by householders for washing a single packaging was specified at a maximum of 2 dm
3 (here, the median was 1.75 dm
3) and a heating temperature difference of 35 °C (here it was assumed to be 40 °C). Given the energy prices reported in the present study, the costs of water heating for washing would be very similar—however, it was not calculated by Wikström et al. [
35].
The results of the analysis can be also compared to the data specific for washing the post-consumer plastic packaging in a recycling plant. The water consumption reported by Toniolo et al. was lower than the median in the current study—1 dm
3 vs. 1.75 dm
3. A greater difference is visible between the energy consumption for packaging washing—0.002 kW·h vs. 0.047 kW·h. The difference may result from the lower temperature of the washing water in the recycling plant and higher efficiency of the process conducted on a larger scale [
36].
The cost of selective collection and sorting activities performed by a recycling plant were presented by Marques et al. Depending on the analyzed country, the determined cost of selective collection was in the range of 96–133 €/t, whereas the cost of sorting ranged from 117–179 €/t [
37]. The costs reported, particularly the latter, can be compared to the results of the current study, where the average washing costs were in the range of 21–48 €/t and 324–952 €/t for glass and plastic packaging, respectively.
The presented ranges allow us to compare the estimated cost of washing packaging with the cost of the next stage of waste management, i.e., waste transportation. In the case of municipal waste collection ‘at source’, the reported cost of waste transport was around 240 €/t [
4]. The cost is between the ranges of the washing cost for glass and plastic packaging.
The input data used for the analyses were affected by uncertainties due to the nature of the phenomenon under study, related methods of data acquisition, and the inaccuracy of the measuring equipment. The major uncertainties may originate from an unstable situation in the market of raw materials and energy carriers. Current trends in price changes are difficult to predict due to political factors driving them, including the war between Russia and Ukraine—two countries that are rich in various resources. The accuracy of water consumption measurement (0.1 dm3) may have introduced significant errors, particularly in cases of low water consumption (e.g., water consumption ≤ 0.2 L, which was recorded in 15 cases, may have introduced a measurement error of ±25%). In the vast majority of experiments (96%), when a higher water consumption was recorded, the error was smaller—the median potential error in reading water consumption was ±8%. This error has a direct impact on the obtained cost of water consumption and the cost of heating water, which were the most important components of the overall cost of the washing process.
The study limitations can be related to several factors. The above-mentioned unstable situation in the market of raw materials and energy carriers makes trends in price difficult to predict. Rapidly changing material prices and exchange rates raise the risk that the survey outcomes may become outdated relatively quickly. The survey may also have a spatial limitation. Most of the numerical data (primarily costs of materials and energy carriers) come from the Polish market and is representative of the region of Central Europe. Moreover, the selected group of people carrying out the experiments represented relatively high environmental awareness. It is important to be aware that other social groups might obtain different measurement results. However, in the case of older generations, potentially lower ecological awareness could be compensated for by water and energy saving habits developed in times of lower economic well-being.
4. Conclusions
The main objective of this study was to specify the effect of the application of particular heat sources on the total cost of preparing glass and plastic packaging for selective collection. The analysis required the determination of the cost of washing post-consumer food packaging and the economic value of the material recovered. The results of the survey were also compared with corresponding results obtained in 2012. General tendencies were observed: over the last ten years, the total value of recyclable material has dropped while the cost of washing has increased. The changes were distinct, but the specific differences depended on the packaging material and washing pattern. In the case of glass packaging, the proportion of data indicating profitability decreased from 48% to 20%, and for plastic packaging, it decreased from 16% to 8%. On average, the pre-treatment of waste food packaging turned out to be unjustified from an economic point of view. However, it was noted that profitability in particular cases was strongly dependent on hot water consumption. Thus, a general conclusion might be drawn: excluding hot water use would considerably improve the process’s profitability. Since the heating energy was identified as the most relevant factor affecting the economic balance, six various solutions for water heating were analyzed in order to find out which of them provided a positive balance of packaging preparation for future recycling. The municipal network that was analyzed in the survey carried out in 2012 turned out to be one of the three most cost-generating solutions (8.9–11.5 m€ on average)—together with electric water heating (10.0–12.9 m€) and the oil boiler (9.4–12.1 m€). The lowest average cost was provided by the gas boiler system (5.9–7.7 m€) and domestic dishwasher (4.4 m€). However, in the case of dishwasher use for cleaning glass and plastic packaging, only 2.4% of cases demonstrated profitability. This proportion is considerably lower than the respective percentage for washing-up by hand, which is 33%, since around half of all experimental points for handwashing involved only cold-water use (without any energy use), whereas using a dishwasher consumes electricity in all cases. Considering the obtained results, washing post-consumer food packaging may be recommended only if a small amount of cold water is used. A relatively low washing cost was also recorded in the case of the system equipped with an air source heat pump (6.2–8.0 m€). Thanks to the use of a renewable energy source, electricity consumption was 2.4 (average coefficient of performance)-times lower compared to the electric water heating system. Despite the reduction in electricity consumption, the total cost of washing exceeded (2.7–4.8) the value of recyclables by several times. The use of renewable energy sources contributes to a reduction in environmental impact, which, however, was not determined in this study.
The identified limitations of the presented study indicate directions for undertaking further research. It would be advisable to conduct analogous analyses using data obtained in other regions of the world. This would allow us to draw more universal conclusions. It would be desirable to perform the survey when the global economic situation is more stable. Moreover, in future research, it is planned that it will involve various social groups representing different ages, educational levels, etc. An important supplement to the economic analyses would be the determination of the environmental impact of individual experiments that consider the various solutions of selective collection systems. The outcomes of the survey based on a life cycle approach would provide a solid basis for substantive recommendations.


