Article

Energy Use of Woody Biomass in Poland: Its Resources and Harvesting Form

by
Marek Wieruszewski
1,*,
Aleksandra Górna
2,
Zygmunt Stanula
2 and
Krzysztof Adamowicz
2
1
Department Mechanical Wood Technology, Faculty of Forestry and Wood Technology, Poznań University of Life Sciences, Wojska Polskiego 28, 60-637 Poznan, Poland
2
Department of Forestry Economics and Technology, Faculty of Forestry and Wood Technology, Poznań University of Life Sciences, Wojska Polskiego 28, 60-637 Poznan, Poland
*
Author to whom correspondence should be addressed.
Energies 2022, 15(18), 6812; https://doi.org/10.3390/en15186812
Submission received: 3 September 2022 / Revised: 13 September 2022 / Accepted: 14 September 2022 / Published: 18 September 2022
(This article belongs to the Special Issue New Trends in Biofuels and Bioenergy for Sustainable Development)

Abstract

:
Currently, woodchips and logging residues form the greatest share of biomass fuels used to generate heat in combined heat and power plants. They are supplied from various regions of the EU. The calorific values of the wood species used as biomass may vary significantly depending on the moisture and composition of the fuel, harvest seasonality, location, and other factors. This article presents the main resources of forest biomass and its characteristic features, as well as the calorific value of woodchips depending on the moisture content. Our research is based on the source data of forest resources from the State Forests National Forest Holding (PGLLP) in Poland. The research conducted by the main forestry enterprise in Poland covered a period of four years. The data on the harvesting of woodchips and logging residues converted into the calorific values of biomass were based on our research and a review of reference publications. Standard methods were used in the research, which included an analysis of the species and assortment structure of the forest biomass of energetic significance that was available for use. The research showed that the moisture content of the woodchips and lump wood was about 30%. The average annual energy value of the wood in the total area of forest resources was 0.07 GJ/ha, whereas the highest value was 0.14 GJ/ha. Between 2018 and 2021, the average energy resources of forest biomass in Poland increased from 351.8 TJ to 498.4 TJ.

1. Introduction

The use of renewable energy sources (e.g., woody biomass), which are by definition carbon-neutral, may significantly reduce greenhouse gas emissions. Forest products can provide substitutes for fossil fuels [1,2]. In the context of climate change, plant sinks of greenhouse gases may play an essential role in removing carbon from the atmosphere through the appropriate management of forest crops [3,4,5,6,7]. The demand for bioenergy is increasing as a result of efforts to reduce the negative influence of humans on the environment and due to the increasing energy problems in the modern world. Biomass, as a renewable source, is an important element of sustainable development. It is viewed as socially attractive in the EU member states because, in contrast to most types of fossil fuels, it can reduce air pollution and greenhouse gas emissions [8,9,10,11,12,13,14].
The promotion of the advantages and possibilities of using renewable energy sources (RES) in Poland and other member states of the European Union (EU) has led to a significant increase in the number of power plants using biomass, especially woody biomass. Globally, the share of biomass currently amounts to 8–15% of the final consumption of thermal energy, electricity production and transport [8,15,16,17,18,19,20,21,22], whereas in the EU, this share is 16% [23]. In addition, according to the National Renewable Energy Action Plans (NREAPs) of the EU member states, biomass production is predicted to increase by almost 37% by 2020 [24], whereas by 2050, the share of energy produced from biomass in the total primary energy production worldwide will range from 33% to 50% [16,22,24,25].
In an attempt to mitigate the effects of climate change, the world’s governments are looking for methods to facilitate the adoption of policies and action plans to reduce CO2 emissions, such as the international Paris Agreement, the European Union (EU) Climate Pact, the European Green Deal, and the UN Climate Change Conference (COP26) [26,27,28].
The global increase in the amount of harvested biomass is estimated at 112–220 billion tonnes annually [24,25,26,27,28,29,30,31]. However, the annual global production of biomass which can be used for energy production is estimated at about 3 billion tonnes of forest biomass [15], 1.1–3.1 billion tonnes of agricultural biomass and its residues [15,32,33], and about 1.1 billion tonnes of municipal waste [24].
As far as the use of global and European woody biomass resources is concerned, it is important to take not only the total efficiency of forest resources into account, but also the composition of the biomass with respect to different energy conversion technologies [34,35]. Woody biomass is characterised by a higher content of lignin and a lower content of cellulose and hemicelluloses, which results in a higher energy value. Due to these features, woody biomass is preferred for energy combustion [36,37,38,39].
In most European countries, a large amount of woody biomass (forest residues) can be used to produce heat and electricity. It can also provide a raw material for a wide range of products, including biofuels, cellulose fibre, wood-based panels and, ultimately, other energy resources [15,40,41,42,43,44,45].
Woodchips obtained from the woody residues of softwood species are used as a solid biofuel by heating plants, as well as combined heat and power plants. Low-quality forest products and residues provide one of the sources of biomass for energy purposes [46,47,48]. Currently, about two-thirds of softwood pellets are used for individual and industrial purposes in Europe. A similar share of pellets produced in North America (Canada and the US) is distributed to Europe and Asia [49].
In order to use woody biomass as a renewable energy source, it is necessary to sort it properly [29,50]. The quality requirements for woody biofuels are regulated by international standards, which define the quality of solid biomass as a fuel. In 2014, ISO 17225-1 [51] and ISO 17225-4 [52,53,54] were introduced. These standards define the sources of origin and the size of biomass particles [55]. ISO 17225-1 describes the possible sources of forest biomass, because its origin affects the final quality of the biofuel [51,56,57]. Log debris consists of treetops and branches, as well as low-quality, small-size round wood. There are five subclasses of log debris:
  • Fresh/green broad-leaved (including leaves);
  • Fresh/green coniferous (including needles);
  • Stored broad-leaved;
  • Stored coniferous;
  • Blends and mixes.
There are also quality classes for non-industrial applications that proceed in the following order: A1, A2, B1, and B2 [55], whereby chips from logging residues are classified as A1 or A2. The highest quality is characterised, above all, by the lowest moisture content and the lowest number of mineral impurities.
It is usually difficult to use forest biomass directly for energy purposes due to its form and large variety of assortments. All stages of the production of this fuel, i.e., logging, storage and preparation for effective combustion, are important for the rational management of biomass. It is necessary to apply a pre-treatment, i.e., chipping [58,59,60,61,62]. Optimal grinding and stacking ensure the best properties of the woodchips, and the storage period is also important for preventing the deterioration of the biomass quality [63,64,65,66,67,68]. Due to the growing demand for bioenergy in the winter months, it is necessary to store woody fuels, especially woodchips [69,70]. The long-term storage of forest biomass before its use for energy leads to various changes in its structure. The physicochemical and biological degradation of biomass during storage decreases its energy value [16,17,18]. This factor causes the loss of dry matter and decreases the calorific value of biomass [19,20,21]. When forest biomass is stored properly, its moisture content is reduced, and its actual energy value improves [71,72,73,74,75,76,77]. In order to obtain the optimal moisture content (below 30%) and, thus, increase the calorific value of the fuel, before chipping, forest residues should be stored for about 5–7 months in a separate area. The level of material loss during the storage of wet woody biomass is influenced by factors such as ambient temperature, rainfall, the storage area, storage time, moisture content, and the form of the stored biomass [33,78,79,80]. A study on the storage of biomass in the form of woodchips over one year showed that its calorific value decreased by 25–55% as a result of biochemical reactions and moisture adsorption [30,31].
Due to the domestic potential of Poland, biomass is promoted as a fuel for the production of heat and electricity, and actions are implemented to supply this biomaterial [81]. Poland is a country with large forest areas (30% of the area) and has enormous potential for the production of biomass. Currently, the share of biomass in the total potential of renewable energy sources (RES) is 50%, and it is expected to rise to 70% in 2050 [82]. The total energy potential of woody biomass in Poland, which includes residues from forestry and the wood industry, is estimated at 13–16 million m3 [83]. Of 40 million m3 of wood harvested, as much as 35–40% is processed as biomass. About 65% of woody biomass is of industrial origin, whereas the remaining 35% is formed of wood residues from forests [84]. In Poland, some forest residues, such as fatwood and green chips, are still not used for the ‘production’ of renewable biomass for energy purposes.
The aim of this study was to investigate the available potential of forest biomass and its energy potential in Poland. The research aim was to assess the abundance and energy potential of biomass at a defined moisture content during storage. The results of the research can be used to develop our knowledge of forest biomass harvesting and storage. They will also aid in the assessment of its potential influence on the energy security of individual and industrial recipients. Another aim of the study was to compare the calorific values of biomass derived from the basic domestic wood species of industrial significance [84].
Biomass harvesting can secure very large amounts of wood as a renewable resource for energy production in a relatively short period of time [85,86]. This study provides the results of investigations of the calorific value of wood, as well as the index, showing the decrease in its calorific value, which enables wood density and moisture content—the values used in the production of thermal energy. Thus, it is possible to obtain a picture of the biomass energy potential (GJ), defined by the available volume of biomass (m3), which is generated in forestry practices.

2. Materials and Methods

Generally accepted methods of data quantification, processing, presentation, statistical observation, and of summarising and grouping observational materials were used in the study. Indicators of the species structure and productivity in the forest areas under analysis were used in the study.
The following methods of quantitative analysis were used to assess the effectiveness of forest biomass harvesting: statistical observation (recording information on specific resources), the calculation of mean values and dynamics of change, and the summary and grouping of indicators according to specific change traits.
The first step in the analysis of the indicators was to take the absolute values of the forest biomass resources into account. These values are the basic indicators used for the harvest calculation, and they are used to calculate the potential mean values and relative energy abundance of forests.
The following assortments were distinguished:
  • Poles (M1)—minimum length 1.5 m, maximum curvature 15 cm/m;
  • Round wood (S3A)—rot unacceptable, diameter measured using the bark, 7–11 cm at 1 m from the thicker end;
  • Residual wood (M2E),
  • Medium-sized firewood (S4)—acceptable soft rot of up to 50%, minimum upper diameter without bark 5 cm;
  • Industrial S2AP assortments—acceptable rot of up to 50%.
These assortments also need to meet the requirements for energy wood according to the definition given in the Directive of the European Parliament and the Council of the European Union 2018/2001 of 11 December 2018, as a source of renewable energy (Renewable Energy Directive, RED II) [87].
The aim of the study was to use a system of analytical indicators which comprehensively characterise the production and energy activities of forests, analyse the causes of the changes in these indicators, and identify and measure the cause-and-effect relationships between them.
Data on wood production were collected from national forest bases, statistical yearbooks, and databases, and by contacting national experts from 17 administrative units of the PGLLP between 2018 and 2021. The compiled statistics were in line with the national definitions. The data on wood production were harmonised by calculating the share of the volume of harvested forest biomass in each administrative unit in relation to the total wood production in Poland. These shares were calculated as the mean values for the individual years for which regional data were available.
Then, these shares were multiplied using the harvesting data available at the national level. This calculation was based on data on annual round wood production (m3) from the Central Statistical Office [88,89,
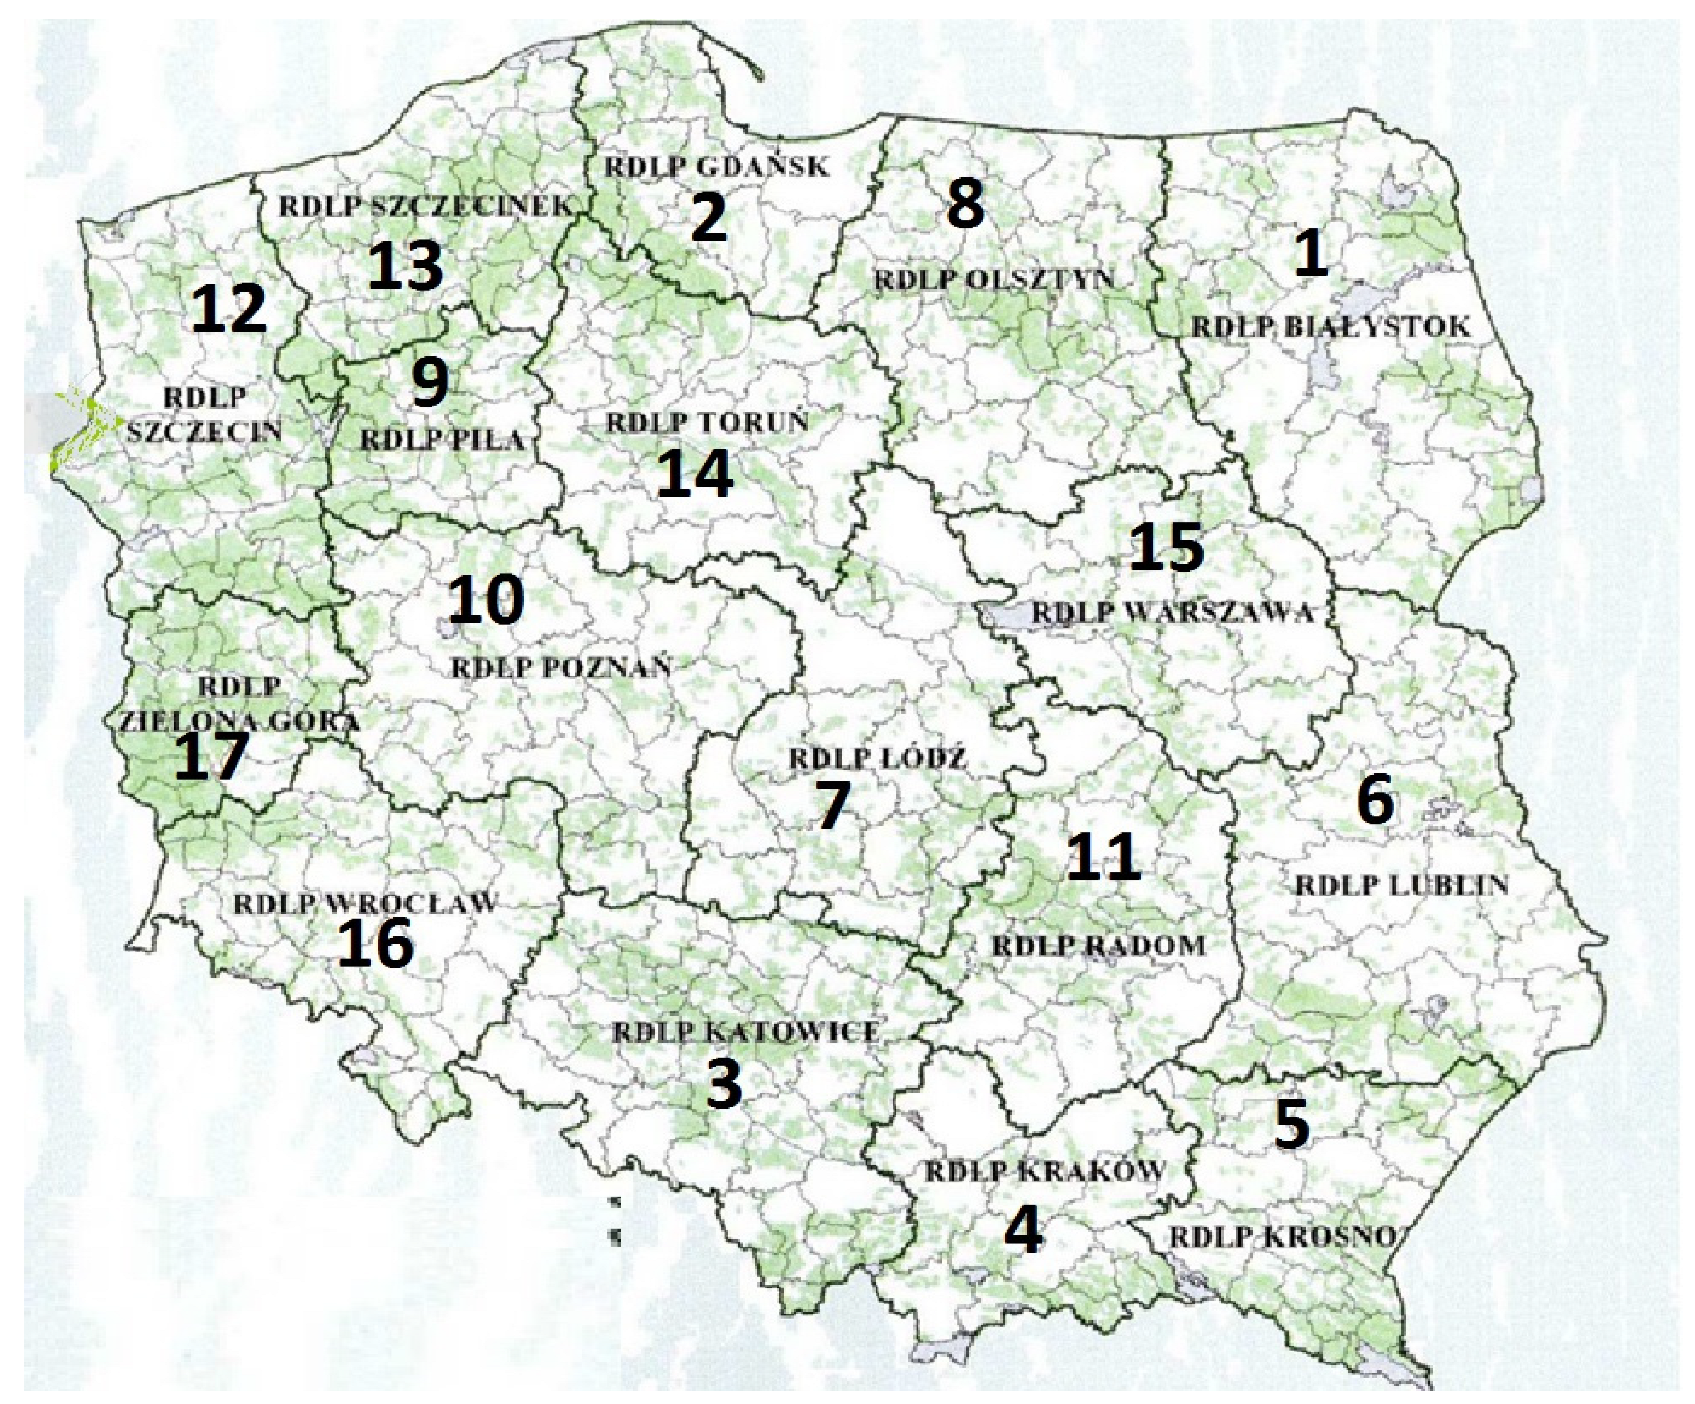
90], because these data are presented in accordance with harmonised definitions, and such data were available for each year in the period under analysis. In order to use these data for statistical analysis, the amount of timber harvested was divided by the forest area in each region (Figure 1). In order to define the problems resulting from differences in the availability of energy biomass in the national units, the share of each unit in the energy abundance of a given Regional Directorate of State Forests (RDSF) was calculated and divided by the forest area in 2021, according to the data from the Central Statistical Office [88] (Table 1). This resulted in a set of maps of harmonised statistics of wood biomass production (GJ/ha/year) at the level of administrative units.

2.1. Location Factors

Scientific publications were reviewed to identify the potential location factors which could affect the probability of forest biomass harvesting in a specific place. The main focus of the review was the identification of forest managers responsible for logging as well as the supply of forest biomass [88,89,90].
In order to match the spatial resolution of our abundance factors with the resolution of the wood production statistics, the mean values of our location factors were calculated for each administrative unit with forest biomass production statistics. For this purpose, the relevant maps of the location factors were multiplied by a fractional map of the forest cover and the share of species (Table 2). A forest map was used to match the forest area statistics available at the regional and national levels.

2.2. Share of Species

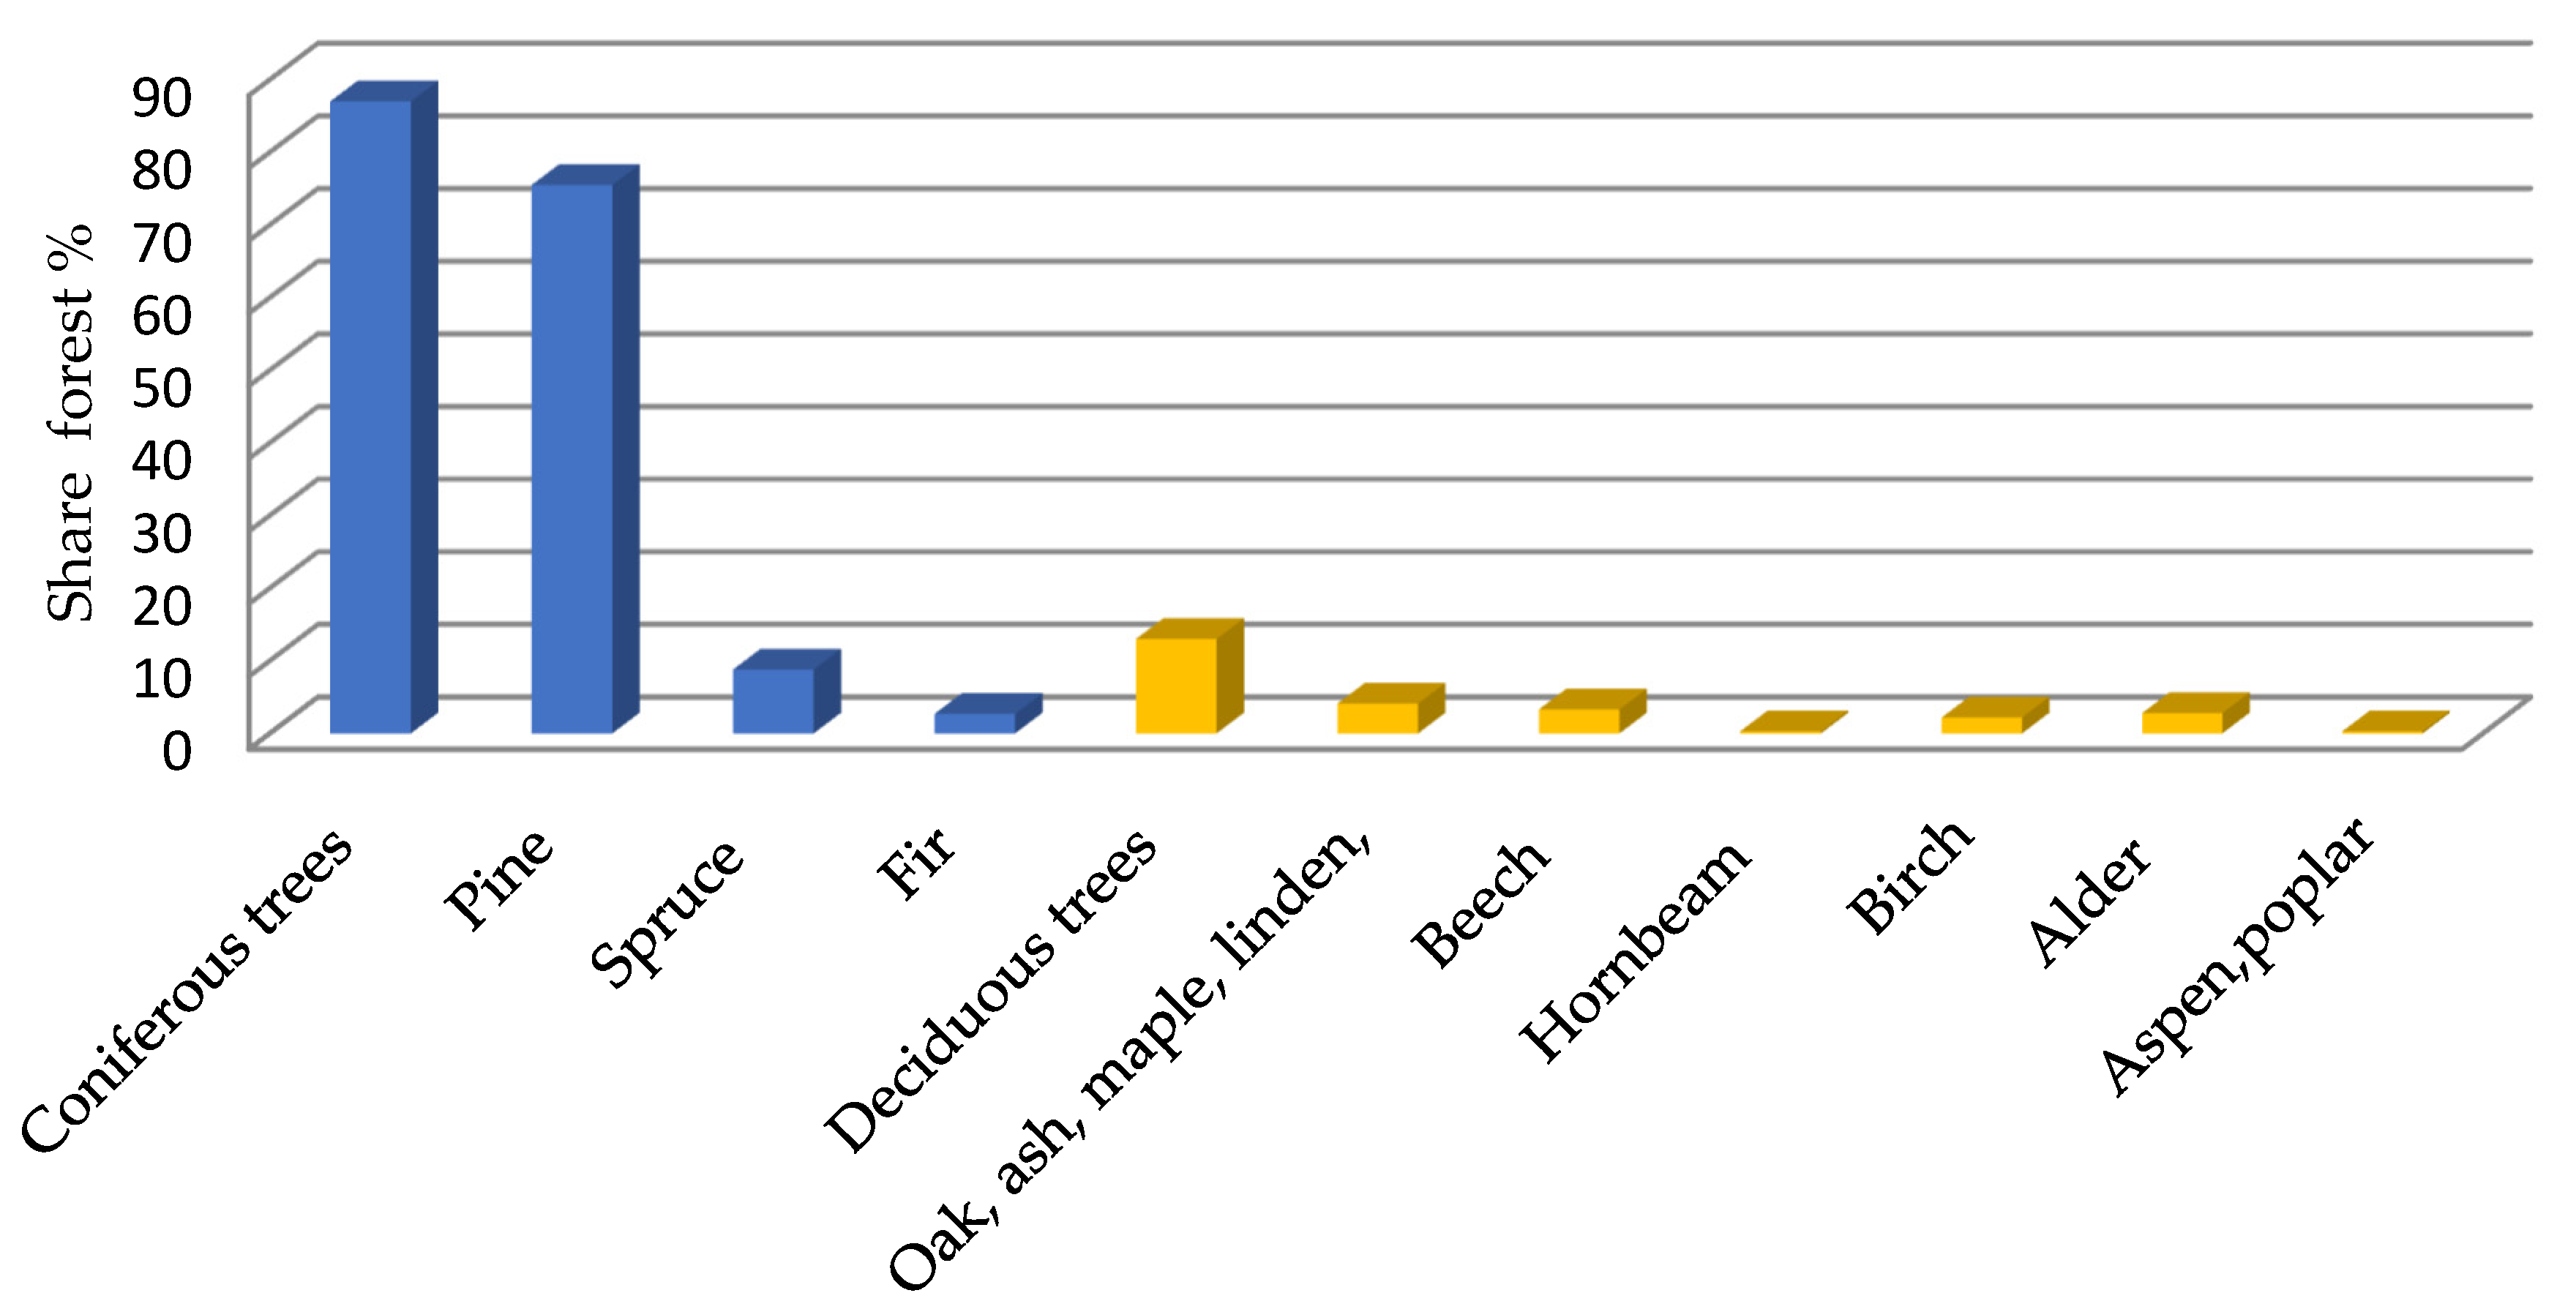
The species structure plays a significant role in wood harvesting (Figure 2). Coniferous trees predominate in the forests in Poland, where pine is the leading species in the production of woody biomass. The share of coniferous species is about 87%.
In practice, it is necessary to determine the share of the harvesting of individual tree species immediately after felling, mainly due to the questions of economic significance and the abundance of biomass separation. Pinewood has the greatest share in the harvesting of individual RDSFs. The share of woody biomass derived from trees of a medium density is increasing. In practice, the structure of forest stands is considered to be a species indicator of the wood harvested (Table 2). A higher energy value of biomass is assumed for coniferous trees of a higher density, and the use of a larger volume of thick wood for industrial purposes is taken into account. As can be seen in Figure 2, pine is the most popular and most common wood species in Poland. Its share amounts to about 65% of the area of wood resources (75% being coniferous trees). The shares of the other tree species are as follows: spruce 8%, fir 4.4%, beech 3%, oak 4%, birch 2%, and other 10.8% (Statistical Yearbook of Forestry 2020).

2.3. Calorific Values Accepted in the Research

According to Gendek and Nurek [91], the calorific value of forest chips with a moisture content of 28–47% is 9–13 MJ/kg, whereas the calorific value of dry matter is about 19–19.5 MJ/kg. Zhao et al. [92] found differences in the calorific value of individual tree elements (trunk wood, branches, and leaves/needles), which ranged from 18.9 to 20.6. MJ/kg. Barontini et al. [93] observed that, after the stacking of coniferous woodchips, their calorific value was about 16 MJ/kg. Density is the factor with a direct influence on the calorific value of wood. According to Šmelko et al. [94], the density of light conifers (spruce, fir) is 370–470 kg/m3, whereas the density of medium-heavy conifers and deciduous species is 510–570 kg/m3. Pretzsch [95] provided similar values, i.e., 377 kg/m3 for poplar, about 380–490 kg/m3 for conifers, 520–560 kg/m3 for hardwood, and up to 650 kg/m3 for acacia. It is not only the density of the wood but also the density of other fractions, such as bark, that significantly affect the calorific value. According to Petráš et al. [96,97,98], the average density of poplar bark is 350–470 kg/m3 and the average density of all three fractions of the four coniferous species (spruce, fir, pine, and spruce) is about 335–550 kg/m3, whereas the density of these fractions of deciduous trees is 380–670 kg/m3.
The calorific value of dry biomass is also known. According to Ellenberg [95], it is 20.34–21.14 MJ/kg for branches and roots of trees with bark. The total energy value of beech trunk, branches, and roots is 19.72–20.10 MJ/kg, whereas the energy value of bark is 20.78–23.13 MJ/kg. Klašnja and Kopitovič [99] found that the energy value of acacia bark was 15.5–19.5 MJ/kg lower than the energy values of its wood. Oszlányi and Biskupski [100] found that the heat of combustion of the wood, bark, and leaves of hornbeam, common maple, oak, and oak bark ranged from 18.12 to 20.65 MJ/kg. According to Pnyakowicz and Dzurenda [101], the heat of combustion of the leaves of several tree species ranged from 16 to 20 MJ/kg. In the experiments conducted by Petráš et al. [102,103], the average values of the heat of combustion of maple and poplar wood and bark ranged from 18.4 to 18.0 MJ/kg, whereas the average calorific value of pine bark was about 1 MJ/kg less. The heat of combustion of biomass also depends on the content of other non-wood substances, such as terpenes and resins. According to Demko [104], the average calorific value of spruce and pine resins ranges from about 38.5 to 38.9 kJ/g. Larcher [105] concluded that woody species are more abundant in energy than herbaceous species due to their higher carbon content. Among plant substances, the highest energy content can be found in lignin, at 26.4 kJ/g, lipids, at 38.9 kJ/g, and terpenes, at up to 46.9 kJ/g. The results of domestic research on the heat of combustion of poplars and maples [106,
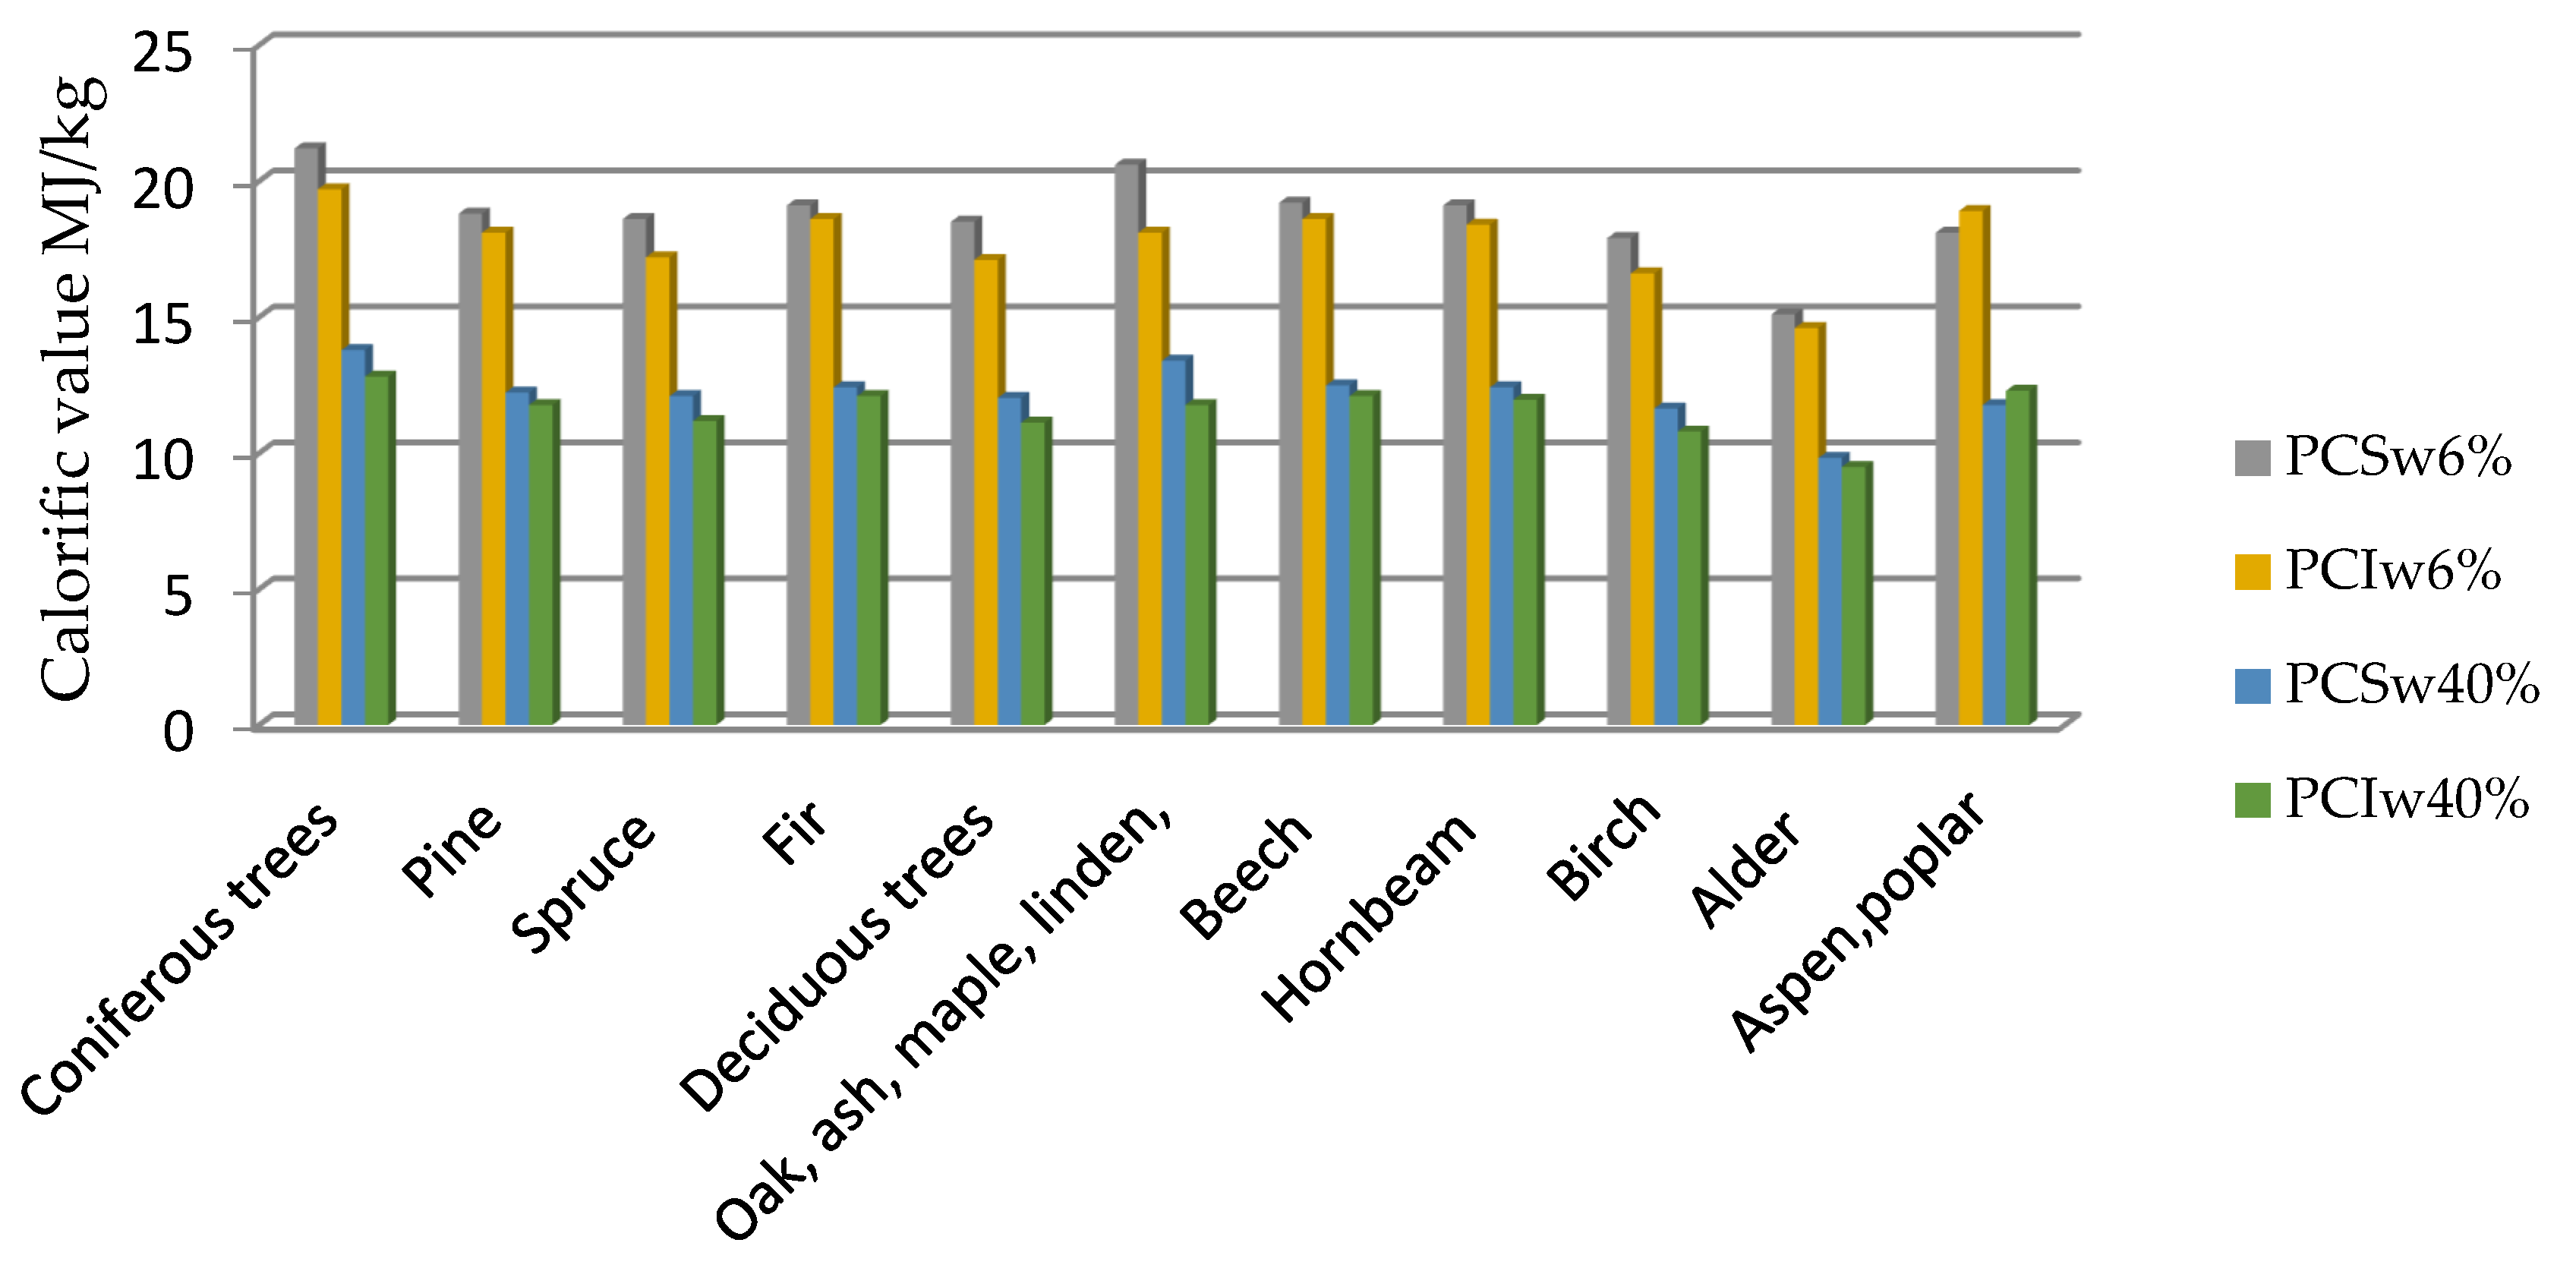
107] were used as the basis for measuring the value of this parameter in 11 other economically important tree species. These experiments have been in progress since 2016. In this way, it is possible to calculate the heat of combustion for whole forest stands, taking the influences of tree species and biomass moisture into account (Figure 3).
The material management and wood harvesting system of the PGLLP includes the felling and pre-felling use of forests. Wood is harvested through renewal, care, and sanitation loggings in accordance with the breeding and protection needs of forest stands. The cubic metre (m3) is the unit used for the calculation of the production of woody biomass. The calorific value of wood of a specific density is calculated by accounting for the wood volume and changes in the moisture content (Table 3). The review of the scientific publications resulted in the assumption that the average moisture content in woody biomass for energy production is 30%, as this is the most common value for woodchips. A moisture content of 30% is an approximate value achieved by the proper storage and seasonal management of energy wood chips. In the literature, the moisture content level depends on both the initial moisture content of the wood raw material and the storage conditions and often reaches values in the range of 25%–55% [36,108,109].

3. Results

The capacity of woody biomass harvesting of forests in Poland refers to the amount of wood assortments destined for chipping and processing into biofuels or for the production of wood materials. This research referred to the Regional Directorates of State Forests (RDSF) in Poland.
Between 2018 and 2021, the total amount of wood biomass harvested in Poland by the State Forests was over 24 million m3. The biomass included both wood intended for potential industrial processing (according to the Wood Quality and Dimension Classification System, raw wood groups M1 and S3A) and the bulk amount intended for processing into energy biomass (according to the Wood Quality and Dimension Classification System, raw wood groups M2, S2AP, S4, and fatwood). In 2019 and 2021, the amount of wood materials harvested for chipping was stabilised (Table 4). Between 2018 and 2019, the resources of this form of biomass increased from 4,570,000 m3 to 6,780,000 m3, i.e., by 148%. In 2021, they fell to 6,481,000 m3, which was 142% of the amount of biomass harvested in 2018. The decrease in this amount was significantly influenced by the separation of the S2P energy resource group according to European directives.
Thin wood M1 (‘small poles’) is a high-value raw material used for industrial needs and energy purposes. As shown in Table 5, the amount of M1 assortment harvested in individual years gradually decreased from 312,000 m3 in 2018 to 167,000 m3 in 2021, which is about 54% of the amount harvested in 2018. This assortment has a high energy value due to its lack of acceptable biological degradations. The greatest share of this wood biomass assortment is harvested in western Poland.
M2E wood (wood logging residue) forms a significant share of the forest biomass used for energy purposes (Table 6). Between 2018 and 2021, the share of this wood in the market increased by almost 100%, i.e., from 427,000 m3 in 2018 to 834,000 m3 in 2021. This increase was caused by the use of this wood for energy biomass processing. This assortment is mostly harvested in central Poland.
Currently, S3A wood (Table 7) is mainly industrially processed, but it is also a potential resource of energy biomass. The amount of these resources did not exceed 83,000 m3 in 2018, and in 2019, 2020, and 2021, it gradually decreased by 28%, 51%, and 56%, respectively, to reach 32,000 m3 in 2021. This class of raw material is not dominant in the forest biomass market. Like M1 biomass, the highest share of this woody biomass assortment is harvested in western Poland.
Fatwood plays the least significant role in energy biomass harvesting (Table 8). According to the PGLLP harvesting data, between 2018 and 2021, the amount of this assortment decreased from about 7200 m3 to 1600 m3 (by 78%). This raw material has untapped potential for further processing as biomass [90].
S4 firewood is the most important group of raw material resources. In 2019, more than 3,740,000 m3 was harvested, but this amount dropped to 2,705,000 m3 in 2021. Most S4 firewood is harvested in central Poland (about 23%) and the least is harvested in the western and south-eastern areas (about 2–3%) (Table 9). The share of the resources of this firewood exceeds 50% of the energy biomass produced in Poland. Between 2018 and 2021, its potential gradually decreased due to the larger amount of S2P energy wood harvested, whose share increased by 28%.
S2AP wood is an assortment of significance in regard to energy, which is intended for industrial processing. This is a significant group of raw material resources. In 2019, 2,250,000 m3 was harvested, whereas in 2021, the amount was more than 2,725,000 m3. In 2012, this assortment was separated as a biomass group, and it forms a dominant share of the amount of wood harvested in western and central Poland (Table 10). The resources of this firewood as part of the biomass produced in Poland, including energy biomass, amount to about 40%. Between 2018 and 2021, its potential gradually increased due to the growing amount of post-disaster wood harvested.

Energy Value

As the statistics indicate, between 2018 and 2021, the share of the energy potential of biomass from renewable sources increased significantly in Poland (Table 11). This points to the progressive reorganisation of the possibilities of using forest biomass for energy. The interest in sources of energy that provide an alternative to fossil fuels is increasing due to economic and environmental conditions.
In order to assess the possibilities of using wood harvesting by-products, the calorific value potential of the amount of processed wood with a 30% moisture content was determined. As can be seen in Table 12, the amount of woody biomass harvested and sold in individual years increased steadily. Greater amounts of raw wood were harvested between 2018 and 2021. Initially, this increase amounted to 146% of the potential in 2018, and it stabilised at 142% in 2021. As a result of the work conducted by foresters, who manage the forest species diversity, it was possible to demonstrate the dominant role of pine biomass, whose energy potential was estimated at about 300,000 GJ (equivalent to 64% of the annual energy potential of the forest biomass harvested by the State Forests). As a consequence of this situation, the energy potential of biomass increased to about 500,000 GJ per year.
The energy potentials of forest by-products and woodchips, as well as the estimated energetic significance of individual species, were used to calculate the share of energy which could be generated from biomass combustion (Table 12) in individual RDSFs. The share of individual species in forests in Poland and their calorific values were also used to determine the calorific value of forest biomass. The highest biomass potentials were determined for the Katowice (Kt), Krosno (Ks), and Szczecin (Sn) RDSFs, where the biomass potential increased by 269%, 248%, and 232%, respectively.
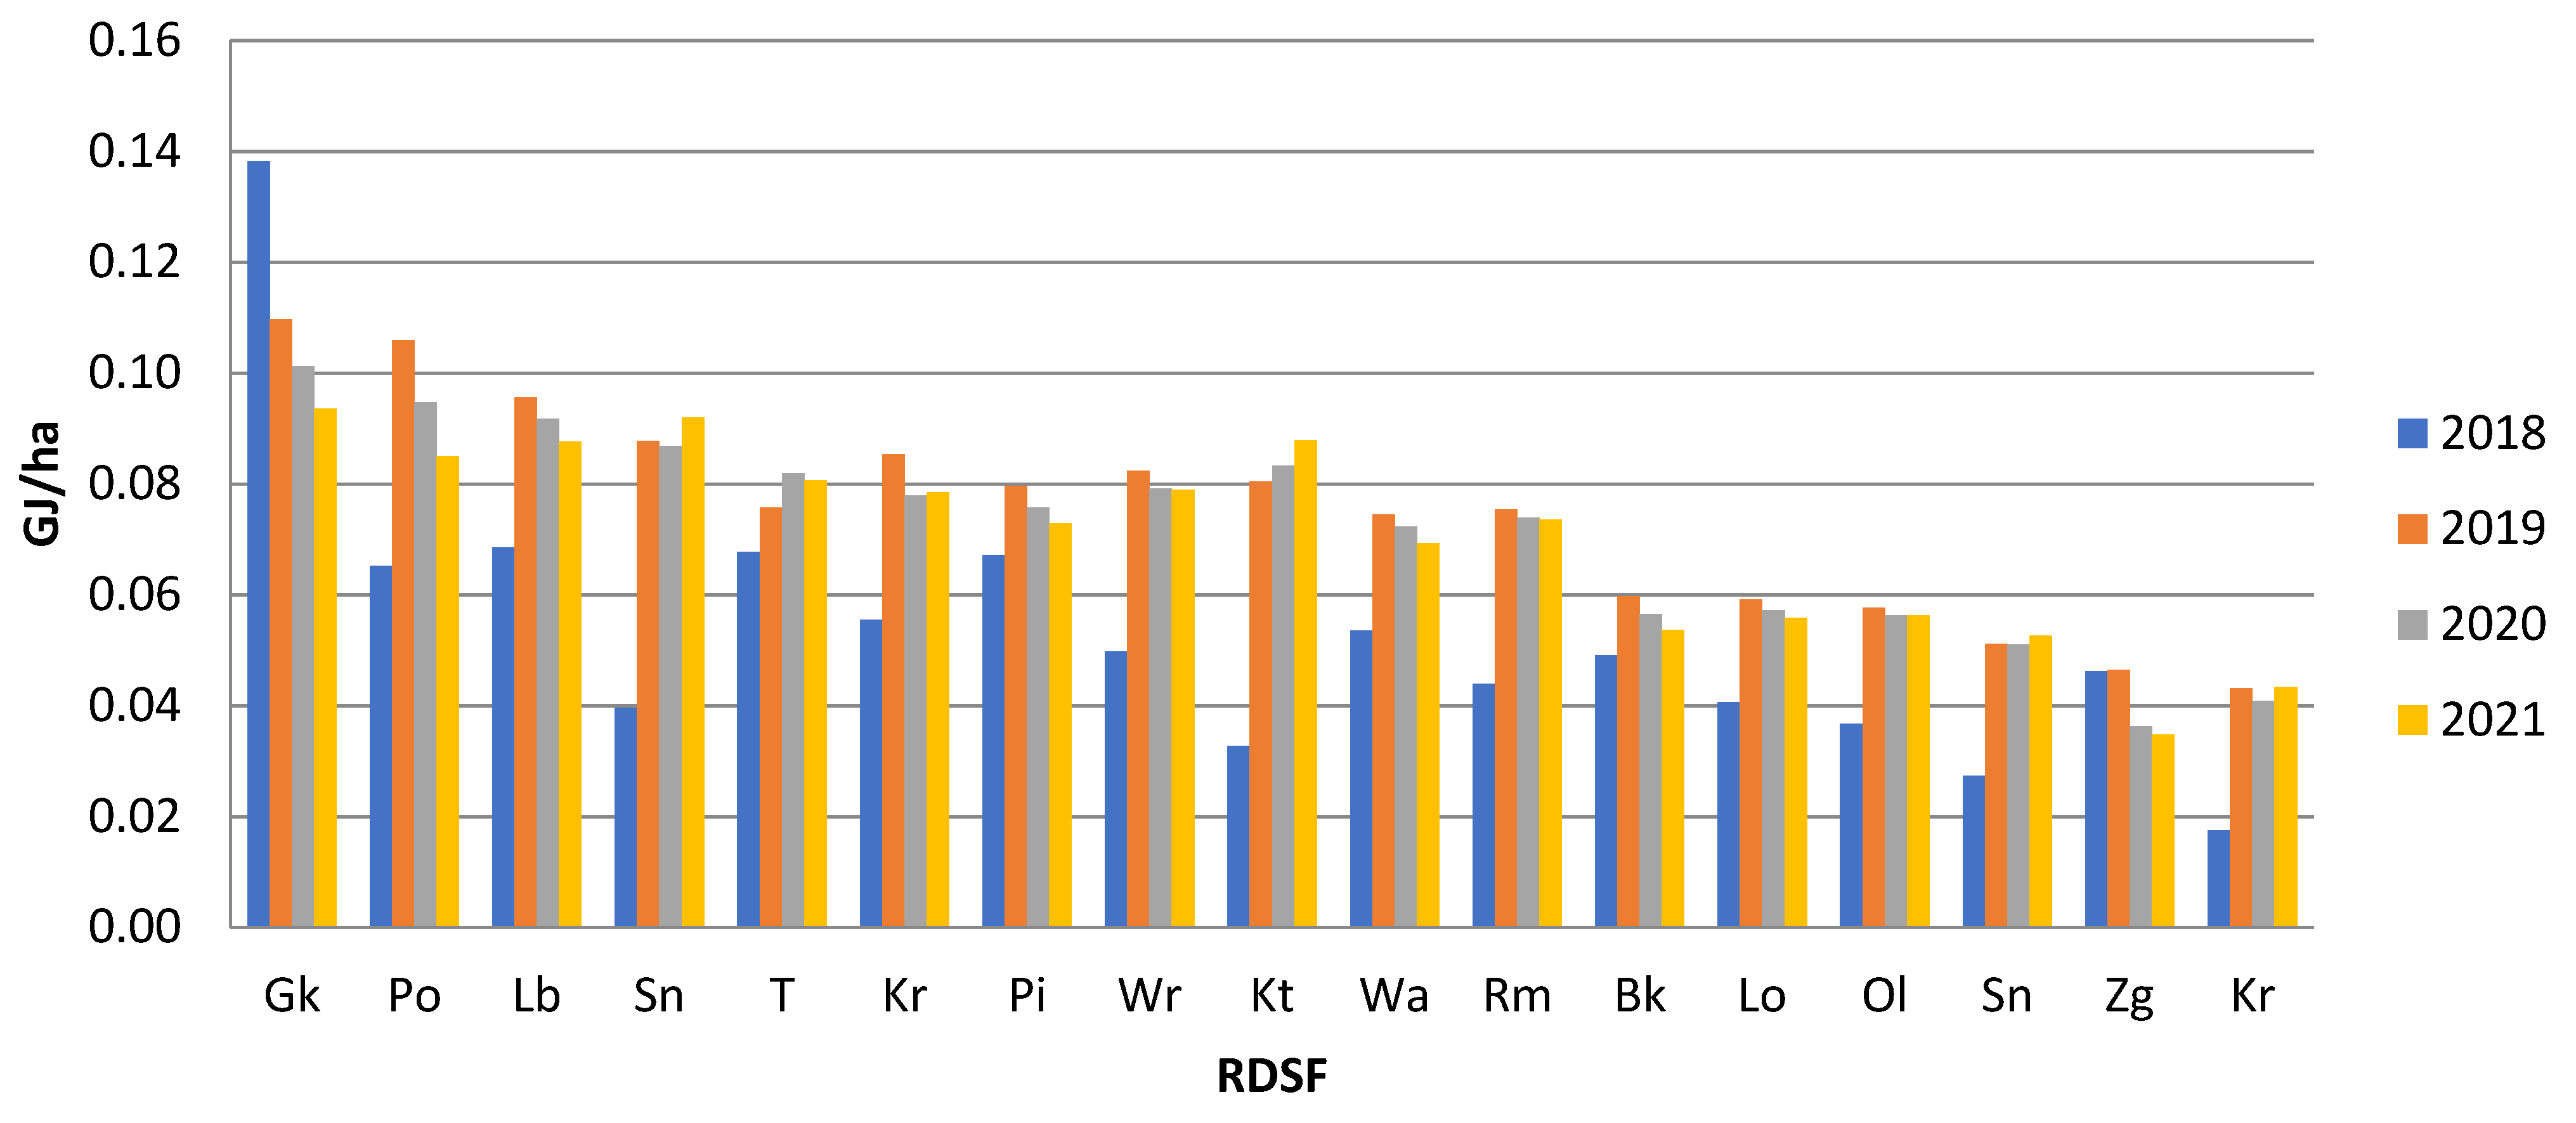
The profitability of the processing of forest wood products depends on various factors, including their quantity, form, and market demand. As can be seen in Figure 4 and Table 1 (surface structure), larger forest areas do not translate into greater possibilities of selling such by-products to, e.g., enterprise manufacturing boards, or converting them into energy material. Smaller business entities (RDSF) usually use wood material directly for energy purposes. Therefore, it is important to determine the demand of individual groups of forest producers for energy. Between 2019 and 2021, the abundance in relation to the average RDSF area stabilised at 0.07 GJ/ha. Assuming a conversion factor of 1 MWh = 3.6 GJ, the calorific value of the available biomass in 2018, 2019, 2020, and 2021 amounted to 97,716 MWh, 144,860 MWh, 139,738 MWh, and 138,438 MWh, respectively.

4. Discussion

Forest biomass mostly consists of low-quality wood produced during forestry works, damaged wood, dead wood, post-disaster wood, and fatwood. Renewable raw materials which are not suitable for the wood industry are mostly used for energy purposes. Between 2018 and 2021, the average amount of wood assortments harvested annually in Polish forests for fragmentation with woody biomass potential was about 6.5 million m3.
The potential of domestic woody biomass is even more important due to the fact that, since 2013, more than 50% of energy woody biomass was imported to Poland from Belarus and Ukraine. However, due to recent geopolitical changes, this trend has ceased. As a result, the availability of biofuels has been significantly reduced.
The high demand for biomass, combined with its shortage, leads to the risk of rising prices and a partial lack of energy security in the market. Consequently, it is possible to make use of the available woody biomass resources which have not been used thus far, including their forest biomass potential [112,113,114,115].
Forest biomass combustion generates net CO2 emissions. This is criticised by environmentalists, who indicate that total emissions of greenhouse gases exceed the capacity of the world’s forests to absorb carbon dioxide. The harvesting of forest biomass reduces the amount of CO2 absorbed by forests but generates space for new afforestation and increases the degree of environmental regeneration [116].
The bioenergy sector in Poland is developing dynamically. By 2020, it reached the level of about 1512 MW. Woody biomass is the main fuel of the Polish bioenergy sector (in 2019, it was about 65%). Throughout the period under analysis, i.e., between 2018 and 2021, the share of bioenergy in the consumption of primary energy from RES systematically decreased. In 2019, it dropped to 81% due to the greater use of solar and wind energy. Between 2018 and 2021, woody biomass formed a considerable share in the consumption of energy among households in Poland, which is estimated at 10–12 million m3 [112,113,114].
Considering the market for woody biomass used for energy purposes should improve the efficiency of the processing of raw materials into wood products and, ultimately, the process of converting it into energy [117,118,119,120].
The economic downturn, which has already begun in Poland, in the European Union, and around the world, creates great opportunities for limiting various market segments, including the market for woody biomass for energy purposes [121,122]. This may be facilitated by developing rules for the harvesting and distribution of biomass within the forest-wood sector and securing the supply of energy in Poland [83,120].
In economic practice, the optimal use of various types of resources of woody biomass for energy-supplying purposes is a significant problem in regard to the development of its market [123]. The use of clean by-products of forestry production to generate energy does not pose a threat. However, it is necessary to ensure the further development of the technology, so that the combustion products emitted into the atmosphere are in a completely oxidised form, with a minimum impact on the environment. The production of valuable fuel from wood biomass usually requires additional costs for its fragmentation and drying to create a form facilitating its combustion or transport (e.g., pellets). Therefore, the availability of biomass and the profitability of the entire process, from biomass harvesting and throughout the supply chain from suppliers to recipients, are decisive factors affecting its use for energy [124,125,126].
The development of renewable energy sources, including the market for woody biomass for energy purposes, is largely determined by economic aspects and active support through legal and financial policies, enabling competition for many renewable biomass technologies in the energy markets [118,119].
The economic downturn, which has already begun in Poland, the European Union, and the world, provides ample opportunity for limiting various market segments, including the market for woody biomass for energy purposes [121,122]. The global biomass supply amounted to 55.6 EJ in 2018. Solid biomass plays an important role in the energy composition [127]. Solid biofuels account for 44.6% of all RES consumed in the European Union and are a major source of clean energy [128].
The type of wood, its storage time, and other conditions affect the calorific value and, thus, the energy efficiency during combustion and, most importantly, the chemical composition of the wood ash formed. In an ash fraction of below 100 µm, a high content of Ca, K, Si, and Fe and potentially toxic elements can be observed. Further research is needed that takes into account the chemical properties of woody biomass and its commercial products as additional criteria for the evaluation of CO2 emissions [129,130].

5. Conclusions

This research was based on a review of scientific publications. It discussed the abundance of renewable energy resources of forest origin, adjusted according to the EU objectives concerning renewable energy and environmental protection.
Due to the increasing degree of forest management and the technological development of wood processing, there have been changes in the use of by-products, which are a valuable source of energy biomass.
Coniferous species have dominant influences on the harvesting of woody biomass resources. Forest habitats and mixed forests, where these species occur most frequently, play a significant role in woody biomass harvesting.
Both the demand for, and supply of, forest biomass for bioenergy purposes have increased noticeably. Biomass scarcity may result in the further transformation of weaker habitats into production land and lead to an intensified search for alternatives to this form of energy that are generated from renewable materials. On the other hand, the increased demand for biomass also creates opportunities for increasing biodiversity, both in existing production sites and in brownfield lands. Long-term breeding may result in greater diversity in the structure of forest crops, a lower consumption of resources, and greater structural diversity of the natural landscape, which may have positive influences on biodiversity.
It is possible to collect primary wood residues from production forests. The removal of these forest residues, under strictly defined conditions of sustainable development, may become economically attractive if there is an increased demand for biomass.
Additional biomass potential can be found in fatwood, as well as trees in the areas which are not otherwise used because they have been abandoned, polluted, or degraded.
Whether the use of forest biomass has a positive or negative effect on biodiversity largely depends on specific regional conditions, the type of biomass, changes in the use of wood residues, and general biomass management practices. However, it is certain that, in the future, the types of plantations and biomass harvested in Poland will be more sustainable than other forest areas covered by the European Green Deal policy.

Author Contributions

Conceptualisation, M.W. and K.A.; methodology, M.W.; software, A.G.; validation, K.A., Z.S., and A.G.; formal analysis, M.W.; investigation, M.W.; resources, Z.S.; data curation, A.G.; writing—original draft preparation, M.W.; writing—review and editing, K.A.; visualisation, M.W.; supervision, K.A.; project administration, K.A.; and funding acquisition, K.A. All authors have read and agreed to the published version of the manuscript.

Funding

The publication was co-financed within the framework of the Ministry of Science and Higher Education program, “Regional Initiative Excellence”, from the years 2019–2022, project No. 005/RID/2018/19.

Institutional Review Board Statement

Not applicable.

Informed Consent Statement

Not applicable.

Data Availability Statement

The data are contained within the article.

Conflicts of Interest

The authors declare no conflict of interest.

References

  1. Mandley, S.J.; Daioglou, V.; Junginger, H.M.; van Vuuren, D.P.; Wicke, B. EU bioenergy development to 2050. Renew. Sustain. Energy Rev. 2020, 127, 109858. [Google Scholar] [CrossRef]
  2. Rajabi Hamedani, S.; Colantoni, A.; Gallucci, F.; Salerno, M.; Silvestri, C.; Villarini, M. Comparative energy and environmental analysis of agro-pellet production from orchard woody biomass. Biomass Bioenergy 2019, 129, 105334. [Google Scholar] [CrossRef]
  3. Lamers, P.; Thiffault, E.; Paré, D.; Junginger, M. Feedstock specific environmental risk levels related to biomass extraction for energy from boreal and temperate forests. Biomass Bioenergy 2013, 55, 212–226. [Google Scholar] [CrossRef]
  4. Lauri, P.; Havlík, P.; Kindermann, G.; Forsell, N.; Böttcher, H.; Obersteiner, M. Woody biomass energy potential in 2050. Energy Policy 2014, 66, 19–31. [Google Scholar] [CrossRef]
  5. Liu, L.; Ni, J.; Zhong, Q.; Hu, G.; Zhang, Z. High Mortality and Low Net Change in Live Woody Biomass of Karst Evergreen and Deciduous Broad-Leaved Mixed Forest in Southwestern China. Forests 2018, 9, 263. [Google Scholar] [CrossRef]
  6. Murphy, F.; Devlin, G.; McDonnell, K. Forest biomass supply chains in Ireland: A life cycle assessment of GHG emissions and primary energy balances. Appl. Energy 2014, 116, 1–8. [Google Scholar] [CrossRef]
  7. Rafael, S.; Tarelho, L.; Monteiro, A.; Sá, E.; Miranda, A.I.; Borrego, C.; Lopes, M. Impact of forest biomass residues to the energy supply chain on regional air quality. Sci. Total Environ. 2015, 505, 640–648. [Google Scholar] [CrossRef]
  8. Demirbas, A. Potential applications of renewable energy sources, biomass combustion problems in boiler power systems and combustion related environmental issues. Prog. Energy Combust. Sci. 2005, 31, 171–192. [Google Scholar] [CrossRef]
  9. Ahmed, A.; Uddin, G.S.; Sohag, K. Biomass energy, technological progress and the environmental Kuznets curve: Evidence from selected European countries. Biomass Bioenergy 2016, 90, 202–208. [Google Scholar] [CrossRef]
  10. Baral Gautam, Y.; Pelkonen, P.; Halder, P. Perceptions of bioenergy among Nepalese foresters—Survey results and policy implications. Renew. Energy 2013, 57, 533–538. [Google Scholar] [CrossRef]
  11. Perea-Moreno, M.-A.; Samerón-Manzano, E.; Perea-Moreno, A.-J. Biomass as Renewable Energy: Worldwide Research Trends. Sustainability 2019, 11, 863. [Google Scholar] [CrossRef]
  12. Varnagirytė-Kabašinskienė, I.; Lukminė, D.; Mizaras, S.; Beniušienė, L.; Armolaitis, K. Lithuanian forest biomass resources: Legal, economic and ecological aspects of their use and potential. Energ. Sustain. Soc. 2019, 9, 41. [Google Scholar] [CrossRef]
  13. Verkerk, P.J.; Levers, C.; Kuemmerle, T.; Lindner, M.; Valbuena, R.; Verburg, P.H.; Zudin, S. Mapping wood production in European forests. For. Ecol. Manag. 2015, 357, 228–238. [Google Scholar] [CrossRef]
  14. Yemshanov, D.; McKenney, D.W.; Fraleigh, S.; McConkey, B.; Huffman, T.; Smith, S. Cost estimates of post harvest forest biomass supply for Canada. Biomass Bioenergy 2014, 69, 80–94. [Google Scholar] [CrossRef]
  15. Heinimö, J.; Junginger, M. Production and trading of biomass for energy—An overview of the global status. Biomass Bioenergy 2009, 33, 1310–1320. [Google Scholar] [CrossRef]
  16. Williams, A.; Jones, J.M.; Ma, L.; Pourkashanian, M. Pollutants from the combustion of solid biomass fuels. Prog. Energy Combust. Sci. 2012, 38, 113–137. [Google Scholar] [CrossRef]
  17. Umamaheswaran, K.; Batra, V.S. Physico-chemical characterisation of Indian biomass ashes. Fuel 2018, 87, 628–638. [Google Scholar] [CrossRef]
  18. Van Loo, S.; Koppejan, J. The Handbook of Biomass Combustion and Co-Firing, 2nd ed.; Earthscan: London, UK, 2012. [Google Scholar] [CrossRef]
  19. Khan, A.A.; de Jong, W.; Jansens, P.J.; Spliethoff, H. Biomass combustion in fluidized bed boilers: Potential problems and remedies. Fuel Processing Technol. 2009, 90, 21–50. [Google Scholar] [CrossRef]
  20. Zhang, L.; Champagne, P.; Xu, C. Overview of recent advances in thermo-chemical conversion of biomass. Energy Convers. Manag. 2010, 51, 969–982. [Google Scholar] [CrossRef]
  21. Saidur, R.; Abdelaziz, E.A.; Demirbas, A.; Hossain, M.S.; Mekhilef, S. A review on biomass as a fuel for boilers. Renew. Sustain. Energy Rev. 2011, 15, 2262–2289. [Google Scholar] [CrossRef]
  22. Andrea Jordan, C.; Akay, G. Speciation and distribution of alkali, alkali earth metals and major ash forming elements during gasification of fuel cane bagasse. Fuel 2012, 91, 253–263. [Google Scholar] [CrossRef]
  23. Calderón, C.; Gauthier, G.; Jossart, J.M. AEBIOM Statistical Report—European Bioenergy Outlook; AEBIOM: Brussels, Belgium, 2016; Available online: https://www.google.com/url?sa=t&rct=j&q=&esrc=s&source=web&cd=&cad=rja&uact=8&ved=2ahUKEwjonKbPr5r6AhUo-yoKHdAqDD0QtwJ6BAgDEAI&url=https%3A%2F%2Fwww.youtube.com%2Fwatch%3Fv%3DnfBvuzCyn8U&usg=AOvVaw1j_EbI-BsBvZsUJqKEQh6H (accessed on 21 July 2022).
  24. Demirbaş, A. Biomass resource facilities and biomass conversion processing for fuels and chemicals. Energy Convers. Manag. 2001, 42, 1357–1378. [Google Scholar] [CrossRef]
  25. McKendry, P. Energy production from biomass (part 1): Overview of biomass. Bioresour. Technol. 2002, 83, 37–46. [Google Scholar] [CrossRef]
  26. Maris, G.; Flouros, F. The Green Deal, National Energy and Climate Plans in Europe: Member States’ Compliance and Strategies. Adm. Sci. 2021, 11, 75. [Google Scholar] [CrossRef]
  27. Jose, D.; Kitiborwornkul, N.; Sriariyanun, M.; Keerthi, K. A Review on Chemical Pretreatment Methods of Lignocellulosic Biomass: Recent Advances and Progress. Appl. Sci. Eng. Prog. 2022, 15, 6210. [Google Scholar] [CrossRef]
  28. Gundupalli, M.P.; Sriariyanun, M. Recent Trends and Updates for Chemical Pretreatment of Lignocellulosic Biomass. Appl. Sci. Eng. Prog. 2022, 16, 5842. [Google Scholar] [CrossRef]
  29. Naik, S.; Goud, V.V.; Rout, P.K.; Jacobson, K.; Dalai, A.K. Characterization of Canadian biomass for alternative renewable biofuel. Renew. Energy 2010, 35, 1624–1631. [Google Scholar] [CrossRef]
  30. Tamaki, Y.; Mazza, G. Measurement of structural carbohydrates, lignins, and micro-components of straw and shives: Effects of extractives, particle size and crop species. Ind. Crops Prod. 2010, 31, 534–541. [Google Scholar] [CrossRef]
  31. Zumerchik, J. Macmillan Encyclopedia of Energy; Macmillan Reference USA: New York, NY, USA, 2001. [Google Scholar]
  32. Werther, J.; Saenger, M.; Hartge, E.U.; Ogada, T.; Siagi, Z. Combustion of agricultural residues. Prog. Energy Combust. Sci. 2000, 26, 1–27. [Google Scholar] [CrossRef]
  33. Abbasi, T.; Abbasi, S.A. Biomass energy and the environmental impacts associated with its production and utilization. Renew. Sustain. Energy Rev. 2010, 14, 919–937. [Google Scholar] [CrossRef]
  34. Malico, I.; Nepomuceno Pereira, R.; Gonçalves, A.C.; Sousa, A.M.O. Current status and future perspectives for energy production from solid biomass in the European industry. Renew. Sustain. Energy Rev. 2019, 112, 960–977. [Google Scholar] [CrossRef]
  35. Verkerk, P.J.; Anttila, P.; Eggers, J.; Lindner, M.; Asikainen, A. The realisable potential supply of woody biomass from forests in the European Union. For. Ecol. Manag. 2011, 261, 2007–2015. [Google Scholar] [CrossRef]
  36. Jåstad, E.O.; Bolkesjø, T.F.; Trømborg, E.; Rørstad, P.K. Large-scale forest-based biofuel production in the Nordic forest sector: Effects on the economics of forestry and forest industries. Energy Convers. Manag. 2019, 184, 374–388. [Google Scholar] [CrossRef]
  37. Mudryk, K.; Jewiarz, M.; Wróbel, M.; Niemiec, M.; Dyjakon, A. Evaluation of Urban Tree Leaf Biomass-Potential, Physico-Mechanical and Chemical Parameters of Raw Material and Solid Biofuel. Energies 2021, 14, 818. [Google Scholar] [CrossRef]
  38. Nicholls, D.L.; Halbrook, J.M.; Benedum, M.E.; Han, H.-S.; Lowell, E.C.; Becker, D.R.; Barbour, R.J. Socioeconomic Constraints to Biomass Removal from Forest Lands for Fire Risk Reduction in the Western U.S. Forests 2018, 9, 264. [Google Scholar] [CrossRef]
  39. Paletto, A.; Bernardi, S.; Pieratti, E.; Teston, F.; Romagnoli, M. Assessment of environmental impact of biomass power plants to increase the social acceptance of renewable energy technologies. Heliyon 2019, 5, e02070. [Google Scholar] [CrossRef]
  40. Beringer, T.I.M.; Lucht, W.; Schaphoff, S. Bioenergy production potential of global biomass plantations under environmental and agricultural constraints. GCB Bioenergy 2011, 3, 299–312. [Google Scholar] [CrossRef]
  41. Burg, V.; Bowman, G.; Erni, M.; Lemm, R.; Thees, O. Analyzing the potential of domestic biomass resources for the energy transition in Switzerland. Biomass Bioenergy 2018, 111, 60–69. [Google Scholar] [CrossRef]
  42. Gruenewald, H.; Brandt, B.K.V.; Schneider, B.U.; Bens, O.; Kendzia, G.; Hüttl, R.F. Agroforestry systems for the production of woody biomass for energy transformation purposes. Ecol. Eng. 2007, 29, 319–328. [Google Scholar] [CrossRef]
  43. Proskurina, S.; Junginger, M.; Heinimö, J.; Tekinel, B.; Vakkilainen, E. Global biomass trade for energy—Part 2: Production and trade streams of wood pellets, liquid biofuels, charcoal, industrial roundwood and emerging energy biomass. Biofuels. Bioprod. Biorefining 2018, 13, 371–387. [Google Scholar] [CrossRef]
  44. Pedroli, B.; Elbersen, B.; Frederiksen, P.; Grandin, U.; Heikkilä, R.; Krogh, P.H.; Spijker, J. Is energy cropping in Europe compatible with biodiversity?—Opportunities and threats to biodiversity from land-based production of biomass for bioenergy purposes. Biomass Bioenergy 2013, 55, 73–86. [Google Scholar] [CrossRef]
  45. Šafařík, D.; Hlaváčková, P.; Michal, J. Potential of Forest Biomass Resources for Renewable Energy Production in the Czech Republic. Energies 2022, 15, 47. [Google Scholar] [CrossRef]
  46. Sántha, E.; Bentsen, N.S. Ecosystem Service Benefits and Trade-Offs—Selecting Tree Species in Denmark for Bioenergy Production. Forests 2020, 11, 277. [Google Scholar] [CrossRef]
  47. Sarmiento, R.; Varela, R. Assessing the Biomass Potential of Major Industrial Tree Plantation Species for Green Energy Production. Open J. For. 2015, 5, 557–562. Available online: https://ssrn.com/abstract=3804291 (accessed on 22 June 2022). [CrossRef]
  48. Torquati, B.; Marino, D.; Venanzi, S.; Porceddu, P.; Chiorri, M. Using tree crop pruning residues for energy purposes: A spatial analysis and an evaluation of the economic and environmental sustainability. Biomass Bioenergy 2016, 95, 124–131. [Google Scholar] [CrossRef]
  49. Francisco Aguilar, H.E. ‘Gene’ Garrett Perspectives of Woody Biomass for Energy: Survey of State Foresters, State Energy Biomass Contacts, and National Council of Forestry Association Executives. J. For. 2009, 107, 297–306. [Google Scholar] [CrossRef]
  50. Barton, G.M. Definition of biomass samples involving wood, bark and foliage. Biomass 1984, 4, 311–314. [Google Scholar] [CrossRef]
  51. ISO 17225-1; Solid Biofuels—Fuel Specifications and Grades—Part 1: General Requirements. ISO: Geneve, Switzerland, 2021.
  52. ISO 17225-4; Solid Biofuels—Fuel Specifications and Grades—Part 4: Wood Chip Grades. ISO: Geneve, Switzerland, 2021.
  53. Obernberger, I.; Supancic, K. Possibilities of ash utilisation from biomass combustion plants. In Proceedings of the 17th European Biomass Conference & Exhibition, Hamburg, Germany, 29 June–3 July 2009; pp. 2373–2384. [Google Scholar]
  54. Biedermann, F.; Obernberger, I. Ash-related Problems during Biomass Combustion and Possibilities for a Sustainable Ash Utilisation, International Conference. In World Renewable Energy Congress (WREC); Elsevier B.V.: Oxford, UK, 2005; pp. 120–124. [Google Scholar]
  55. EN 14961-1:2010; Solid Biofuels, Fuel Specifications and Classes. CEN: Brussels, Belgium, 2010.
  56. Francescato, V.; Antonini, E.; ZuccoliBergomi, L. Priručnik o Gorivima iz Drvene Biomase; Šegon, V., Ed.; Regional Energy Agency of Northwest Croatia: Zagreb, Croatia, 2008; pp. 1–84. [Google Scholar]
  57. Jenkins, B.; Baxter, L.; Miles, T.; Miles, T. Combustion properties of biomass. Fuel Processing Technol. 1998, 54, 17–46. [Google Scholar] [CrossRef]
  58. Spinelli, R.; Magagnotti, N.; Picchi, G. A supply chain evaluation of slash bundling under the conditions of mountain forestry. Biomass Bioenergy 2012, 36, 339–345. [Google Scholar] [CrossRef]
  59. Marques, A.; Rasinmäki, J.; Soares, R.; Amorim, P. Planning woody biomass supply in hot systems under variable chips energy content. Biomass Bioenergy 2018, 108, 265–277. [Google Scholar] [CrossRef]
  60. Moskalik, T.; Gendek, A. Production of Chips from Logging Residues and Their Quality for Energy: A Review of European Literature. Forests 2019, 10, 262. [Google Scholar] [CrossRef]
  61. Obeng, G.Y.; Amoah, D.Y.; Opoku, R.; Sekyere, C.K.K.; Adjei, E.A.; Mensah, E. Coconut Wastes as Bioresource for Sustainable Energy: Quantifying Wastes, Calorific Values and Emissions in Ghana. Energies 2020, 13, 2178. [Google Scholar] [CrossRef]
  62. Pecenka, R.; Lenz, H.; Jekayinfa, S.O.; Hoffmann, T. Influence of Tree Species, Harvesting Method and Storage on Energy Demand and Wood Chip Quality When Chipping Poplar, Willow and Black Locust. Agriculture 2020, 10, 116. [Google Scholar] [CrossRef]
  63. Álvarez-Álvarez, P.; Pizarro, C.; Barrio-Anta, M.; Cámara-Obregón, A.; Bueno, J.L.M.; Álvarez, A.; Gutiérrez, I.; Burslem, D.F.R.P. Evaluation of Tree Species for Biomass Energy Production in Northwest Spain. Forests 2018, 9, 160. [Google Scholar] [CrossRef]
  64. Braghiroli, F.L.; Passarini, L. Valorization of Biomass Residues from Forest Operations and Wood Manufacturing Presents a Wide Range of Sustainable and Innovative Possibilities. Curr. For. Rep. 2020, 6, 172–183. [Google Scholar] [CrossRef]
  65. Esteban, B.; Riba, J.-R.; Baquero, G.; Puig, R.; Rius, A. Environmental assessment of small-scale production of wood chips as a fuel for residential heating boilers. Renew. Energy 2014, 62, 106–115. [Google Scholar] [CrossRef]
  66. Heinimö, J. Methodological aspects on international biofuels trade: International streams and trade of solid and liquid biofuels in Finland. Biomass Bioenergy 2008, 32, 702–716. [Google Scholar] [CrossRef]
  67. Mola-Yudego, B.; Arevalo, J.; Díaz-Yáñez, O.; Dimitriou, I.; Freshwater, E.; Haapala, A.; Selkimäki, M. Reviewing wood biomass potentials for energy in Europe: The role of forests and fast growing plantations. Biofuels 2017, 8, 401–410. [Google Scholar] [CrossRef]
  68. Paulo, H.; Azcue, X.; Barbosa-Póvoa, A.P.; Relvas, S. Supply chain optimization of residual forestry biomass for bioenergy production: The case study of Portugal. Biomass Bioenergy 2015, 83, 245–256. [Google Scholar] [CrossRef]
  69. Schweier, J.; Blagojević, B.; Venanzi, R.; Latterini, F.; Picchio, R. Sustainability Assessment of Alternative Strip Clear Cutting Operations for Wood Chip Production in Renaturalization Management of Pine Stands. Energies 2019, 12, 3306. [Google Scholar] [CrossRef]
  70. Sharma, B.; Ingalls, R.G.; Jones, C.L.; Huhnke, R.L.; Khanchi, A. Scenario optimization modeling approach for design and management of biomass-to-biorefinery supply chain system. Bioresour. Technol. 2013, 150, 163–171. [Google Scholar] [CrossRef] [PubMed]
  71. Elauria, J.C.; Castro, M.L.Y.; Elauria, M.M.; Bhattacharya, S.C.; Abdul Salam, P. Assessment of sustainable energy potential of non-plantation biomass resources in the Philippines. Biomass Bioenergy 2005, 29, 191–198. [Google Scholar] [CrossRef]
  72. Sundstrom, S.; Nielsen-Pincus, M.; Moseley, C.; McCaffery, S. Woody Biomass Use Trends, Barriers, and Strategies: Perspectives of US Forest Service Managers. J. For. 2012, 110, 16–24. [Google Scholar] [CrossRef]
  73. Frombo, F.; Minciardi, R.; Robba, M.; Rosso, F.; Sacile, R. Planning woody biomass logistics for energy production: A strategic decision model. Biomass Bioenergy 2009, 33, 372–383. [Google Scholar] [CrossRef]
  74. Schueler, V.; Weddige, U.; Beringer, T.; Gamba, L.; Lamers, P. Global biomass potentials under sustainability restrictions defined by the European Renewable Energy Directive 2009/28/EC. GCB Bioenergy 2013, 5, 652–663. [Google Scholar] [CrossRef]
  75. Tumuluru, J.S. Specific energy consumption and quality of wood pellets produced using high-moisture lodgepole pine grind in a flat die pellet mill. Chem. Eng. Res. Des. 2016, 110, 82–97. [Google Scholar] [CrossRef]
  76. Sikkema, R.; Proskurina, S.; Banja, M.; Vakkilainen, E. How can solid biomass contribute to the EU’s renewable energy targets in 2020, 2030 and what are the GHG drivers and safeguards in energy- and forestry sectors? Renew. Energy 2020, 165, 758–772. [Google Scholar] [CrossRef]
  77. Sulaiman, C.; Abdul-Rahim, A.S.; Ofozor, C.A. Does wood biomass energy use reduce CO2 emissions in European Union member countries? Evidence from 27 members. J. Clean. Prod. 2020, 253, 119996. [Google Scholar] [CrossRef]
  78. Chowdhury, S.; Mishra, M.; Suganya, O. The incorporation of wood waste ash as a partial cement replacement material for making structural grade concrete: An overview. Ain Shams Eng. J. 2015, 6, 429–437. [Google Scholar] [CrossRef] [Green Version]
  79. Cheah, C.B.; Ramli, M. The implementation of woodwaste ash as a partial cement replacement material in the production of structural grade concrete and mortar: An overview. Resour. Conserv. Recycl. 2011, 55, 669–685. [Google Scholar] [CrossRef]
  80. Jayarathna, L.; Kent, G.; O’Hara, I.; Hobson, P. A Geographical Information System based framework to identify optimal location and size of biomass energy plants using single or multiple biomass types. Appl. Energy 2020, 275, 115398. [Google Scholar] [CrossRef]
  81. Bilgili, F.; Koçak, E.; Bulut, Ü.; Kuşkaya, S. Can biomass energy be an efficient policy tool for sustainable development? Renew. Sustain. Energy Rev. 2017, 71, 830–845. [Google Scholar] [CrossRef]
  82. Gendek, A.; Aniszewska, M.; Chwedoruk, K. Bulk density of forest energy chips. Ann. Warsaw Univ. Life Sci.-SGGW Agric. 2016, 67, 101–111. Available online: https://depot.ceon.pl/bitstream/handle/123456789/11535/afe2016no67p101-111.pdf?sequence=1&isAllowed=y (accessed on 22 June 2022).
  83. Wieruszewski, M.; Górna, A.; Mydlarz, K.; Adamowicz, K. Wood Biomass Resources in Poland Depending on Forest Structure and Industrial Processing of Wood RawMaterial. Energies 2022, 15, 4897. [Google Scholar] [CrossRef]
  84. Grünewald, H.; Böhm, C.; Quinkenstein, A.; Grundmann, P.; Eberts, J.; von Wühlisch, G. Robinia pseudoacacia L.: A Lesser Known Tree Species for Biomass Production. Bioenerg. Res. 2009, 2, 123–133. [Google Scholar] [CrossRef]
  85. Jewiarz, M.; Wróbel, M.; Mudryk, K.; Szufa, S. Impact of the Drying Temperature and Grinding Technique on Biomass Grindability. Energies 2020, 13, 3392. [Google Scholar] [CrossRef]
  86. Koondhar, M.A.; Tan, Z.; Alam, G.M.; Khan, Z.A.; Wang, L.; Kong, R. Bioenergy consumption, carbon emissions, and agricultural bioeconomic growth: A systematic approach to carbon neutrality in China. J. Environ. Manag. 2021, 296, 113242. [Google Scholar] [CrossRef]
  87. Dyrektywy Parlamentu Europejskiego i Rady Unii Europejskiej 2018/2001 z 11 Grudnia 2018 r. Available online: https://eur-lex.europa.eu/legal-content/EN/TXT/PDF/?uri=CELEX:32018L2001&from=PL (accessed on 28 July 2022).
  88. GUS Report on the State of Forests in Poland. 2020. Available online: https://www.bdl.lasy.gov.pl/portal/Media/Default/Publikacje/raport_o_stanie_lasow_2020.pdf (accessed on 27 July 2022).
  89. Statistical Yearbook of Forestry 2021. National Bureau of Statistics of the Republic of Poland. Statistical Yearbook of Forestry; Statistics Poland: Warszawa, Poland, 2021; ISSN 2657-3199.
  90. Statistical Yearbook of Forestry. 2020. Available online: https://stat.gov.pl/download/gfx/portalinformacyjny/pl/defaultaktualnosci/5515/13/3/1/rocznik_statystyczny_lesnictwa_2020.pdf (accessed on 27 July 2022).
  91. Gendek, A.; Nurek, T. Variability of energy woodchips and their economic effects. Folia For. Pol. 2016, 58, 62–71. [Google Scholar] [CrossRef]
  92. Zhao, D.; Kane, M.; Teskey, R.; Markewitz, D.; Greene, D.; Borders, B. Impact of management on nutrients, carbon, and energy in aboveground biomass components of mid-rotation loblolly pine (Pinus taeda L.) plantations. Ann. For. Sci. 2014, 71, 843–851. [Google Scholar] [CrossRef]
  93. Barontini, M.; Scarfone, A.; Spinelli, R.; Gallucci, F.; Santangelo, E.; Acampora, A.; Jirjis, R.; Civitarese, V.; Pari, L. Storage dynamics and fuel quality of poplar chips. Biomass Bioenergy 2014, 62, 17–25. [Google Scholar] [CrossRef]
  94. Šmelko, Š.; Wenk, G.; Antanaitis, V. Rast, Štruktúra a Produkcia Lesa; Príroda: Bratislava, Slovakia, 1992; 342p. [Google Scholar]
  95. Pretzsch, H. Forest Dynamics, Growth and Yield; Springer: Berlin/Heidelberg, Germany, 2009; 664p. [Google Scholar]
  96. Petráš, R.; Mecko, J.; Neuschlová, E. Density of basic components of above-ground biomass of poplar clones. Wood Res. 2010, 55, 113–122. [Google Scholar]
  97. Petráš, R.; Mecko, J.; Krupová, D.; Slamka, M.; Pažitný, A. Aboveground biomass basic density of softwoods tree species. Wood Res. 2019, 64, 205–211. [Google Scholar]
  98. Petráš, R.; Mecko, J.; Krupová, D.; Pažitný, A. Aboveground biomass basic density of hardwoods tree species. Wood Res. 2020, 65, 1001–1012. [Google Scholar] [CrossRef]
  99. Klašnja, B.; Kopitovič, Š. Quality of wood of some willow and Robinia clones as fuelwood. Drevársky Výskum 1999, 44, 9–18. [Google Scholar]
  100. Oszlányi, J.; Biskupský, V. Energetická hodnota nadzemnej biomasy drevín v dubovo-hrabovom lese. Acta Ecol. 1979, 20, 59–105. [Google Scholar]
  101. Pňakovič, Ľ.; Dzurenda, L. Combustion characteristics of fallen fall leaves from ornamental trees in city and forest parks. BioResources 2015, 10, 5563–5572. [Google Scholar] [CrossRef]
  102. Petráš, R.; Mecko, J.; Oszlányi, J.; Petrášová, V.; Jamnická, G. Landscape of Danube inland-delta and its potential of poplar bioenergy production. Biomass Bioenergy 2013, 55, 68–72. [Google Scholar] [CrossRef]
  103. Petráš, R.; Mecko, J.; Petrášová, V. Energy potential in production of fast-growing poplar clones in Slovak regions. Acta Reg. Environ. 2013, 10, 53–56. [Google Scholar] [CrossRef]
  104. Demko, J. Spalné teplo živice ihličnatých drevín. Acta Fac. For. 1996, 38, 261–267. [Google Scholar]
  105. Larcher, W. Physiological Plant Ecology: Ecophysiology and Stress Physiology of Functional Groups; Springer: Berlin/Heidelberg, Germany, 2003; 513p. [Google Scholar]
  106. Dzurenda, L.; Zoliak, M. Chemické zloženie horľaviny energetickej štiepky z dendromasy plantažnicky pestovanej dreviny Populus klon Max 5. Acta Fac. Xylologiae Zvolen 2011, 53, 87–92. [Google Scholar]
  107. Dzurenda, L.; Bartko, M.; Ridzik, L. Energetic characteristics green chips made of branches of wood species Populus × Euroamericana clone Koltay grown on plantations. Acta Fac. Xylologiae Zvolen 2012, 54, 115–122. [Google Scholar]
  108. Jamnická, G.; Petrášová, V.; Petráš, R.; Mecko, J.; Oszlányi, J. Energy production of poplar clones and their energy use efficiency. iForest 2014, 14, 150–155. [Google Scholar] [CrossRef]
  109. Lieskovský, M. Vybrané produkčné a energetické vlastnosti topoľa Populus × Euroamericana klon Max 4. Acta Fac. Xylologiae Zvolen 2015, 57, 127–133. [Google Scholar]
  110. Gendek, A.; Malaťák, J.; Velebil, J. Wpływ technologii pozyskania i składu zrębków leśnych na ich wartość opałową i zawartość popiołu. Sylwan 2018, 162, 248–257. [Google Scholar]
  111. Igliński, B.; Cichosz, M.; Skrzatek, M.; Buczkowski, R. Potencjał techniczny odpadowej biomasy stałej na cele energetyczne w Polsce. Inżynieria Ochr. Sr. 2018, 22, 109–118. [Google Scholar]
  112. Energia ze źródeł odnawialnych w 2019 roku. Renewable Energy 2019. GUS 2019, Warszawa. Available online: https://stat.gov.pl/download/gfx/portalinformacyjny/pl/defaultaktualnosci/5485/10/3/1/energia_ze_zrodel_odnawialnych_w_2019.pdf (accessed on 27 July 2022).
  113. Energia ze źródeł odnawialnych w 2020 roku. Renewable Energy 2020. GUS 2020, Warszawa. Available online: https://stat.gov.pl/download/gfx/portalinformacyjny/pl/defaultaktualnosci/5485/10/4/1/energia_ze_zrodel_odnawialnych_w_2020_r..pdf (accessed on 27 July 2022).
  114. Rocznik Statystyczny Leśnictwa. 2018. Available online: https://stat.gov.pl/obszary-tematyczne/roczniki-statystyczne/roczniki-statystyczne/rocznik-statystyczny-lesnictwa-2018,13,1.html (accessed on 27 July 2022).
  115. Banaś, J.; Utnik-Banaś, K. Using Timber as a Renewable Resource for Energy Production in Sustainable Forest Management. Energies 2022, 15, 2264. [Google Scholar] [CrossRef]
  116. Gu, H.; Bergman, R.; Nathaniel, A.; Sevda, A.R. Life cycle assessment of activated carbon from woody biomass. Wood Fiber Sci. 2018, 50, 229–243. [Google Scholar] [CrossRef]
  117. Long, H.; Li, X.; Wang, H.; Jia, J. Biomass resource and their bioenergy potential estimation: A review. Renew. Sustain. Energy Rev. 2013, 26, 344–352. [Google Scholar] [CrossRef]
  118. Karakosta, C.; Dimopoulou, S.; Doukas, H.; Psarras, J. The potential role of renewable energy in Moldova. Renew. Energy 2011, 36, 3550–3557. [Google Scholar]
  119. Frombo, F.; Minciardi, R.; Robba, M.; Rosso, F.; Sacile, R. A dynamic decision model for the optimal use of forest biomass for energy production. Energy Syst. 2016, 7, 615–635. [Google Scholar] [CrossRef]
  120. Mydlarz, K.; Wieruszewski, M. Economic, Technological as Well as Environmental and Social Aspects of Local Use of Wood By-Products Generated in Sawmills for Energy Purposes. Energies 2022, 15, 1337. [Google Scholar] [CrossRef]
  121. Nikodinoska, N.; Cesaro, L.; Romano, R.; Paletto, A. Sustainability metrics for renewable energy production: Analysis of biomass-based energy plants in Italy. J. Renew. Sustain. Energy 2018, 10, 043104. [Google Scholar] [CrossRef]
  122. Buonocore, E.; Paletto, A.; Russo, G.F.; Franzese, P.P. Indicators of environmental performance to assess wood-based bioenergy production: A case study in Northern Italy. J. Clean. Prod. 2019, 221, 242–248. [Google Scholar] [CrossRef]
  123. De Jong, J.; Akselsson, C.; Egnell, G.; Löfgren, S.; Olsson, B.A. Realizing the energy potential of forest biomass in Sweden – How much is environmentally sustainable? For. Ecol. Manag. 2017, 383, 3–16. [Google Scholar] [CrossRef]
  124. Szostak, A.; Ratajczak, E.; Bidzińska, G.; Gałecka, A. Rynek przemysłowych odpadów drzewnych w Polsce. Drewno-Wood 2004, 47, 172. [Google Scholar]
  125. Hall, J.P. Sustainable production of forest biomass for Energy. For. Chron. 2002, 78, 391–396. [Google Scholar] [CrossRef]
  126. Daian, G.; Ozarska, B. Wood waste management practices and strategies to increase sustainability standards in the Australian wooden furniture manufacturing sector. J. Clean. Prod. 2009, 17, 1594–1602. [Google Scholar] [CrossRef]
  127. Global Bioenergy Statistics. 2020. Available online: https://www.greengrowthknowledge.org/research/global-bioenergy-statistics-2020 (accessed on 12 September 2022).
  128. Stolarski, M.; Niksa, D.; Krzyżaniak, M.; Tworkowski, J.; Szczukowski, S. Willow productivity from small- and large-scale experimental plantations in Poland from 2000 to 2017. Renew. Sustain. Energy Rev. 2019, 101, 461–475. [Google Scholar] [CrossRef]
  129. Jahn, L.G.; Polen, M.J.; Jahl, L.G.; Brubaker, T.A.; Somers, J.; Sullivan, R.C. Biomass combustion produces ice-active minerals in biomass-burning aerosol and bottom ash. Proc. Natl. Acad. Sci. USA 2020, 117, 21928–21937. [Google Scholar] [CrossRef]
  130. Smołka-Danielowska, D.; Jabłońska, M. Chemical and mineral composition of ashes from wood biomass combustion in domestic wood-fired furnaces. Int. J. Environ. Sci. Technol. 2021, 19, 5359–5372. [Google Scholar] [CrossRef]
Figure 1. Separation of the zones of forest managers (RDSF: Regional Directorate of State Forests) in the territory of the country within the PGLLP.
Energies 15 06812 g001
Figure 2. Structure of the basic share of the occurrence of species of forest resources in Poland [88,89,90].
Energies 15 06812 g002
Figure 3. Variability in the calorific value of species on a density scale [109,110,111,112,113,114,115].
Energies 15 06812 g003
Figure 4. Biomass energy potential in relation to the forest area in separate areas of Poland per ha (for a biomass moisture content of 30%). Own elaboration based on the available data.
Energies 15 06812 g004
Table 1. Adopted structure of the designation of forest managers (RDSF) in the territory of Poland [88,89,90].
RDSFBiałystokGdańskKatowiceKrakówKrosnoLublinŁódźOlsztynPiłaPoznańRadomSzczecinSzczecinekToruńWarszawaWrocławZielonaPolska
NR1234567891011121314151617
SymbolBkGkKtKrKsLbLoOlPiPoRmSnSkTWaWrZgPL
Area, thousand ha575.4284.7599.9167.7402.0398.2283.5579.8339.3407.9309.5641.1571.2422.2184.0526.9425.17118.3
Table 2. Adopted structure of the basic share of the occurrence of species in the area of timber resources under the management of RDSF [88,89,90].
Forest Area Managed by Regional Directorates of the State Forests
RDSF pinesprucefirbeechoakhornbeambirchalderaspenpoplar
Share forest%
Bk163.212.5006.02.45.68.30.70
Gk264.02.30154.80.64.93.10.20
Kt361.05.22.17.68.80.45.14.70.20.2
Kr417.23.437.126.97.30.71.11.80.10
Ks529.52.426.225.93.11.82.52.00.40
Lb666.60.61.63.211.22.94.16.51.00.2
Lo778.40.10.71.78.10.83.54.90.20
Ol863.98.305.15.00.77.46.20.60
Pi985.53.101.13.202.53.90.10
Po1072.01.001.114.00.72.65.000.2
Rm1165.00.612.73.98.00.82.12.90.40
Sn1275.32.904.85.80.23.33.90.10.1
Sk1364.86.2011.73.90.57.24.40.30
T1485.80.500.86.00.31.83.20.20
Wa1580.70.30.40.36.40.43.95.10.50
Ww1637.225.40.17.112.20.33.74.20.50
Zg1783.10.801.05.90.22.33.60.50.2
Table 3. Calorific value of wood in GJ depending on the moisture content of the wood species per unit volume [110,111].
Calorific Value of Wood (GJ/m3)
Moisture (%)Oak, BeechBirchPoplarLarchPine AdlerSpruceFirHornbeam
010.839.696.658.747.987.67.011.8
1510.599.476.58.557.87.436.811.5
2010.499.386.448.467.737.366.811.4
2510.379.286.378.377.647.286.711.3
3010.249.176.298.277.557.196.611.2
3510.099.036.28.157.447.086.511.0
409.929.876.0987.316.966.410.8
459.718.695.967.847.166.816.310.6
509.468.475.817.646.976.646.110.3
559.168.195.627.396.756.435.910.0
608.787.855.397.086.476.165.79.6
Table 4. Forest biomass resources by directorate (RDSF) in Poland.
RDSF2018201920202021
* 100%m3%m3%m3%
Bk364,517443,920122419,953115398,868109
Gk505,288401,16979369,97173341,87368
Kt254,894627,630246649,242255685,133269
Kr118,961183,009154167,101140168,372142
Ks91,051224,829247212,935234226,134248
Lb344,508481,019140461,561134440,827128
Lo148,269215,968146208,740141203,538137
Ol275,458432,761157423,041154422,963154
Pi297,970353,102119336,106113323,021108
Po342,581556,984163497,502145446,884130
Rm180,618309,731171303,682168301,964167
Sn333,183738,625222731,203219774,574232
Sk194,939364,798187364,083187375,204192
T373,046416,991112451,025121444,149119
Wa128,787179,159139173,914135166,818130
Ww357,584590,959165567,993159566,499158
Zg258,642260,017101202,93878194,50575
Total PL4,570,2966,780,6721486,540,9921436,481,325142
*—volume of 100% being the reference for the following years.
Table 5. Presentation of the structure of M1w wood biomass from 2018–2021.
RDSFM1 2018M1 2019M1 2020M1 2021
* 100% m3m3%m3%m3%
Bk19941525767533872937
Gk1291121194121994118091
Kt4545111132886327961
Kr185167901457814076
Ks53234321402038
Lb651287442023119530
Lo2803011081846617864
Ol27953193114136749132347
Pi75,86164,2378549,4526547,85263
Po74337754104460362445460
Rm683376555728455381
Sn51,79341,0657927,6105326,71752
Sk26,43323,3718819,7797519,13972
T883010,43711891591048863100
Wa5000000
Ww14,35012,9779010,7477510,39972
Zg119,361106,5558947,2104045,68338
Total PL312,452273,99088173,31155167,70554
M1: “small pole”. Length from 1.5 m. Permissible curvature of 15 cm per 1 m. *—volume of 100% being the reference for the following years.
Table 6. Structure of woody biomass M2 from 2018–2021.
RDSFM2 2018M2 2019M2 2020M2 2021
* 100% m3m3%m3%m3%
Bk62,69372,41111683,30413386,022137
Gk20,30444,50121949,90424651,532254
Kt12,95116,69912936,90228538,106294
Kr0000000
Ks0140803368239 **3478247 **
Lb16,27930,63618846,13428347,639293
Lo675511,52317115,81323416,329242
Ol50,87267,61113372,00314274,352146
Pi15,37635,77623351,78333753,472348
Po59,19580,02213564,39510966,496112
Rm60937876229354153696591586
Sn19,97838,64319333,44216734,533173
Sk28,15160,66021560,63021562,608222
T87,130158,216182205,102235211,793243
Wa18,85531,87116933,79517934,897185
Ww23,60425,40910816,8997217,45074
Zg400210,73426824,82462025,634641
Total PL426,754689,907162807,652189834,000195
M2E: residual wood. ** Percentage increase over 2019. *—volume of 100% being the reference for the following years.
Table 7. Change in the structure of S3 woody biomass from 2018–2021.
RDSFS3 2018S3 2019S3 2020S3 2021
* 100% m3m3%m3%m3%
Bk2158187187116254109551
Gk425371873197530171
Kt80611651454435541752
Kr25311242811226104
Ks2122105189900178848
Lb437524862002345850
Lo54834282782064381 94535
Ol25622186166156
Pi22,82314,5806410,28545969142
Po49000000
Rm0000000
Sn13,88210,79278899265847361
Sk2601209681183471172866
T39486822010932771030261
Wa0000000
Ww8251477058476758449254
Zg25,51218,82374890935839533
Total PL82,69059,8957240,3494938,02046
3A: round wood (poles). Rot, insect infestation, and visible foreign bodies are not permissible. Permissible curvature up to 10 cm per 1 m. Diameter measured on the bark at a distance of 1 m to the thicker end: 7–11 cm. *—volume of 100% being the reference for the following years.
Table 8. Stump wood biomass structure from 2018–2021.
RDSF2018201920202021
* 100% m3m3%m3%m3%
Bk5729991752935110619
Gk468818175239518719
Kt283494175140495118
Kr55110051822925310619
Ks92791398259289410
Lb324491152144445216
Lo351532152156445716
Ol405614152180446616
Pi270409151120444416
Po444742167205467517
Rm296494167137465017
Sn68011721723515212819
Sk454781172234528519
T19233217330916111258
Wa28749917446316116859
Ww47983117377116128159
Zg217374172105483818
Total PL720011,500160440061160022
*—volume of 100% being the reference for the following years.
Table 9. Change in the structure of S4w wood biomass from 2018–2021.
RDSFS4 2018S4 2019S4 2020S4 2021
* 100% m3m3%m3%m3%
Bk297,100290,45098254,10086217,76973
Gk482,800303,80063265,40055227,45447
Kt240,400223,00093207,20086177,57574
Kr118,200102,0008683,0007071,13360
Ks90,05086,2509666,3507456,86363
Lb327,250332,250102291,85089250,12276
Lo135,400130,70097118,60088101,64375
Ol221,130210,59095191,72087164,30874
Pi183,640176,28096159,68087136,84975
Po275,460440,700160399,200145342,123124
Rm179,030178,640100161,12090138,08377
Sn246,850210,20085203,10082174,06171
Sk137,300119,15087115,2508498,77272
T276,500182,00066167,10060143,20852
Wa109,640108,7209999,7609185,49678
Ww310,900308,60099285,00092244,25179
Zg109,55091,0508387,8508075,28969
Total PL3,741,2003,494,380933,156,280842,705,00072
S S4: medium-sized firewood. Soft rot is permissible up to 50%. Minimum top diameter without bark is 5 cm. *—volume of 100% being the reference for the following years.
Table 10. Change in the structure of S4w wood biomass from 2018–2021.
RDLPS2P 2018S2P 2019S2P 2020S2P 2021
m3
Bk076,66380,34193,147
Gk050,46952,89061,320
Kt0385,761404,269468,706
Kr079,80783,63696,966
Ks0136,213142,748165,500
Lb0117,352122,983142,585
Lo068,63071,92383,387
Ol0150,532157,755182,899
Pi061,82064,78675,112
Po027,76629,09933,737
Rm0126,433132,499153,618
Sn0436,753457,708530,662
Sk0158,740166,356192,872
T065,13868,26379,143
Wa038,07039,89646,255
Ww0238,372249,809289,626
Zg032,48134,04039,465
Total PL02,251,0002,359,0002,735,000
S2AP: medium-sized wood. Rot, insect infestation, and visible foreign bodies are not permissible. Permissible curvature up to 12 cm per 1 m. Minimum top diameter without bark is 5 cm.
Table 11. Energy value (GJ) generated by biomass by species impact (for a biomass moisture content of 30%).
YearSpecies
PineSpruceFirBeechOakHornbeamBirchAlderAspenPoplarTotal
GJ/Year
2018 * 100%229,99216,709686026,88834,080413916,28115,6281029172351,779
2019333,65526,25912,55741,48552,173597624,41623,2071478289521,495
%145157183154153144150148144168148
2020322,22725,40311,91339,93950,116572223,66722,3751420274503,056
%140152174149147138145143138159143
2021318,35325,35512,18240,33549,303558623,52822,0641398271498,375
%138152178150145135145141136158142
Own elaboration based on the available data. *—volume of 100% being the reference for the following years.
Table 12. Energy potential of the forest biomass in RDSFs in Poland (for a biomass moisture content of 30%).
Year2018201920202021
RDSFGJ * 100%GJ%GJ%GJ%
Bk28,20234,34512232,49111530,860109
Gk39,35131,2427928,8137326,62468
Kt19,60148,26524649,92725552,687269
Kr930314,31215413,06814013,167142
Ks701917,33224716,41523417,432248
Lb27,27738,08614036,54513434,903128
Lo11,51916,77914616,21714115,813137
Ol21,26033,40115732,65015432,644154
Pi22,79027,00711925,70711324,706108
Po26,58743,22616338,61014534,682130
Rm13,61023,33917122,88316822,754167
Sn25,35956,21722255,65221958,953232
Sk15,60029,19418729,13718730,027192
T28,58631,95411234,56212134,035119
Wa984713,69813913,29713512,754130
Ww26,24443,37116541,68615941,576158
Zg19,62419,72810115,3977814,75775
Total PL351,779521,495148503,056143498,375142
Own elaboration based on the available data. *—volume of 100% being the reference for the following years.
Publisher’s Note: MDPI stays neutral with regard to jurisdictional claims in published maps and institutional affiliations.

