Article

Research on Carbon Emission Efficiency Measurement and Regional Difference Evaluation of China’s Regional Transportation Industry

Business School, Nanjing Xiaozhuang University, Nanjing 211171, China
*
Author to whom correspondence should be addressed.
Energies 2022, 15(18), 6502; https://doi.org/10.3390/en15186502
Submission received: 1 August 2022 / Revised: 25 August 2022 / Accepted: 2 September 2022 / Published: 6 September 2022
(This article belongs to the Special Issue CO2 Emissions from Vehicles)

Abstract

:
From a global perspective, carbon emissions are a global problem that needs to be solved urgently. At present, 61% of countries have committed to achieving net zero emissions. Compared with industry and construction, the transportation sector has become the focus and challenge for countries to achieve carbon neutrality due to the characteristics of strong mobility, scattered emission sources, and complex social behaviors. Therefore, the issue of carbon emissions in the transportation industry has become the focus of academic attention. This paper first calculates the carbon emission efficiency (CEE) of the regional transportation industry through the super-efficiency SBM model and then evaluates its regional differentiation characteristics through the Theil index, which has important practical significance for reducing regional carbon emissions. The results show that the national transportation CEE average value is 0.612, a relatively low level. The spatial distribution of China’s transportation CEE shows an obvious characteristic of “east highest and west lowest”. The regional differences in the transportation industry CEE are larger than those between regions. The differences in the transportation industry CEE among the eastern, central, and western regions are on the downward trend as a whole, and intra-regional differences are greater than inter-regional. The intra-regional differences cause the overall differences in transportation industry CEE; the eastern region contributed the most to the Theil index, while the central contributed the least. The biggest factor affecting the transportation industry CEE is the regional energy structure, and the smallest factor is the per capita GDP. This research has important reference significance on the target of carbon neutrality.

1. Introduction

Since the beginning of the 21st century, energy depletion, environmental pollution, and global warming have become major issues facing people all over the world. Properly solving various conflicts caused by carbon dioxide-based greenhouse gas emissions is an economic and scientific issue as well as a global political and social issue, which is directly related to the development rights and development space of various countries [1,2,3]. As the basic carrier and strategic leading industry, the transportation industry is an important source of carbon emissions [4]. The transportation industry’s oil consumption is second only to the manufacturing industry, accounting for 50%, while the CO2 emissions account for 25% of the total CO2 emissions [5]. In 2008, the global transportation sector had 6.606 billion tons of carbon emissions—22.48% of the total carbon emissions were from energy activities [6]. Carbon emissions in the EU transport sector increased by 21% between 1990 and 2008 [7] and 21% in the UK [8]. In 2008, transportation sector carbon emissions in the United States totaled 1.795 billion tons; in 2009, they reached 1.854 billion tons and are expected to exceed 3 billion tons by 2050 [9].
Chinese GDP ranks second in the world, which is inseparable from transportation industry support. However, with the rapid economic development, fossil energy consumption in the transportation industry is also growing rapidly. Both the scale and quality of transportation have made great achievements, making important contributions to China’s social and economic development, but at the same time, they have also led to strong negative externalities such as energy consumption, environmental pollution, and a surge in carbon emissions [10,11]. The energy consumption of the transportation industry is still dominated by oil consumption and has a high annual growth rate, resulting in a high annual carbon emission growth rate [12]. China’s total carbon dioxide emissions in 2015 were 10.4 billion tons, more than the sum of the United States and the 28 EU countries. The proportion of CO2 emissions from the industry has exceeded 15% [13], second only to the energy sector, and it has shown an evident increasing trend. The environmental impact of China has attracted great attention. While maintaining rapid economic development, coordinating their relationship, and promoting the transformation of the transportation industry from extensive development to a connotative development model focusing on efficiency improvement has become an academic focus from the world and policy makers [14].
However, there are many provinces in China with significant regional differences. The eastern part of the country has fast economic development, a high level of urbanization, a developed road network, and a leading level of motor vehicles and other vehicles in the country, while the other two regions are relatively slow. The road network density and level of transportation infrastructure are relatively low, but the development method is rough, and its energy utilization efficiency is not comparable to that of the developed eastern regions. The development level and characteristics of different regions are relatively large, which leads to the uneven development of transportation, leading to carbon emissions differences [15]. In response to the governance of carbon emissions, a national “package” policy cannot be adopted. The development of regional transportation and the differences in carbon emissions should be integrated and combined with the different geographical characteristics to reduce transportation carbon emissions [16].
In summary, measuring transportation CEEs and their differences is of great significance for adopting effective strategies to reduce carbon emissions. The social and economic development is different, and development strategies and development characteristics of different regions are not consistent, especially in terms of economy, technology, and population distribution. The transportation carbon emissions are also different [17]. Based on more specific research results, more targeted strategic measures can be provided by comprehensive research and analysis. Based on this, the study selects the super-efficiency SBM to calculate the CEEs of the regional transportation industry; finally, it evaluates regional differentiation characteristics through the Theil index, which has important practical significance for reducing regional carbon emissions.

2. Literature Review

2.1. CEE of Transportation Industry

2.1.1. Measurement of Transportation Industry CEE

With the increasingly severe transportation carbon emissions, the importance of reducing undesired output to improve transportation CEE has become increasingly prominent. For the automotive industry, such as Los and Verspagen (2009) [18], González et al. (2013) [19], and Hampf and Krüger (2014) [20] used the DEA to explore the automotive CEE of the UK, Spain, and Germany. Sgouridis et al. (2011) [21] explored the carbon footprint characteristics of air transport under the condition of the undesired output of carbon emissions. Using the autoregressive distributed lag method, Yorucu (2016) [22] found that there is a significant dynamic relationship between Turkey’s CO2 emissions and the scale of tourists. Labib et al. (2018) used traffic volume, fuel type, and vehicle distance traveled to estimate CO2 emissions from the main transportation network in Dhaka, the capital city of Bangladesh [23].
Domestic literature research is mostly reflected in the measurement and comparison of regional transportation carbon emission efficiency. Li et al. (2019) adopted a grey system prediction model to study the transportation industry in Shaanxi Province under the premise of fully considering the correlation between multiple influencing factors and industry carbon emissions. Carbon emissions are forecasted [24]. For example, Dai (2019) [25], Song Mei and Hao (2018) [26], and Lv and Gao (2018) [27] measured the transportation industry’s carbon emissions through the “top-down” method. Wang (2020) [28] used the Super-SBM-ML index model to calculate the transportation industry’s CEE in six provinces in central China. Zhou and Hong (2018) [29] measured the transportation industry’s CEE from 2003 to 2015, and on this basis, used the IGVAR method to study its driving factors. Yuan et al. (2017) [30] measured transportation CEE with the SBM model and analyzed the spatiotemporal evolution characteristics of the transportation industry CEE.

2.1.2. Factors Affecting Transportation CEE

Mishalani et al. [31] found a strong link between private vehicle occupancy and transport sector carbon efficiency. Achour and Belloumi (2016) [32] used the log-average index to study transport energy consumption drivers and contributions in Tunisia. Timilsina and Shrestha (2009) [33] studied transportation industry emissions influencing factors in some Asian countries. Jia (2020) [34] also decomposed its influencing factors in Hebei Province with the improved Kaya identity and used the gray correlation model to study its relationship. Wang and Wang (2019) [35] used the LMDI method to study their relationship. Xing (2017) [36] used Bayesian structural equations to explore the relationship between transportation energy consumption, transportation structure, economic development level, industry technology level, and other factors.

2.2. Regional Differences of Transportation Industry CEE

Lesiv et al. (2010) [37] explored and studied the distribution characteristics of carbon emissions from passenger transportation with the help of visual analysis technology; Réquia et al. (2015) [38] also studied CEE spatial distribution characteristics in different areas. Meanwhile, Keuken et al. (2014) [39] compared and analyzed the carbon emissions of road transportation in Basel and Rotterdam in Europe and Xi’an and Suzhou in China and gave corresponding solution results for the current situation in their respective cities.
Domestic research on the status quo of transportation carbon emissions in some parts of the country is relatively abundant. Liu (2016) [40] conducted research and analysis on the transportation carbon emissions and their spatial transfer differences for the Silk Road Economic Belt region and found that Qinghai has the highest low-carbon emission quality, while Ningxia has the highest emission quality. There is an upward trend, while the low-carbon transportation development level of Shaanxi, Xinjiang, and Gansu is relatively backward. Zhang and Nian (2013) [41] divided China’s provinces into the middle, east, and west regions by geographical location, established the STIRPAT model to study influencing factors, and found that passenger traffic is one of the dominant factors. Yang and Ning (2015) [42] confirmed the existence of spatial differences in regional carbon emissions and studied the intrinsic relationship between spatial differences and economic level gaps. Xu and Lin (2016) [43] used transportation carbon emissions to study the impact of urbanization, private cars, and freight traffic on CEE and found that urbanization varies between the middle, east, and west and that the impact of private cars is greater than that of freight traffic. Zhang et al. (2017) [44] found that the spatial clustering characteristics of China’s provincial transportation carbon emissions from 2000 to 2013 did not change much with time, and there were significant high-value and low-value clustering characteristics. Li (2016) [45] combined the 2000–2014 panel data and then systematically analyzed its spatial agglomeration characteristics through three indicators. The transportation industry’s total carbon emissions and per capita carbon emissions show a gradually decreasing spatial agglomeration characteristic of “east, middle, and west”.
The research on transportation carbon emissions is mainly in the aspects of measurement, influencing factors, and trend prediction. However, most of them focus on transportation carbon emission research in a single city or a certain province. In addition, it should be noted that the previous studies were mainly based on the LMDI, IPAT equation, or STIRPAT model and other theoretical methods to analyze transportation CEE. Modeling based on economic theory lacks consideration of spatial factors and may lead to certain shortages in this research area. At the same time, due to different economic characteristics, carbon emission efficiency shows significant heterogeneity in different regions, and the existing literature is seldom carried out in this field. The spatial heterogeneity analysis in this paper is a useful supplement to the existing research. It is also an expansion of existing research and has important innovative value for realizing regionally differentiated policies.

3. Methods

3.1. Efficiency Measurement Model

3.1.1. Super-Efficient SBM

DEA is a model that uses mathematical programming (including linear programming, multi-objective programming, semi-infinite programming, etc.) to evaluate the relative effectiveness of multiple outputs, especially multiple output “departments” or “units” (decision-making units). That is to say, we first determine the relatively efficient production frontier and then determine the relative efficiency by calculating the degree of deviation of the decision-making unit from the DEA frontier. If the decision-making unit is on the efficiency frontier, it is called an effective unit, and if the decision-making unit is not on the efficiency frontier, it is called an ineffective unit. Assuming that the production system has n decision-making units, in each decision-making unit, there are S kinds of output and m kinds of input; then, the efficiency of the ith decision-making unit is θ, and the DEA model is as follows:
Min θ :
s . t . i = 1 n Y i λ i y i 0 i = 1 n X i λ i θ x i 0 λ 0
where θ represents the value of CEE, λ represents the constant vector of N × 1; it is called the CCR model. If adding a constraint i = 1 n λ i = 1 to Formula (1), it is called the BCC model [46] and can be obtained as in Equation (2):
Min θ :
s . t . i = 1 n Y i λ i y i 0 i = 1 n X i λ i θ x i 0 i = 1 n λ i = 1 λ 0
In order to overcome the problems that the radial CCR model has, such as low identification for efficient vehicles and not considering slack variables, the super-efficiency SBM model is selected to calculate CEE [47]. This model incorporates the slack variables of input factors into the objective function and, at the same time, removes the evaluated vehicles from the production possibility set, which improves the discrimination of the measurement results. Assuming that there are n types of vehicles in the carbon emission production process of the transportation industry, each vehicle has a decision-making unit; the unit has m inputs and q output elements. We define the input matrix x = x 1 , , x i , , x m and the output matrix y = y 1 , , y r , , y q . When the return to scale is constant, to satisfy the axioms of triviality, convexity, conicity, invalidity, and minimality, the production possible set T after excluding the evaluated vehicle k is constructed:
T = x , y | x i j = 1 , j k n x i j λ j , y r j = 1 , j k n y r j λ j , x j 0 , λ j 0
where T is the production possible set after excluding the evaluated vehicle k; x i j ,    y r j represent the i-th input and r-th output factor values of the vehicle j, respectively; λ j is the factor weight value of the vehicle j; i = 1 , , m ;    r = 1 , , q ;    j = 1 , , n ;    j k . The input-oriented super-efficiency SBM for measuring the transportation GEE is:
min θ = 1 + 1 m i = 1 m S i k x i k
s . t . j = 1 , j k n x i j λ j S i k x i k j = 1 , j k n y r j λ j + S r k + y r k λ j , S i k , S r k + 0 i = 1 , 2 , , m ; r = 1 , 2 , , q ; j = 1 , 2 , , n j k
where θ is the CEE of transportation, and the goal is to minimize the redundancy value of input factors; S i k , S r k + are the redundancy of input factors and the shortage of output factors, respectively; 1 m i = 1 m S i k x i k means the average input inefficiency; the constraint condition consists of the production possibility set T. Discrimination of carbon emission efficiency: when θ ≥ 1 and both S i k , S r k + are 0, the carbon emission efficiency is high; when θ ≥ 1, and when S i k , S r k + are not all 0, the carbon emission efficiency is relatively high, but there is still room for optimization of input factors; when θ < 1, the CEE is low.
This method can solve the sorted problem in efficiency evaluation, so it can more accurately measure transportation industry CEE [48]. The Super-SBM model that considers undesirable outputs adopted in this paper clearly distinguishes output variables and defines transportation carbon emissions as undesired outputs. Compared with the traditional DEA developed on the basis of the radial non-angle measurement method, it can not only avoid the measurement deviation, but also the decision-making unit can effectively evaluate and sort the efficiency value, so that the measurement results are more accurate and reliable and can better reflect the essence of efficiency evaluation.

3.1.2. Indicator Selection

Input Variables

Labor input: The labor force is often measured by the effective labor time of employed persons [49,50], but due to the lack of Chinese statistical data, this paper uses the transportation practitioners published in the Statistical Yearbook instead.
Capital input: Refers to the capital stock of transportation. Currently, no direct statistical data can be obtained. It is necessary to calculate the capital stock of transportation in the Chinese provinces from 2008 to 2020 (unit: CNY 100 million). In the past, most scholars used the “perpetual inventory method” to calculate. This paper refers to the research of Li (2016) [51] and Bai and Qian (2010) [52] to determine the depreciation rate of transportation fixed assets at 8.96%. For the calculation of the total capital formation in the base year, we first calculate the total capital formation in the base year in China, and then use the ratio of the total investment in fixed assets in transportation in each province to the total investment in fixed assets in each province as a coefficient to calculate the capital stock data in the base year in each province. In addition, to eliminate the influence of price factors, the capital stock data are uniformly converted into constant price data with 2008 as the base period by using the fixed asset investment price index of each province. The specific calculation formula is as follows:
K i , t = K i , t 1 1 δ i , t + I i , t
where i represents the province (I = 1, 2, …, 30); Kit and K i,t−1 represent the fixed capital stock of the transportation industry in province i at the end of period t and period t−1, respectively; Iit represents province i’s investment in the transportation industry at the end of period t; that is, the new fixed capital; it represents the depreciation rate of the fixed assets corresponding to the i province at the end of the t period.
Energy input: Energy consumption input includes coal consumption input, oil consumption input, and new energy input. Coal consumption includes raw coal and coal; oil consumption includes four categories: crude oil, gasoline, diesel, kerosene, and fuel oil; new energy consumption includes electricity, natural gas, and liquefied petroleum gas. All kinds of energy consumption data are uniformly converted into standard coal by using the appendix “Reference coefficient of standard coal conversion for various energy sources” in the “China Energy Statistical Yearbook 2020”. The conversion coefficients of standard coal for various energy sources are shown in Table 1.

Output Indicators

Expected output: It is represented by the added value of the transportation industry in each province (unit: CNY 100 million). At present, the added value of the transportation, warehousing, and postal industries is counted according to the same industry in the existing statistical system. Compared with the transportation industry, the warehousing and postal industries account for a relatively small proportion. Considering the availability of data, the statistical yearbook is used. The “value added of transportation, warehousing and postal industry” of the 2008 approximation replaces the value added of the transportation industry and deflates with 2008 as the base period to eliminate the impact of price fluctuations.
Undesirable output: Transportation carbon emissions. Since China does not directly announce the carbon emissions, they need to be calculated based on various energy sources. According to the different industries in China, the transportation, warehousing, and postal industries are grouped into one industry (collectively referred to as transportation in this paper) [50], mainly consuming fossil energy such as coal, coke, crude oil, fuel oil, gasoline, kerosene, diesel oil, and natural gas (because electricity consumption does not directly emit carbon dioxide, so it is not counted here). We refer to the 2006 IPCC National Greenhouse provided calculation model; the method is as follows:
E C O 2 = i E i · S i · E f i
where E i is the energy consumption, S i is the converted standard coal coefficient of energy; E f i is the CO2 emission coefficient (Table 2). The formula is proposed by the “2006 IPCC National Greenhouse Gas Inventory Guidelines”. The carbon emission coefficients of various energy sources were obtained from the average low calorific value of various energy sources in the China Energy Statistical Yearbook and the CO2 emission factors in the 2006 IPCC Greenhouse Gas Emission Inventory Guidelines. The carbon emission coefficients of various energy sources are shown in Table 2.

3.2. Theil Index

The Theil index was proposed based on the concept of entropy [51]. It is mainly selected for analyzing the income inequality phenomenon. The size of the regional difference is reflected in the size of the Theil index. The larger the value, the larger the regional difference. There are the following advantages of using the Theil index [53]: the spatial differences of the transportation CEE can be decomposed at multiple levels according to the zonal structure, which can study the evolution of the overall difference and internal difference change; it is not affected by the number of spatial units under investigation and can compare the differences in the CEE of the transportation industry in different regional systems. Referring to the research on the Theil index [54], the calculation formula is as follows:
T = j C i / C l n C i / C X i / X
T w = j C j / C T w i = j i C j / C C j i / C j l n C j i / C j X j i / X j
T w i = i C j i / C j l n C j i / C j X j i / X j
T B = j C j / C l n C j / C X j / X
T = T w + T B = T B + C j / C T w i
where i is the province (excluding Tibet Autonomous Region and Hong Kong, Macao, and Taiwan); j is the region, namely the eastern, central, and western regions; C is the CEE of the transportation industry (10,000 tons); Ci is the CEE of the provincial transportation industry; Cj is the regional CEE from the transportation industry; X represents the transportation industry output value; X j is the output value in each region; and X i is the output value in each province. Equation (8) is the calculation method of the overall Theil index of the national transportation carbon emission; Equation (9) is the calculation formula of the Theil index in the region, and the calculation result T w is the internal difference of the transportation CEE in each region. The calculation result of Equation (10), T w i , represents the Theil index of the transportation carbon emission efficiency of each province within the region. The calculation result of Equation (11) is T B , which represents the difference in transportation CEE between regions. Equation (12) reflects that the Theil index is decomposed into inter-regional and intra-regional differences. The Theil index is usually weighted by the transportation industry output value. When X represents the transportation output value, T is the transportation CEE Theil index.
For more easily exploring the differences in regional transportation CEE, the total difference in the national transportation CEE, and to clarify the impact level of intra-regional and inter-regional differences, the two sides of Equation (13) are divided by T, and the formula is transformed into:
T B T + T W T = T B T + C j / C T w i T = 1
where T B T represents the contribution rate between different regions, T W T represents the contribution rate within each region, and C j / C T w i T represents the contribution rate of each province.

4. Results

4.1. Results of Transportation Industry CEE

The MAXDEA software was selected to calculate the CEE value of the transportation industry in 30 provinces (Table 3). To facilitate comparison between results, the selected area was divided into east, central, and west. We measured the average CEE of the transportation industry according to the regional divisions.
Nationally, from 2008 to 2020, the average level of the transportation CEE value was 0.612, and six provinces (Hebei, Jiangsu, Qinghai, Ningxia, Jiangxi, and Tianjin) ranked the highest in China’s transportation CEE; the average value of their transportation CEE was greater than 1, indicating that they are all at the frontier of production. The transportation CEE of these six provinces was at the national advanced level, and the resource allocation was relatively reasonable. Hebei Province, as a major transportation province in China, had a relatively high industrial development level. Jiangsu’s economic development level and transportation development scale are at the forefront in China. The transportation industry has high technological innovation capabilities, rapid transformation, and upgrading, and the emission reduction policies have achieved remarkable results. Therefore, the level of carbon emission efficiency is high. Tianjin’s low-carbon development effect is very good. It is a model city of China’s circular economy. In recent years, Tianjin has done a lot of work in green transportation and achieved considerable results. Therefore, its transportation carbon emissions are relatively low. Jiangxi and Hainan have less railway and highway mileage than other provinces in the country, waterway transportation is developed, and waterway energy consumption is low, so these two provinces have less transportation carbon emissions. The two western provinces of Qinghai and Ningxia are vast and sparsely populated, and their population size is at the lowest level. Due to the constraints of geographical conditions and natural resource environment, their transportation resource endowments are at a relatively low level. The transportation industry’s development is relatively backward, and the energy consumption is relatively low. Compared with other provinces, the amount and carbon emissions are lower, and the carbon emission efficiency level is correspondingly higher.
The six provinces of Hunan, Yunnan, Sichuan, Chongqing, Guizhou, and Shaanxi had the lowest average transportation CEEs in China. The efficiency values were all below 0.4, and the CEE level was relatively low. It is the “chaser” of carbon emission reduction in transportation. In many western regions of these provinces, the extensive economic development model leads to high carbon emissions, insufficient investment in environmental pollution control, low energy-saving technologies, ineffective carbon emission reduction work, and a low level of CEE.
The changing trend in the three regions’ transportation CEEs was further analyzed. A graph of efficiency versus time is shown in Figure 1. The horizontal axis in the figure is the year, and the vertical axis is the CEE value.
From a regional perspective, the geographical distribution pattern of transportation CEE was similar to that of China’s economic development level. This distribution feature verifies that transportation CEE may be affected by economic development and traffic activity. At the same time, CEE shows an obvious characteristic of “high in the east and low in the west”. The eastern region has larger carbon emissions in transportation due to favorable guidance and capital investment of government policies in recent years, coupled with its strong economic foundation, continuous improvement of technical level, and high energy utilization rate [55]. The work has achieved remarkable results, and its transportation carbon emission efficiency level is relatively high. The central and western regions are relatively backward in terms of economic development and technological level. The transportation industry development is not high, and there is a lack of advanced technology and excellent talents, unreasonable allocation of resources, and slow industrial transformation and upgrading. Furthermore, transportation CEE is low, and the pressure on carbon emission reduction is high. This is different from the conclusions drawn by some scholars. For example, the scholar Zhang (2018) [56] concluded that the carbon emission efficiency of some regions has a U-shaped characteristic. The possible reason is that the research period selected in this paper was 2008–2020, the base period was 2008, the starting point of this study was 2006, and different trend results appeared.

4.2. Regional Difference Measurement

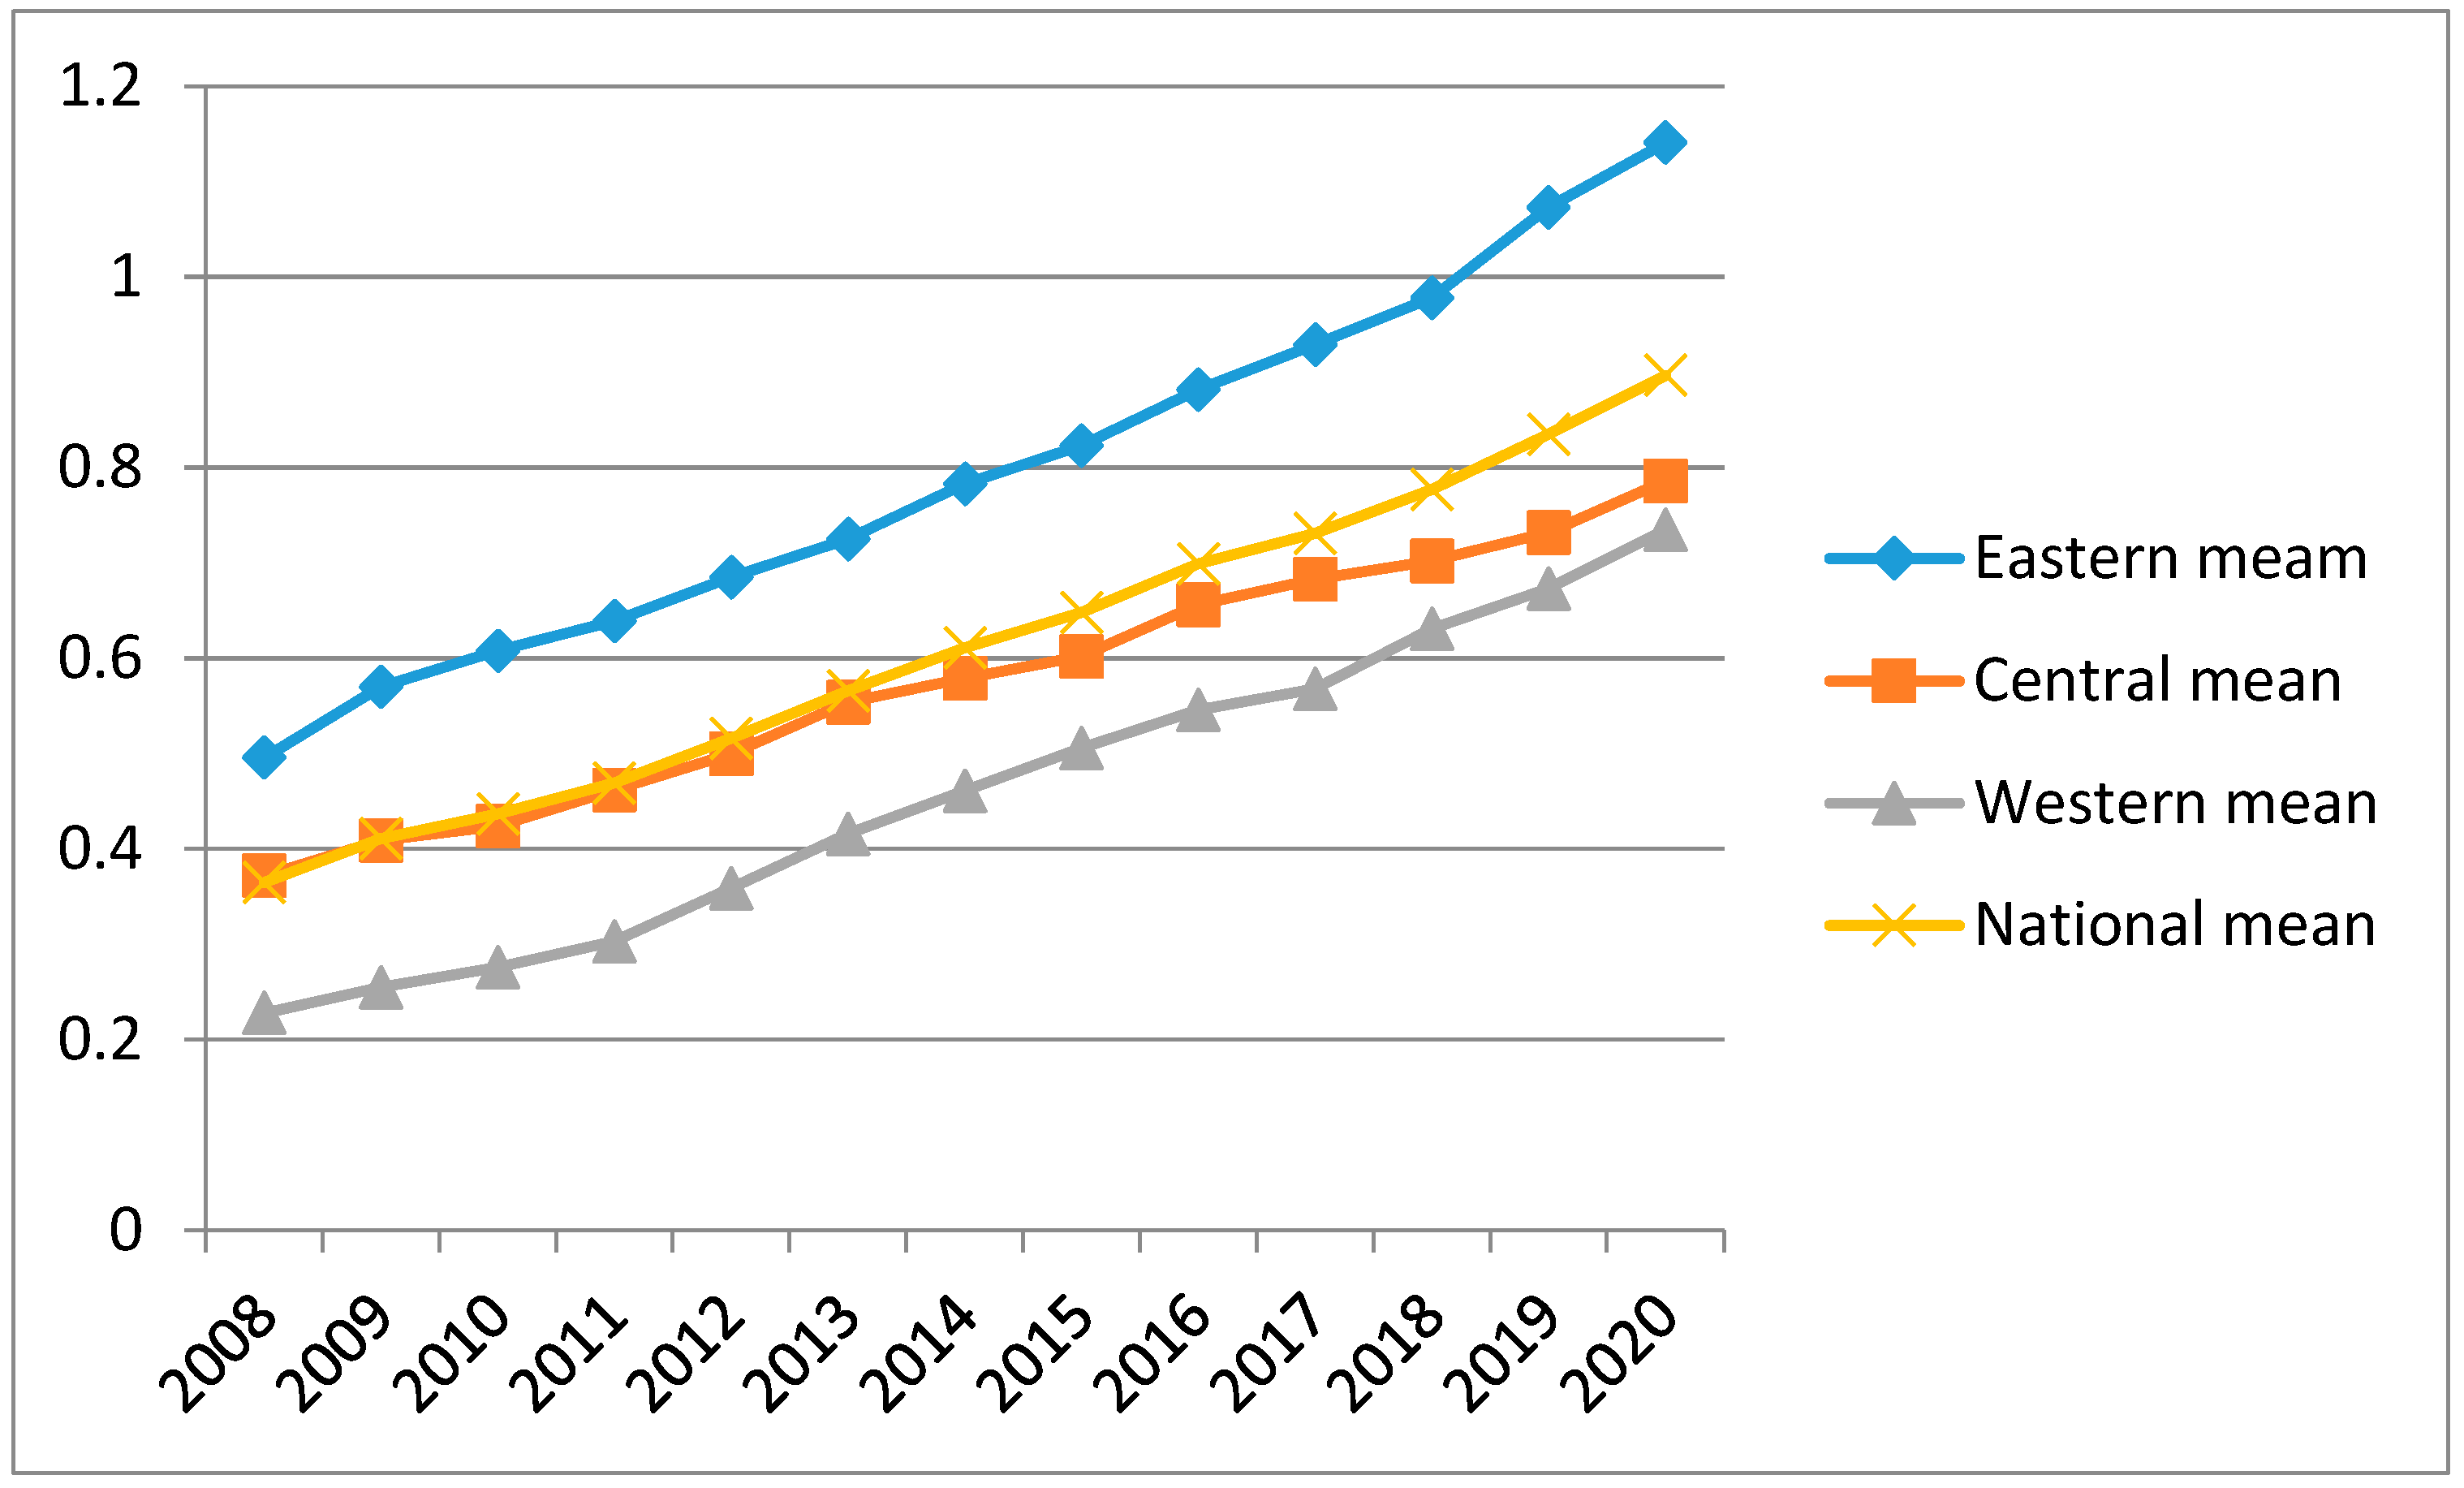
4.2.1. Regional Differences in Transportation Industry CEE

To better reflect the quantitative regional differences in the transportation industry CEE, the Theil index can be selected to calculate the overall regional differences. At the same time, the Theil index of regional differences and intra-regional differences can be calculated. The results are shown in Table 4, and the trend of its changes is drawn according to the Theil index in Figure 2. The horizontal axis in the figure is the year, and the vertical axis is the Theil index.
Table 4 and Figure 2 show that the regional carbon emission levels vary by region. In Figure 2, the total regional differences in the transportation industry CEE show an upward trend before 2011, a peak in 2011, a decrease in 2015, and a slight increase after 2015, indicating that China’s regional differences in CEE of the transportation industry reached the maximum in 2011. Meanwhile, the regional differences in CEE were larger than those between regions, and the overall regional differences were also caused by intra-regional differences.

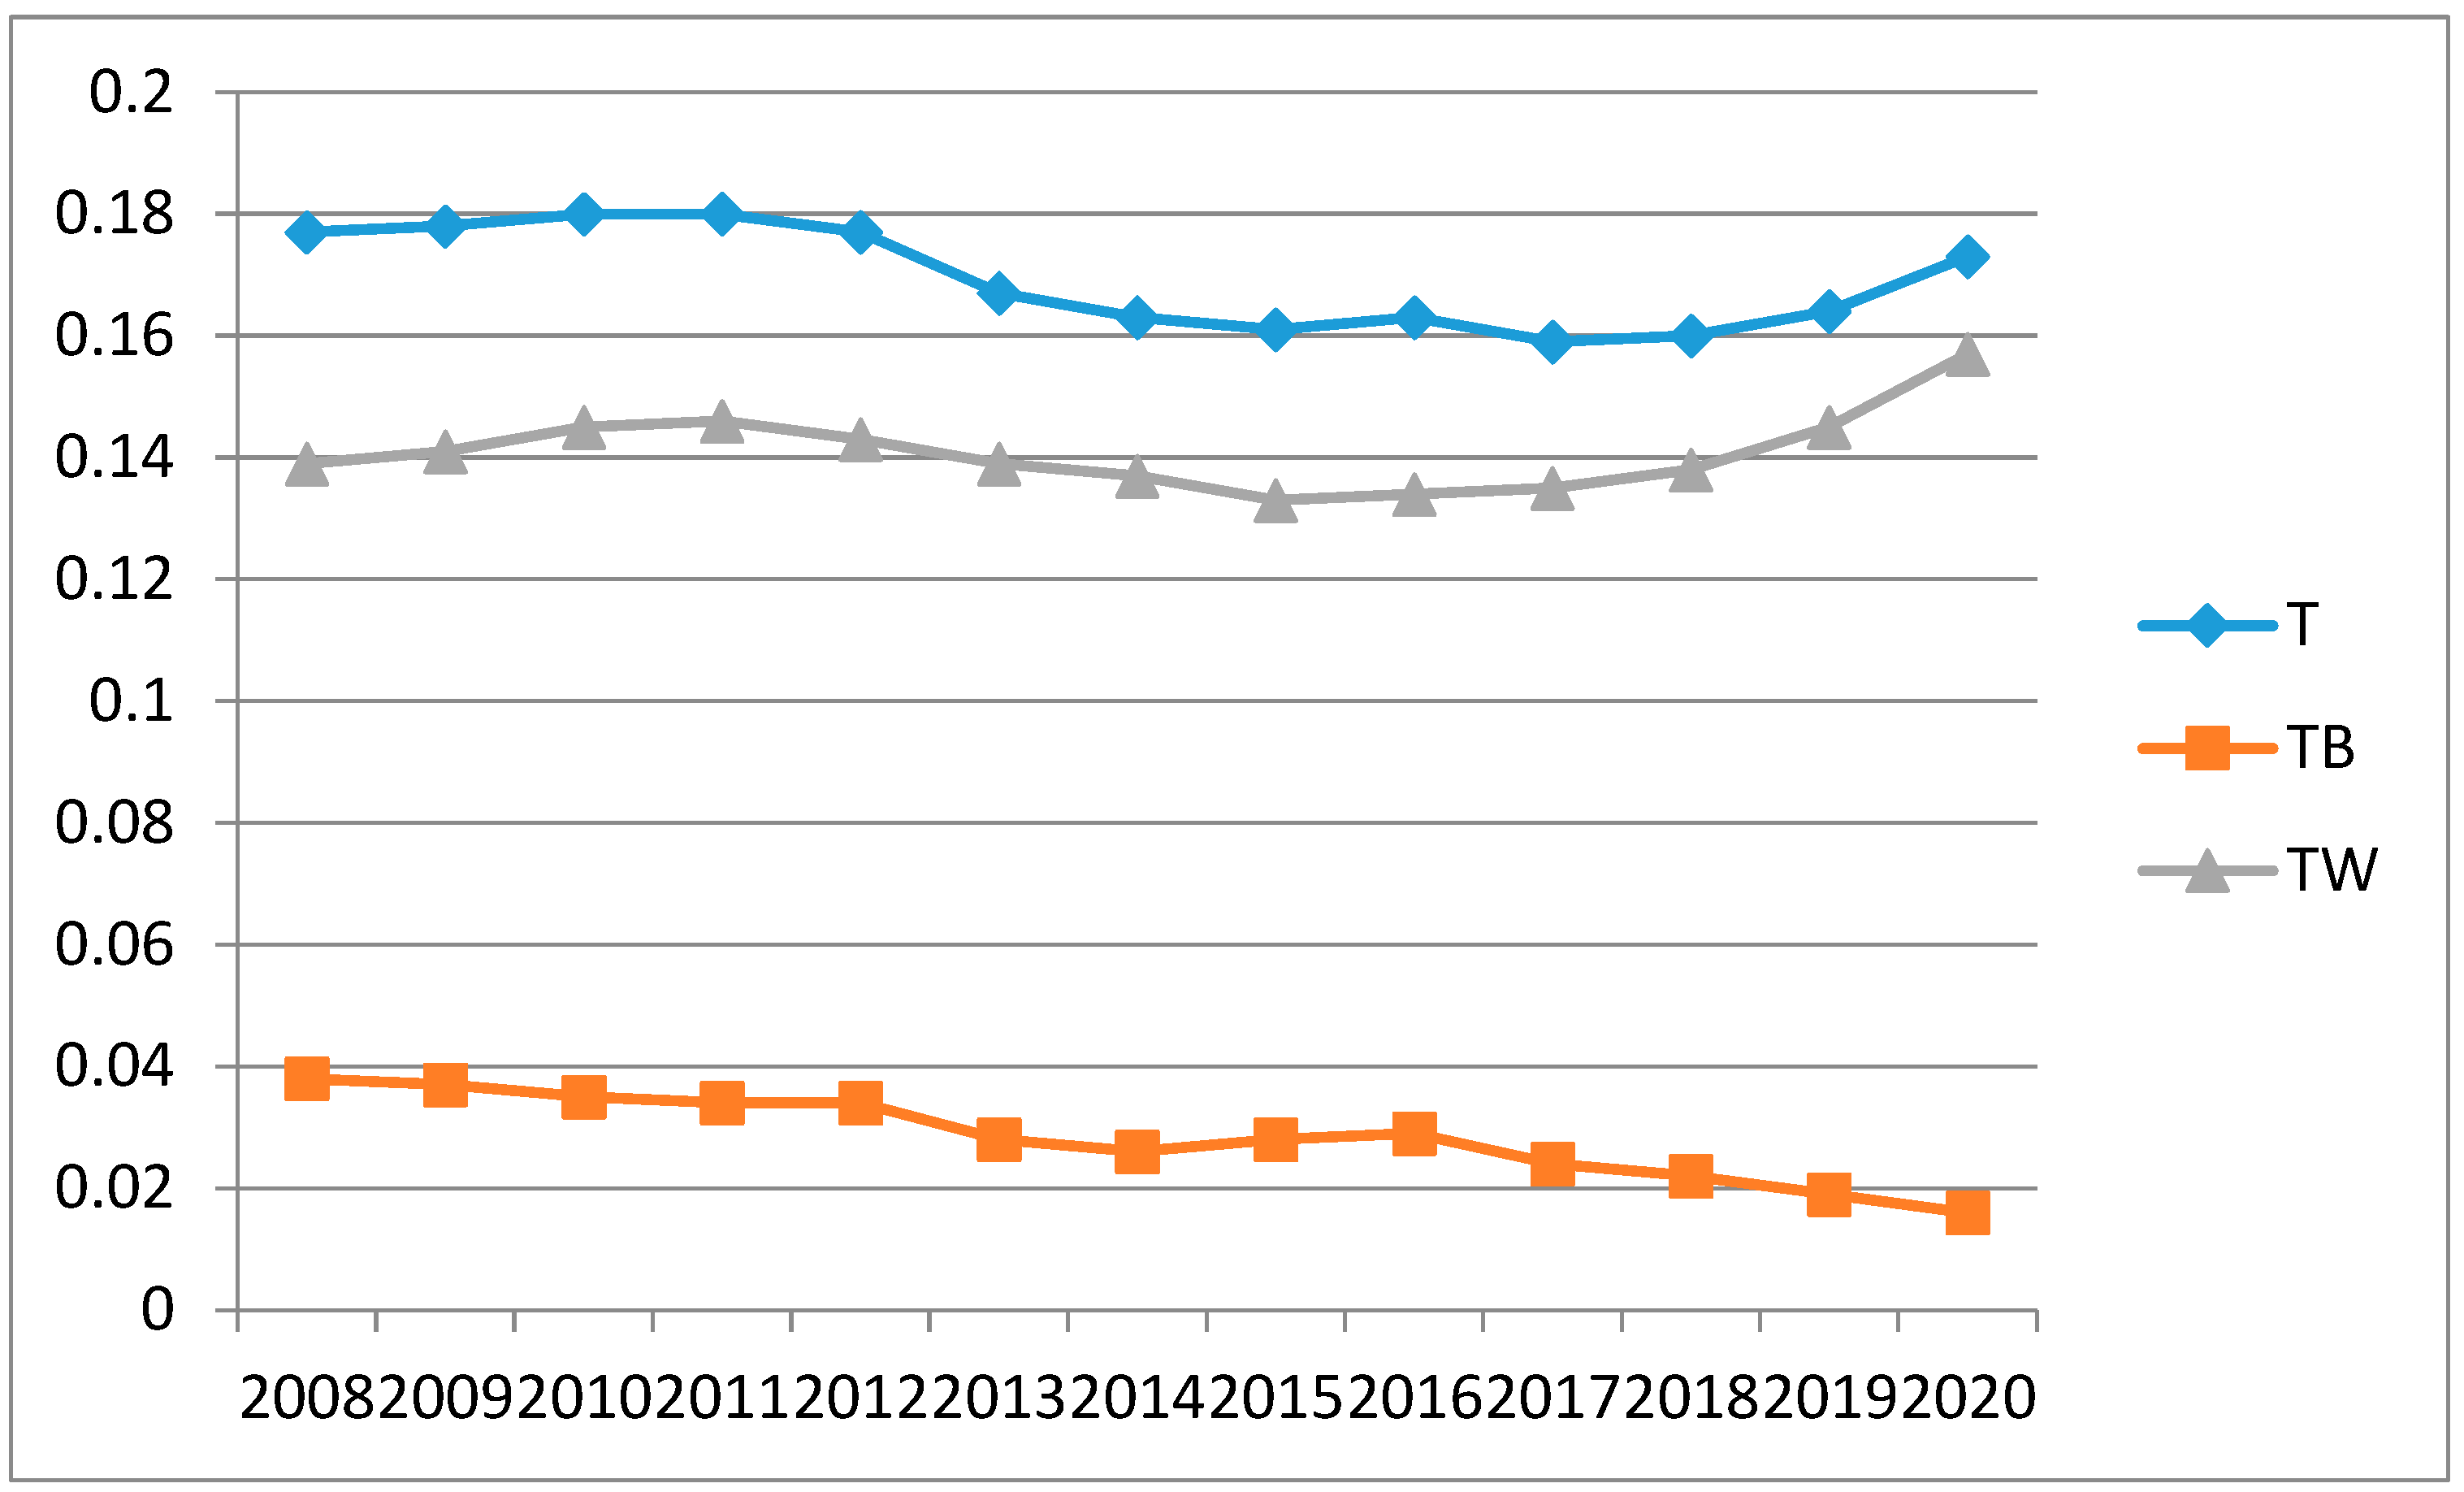
4.2.2. Decomposition of Theil Index of Transportation CEE in Three Regions

In order to more easily reflect how the differences in transportation carbon emissions between the three regions affect the overall national differences and explore how the differences in transportation CEE between and within the three regions affect the national differences, the eastern region was calculated according to the formula. Table 5 shows the Theil index of transportation CEE in eastern, central, and western China from 2008 to 2020. Figure 3 shows the change in the Theil index of transportation CEE in eastern, central, and western China. The horizontal axis is the year, and the vertical axis is the Theil index.
In Table 5 and Figure 3, the fluctuation of intra-regional differences in the transportation industry CEE from 2008 to 2020 is relatively small, with the minimum and maximum values being 0.0921 in 2020 and 0.1014 in 2011, respectively. The difference in transportation industry CEE among the three regions in the central and western regions showed a downward trend as a whole, with the maximum and minimum values being 0.0147 in 2011 and 0.0056 in 2020, respectively. With absolute value, the differences in transportation CEE within the eastern, central, and western regions of China are far greater than between regions; this is consistent with the conclusions of most scholars [57,58]. From the observation of data changes, neither the intra-regional differences nor the inter-regional differences changed significantly, but the intra-regional differences had a larger change. Regarding the Theil index of transportation CEE in the eastern, central, and western regions, the eastern region had the largest regional difference. The transportation CEE in the central and western regions was not consistent; the western was higher, while the central was lower. The lowest value of the Theil index of transportation CEE in the eastern region was 0.0666, which appeared in 2008, and the highest value was 0.1122, which appeared in 2020. As for the central region, the minimum and maximum values were 0.0279 in 2014 and 0.0457 in 2016; the minimum and maximum values of the Theil index of the transportation industry CEE in the western region were 0.0295 in 2008 and 0.0995 in 2018, respectively. From the perspective of changing trends, during the observation year, the regional differences in the western region showed an upward trend in fluctuation; the regional differences in transportation CEE in the eastern region continued to fluctuate but showed a trend of horizontal development as a whole. Except for 2012–2014, the central region decreased sharply. In addition, the remaining years showed a trend of horizontal development despite fluctuations.
Figure 4 and Table 6 show the source of regional differences in transportation CEE from 2008 to 2020. During the study period, the Theil index of transportation CEE within and between regions had different contributions to the total regional differences in transportation carbon emissions; the average contribution rates were 90% and 10%, meaning that the Theil index between regions never surpassed the Theil index within the region. From the perspective of the entire change process, the contribution rate of the Theil index within the region had an upward trend and increased to the peak in 2020, with a value of 94.3%; the contribution rate between regions was constantly fluctuating and showed a downward trend. The annual minimum value was 5.7%. From the perspective of the three major regions, the eastern region’s contribution was always the largest, with an average of about 59.9%. The western region was close behind, in second place in the contribution rate ranking, with an average value of about 18.5%; the central region was at the bottom, and its contribution rate was the lowest at 10.5%, indicating that the regional differences of the transportation industry CEE were mainly caused by the east of China. During the study period, the fluctuations in the eastern region were small. The overall trend of change was first a decline and then an increase. The change in the central region was relatively large, with a maximum value of 14.11% in 2008, a gradual decline to 8.68% in 2015, and a slow rise thereafter. The minimum value in the western region was 8.34% in 2008, the maximum value was 21.32% in 2016, and the overall upward trend was the most significant.

4.3. Analysis of Factors Affecting the Carbon Emission Efficiency Gap of Regional Transportation Industry

The analysis of influencing factors of the regional transportation industry’s CEE gap shows that energy structure, urbanization level, transportation infrastructure, and per capita GDP are the main factors affecting the regional transportation industry’s CEE. The gap between regions is bound to affect regional disparity in the carbon emission efficiency of the regional transportation industry. For this reason, in this section, we selected four variables: energy structure gap, urbanization level gap, transportation infrastructure gap, and per capita GDP gap as the influencing factors of the regional transportation industry carbon emission efficiency gap. We used Dun’s grey relational model to study the influence on the regional transportation industry’s carbon emission efficiency gap.
This paper used the proportion of fossil energy to total energy to represent the energy structure. Transportation infrastructure is a prerequisite for economic development, and the perfection and convenience of transportation infrastructure can greatly attract and drive freight transportation and population flow to promote connectivity with surrounding areas and even larger areas. Urbanization rate is a measure of urbanization development; that is, the proportion of the urban population to the total population. Population transfer and economic development promote the development of urbanization. The urbanization rate can reflect the impact of the continuous improvement of a country’s urbanization level on the carbon emissions of the transportation industry, and, to a certain extent, it can also reflect the progress of social and economic development. The ratio of gross domestic product to the resident population at the end of the year is an important indicator to measure the level of social and economic development of a country or region. The improvement of the level of social and economic development will drive the rapid development of the transportation industry and promote the growth of transportation carbon emissions. The calculation results are shown in Table 7.
From Table 7, it can be seen that the energy structure gap was the most relevant to the regional transportation carbon emission efficiency gap because this geographical area is large, the regional differences are large, the energy structure differences in different regions are large, and the regions relying on non-renewable energy sources are large. Transportation carbon emissions are significantly higher. The second most relevant to the regional transportation carbon emission efficiency gap was transportation infrastructure. The greater the investment in transportation infrastructure, the higher the transportation convenience, and the stronger the ability to attract material flow and people flow, which will have an impact on the carbon emissions of the transportation industry and cause regional differences in carbon emission efficiency. Furthermore, the country’s urbanization rate is far from the average level of developed countries; this was the third most relevant to the regional transportation carbon emission efficiency gap. In the future, with the rapid development of the country’s economy, the population will gather in cities, and the level of urbanization will be further improved. In this process, a model of urban work and suburban development of residential areas will gradually form, which will drive the development of the transportation industry; that is, residents’ travel needs to and from work areas and residential areas will increase, which will promote the continuous improvement of transportation infrastructure, system facilities, upgrades, etc., thereby promoting the continuous increase of carbon emissions in the transportation industry. Different regions of China have different urbanization rates, resulting in large differences in regional carbon emission efficiencies. The fourth most relevant to the regional transportation carbon emission efficiency gap was the GDP per capita. The disposable income and consumption level of residents have also been continuously improved with the development of the country. The travel mode of capable residents has changed. By purchasing private cars instead of public transportation, the per capita GDP is more conducive to the increase in the carbon emissions of private vehicles, and thus has less impact on the carbon emissions of commercial vehicles.

5. Conclusions and Recommendations

5.1. Conclusions

In this paper, a scientific and reasonable input-output evaluation index system is constructed, and transportation carbon emissions are introduced as an undesired output. To evaluate and analyze it and, on this basis, calculate the regional difference and contribution rate of transportation CEE, we draw the following conclusions:
(1) From a national perspective, the average transportation CEE value was 0.612, at a relatively lower level. The average transportation carbon emission efficiency values of Hebei, Jiangsu, Qinghai, Ningxia, Jiangxi, and Tianjin were all larger than 1. At the national advanced level, Hunan, Yunnan, Sichuan, Chongqing, Guizhou, and Shaanxi were the bottom six provinces in terms of the average transportation CEE, and the efficiency values were all below 0.4; from the regional level, the geographical distribution pattern of the transportation carbon emissions was similar to the economic development level, and the transportation industry has great potential for energy conservation and emission reduction. Transportation CEE in the eastern region is higher than the whole country and higher than the central and western regions, showing a decreasing trend from east to west.
(2) The economic development difference makes the regional carbon emission levels different. The total regional differences in CEE of the transportation industry peaked in 2011, then declined, and fluctuated slightly after 2015. Meanwhile, the intra-regional differences in CEE were greater than the inter-regional differences, and the overall regional differences are also caused by intra-regional differences.
(3) From 2008 to 2020, the intra-regional differences in the transportation industry CEE fluctuated relatively little; the difference in transportation carbon emission efficiency within the three western regions was far greater than the difference in CEE between regions. This phenomenon shows that the dominant factor causing the overall difference in transportation CEE in China is the regional difference. The eastern region had the largest regional differences in the transportation industry CEE. There were regional differences in the transportation carbon emission efficiency in the central and western regions, but the difference was not consistent, the western region was higher, and the central region was lower.
During the study period, the Theil index between regions never surpassed the Theil index within the region, indicating that the differences within regions caused the overall differences in transportation CEE. The contribution rate of the Theil index within the region showed an upward trend as a whole, while the contribution rate of the Theil index between regions fluctuated continuously and showed a downward trend. From the perspective of the three major regions, the eastern region had the largest contribution to the Theil index, followed by the western region; the central region had the lowest contribution rate, indicating that the regional differences in CEE of the transportation industry were mainly caused by the eastern region.
Through the study of Dun’s grey correlation model, we found that the energy structure had the greatest impact on the regional transportation industry CEE differences and the smallest per capita GDP.

5.2. Recommendations

(1) Clarify the key direction of low-carbon transportation; scientifically design overall improvement ideas according to local conditions. The southeastern coastal provinces in the eastern region should learn from the transportation management experience of the Beijing–Tianjin–Hebei region while continuing to take advantage of their technological level [59]. In addition to improving the technical level, the Beijing–Tianjin–Hebei region should pay special attention to transportation-scale expansion to avoid the excessive concentration of elements resulting in a waste of resources. Although the progress of carbon emission total factor productivity in the northeast region has benefited from the substantial increase in technical efficiency, it is still necessary to seek strategies to maintain or break through its current stable state. The western region should increase policy support for the green economic development of the transportation industry, fully integrate its own energy and resource endowments, and integrate resources to promote transportation management services. In addition, the western region can strengthen the linkage between regions and narrow the development gap between the three regions by establishing a cross-regional comprehensive management agency for the transportation industry with the central region.
(2) Improve energy technology and increase the application of clean energy. The improvement of energy efficiency mainly comes from technological progress, which can significantly reduce carbon emission efficiency and thus save resources. In order to achieve low-carbon transportation, we should start from two aspects: i) strengthen the research and development of new clean fuels, use new fuels to replace traditional energy, and increase the proportion of clean energy in the transportation industry, such as nuclear energy, wind energy, solar energy, etc.; and ii) reduce dependence on coal and petroleum energy [60].
(3) Development of transportation technology level. Innovative, smart transportation will continue to develop and new technology empowerment will improve the overall efficiency of transportation [61]. New technologies should be deeply integrated with the transportation industry and supply chain management, and the application of big data will promote the precise matching of transportation supply and demand, improving system operation efficiency and reducing carbon dioxide emissions.
(4) Promote coordinated regional development and narrow the difference in regional carbon emissions. There is a significant difference in transportation industry CEEs among the three major regions in China. In the future development process, importance should be attached to balancing carbon emissions in the three regions. On the one hand, the equalization of basic public transportation services can be achieved by developing and improving the construction of transportation infrastructure in underdeveloped areas; on the other hand, the regional flow of production factors can be promoted by means of policy attraction and industrial structure adjustment. At the same time, it is necessary to coordinate the development between urban and rural areas in the region, build a new traffic pattern of “zero transfer of passenger transport and seamless connection of freight”, and minimize the turnover of passenger and freight, thereby reducing carbon emissions from transportation [62].
(5) Increase publicity efforts to guide the public to travel green. The transportation mode of the public has a strategic impact on transportation energy. The characteristics of a dense population, huge demand for the transportation industry, and pressure on environmental carrying capacity determine that it needs to accelerate the formation of resource-saving and environmentally friendly types of transportation consumption patterns [63]. Newspapers, questionnaires, public service advertisements, and other media can be fully utilized to improve the public’s awareness of low-carbon travel, mobilize the enthusiasm for green travel, and advocate the use of bicycles, public transportation, new energy vehicles, and other low-carbon travel methods, thereby promoting changes in public transport consumption patterns.

Author Contributions

Conceptualization, T.Z.; methodology, T.Z.; software, R.W.; validation, R.W., formal analysis, T.Z.; investigation, R.W.; resources, R.W.; data curation, R.W.; writing—original draft preparation, R.W.; writing—review and editing, R.W.; visualization, G.X.; supervision, G.X.; project administration, G.X.; funding acquisition, G.X. All authors have read and agreed to the published version of the manuscript.

Funding

This research was funded by Jiangsu Provincial Social Science [21GLD010].

Institutional Review Board Statement

Not applicable.

Informed Consent Statement

Not applicable.

Data Availability Statement

The data used to support the findings of this study are available from the corresponding author upon request.

Conflicts of Interest

The authors declare no conflict of interest.

References

  1. Bose, B.K. Global warming: Energy, environmental pollution, and the impact of power electronics. IEEE Ind. Electron. Mag. 2010, 4, 6–17. [Google Scholar] [CrossRef]
  2. Zandalinas, S.I.; Fritschi, F.B.; Mittler, R. Global warming, climate change, and environmental pollution: Recipe for a multifactorial stress combination disaster. Trends Plant Sci. 2021, 26, 588–599. [Google Scholar] [CrossRef] [PubMed]
  3. Apergis, N.; Gozgor, G.; Lau, C.K.M. Globalization and environmental problems in developing countries. Environ. Sci. Pollut. Res. 2021, 28, 33719–33721. [Google Scholar] [CrossRef] [PubMed]
  4. Khan, S.A.R.; Godil, D.I.; Yu, Z. Adoption of renewable energy sources, low-carbon initiatives, and advanced logistical infrastructure—An step toward integrated global progress. Sustain. Dev. 2022, 30, 275–288. [Google Scholar] [CrossRef]
  5. Wang, C.B.; Hu, Z.W.; Zhou, D.Q. Accounting of indirect CO 2 emissions from household consumption in China and its key emission reduction paths. J. Beijing Inst. Technol. 2022, 24, 15–27. [Google Scholar]
  6. Huang, L.C.; Cao, Q.S. Analysis of green development strategies in the transportation sector under the carbon neutrality target. Urban Transp. 2021, 19, 36–42. [Google Scholar]
  7. Du, Q.; Li, Z.Q. Legal policies and implementation actions of carbon neutrality abroad. China Environment News, 16 April 2021. [Google Scholar]
  8. Alataş, S. Do environmental technologies help to reduce transport sector CO2 emissions? Evidence from the EU15 countries. Res. Transp. Econ. 2022, 91, 101047. [Google Scholar] [CrossRef]
  9. Chen, L.; Wemhoff, A.P. Predicting embodied carbon emissions from purchased electricity for United States counties. Appl. Energy 2021, 292, 116898. [Google Scholar] [CrossRef]
  10. Wang, M.; Wang, Y.; Chen, L. Carbon emission of energy consumption of the electric vehicle development scenario. Environ. Sci. Pollut. Res. 2021, 28, 42401–42413. [Google Scholar] [CrossRef]
  11. Rauf, A.; Ozturk, I.; Ahmad, F. Do tourism development, energy consumption and transportation demolish sustainable environments? evidence from Chinese Provinces. Sustainability 2021, 13, 12361. [Google Scholar] [CrossRef]
  12. Huang, Y.; Li, D.M.; Li, Y.T. Temporal and spatial variation characteristics and influencing factors of carbon emissions in the transportation industry. Environ. Sci. 2021, 47, 62–70. [Google Scholar]
  13. Chen, Y.C.; Xia, Y.Y. Research on the impact of FDI and industrial structure on carbon emissions: Taking the eastern, central and western my country as an example. Inn. Mong. Coal Econ. 2018, 7, 12–13. [Google Scholar]
  14. Yin, J.P.; Zhang, Y.X.; Fu, Y. Research on carbon emission and carbon absorption potential of forest vegetation in China. For. Resour. Manag. 2021, 3, 53–61. [Google Scholar]
  15. Magazzino, C.; Mele, M. On the relationship between transportation infrastructure and economic development in China. Res. Transp. Econ. 2021, 88, 100947. [Google Scholar] [CrossRef]
  16. Mashud, A.H.M.; Pervin, M.; Mishra, U. A sustainable inventory model with controllable carbon emissions in green-warehouse farms. J. Clean. Prod. 2021, 298, 126777. [Google Scholar] [CrossRef]
  17. Ağbulut, Ü. Forecasting of transportation-related energy demand and CO2 emissions in Turkey with different machine learning algorithms. Sustain. Prod. Consum. 2022, 29, 141–157. [Google Scholar] [CrossRef]
  18. Los, B.; Ve RspagenP, B. Localized innovation, localized diffusion and the environment: An analysis of reductions of CO2, emissions by passenger cars. J. Evol. Econ. 2009, 19, 507–526. [Google Scholar] [CrossRef]
  19. Gonz, L.; Ventura, J.; Cárcaba, A. Product efficiency in the Spanish automobile market. Investig. Eur. Dir. Econ. Empresa 2013, 19, 1–7. [Google Scholar]
  20. Hampf, B.; Krger, J.J. Technical efficiency of automobiles-a nonparametric approach incorporating carbon dioxide emissions. Transp. Res. Part D Transp. Environ. 2014, 33, 47–62. [Google Scholar] [CrossRef]
  21. Sgouridis, S.; Bonnefoy, P.A.; Hansman, R.J. Air transportation in a carbon constrained world: Long-term dynamics of policies and strategies for mitigating the carbon footprint of commercial aviation. Transp. Res. Part A Policy Pract. 2011, 45, 1077–1091. [Google Scholar] [CrossRef]
  22. Yorucu, V. Growth impact of CO2 emissions caused by tourist arrivals in Turkey: An econometric approach. Int. J. Clim. Chang. Strateg. Manag. 2016, 8, 19–37. [Google Scholar] [CrossRef]
  23. Labib, S.M.; Neema, M.N.; Rahaman, Z. Carbon dioxide emission and bio-capacity indexing for transportation activities: A methodological development in determining the sustainability of vehicular transportation systems. J. Environ. Manag. 2018, 223, 57–73. [Google Scholar] [CrossRef] [PubMed]
  24. Li, Y.; Li, X.D.; Lv, X.L. Grey Correlation and Prediction Analysis of Transportation Carbon Emissions in Shaanxi Province. In Proceedings of the 2019 World Transportation Conference, Beijing, China, 13–16 June 2019. [Google Scholar]
  25. Dai, W.T. Research on the Environmental Effects and Driving Mechanism of Carbon Emissions from Transportation in Sichuan Province; Southwest Jiaotong University: Chengdu, China, 2019. [Google Scholar]
  26. Song, M.; Hao, X.G. Analysis of Influencing Factors of Energy Consumption Carbon Emissions in Beijing’s Transportation Industry. China Energy 2018, 40, 42–47. [Google Scholar]
  27. Lv, Q.; Gao, J.L. The transportation carbon emission model and driving factor analysis in Beijing-Tianjin-Hebei region. Ecol. Econ. 2018, 34, 31–36. [Google Scholar]
  28. Wang, Y.Q.; Jiang, H.Y.; Fang, C.C. Measurement and Analysis of Total Factor Carbon Emission Efficiency of Transportation Industry in Six Central Provinces. Highw. Automob. Transp. 2020, 3, 15–20. [Google Scholar]
  29. Zhou, Y.X.; Hong, X.J. The measurement and dynamic driving mechanism of total factor carbon emission efficiency in China’s transportation industry. Bus. Econ. Manag. 2018, 5, 62–74. [Google Scholar]
  30. Yuan, C.W.; Zhang, S.; Jiao, P. Research on temporal and spatial changes and influencing factors of total factor carbon emission efficiency of transportation in China. Resour. Sci. 2017, 39, 687–697. [Google Scholar]
  31. Mishalani, R.G.; Goel, P.K.; Westra, A.M. Modeling the relationships among urban passenger travel carbon dioxide emissions, transportation demand and supply, population density, and proxy policy variables. Transp. Res. Part D Transp. Environ. 2014, 33, 146–154. [Google Scholar] [CrossRef]
  32. Achour, H.; Belloumi, M. Decomposing the influencing factors of energy consumption in Tunisian transportation sector using the LMDI method. Transp. Policy 2016, 52, 64–71. [Google Scholar] [CrossRef]
  33. Timilsina, G.R.; Shrestha, A. Transport sector CO2 emissions growth in Asia: Underlying factors and policy options. Energy Policy 2009, 37, 4523–4539. [Google Scholar] [CrossRef]
  34. Jia, J.W. Research on the influencing factors and countermeasures of transportation carbon emissions in Hebei Province based on GRA. Hebei Enterp. 2020, 9, 72–73. [Google Scholar]
  35. Wang, H.Y.; Wang, N. Research on the influencing factors of carbon emissions in China’s comprehensive transportation system. Logist. Technol. 2019, 2, 78–83. [Google Scholar]
  36. Xing, L.M. Analysis of Influencing Factors of China’s Transportation Energy Consumption and Energy Saving and Emission Reduction Potential; Shaanxi Normal University: Xi’an, China, 2017. [Google Scholar]
  37. Lesiv, M.; Bun, R. Geoinformation Technologies and Spatial Analysis of Carbon Dioxide. Transport through Border Line. Artif. Intell. 2010, 4, 322–329. [Google Scholar]
  38. Réquia, W.J.; Koutrakis, P.; Roig, H.L. Spatial distribution of vehicle emission inventories in the Federal District, Brazil. Atmos. Environ. 2015, 112, 32–39. [Google Scholar] [CrossRef]
  39. Keuken, M.P.; Jonkers, S.; Verhagen, H.L.M. Impact on air quality of measures to reduce CO2 emissions from road traffic in Basel, Rotterdam, Xi’an and Suzhou. Atmos. Environ. 2014, 98, 434–441. [Google Scholar] [CrossRef]
  40. Liu, Y.H. Silk Road Economic Belt Transportation Carbon Emission Spatial Transfer Analysis. Financ. Econ. Theory Pract. 2016, 37, 129–133. [Google Scholar]
  41. Zhang, C.; Nian, J. Panel estimation for transport sector CO2, emissions and its affecting factors: A regional analysis in China. Energy Policy 2013, 63, 918–926. [Google Scholar] [CrossRef]
  42. Yang, B.; Ning, X.L. China’s transportation carbon emissions measurement and spatial pattern analysis from the perspective of new urbanization. J. Inn. Mong. Norm. Univ. 2015, 5, 667–673. [Google Scholar]
  43. Xu, B.; Lin, B.Q. Differences in regional emissions in China’s transport sector: Determinants and reduction strategies. Energy 2016, 95, 459–470. [Google Scholar] [CrossRef]
  44. Zhang, S.Q.; Wang, J.W.; Zheng, W.L. Spatial and temporal difference analysis of China’s transportation carbon emissions and influencing factors. J. Environ. Sci. 2017, 37, 4787–4797. [Google Scholar]
  45. Li, W.; Sun, W. Temporal and spatial distribution characteristics of carbon emissions in the provincial transportation industry. Syst. Eng. 2016, 34, 30–38. [Google Scholar]
  46. Färe, R.; Lovell, C.A.K. Measuring the Technical Efficiency of Production. J. Econ. Theory 1978, 19, 150–162. [Google Scholar] [CrossRef]
  47. Wang, B.X.; Guo, K. The Efficient of Carbon Emissions Efficiency of Beijing Public Transportation System: Based on Super-Efficiency SBM Model Using Malmquist-Luenberger Index. J. Syst. Sci. Math. Sci. 2018, 38, 456–467. [Google Scholar]
  48. Taleb, M.; Ramli, R.; Khalid, R. Developing a two-stage approach of super efficiency slack-based measure in the presence of non-discretionary factors and mixed integer-valued data envelopment analysis. Expert Syst. Appl. 2018, 103, 14–24. [Google Scholar] [CrossRef]
  49. Ma, D.L.; Chen, Z.C.; Wang, L. Spatial measurement of inter-provincial carbon emission efficiency in China. China Popul.·Resour. Environ. 2015, 25, 67–77. [Google Scholar]
  50. Chen, Q.L. An Empirical Study on the Impact of Regional Economy on Comprehensive Transportation Efficiency. China Mark. 2020, 9, 34. [Google Scholar]
  51. Li, J.W.; Zhang, G.Q. Estimation of capital stock and return on capital of China’s transportation infrastructure. Contemp. Financ. 2016, 6, 3–14. [Google Scholar]
  52. Bai, C.E.; Qian, Y.Y. Infrastructure Development in China: The Cases of Electricity, Highways, and Railways. J. Comp. Econ. 2010, 38, 34–51. [Google Scholar] [CrossRef]
  53. Lan, Z.R.; Zhang, H.W. Research on inter-provincial differences in carbon emission efficiency of China’s transportation industry. Logist. Technol. 2014, 33, 132–135. [Google Scholar]
  54. Yang, J.M.; Wan, W.J. Carbon emission accounting and emission reduction scenario analysis of provincial transportation industry. Highway 2017, 62, 155–159. [Google Scholar]
  55. Zhang, Y.; Yu, Z.; Zhang, J. Analysis of carbon emission performance and regional differences in China’s eight economic regions: Based on the super-efficiency SBM model and the Theil index. PLoS ONE 2021, 16, e0250994. [Google Scholar] [CrossRef] [PubMed]
  56. Zhang, S. Research on the Measurement of Transportation Carbon Emissions and Economic Efficiency Based on RAM Model; Chang’an University: Xi’an, China, 2018. [Google Scholar]
  57. Shao, H.Q.; Wang, Z.F. Spatial correlation network structure of China’s transportation carbon emission efficiency and its influencing factors. China Population. Resour. Environ. 2021, 31, 32–41. [Google Scholar]
  58. Zhang, Q. Research on Transportation Carbon Emission Efficiency Based on Super-SBM Model; Chang’an University: Xi’an, China, 2018. [Google Scholar]
  59. Xu, Y.; Wang, Z.P. Carbon emission measurement and factor decomposition of my country’s transportation industry. Logist. Technol. 2011, 30, 16–18. [Google Scholar]
  60. Lu, J.F.; Fu, H.; Wang, X.X. A Study on Influencing Factors of Carbon Emission Efficiency in Regional Transportation Industry. Transp. Syst. Eng. Inf. 2016, 16, 25–30. [Google Scholar]
  61. Xu, S.C.; Xi, R.; He, Z.X. Analysis of Influencing Factors and Policy Implications of Carbon Emissions from Energy Consumption in China. Resour. Sci. 2012, 34, 2–12. [Google Scholar]
  62. Xie, S.H.; Cai, H.Y.; Xia, G.X. Measurement and influencing factors of carbon emissions in China’s transportation industry. Resour. Environ. Arid. Reg. 2016, 5, 13–18. [Google Scholar]
  63. Mao, C.C.; Ma, Z.X. The analysis of the regional economic growth and the regional financial industry development difference in china based on the theil index. Int. J. Econ. Financ. Stud. 2021, 13, 128–154. [Google Scholar]
Figure 1. Variation of CEE of transportation in eastern, central, and western China.
Energies 15 06502 g001
Figure 2. Trend of Theil index of transportation industry CEE.
Energies 15 06502 g002
Figure 3. Trend of Theil index of transportation CEE in three regions in China.
Energies 15 06502 g003
Figure 4. Trends of sources of regional differences in transportation CEE.
Energies 15 06502 g004
Table 1. Conversion coefficients of standard coal for various energy sources.
Energy NameConverted to Standard Coal CoefficientEnergy NameConverted to Standard Coal Coefficient
raw coal0.7143kerosene1.4714
coal0.9714diesel fuel1.4571
crude1.4286liquefied petroleum gas1.7143
fuel oil1.4286natural gas1.3300
gasoline1.4714electricity0.1229
Note: The data in the table are compiled by the author according to China Energy Statistical Yearbook 2008; the unit of conversion to standard coal is kg standard coal/kg, kg standard coal/m3, or kg standard coal/kWh.
Table 2. Carbon emission coefficients of various energy sources.
Fuel TypeCarbon Emission
Coefficient
Fuel TypeCarbon Emission
Coefficient
raw coal1.9804diesel fuel3.1645
coke3.0463fuel oil3.2406
gasoline2.9885liquefied petroleum gas3.1702
crude3.0689natural gas2.1867
kerosene3.1006electricity2.2132
Note: Based on the appendix of the China Energy Statistical Yearbook (2008) (reference coefficients for converting various energy sources to standard coal) and the 2006 IPCC Guidelines for National Greenhouse Gas Emissions Inventory.
Table 3. Calculation results of transportation industry CEE.
Region2008200920102011201220132014201520162017201820192020Mean
EasternBeijing0.5130.6250.6460.6530.7640.7760.7560.8620.8770.8970.9231.1561.1740.817
Tianjin0.7130.7940.8570.9340.9560.9721.1161.1371.2161.3481.3981.4451.4761.105
Hebei0.7110.8340.9360.9650.9660.9761.0491.1161.2761.2871.3031.4261.4821.102
Liaoning0.3570.4160.4650.4770.4820.5180.5270.5380.5750.6560.6890.7410.8760.563
Shanghai0.5210.6560.6750.6650.7160.7540.8170.8580.8890.8970.9431.1871.2140.830
Jiangsu0.7430.8770.8580.9170.9480.9680.9820.9931.1341.1831.2721.3951.4981.059
Zhejiang0.5160.6040.7370.8170.9100.9670.9790.9961.0161.0761.1271.2181.3190.945
Fujian0.3170.3270.3170.3320.3410.3860.4210.4650.5170.5820.6170.6540.7330.462
Shandong0.3160.3260.3290.3370.3580.4040.5380.5980.6320.7180.8530.8950.9580.559
Guangdong0.3150.3460.3820.4110.5330.6160.7640.7360.7870.7980.8170.8280.9290.636
Hainan0.4330.4670.4880.5260.5570.6370.6680.7580.7870.7820.8160.8550.8890.666
Eastern Mean0.4960.5700.6080.6390.6850.7250.7830.8230.8820.9290.9781.0731.1410.795
CentralShanxi0.3210.4230.4660.5230.5680.6450.6870.7440.7760.7980.8120.8410.8560.651
Jilin0.3110.4240.4350.4260.46710.5560.5880.6430.7650.7880.8340.8540.8970.614
Heilongjiang0.3230.3360.3560.4310.4590.5470.5780.5980.6160.6450.6660.6760.6780.531
Anhui0.3210.3210.3340.4150.5110.5320.5460.5560.5640.5710.5780.6090.6370.500
Jiangxi0.7150.7560.7680.7890.8450.9180.9890.9971.1561.2451.2821.3771.4121.019
Henan0.4170.4230.4260.4250.4280.4380.4370.4480.4690.4750.4890.4960.5450.455
Hubei0.4120.4250.4290.4320.4350.4540.4530.4590.4660.4740.4860.5240.6980.473
Hunan0.1560.1630.1790.2560.2880.3450.3560.3670.4360.4650.4710.4790.5680.348
Central mean0.3720.4090.4240.4620.5000.5540.5790.6020.6560.6830.7020.7320.7860.574
WesternNeimenggu0.1210.2270.2310.2470.2520.2670.3140.4220.5340.5440.6540.6630.7610.403
Guangxi0.1170.1250.1430.2510.3560.3890.3920.4440.4650.4730.5450.7670.8170.406
Chongqing0.1120.1340.1370.1520.2340.2760.2890.2980.3120.3140.3250.3290.3560.251
Sichuan0.1240.1460.1690.1780.2150.2420.2820.2970.3070.3160.4120.4450.5270.282
Guizhou0.1180.1190.1310.1410.1450.2270.2370.2480.3270.3650.4250.4310.5180.264
Yunnan0.1290.2270.2260.2460.2530.3150.3270.3580.3760.3950.4430.4540.5280.329
Shaanxi0.1150.1160.1260.1380.2270.2580.2790.2910.3240.3450.3340.3560.4130.256
Gansu0.2120.2140.2250.2340.2520.3640.3710.3880.4270.5330.6480.6760.7330.406
Qinghai0.6210.6360.6810.7260.8560.9731.1131.2241.2651.2781.3241.33561.3461.029
Ningxia0.6220.6350.6870.7150.8340.9251.1081.2311.2441.2521.3141.3271.3461.018
Xinjiang0.2150.2220.2750.3050.3210.3370.3550.3670.4270.4320.5120.6220.7380.394
Western mean0.2280.2550.2760.3030.3590.4160.4610.5060.5460.5680.6310.6730.7350.458
National mean0.3650.4110.4370.4690.5160.5660.6110.6480.6990.7310.7770.8350.8970.612
Table 4. Theil index of transportation industry CEE.
YearT T B T w
20080.1770.0380.139
20090.1780.0370.141
20100.180.0350.145
20110.180.0340.146
20120.1770.0340.143
20130.1670.0280.139
20140.1630.0260.137
20150.1610.0280.133
20160.1630.0290.134
20170.1590.0240.135
20180.1600.0220.138
20190.1640.0190.145
20200.1730.0160.157
Table 5. Decomposition results of Theil index of transportation CEE in three regions in China.
YearTwiTBTW
EastCentralWest
20080.06660.04870.02950.01440.0926
20090.08220.03450.03870.01420.0956
20100.09560.03220.06670.01450.1012
20110.10160.03340.05260.01470.1014
20120.10560.04670.06870.01310.0987
20130.10760.03980.07670.01270.0967
20140.09980.02790.09560.01250.0983
20150.11340.03760.09570.01140.0975
20160.09560.04570.08780.01020.0969
20170.09870.03870.09560.00850.0965
20180.10230.03780.09950.00620.0953
20190.10450.03820.09890.00430.0945
20200.11220.03240.08620.00560.0921
Table 6. Source results of regional differences in transportation CEE.
YearTW/TTB/TEastern Contribution RateCentral Contribution RateWestern Contribution Rate
20080.8650.1350.60350.14110.0834
20090.8710.1290.60480.12130.1111
20100.8750.1250.61020.10010.1556
20110.8730.1270.60940.09340.1845
20120.8830.1170.60780.10140.1856
20130.8840.1160.60450.10020.1878
20140.8870.1130.60110.09870.1976
20150.8950.1050.59670.08680.2023
20160.9050.0950.59560.08940.2132
20170.9190.0810.59340.12450.1876
20180.9390.0610.58870.12560.1887
20190.9560.0440.58670.1140.2067
20200.9430.0570.59120.10210.2034
Mean0.90000.10000.5990.1050.185
Table 7. Correlation measurement results.
Energy StructureTransport InfrastructureUrbanizationGDP per Capita
Correlation−0.2423−0.1722−0.0813−0.0022
Sequence1234
Publisher’s Note: MDPI stays neutral with regard to jurisdictional claims in published maps and institutional affiliations.

