Article

A Predicting Model for the Effective Thermal Conductivity of Anisotropic Open-Cell Foam

1
State Key Laboratory for Strength and Vibration of Mechanical Structures, School of Aerospace Engineering, Xi’an Jiaotong University, Xi’an 710049, China
2
State Key Laboratory of Aerodynamics, China Aerodynamics Research and Development Center, Mianyang 621000, China
*
Authors to whom correspondence should be addressed.
Energies 2022, 15(16), 6091; https://doi.org/10.3390/en15166091
Submission received: 7 July 2022 / Revised: 17 August 2022 / Accepted: 18 August 2022 / Published: 22 August 2022

Abstract

:
The structural anisotropy of open-cell foam leads to the anisotropy of effective thermal conductivity (ETC). To quantitatively analyze the effect of structural anisotropy on the anisotropy of ETC, a new predicting model for the ETC of anisotropic open-cell foam was proposed based on an anisotropy tetrakaidecahedron cell (ATC). Feret diameters in three orthogonal directions obtained by morphological analysis of real foam structures were used to characterize the anisotropy of ATC. To validate our proposed anisotropic model, the ETCs of real foam structures in three orthogonal directions predicted by it were compared with the numerical results, for which the structures of numerical models are reconstructed by X-ray computed tomography (X-CT). Using the present anisotropic model, the influences of the thermal conductivity ratio (TCR) and porosity of the foams on the anisotropic ratios of ETCs are also investigated. Results show that there is good consistency between the ETCs obtained by the anisotropic model and the numerical method. The maximum relative errors between them are 2.84% and 13.57% when TCRs are 10 and 100, respectively. The present anisotropic model can not only predict the ETCs in different orthogonal directions but also quantitatively predict the anisotropy of ETC. The anisotropies of the ETCs decrease with porosity because the proportion of the foam skeleton decreases. However, the anisotropies of ETCs increase with TCR, and there exist asymptotic values in anisotropic ratios of ETCs as TCR approaches infinity and they are equal to the relative Feret diameters in different orthogonal directions.

1. Introduction

Open-cell foam materials owning lightweight and high heat transfer surface area are widely used for the active cooling systems of aircraft [1,2,3], and it is of great significance to accurately characterize their thermophysical parameters. In the thermophysical parameters of foam material, the effective thermal conductivity (ETC) is an important parameter for characterizing the heat transfer performance of materials [4]. However, the characteristics of foam material make it difficult to accurately predict its ETC. In particular, foam cells are usually elongated by the forces of viscosity and gravity during manufacturing [5,6], which means that cells are not symmetric. This asymmetry causes an inevitable structural anisotropy, which results in different ETCs of foam material in different directions.
Some studies have analyzed the asymmetry anisotropy of microstructures [7,8,9,10]. The results indicate that the anisotropy of structures is relative to the pores per inch (PPI) of the foam materials. Among them, Gong et al. [7] used the ratios of elongation in different orthogonal directions to define the anisotropies of polyurethane (PU) foams, and the influence of pores per inch (PPI) and porosity were analyzed. They found that the anisotropies of structures decreased with the increase of PPI in the same porosity. Perrot et al. [8] and Jang et al. [9] then analyzed the anisotropy of aluminum foams with different average cell sizes. They found that the anisotropy ratios of aluminum foams decrease with PPI. The influence of PPI on the anisotropy of titanium foam was experimentally investigated by Manonukul et al. [10], who found that the anisotropy of the structures was less pronounced in titanium foam compared to the corresponding PU foam in different PPI due to the influence of the processing technology. The influence of porosity was studied by Huber and Gibson [11], who reported that the anisotropy of structures increases with porosity. In fact, the porosity decreases with the increase of PPI when the total volume of the representative element is constant. Therefore, the influence mechanisms of PPI and porosity on structural anisotropies are the same.
The above works mainly focused on the anisotropy of structure; the effect of the anisotropy on the heat transfer was seldom discussed. The anisotropy of convection heat transfer was investigated by Iasiello et al. [12,13,14]. They focused on a qualitative comparison of heat transfer anisotropy. There are few quantitative analyses of anisotropy in the research. Bodla et al. [15] predicted the heat transfer coefficient of foam in three orthogonal directions; the heat transfer coefficients exist 10–20% differences for samples of the same volumetric porosity, which proves that the influence of structural anisotropy on heat transfer cannot be ignored. Amani et al. [16] used X-ray tomography to restructure three-dimensional microstructures of an aluminum alloy foam and used the finite element method (FEM) to predict the ETCs in three directions. The numerical and experimental results both pointed out that both the cell sizes and the ETCs were larger in one direction than those in others. Therefore, it can be found that a relationship might exist between the anisotropies of cell elongation and ETC. However, the relationships between structural and ETC’s anisotropies were not discussed in their work. Iasiello et al. [17] used FEM to predict the ETCs in three directions numerically, and foam cell elongation was quantified by an anisotropy ratio. They found that the anisotropy ratio and the ETC ratio in different directions are positively correlated. However, the influence of the thermal conductivity of media in pores on ETC was not considered. In fact, foam materials are often filled with mediums in the pores, and the thermal conductivity of media in pores has a great influence on the ETCs of foam materials in some service environments [4,18]. Kumar and Topin [19] established various virtual foam samples with circular, square, hexagon, diamond and star strut cross sections. The anisotropy of the original foam sample is realized by elongating in one direction. The effect of structural anisotropy on the ETCs was predicted using numerical and theoretical methods, respectively. They found that increased stretching along a direction resulted in larger effective thermal conductivity along the same direction. However, Kumar and Topin [19] used virtual foam samples and the nodes of foam skeletons were ignored, which is different from the real foam in microstructures. In addition, the relationships between the anisotropies of ETCs and structural anisotropies are still not given quantitatively in these works. Therefore, the quantitative characterization of real foam anisotropy needs to be further investigated.
Before establishing a quantificational anisotropic model for predicting ETCs, the complicated microstructures of open-cell foam, especially the anisotropies of structures, must be accurately characterized. However, many works have focused on isotropic structures, such as sphere cells [20], Kelvin cells [18,21,22], cubic cells [23] and crystal cells [24]. The ETCs predicted by using these isotropic structures are only close to the average values of experiments and they cannot reflect the difference of ETCs under the same porosity, which often appears in experimental measurements [16,22]. Therefore, it is necessary to establish a structure that truly reflects the structural anisotropy of the real foam material. Jang [9] et al. pointed out that the most ideal model to reflect the microstructures of open-cell foams is the Kelvin cell. Then, the Kelvin cell was used to analyze the elastic properties in different directions and the heat transfer performance was not discussed. Perrot et al. [8] used Kelvin cells to characterize the anisotropy of open-cell reticulated foams and morphological characterization was introduced. However, they are concerned with the characterization of the structures, and the heat transfer performance was also not analyzed. The above presented survey of the literature suggests that the characterization of structural anisotropy has been investigated, but the quantitative analysis between structural anisotropy and anisotropy of ETCs needs further discussion.
In this work, a prediction model for the anisotropy of the ETC of open-cell foam with high porosity is proposed. The structure of this paper is as follows. Section 2 introduces the method for establishing a geometrical model of structural anisotropy and the morphological characterization of the anisotropies of foam structures. Then, a predicted model for the anisotropy of the ETC is proposed. Section 3 introduces the numerical method for the validation of the proposed anisotropic model for predicting ETC. The comparisons and discussions of the proposed anisotropic model are made in Section 4. The conclusions are presented in Section 5. The theoretical model proposed in this paper can quickly and accurately predict the ETCs of anisotropic foams in different directions, which can provide theoretical support for the application of foam material in the active cooling system of aircraft.

2. A Predicting Model for the Anisotropic ETCs of Open-Cell Metal Foams

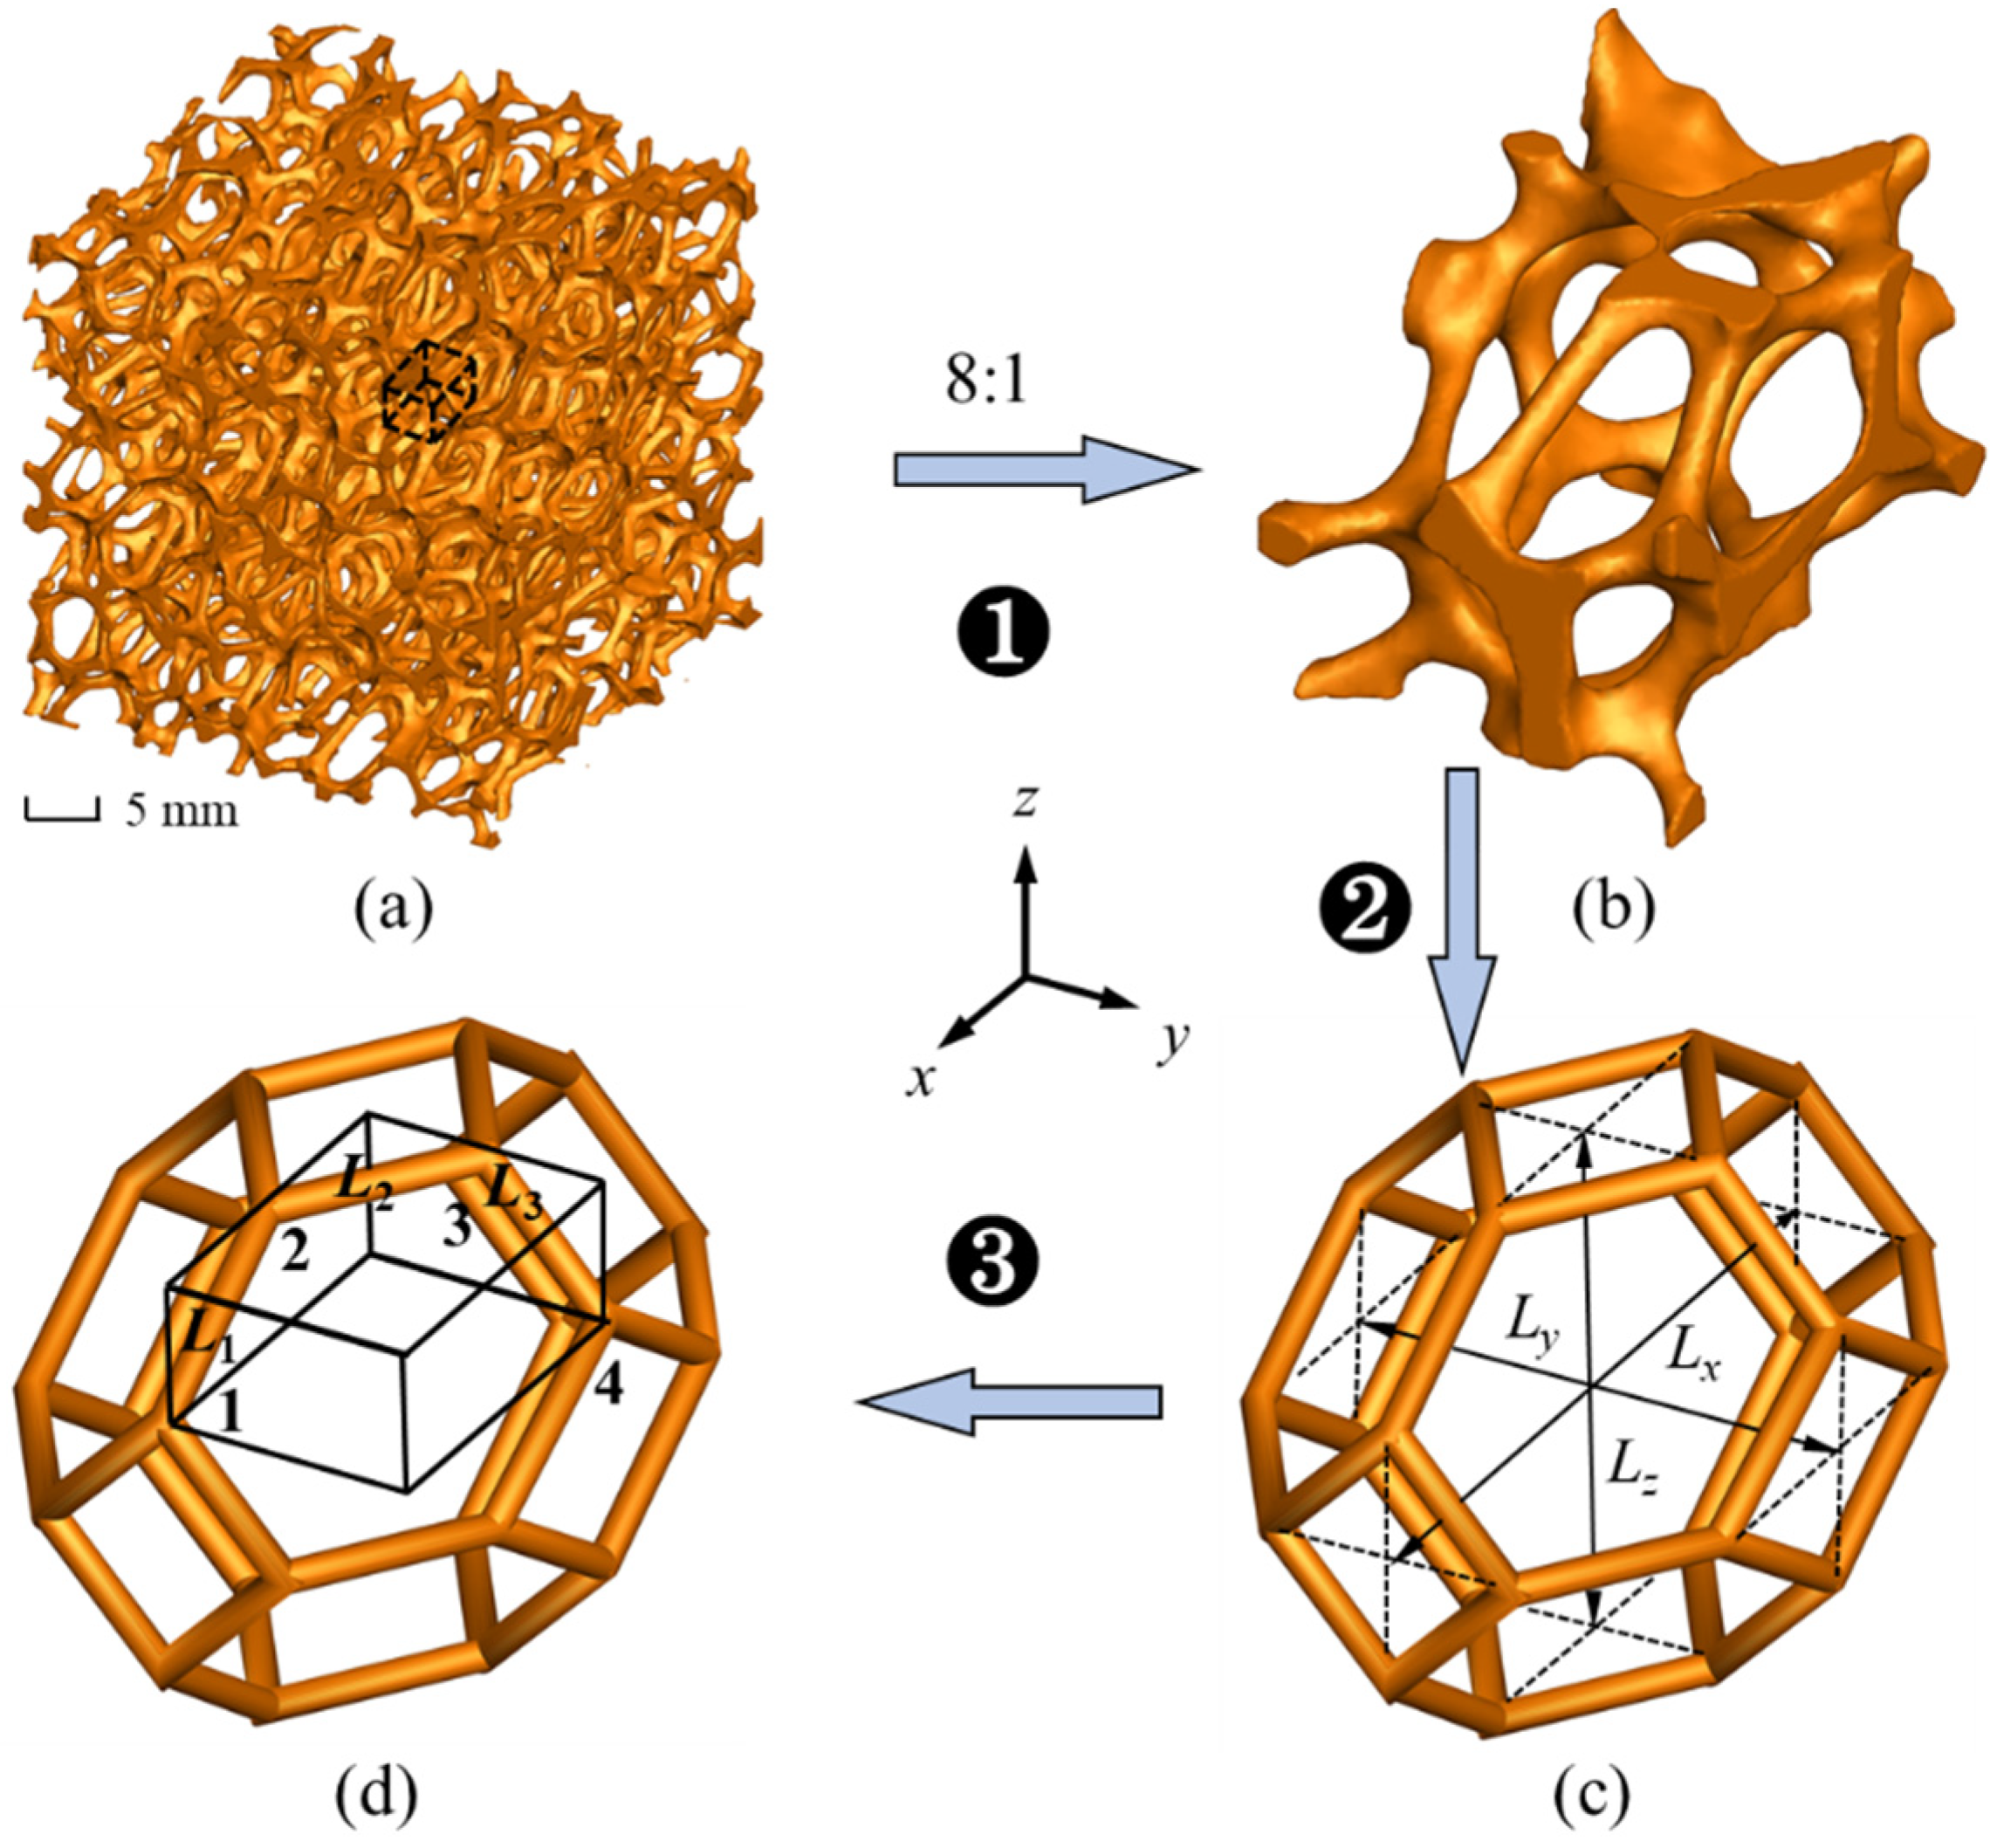
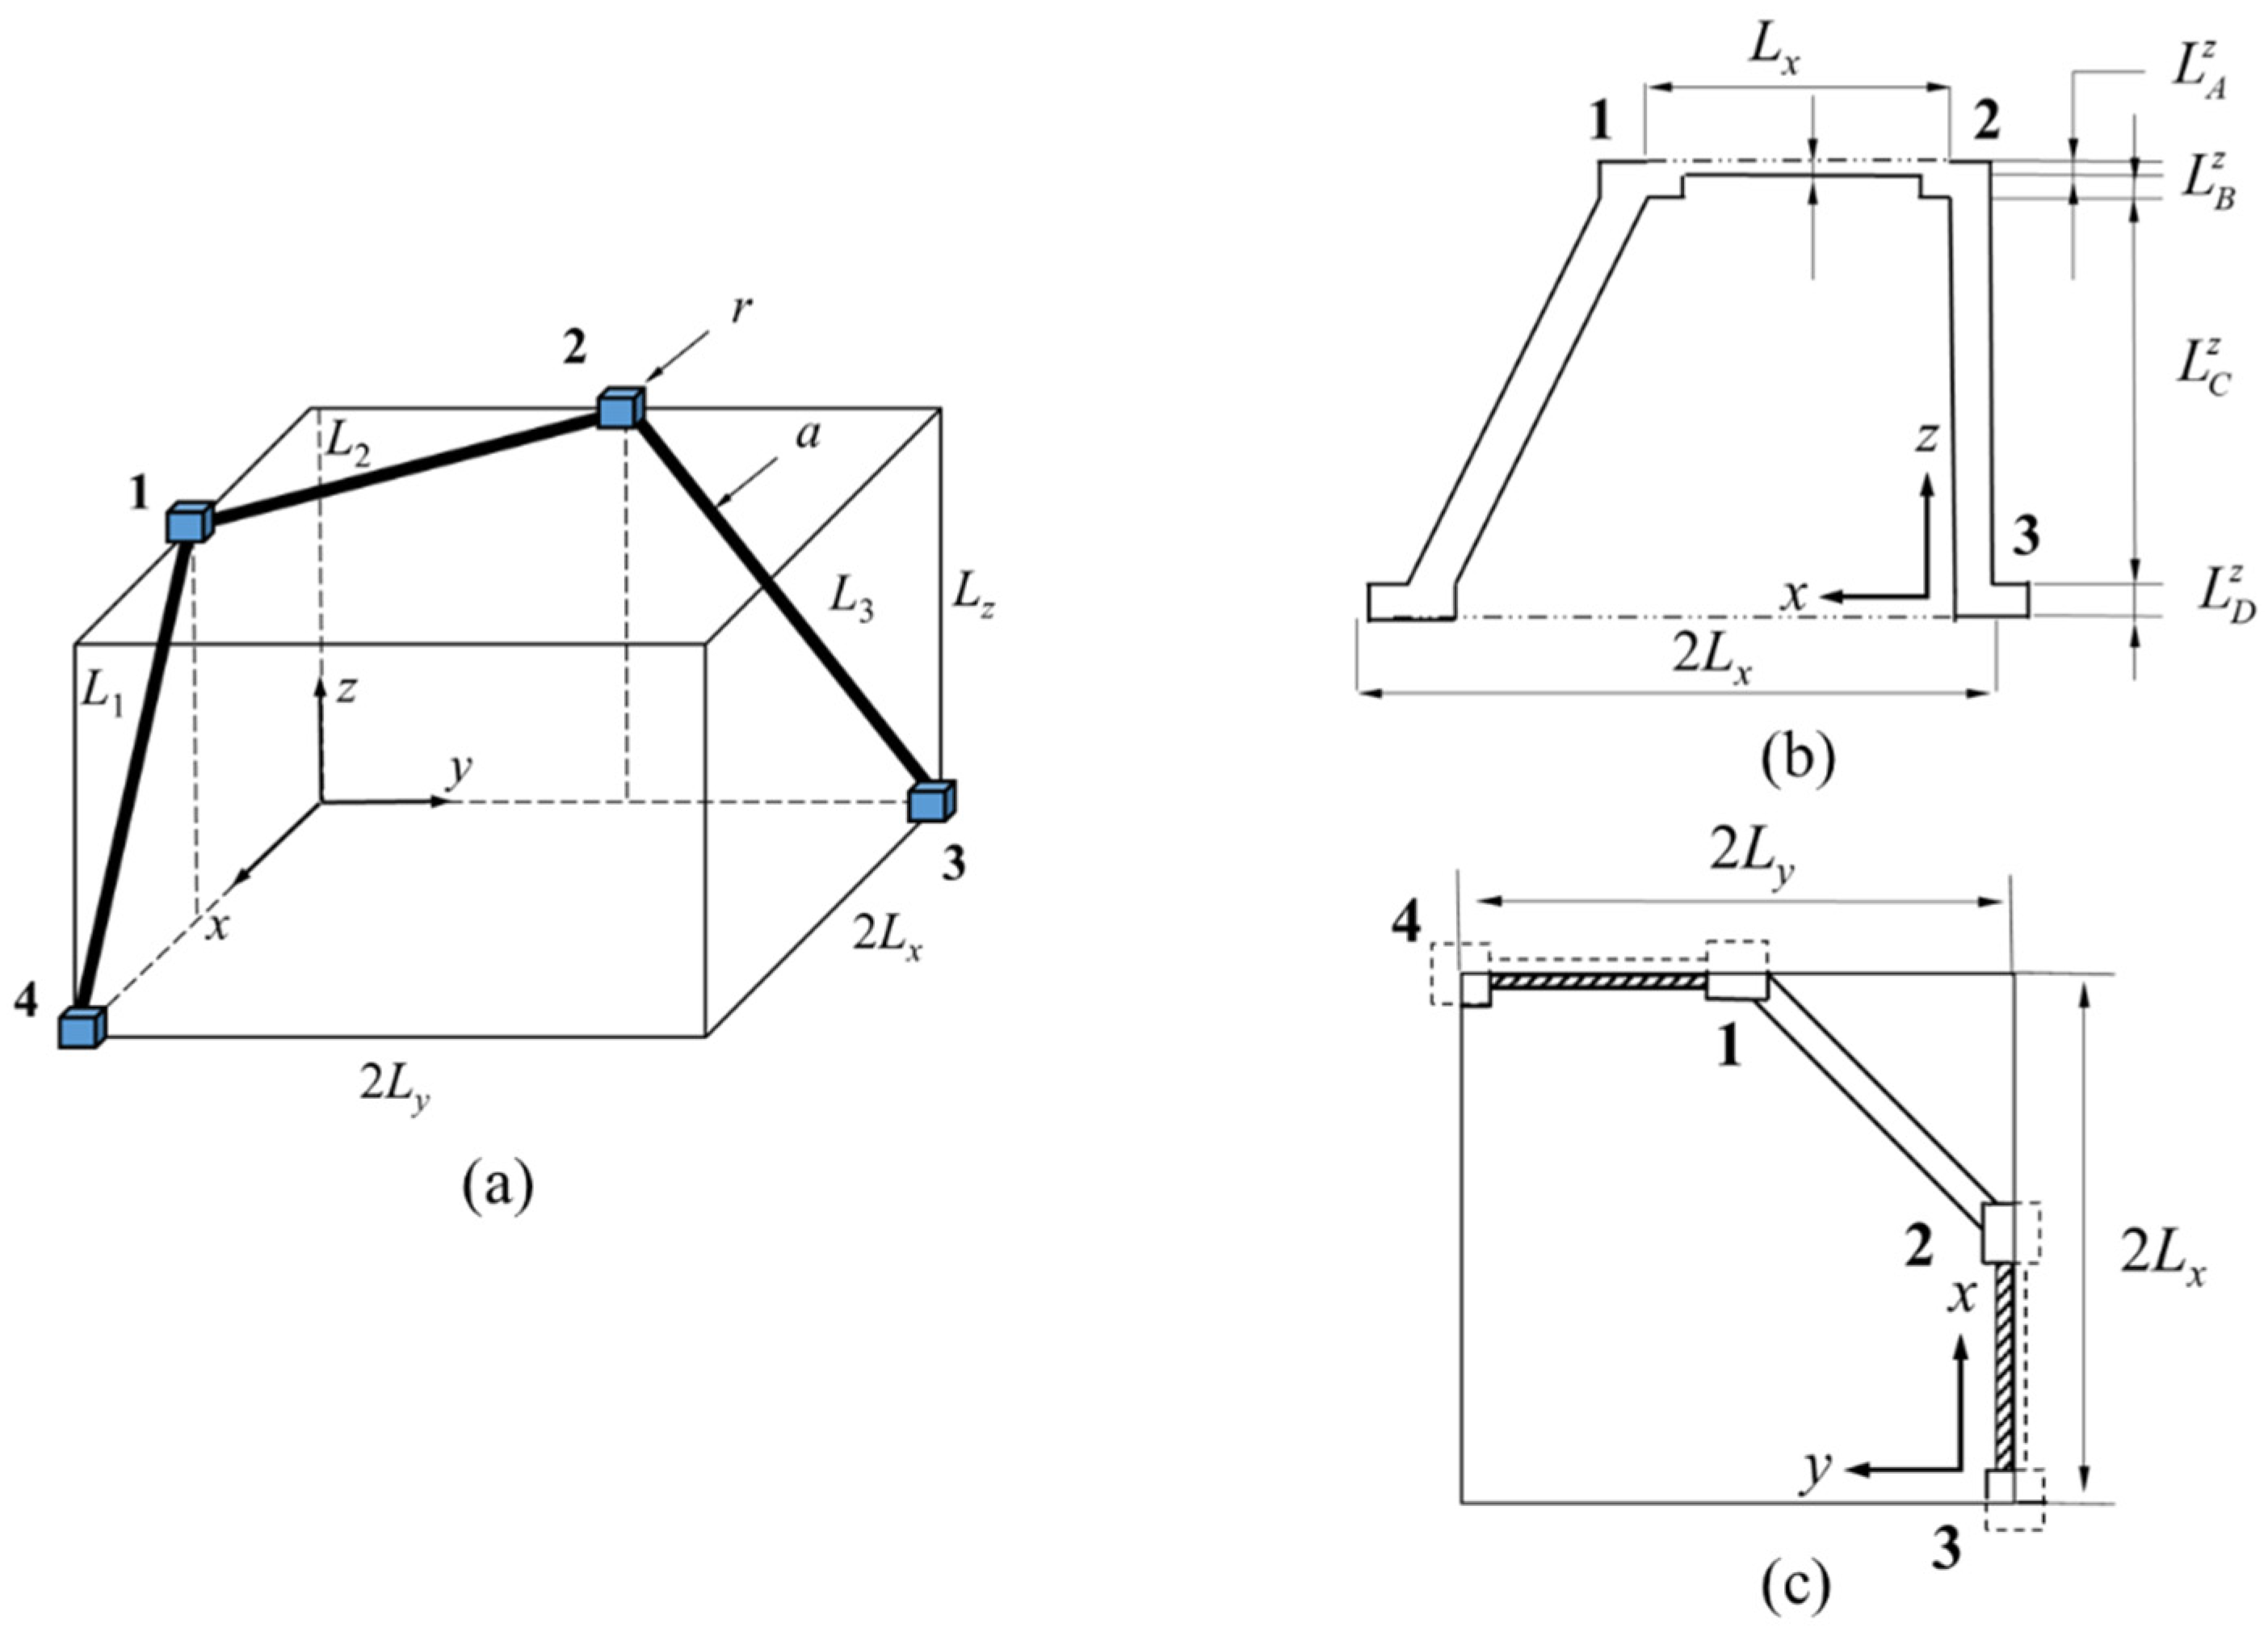
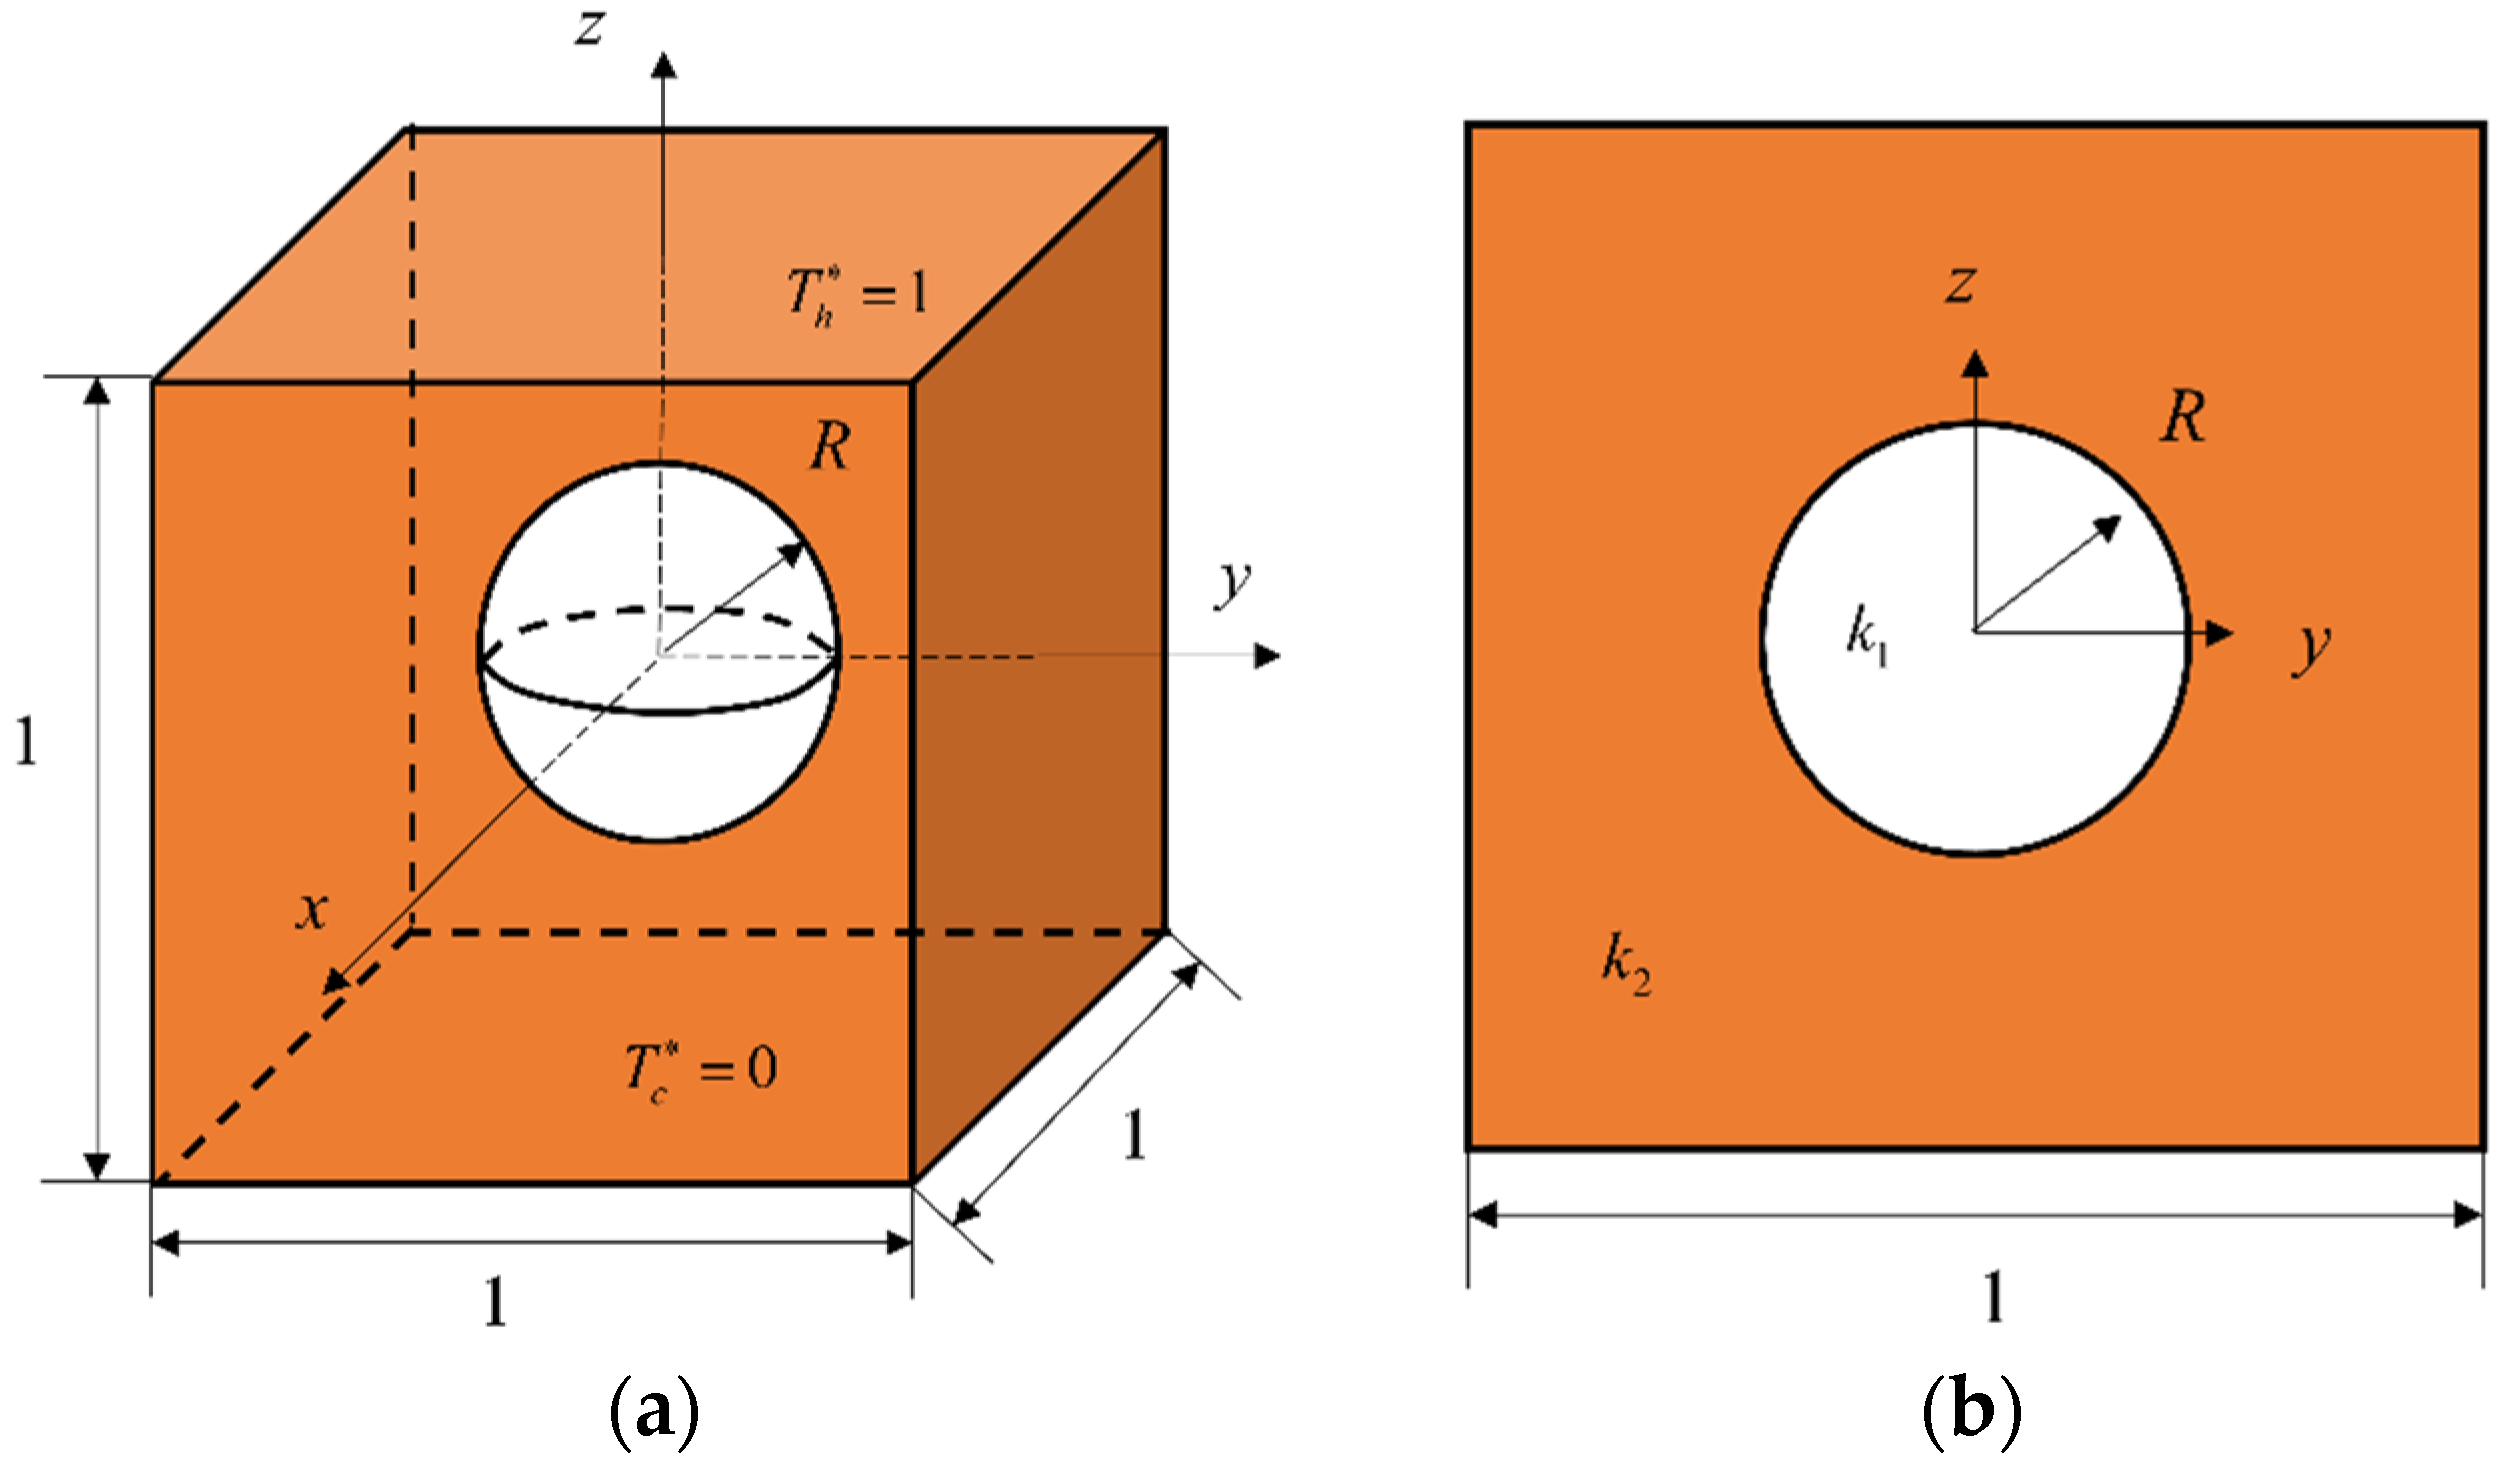
2.1. Geometrical Model

An accurate characterization of the geometrical structures of foam materials is important for developing an effective theoretical model for predicting the anisotropies of ETCs in different directions. Figure 1a–d show the process of the selection of a representative cell and geometric modeling. Figure 1a displays the three-dimensional (3D) microstructures of the copper foam, which is restructured by X-ray computed tomography (X-CT) and the VGStudiomax software, which is visual software for microstructures obtained by X-CT. The macroscopic size of foam is 4 cm × 4 cm × 4 cm. The porosity of the material is calculated according to the pixel distribution of the pores based on the image processing method, which is 0.92. It can be seen that realistic copper foams are constituted by many complex cells containing ligaments and nodes. To select a reasonable representative cell, a single cell was randomly cut from the original foam, as shown in Figure 1b. It can be found that the lengths of the three directions are different, and it is largest in the x direction. The reason for this is that foam cells are elongated perpendicular to the gravitational direction during manufacturing [5,6], which makes the structures obviously anisotropic. In previous theoretical research, the anisotropy of the cell was usually ignored for predicting ETCs. The most widely used geometric model was the Kelvin tetrakaidecahedron cell first proposed in 1887 by Lord Kelvin [25]. Based on Lord Kelvin’s work, many researchers used Kelvin tetrakaidecahedron as a representative cell, and the lengths of the Kelvin tetrakaidecahedron in three directions are the same, which means that the structures are isotropous. However, there are some deviations between the isotropic structure and the actual structure (Figure 1b). An anisotropic tetrakaidecahedron cell is developed based on the traditional isotropic Kelvin tetrakaidecahedron cell, which is shown in Figure 1c. In this structure, the anisotropy of the structure is characterized by the apothems in three directions, which are defined as 4Lx, 4Ly and 4Lz, respectively. (Figure 1c).
In foam structures, the anisotropic tetrakaidecahedron cells are connected with each other, and a hexahedral unit cell can be extracted based on the symmetry of the structures [18,25], as shown in Figure 1d. The basic geometrical characteristics of the anisotropic tetrakaidecahedron cell can be found. In particular, the anisotropy of structures can be expressed not only by 4Lx, 4Ly and 4Lz (Figure 1c) but also by L1, L2 and L3 and the relationships between them are:
L 1 = L x 2 + L z 2 L 2 = L x 2 + L y 2 L 3 = L y 2 + L z 2
Therefore, the hexahedral unit cell is adopted as the most basic representative element for theoretically predicting the ETCs of open-cell metal foams in three directions. As shown in Figure 1d, the ligaments L1, L2 and L3 are connected by nodes 2 and 3. Simultaneously, nodes 1 and 4 are located at vertexes of the hexahedral unit cell, nodes 2 and 3 are located at the center of the cell edge in x and y directions, and ligaments L1, L2 and L3 are confined in the surfaces of the hexahedral unit cell and only half the volume of ligaments is taken into account in order to maintain structural symmetry. In addition, Figure 1c,d exhibits that the three coordinates (x, y, z) are perpendicular to the surfaces of the hexahedral unit cell, which means that the representative element can directly indicate the three main directions of the thermal conductivity. In particular, the heat conduction is assumed in the z direction in Figure 1d and the ETCs in the z direction can be predicted by theoretical analysis. Therefore, the predicted model for ETC in the z direction will be derived first.
Because the distribution of the foam skeletons in the z direction is not uniform, the hexahedral unit cell should be divided by different small hexahedral cells, which can be theoretically and accurately predicted. Figure 2a–c show the schematic diagram of the hexahedral unit cell. The present notes and ligaments of anisotropic tetrakaidekahedron were similar to Boomsma and Poulikakos [18] and Dai et al. [21]. Therefore, following their analysis, four hexahedral blocks (A, B, C, D) with thickness of L A z , L B z , L C z and L D z in z direction. In Figure 2a, a is the radius of the foam ligament, and r is the edge length of the cubic nodes. ϕ x z and ϕ y z are the angles between L1, L3 and the bottom surface, respectively, and they are computed by:
cos ϕ x z = L x L 1 cos ϕ y z = L y L 3
Through the above definitions and assumptions, the lengths in the z direction satisfy the following equations:
L A z + L B z + L C z + L D z = L z
where
L A z = a
L B z = r / 2 a
L C z = L z r
L D z = r / 2
From Equations (4)–(7), the total volumes of pores and foam skeletons for different heights can be calculated as follows:
V A z = 4 a L x L y
V B z = 2 ( r 2 a ) L x L y
V C z = 4 ( L z r ) L x L y
V D z = 2 r L x L y
where, V A z , V B z , V C z and V D z are the total volumes of pores and foam skeletons at the A, B, C and D layers, respectively.
In addition, the volumes of foam skeletons at different heights can also be calculated according to Equations (4)–(7).
V A , S z = a r 2 + 1 2 π a 2 [ L 2 r ]
V B , S z = ( r / 2 a ) r 2
V C , S z = 1 2 π a 2 [ L 1 + L 3 ]
V D , S z = 1 4 r 3
where, V A , S z , V B , S z , V C , S z and V D , S z are the total volumes of foam skeletons at the A, B, C and D layers, respectively. The Equation (14) is slightly different from the assumptions of Boomsma and Poulikakos [18] and Dai et al. [21]. They suggested that the length of the ligaments should be subtracted from the overlap with the node, and they approximated that the volume of the overlapping region is π a 2 2 r because ϕ x z and ϕ y z are both 45°. In the isotropic tetrakaidecahedron cell, this approximation makes the prediction of ETC precise. However, in the present anisotropic tetrakaidecahedron cell, such an assumption makes the total volumes of skeletons in the hexahedral unit cell different in three directions, which makes the prediction for anisotropy of ETCs incorrect. The reason is that ϕ x z and ϕ y z are different due to the different L1, L2 and L3. In this work, the overlaps of ligaments and nodes are ignored to ensure that the total volumes of skeletons in the hexahedral unit cells in three directions are identical.
Combining Equations (8)–(15), the correlation for computing the porosity of the foam is obtained.
ε = 1 ( V A , S z V A z + V B , S z V B z + V C , S z V C z + V D , S z V D z ) = 2 π a 2 r + 2 π a 2 ( L 1 + L 2 + L 3 ) + 3 r 3 16 L x L y L z
From Equation (16), it is noted that the formulas of porosity can be abstracted as:
ε = f ( a , r , L x , L y , L z )
It can be seen from Equation (17) that the ε is determined by a, r, Lx, Ly and Lz. However, for isotropic models [18,21], ε is only influenced by a and r. When L x = L y = L z , Equation (17) can be simplified to the isotropic model, therefore, present formula can be considered as a modified one based on the isotropic model.

2.2. Effective Thermal Conductivity Model of Open-Cell Metal Foams

In Section 2.1, the geometric features of the anisotropic tetrakaidecahedron cell are introduced. The ETCs in different layers A, B and D can be predicted by the following equations provided by reference [26].
k N z = ε N z k s + ( 1 ε N z ) k f ,   ( N = A , B , D )
where, k s and k f are the thermal conductivities of the foam skeleton and the medium in pores, respectively. ε N z is the volume fraction of foam skeleton in layer N, which is defined as [21]:
ε N z = V N , S z V N z ,   ( N = A , B , D )
k A z = 2 a r 2 + π a 2 [ L 2 r ] 8 a L x L y k s + ( 1 2 a r 2 + π a 2 [ L 2 r ] 8 a L x L y ) k f
k B z = ( r 2 a ) r 2 4 ( r 2 a ) L x L y k s + ( 1 ( r 2 a ) r 2 4 ( r 2 a ) L x L y ) k f
k D z = r 3 8 r L x L y k s + ( 1 r 3 8 r L x L y ) k f
As for layer C, some modified parameters need to be introduced into Equation (18) based on Dai et al.’s point of view [21], which makes the prediction of ETC more accurate. Considering Equation (18), the ETC in layer C can be calculated as [21]:
k N z = ε C z k s cos 2 ϕ + ( 1 ε C z ) k f
where, ε C z is the volume fraction of foam skeleton in layer C, ϕ is the angle between ligament and bottom surface.
By Equation (23), the ETC of layer C can be calculated as:
k C z = [ π a 2 L 1 cos 2 ϕ x z 8 ( L z r ) L x L y + π a 2 L 3 cos 2 ϕ y z 8 ( L z r ) L x L y ] k s + ( 1 π a 2 ( L 1 + L 3 ) 8 ( L z r ) L x L y ) k f
From Figure 2a,b, it can be noted that the configurations of layers A, B, C and D are in series when predicting the ETC in the z direction. Therefore, the ETC of the hexahedral unit cell can be written as [21]:
k e f f z = N L N z N L N z / k N z ,   ( N = A , B , C , D )
Similarly, the ETCs in the x and y directions can be obtained.
In the above equations, there are five main parameters ( L x , L y , L z , a , r ), which determine the characteristics of the structure. Among them, a and r are the parameters that determine porosity. In Yao et al.’s investigations [22], it is found that the influence of r / a is relatively weak. Therefore, the influence of r / a is ignored in the present work and r = 2 a + 0.01 is defined here to guarantee that the values of volumes V B z and V B , S z are positive. Besides, L x , L y , L z are dominant parameters of anisotropy and 4Lx, 4Ly and 4Lz are the diameters of the inscribed circles of the anisotropic tetrakaidecahedron cell in three directions. In the prediction of anisotropic ETCs, an accurate characterization of L x , L y , L z becomes the premise work, which will be quantitatively analyzed in Section 2.3.
In the present work, the ratio of ETCs between one direction and another is used as the characterized parameters of the anisotropy of ETCs, which are defined as:
k a n i x , y = k e f f x k e f f y , k a n i x , z = k e f f x k e f f z , k a n i z , y = k e f f z k e f f y
where, k a n i x , y , k a n i x , z and k a n i z , y represent the anisotropies of ETCs in xy, xz and yz directions, respectively. The dimensionless ETCs in the three directions in Equation (26) are defined as:
k e f f x = k e f f x / k s , k e f f y = k e f f y / k s , k e f f z = k e f f z / k s
From Equations (26) and (27) and Figure 2a, it is found that the anisotropies of ETCs predicted are orthogonal, which means that the ETCs are on the diagonal of the matrix of thermal conductivity. It can be expressed as:
k x y z = [ k e f f x 0 0 0 k e f f y 0 0 0 k e f f z ]
where k x y z is the matrix of ETC.
Finally, combining Equations (25) and (26), a new predicted model for the anisotropies of the ETCs is proposed. In this model, the formulas can be abstracted as:
k a n i m , n = f ( a , r , k s , k f , L x , L y , L z ) ,   ( m = x , y , z ; n = x , y , z )
Combining Equations (17) and (27), Equation (29) can be further abstracted as:
k a n i m , n = f ( ε , k r , d r m , n ) ,   ( m = x , y , z ; n = x , y , z )
where, k r is the thermal conductivity ratio (TCR).
k r = k s k f
d r m , n = L m L n ,   ( m = x , y , z ; n = x , y , z )
From the Equation (30), it can be found that k a n i m , n is mainly influenced by three dimensionless parameters ( ε , k r and d r m , n ). Among them, the parameter d r m , n is a new variable compared with the traditionally theoretical formula.

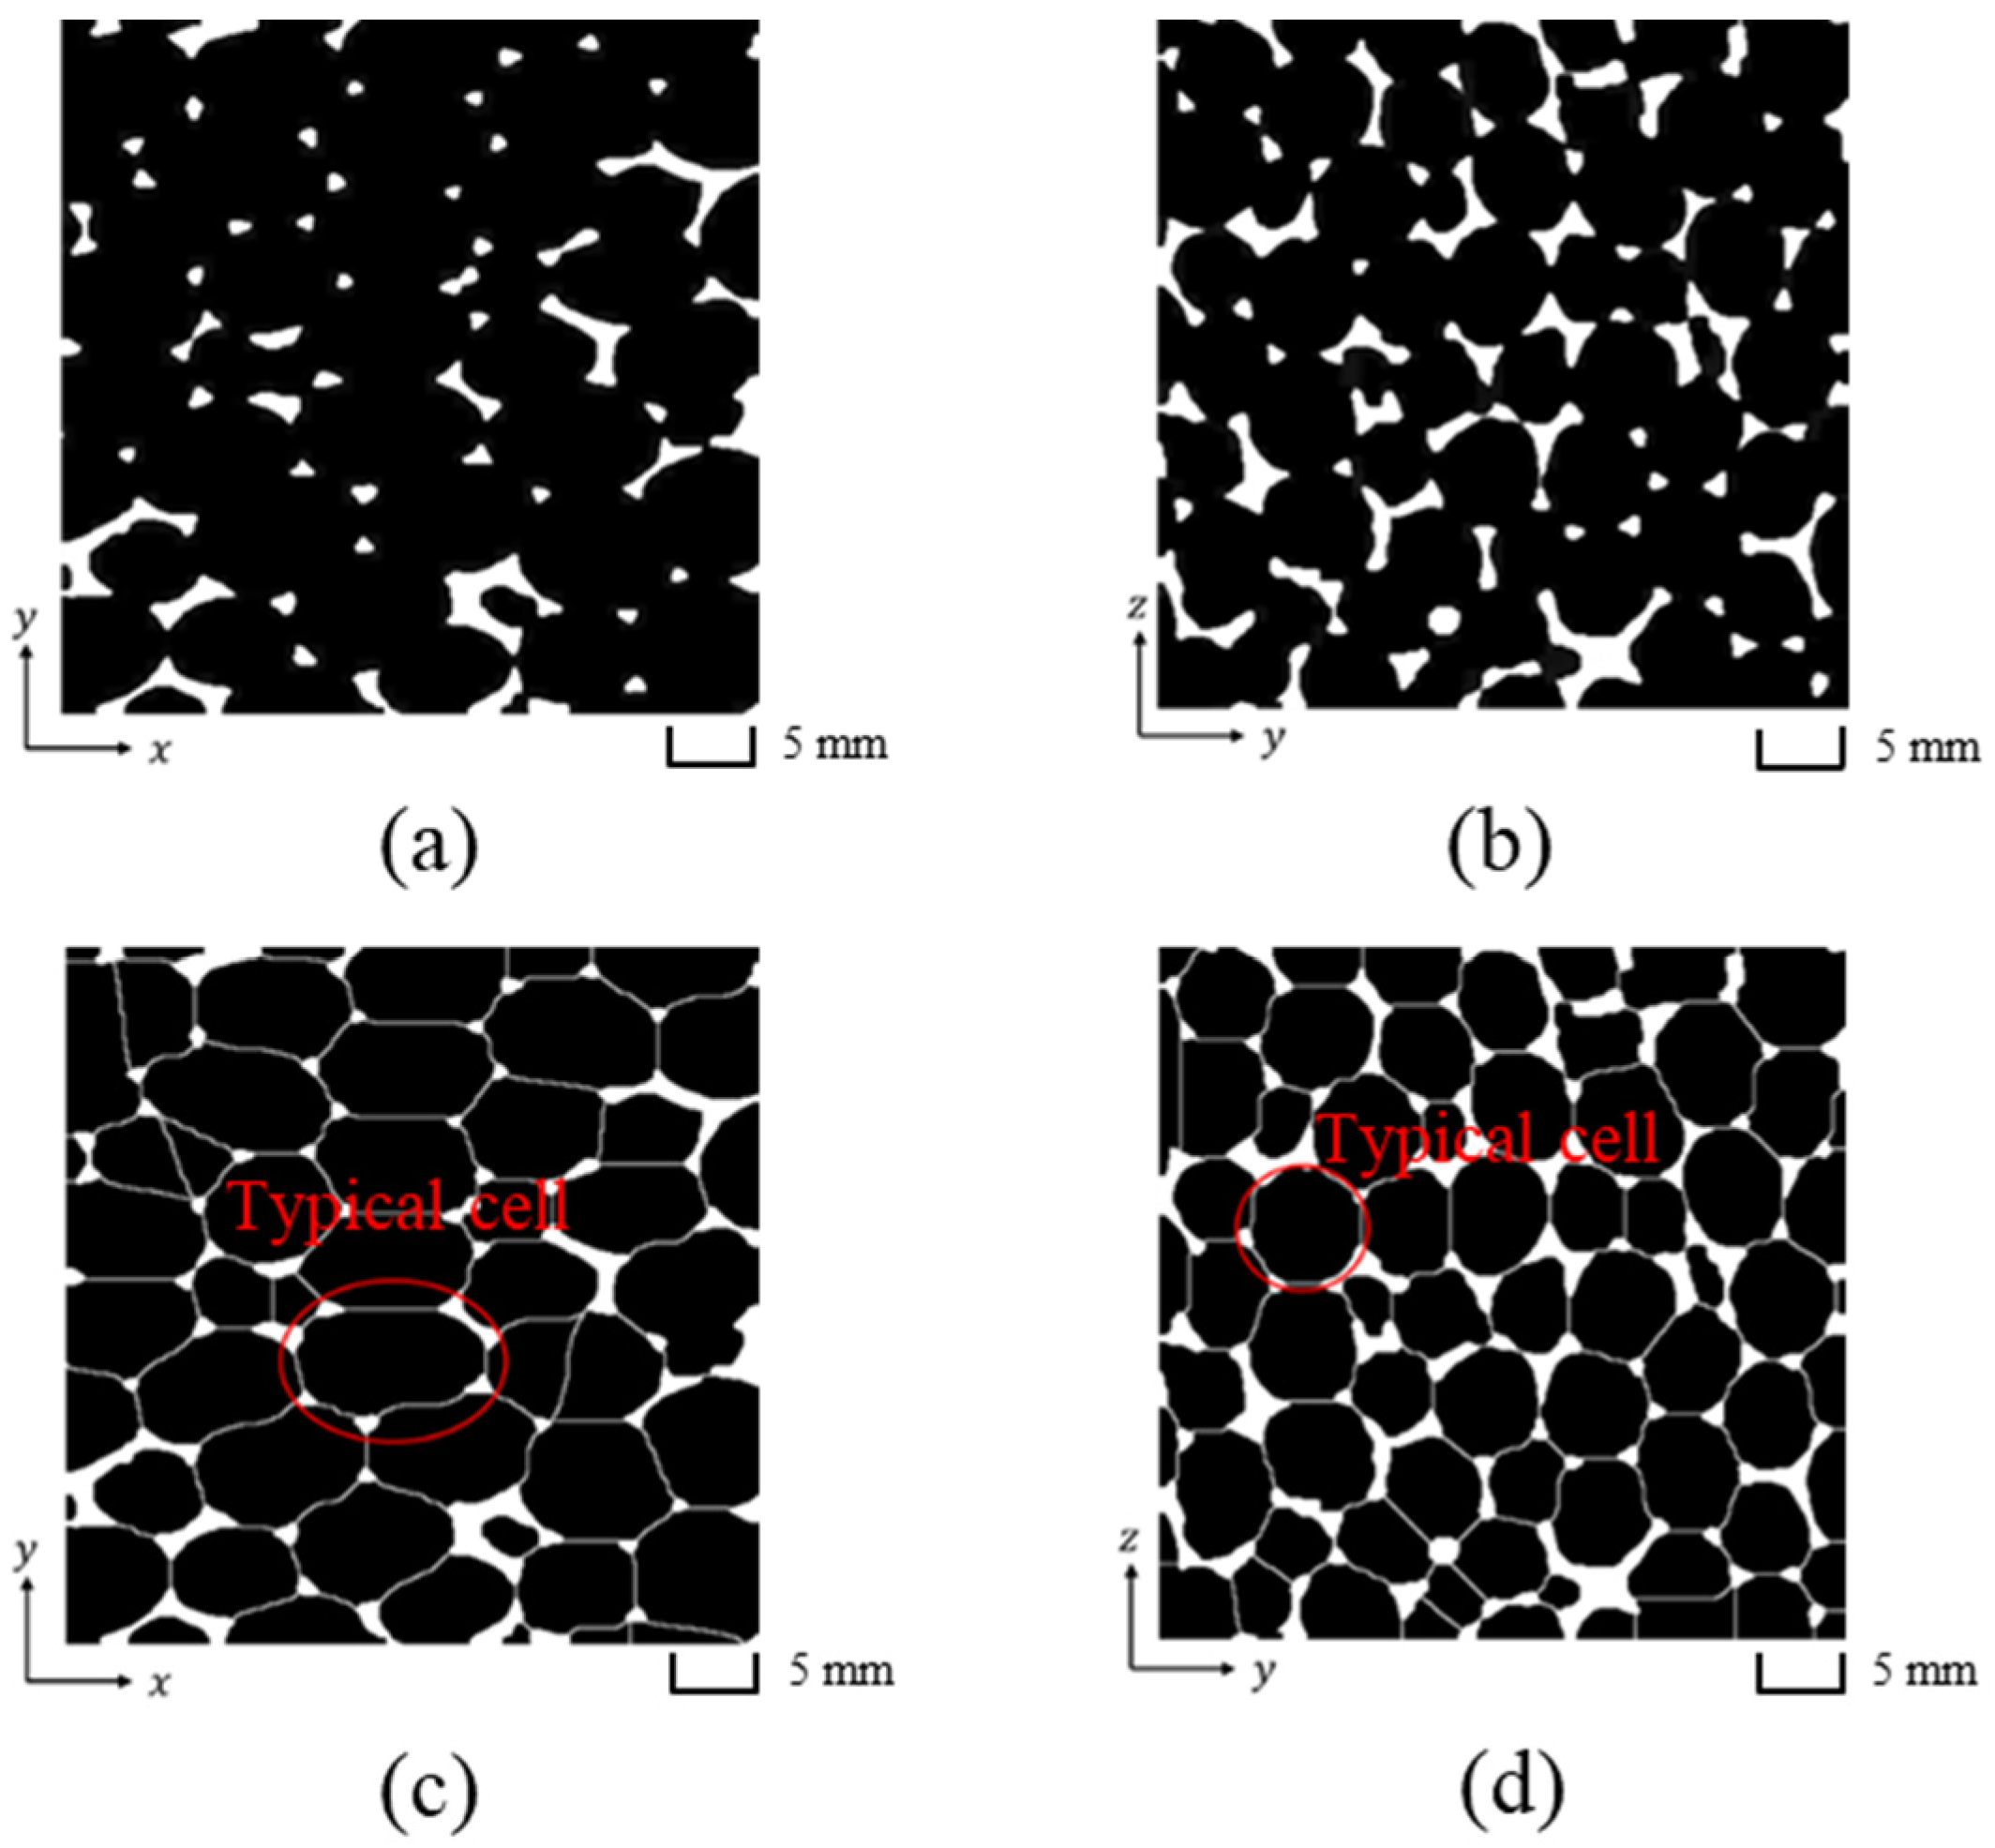
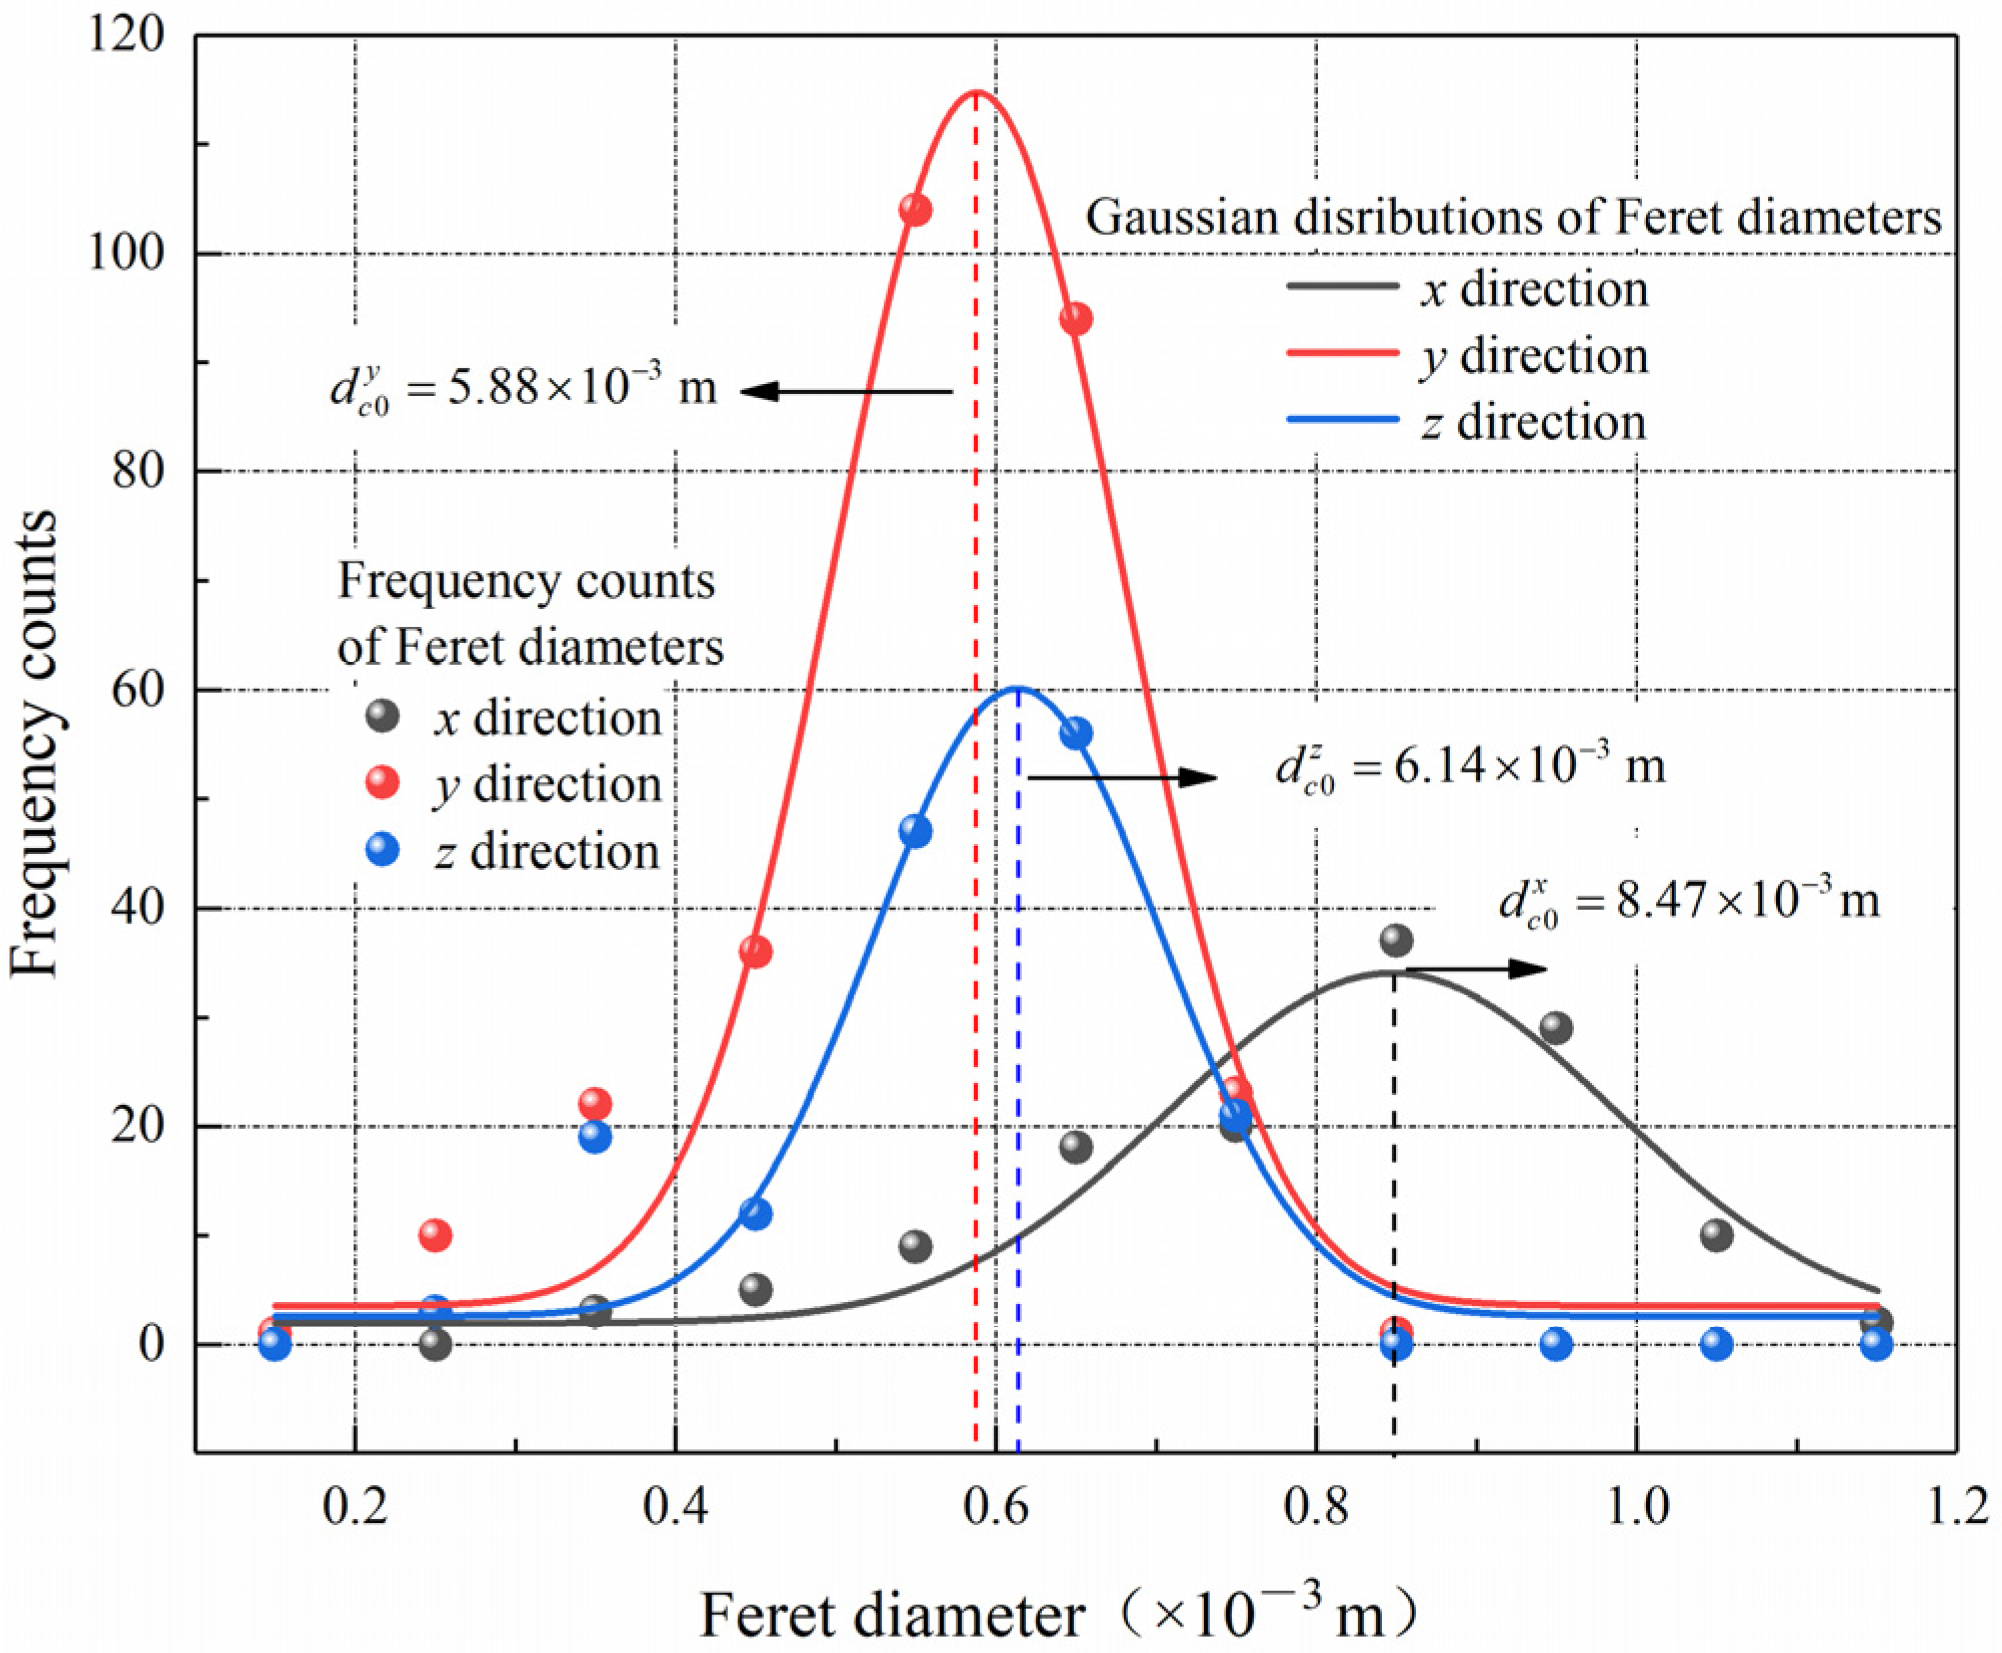
2.3. Morphological Characterization of Foam Structures

According to the reviews of Amani et al. [16] and Iasiello et al. [17], cell elongations are related to ETCs in different directions. In addition, Iasiello et al. [17] and Perrot et al. [8] proposed that the largest ellipsis can be used to characterize cell elongations. In fact, the diameter of the ellipsis is the Feret diameter in geometry. In order to establish the relationship between structural anisotropy and heat transfer anisotropy, the internal relationship between structural anisotropy and Feret diameter must first be clarified. Therefore, the Feret diameters in the three directions should be counted and used to analyze the structural anisotropy of the foam structures.
Then, five and four slices were randomly selected in the xy and yz planes, as shown in Figure 3a,b (only two of them were exhibited). Referring to the research of Iasiello et al. [17], the skeletons of foam structures in xy and yz were connected by fictitious lines with the watershed algorithm in Fiji (Image J) [27] software, which can be seen in Figure 3c,d. It is obvious that cell elongations are in the x direction, and there are few differences in Feret diameters between the y and z directions. The reason is that foam cells can be elongated perpendicular to the gravity direction during manufacturing [5,6], which is the dominant factor that causes structural anisotropy.
Table 1 displays the number of cell size measurements and the average Feret diameters (AFD) for different directions. What stands out in Table 1 is that the average Feret diameters in the x direction are largest, but there is little difference in the y and z directions.
By further analysis, the distributions of measured cell sizes for different directions can be fitted by the Gaussian function. The fitting lines can be seen in Figure 4 and the d c 0 x , d c 0 y and d c 0 z are mathematic expectations of the Gaussian distributions. Figure 4 shows that the relative characteristics are consistent with those in Table 1, but there are differences in values of Feret diameters.
According to the above morphological analysis, the characterization of structural anisotropy can be used by two parameters. One is the average Feret diameter and the other is the mathematical expectation of the Gaussian distributions of the Feret diameter (GFD). Essentially, their principles are similar. Iasiello et al. [17] adopted the second method. In the present study, both methods are adopted.
In Section 2.1, it has been indicated that 4Lx, 4Ly and 4Lz are the diameters of inscribed circles of anisotropic tetrakaidecahedron cells in three directions. In fact, the lengths of the Feret diameters are equal to the diameters of the inscribed circles. Therefore, the relationships between the average Feret diameters and L x , L y and L z are:
d x = 4 L x d y = 4 L y d z = 4 L z
where, d x , d y and d z are average Feret diameters in the x, y and z directions.
For the anisotropy of foam structures, three dimensionless parameters are defined:
d r m , n = L m L n = d m d n ,   m = x , y , z ;   n = x , y , z .
The structural anisotropies of the foam structures can be characterized, which are shown in Table 2. It can be found that the absolute values of the difference between AFD and GFD are obviously larger than the relative value.

3. Numerical Simulations for Validation

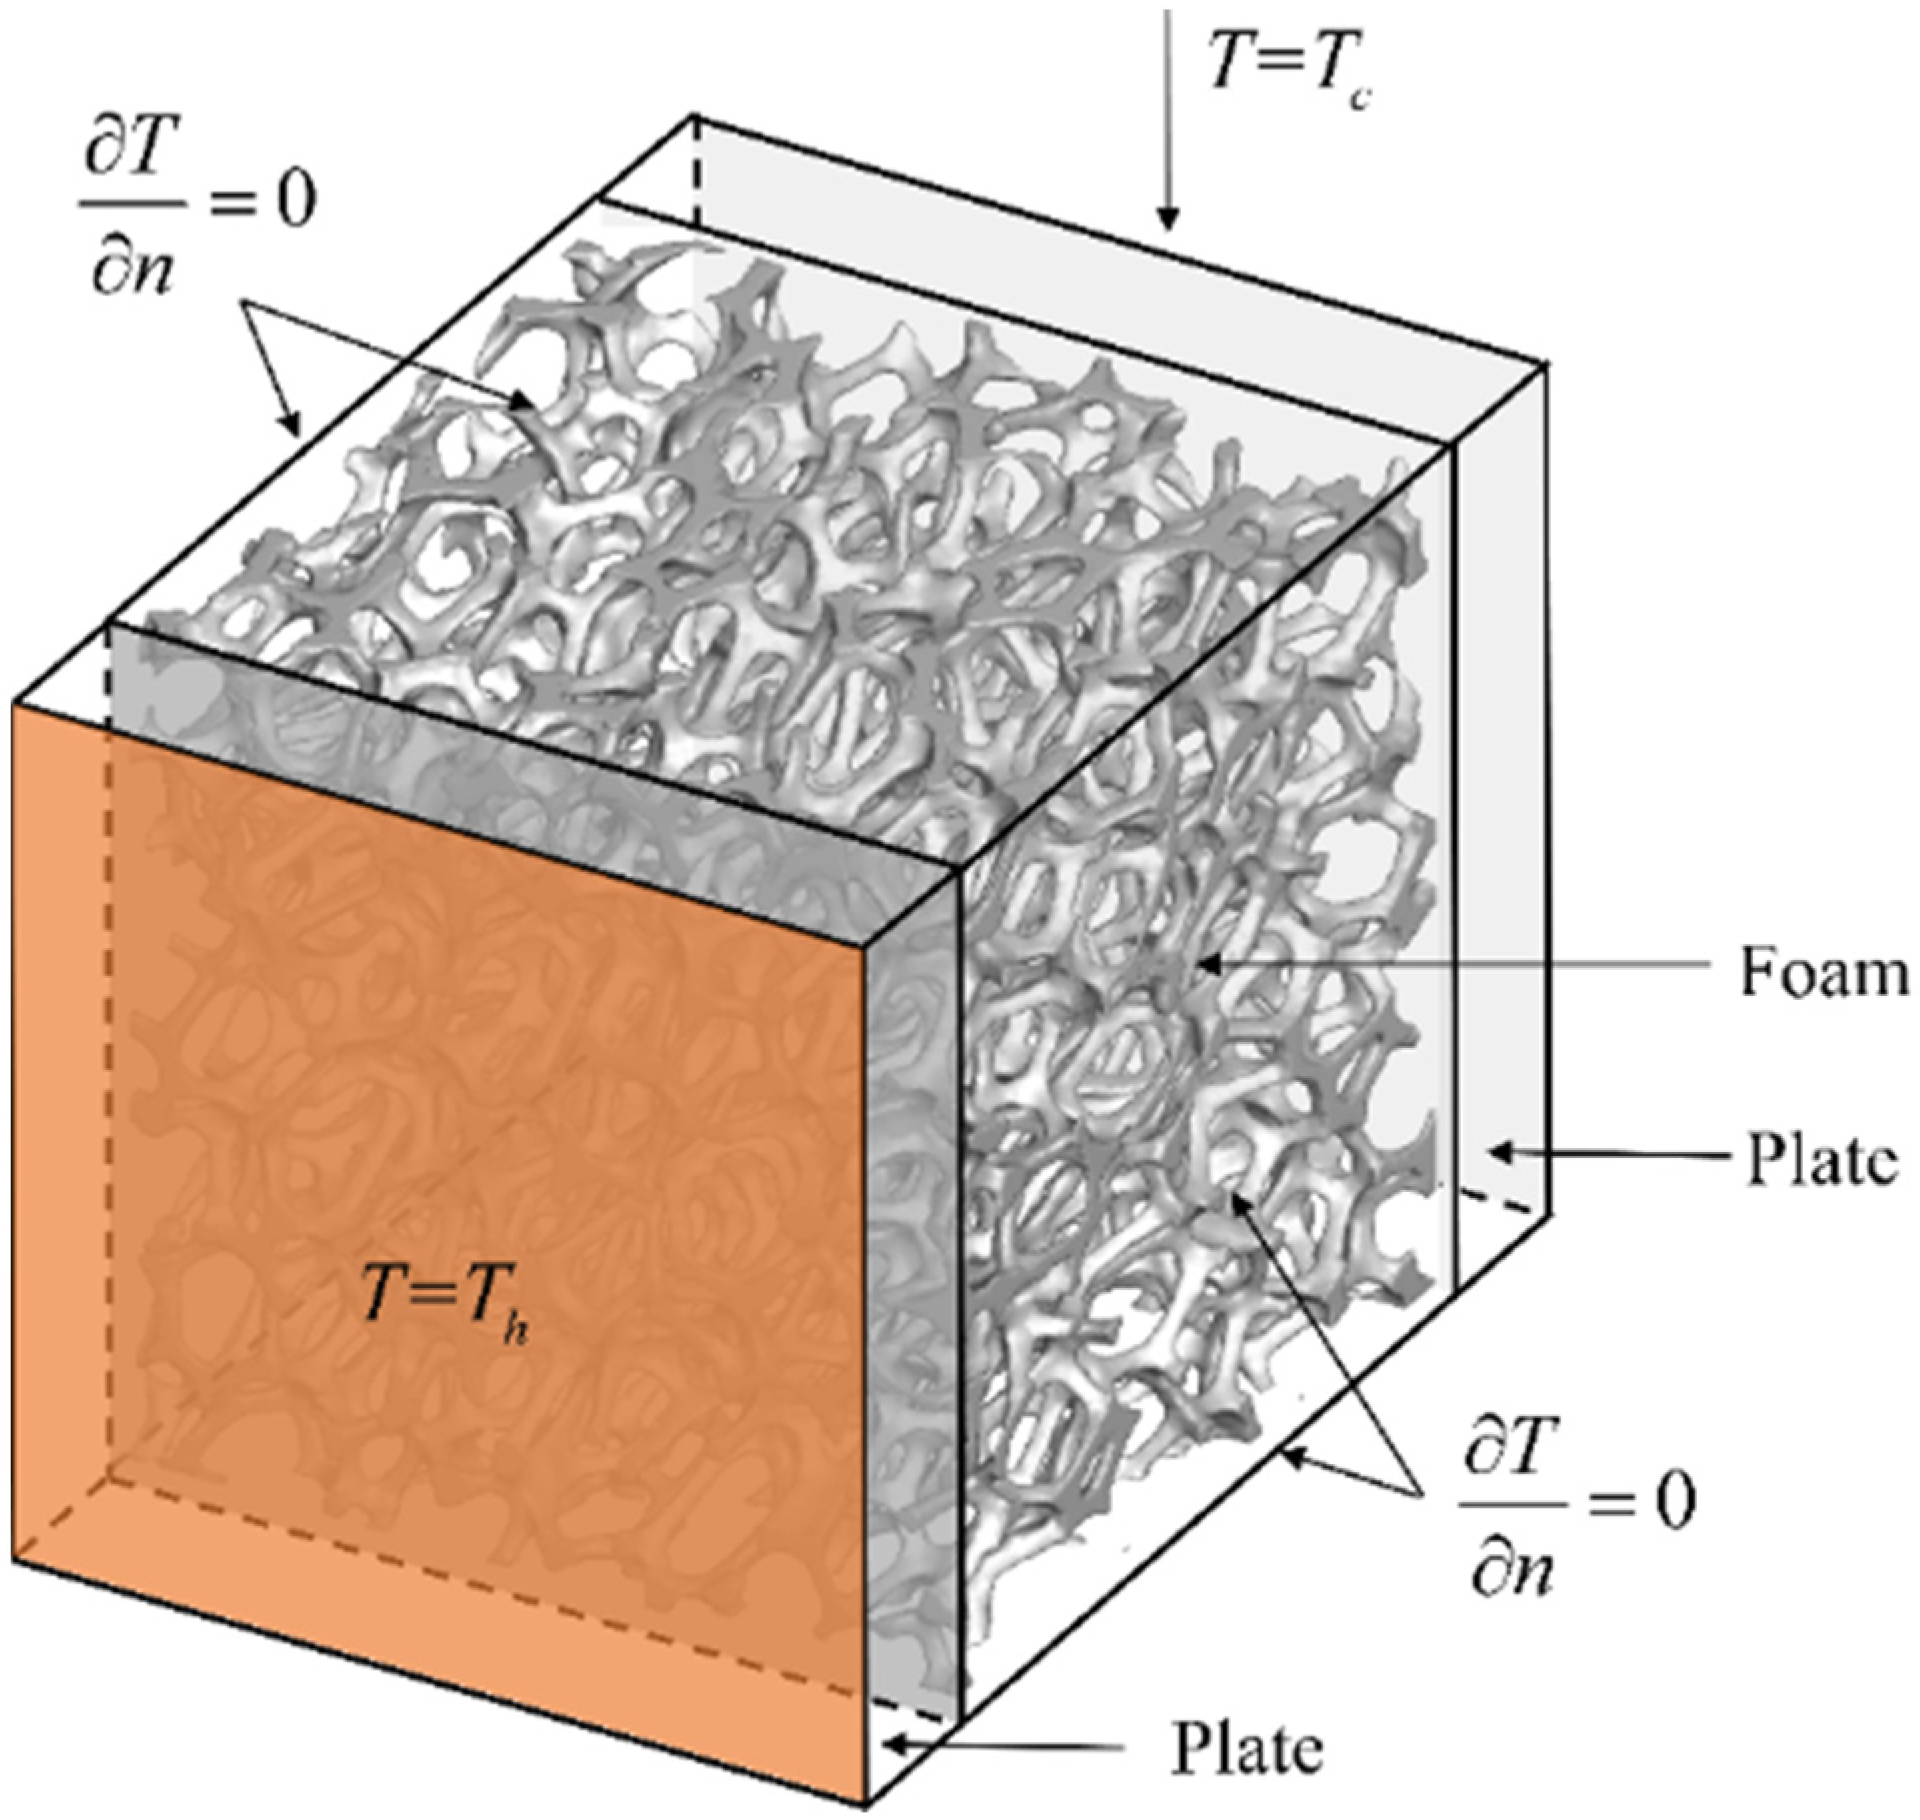
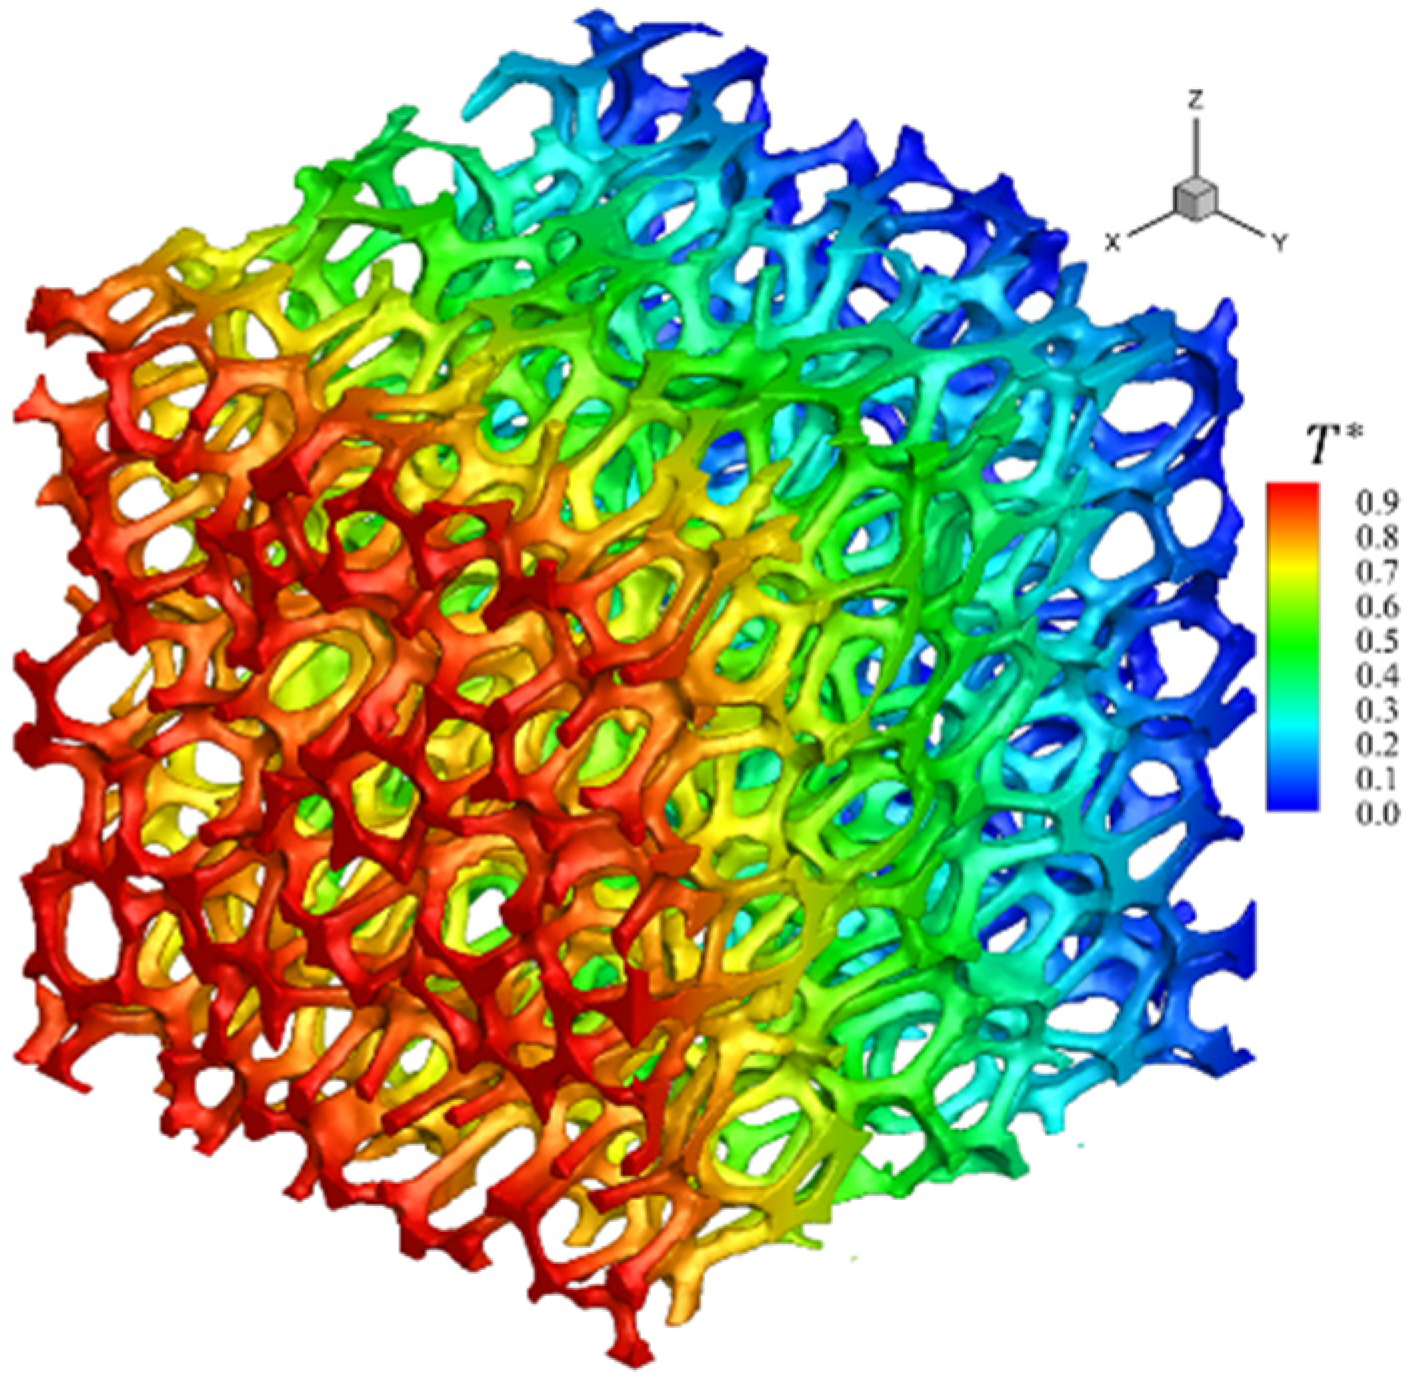
3.1. Computational Model

Figure 5 shows the diagrammatic of the computational model. Two plates with a thickness of 5 × 10⁻³ m are located on hot and cold surfaces. The uniform temperatures Th and Tc are employed on hot and cold walls, respectively. Other walls are kept insulated. The effects of different relative thermal conductivities on the anisotropic thermal conductivity of foam structures will be analyzed. To facilitate the analysis, some parameters such as temperature are dimensionless, which will be introduced in Section 3.2.

3.2. Mathematical Model

The dimensionless energy equation of the medium domain in pores is:
T f t = 2 T f r 2
Dimensionless parameters are defined as follows:
t = α f t L r e f 2 , r * = r L r e f , T f = T f T c T h T c
where, T h and Tc are the temperatures of hot and cold walls, L r e f is the characteristic length, α f is the thermal diffusion coefficient of the medium in pores, and r is a vector whose components are x, y and z.
The dimensionless energy equation of the solid domain without an internal heat source is:
T s t = κ s ( 2 T s r 2 )
where
T s * = T s T c T h T c , κ s = α s α f
where, α s is the thermal diffusion coefficient of the foam skeleton.
The interfaces between foam skeletons and mediums in pores should satisfy the following equations:
T s * = T f * k r T s * r = T f * r
The finite difference method (FDM) is used to solve Equations (35) and (37). The second-order explicit Runge-Kutta and central difference methods are used for discretizing the time and the diffusion terms, respectively. In addition, 8 NVIDIA Tesla A100 GPUs are used for acceleration.

3.3. Code Verification

In order to verify the program in the present study, a computational model of Ngo and Byon [28], as shown in Figure 6, was used to calculate the ETCs under different relative thermal conductivities conditions. In the validated model, the volume fraction is defined as follows:
φ = 4 π R 3 3 ,   0 R 0.5
The mesh was generated based on the theory of the intersection of rays and triangles. For details, please refer to the work of Möller and Trumbore [29]. Figure 7 reveals the comparison of ETCs between Ngo and Byon’s works [28] and the present investigation. The results of the present study are in good agreement with Ngo and Byon’s works [28] and the maximum relative error is less than 1%.

4. Discussions for the Anisotropic Model of Effective Thermal Conductivity

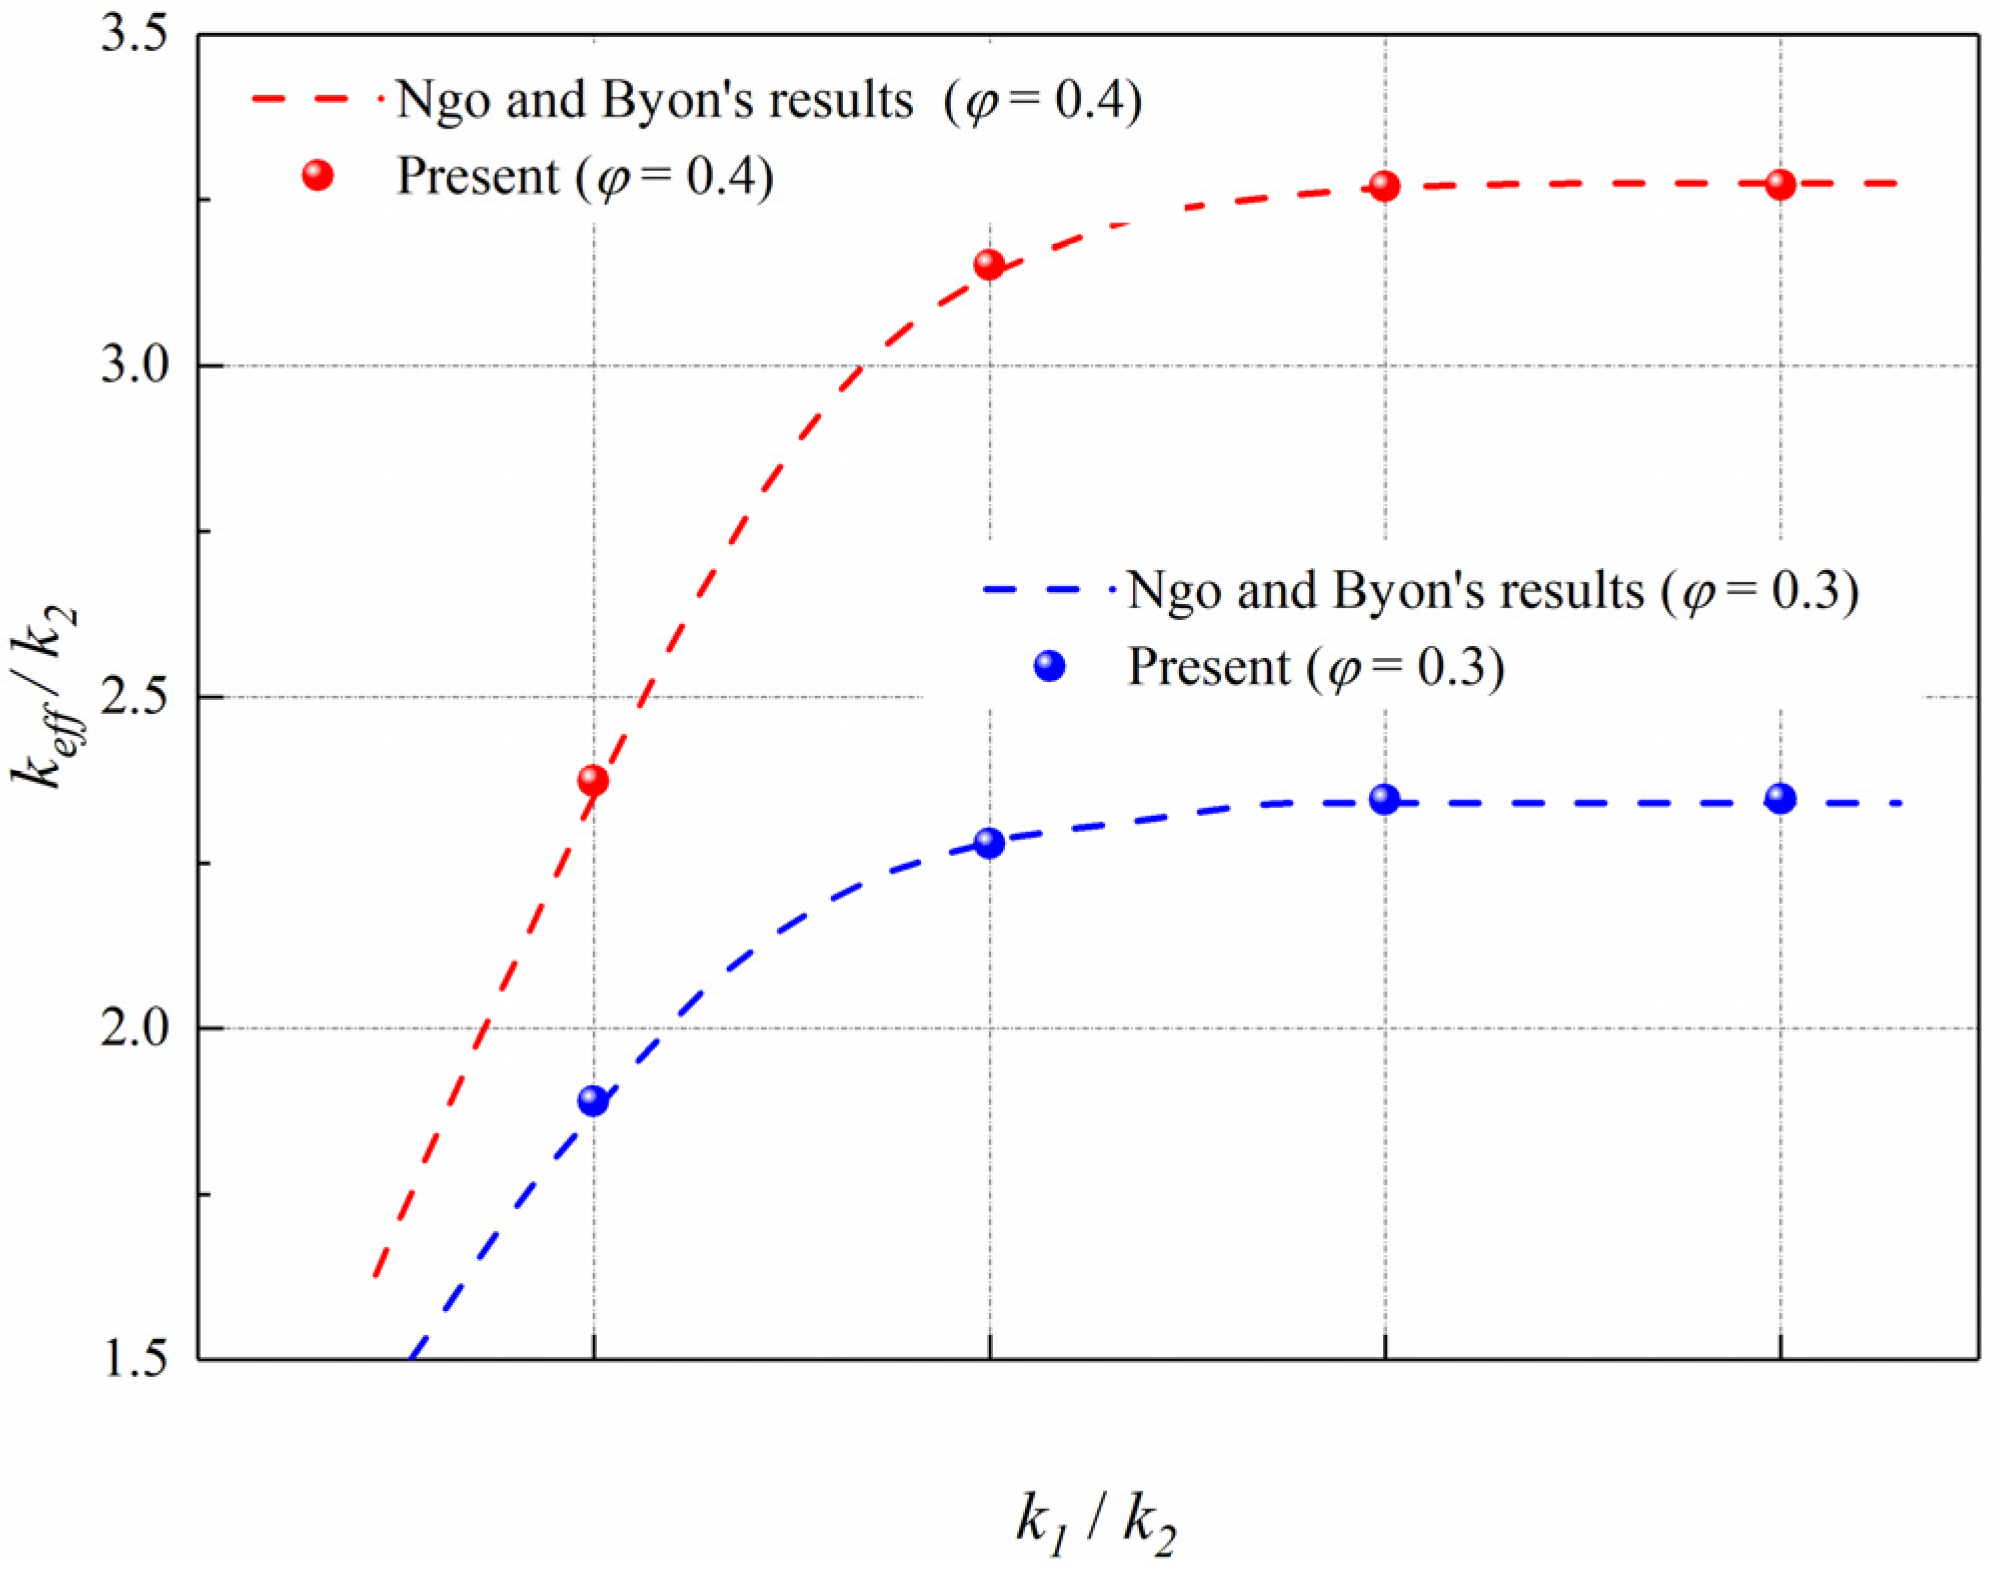
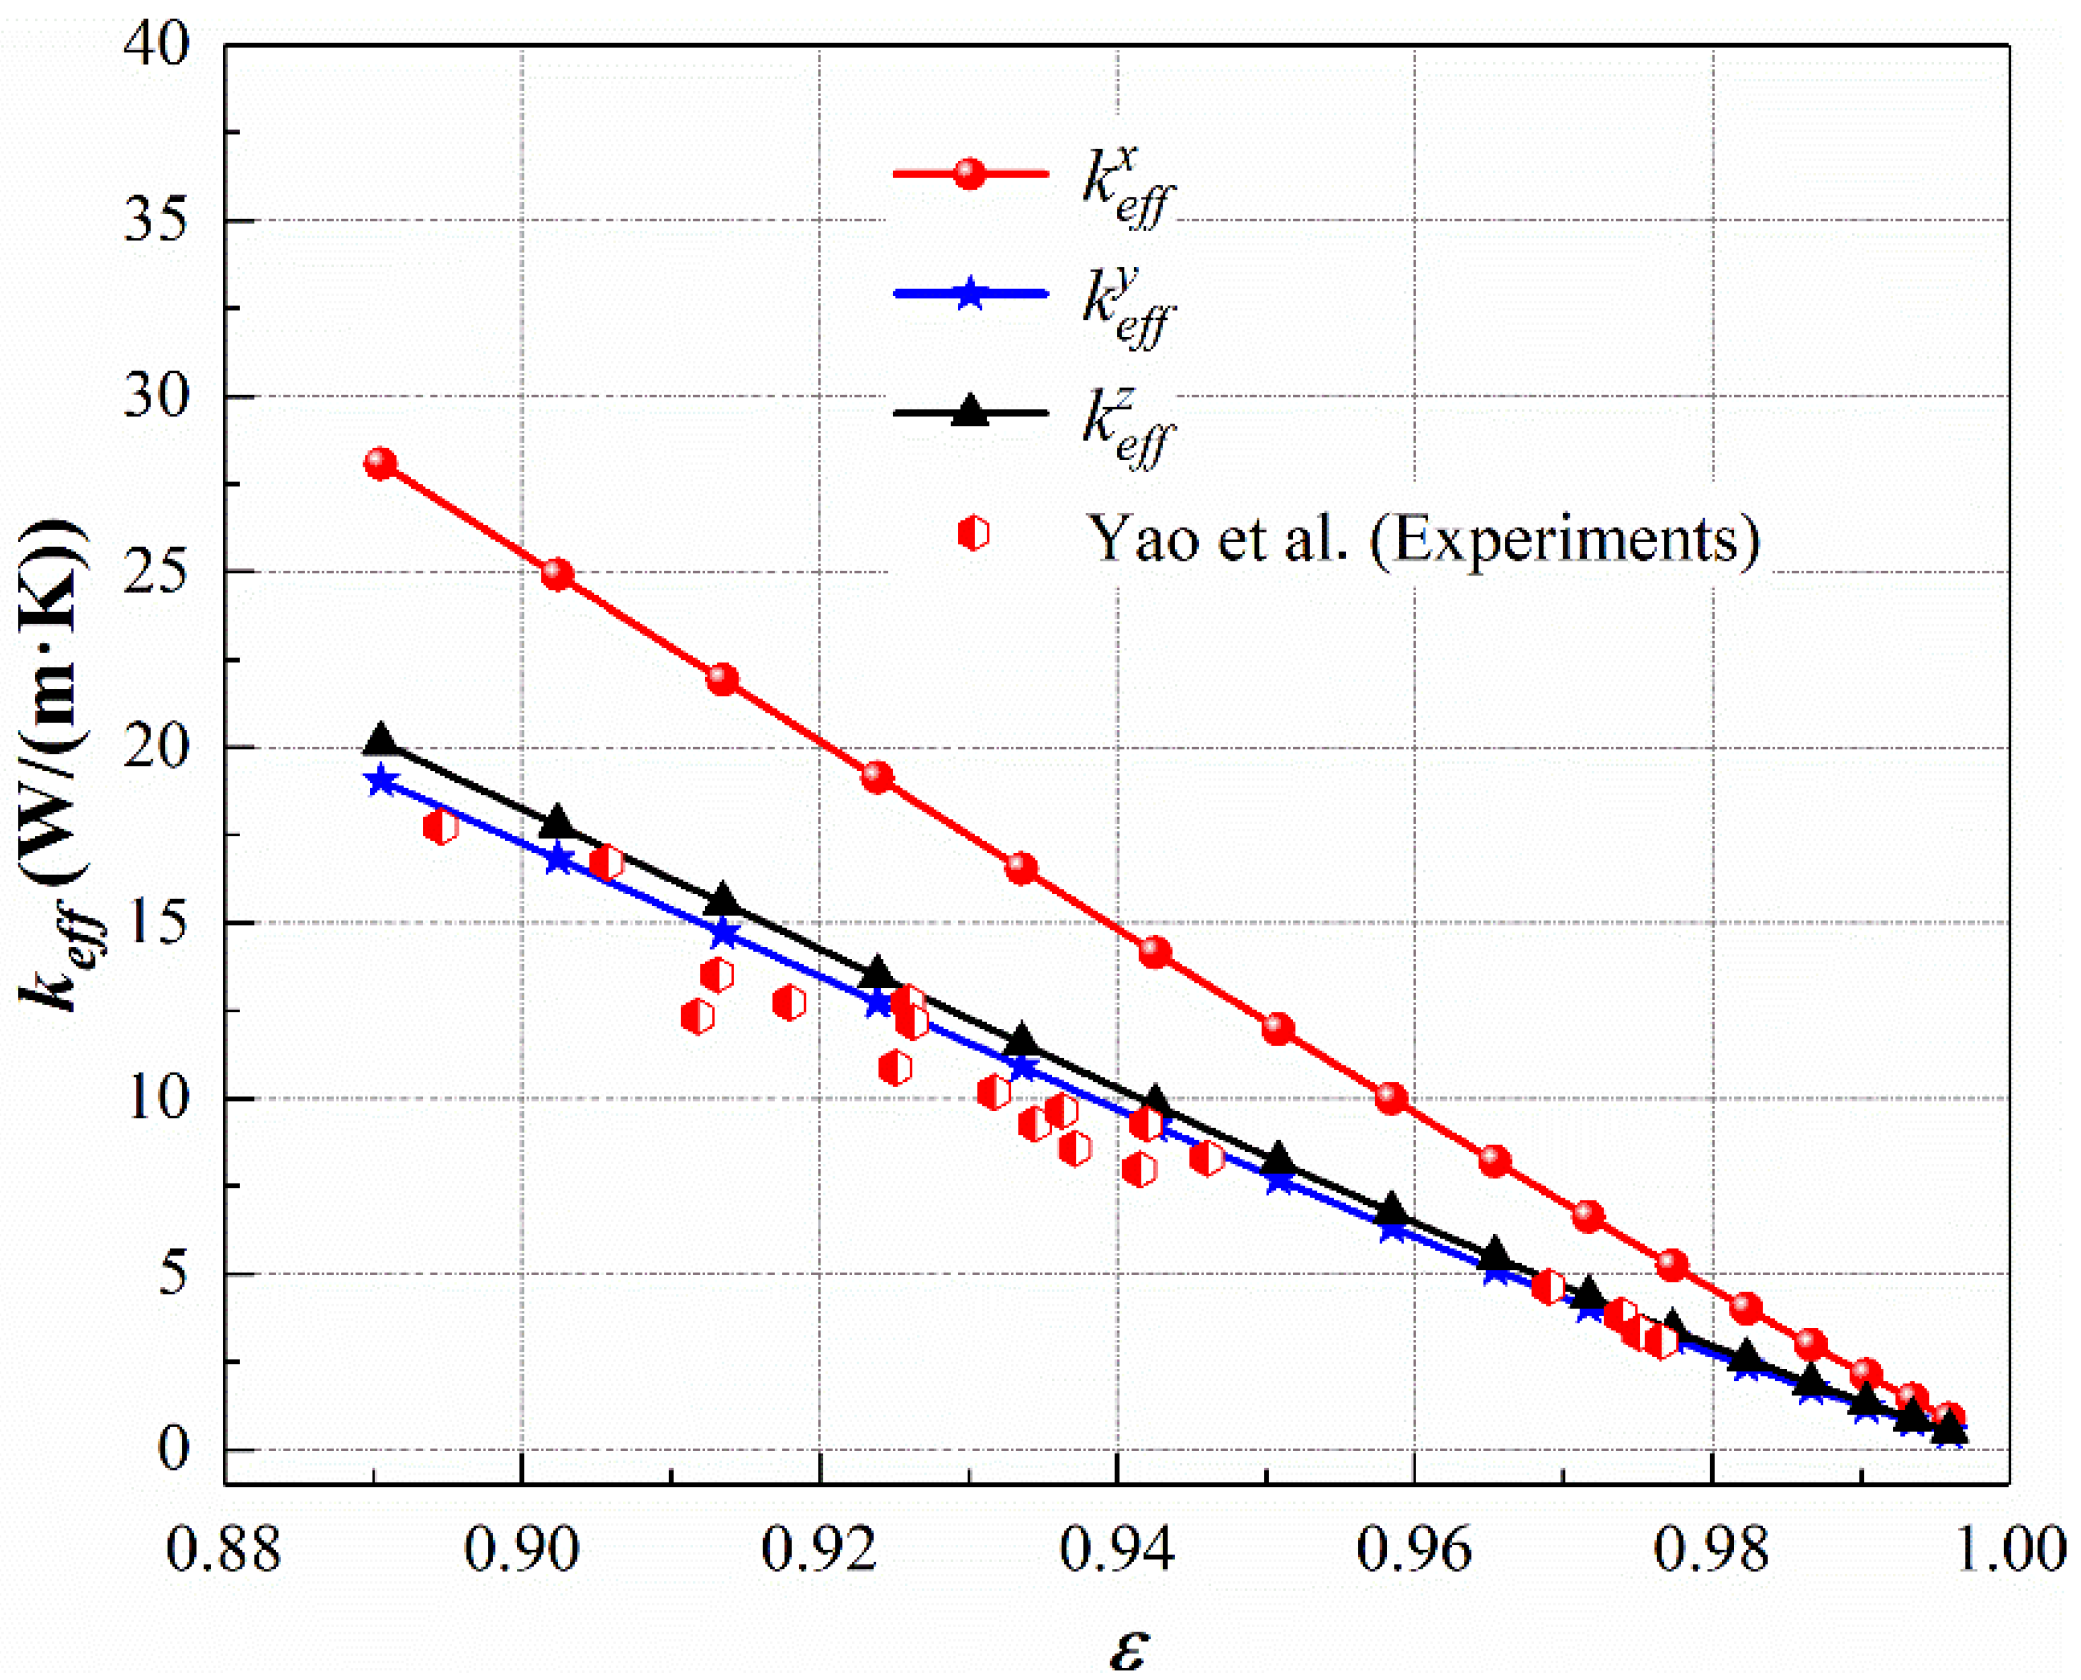
4.1. Comparison with Numerical Result

For theoretical predictions, the AFD and GFD in x, y and z directions are embedded into the theoretical model to predict the ETCs at kr = 10, respectively. The ETCs are theoretically predicted by using AFD and GFD in different directions at kr = 10, as shown in Table 3. It is found that relative differences in the absolute values of ETCs and anisotropies of ETCs between the two methods are both less than 1%. The reason can be analyzed from the structural parameters (Table 2). It is found that the maximum relative difference of relative Feret diameter is 2.87%, though the minimum relative difference of Feret diameter is 6.54%. The ATC defined by AFD can be thought of as a geometric reduction of that defined by GFD. It is further proved that relative Feret diameters determine the ETC and anisotropy of ETC when porosity and the relative thermal conductivity ratio are fixed, which also proved that the simplified Equation (30) proposed in this paper, is consistent. In addition, the definition of AFD is significantly simpler than that of GFD. Therefore, AFD is used in the following analysis.
For numerical predictions, the grid independence has been assessed and the final grid number is 400 × 400 × 400 (64 million). According to Fourier’s law, the temperature distributions of the foam structure should be obtained before calculating the ETC of the foam structure. The dimensionless temperature distribution of foam skeletons when employing the heat flux in the x direction is shown in Figure 8. There are two points that can be noted in the figure. First, the numerical method developed in this study can precisely obtain the distribution of temperature. Second, the temperature gradient along the x direction is relatively uniform, although the local temperature distribution is not uniform, which satisfies the assumption of one-dimensional heat conduction of Fourier’s law.
Table 4 shows the numerical and theoretical results of the ETCs in different directions at kr = 10 and 100 when porosity is 0.92. On the whole, what stands out is that the ETCs are positively correlated with the AFDs in three orthogonal directions in both kr = 10 and 100, which is similar to the results obtained by Iasiello et al. [17] when the medium in the pores is not considered. Therefore, a further conclusion can be drawn that the ETCs of foam structures are positively correlated with the Feret diameters of foam skeletons, regardless of whether the conduction of medium in pores is considered or not when kr > 1.
It can be also found in Table 4 that the results predicted by the theoretical model are in agreement with the numerical results. When kr = 10, the maximum relative error of ETCs in different directions is 2.84% ( k e f f z ), and the maximum relative error of the anisotropies of ETCs is 1.99%. As kr increases to 100, both the relative error of ETCs and the anisotropies of ETCs increase, and the maximum relative errors of the ETCs and the anisotropies of ETCs are 13.57% and 3.43%, respectively. In fact, among previous isotropic models, the relative deviations of the predicted ETCs are much more than 13.57% [21] and the relative deviations between Yang et al. [2] and Dai et al.’s [21] models will increase with kr increase. Therefore, the maximum relative error of ETCs predicted by the present model is within reasonable limits. The relative error is mainly caused by three factors. First, the real structures of foam are very complicated, which causes some inevitable deviations in the morphological characterization of structural anisotropy. Secondly, it is assumed that layers A, B, C and D (Figure 2a) are in parallel, which is not perfectly accurate in layer C although it has been corrected according to Dai et al.’s [21] viewpoint. Third, the conduction in real foam structures is not entirely one-dimensional, which will make the ETCs calculated by Fourier’s law exist deviations.

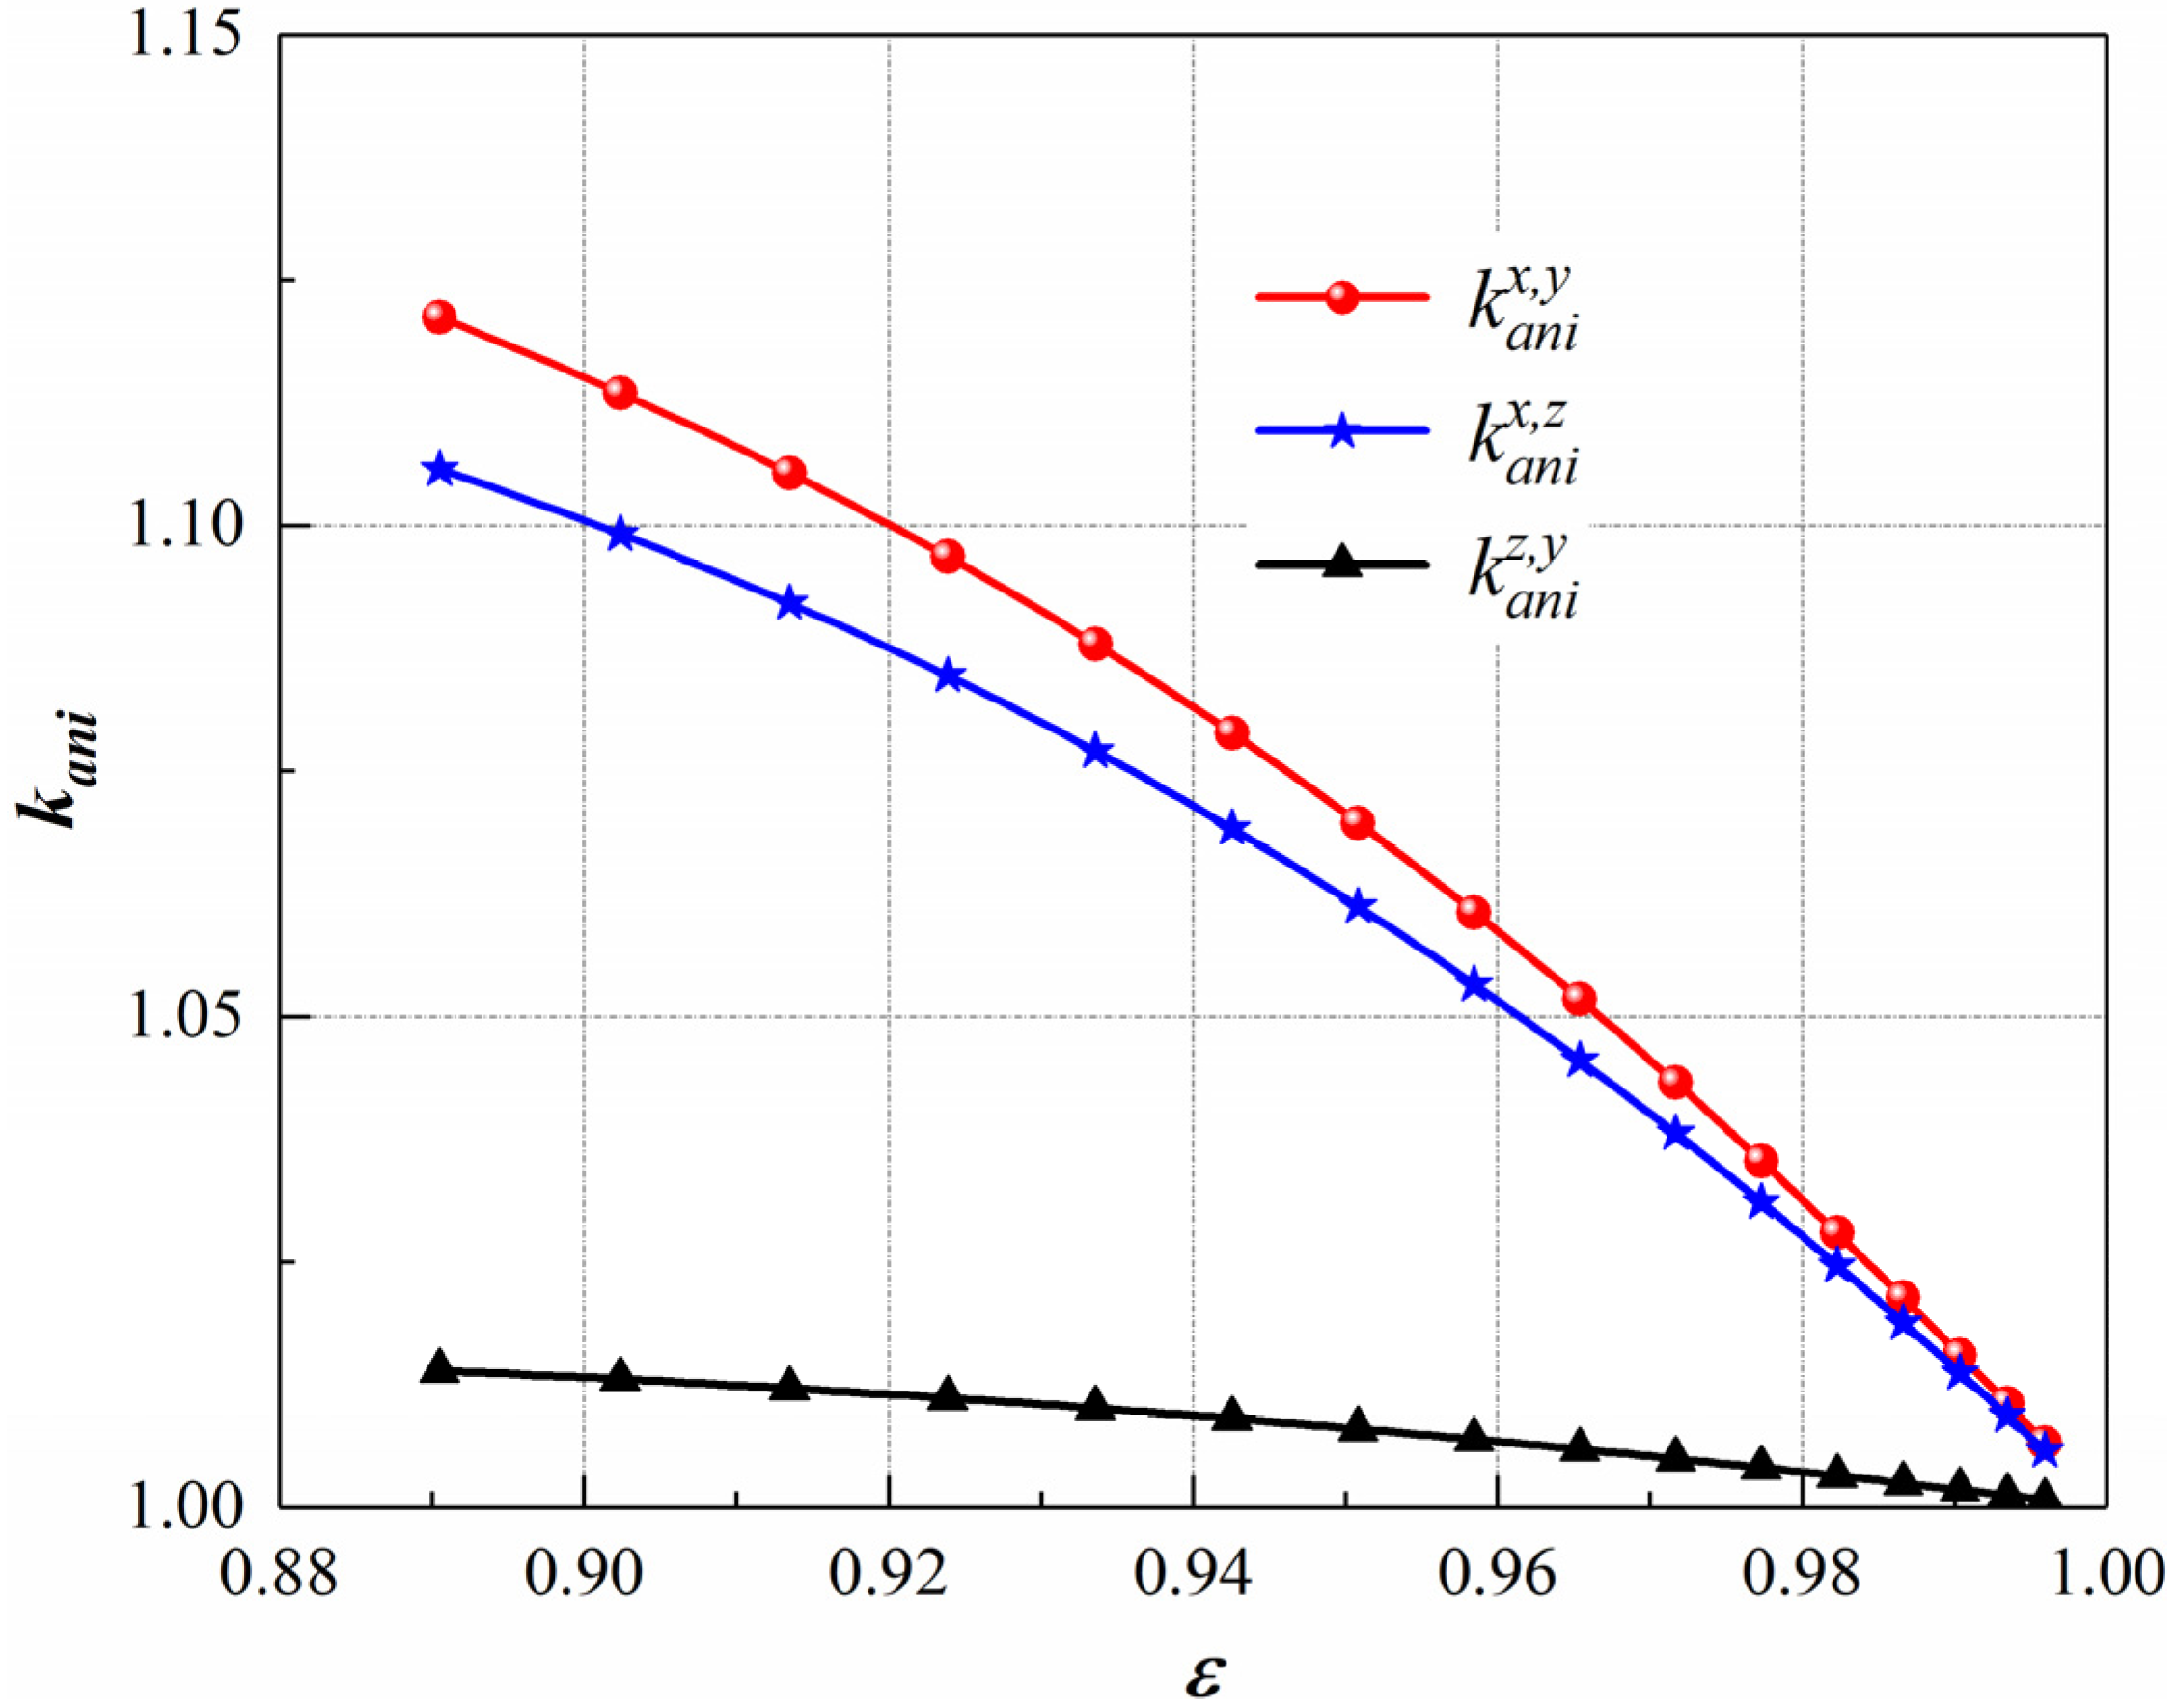
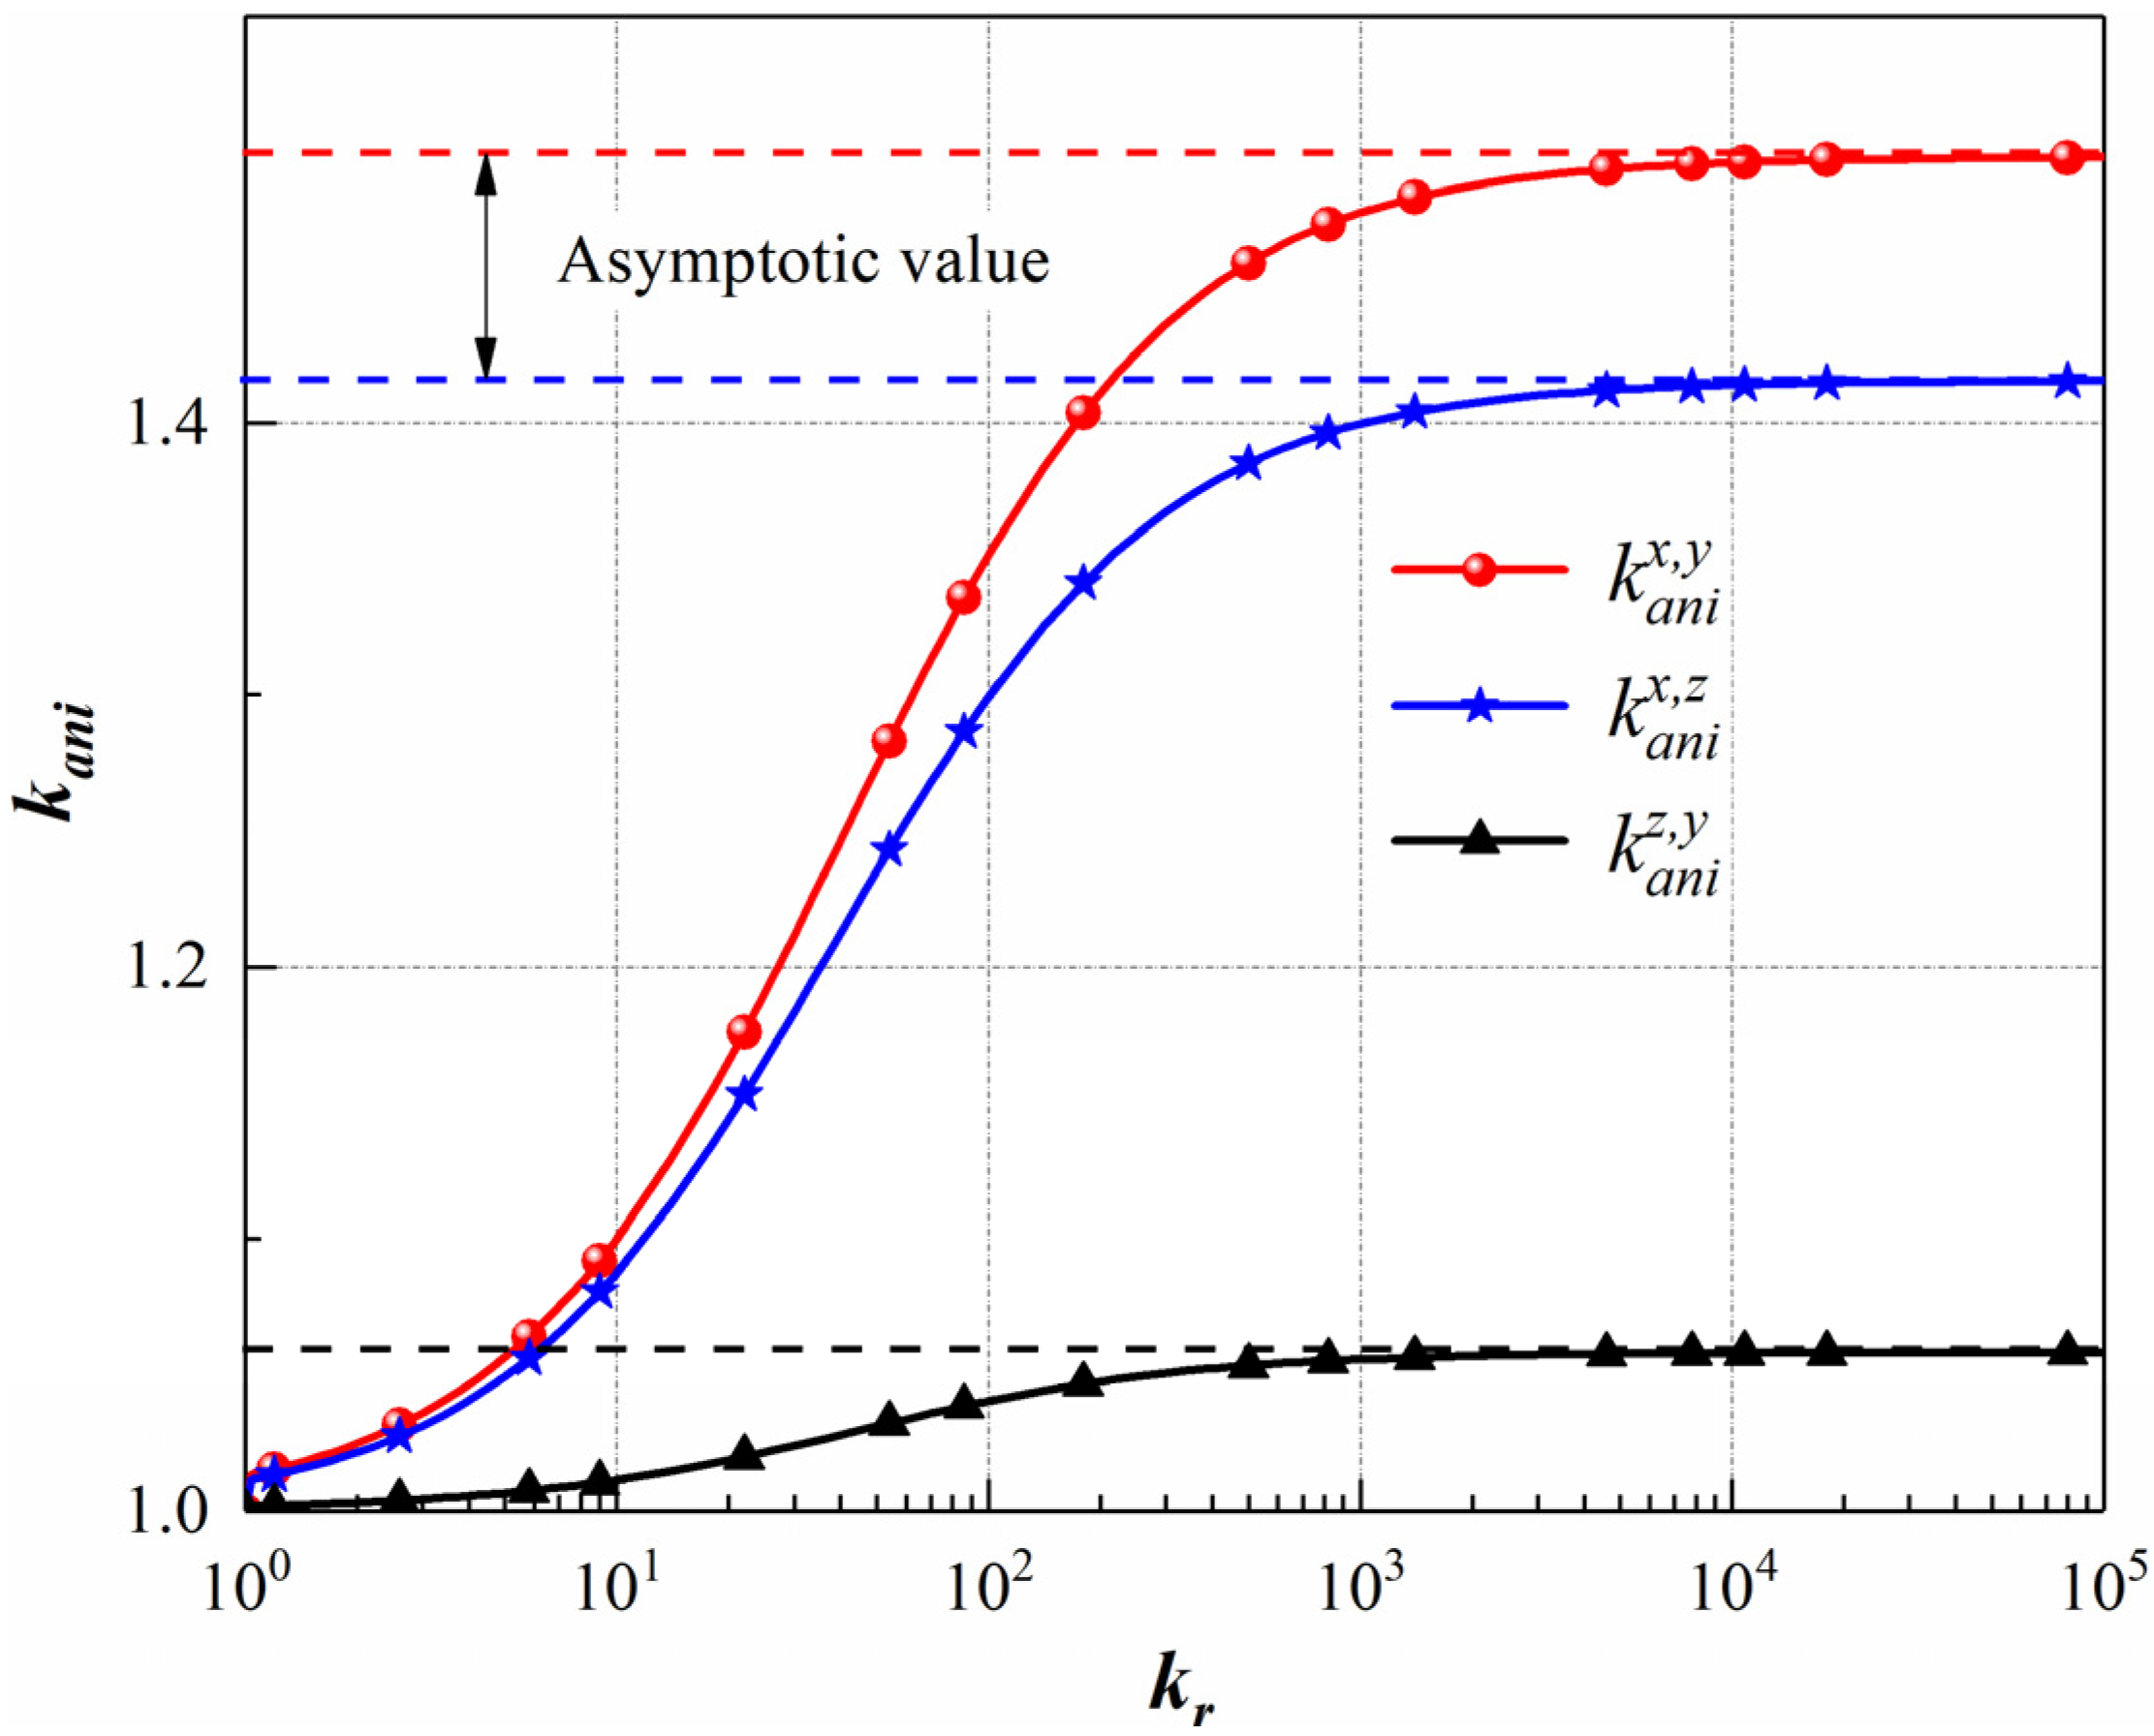
4.2. The Influence of Porosity and Relative Thermal Conductivity

Figure 9 shows comparisons of ETCs between anisotropic model predictions and experimental data. The foam skeleton is copper foam and the pores are filled with air. In this condition, the value of kr is 15,132.08. The values of ETCs in the y and z directions are slightly larger than the experimental data provided by Yao et al. [22]. There are three possible reasons. First, the thermal conductivity of copper is set to 400 W/(m·K) during the present simulation, but it may be less than 400 W/(m·K) in the experiment. Second, there are many small closed cells in the real foam copper, which makes the measured values of porosity smaller than actual ones. Thus, the experimental ETC values are smaller than the present ones. Third, the present structural parameters Lx, Ly and Lz, are different from those in Yao et al.’s study [22], which will influence the ETCs significantly. Unfortunately, Lx, Ly and Lz are not reported in Yao et al.’s study [22]. Then, the values of ETCs in the x direction are much greater than the experimental ones measured by Yao et al. [22]. In addition to the three reasons above, another possible reason is that the experimental data measured by Yao et al. [22] are not along the directions with the longest Feret diameter.
Figure 10 shows the variations of k a n i with ε in different directions at kr = 10. It can be found that the anisotropies of ETCs decrease with an increase in porosity at kr = 10. The reason is that the foam skeleton dominates the anisotropic heat conduction [17]; the proportion of the foam skeleton decreases when the porosity increases. Especially, when ε increase to 1, the proportion of the foam skeleton is 0, the anisotropies of ETCs will disappear.
Figure 11 shows the variations of k a n i with kr in different directions. The k a n i increase with the increase of kr. Besides, the values of k a n i x , y , k a n i x , z and k a n i z , y exist asymptotic value when kr approches infinity and the values of k a n i x , y , k a n i x , z and k a n i z , y are equal to the values of d r x , y , d r x , z and d r z , y , respectively, which means that dr is the dominant parameter of anisotropy of ETC. The reason for this can be analyzed by Equations (25)–(27). Taking k a n i x , y for example, the expressions of k a n i x , y can be written as:
k a n i x , y = L x L y N L N y / k N y N L N x / k N x = d r x , y N L N y / k N y N L N x / k N x , N = A , B , C , D
when kr = 1, k N x is equal to k N y , ( N L N y / k N y ) / N L N x / k N x = 1 / d r x , y , k a n i x , y is equal to 1. In this condition, the two-phase material is equivalent to the one-phase material. Therefore, the structures of the material will exhibit isotropy. When 1 < k r < , 1 / d r x , y < N L N y / k N y / N L N x / k N x < 1 , 1 < k a n i x , y < d r x , y . When k r = , N L N y / k N y / N L N x / k N x = 1 , k a n i x , y is equal to d r x , y .

5. Conclusions

A new prediction model for the ETC of realistic anisotropic open-cell foam was proposed in this work. In the present anisotropic model, an anisotropic tetrakaidecahedron cell (ATC) based on the traditional isotropic tetrakaidecahedron cell was established. To quantitatively characterize the ATC, the Feret diameters in three orthogonal directions obtained by morphological analysis for real foam structures obtained by X-CT were used. Through the volume average method on ATC, the predicted model for ETCs in three orthogonal directions was quantitatively developed. The predicted model is a function of three main parameters: thermal conductivity ratio of metal material and filling medium, porosity and relative Feret diameter, in which relative Feret diameter is a new variable compared with traditional isotropic models. To validate the anisotropic model, the ETCs of real foam structures in three orthogonal directions are predicted numerically. The ETCs in three orthogonal directions predicted by the present theoretical model are in good agreement with the numerical results in different thermal conductivity ratios (TCRs). The anisotropic ratios of ETCs in different orthogonal directions also meet well. In addition, the ETCs predicted by the present anisotropic model in different porosities are compared with the experiments from the literature, and the results further verify the rationality of the anisotropic model. Finally, it is found that the anisotropic ratios of ETCs decrease with the increase of porosity and increase with the increase of TCR. In addition, the anisotropic ratios of ETCs exit asymptotic values, which are equal to the relative Feret diameter in different orthogonal directions when TCR approaches infinity.

Author Contributions

Conceptualization, C.Z.; methodology, C.Z. and G.X.; software, C.Z. and X.K.; validation, C.Z. and G.X.; formal analysis, X.W. and Y.D.; investigation, C.Z. and X.K.; resources, X.W.; data curation, C.Z. and X.K.; writing—original draft preparation, C.Z.; writing—review and editing, X.W. and Y.D.; visualization, C.Z.; supervision, X.W. and Y.D.; project administration, X.W.; funding acquisition, X.W. and Y.D. All authors have read and agreed to the published version of the manuscript.

Funding

This research was supported by the National Key Research and Development Program of China (No. 2019YFA0405202) and National Numerical Wind Tunnel Foundation of China (No. NNW2019ZT2-B27).

Institutional Review Board Statement

Not applicable.

Informed Consent Statement

Not applicable.

Data Availability Statement

Not applicable.

Acknowledgments

The results of this study could not have been possible without the efforts of the staff on the research team, and at the same time, we sincerely thank the editors and reviewers for spending their valuable time reviewing and providing valuable comments.

Conflicts of Interest

The authors declare that they have no conflict of interest.

References

  1. Ferrari, L.; Barbato, M.; Esser, B.; Petkov, I.; Kuhn, M.; Gianella, S.; Barcena, J.; Jimenez, C.; Francesconi, D.; Liedtke, V.; et al. Sandwich structured ceramic matrix composites with periodic cellular ceramic cores: An active cooled thermal protection for space vehicles. Compos. Struct. 2016, 154, 61–68. [Google Scholar] [CrossRef]
  2. Yang, H.; Li, Y.; Yang, Y.; Chen, D.; Zhu, Y. Effective thermal conductivity of high porosity open-cell metal foams. Int. J. Heat Mass Transf. 2020, 147, 118974. [Google Scholar] [CrossRef]
  3. Tao, Y.B.; He, Y.L. A review of phase change material and performance enhancement method for latent heat storage system. Renew. Sustain. Energy Rev. 2018, 93, 245–259. [Google Scholar] [CrossRef]
  4. Ranut, P. On the effective thermal conductivity of aluminum metal foams: Review and improvement of the available empirical and analytical models. Appl. Therm. Eng. 2016, 101, 496–524. [Google Scholar] [CrossRef]
  5. Andreozzi, A.; Bianco, N.; Iasiello, M.; Naso, V. Numerical study of metal foam heat sinks under uniform impinging flow. J. Phys. Conf. Ser. 2017, 796, 012002. [Google Scholar] [CrossRef]
  6. Gibson, L.J.; Ashby, M.F. Cellular Solids: Structure and Properties; Cambridge University Press: Cambridge, UK, 1999. [Google Scholar]
  7. Gong, L.; Kyriakides, S.; Jang, W.Y. Compressive response of open-cell foams. Part I: Morphology and elastic properties. Int. J. Solids Struct. 2005, 42, 1355–1379. [Google Scholar] [CrossRef]
  8. Perrot, C.; Panneton, R.; Olny, X. Periodic unit cell reconstruction of porous media:application to open-cell aluminum foams. J. Appl. Phys. 2007, 101, 113538. [Google Scholar] [CrossRef] [Green Version]
  9. Jang, W.Y.; Kraynik, A.M.; Kyriakides, S. On the microstructure of open-cell foams and its effect on elastic properties. Int. J. Solids Struct. 2008, 45, 1845–1875. [Google Scholar] [CrossRef] [Green Version]
  10. Manonukul, A.; Srikudvien, P.; Tange, M.; Puncreobutr, C. Geometry anisotropy and mechanical property isotropy in titanium foam fabricated by replica impregnation method. Mater. Sci. Eng. A Struct. Mater. Prop. Misrostruct. Process. 2016, 655, 388–395. [Google Scholar] [CrossRef]
  11. Huber, A.T.; Gibson, L.J. Anisotropy of foams. J. Mater. Sci. 1988, 23, 3031–3040. [Google Scholar] [CrossRef]
  12. Oliviero, M.; Cunsolo, S.; Bianco, N.; Naso, V.; William, H. Numerical analysis of heat transfer and pressure drop in metal foams for different morphological models. J. Heat Transf. 2014, 136, 112601. [Google Scholar]
  13. Iasiello, M.; Bianco, N.; Chiu, W.K.S.; Naso, V. Anisotropy effects on convective heat transfer and pressure drop in Kelvin’s open-cell foams. J. Phys. Conf. 2017, 923, 012035. [Google Scholar] [CrossRef]
  14. Iasiello, M.; Bianco, N.; Chiu, W.K.S.; Naso, V. Anisotropic convective heat transfer in open-cell metal foams: Assessment and correlations. Int. J. Heat Mass Transf. 2020, 154, 119682. [Google Scholar] [CrossRef]
  15. Bodla, K.K.; Murthy, J.Y.; Garimella, S.V. Microtomography-based simulation of transport through open-cell metal foams. Numer. Heat Transf. Part A Appl. 2010, 58, 527–544. [Google Scholar] [CrossRef] [Green Version]
  16. Amani, Y.; Takahashi, A.; Chantrenne, P.; Maruyama, S.; Dancette, S.; Maire, E. Thermal conductivity of highly porous metal foams: Experimental and image based finite element analysis. Int. J. Heat Mass Transf. 2018, 122, 1–10. [Google Scholar] [CrossRef]
  17. Iasiello, M.; Bianco, N.; Chiu, W.K.S.; Naso, V. Thermal conduction in open-cell metal foams: Anisotropy and Representative Volume Element. Int. J. Therm. Sci. 2018, 137, 399–409. [Google Scholar] [CrossRef]
  18. Boomsma, K.; Poulikakos, D. Corrigendum for the paper: K. Boomsma, D. Poulikakos, “On the effective thermal conductivity of a three-dimensionally structured fluid-saturated metal foam” [International Journal of Heat and Mass Transfer, 44 (2001) 827–836]. Int. J. Heat Mass Transf. 2011, 54, 746–748. [Google Scholar] [CrossRef]
  19. Kumar, P.; Topin, F. Impact of anisotropy on geometrical and thermal conductivity of metallic foam structures. J. Porous Media 2015, 18, 949–970. [Google Scholar] [CrossRef]
  20. Wang, X.; Zheng, J.; Chen, H. A prediction model for the effective thermal conductivity of mono-sized pebble beds. Fusion Eng. Des. 2016, 103, 136–151. [Google Scholar] [CrossRef]
  21. Dai, Z.; Nawaz, Y.K.; Park, G.; Bock, J.; Jacobi, A.M. Correcting and extending the Boomsma–Poulikakos effective thermal conductivity model for three-dimensional fluid-saturated metal foams. Int. Commun. Heat Mass Transf. 2010, 37, 575–580. [Google Scholar] [CrossRef]
  22. Yao, Y.; Wu, H.; Liu, Z. A new prediction model for the effective thermal conductivity of high porosity open-cell metal foams. Int. J. Therm. Sci. 2015, 97, 56–67. [Google Scholar] [CrossRef]
  23. Mendes, M.A.A.; Ray, S.; Trimis, D. A simple and efficient method for the evaluation of effective thermal conductivity of open-cell foam-like structures. Int. J. Heat Mass Transf. 2013, 66, 412–422. [Google Scholar] [CrossRef]
  24. Wang, G.; Wei, G.; Xu, C.; Xing, J.; Du, X. Numerical simulation of effective thermal conductivity and pore-scale melting process of PCMs in foam metals. Appl. Therm. Eng. 2019, 147, 464–472. [Google Scholar] [CrossRef]
  25. Thomson, W. On the division of space with minimum partitional area. Philos. Mag. 1887, 5, 503–514. [Google Scholar] [CrossRef] [Green Version]
  26. Kanaun, S.; Tkachenko, O. Effective conductive properties of open-cell foams. Int. J. Eng. Sci. 2008, 46, 551–571. [Google Scholar] [CrossRef]
  27. Schindelin, J.; Arganda, C.I.; Frise, E.; Kaynig, V.; Longair, M.; Pietzsch, T.; Preibisch, S.; Rueden, C.; Saalfeld, S.; Schmid, B. Fiji: An open-source platform for biological-image analysis. Nat. Methods 2012, 9, 676. [Google Scholar] [CrossRef] [PubMed] [Green Version]
  28. Ngo, I.L.; Byon, C. A generalized correlation for predicting the thermal conductivity of composite materials. Int. J. Heat Mass Transf. 2015, 83, 408–415. [Google Scholar] [CrossRef]
  29. Möller, T.; Trumbore, B. Fast, Minmum Storage Ray/Triangle Intersection. J. Graph. Tools 1997, 2, 21–28. [Google Scholar] [CrossRef]
Figure 1. The process of representative cell selection and geometric modeling; (a) The 3D microstructures of ligaments; (b) A real cells of foam structures cut from the original copper foams randomly; (c) A simplified anisotropic tetrakaidekahedron formed by nodes and ligaments; (d) The schematic diagram of hexahedron representative unit selection.
Energies 15 06091 g001
Figure 2. Schematic diagram of the hexahedral unit cell; (a) 3D schematic and the dimensions; (b) The view of y direction for hexahedral unit cell; (c) The view of z direction for hexahedral unit cell.
Energies 15 06091 g002
Figure 3. The original pictures: (a) xy plane; (b) yz plane and distributions of cells for Feret diameter evaluation: (c) xy plane; (d) yz plane.
Energies 15 06091 g003
Figure 4. Distributions of measured cell sizes in different directions.
Energies 15 06091 g004
Figure 5. The diagrammatic of the computational model.
Energies 15 06091 g005
Figure 6. Schematic diagrams of validated model: (a) 3D, (b) Middle section in x direction.
Energies 15 06091 g006
Figure 7. The variation of k e f f / k 2 under different k 1 / k 2 at φ = 0.3 and 0.4.
Energies 15 06091 g007
Figure 8. The dimensionless temperature distribution of foam copper skeletons when heating in the x direction at kr = 10.
Energies 15 06091 g008
Figure 9. Comparisons between anisotropic model prediction and experimental data with copper foam and air (kr = 15,132.08) [22].
Energies 15 06091 g009
Figure 10. The variations of Kani with ε in different directions at kr = 10.
Energies 15 06091 g010
Figure 11. The variations of Kani with ε in different directions at ε = 0.92.
Energies 15 06091 g011
Table 1. Number of cell size measurements and average Feret diameters for different directions.
DirectionNumberAverage Feret Diameters (×10−3 m)
x1337.95
y2915.36
z1585.67
Table 2. Feret diameters and relative Feret diameters of the AFD and GFD.
ParameterAFD (×10−3 m)GFD (×10−3 m)Relative Difference
d x 7.958.476.54%
d y 5.365.889.70%
d z 5.676.148.29%
d r x , y 1.48321.44052.87%
d r x , z 1.40211.37951.61%
d r z , y 1.05781.04421.28%
Table 3. The ETCs numerically predicted by using AFD and GFD in different directions at kr = 10.
AFDGFDRelative Difference
The absolute values of ETCs k e f f x * 0.149650.149180.31%
k e f f y * 0.136040.136530.36%
k e f f z 0.137610.137750.10%
The anisotropies of ETCs k d i f f x , y 1.100041.092710.67%
k d i f f x , z 1.087491.082980.41%
k d i f f z , y 1.011541.008980.25%
Table 4. The ETCs in different direction at ε = 0.92 .
Numerical ResultsTheoretical ResultsRelative Error
kr = 10 k a n i x * 0.151010.149650.90%
k a n i y * 0.138560.136041.82%
k a n i z 0.141630.137612.84%
k a n i x , y 1.089851.100040.94%
k a n i x , z 1.066231.087491.99%
k a n i z , y 1.022161.011541.03%
kr = 100 k a n i x * 0.053710.0610013.57%
k a n i y * 0.041100.045139.80%
k a n i z 0.042850.046959.56%
k a n i x , y 1.306811.351653.43%
k a n i x , z 1.253441.299263.65%
k a n i z , y 1.042581.040330.22%
Publisher’s Note: MDPI stays neutral with regard to jurisdictional claims in published maps and institutional affiliations.

