Article

A Method for Grading the Hidden Dangers of Urban Gas Polyethylene Pipelines Based on Improved PLC Methods

1
Zhejiang Energy Natural Gas Group Co., Ltd., Hangzhou 310051, China
2
School of Economics and Management, China University of Petroleum (East China), Qingdao 266580, China
*
Author to whom correspondence should be addressed.
Energies 2022, 15(16), 6073; https://doi.org/10.3390/en15166073
Submission received: 27 June 2022 / Revised: 9 August 2022 / Accepted: 18 August 2022 / Published: 22 August 2022

Abstract

:
The classification of hidden dangers in urban gas pipelines plays a vital role in the smooth operation of urban gas pipelines and in solving the problem of hidden safety dangers in urban gas pipelines. In recent years, the number and proportion of polyethylene (PE) pipelines in urban gas pipelines are increasing day by day, but the current classification of hidden dangers in urban gas pipelines is still based on steel pipelines, and the classification method is highly subjective. Therefore, this paper proposes an improved PLC method that integrates the use of a risk matrix and compensation coefficient to solve the problem of grading the hidden dangers of PE pipelines of urban gas. The improved PLC method is based on the failure database of urban gas PE pipelines to obtain the vulnerability and severity of consequences when determining the initial level of hidden dangers, and the compensation coefficient is modified according to regional vulnerability, ease of rectification, condition around the pipeline, positioning technology, leak detection technology, and emergency ability, which can effectively reduce the subjectivity of hidden danger classification. Using the improved PLC method to classify urban gas pipelines for hidden dangers can provide pipeline operating companies with a basis for decision making in the process of hidden danger disposal and effectively reduce pipeline safety risks.

1. Introduction

Urban gas mainly includes artificial gas, liquefied petroleum gas, and natural gas [1]. Artificial gas is gradually drawing people’s attention due to its high cost, poor gas quality, and the pollution in the environment during the production process of gas source plants. Promoting the development and utilization of clean energy is the current trend of energy policy in all regions [2,3] and has led to numerous related technological studies [4,5]. Compared with liquefied petroleum gas, natural gas is gaining popularity as a cleaner, more efficient, and cheaper energy source, and is currently the main transmission medium for urban gas pipelines. Natural gas, as an effective solution for energy saving and emission reduction, has huge room for development and will be the most consumed energy source in the foreseeable future. As the popularity of natural gas increases [6], it is inevitably accompanied by more frequent pipeline accidents [7]. From the perspective of the laying environment of urban gas pipelines, most of them are in densely populated areas, and once an accident occurs, it is very easy to cause significant casualties and property damage. Therefore, the entire distribution area of the urban gas pipeline is all high-consequence areas [8]. This has put forward higher requirements for the safe operation of urban gas pipelines [9], and as a key part of the daily management and maintenance of urban gas pipelines, the importance of the classification of hidden pipeline dangers has become increasingly prominent.
With the rapid development of technologies related to urban gas pipelines in recent years, polyethylene gas pipelines have been widely used in urban gas transmission pipelines for their good anticorrosive properties, long service life, convenient construction, and economic cost, which have become the most remarkable achievement in the field of “plastic instead of steel” [10].
In this context, the gradual replacement of metal pipes by PE pipelines, coupled with the continuous development of urban gas pipeline networks, have put forward new requirements for urban gas pipeline management, which will inevitably bring new challenges to urban gas pipeline management. The original urban gas pipeline management method is more suitable for a steel pipeline [11], and it is inevitable that there will be a problem of maladaptation. Therefore, it is necessary to accelerate the construction of a classification method for PE gas pipelines with hidden dangers to achieve the goal of scientific management of pipelines according to hidden danger levels and further reduce the possibility of failure of urban gas pipelines, thus ensuring a safe, economical, and smooth operation of pipelines and escorting the smooth work of gas enterprises.

2. Literature Review

At present, scholars in the field have relatively more research on the problem of long-distance pipelines’ hidden danger classification, but relatively less research on urban gas pipelines, especially PE pipelines, which is very unfavorable to the safe operation of urban gas PE pipelines [9]. There are three general categories of technical research methods for classifying hidden dangers: qualitative, semiquantitative, and quantitative analysis. Qualitative research methods generally use the direct determination method to classify hidden dangers, which is currently used by most companies and legal codes to determine hazard levels [12]. The quantitative hidden dangers’ classification method can accurately calculate the probability of each hazard causing an accident while accurately assessing the outcome of the accident, but the calculation process using this method alone is complex and the risk analysis process is demanding [13]. While the qualitative research method is simple and convenient, it is not very reliable. Therefore, a semiquantitative method with a high degree of objectivity and operability is needed for the classification of hidden dangers.
Commonly used semiquantitative hazard classification methods include layers of protection (LOP), the MES evaluation method, the PLR method, and the PLC method. The LOP model classifies accident hidden dangers into seven categories according to their impact on the safety function of the protection layer of the system: design-build accident hidden dangers, basic process control accident hidden dangers, over-run alarm accident hidden dangers, safety control accident hidden dangers, active protection accident hidden dangers, passive protection accident hidden dangers, and emergency response accident hidden dangers. It is further classified into three levels according to the degradation of safety protection function caused by the hidden danger: level 1 accidental hidden danger significantly affects the safety function of LOP, causing the loss of its main function or overall paralysis; level 2 accidental hidden danger causes partial loss of LOP’s function; and level 3 accidental hidden danger affects only one or a few functions of LOP, and the overall function of LOP can still be maintained. Among them, level 1 hidden dangers correspond to major accident hidden dangers, and levels 2 and 3 correspond to general accident hidden dangers [14]. This classification is based on the nature of accident hidden dangers that can degrade or even disable LOP safety protection, facilitating system analysis. However, the definition, classification, and grading of accident hidden dangers based on the accident doctrine are increasingly unable to meet the needs of safe production practice [15]. The MES evaluation method classifies the status of control measures M, the frequency of exposure E, and the consequences of loss S from hidden dangers, leading to accidents at several levels. For specific operating conditions, the values of M, E, and S are selected appropriately, and the level of hidden dangers is determined according to the product of the multiplication. The method is mainly aimed at the hidden dangers that cause personal injury accidents and occupation-related diseases and is not well adapted to the pipeline hidden danger classification situation [16]. The PLR method combines three evaluation factors, namely, the probability (P) of an accident caused by hidden dangers, the potential loss (L) of an accident, and the affect region (R), and proposes the “PLR Hidden Hazard Rating Scale” to represent the results of classifying accident hidden dangers [17]. The pipeline hidden danger classification results obtained by this method cannot be further adjusted and still require the assistance of other appropriate control and correction measures to obtain the final hidden danger classification results. In contrast to the above methods, the PLC method is a hidden danger grading evaluation method specifically proposed for urban gas enterprises. The determining factors of the hidden danger grade under this method are the possibility of accident P, the degree of accident loss L, and the compensation coefficient C. First, the initial level of hidden dangers is determined by P and L, and the initial level of hidden dangers is flexibly modified by the compensation coefficient C in terms of the material characteristics of the pipeline and management focus and so on. This is a relatively effective method of grading hidden dangers in urban gas pipelines at present [18]. However, the traditional PLC method has a strong subjective initial grade and cannot highlight the management characteristics of urban gas PE pipelines, which cannot be clearly distinguished from traditional steel pipelines.
To address this issue, this paper proposes an improved PLC method applicable to the classification of hidden dangers of urban gas PE pipeline, and establishes its pipeline failure database based on historical accident data of urban gas PE pipelines in the industry. Based on the failure database, this paper can use a quantitative method to determine the P and L values of the major hidden dangers and obtain the initial hidden danger classification. Then on the basis of considering the environment of the pipeline and the characteristics of PE pipeline management, this paper puts forward six compensation coefficient indexes, which can reasonably modify the initial grade. Finally, the effectiveness and feasibility of the proposed method are proved through practical application.

3. Hidden Danger Grading Method

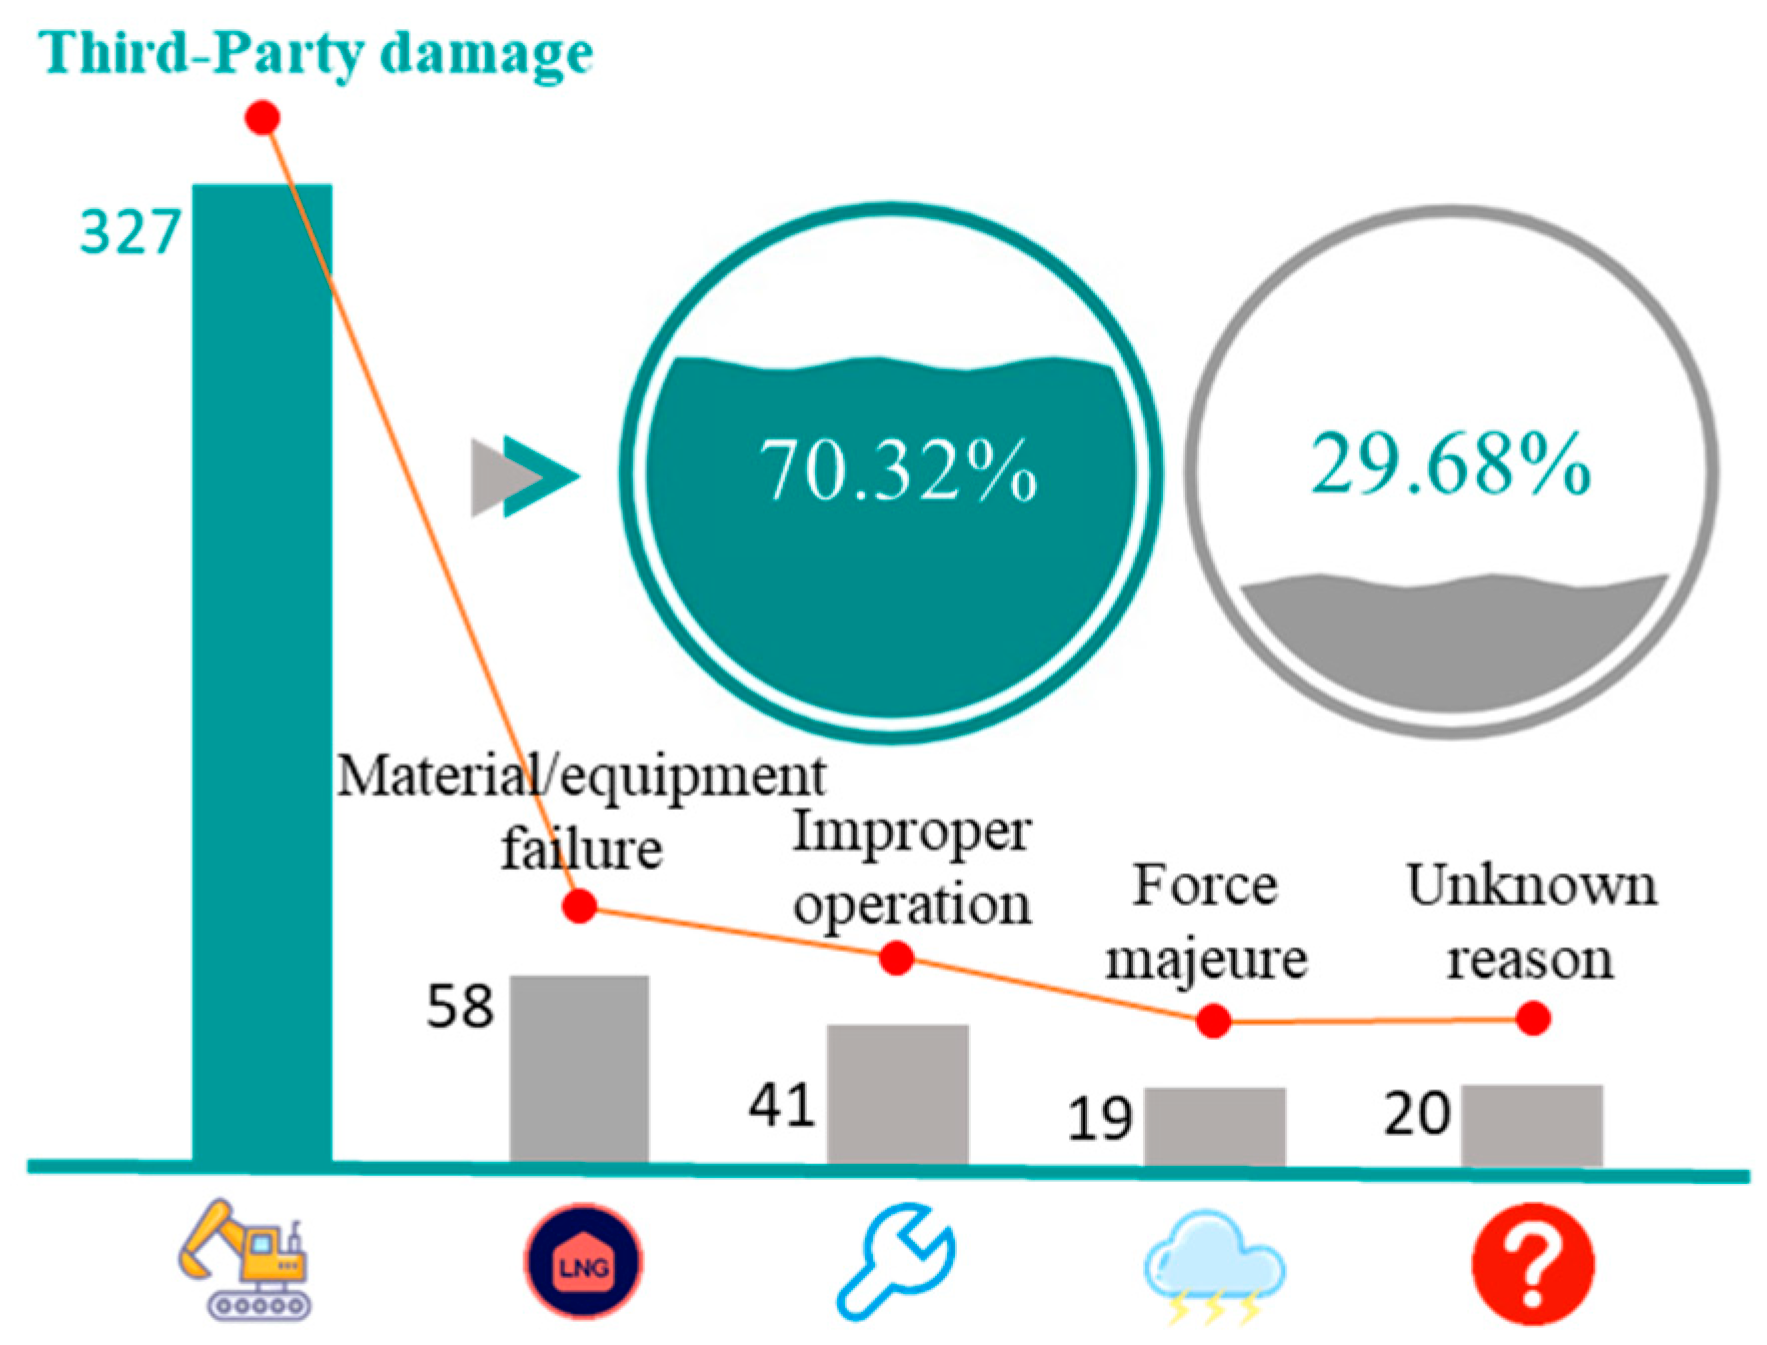
3.1. Database Construction
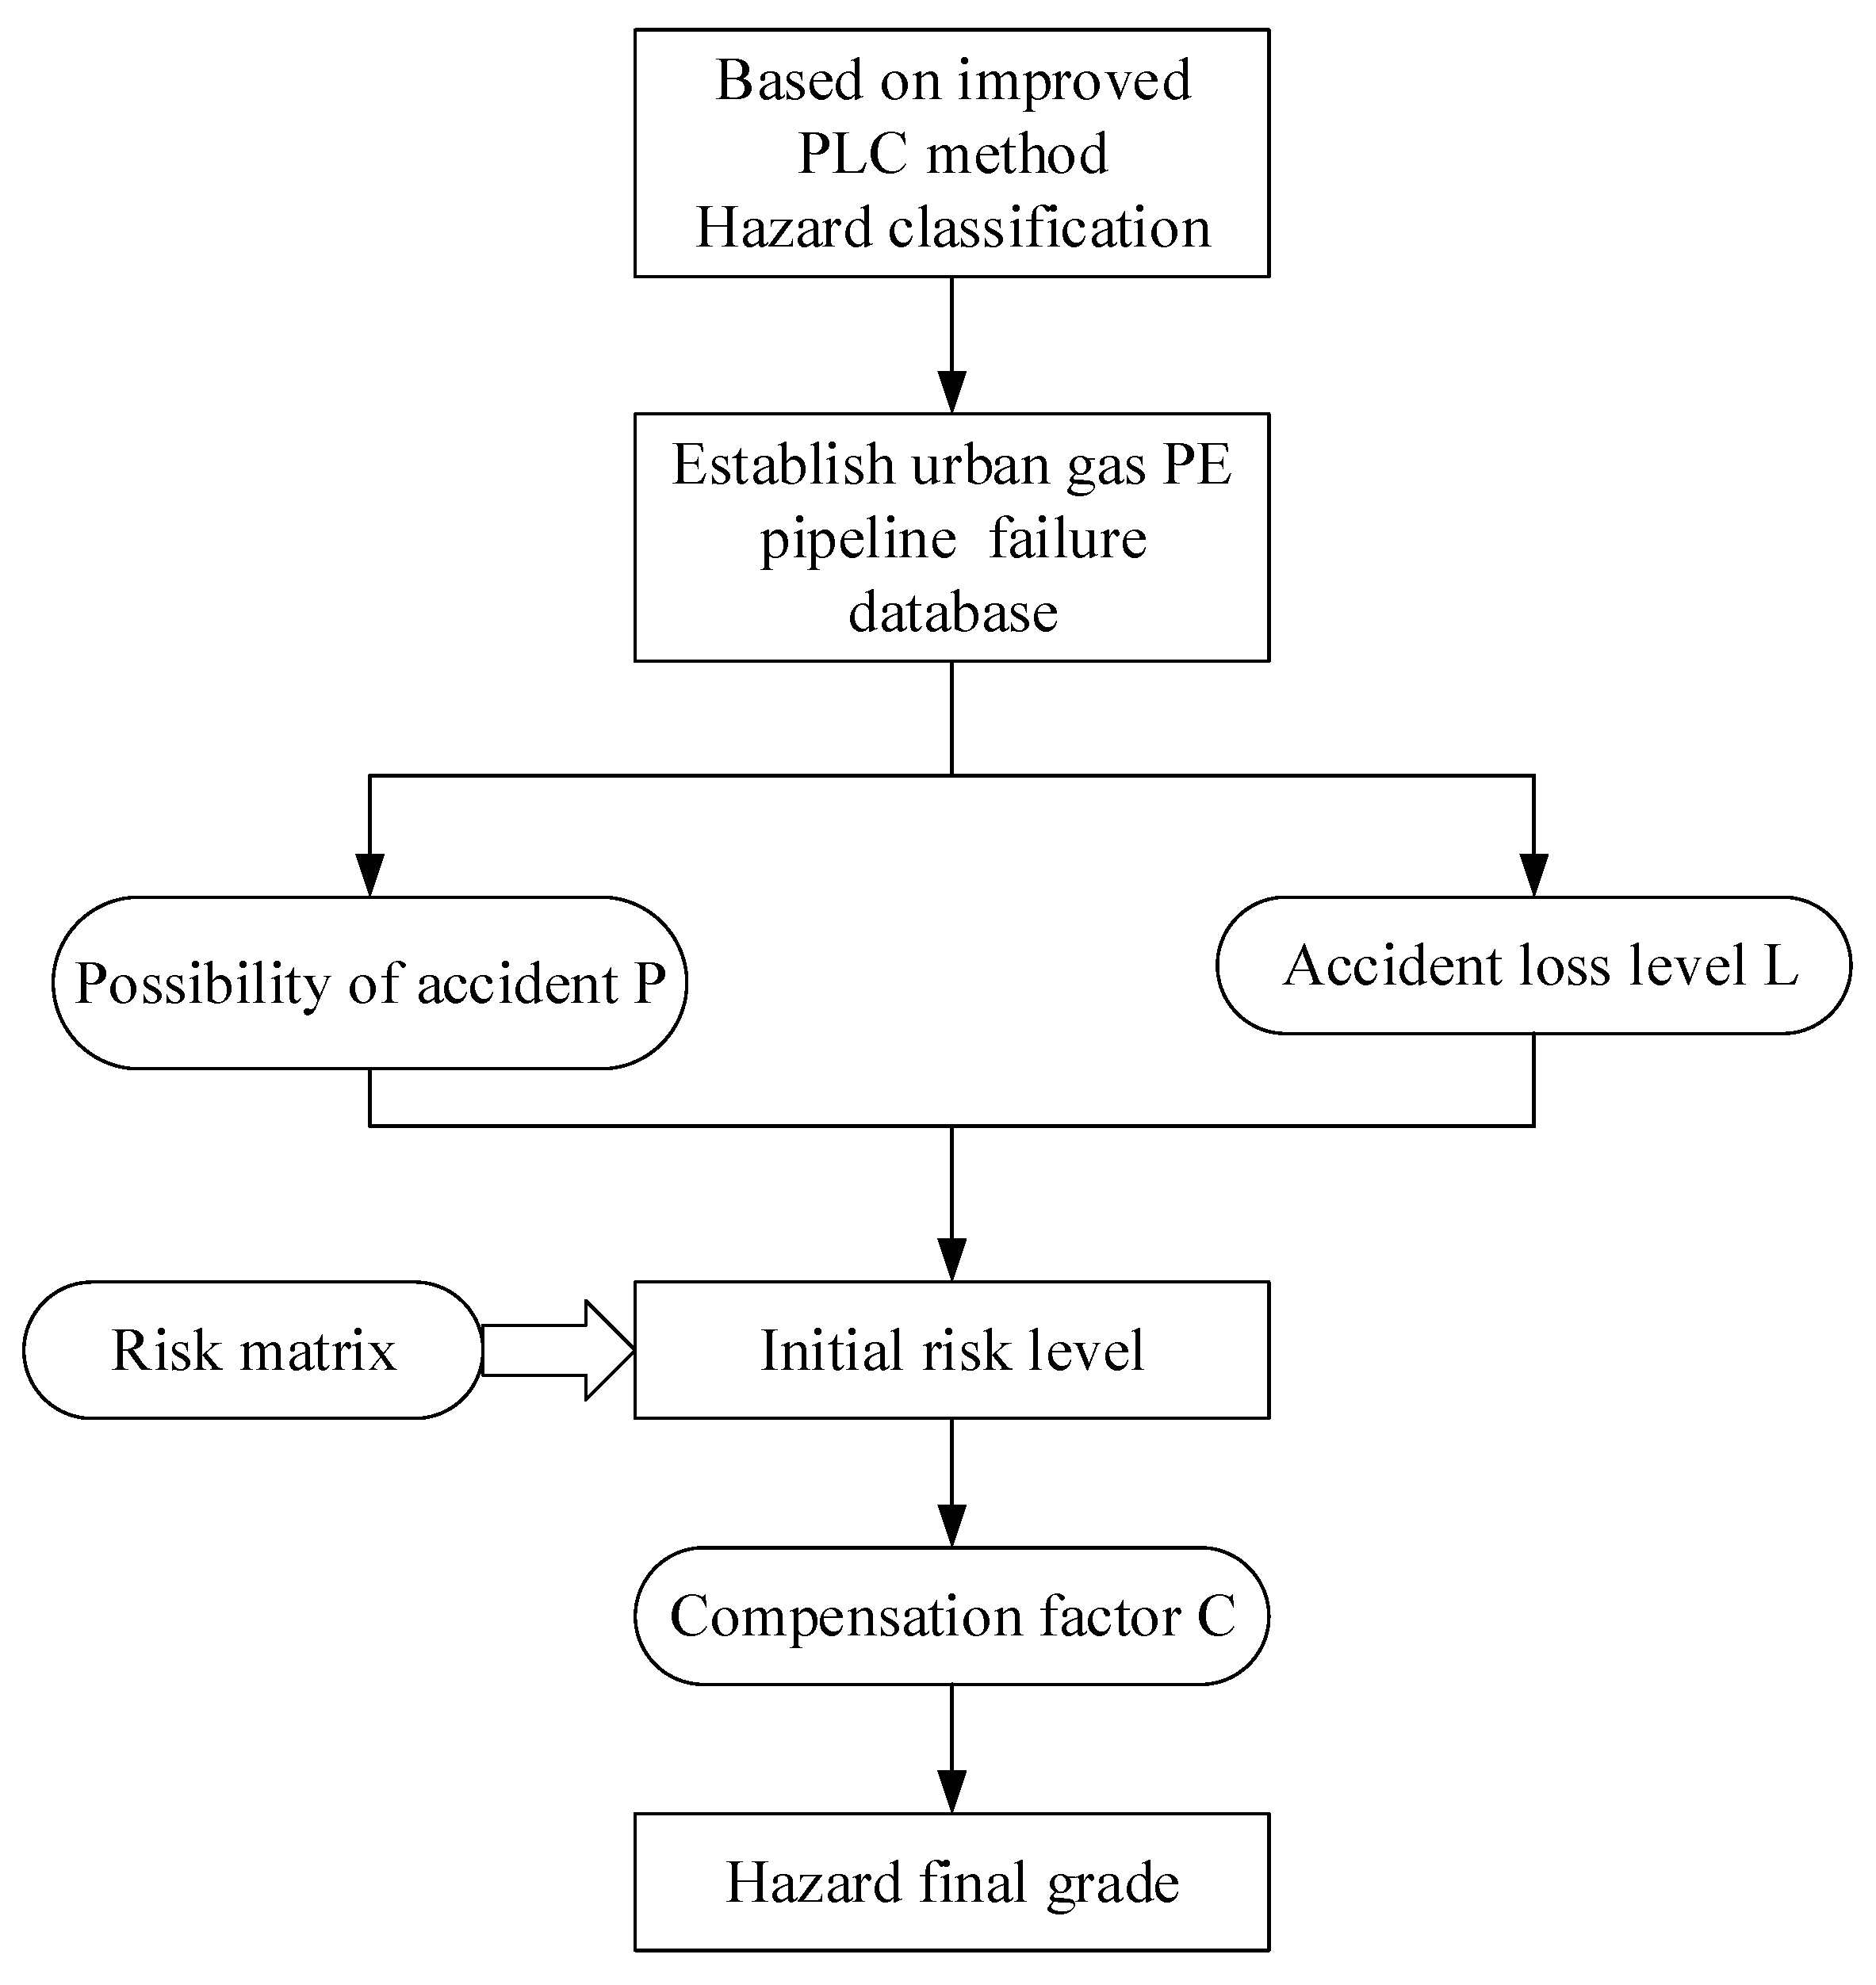
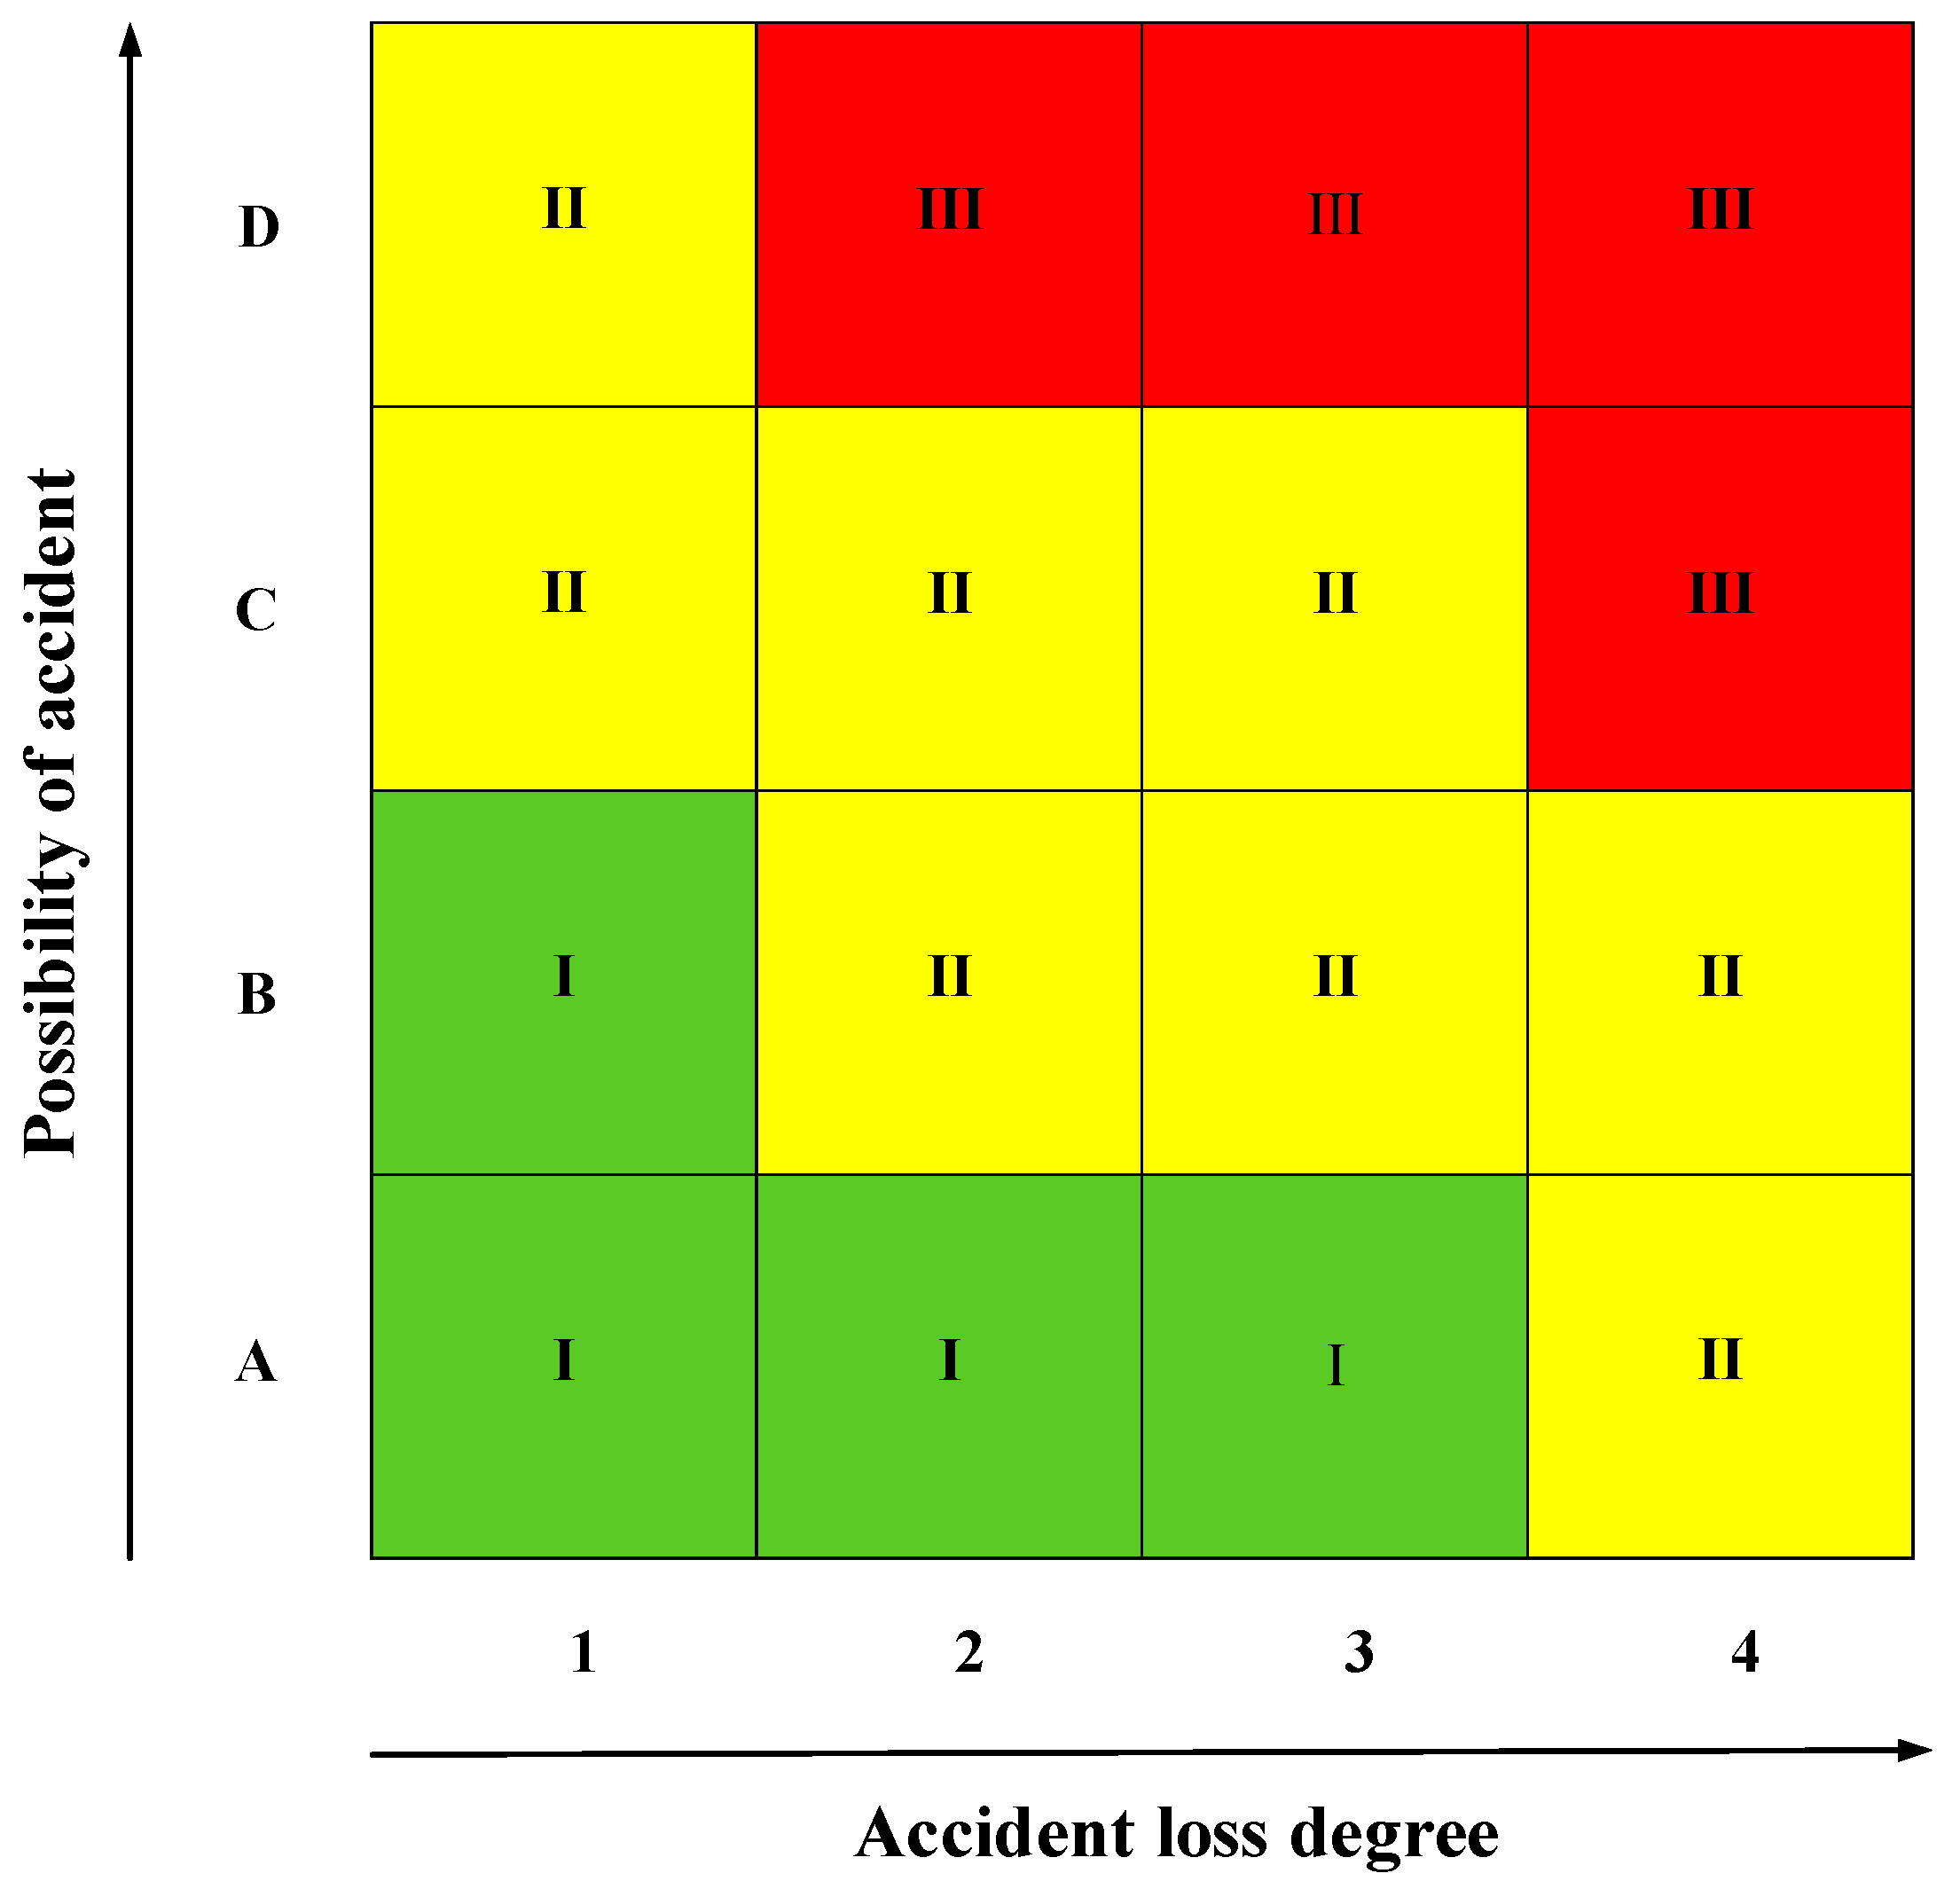
Statistical analysis of pipeline failure data is an important tool to understand the trend of pipeline failure, which can assess the overall pipeline safety situation from a macroscopic perspective [19], and has practical significance for pipeline hazard classification [20], risk identification [21], accident prevention, and mitigation measure formulation [22]. The collection and analysis of failure data is commonly emphasized by pipeline companies, such as the Pipeline and Hazardous Materials Safety Administration (PHMSA) [23], the National Energy Board (NEB) [24], the European Gas Pipeline Incident Data Group (EGIG) [25], the United Kingdom Onshore Pipeline Operators Association (UKOPA) [26], and the Australian Pipeline Industry Association (APIA) [27], which have all established proprietary pipeline failure databases. Among them, the PHMSA database in the United States clearly indicates the data related to PE pipelines for urban gas. Therefore, this paper establishes a failure database specifically for urban gas PE pipelines by referring to existing databases and combining the availability of Chinese accident report data and US PHMSA database data, as shown in Table 1.
The current accident management mechanism specifically for PE material urban gas pipelines is not yet mature and lacks standardized, accurate, and systematic guidance [28]. Therefore, this paper investigates and statisticizes the accident data of urban gas PE pipelines from the China and US PHMSA databases, and forms the failure database of urban gas PE pipelines, providing support for the following initial classification of hidden dangers in this paper. This failure database contains 465 pipeline failure samples, including 57 from China and 408 from the US PHMSA database. More specifically, the database uses relevant websites of the Chinese gas industry as a source of accident data in China, supplemented by accident investigation reports published on the official websites of counties and cities as well as provincial people governments, and screens out a total of more than 5000 urban gas pipeline accidents from 2010 to the present. After screening by pipeline material, 57 accidents were clearly indicated to be PE pipelines, caused by the low coverage of PE pipelines in China and the short duration of the operation. Second, 408 cases of urban gas PE pipeline accidents were screened from the US PHMSA database from 2010 to the present. By analyzing the established failure database, the following five categories of major hidden dangers (cause of pipeline failure) were obtained: third-party damage, material/equipment failure, force majeure, improper operation, and unknown reason, as shown in Table 2. In addition, from the perspectives of Chinese samples and American PHMSA database samples, there is little difference in the proportion of accident failure reasons, and it is not necessary to display them separately. The specific statistics of failure reasons in the failure database of urban gas PE pipelines are shown in Figure 1.

3.2. Grading Model

The determinants of the hidden danger level of the PLC method are divided into the following three categories: Possibility of accident P, accident loss degree L, and compensation factor C. The hidden danger level R can be expressed as:
R = P × L × C
The specific steps are to determine the initial level of accident hidden dangers by the position of P and L in the risk matrix and then correct the initial level by C to get the actual level of hidden dangers. The improved PLC method can quantitatively determine the possibility of accident P and the accident loss degree L by establishing the failure database of the PE pipeline of urban gas, and reduce the subjectivity of determining the initial level of hidden danger. After that, the compensation coefficient C is determined to modify the initial level by testing the specific situation of the evaluation object, and the actual level of hidden danger is obtained. The characteristics of the urban gas PE pipeline and the influence of the external system on the hidden dangers are fully considered to construct the detectability classification index of the compensation factor C, and the hidden dangers of the urban gas PE pipeline are more comprehensively classified.
In this paper, the improved PLC method is used to classify the four types of PE pipeline major hidden dangers, which are calculated from the failure database. The numerical analysis of the failure database of urban gas pipelines is used to obtain the possibility P and the degree of accidental loss L. The initial level of the hidden dangers is then determined with the help of a risk matrix. Finally, the final grade of hidden dangers is determined by the compensation coefficient C. The process of hidden danger grading is shown in Figure 2.

3.3. Indicator Determination

3.3.1. Possibility of Accident (P)

In order to solve the shortcomings of the traditional PLC method of qualitative analysis, and effectively use the urban gas PE pipeline failure database. Referring to the concept of basic failure probability in quantitative risk assessment of oil and gas pipelines [29]: the number of accidents per kilometer per year on average in the oil and gas pipeline system. This paper proposes to divide the possibility of accidents caused by hidden dangers into four grades according to the annual average number of accidents caused by hidden dangers, namely, the average number of cases per year. The four levels are detailed as shown in Table 3: (A) unlikely to happen, (B) less likely to happen, (C) likely to happen, and (D) very likely to happen. According to this analysis, the possible level of accidents caused by hidden dangers can be obtained as shown in Table 4.

3.3.2. Accident Loss Degree (L)

The degree of accidental loss refers to the severity of accidental consequences that may result from hidden dangers. In this paper, according to the characteristics of the urban gas pipelines field, we refer to the grading of the severity of consequences of Zhejiang Energy Natural Gas Group Co., Ltd, Hangzhou, China. (Table 5), and the Regulations on the Reporting and Investigation of Production Safety Accidents (Table 6), and combine the statistics of the average damage of gas accidents in China and the United States to give the qualitative consequence grade reference standards, as shown in Table 7. The final grade is determined based on the maximum grade of the four indicators.
According to the grading criteria, combined with the relevant data from the pipelines’ failure database, the grades of the accident loss degree of the main hidden dangers were obtained, as shown in Table 8.
Most of the legal norms divide the level of hidden dangers into three levels, so the initial level of hidden dangers is determined according to the risk matrix (as shown in Figure 3) by combining the levels of P and L. Level III is a major hidden danger, level II is a large hidden danger, and level I is a general hidden danger.
According to this risk matrix, the initial level of each hidden danger can be derived, as shown in Table 9.

3.3.3. Compensation Factor (C)

The compensation coefficient can be adjusted to the initial level of the hidden danger according to the environment in which the pipeline is located, making the level of the hidden danger more in line with the actual situation and facilitating the enterprise to make corresponding disposal measures and emergency measures for the level of the hidden danger. In order to ensure the scientific integrity of the method, this paper summarizes and condenses six compensation coefficient indexes from the existing hidden danger classification methods, such as the Interim Provisions on Hidden Danger Investigation and Management of Safety Production Accidents and the Hidden Danger Classification of China National Offshore Oil Corporation, combined with the characteristics of urban gas PE pipelines, such as difficulty in locating, complex pipelines, and difficulty in determining the leak location.
The compensation coefficient value of the unit is calculated according to the six compensation coefficient indexes, and the calculation formula is as follows:
C = i = 1 6 C i
where C i is the value of the compensation coefficient for each cell, and the details are shown in Table 10.
According to the value of the compensation coefficient to adjust the initial level of accident hidden dangers to get the final level of accident hidden dangers, the adjustment method is shown in Table 11.

4. Example Applications

4.1. Basic Information

The busy section of Songyuan City, Jilin City (Ulan Street to the Fifth Ring Street section), is equipped with an urban medium pressure gas pipeline made of PE, with a pipe diameter of 110 mm, a working pressure of 0.3 MPa, and a burial depth of 3.9 m. Having other underground spaces around the pipeline makes it easier for gas to leak. There are buildings above the pipeline, such as the Ningjiang First Primary School, Songyuan People’s Hospital, Oriental Home, and Social Security Home, which are densely populated areas. The pipeline was constructed and operated by Jilin Haoyuan Gas Co., Ltd. The person in charge of the area did not conscientiously fulfill his responsibilities as the first responsible person for safety production, and the gas pipeline protection measures were not implemented. The safety management of gas equipment operation was not implemented, and emergency preparedness was lacking. The company’s pipeline positioning technology and leak detection technology both use the most advanced technical means and testing instruments in the current market, and can achieve a high degree of accuracy.

4.2. Hidden Danger Grading

Jilin Haoyuan Gas Co., Ltd., finds three hidden dangers here in the process of identifying hidden dangers for this pipeline: third-party excavation damage, vandalism, and improper operation by the contractor. The hidden danger level is shown in Table 12.
The final results show that for this pipeline, third-party excavation, vandalism, and contractor improper operation hidden dangers are major, major, and general hidden dangers, respectively. In addition, it can be seen from Table 12 that the initial grades of the three typical hidden dangers found on the pipeline were adjusted according to the compensation coefficient C, which proves that the traditional classification method that only considers the failure possibility and failure consequence has considerable disadvantages. Considering six types of external factors, such as the real environment in which urban gas PE pipelines are located and the unique characteristics of PE gas pipelines, has an important impact on the accuracy of the hidden hazard classification, while proving that the PLC method is necessary.

4.3. Disposal of Hidden Dangers

The third-party excavation, intentional damage, and the contractor’s improper operation of hidden dangers of PE pipelines in the prosperous section of Jilin Songyuan City are major hidden dangers, significant hidden dangers, and general hidden dangers, respectively. Therefore, the hidden danger management plan for PE pipelines in the busy section of Songyuan City, Jilin City, is shown in Table 13, and the targeted management measures are shown in Table 14.

5. Conclusions and Recommendations

5.1. Conclusions

This paper establishes a pipeline failure database based on domestic and international statistics of PE accidents in urban gas and obtains the following four categories of typical hidden dangers for PE gas pipelines, third-party damage, material/equipment failure, force majeure, and improper operation. Among them, third-party damage hazards account for more than 70% of all accident hidden dangers. To address the grading of four typical hidden dangers, this paper proposes an improved PLC method based on existing research on the hidden danger grading method for urban gas pipelines, in which the initial grade of hidden danger grading is determined by obtaining the grade of hidden danger susceptibility and the grade of the severity of accident consequences through the analysis of the pipeline failure database, which greatly reduces the subjectivity of the original method. In setting the compensation coefficient, the influences of external factors, such as regional vulnerability, ease of rectification, condition around the pipeline, positioning technology, leak detection technology, and emergency ability, are considered, respectively, so as to determine the corrected hidden danger level and make the corrected hidden danger level more in line with the real situation. Finally, the practicality and feasibility of the method are tested by applying the method in this paper to a field example.

5.2. Recommendations

For PE pipeline common typical hidden dangers, gas pipeline operating enterprises must strengthen the awareness of prevention for different hidden dangers to take corresponding disposal measures, but also pay special attention to the impact of third-party damage on buried PE pipeline. Enterprises should form a special third-party damage protection manual from a comprehensive system to reduce the probability of accidents. The improved PLC method is a new grading management technique for urban gas pipelines with hidden dangers. Through hidden danger grading assessment, pipelines can be classified, management can be focused on pipelines worthy of attention, and investment in pipelines safe for the operating environment can be reduced, thus reducing risks and management costs, minimizing economic losses caused by sudden accidents in buried PE pipelines of urban gas, and improving the safety of pipelines.

Author Contributions

Conceptualization, Y.W. (Yunlong Wang), H.L. and Y.W. (Yun Wu); methodology, Z.L. and H.L.; software, Y.W. (Yunlong Wang) and X.H.; resources, H.L., Y.W. (Yun Wu) and K.Z.; data curation, Y.W. (Yunlong Wang), H.L. and Y.W. (Yun Wu); writing—original draft preparation, Z.L. and X.H.; writing—review and editing, Y.W. (Yunlong Wang) and Z.L.; funding acquisition, Y.W. (Yunlong Wang). All authors have read and agreed to the published version of the manuscript.

Funding

This research was funded by the Science and Technology Project of Zhejiang Energy Natural Gas Group Co., Ltd., grant number ZNKJ-2020-080.

Data Availability Statement

Not applicable.

Conflicts of Interest

The authors declare no conflict of interest.

References

  1. You, L. Approach of development of town gas in China. In Energy, Resources and Environment; Pergamon: Oxford, UK, 1982; pp. 235–241. [Google Scholar]
  2. Xu, X. Global renewable energy development: Influencing factors, trend predictions and countermeasures. J. Resour. Policy 2019, 63, 101470. [Google Scholar] [CrossRef]
  3. Xu, X.; Hao, J.; Zheng, Y. Multi-objective artificial bee colony algorithm for multi-stage resource leveling problem in sharing logistics network. Comput. Ind. Eng. 2020, 142, 106338. [Google Scholar] [CrossRef]
  4. Xu, X.; He, Y. Blockchain application in modern logistics information sharing: A review and case study analysis. Prod. Plan. Control. 2022, 1–15. [Google Scholar] [CrossRef]
  5. Xu, X.; Wang, C.; Zhou, P. GVRP considered oil-gas recovery in refined oil distribution: From an environmental perspective. Int. J. Prod. Econ. 2021, 235, 108078. [Google Scholar] [CrossRef]
  6. Wang, Z.; Luo, D.; Liu, L. Natural gas utilization in China: Development trends and prospects. Energy Rep. 2018, 4, 351–356. [Google Scholar] [CrossRef]
  7. Li, X.; Han, Z.; Zhang, R.; Abbassi, R.; Chang, D. An integrated methodology to manage risk factors of aging urban oil and gas pipelines. J. Loss Prev. Process Ind. 2020, 66, 104154. [Google Scholar] [CrossRef]
  8. Zhang, P.; Qin, G.; Wang, Y. Optimal Maintenance Decision Method for Urban Gas Pipelines Based on as Low as Reasonably Practicable Principle. Sustainability 2019, 11, 153. [Google Scholar] [CrossRef] [Green Version]
  9. Han, Z.Y.; Weng, W.G. Comparison study on qualitative and quantitative risk assessment methods for urban natural gas pipeline network. J. Hazard. Mater. 2011, 189, 509–518. [Google Scholar] [CrossRef]
  10. Meng, T.; Li, X.; Li, C.; Wang, X. Pplication of risk assessment technology on PE Gas Pipeline System of the Residential Area. In Proceedings of the 2020 3rd International Conference on Electron Device and Mechanical Engineering (ICEDME), Suzhou, China, 1–3 May 2020. [Google Scholar]
  11. Wasim, M.; Djukic, M.B. External corrosion of oil and gas pipelines: A review of failure mechanisms and predictive preventions. J. Nat. Gas Sci. Eng. 2022, 100, 104467. [Google Scholar] [CrossRef]
  12. Adelia, Y.F.; Manurung, R.; Permana, H.; Munir, B. Quantitative risk assessment for external corrosion of buried onshore pipeline by using direct examination. AIP Conf. Proc. 2021, 2338, 040002. [Google Scholar]
  13. Li, S.; Cheng, C.; Pu, G.; Chen, B. QRA-Grid: Quantitative risk analysis and grid-based pre-warning model for urban natural gas pipeline. ISPRS Int. J. Geo Inf. 2019, 8, 122. [Google Scholar] [CrossRef] [Green Version]
  14. Dowell, A.M., III. Layer of protection analysis for determining safety integrity level. ISA Trans. 1998, 37, 155–165. [Google Scholar] [CrossRef]
  15. Rate, I.F. Limitations and misuse of LOPA. Loss Prev. Bull. 2019, 265, 13. [Google Scholar]
  16. Gong, W.; Zhang, Q. Exploration of application of the MES method in the risk assessment on occupational hazard in construction projects. Mod. Prev. Med. 2010, 37, 1612–1635. [Google Scholar]
  17. You, Q.; Fan, J.; Zhu, W.; Bai, Y. Application of PLR classification guide for accidental potential in Beijing LPG storage and distribution station. Intelligent Systems and Decision Making for Risk Analysis and Crisis Response. In Intelligent Systems and Decision Making for Risk Analysis and Crisis Response, Proceedings of the 4th International Conference on Risk Analysis and Crisis Response, Istanbul, Turkey, 27–29 August 2013; CRC Press: Boca Raton, FL, USA, 2013; p. 269. [Google Scholar]
  18. Bai, Y.; Wang, T.; Lv, L.; Xie, Y.; Song, B. The PLC method and its application for the assessment of the hidden danger of urban gas accidents. In Proceedings of the 2009 Academic Annual Conference of China Occupational Safety and Health Association, Xiamen, China, 12 November 2009. [Google Scholar]
  19. Liu, B.; Zhang, P. Research on the Pipeline Security Protection Technology of Pipeline Integrity Based on Gis. In Proceedings of the 2011 Fourth International Symposium on Knowledge Acquisition and Modeling, Sanya, China, 8–9 October 2011; pp. 454–457. [Google Scholar]
  20. Halim, S.Z.; Yu, M.; Escobar, H.; Quddus, N. Towards a causal model from pipeline incident data analysis. Process Saf. Environ. Prot. 2020, 143, 348–360. [Google Scholar] [CrossRef]
  21. Lam, C. Statistical Analyses of Historical Pipeline Incident Data with Application to the Risk Assessment of Onshore Natural Gas Transmission Pipelines. Master’s Thesis, The University of Western Ontario, London, ON, Canada, 2015. [Google Scholar]
  22. Gao, L.; Fan, X.; Liu, L. Constructing a Quality Management System with Risk Control as the Core. Tech. Superv. Pet. Ind. 2019, 35, 29–33. [Google Scholar]
  23. Lam, C.; Zhou, W. Statistical analyses of incidents on onshore gas transmission pipelines based on PHMSA database. Int. J. Press. Vessels Pip. 2016, 145, 29–40. [Google Scholar] [CrossRef]
  24. Paviglianiti, J.; Shaw, S. Analysis of the National Energy Board Pipeline Integrity Performance Measures Data. In International Pipeline Conference; American Society of Mechanical Engineers: New York, NY, USA, 2018; Volume 51869, p. V001T03A050. [Google Scholar]
  25. Bolt, R.; Owen, R.W. Recent Trends in Gas Pipeline Incidents (1970–1997): A Report by the European Gas Pipeline Incidents Data Group (EGIG). 1999. Available online: https://www.osti.gov/etdeweb/biblio/20082704 (accessed on 12 May 2022).
  26. Brown, P. United Kingdom Onshore Pipeline Operators Association (UKOPA)-World-class pipeline safety. Int. Gas Eng. Manag. 2004, 44, 32. [Google Scholar]
  27. Davies, S. Data for developers: The Australian Pipeline Database. Aust. Pipeline Off. Publ. Aust. Pipelines Gas Assoc. 2016, 167, 38–40. [Google Scholar]
  28. Lin, D.; Wang, Y.; Qin, L. The Enlightenment of Foreign Pipeline Failure Database Construction on my country’s Pipeline Risk Management. Welded Pipe 2012, 35, 64–66. [Google Scholar]
  29. Shan, K.; Shuai, J.; Xu, K.; Zheng, W. Failure probability assessment of gas transmission pipelines based on historical failure-related data and modification factors. J. Nat. Gas Sci. Eng. 2018, 52, 356–366. [Google Scholar] [CrossRef]
Figure 1. Statistical chart of the causes of failure of PE pipeline accidents in urban gas.
Energies 15 06073 g001
Figure 2. The process of hidden danger grading.
Energies 15 06073 g002
Figure 3. Risk matrix of hidden danger classification.
Energies 15 06073 g003
Table 1. Urban gas PE pipeline failure database composition.
General InformationInformation about the Consequences of FailureRelated Sources
Date of expiration
Name of pipelines
Cause of failure
Failure part
Type of failure leak
Fire and explosion situation
Number of injured
Number of deaths
Number of households affected
Economic loss
Press releases
Gas industry website
Accident investigation report
PHMSA
Table 2. Major hidden dangers of urban gas PE pipelines (cause of pipeline failure).
Cause of Pipeline FailureDetailed Interpretation
Third-party damageDamage to the urban gas pipeline caused by the actions of non-gas pipeline personnel.
Material/equipment failurePipeline failure caused by unqualified material performance and abnormal operation of equipment. For example, pipe manufacturing defects and weld defects.
Force majeurePipeline failure due to unforeseen, unavoidable, and insurmountable circumstances. For example: lightning strike, typhoon, and rainstorm.
Improper operationPipeline failure due to improper operation of pipeline operators.
Unknown reasonCases of pipe failure whose cause has not been identified.
Table 3. Reference standard of the possibility of a hidden danger causing an accident level.
Accident Probability LevelAverage Number of Cases per Year
A (unlikely to happen)[0, 0.5)
B (less likely to happen)[0.5, 2)
C (likely to happen)[2, 5)
D (very likely to happen)≥5
Table 4. Urban gas PE pipeline database possibility rating for hidden dangers.
Typical Hidden DangersAverage Number of Cases per YearRating
Force majeureEarthquake0.333333A
Heavy rain/flood0.25A
Lightning0.416667A
Temperature0.083333A
High wind0.25A
Other0.25A
Third-party damageThird-party excavation damage19.5D
Nearby fire/explosion damage1.583333B
Vehicle accidents1.333333B
Equipment arc damage0.75B
Vandalism0.166667A
Excavation damage repair failure0.166667A
Other external damage3.75C
Material/equipment failurePipe failure1.166667B
Flange connection failure0.916667B
Fused joint failure1.583333B
Other connection failures0.58333A
Control/pressure relief equipment failure0.333333A
Failure of threaded connections0.166667A
Other equipment failures0.083333A
Improper operationFirst-party excavation damage0.583333B
Second-party excavation damage0.583333B
Improper operation by contractor0.5B
Pipeline or equipment overpressure0.166667A
Improper equipment installation operation0.333333A
Other improper operation1.25B
Other accident causesOther causes0.583333B
Unknown causes1.083333B
Table 5. Zhejiang Energy Natural Gas Group Co., Ltd., consequence severity grading.
ValueLegal Provisions and Other RequirementsLoss of Life and Personal InjuryFinancial LossLockoutCorporate Image
5Violation of laws, regulations, and standardsDeathMore than 500,000 yuanMore than two sets of equipment shutdownSignificant domestic impact
4Potential violations of regulations and standardsLoss of labor force250,000–500,000 yuanTwo units shutdownInfluence within the industry and province
3Does not conform to the safety policy, system, and regulation of the superior company or industryAmputations, broken bones, hearing loss, chronic diseases100,000–250,000 yuanOne set of equipment shutdownRegional influence
2Does not comply with the safety operation procedures and regulations of the enterpriseMinor injury, intermittent discomfortLess than 100,000 yuanThe impact is minor, and there is almost no work stoppageCompany and surrounding area
1In full compliance withNo casualtiesNo lossNo shutdownNo damage
Table 6. Grading of the severity of consequences of the Regulations on the Reporting and Investigation of Production Safety Accidents.
Level of AccidentSeriously Injured PeopleDeath TollDirect Economic Loss
Extremely serious accident>100>30>100 million yuan
Major accident50–10010–3050–100 million yuan
Larger accident10–503–1010–50 million yuan
General accident≤10≤3≤10 million yuan
Table 7. Accident loss degree reference standard.
Level of AccidentNumber of InjuriesDeath TollNumber of Households AffectedDirect Economic Loss
10–10[0, 200][0, 100]
21–20(200, 2000](100, 200]
32–30–1(2000, 4000](200, 500]
4≥3≥1>4000>5 million yuan
Table 8. Typical hidden danger accident loss level.
Typical Hidden DangersAverage Number of InjuredAverage Number of DeathsAverage Number of Households AffectedAverage Direct Economic LossGrade
Force majeureEarthquake12273.5999.79744
Heavy rain/flood0025.666725.158171
Lightning003.262.602061
Temperature00172281.640271
High wind00224.33310.334671
Other0.50520.3333344.27923
Third-party damageThird-party excavation damage0.836630.11442407.2966474.04163
Nearby fire/explosion damage0.368420.1578939.7368486.7563
Vehicle accidents0.43750.0625891.90033
Equipment arc damage0068607.96664
Vandalism004002
Excavation damage repair failure00259.5385.98233
Other external damage0.511110.0222287,063.56304.75864
Material/equipment failurePipe failure0.928570.07142599.4286357.94
Flange connection failure0.50.15.9499.01773
Fused joint failure0.368420.05263104127.81273
Other connection failures0.428570.142857219.857162.504353
Control/pressure relief equipment failure001.33361.880062
Failure of threaded connections0.50515.5145.54962
Other equipment failures0074350.64853
Improper operationFirst-party excavation damage0.166660659.333100.78852
Second-party excavation damage0.285710147121.29282
Improper operation by contractor16.21.40.51065.1024
Pipeline or equipment overpressure001118.76492
Improper equipment installation operation0.506248.309121
Other improper operation0.733330.1333386.889.682081
Other accident causesOther causes0.857140125.428630.111531
Unknown causes0.60.13.4177.99072
Table 9. Typical hidden danger initial grading table.
Typical Hidden DangersGrade
Force majeureEarthquake
Heavy rain/flood
Lightning
Temperature
High wind
Other
Third-party damageThird-party excavation damage
Nearby fire/explosion damage
Vehicle accidents
Equipment arc damage
Vandalism
Excavation damage repair failure
Other external damage
Material/equipment failurePipe failure
Flange connection failure
Fused joint failure
Other connection failures
Control/pressure relief equipment failure
Failure of threaded connections
Other equipment failures
Improper operationFirst-party excavation damage
Second-party excavation damage
Improper operation by contractor
Pipeline or equipment overpressure
Improper equipment installation operation
Other improper operation
Other accident causesOther causes
Unknown causes
Table 10. Compensation factor values for each unit.
Level IndicatorsSecondary IndicatorsData Range
Regional vulnerabilityThere are 2 or fewer densely populated areas within the 50 m range on both sides of the pipeline centerline0.7–1.0
There are 3 densely populated areas within the 50 m range on both sides of the pipeline centerline1.0–1.2
There are 4 or more densely populated areas within the 50 m range on both sides of the pipeline centerline1.2–3.0
Ease of rectificationSmall business/branch can take care of itself0.3–0.5
Need group company/head office coordination to solve0.5–1.0
Need district county gas office to coordinate solution1.0–1.6
Need to be coordinated by the municipal gas office1.6–3.0
Condition around pipelineThere are other pipes around, and they are not up to standard1.4–2.5
Other lines around but up to standard1.0–1.4
There is no other pipeline around0.5–1.0
Positioning technologyHigh positioning accuracy0.4–1.0
Average positioning accuracy1.0–1.4
Poor positioning accuracy1.4–2.0
Leak detection technologyHigh positioning accuracy0.4–1.0
Average positioning accuracy1.0–1.4
Poor positioning accuracy1.4–2.0
Emergency abilityHave a complete emergency plan and emergency supplies0.7–1.0
Inadequate emergency plans or lack of emergency supplies1.5–1.8
Inadequate emergency plans and lack of emergency supplies1.8–3.0
Note: densely populated areas refer to schools, hospitals, shopping malls, famous scenic spots, entertainment places, residential areas with more than 100 households, and so on.
Table 11. Accident potential initial level adjustment method.
Compensation FactorAdjustment Method
C ≤ 0.5Hidden danger level reduced by 2 levels
0.5 < C ≤ 1.0Hidden danger level reduced by 1 level
1.0 < C ≤ 1.2Hidden danger level is not adjusted
1.2 < C ≤ 2.5Hidden danger level is increased by 1 level
C > 2.5Hidden dangers level is increased by 2 levels
Hidden danger to level I or Ⅲ, no adjustment will be made.
Table 12. Typical hidden danger grading.
Typical Hidden DangersPLThe Initial LevelCompensation FactorThe Final Grade
C1C2C3C4C5C6C
Third-party excavation damageD31.20.81.41.01.01.82.0
VandalismA2I1.21.21.41.01.01.83.6
Improper operation by contractorB41.20.31.41.01.01.80.9I
Table 13. Hidden danger classification disposal management scheme.
Typical Hidden DangersHeadTime LimitObjectives, Management PlanBasic Management Measures
Third-party excavation damageSenior managementImmediately correctiveImmediately stop the operation, listed in the enterprise supervision and rectification hidden trouble governance project, develop a target plan to control hidden trouble, and re-evaluate the hidden trouble after the hidden trouble governance measures are implemented. Listed in the list of major hidden dangers of enterprises, focus on monitoring.(1) Pipeline protection publicity and public education
(2) Setting and maintenance of pipeline warning marks
(3) Establishment, implementation, and assessment of pipeline inspection and care management system
(4) Regular inspection of pipelines
(5) Formulate and drill safety plans
VandalismSenior managementImmediately correctiveImmediately stop the operation, listed in the enterprise supervision and rectification hidden trouble governance project, develop a target plan to control hidden trouble, and re-evaluate the hidden trouble after the hidden trouble governance measures are implemented. Listed in the list of major hidden dangers of enterprises, focus on monitoring.
Improper operation by contractorMiddle managementImmediately correctiveTo be listed as a department-level hidden trouble control project, develop a target plan to control hidden trouble, and re-evaluate hidden trouble after the implementation of hidden trouble control measures.
Table 14. Specific measures for graded disposal of hidden dangers.
Typical Hidden DangersHazard LevelTreatment Measure
Third-party excavation damageMajorA1 signing of pipeline protection agreements
A2 development of special plans and regular drills for hidden pipeline sections
A4 increasing the means of operational monitoring
A5 increasing the density of warning signs
A6 conducting high-consequence area management
A7 reporting to the relevant local government departments
B1 increasing the burial depth of pipelines
B9 installing additional monitoring or security surveillance systems
C7 construction call-off
C9 establishing special funds
VandalismMajorA1 signing pipeline protection agreements
A2 developing special plans and regular drills for hidden pipeline sections
A3 shortening the inspection interval
A4 increasing the means of operational monitoring
A5 increasing the density of warning signs
A6 conducting high-consequence area management
A7 reporting to the relevant local government departments
B1 increasing the burial depth of pipelines
B3 shortening the inspection cycle
C4 dismantling or removing the occupants
Improper operation by contractorGeneralA1 Sign pipeline protection agreement
A2 Formulate special plans for hidden dangers and conduct regular drills
A3 Shorten the inspection interval
A4 Add operation monitoring means
A5 Increase the density of warning labels
A6 High-consequence zone management
A7 Report to relevant local government departments
Note: Class A, class B, and class C measures can be used for the disposal of hidden dangers at all levels. As the level of measures increases from A to C, lower-level measures can be replaced by appropriate and effective higher-level measures.
Publisher’s Note: MDPI stays neutral with regard to jurisdictional claims in published maps and institutional affiliations.

