Article

Effects of Curing Pressure on the Long-Term Strength Retrogression of Oil Well Cement Cured under 200 °C

1
Oil and Gas Engineering Research Institute, PetroChina Tarim Oilfield Company, Korla 841000, China
2
School of Petroleum Engineering, China University of Petroleum (East China), Qingdao 266580, China
3
Key Laboratory of Unconventional Oil & Gas Development, China University of Petroleum (East China), Ministry of Education, Qingdao 266580, China
4
Supervision Center, PetroChina Tarim Oilfield Company, Korla 841000, China
*
Author to whom correspondence should be addressed.
Energies 2022, 15(16), 6071; https://doi.org/10.3390/en15166071
Submission received: 7 July 2022 / Revised: 22 July 2022 / Accepted: 17 August 2022 / Published: 21 August 2022

Abstract

:
The influences of curing pressure on the physical and mechanical property development of oil well cement during long-term curing were studied. Five silica-enriched cement slurries designed without and with reinforcement materials (latex fiber and nano-graphene) were autoclaved at 200 °C under two different pressures. The low pressure (50 MPa) curing was conducted for 2, 60, 90 and 180 days; the high pressure (150 MPa) curing was conducted for 2 and 360 days. The physical and mechanical properties of set cement were characterized by compressive strength, Young’s modulus, and water/gas permeability; the mineral composition and microstructure were determined by X-ray diffraction, mercury intrusion porosimetry, thermogravimetry and scanning electron microscope. Test results showed that high pressure (150 MPa) curing led to a more compact microstructure, which reduced the rate of strength retrogression in the long term. Samples with reinforcement materials, especially the latex fiber, showed higher compressive strength, Young’s modulus and lower permeability during long-term curing at both pressures.

1. Introduction

With the increasing activities of deep well drilling and completion, significant efforts have been made to study the physical principles of the strength retrogression of oil well cement under high pressure and high temperature (HPHT) conditions. Silica has traditionally been the most commonly used material to mitigate strength retrogression [1,2,3,4,5,6,7,8,9,10,11,12,13]. However, it has been [14,15] revealed recently that silica can become ineffective during long-term curing under simulated deep well cementing conditions (set and cured under HPHT conditions, i.e., the so-called “one-step” curing regime), which is in great contrast to the test results under simulated steam injection well conditions (set at low temperature and cured at HPHT conditions, i.e., the so-called “two-step” curing regime). The long-term strength decline of silica-enriched oil well cement often exceeds 80%, while its permeability can increase by two orders of magnitude. We have conducted a series of studies to understand such behavior of oil well cement and to optimize the cement composition design to improve its properties under the “one-step” curing regime (at the specific condition of 200 °C and 50 MPa) [14,15,16,17]. The main findings include: (1) the optimal dosage of silica flour is 60–80% based on 14 d strength [17]; (2) reducing the particle size of silica is beneficial for strength stability, at least during the first 30 d [16]; (3) addition of silica fume can improve strength at early age (2 d) but accelerates the strength decline afterward [16]; (4) addition of nanoparticles (such as nanosilica and nano-iron oxide) can reduce permeability at early age, but probably has little effect in the long term [16,17]; (5) addition of nano-graphene can significantly improve the long-term stability of Young’s modulus but cannot prevent strength decline or permeability increase [16]; (6) long-term strength retrogression may be caused by crystallization or structural coarsening of amorphous C-S-H [14,16,17].
Under HPHT conditions, the influence of curing temperature has been considered as the main factor affecting the properties of set cement, while the influence of curing pressure was often ignored. In the petroleum industry, service companies came up with slightly different definitions for HPHT conditions. Baker Oil Tools’ HPHT classification was used in Figure 1 [18], and the curing conditions of previous publications for strength retrogression were plotted [4,5,6,7,8,9,10,11,12,13,14,15,16,17]. In those studies, silica-enriched systems were often used to ensure the integrity of the wellbore. It can be seen in Figure 1 that the curing temperature varied widely from 150 to 350 °C, while only three curing pressures were chosen by researchers: 13.8 MPa (2000 psi), 20.7 MPa (3000 psi) and 50 MPa (our recent studies). Most studies met the high-temperature standard (150 °C) but were far below the high-pressure standard (69 MPa). The reason why curing pressure was ignored can be dated back to 1954, where an API study [4] found that the 24 h compressive strength of oil well cement cured at 93 °C, apparently increased with increasing curing pressure in the range of 0–13.8 MPa, but showed little dependence on curing pressure in the range of 13.8–52 MPa. As a result, most subsequent studies assumed that the influence of curing pressure (greater than 13.8 MPa) on cement compressive strength could be ignored. However, the influence of curing pressure may not be ignored in some ultra-high pressure fields that exist in the Gulf of Mexico, North Sea, Southeast Asia, Africa and the Middle East; several deep water and deep gas reservoir formation pressures can reach 138 MPa [18,19]. In China, the formation pressure gradient of the Yingqiong and Tarim Basin even exceeded 2 Mpa/100 m [20,21]. In recent years, it has been found that curing pressure has a similar (albeit smaller) effect in accelerating the hydration reaction of oil well cement, and its influences on thickening time and other early-age properties cannot be ignored [22,23,24,25,26]. Therefore, the influence of ultra-high pressure on set cement properties in the long term also needs to be further explored.
Numerical simulations of cement sheath integrity often suggest that increasing the tensile strength and ductility of oil well cement is beneficial for its resistance to failure [27,28,29]. Various types of reinforcement materials, such as crystal whisker, fiber, graphene, and latex, were often used to reduce the brittle nature of set cement through the bridging effect across cracks, thereby improving the durability of cement sheath in oil wells [28,29]. However, their application in the HPHT environment deserves further investigation due to a lack of understanding of their long-term effectiveness. As mentioned previously, nano-graphene seems to show some promising effects, at least in improving Young’s modulus stability at HPHT conditions. In this study, another reinforcement material (latex fiber) was added to further evaluate the effectiveness of reinforcement materials in mitigating the strength retrogression of oil well cement. The previously optimized cement slurries from our most recent study were further investigated along with two additional designs: one with nano-iron oxide removed and the other with latex fiber added. This resulted in a total of five silica-enriched oil well cement slurries, which were autoclaved at 200 °C under two different pressures. The low pressure (50 MPa) curing was conducted for 2, 60, 90, and 180 days; the high pressure (150 MPa) curing was conducted for 2 and 360 days. The microscopic properties of the cement were evaluated in much greater detail in this study, employing mercury intrusion porosimetry (MIP), thermogravimetry (TG), and scanning electron microscope (SEM) test methods. These new test results helped to reveal significant insights with regard to the influences of curing pressure and reinforcement materials on the long-term properties of oil well cement.

2. Materials and Methods

2.1. Raw Materials

Aksu Class G oil well cement was manufactured by Aksu cement factory, Xinjiang, China. Quantitative Rietveld refinement was utilized to determine the component compositions from the cement’s XRD profiles. The compound proportions of C3S, C2S, C3A, C4AF, gypsum, and hemihydrate were 63.19%, 15.03%, 3.70%, 12.91%, 2.05% and 0.82%, respectively. In addition, 6 μm silica was provided by Tongbai factory, Henan, China. Zhengzhou Huarun raw materials Co., LTD provided the alumina (α-Al2O3). Chengdu Organic Chemicals Co., LTD offered Nano-Graphene (with a density of 2.24 g/cm3). The latex fiber was an anti-gas channeling agent (Flok-2) provided by OMAX Oilfield Technology Co., LTD. It was obtained from Tianjin PetroChina Boxing Technology Co, LTD. that chemical admixtures such as high temperature suspension agent (BDJ-300S), fluid loss agent (BXF-200L), defoaming agent (G603), retarder (BCR-300L) and dispersion (BCD-210L) were obtained. BCD-210L, BXF-200L, and BCR-300L were synthetic AMPS polymer water suspensions having a 20% activity. More detailed test results of the raw materials can be found in our previous study [16].

2.2. HPHT Cured Samples Formulation Design and Preparation

The influence of reinforcement admixtures and pressure on the strength retrogression of silica-enriched cement systems under 200 °C was investigated using five slurries. The formulation design is shown in Table 1. To decrease long-term strength retrogression, 70 percent silica (by weight of cement, BWOC), various doses of -alumina, and nano-iron oxide were added. Slurry T3 is the control design. Compared with Slurry T3, slurry T1 has lower α-Al2O3 (5%); slurry T2 does not contain Nano-Fe2O3; slurry T4 has 6% latex fiber as reinforcement admixture; slurry T5 has 0.4% nano graphene as reinforcement admixture. The durations of samples cured under 50 MPa were 2, 60, 90, and 180 d. The durations of samples cured under 150 MPa were 2 and 360 d. Such high pressure and long curing time are beyond any previously published studies to the best of our knowledge. The different curing durations employed at different curing pressures were due to specific project requirements. After high-pressure curing, quick depressurization may lead to specimen damage and decreased mechanical properties [30]. Thus, the manual depressurization took about 100 h, including two stages: (1) keep the temperature at 200 °C and decrease the pressure to 50 MPa at 1.5 MPa/h by fully automatic syringe pumps; (2) reduce the temperature and pressure of the autoclave to room condition by natural cooling. The density of all of the formulations was set at 1.9 g/cm3. Our latest papers describe the curing process in more detail [14,17].

2.3. Test Methods

The details of the test method, such as mechanical property test, water and gas permeability test, MIP test, SEM test, and TG test, can be found in the previous studies [14,15,16,17]. The “ink-bottle” effect was reduced in the MIP tests described in this paper by using tiny pieces of dried material (approximately 1 mm in thickness). Some samples were evaluated using a Quantachrome mercury intrusion pore size analyzer Model PM 60 with a macro bore cell (18 mL) and a maximum pressure of 413 MPa, while others were examined using a Model PM 33 with a small bore cell (3 mL) and a maximum pressure of 228 MPa. In Section 4.1, the effects of sample size and quantity on MIP test findings will be examined.

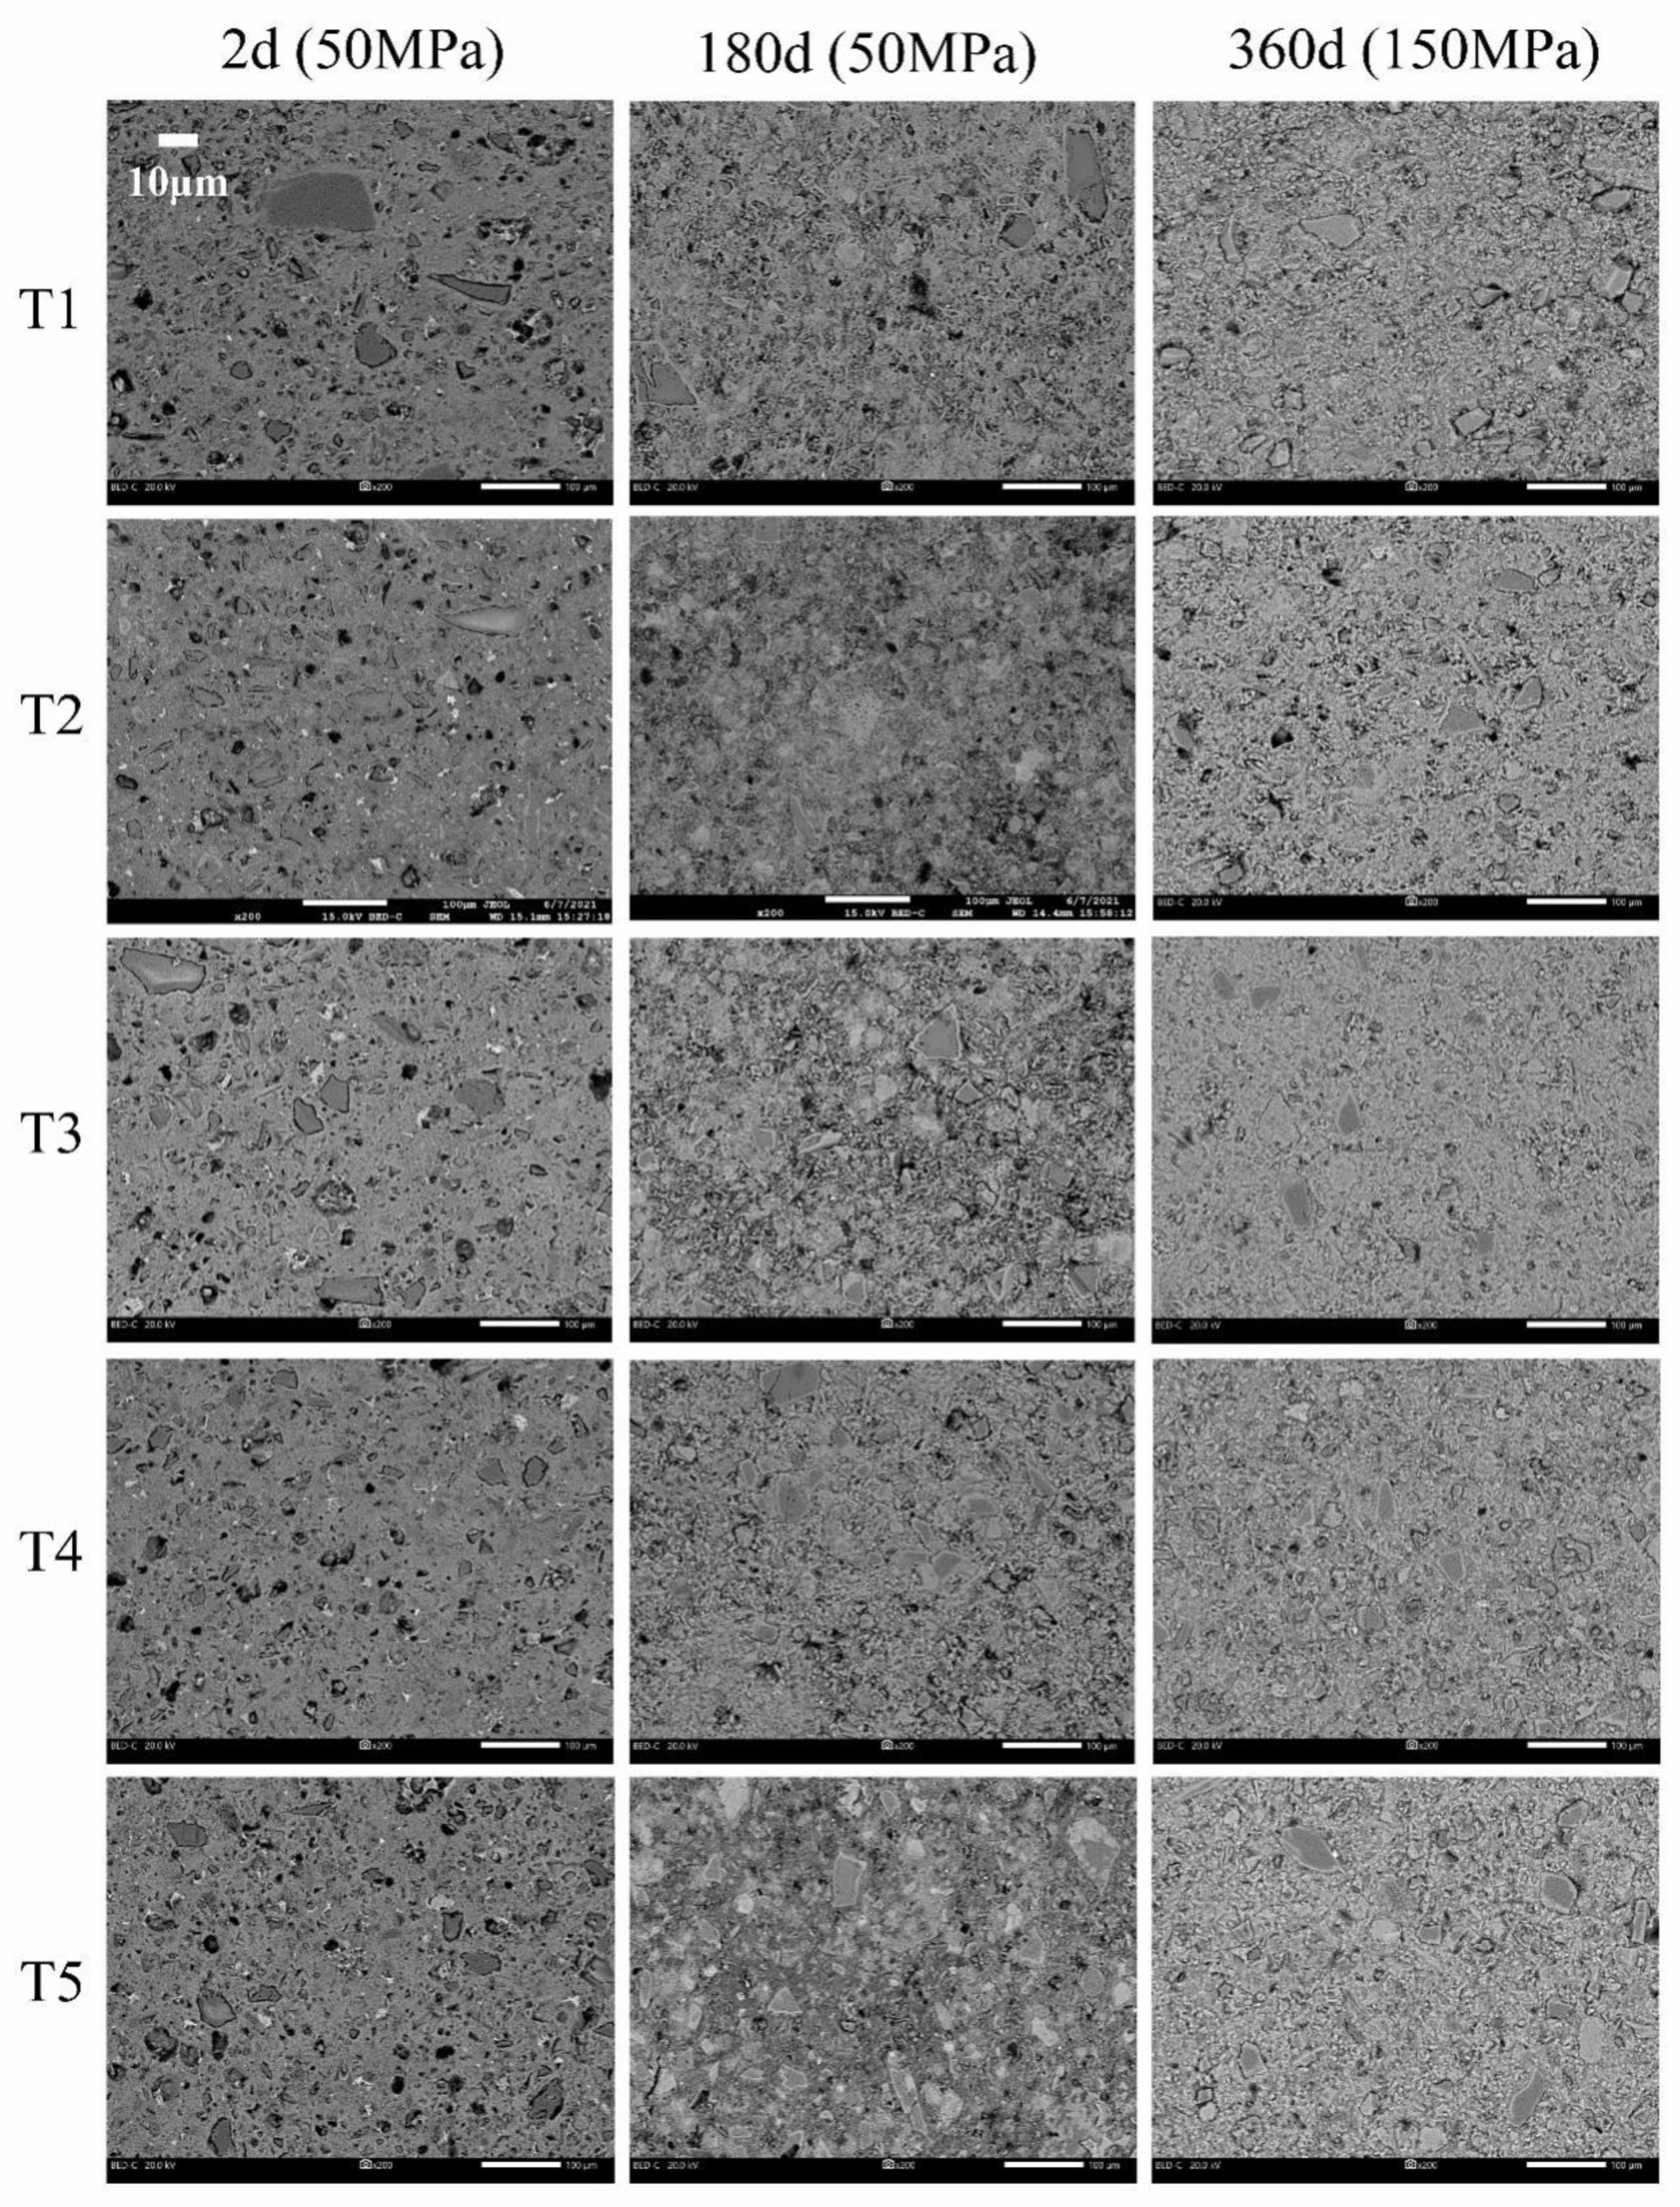
3. Macroscopic and Microscopic Analyses of Samples Cured under 50 and 150 MPa

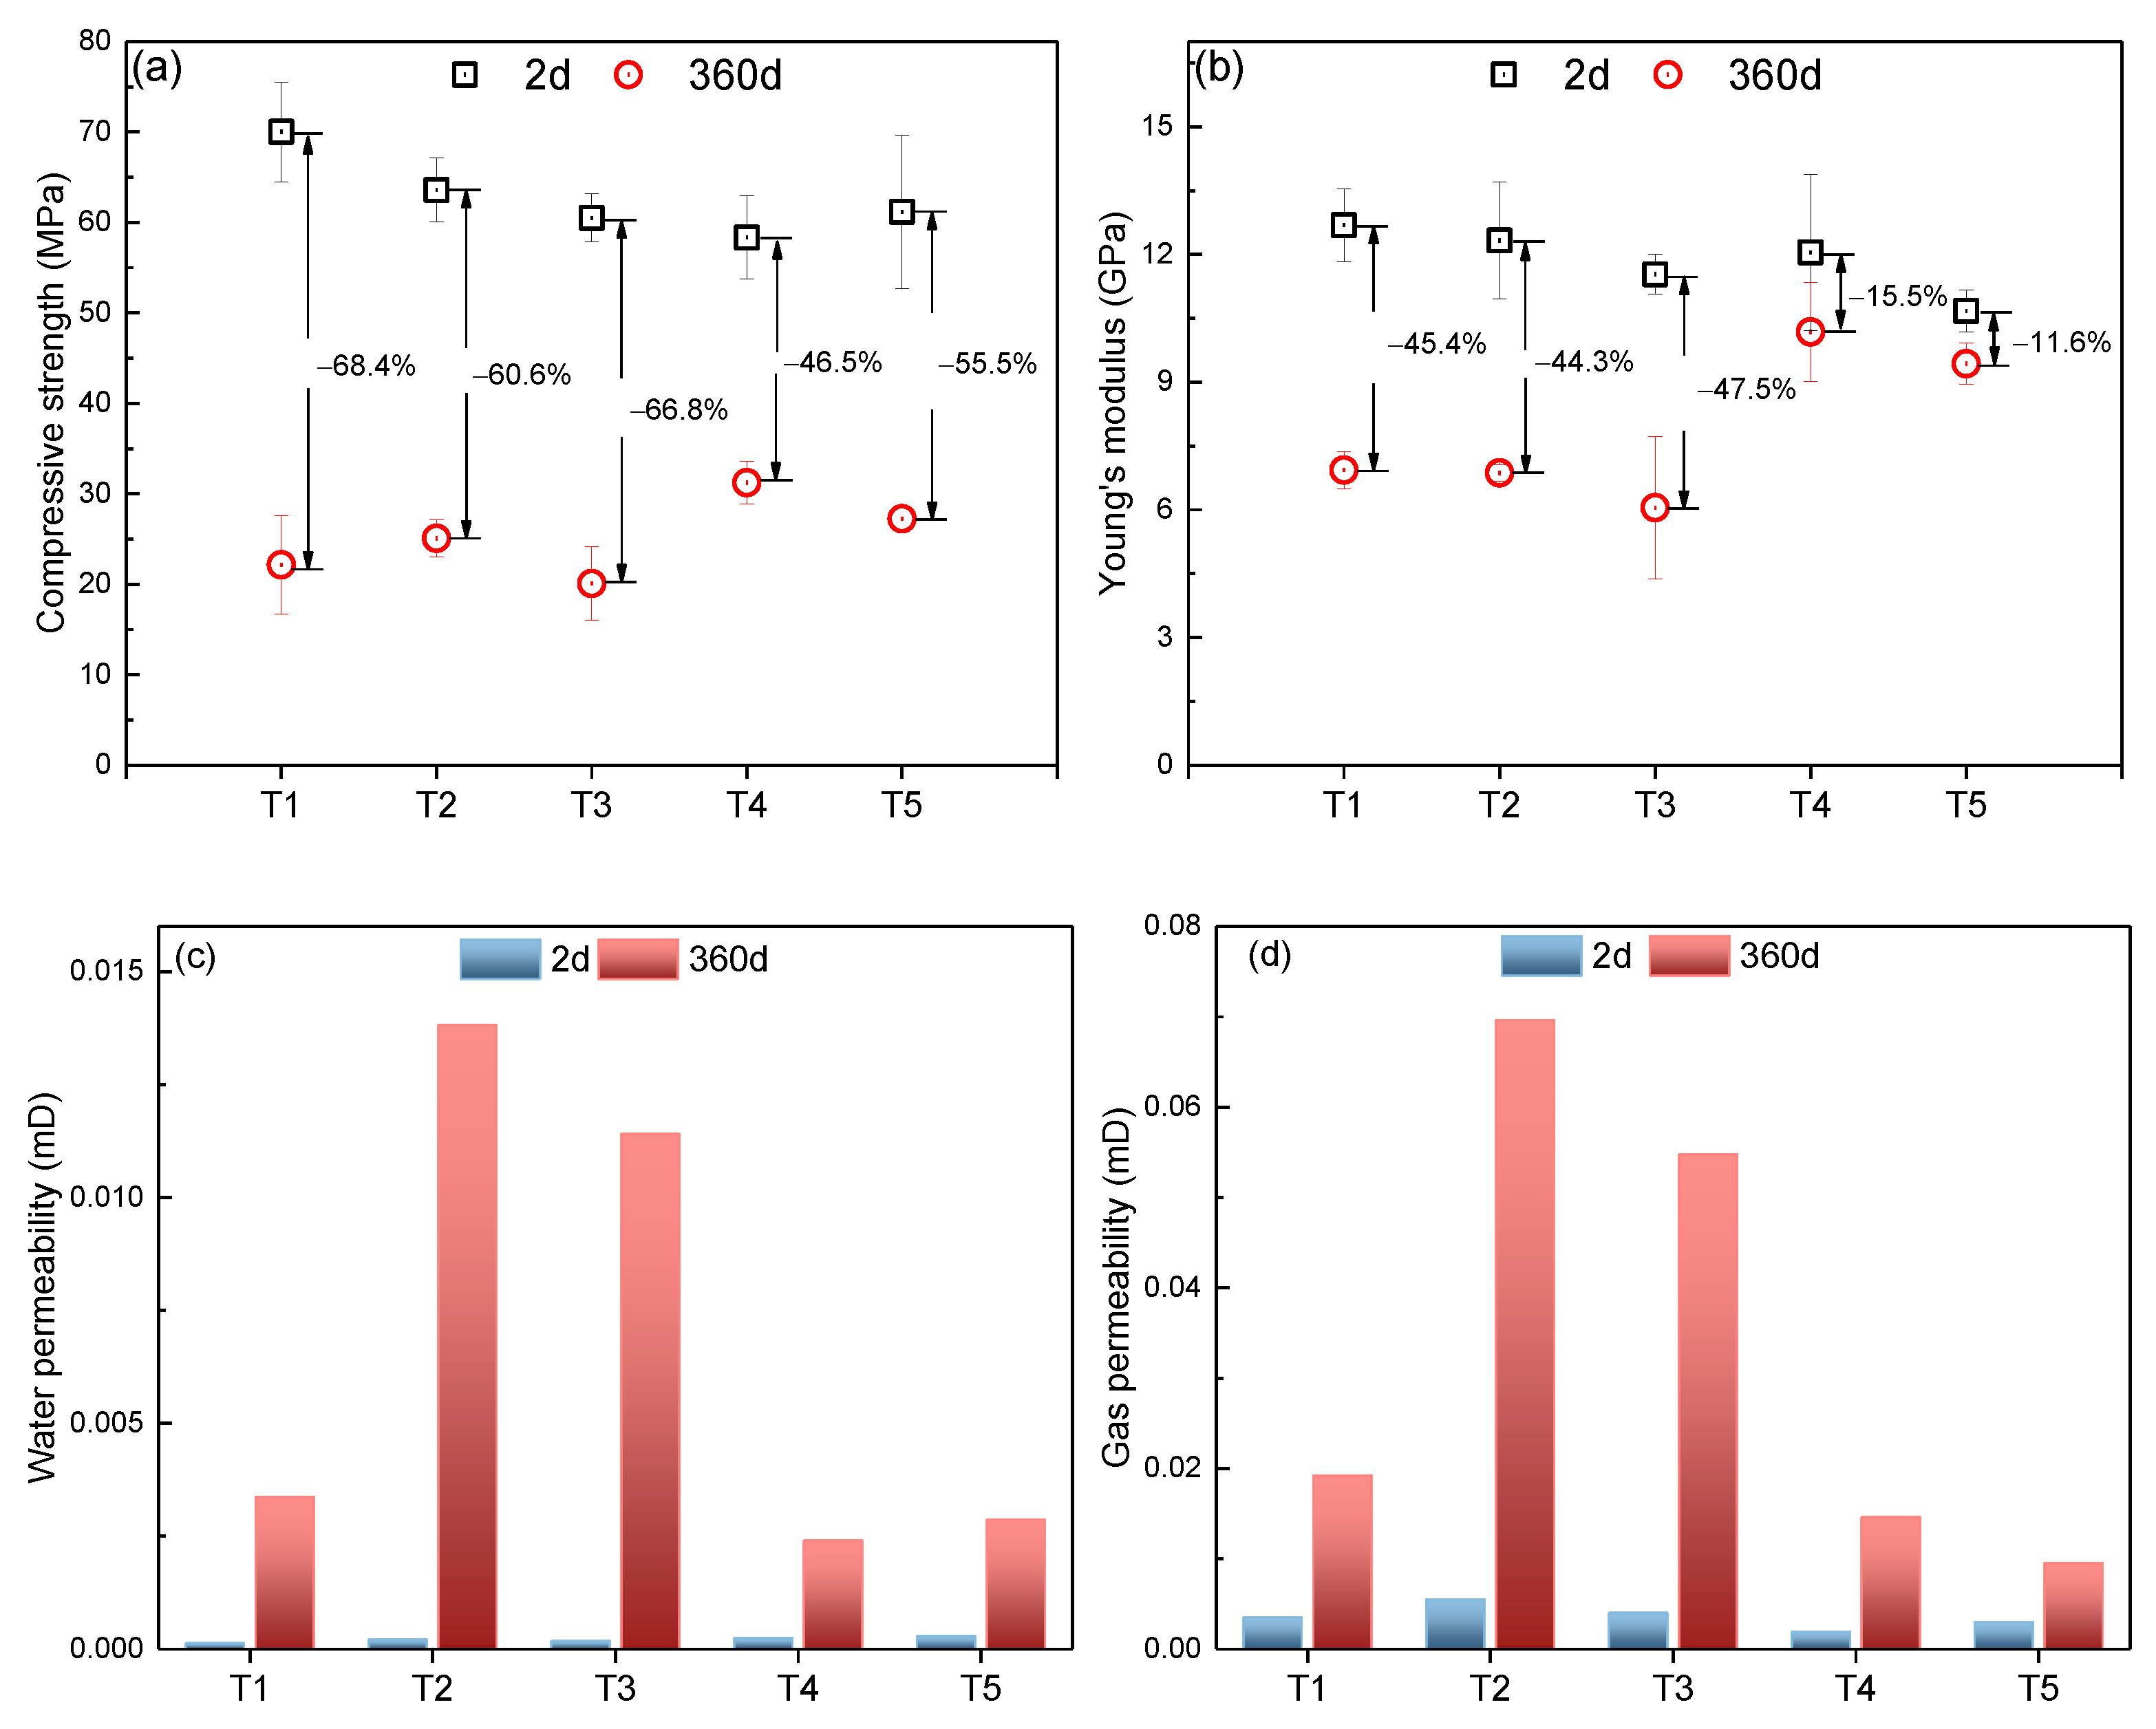
3.1. Test Results of Samples Cured under 50 MPa

Long-term property changes of slurries T1 to T5 cured under 200 °C and 50 MPa are shown in Figure 2. The 180 d reductions (compared to the 2 d test results) of all five slurries are highlighted in Figure 2a,b. The compressive strength, Young’s modulus and water permeability of slurries T1, T3 and T5 have been shown in our previous study [16]. However, their comparison with the new formula (slurry T2 and T4) was still valuable to find a better reinforcement material. These test results showed a slight dependence on slurry composition but a strong dependence on curing time. All slurries exhibited a similar decline in physical and mechanical properties over the long term, which was consistent with our previous study [14]. Clearly, the changing dosages of α-alumina and nano-iron oxide between slurries T1, T2 and T3 had almost no influence on test results, suggesting that they had little to no effect on the long-term stability of the set cement. The 180 d reductions in compressive strength of slurries T1, T2 and T3 were 75%, 75% and 72%, respectively, which were slightly higher than the slurries containing reinforcement materials (decline rates of slurries T4 and T5 were 66% and 64%, respectively). Overall, the 180 d reductions in Young’s modulus (ranging from 14.6% to 50.1%) were smaller than the compressive strength. The experimental errors in Young’s modulus are naturally larger than those in compressive strength. After curing for 180 d, the Young’s moduli of slurries with reinforcement materials, especially slurry T5, were apparently higher than those without reinforcement materials. Water permeability showed almost no change from 60 to 90 d curing and then a sharp increase from 90 to 180 d, suggesting that the deterioration of cement macroscopic properties did not occur at a constant rate. For most slurries, gas permeability and water permeability showed a similar trend with increasing curing time. The water permeability was about two orders of magnitude lower than gas permeability at 2 d and about one order of magnitude lower than gas permeability at 180 d. This phenomenon is consistent with our previous observations and may be caused by the swelling of C-S-H gel in the presence of water, which results in a more compact structure at a water-saturated state [31].
All slurries exhibited similar changes in macroscopic properties when the same dosage of silica flour (70% BWOC) was added. A representative slurry T4 was selected for stress–strain response, XRD, MIP, and TG analysis (Figure 3), which might also explain changes in long-term mechanical characteristics not addressed in the prior work [16]. Here the MIP tests were performed with Instrument Model PM 60. The 180 d sample’s failure strain was much lower than early-age samples, demonstrating that the set cement’s capacity to absorb energy before failure (toughness) was greatly decreased due to strength retrogression. The main change in the XRD results of slurry T4 was the increased tobermorite peak at 7.8° from 2 to 60 d. No significant changes in mineral composition results were observed after 60-day curing, and tobermorite content remained stable from 60 to 180 days. However, an unidentified new peak was observed at about 28.3° in the 180 d sample, which may be associated with the structural change of the C-S-H gel (C-S-H has an amorphous peak at 28° to 30°). In TG results, the total weight loss of the set cement decreased with increasing curing time, indicating that long-term HPHT curing may reduce the bound water content in the sample. Based on the DTG curves, the weight loss rate clearly decreased with increasing curing time in the temperature range from 200 to 650 °C, which may be associated with reduced C-S-H content or a change in its structure leading to less bound water; meanwhile, the weight loss rate clearly increased with increasing curing time in the temperature range from 650 to 950 °C, which was possibly caused by increasing crystalline phase content in the set cement. In the MIP results, the median pore throat size significantly increased from 2 to 180 d; a platform stage was observed during the period from 60 to 90 d, where the pore size of slurry T4 was nearly unchanged. Consistent with permeability test findings, these results suggest that microstructure coarsening was not a constant rate process.

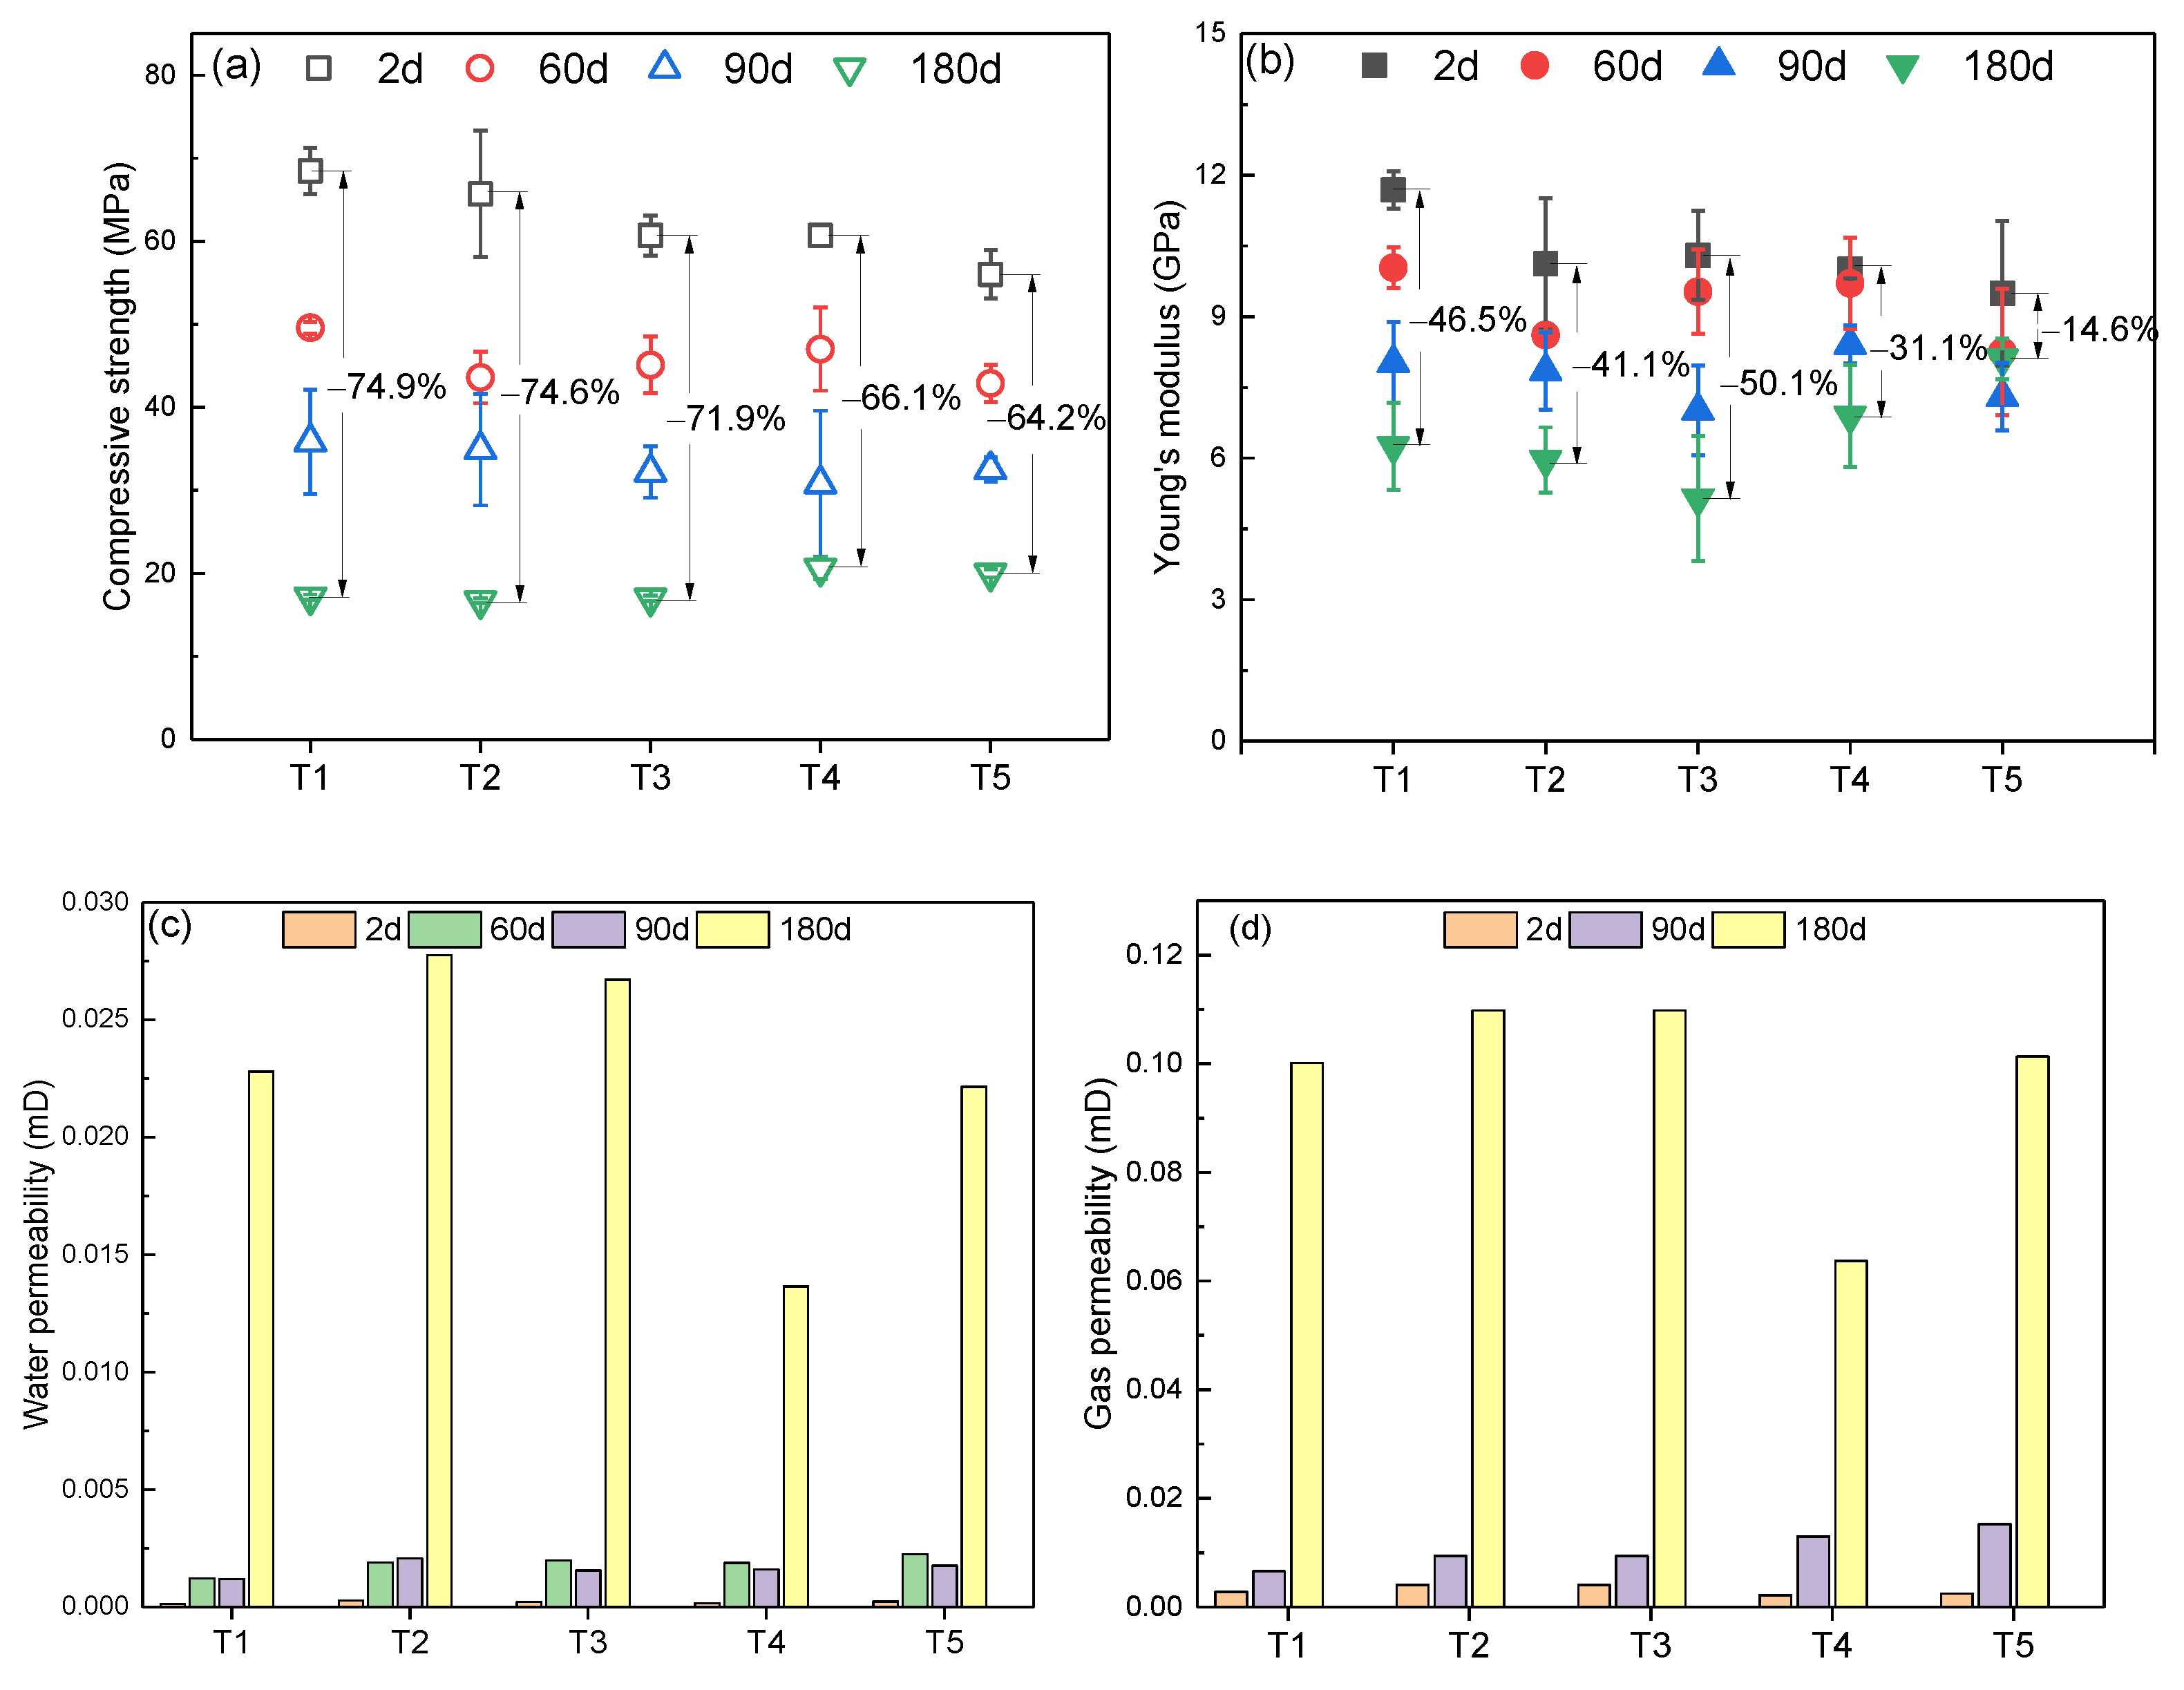
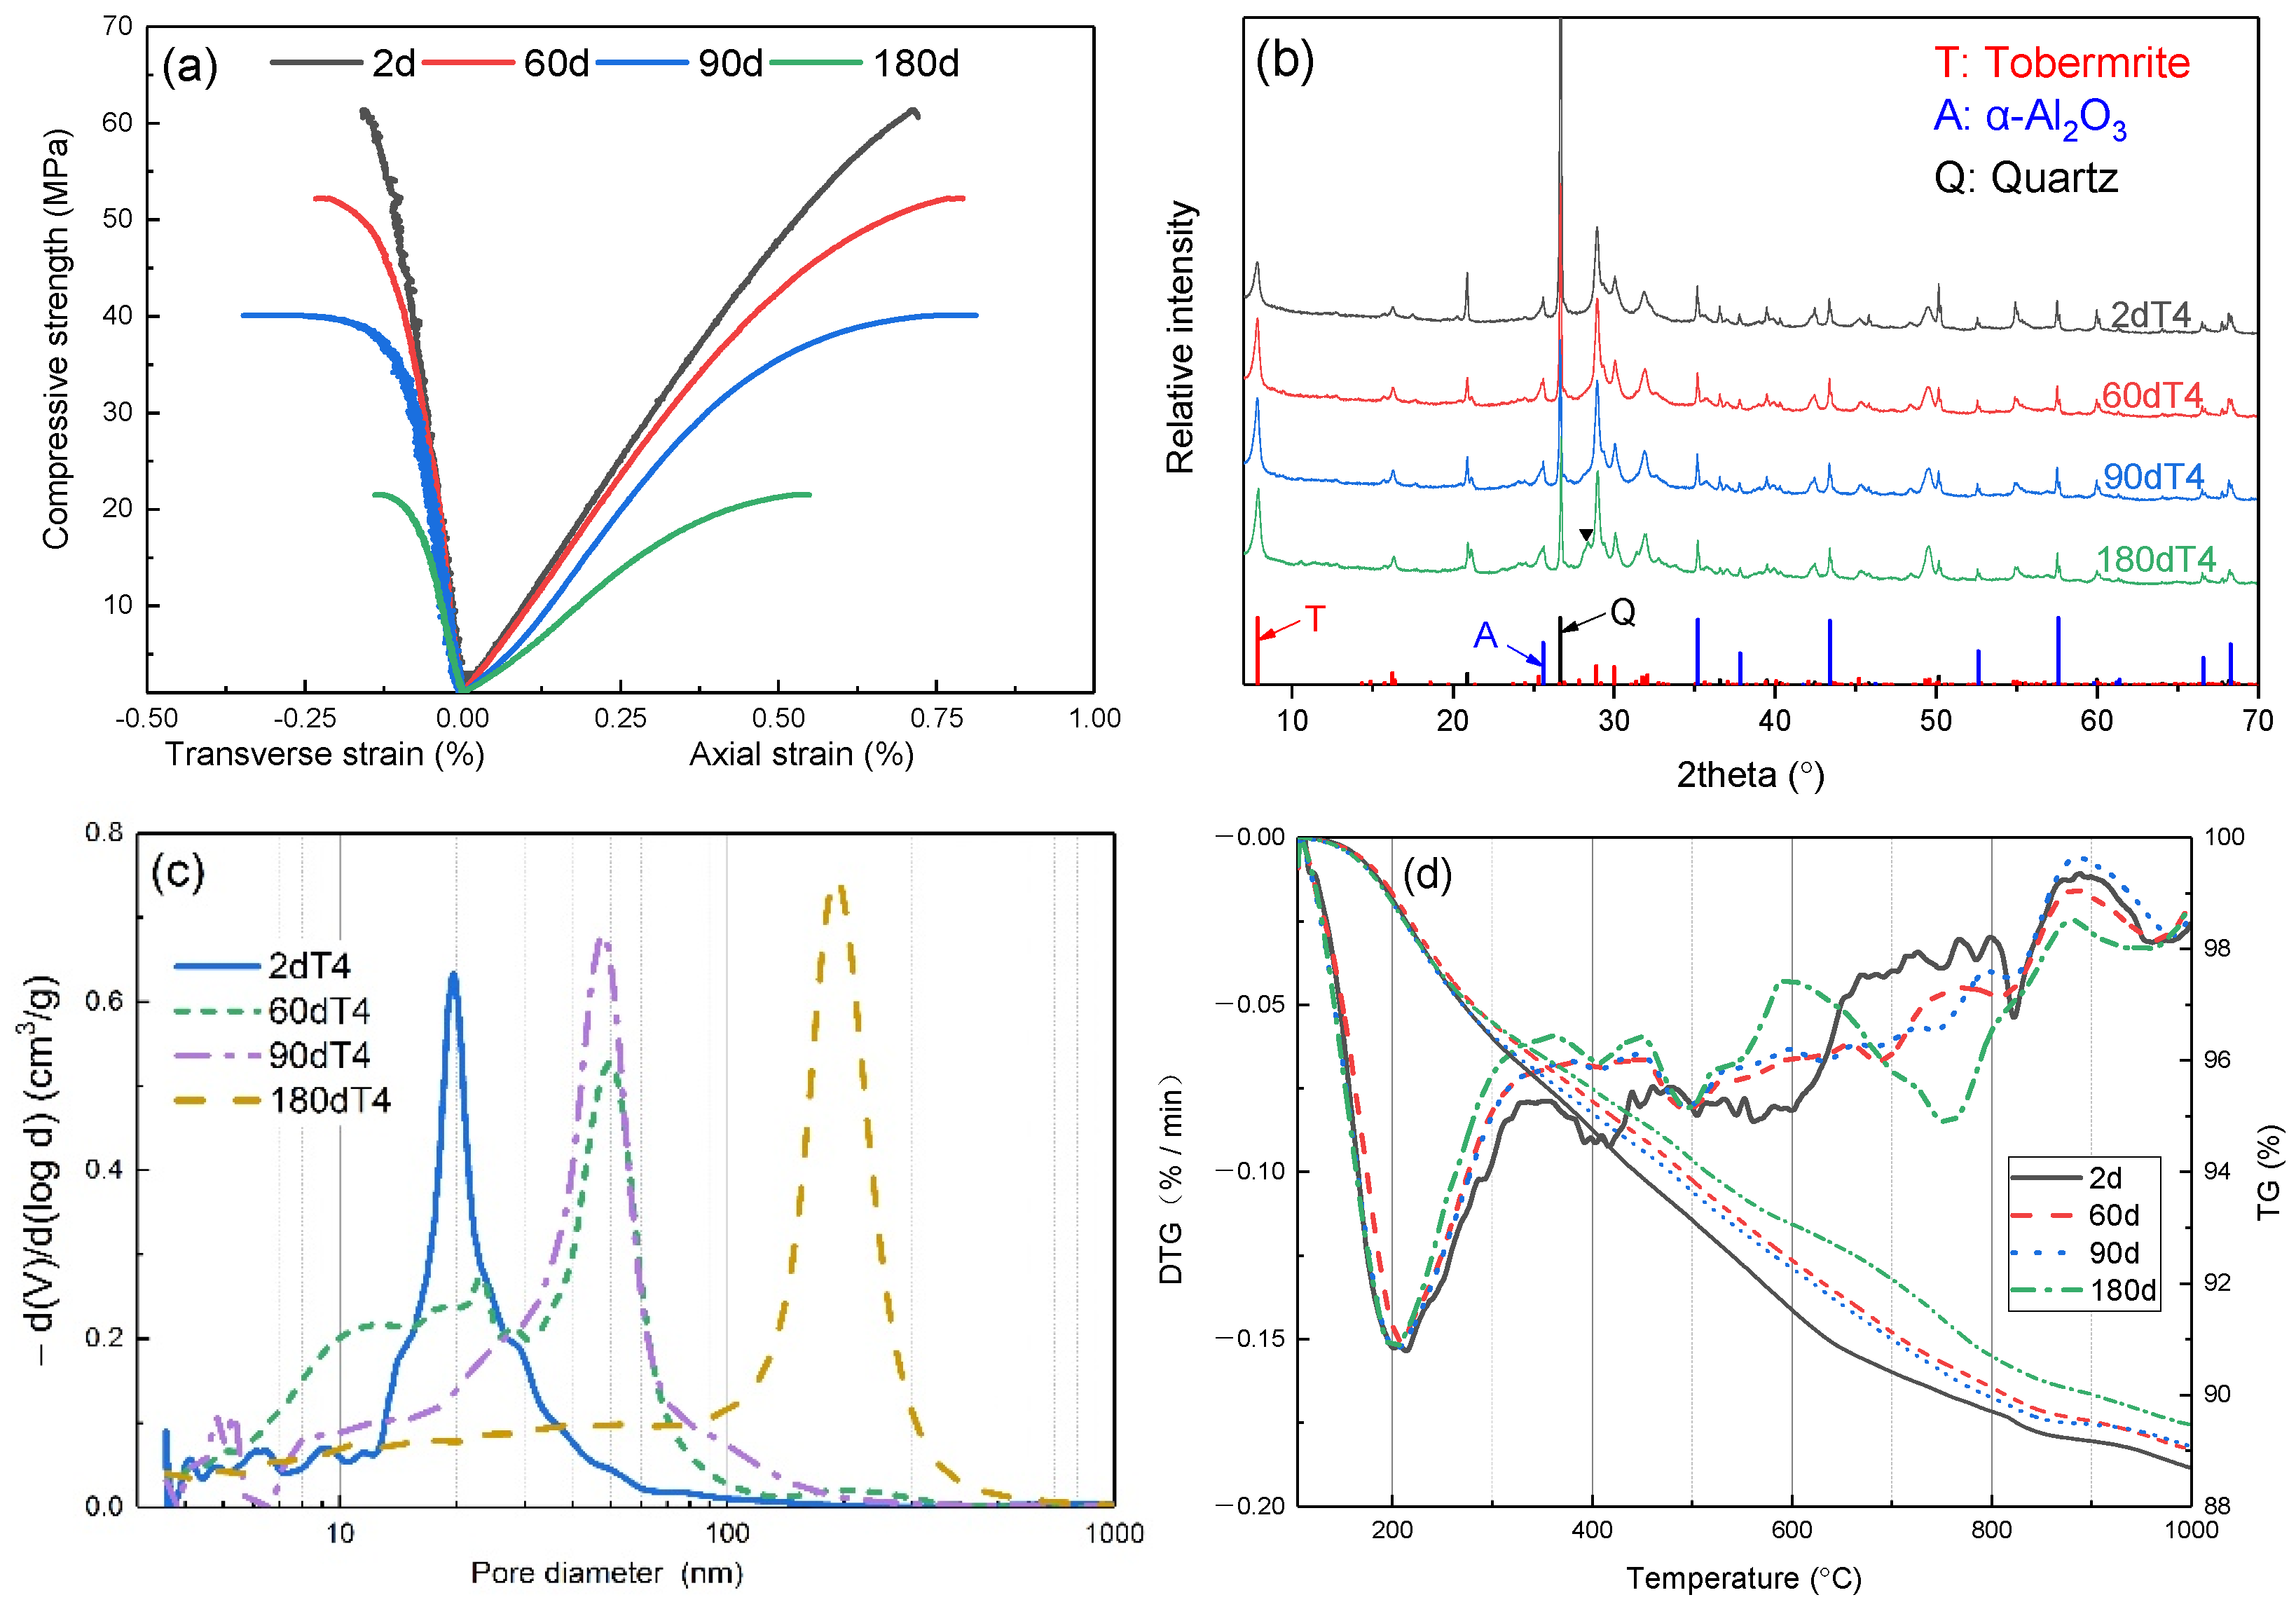
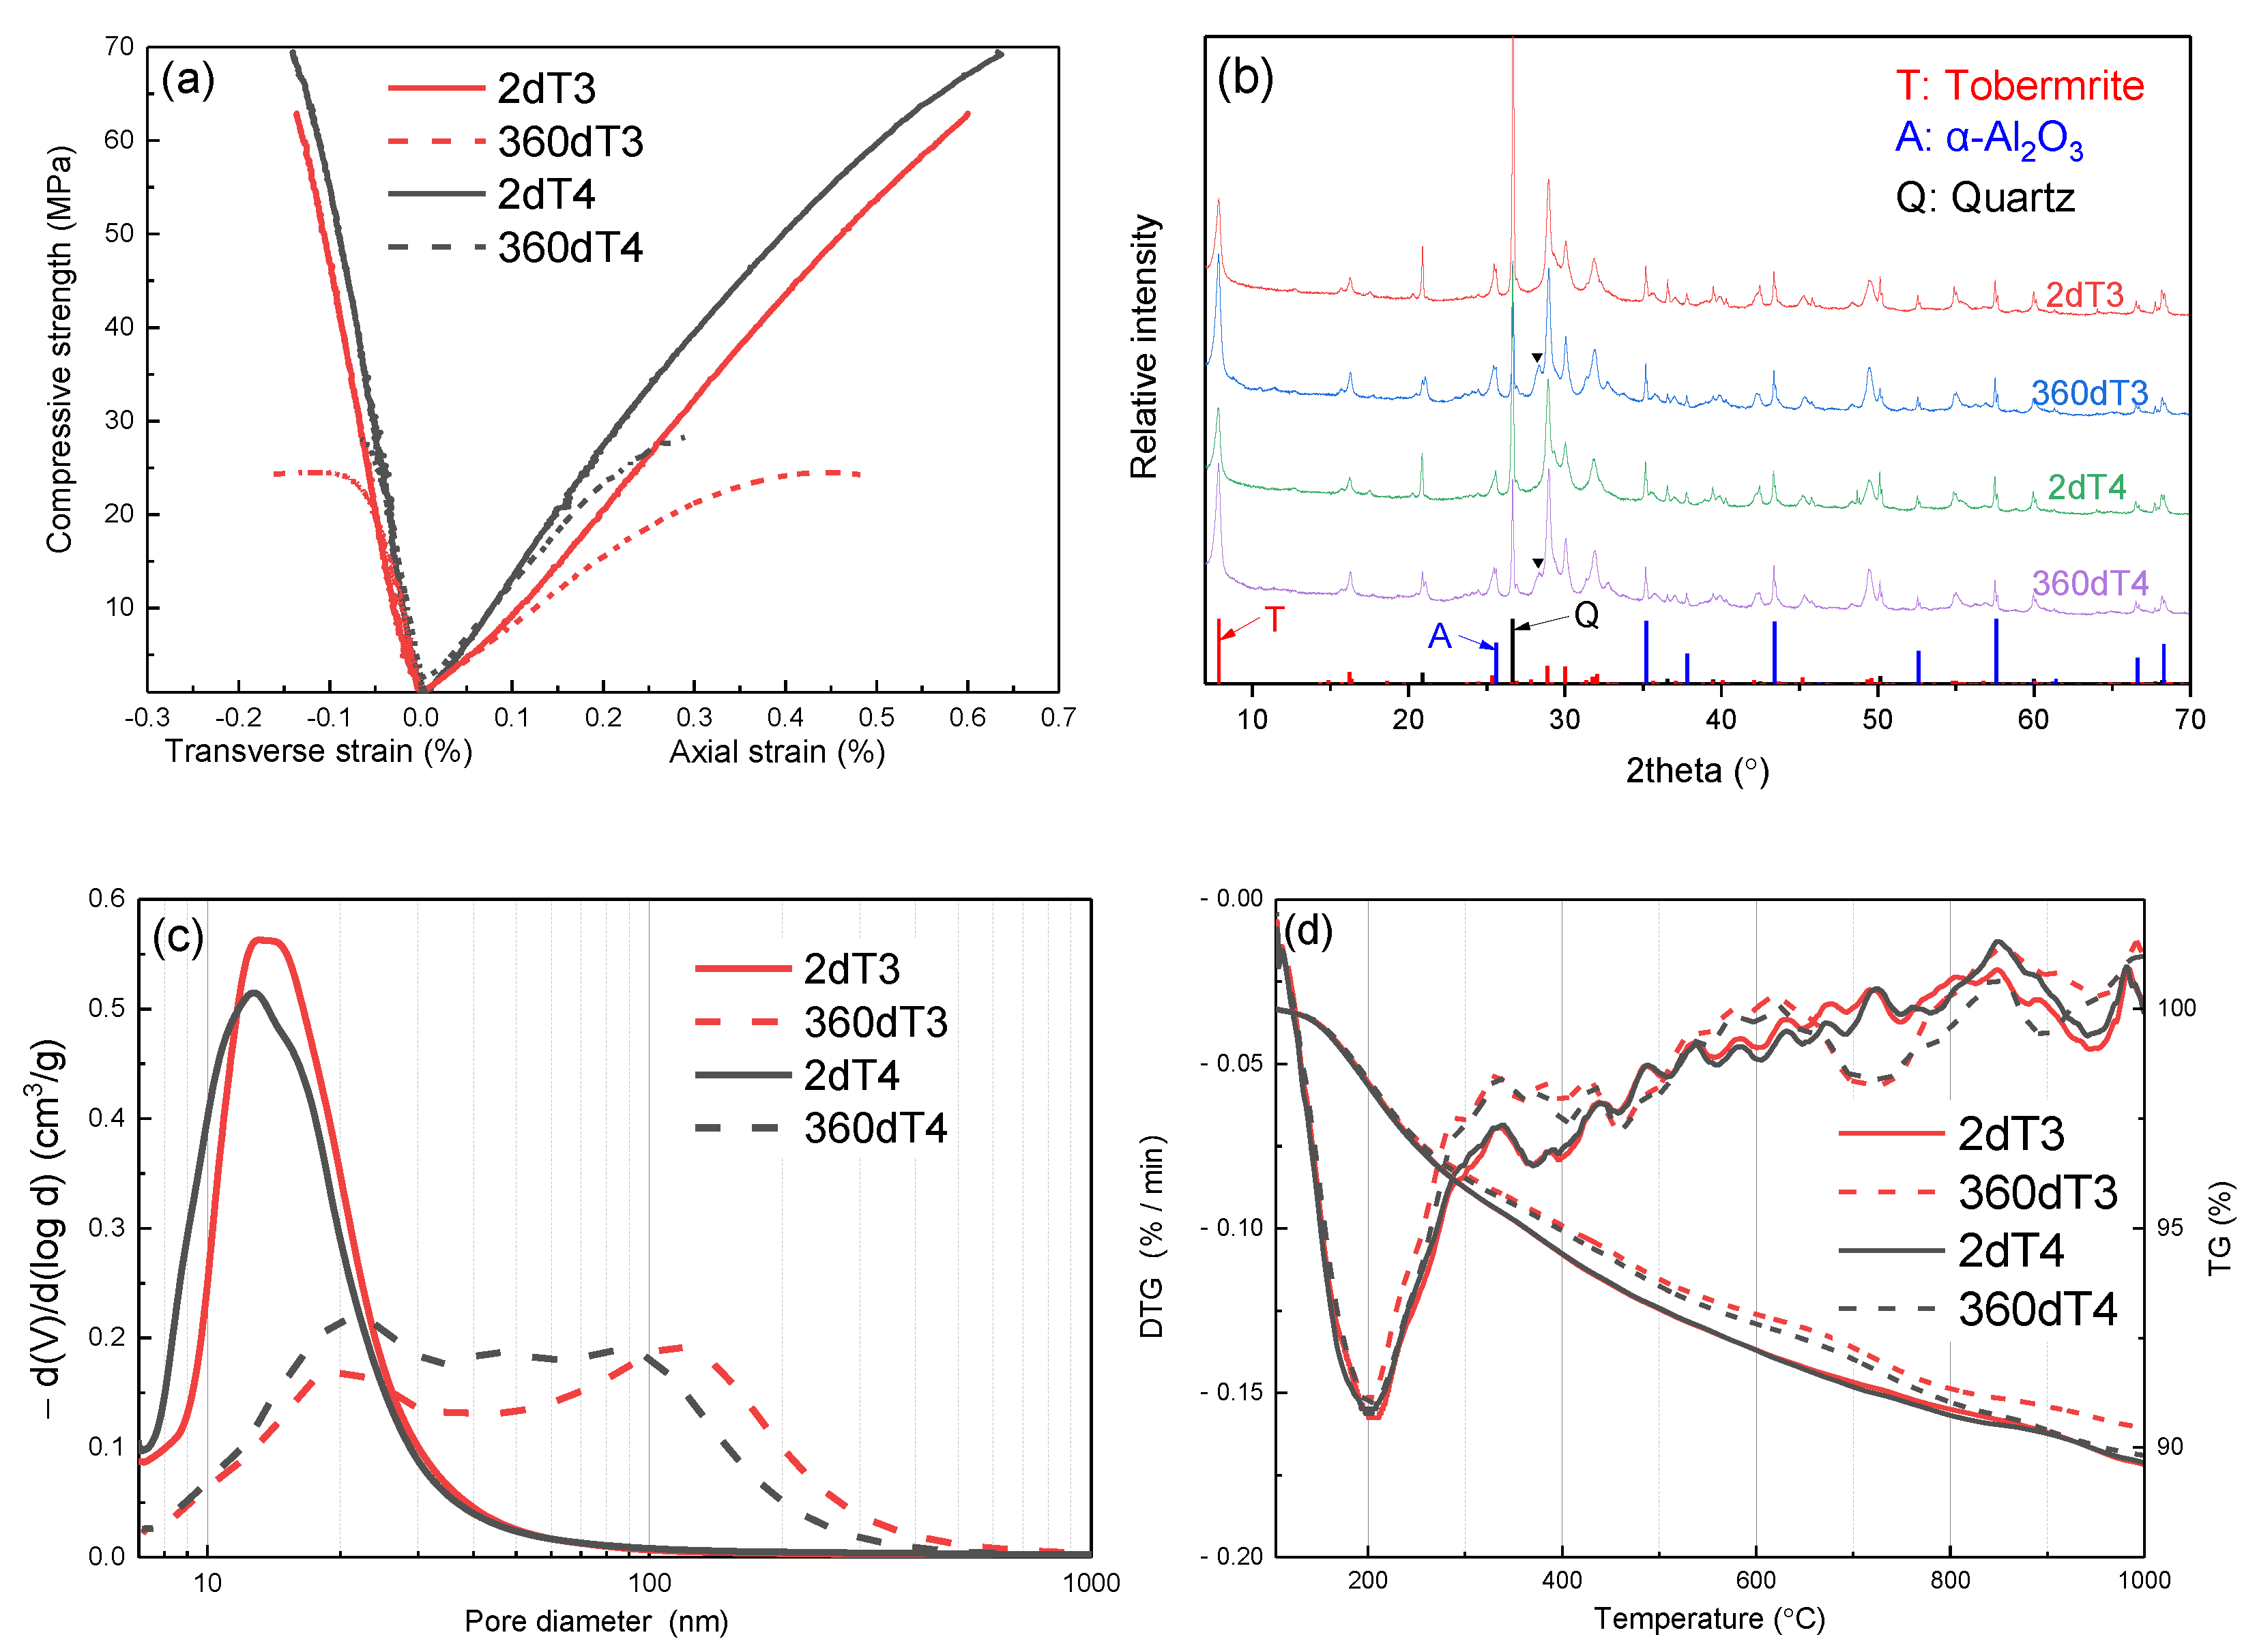
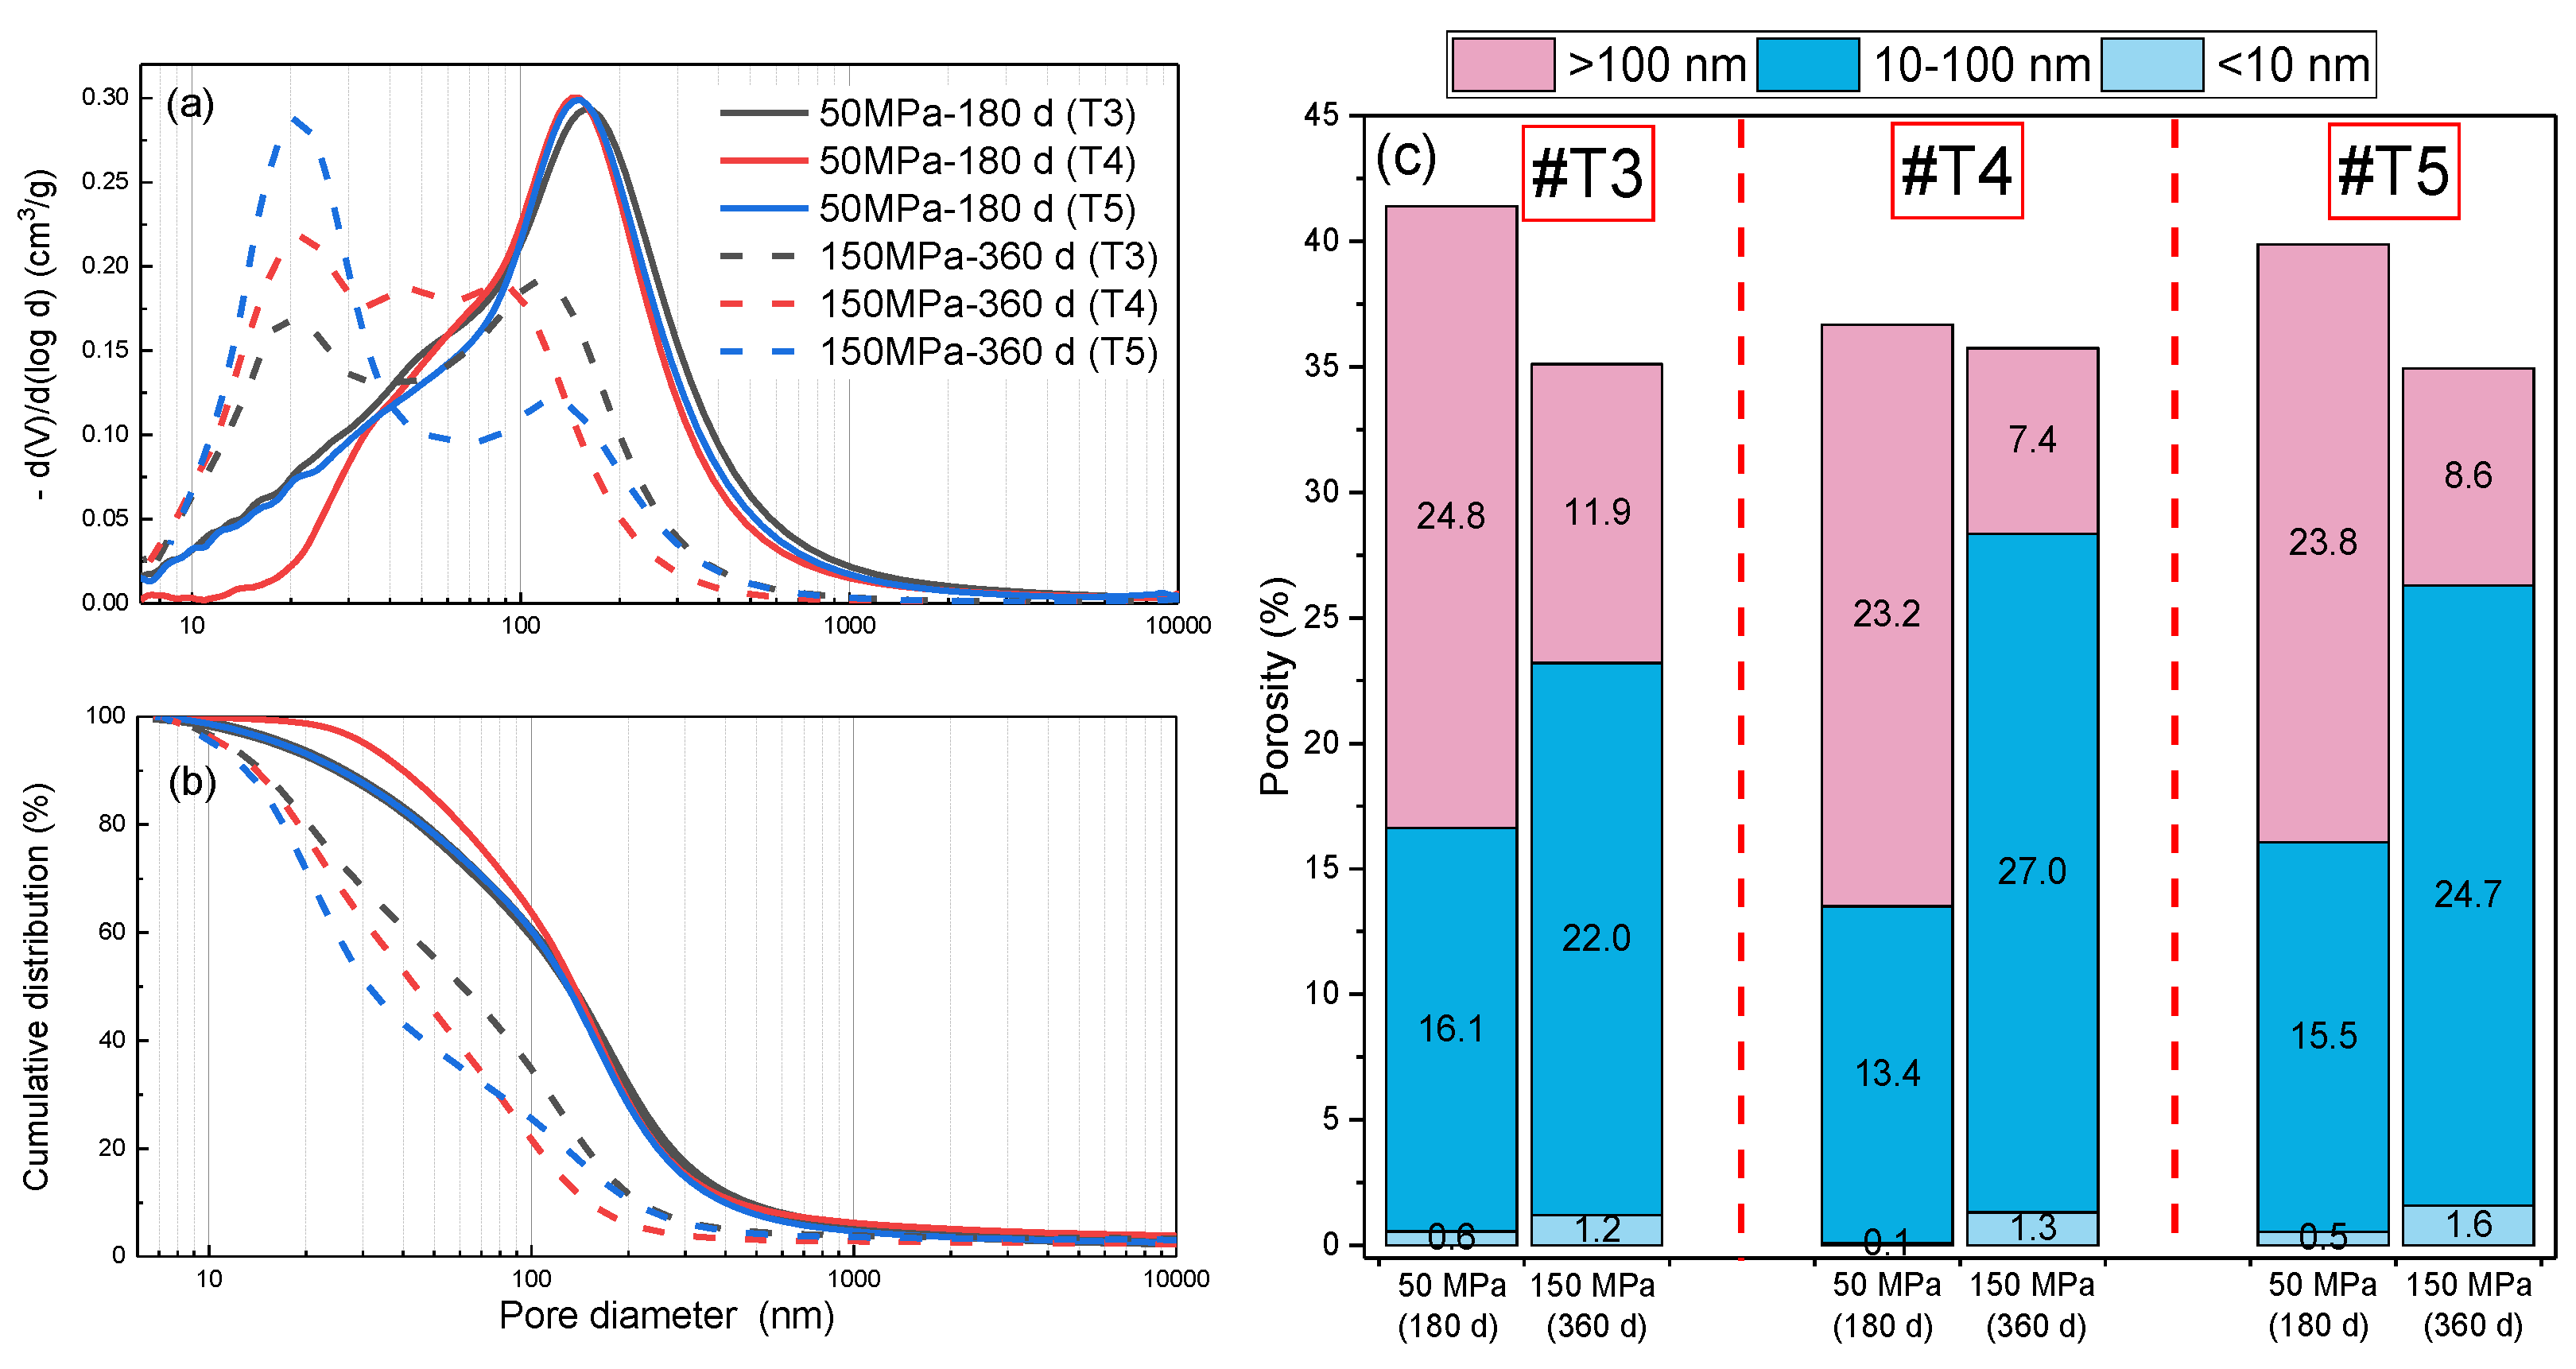
3.2. Test Results of Samples Cured under 150 MPa

The mechanical properties of slurries T1 to T5 cured at 200 °C and 150 MPa are shown in Figure 4a,b. Different from the previous results cured under 50 MPa [16], the decline rates of mechanical properties of all slurries cured at 150 MPa for 360 d were lower than those cured at 50 MPa for 180 d, despite the much longer curing time. The reductions in compressive strength of slurries T1-T5 from 2 to 360 d were 68%, 61%, 67%, 47% and 56%, respectively. Similar to the 50 MPa test results, the reductions in Young’s modulus were smaller than the compressive strength. In particular, the Young’s moduli of slurries with reinforcement materials were only reduced by 15.5% and 11.6%, for slurry T4 and T5, respectively. As shown in Figure 4c,d, both the water and gas permeability of the set cement increased by about an order of magnitude from 2 to 360 d curing. The ability of reinforcement materials to reduce the permeability increase in set cement seemed to be boosted by ultra-high curing pressure; the long-term water and gas permeability of slurries T4 and T5 under 150 MPa were about 70% lower than that of the control slurry T3.
Figure 5a shows representative stress–strain curves of slurry T3 and T4 during long-term curing. Similar to the 50 MPa test results, reductions in failure strain (strain at maximum stress) were also observed at 150 MPa curing pressure from 2 to 360 d: the average reduction of axial strain was about 0.25%, while the average reduction of transverse strain was about 0.05%. In XRD results, one of the main changes of slurries T3 and T4 was the increased tobermorite peak at 7.8° with the increasing curing time, which probably happened at an early curing age, similar to that observed at 50 MPa. The unidentified new peak at about 28.3° observed in the 180 d samples cured at 50 MPa was also observed in the 360 d samples cured at 150 MPa, indicating a possibly similar change in C-S-H structure. The decrease in bound water content (as measured by total weight loss based on the TG results) with increasing curing time was less significant compared with the 50 MPa test results. In particular, the total bound water content of slurry T4 was almost constant from 2 to 360 d. However, DTG curves indicated a similar trend of change as the 50 MPa test results, i.e., the 360 d samples had a smaller weight loss rate in the lower temperature range of 200–650 °C and a larger weight loss in the higher temperature range of 650–850 °C. As shown by the MIP test results (performed by Instrument Model PM 33), the median pore size increased about an order of magnitude from 2 to 360 d. The pore size distribution frequency curves of 360 d samples showed two partially overlapping peaks at approximately 20 and 100 nm, indicating that the samples still contain significant amounts of small pores after curing under 150 MPa for 360 d. The total porosity of samples cured under 150 MPa increased slightly from 2 to 360 d: the total porosity of slurry T3 increased from 34.1% to 35.1% while that of slurry T4 increased from 34.5% to 35.7%. Therefore, both pore size and porosity increased with increasing curing time.

4. Influences of Various Experimental Factors on Test Results

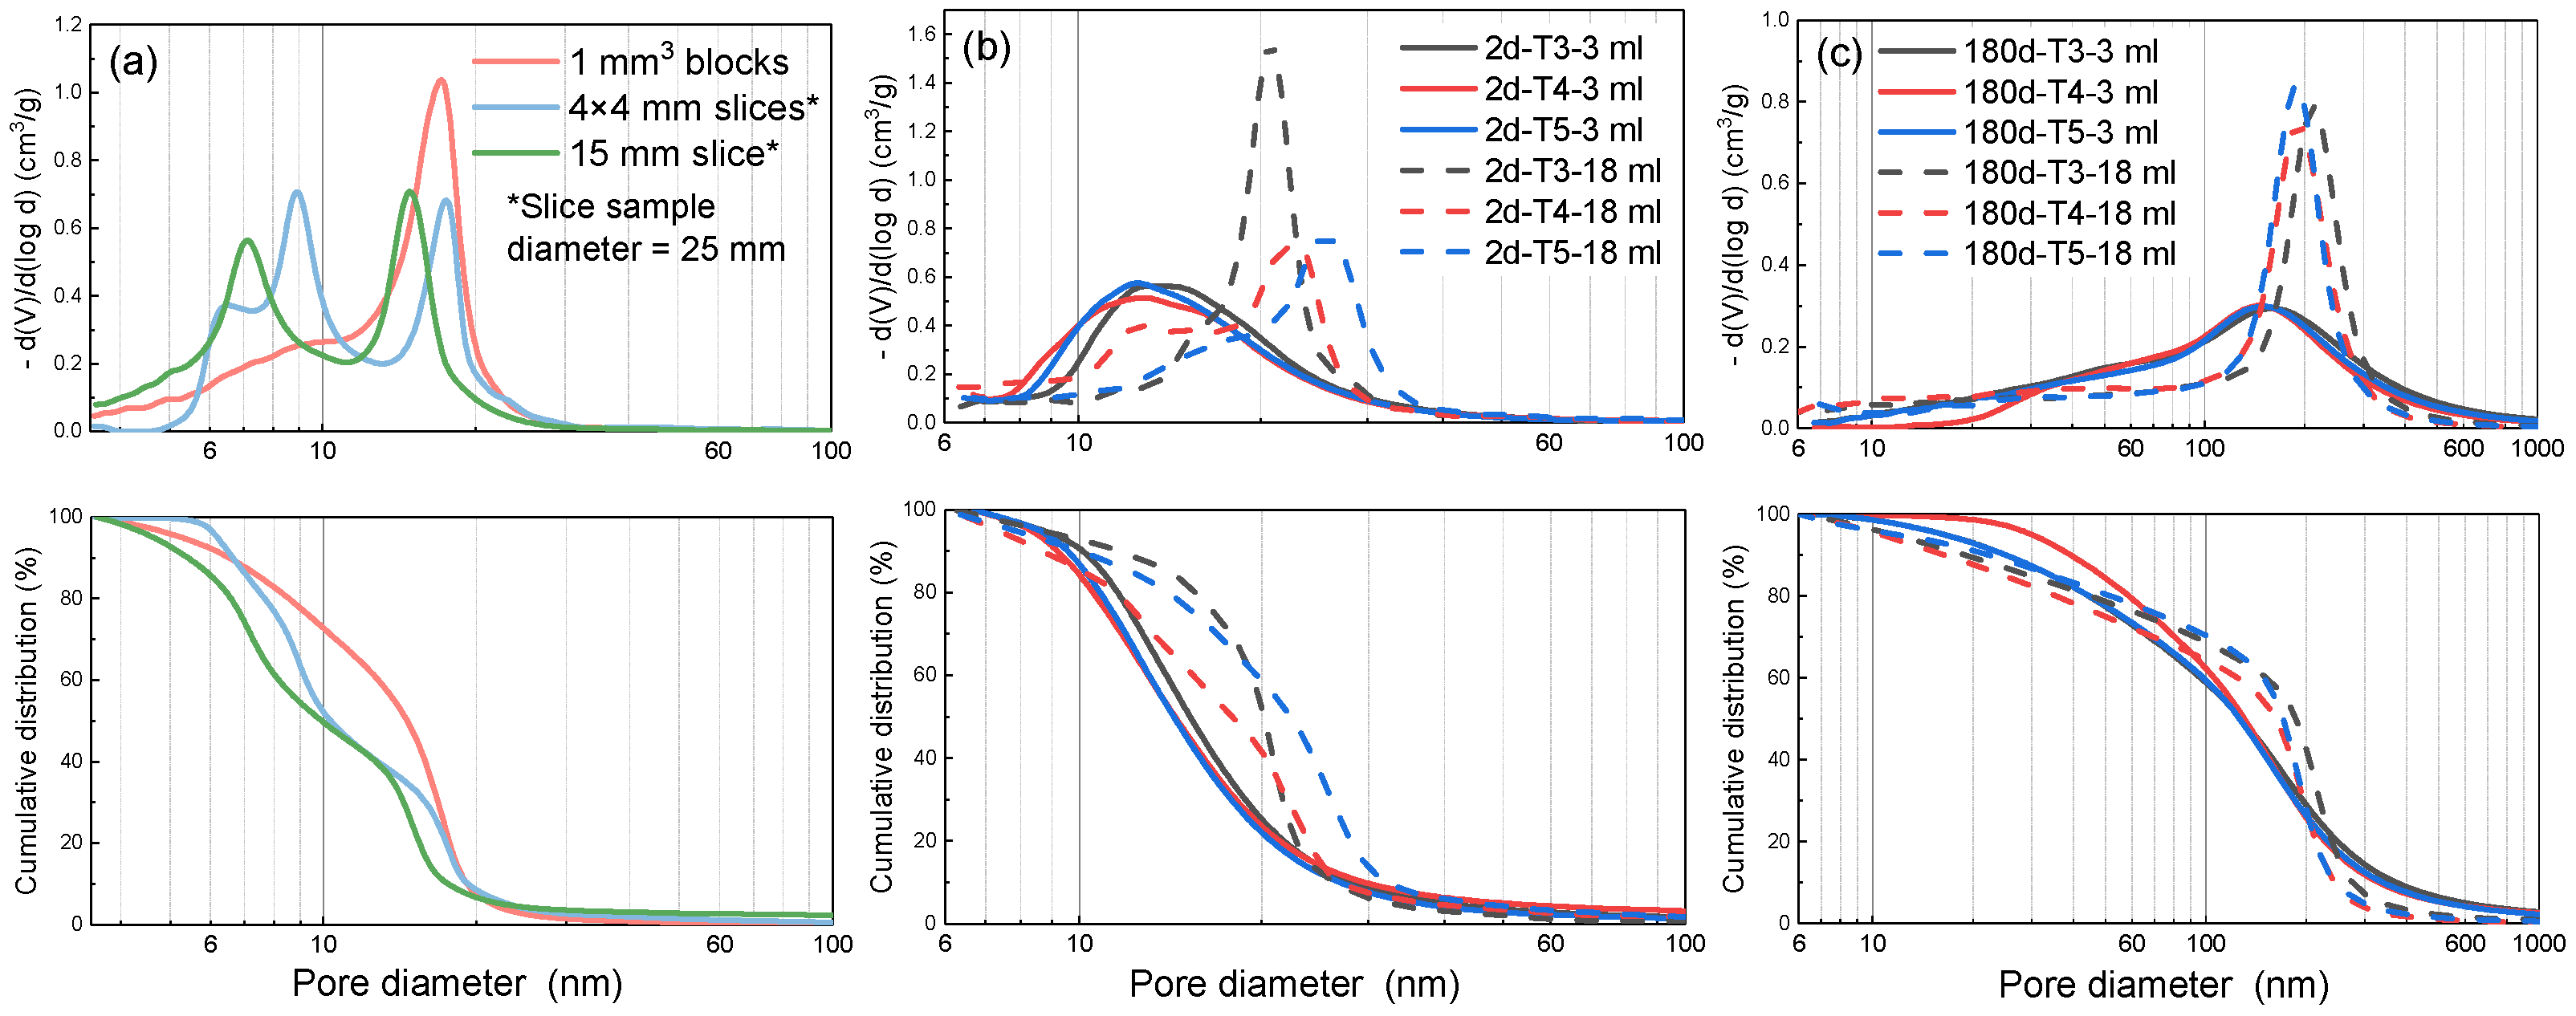
4.1. Influences of Specimen Size and Quantity on MIP Results

In a previous study, the influence of specimen thickness on the MIP test results was preliminarily discussed using Instrument Model PM 60 [14], which is further analyzed here. As shown in Figure 6a, the test results with much smaller specimens (1 mm3 blocks) were added to compare with the results of relatively large slices. A larger sample tends to underestimate the pore size due to the well-known “ink-bottle” effect (a portion of the large pores can only be accessed by passing through much smaller pore throats and hence will be statistically treated as much smaller pores). With decreasing specimen size, the measured amount of small pores (below 10 nm) was significantly decreased, while the measured amount of pores in the range between 10 and 20 nm was significantly increased. For the same specimen size (1 mm3 blocks), Figure 6b,c show the influence of specimen quantity on test results. Since the tests were also conducted with different instruments with different pressure capacities, test results from the same pressure range (0–228 MPa) were considered here to allow for fair comparison. Compared with the results obtained by the macro-bore cell (volume ~18 mL) and Instrument Model PM 60, the results obtained by the small cell (volume 3 mL) and Instrument Model PM 33 showed a broad but lower peak in distribution curves and smaller median pore sizes at curing ages of both 2 and 180 d. Compared with the influence of curing time, which can cause the pore size to increase by several orders of magnitude, the influences of specimen size and quantity on MIP test results were relatively small. Nevertheless, the same testing strategy should be adopted when comparing the results of the same test series.

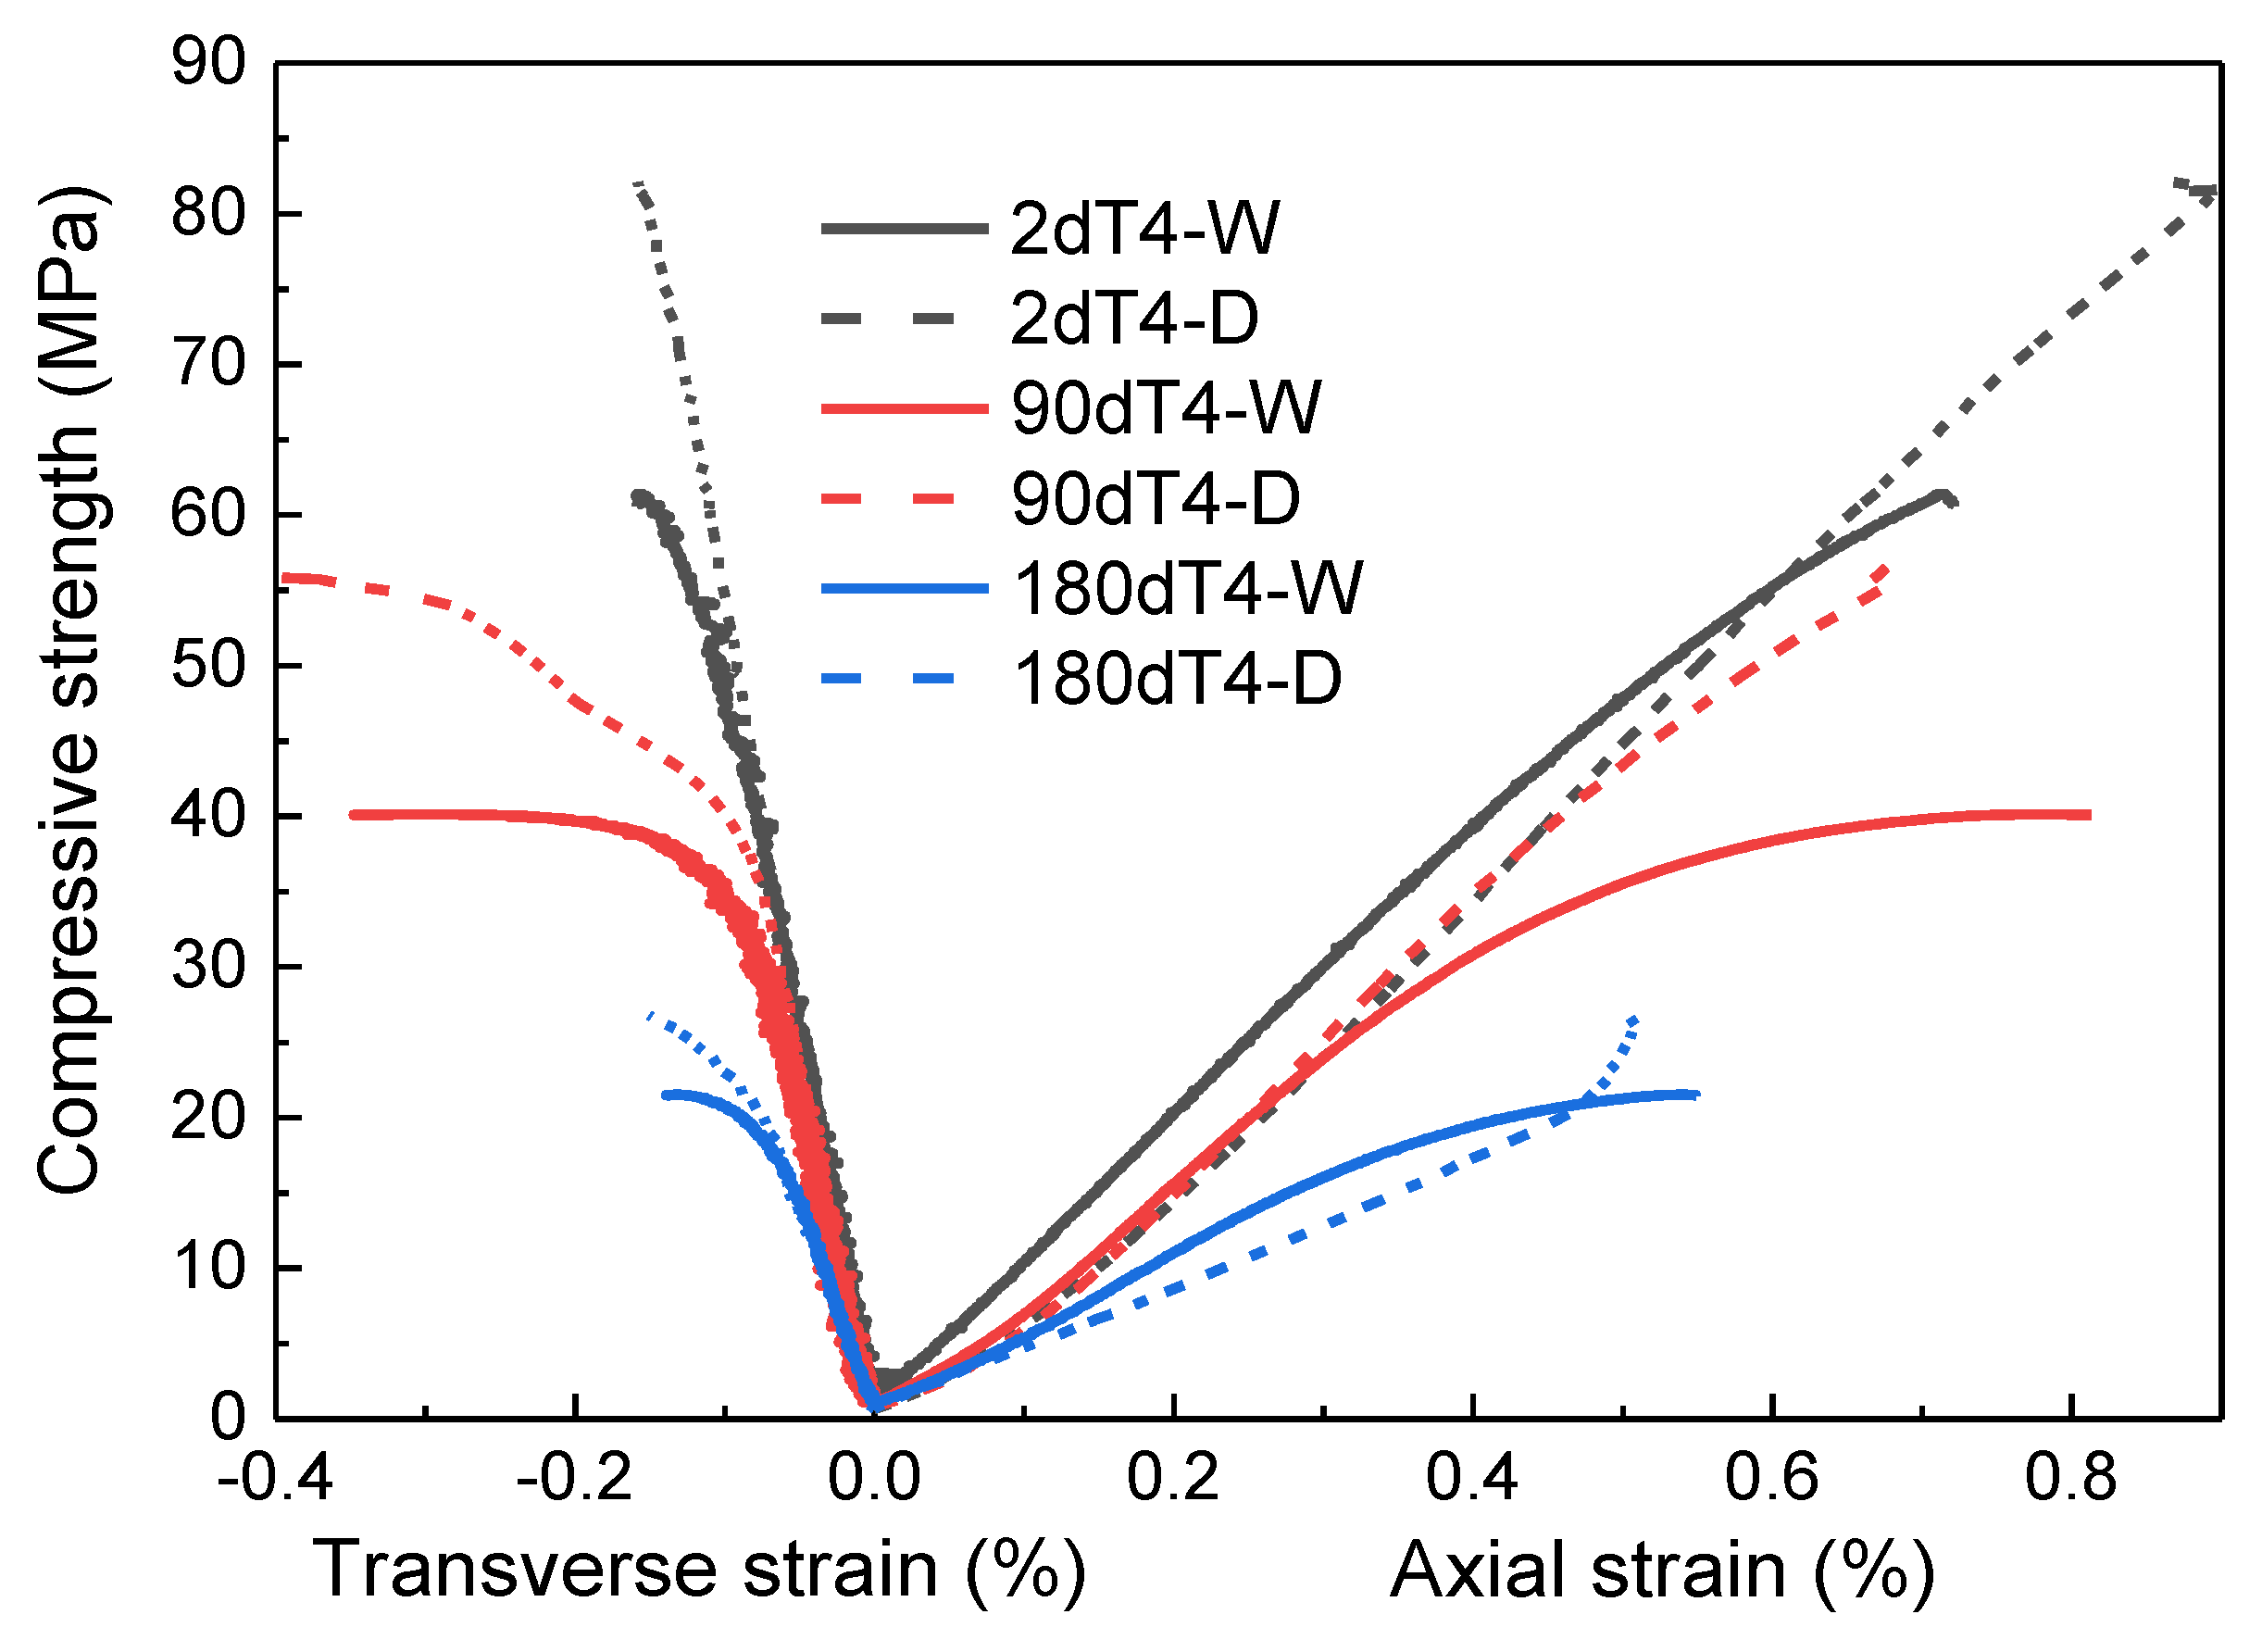
4.2. Influence of Drying Condition on Mechanical Properties of Set Cement

The compressive strength of set cement is known to increase with the degree of drying due to the reduced effect of pore water pressure and changes in C-S-H structure. Conversely, drying may also lead to shrinkage and cracks in cement-based materials, thereby damaging their mechanical integrity. The stress–strain curves of saturated samples were compared with those of vacuum-dried samples in Figure 7. Clearly, the measured compressive strength increased significantly after sample drying, while the changes in Young’s modulus (slope of stress vs. axial strain curves) were relatively small. The amount of increase in compressive strength due to drying ranged from 29.3% to 37.5% at different curing times. The test results shown here suggest that no significant damage was induced in the test samples during the drying process.

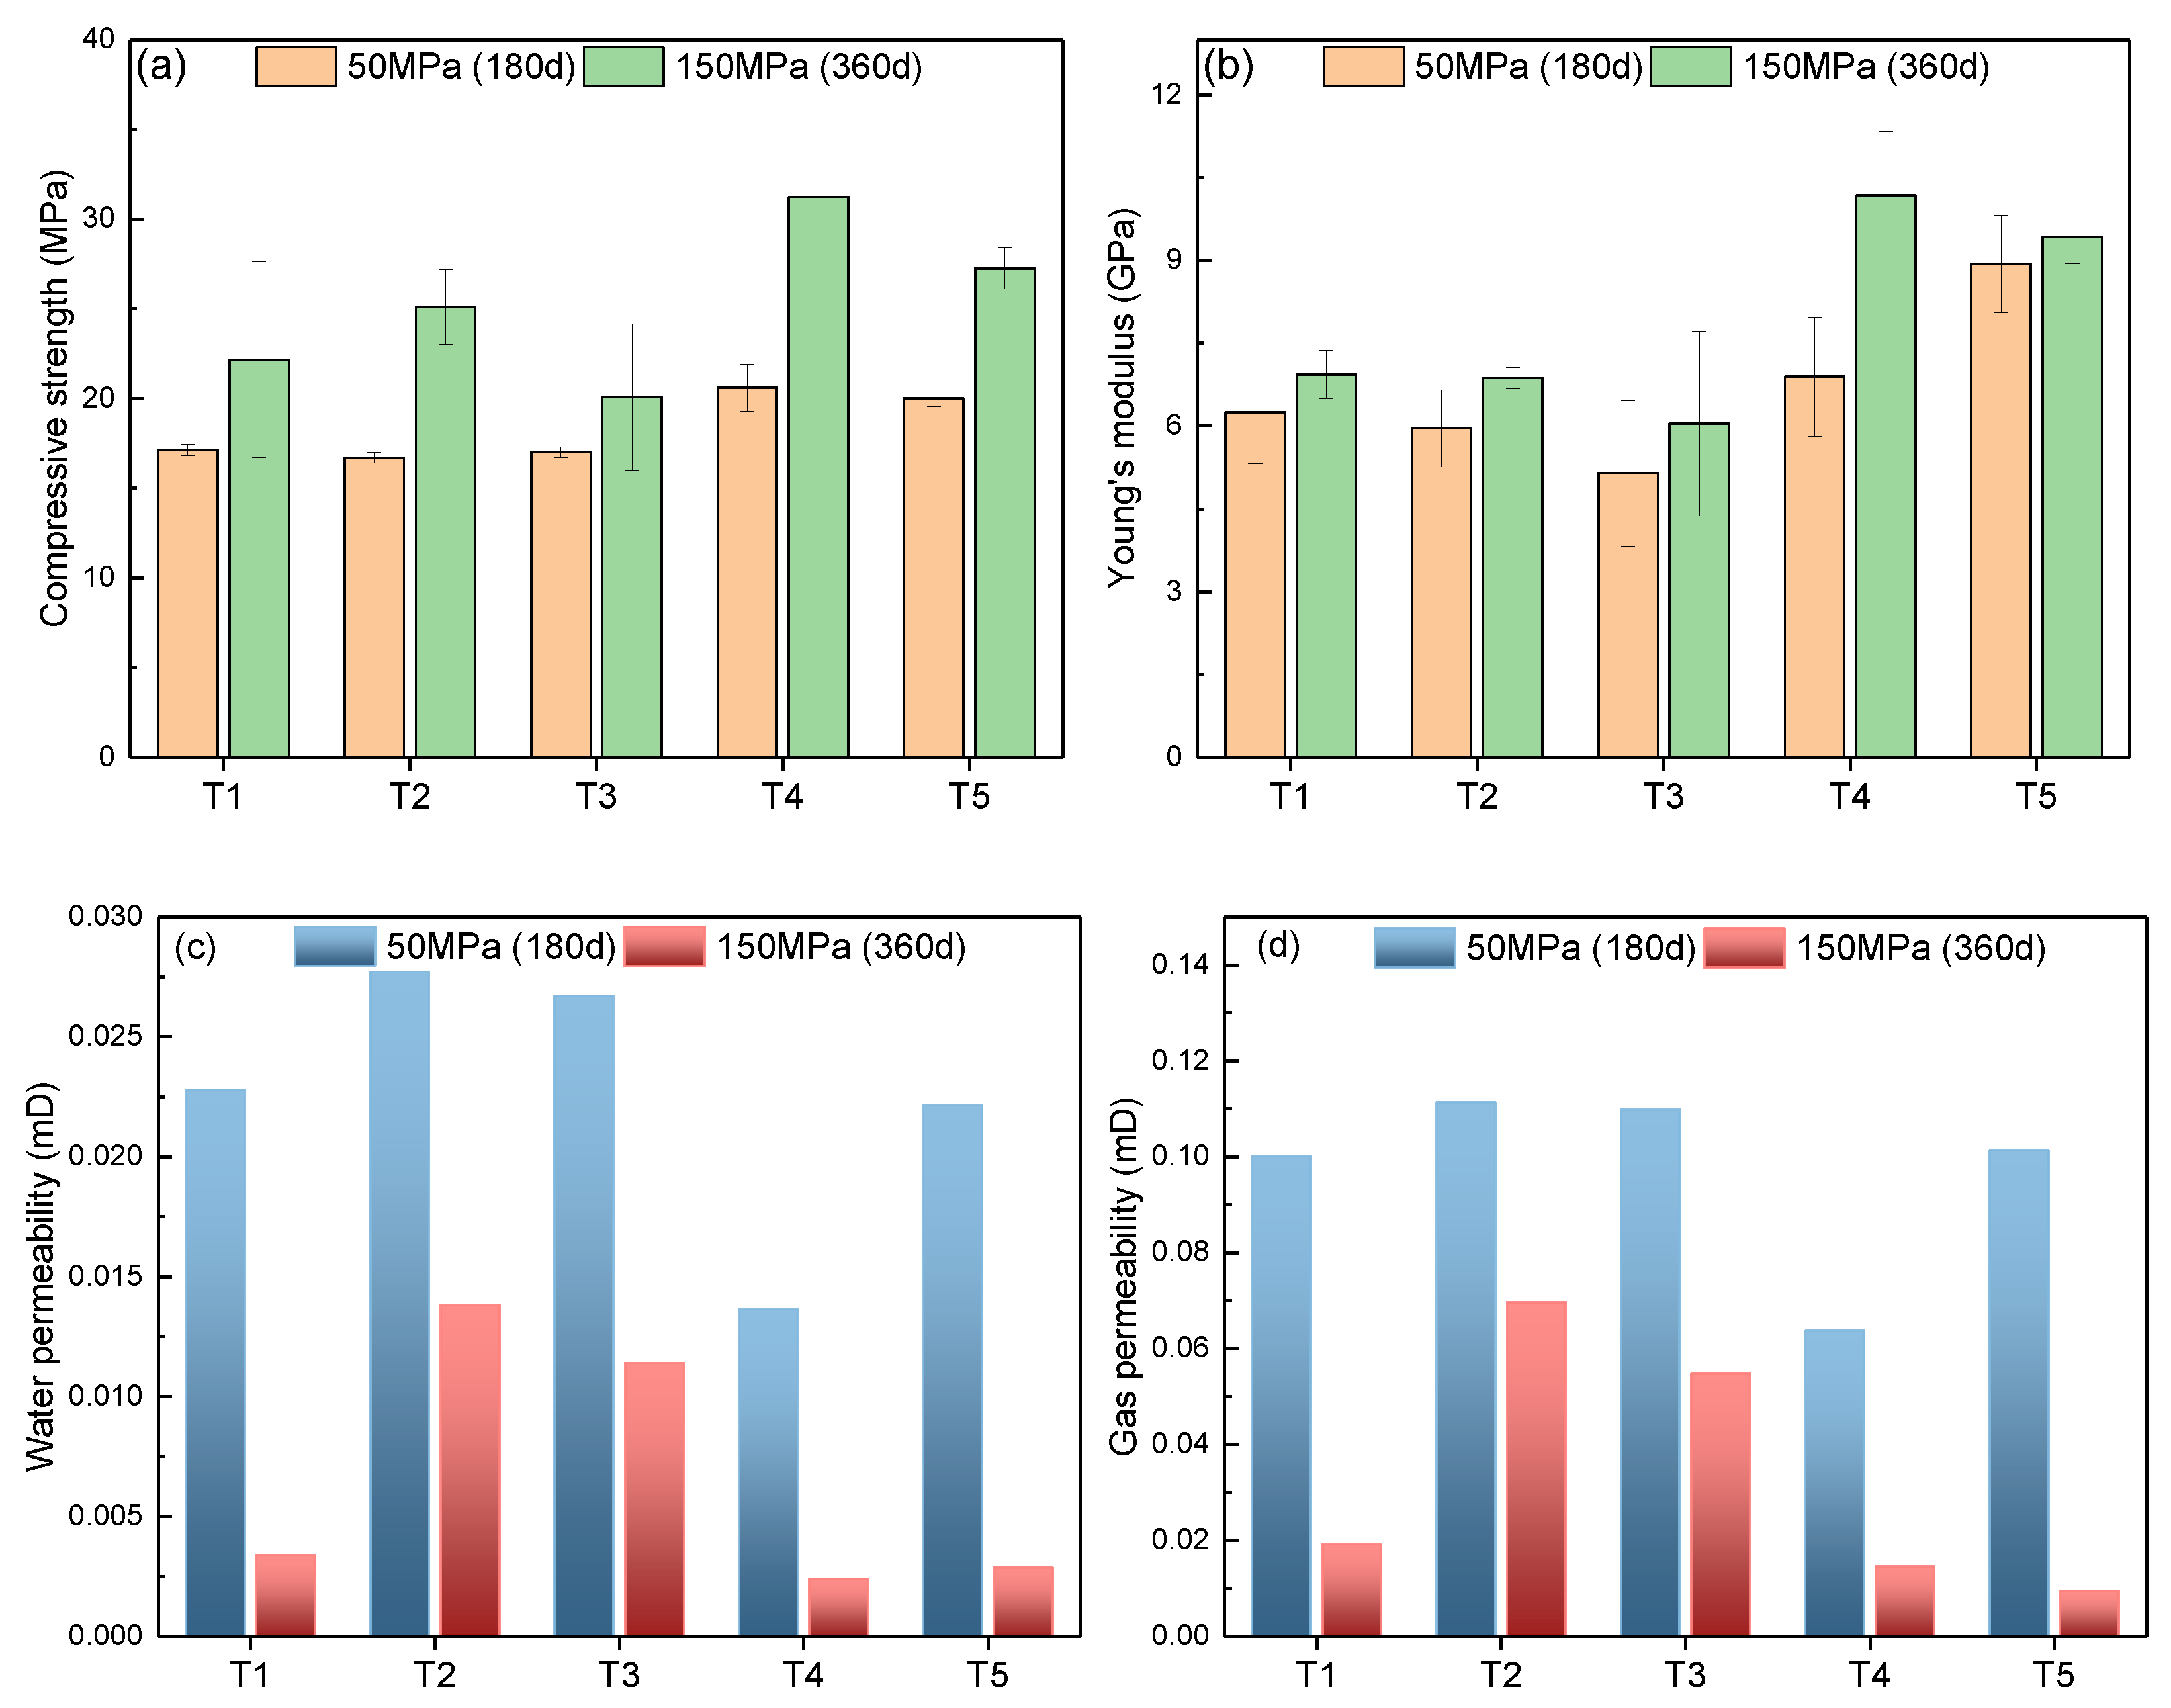
4.3. Influence of Curing Pressure on Properties of Set Cement

Short-term (2 d) compressive strength and Young’s modulus results of slurries T1 to T5 cured under 200 °C and 50/150 MPa were compared in Figure 8a,b. The average COVs of compressive strength at 50 and 150 MPa were 4% and 6%, respectively, while the average COVs of Young’s modulus were 8% and 9%, respectively, indicating relatively small experimental errors. Curing pressure appeared to have little to no influence on the short-term mechanical property performance of the set cement as measured based on both mechanical properties and permeability test results. The consistency of test results also indicated that the slow depressurization rate adopted in this study effectively prevented sample damage during depressurization.
As shown in Figure 9a,b, the long-term compressive strength and Young’s modulus results of samples cured at 150 MPa were uniformly higher than those cured at 50 MPa, despite the longer strength retrogression period. Meanwhile, the water and gas permeability test results of the 150 MPa samples were also uniformly lower than the 50 MPa samples. On average, the compressive strength and Young’s modulus of the 150 MPa samples were 37% and 19% higher than the 50 MPa samples, while the water and gas permeability of the 150 MPa samples were 72% and 67% lower than the 50 MPa samples. Since the long-term strength retrogression of silica-enriched cement appeared to be an irreversible process according to our previous studies [14,16], the test results presented here suggest that high curing pressure can help to significantly slow down the rate of strength decline. This result is different from the previous conclusion that pressure has little effect on set cement properties when the pressure is higher than 13.8 MPa [4].
Figure 10 shows the MIP test results of three representative long-term cured slurries at different pressures, where Instrument Model P33 was used. The pore size distribution frequency curves of the sample cured under 50 MPa showed only one broad peak, while the sample cured under 150 MPa generally showed two partially overlapping broad peaks, with the left one (with a peak of approximately 20 nm) representing a smaller pore structure. The total porosity of samples cured under 50 MPa varied slightly from 36.7% to 41.4% and seemed to show a slight dependence on slurry compositions. However, the total porosity was decreased to about 35% at 150 MPa curing pressure with almost no dependence on slurry compositions. The quantity of large pores (>100 nm) also slightly decreased with the application of different reinforcement materials, especially in slurry T4 with latex fiber at 150 MPa (from 11.9% to 7.4%), which showed that the ability of reinforcement materials to resist microstructural coarsening was more significant under high pressure during long-term curing conditions. Combined with the results in Section 3.1 and Section 3.2, it can be concluded that the internal pore size played a crucial role in the physical and mechanical properties of set cement cured under HPHT conditions. The reduction of pore size under ultra-high pressure led to more stable physical and mechanical properties over long-term curing. The test results showed that ultra-high pressure might be beneficial to forming a more compact set cement structure to increase mechanical properties and decrease permeability in the long-term curing period.
Traditional MIP tests underestimate cement-based materials’ real pore sizes since mercury can only enter huge pores via much smaller “throat pores”, which is known as the “ink-bottle” effect [32,33,34,35]. The large pores can be better visualized through SEM back-scattered electron (SEM-BSE) images. The SEM-BSE analysis results of slurries T1 and T2 cured for 50 and 150 MPa under low magnification (×50) are given in Figure 11. As discussed in our earlier study [14], the SEM-BSE image’s gray levels were (from black to white): Pores > anhydrous particles (mostly silica) > C-S-H > various hydration products. The large pores can be separated by defining a grayscale threshold using an image processing software (Image J), which can convert grayscale images into binary images and provide statistical information with regard to the pores. The porosity and median size of the large pores calculated based on each image are also provided in Figure 11. Apparently, the 150 MPa samples had significantly smaller large-pore porosity than the 50 MPa samples, indicating that increasing curing pressure can slow down pore size increase during long-term high-temperature curing. Only large pores can be resolved in the relatively low resolution image presented here. Therefore, the porosities measured by SEM-BSE images were much lower than those measured by MIP tests.

4.4. Influence of Reinforcement Materials on Properties of Set Cement

The test results of slurries T3 to T5 cured at 50 and 150 MPa are summarized in Table 2 and Table 3, respectively. Slurry T3 was used as a control system; 6% latex fiber was added to obtain slurry T4, and 0.4% nano-graphene was added to obtain slurry T5. Reinforcement material addition can reduce the mechanical property deterioration of set cement during long-term curing, especially Young’s modulus. Reinforcement material addition can also result in set cement with finer pore structure and can slow down the increase in water permeability over long-term HPHT curing, indicating that the reinforcement admixture may alleviate the microstructure coarsening, which has been proven to be the main driving force for strength retrogression during long-term HPHT curing [14,16]. Furthermore, this mitigation effect of reinforcement materials seemed to be enhanced under ultra-high pressure. The long-term strength decline of slurry T4 and T5 indicated that the addition of reinforcement materials can not completely prevent the strength retrogression at 200 °C, at least at the dosage employed during this study.
Figure 12 shows the SEM-BSE images of slurries T3 to T5 cured at 50 and 150 MPa under low magnification (×50). Additional images at high magnification levels can be found in Appendix A (Figure A1 and Figure A2). The slurry with the best strength and water permeability performance (slurry T4 with latex fiber) also seemed to have the best microstructure, as measured by the median pore size of the large pores. However, it is apparent that the influence of the reinforcement materials on the microstructure was much less than that of the curing pressure, especially based on the metrics of large-pore porosity. The large-pore porosities in these images were 4.5%, 4.8%, and 3.9% for slurries T3, T4, and T5 cured under 50 MPa, which became 1.3%, 1.0%, and 2.5% under 150 MPa curing pressure, respectively. The quantitative image analysis results presented here were only intended to provide an overall trend of variation; a much greater number of images would be required for accurate quantification of large pores.

5. Discussion: Mechanism of Strength Retrogression

The conversion of cement hydration products from amorphous C-S-H to crystalline phases has long been considered as the main cause of the strength retrogression of Portland cement-based materials. As the crystalline phases have higher densities than the amorphous C-S-H, such conversion will lead to local failures and cause porosity increases in the cement matrix. However, our most recent study adopting the quantitative XRD analysis method (with internal standard) indicated that the amorphous phase content in the silica-enriched oil well cement system did not change significantly over the long-term curing [16]. TG test results as presented in Figure 3 and Figure 5 of this study clearly indicated that the bound water content of amorphous C-S-H in the temperature range of 200–450 °C clearly decreased with increased curing time. It is suspected that the structure of amorphous C-S-H may change during the long-term curing under HPHT conditions, and such a structural change may be the cause of reduced bound water content and the driving force of microstructure coarsening. Previous studies have found that increased temperature can lead to reductions in C-S-H interlayer water content [36], and the reduced water content in C-S-H is often responsible for its microstructure coarsening [31]. Higher curing pressure seems to be able to reduce the rate of C-S-H structural change and thereby decrease the rate of strength retrogression of silica-enriched oil well cement systems.

6. Conclusions

The influences of curing pressure and reinforcement materials on long-term properties of silica-enriched oil well cement cured under 200 °C were studied experimentally. The following main conclusions can be drawn:
(1)
Increasing curing pressure can significantly decrease the rate of long-term strength retrogression of silica-enriched oil well cement systems, possibly due to the more compact microstructure of set cement and more stable C-S-H structures.
(2)
Reinforcement materials such as latex fiber and nano-graphene can also mitigate long-term strength retrogression of silica-enriched oil well cement systems, especially at ultra-high pressure (150 MPa); the best design of this study is slurry T4 with latex fiber, which had a compressive strength of 30 MPa after 360 d curing under 200 °C and 150 MPa.
(3)
The long-term curing during HPHT conditions may lead to structural change of amorphous C-S-H gel; such a structural change may be the cause of reduced bound water content and the driving force of microstructure coarsening, which in turn are responsible for strength retrogression of silica-enriched oil well cement systems.

Author Contributions

Conceptualization, X.P.; Formal analysis, J.Q.; Funding acquisition, H.L. and X.P.; Investigation, J.Q. and B.Z.; Methodology, X.P.; Writing—original draft, J.Q. and X.P.; Writing—review & editing, H.L., B.Z., Z.L., Z.Y., Z.Z., Z.A. and X.L. All authors have read and agreed to the published version of the manuscript.

Funding

This research was funded by China National Natural Science Foundation (no. 51974352) as well as from the China University of Petroleum (East China) (no. 2018000025 and no. 2019000011).

Institutional Review Board Statement

Not applicable.

Informed Consent Statement

Informed consent was obtained from all subjects involved in the study.

Data Availability Statement

Not applicable.

Acknowledgments

We would like to thank all contributors who supported the field work and the data collection and analysis.

Conflicts of Interest

The authors declare no conflict of interest.

Appendix A

Figure A1. SEM-BSE analysis of slurries T1 to T5 (×1000).
Energies 15 06071 g0a1
Figure A2. SEM-BSE analysis of slurries T1 to T5 (×200).
Energies 15 06071 g0a2

References

  1. Zhang, P.; Mishra, B.; Heasley, K.A. Experimental Investigation on the Influence of High Pressure and High Temperature on the Mechanical Properties of Deep Reservoir Rocks. Rock Mech. Rock Eng. 2015, 48, 2197–2211. [Google Scholar] [CrossRef]
  2. Pang, X.; Qin, J.; Bu, Y.; Yuan, Z.; Wang, Y.; Wang, Z. Research Advances in Oil Well Cement Subjected to High Temperature and High Pressure Curing Environment. J. Oil Gas Technol. 2020, 42, 13–23. [Google Scholar] [CrossRef]
  3. Luo, Y.; Xiao, W.; Zhao, J. Research progresses and development suggestions of CNOOC cementing technology during the13th Five-Year Plan. China Offshore Oil Gas 2020, 32, 145–151. [Google Scholar]
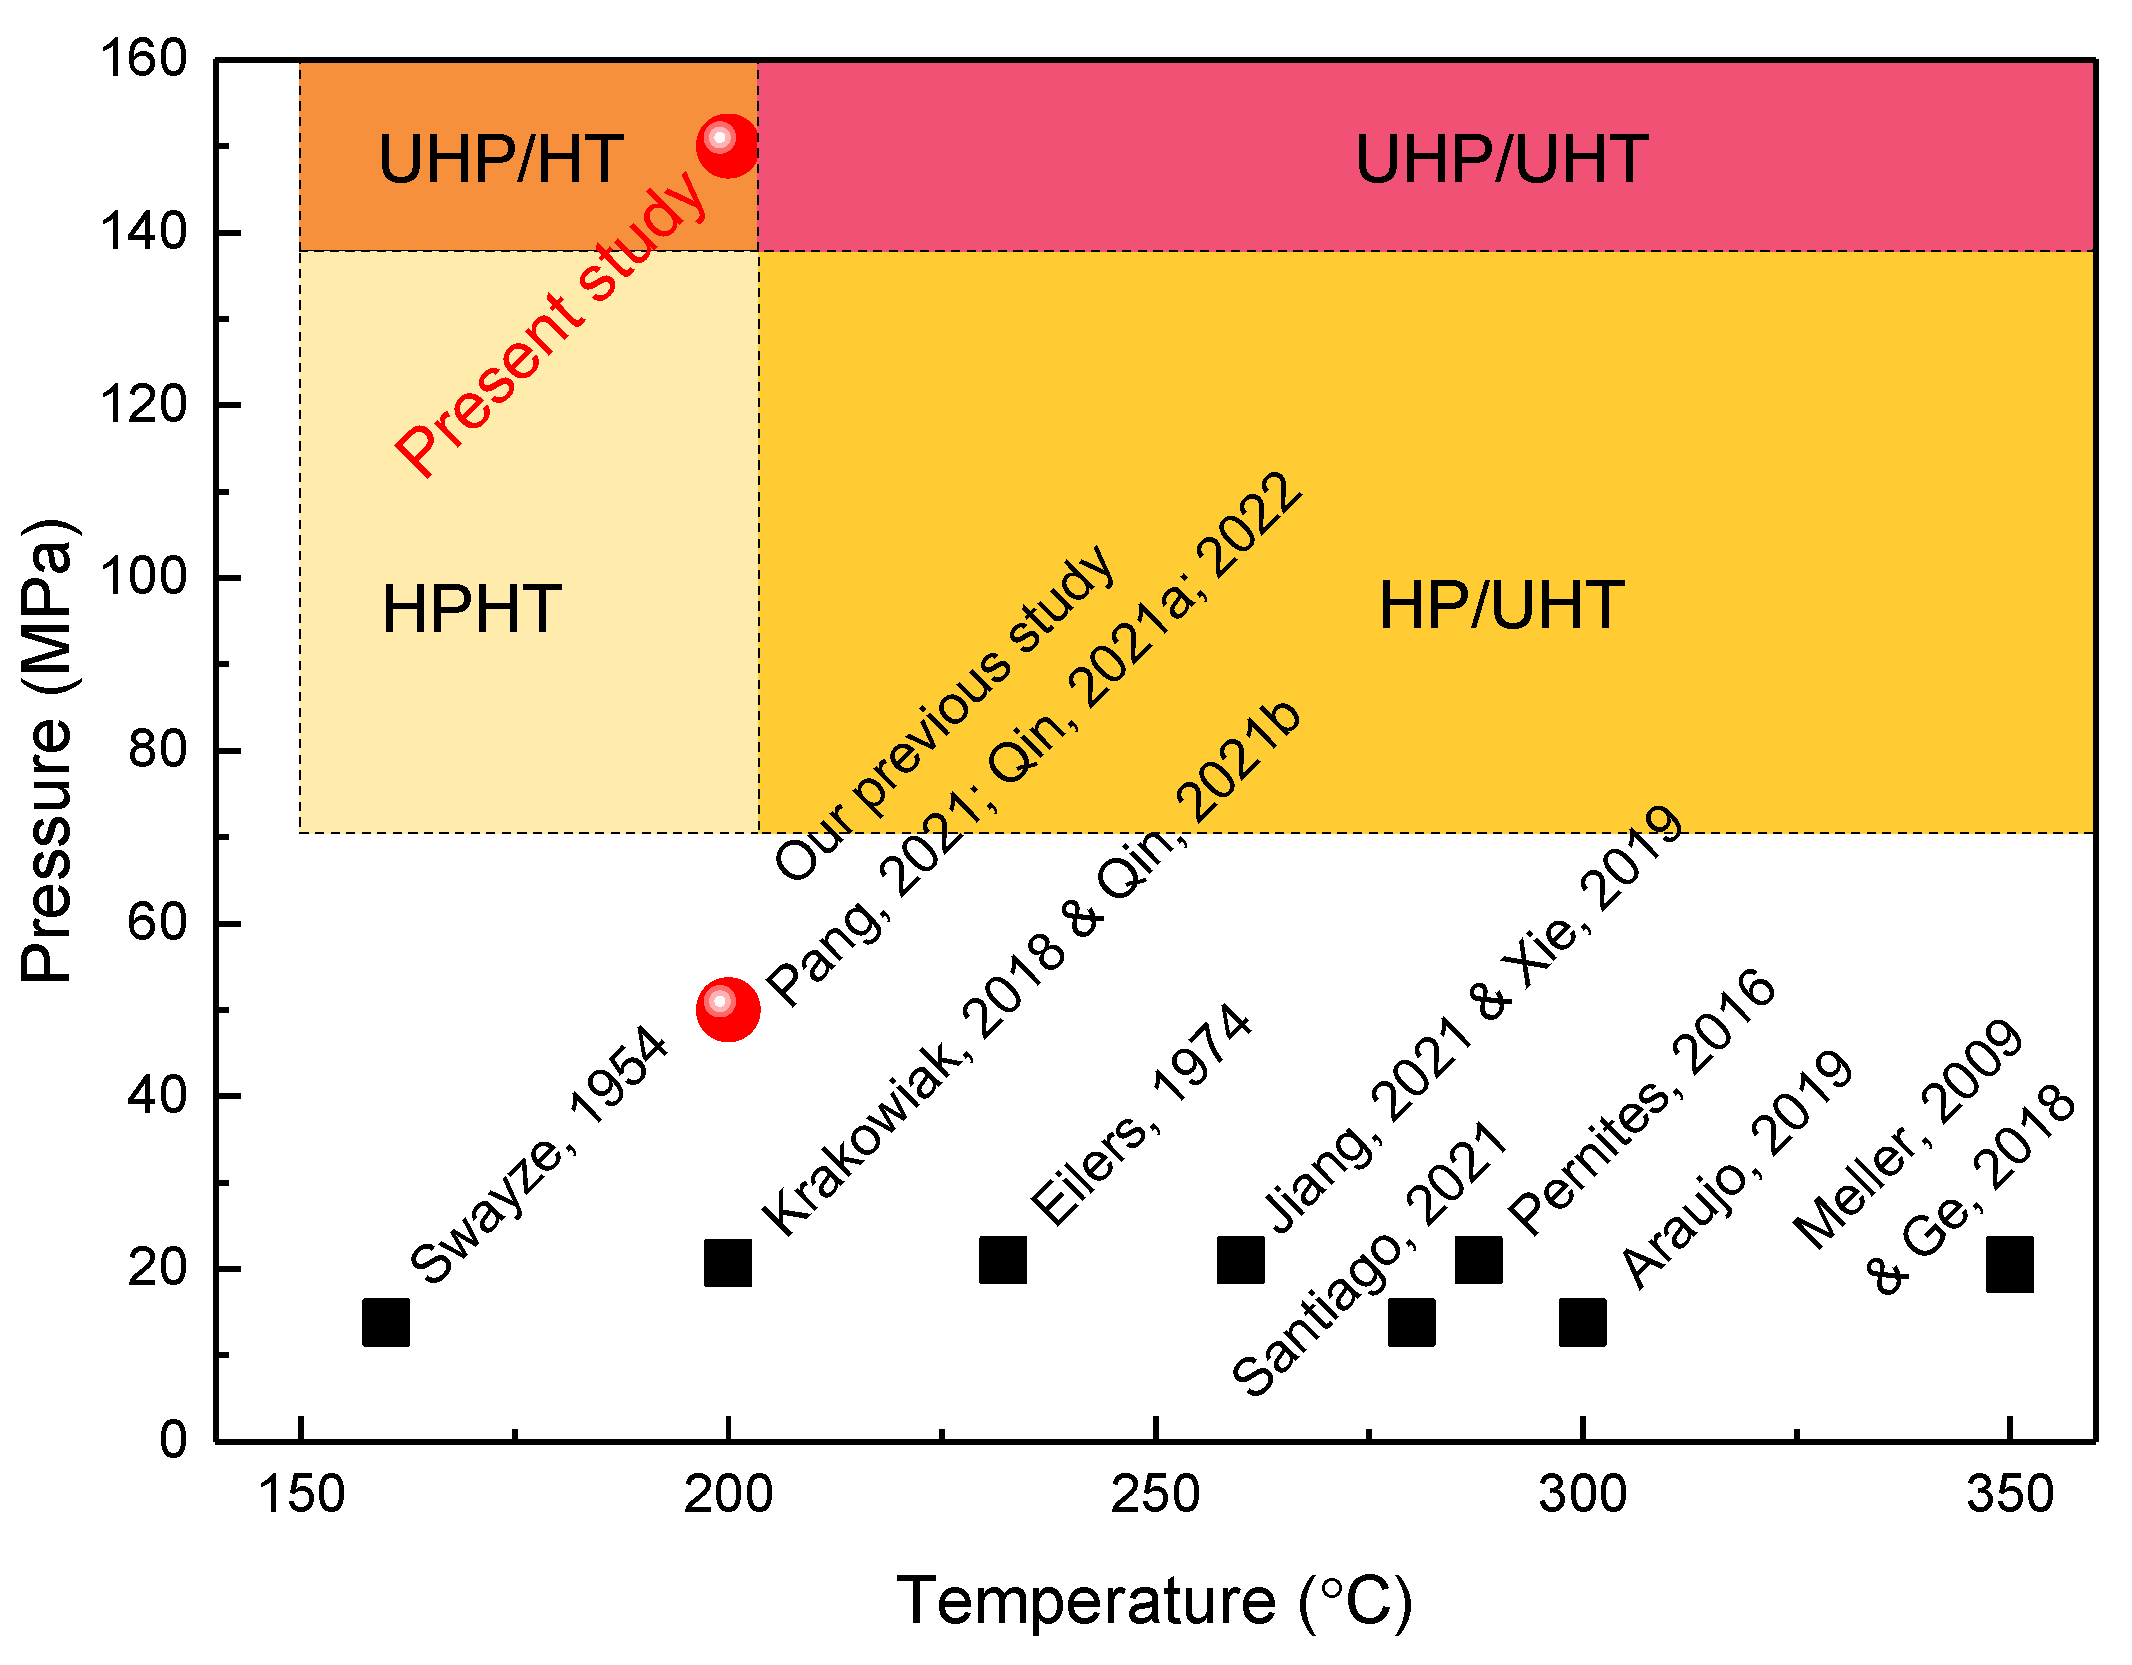
  4. Swayze, M.A. Effects of high pressures and temperatures on strength of oil-well cements. Drill. Prod. Pract. 1954, 72. [Google Scholar]
  5. Krakowiak, K.J.; Thomas, J.J.; James, S.; Abuhaikal, M.; Ulm, F.-J. Development of silica-enriched cement-based materials with improved aging resistance for application in high-temperature environments. Cem. Concr. Res. 2018, 105, 91–110. [Google Scholar] [CrossRef]
  6. Eilers, L.H.; Root, R.L. Long-Term Effects of High Temperature on Strength Retrogression of Cements. In Proceedings of the Fall Meeting of the Society of Petroleum Engineers of AIME, Houston, TX, USA, 6–9 October 1974; Volume 4. [Google Scholar]
  7. Jiang, T.; Geng, C.; Yao, X.; Song, W.; Dai, D.; Yang, T. Long-term thermal performance of oil well cement modified by silica flour with different particle sizes in HTHP environment. Constr. Build. Mater. 2021, 296, 123701. [Google Scholar] [CrossRef]
  8. Xie, Z.; Yao, X. Influence of the particle size distribution of silica flour on the mechanical and microstructural properties of oil well cement paste exposed to hthp conditions. Ceram.-Silik. 2019, 63, 239–247. [Google Scholar] [CrossRef]
  9. Santiago, R.; Costa, B.; Silva, F.; Medeiros, R.; Nascimento, R.; Aum, P.; Freitas, J. Sustainable cement blends for oil well steam injection using rice husk ash. J. Pet. Sci. Eng. 2021, 199, 108281. [Google Scholar] [CrossRef]
  10. Pernites, R.B.; Santra, A.K. Portland cement solutions for ultra-high temperature wellbore applications. Cem. Concr. Compos. 2016, 72, 89–103. [Google Scholar] [CrossRef]
  11. Araújo, R.G.D.S.; Freitas, J.C.D.O.; Costa, B.L.D.S.; Moreira, P.H.S.S.; da Silva, F.P.F.; de Oliveira, Y.H. Alternative Material to be Applied in Oil Well Cementing Subjected to High Temperatures to Avoid Compressive Strength Retrogression. In Proceedings of the Offshore Technology Conference, Houston, TX, USA, 6–9 May 2019. [Google Scholar]
  12. Meller, N.; Kyritsis, K.; Hall, C. The mineralogy of the CaO–Al2O3–SiO2–H2O (CASH) hydroceramic system from 200 to 350 °C. Cem. Concr. Res. 2009, 39, 45–53. [Google Scholar] [CrossRef]
  13. Ge, Z.; Yao, X.; Wang, X.; Zhang, W.; Yang, T. Thermal performance and microstructure of oil well cement paste containing subsphaeroidal konilite flour in HTHP conditions. Constr. Build. Mater. 2018, 172, 787–794. [Google Scholar] [CrossRef]
  14. Pang, X.; Qin, J.; Sun, L.; Zhang, G.; Wang, H. Long-term strength retrogression of silica-enriched oil well cement: A comprehensive multi-approach analysis. Cem. Concr. Res. 2021, 144, 106424. [Google Scholar] [CrossRef]
  15. Qin, J.; Pang, X.; Liu, Z.; Ai, Z.; Li, N. Effect of various testing parameters on the experimental evaluation of oil well cement cured under simulated downhole conditions. IOP Conf. Ser. Mater. Sci. Eng. 2021, 1028, 012004. [Google Scholar] [CrossRef]
  16. Qin, J.; Pang, X.; Santra, A.; Cheng, G.; Li, H. Various admixtures to mitigate the long-term strength retrogression of Portland cement cured under HPHT conditions. J. Rock Mech. Geotech. Eng. 2022. [Google Scholar] [CrossRef]
  17. Qin, J.; Pang, X.; Cheng, G.; Bu, Y.; Liu, H. Influences of different admixtures on the properties of oil well cement systems at HPHT conditions. Cem. Concr. Compos. 2021, 123, 104202. [Google Scholar] [CrossRef]
  18. Shadravan, A.; Amani, M. What Petroleum Engineers and Geoscientists Should Know About High Pressure High Temperature Wells Environment. Energy Sci. Technol. 2012, 4, 36–60. [Google Scholar]
  19. Payne, M.L.; Pattillo, D.; Miller, R.; Johnson, C.K. Advanced Technology Solutions for Next Generation HPHT Wells. In Proceedings of the International Petroleum Technology Conference, Dubai, United Arab Emirates, 4–6 December 2007; OnePetro: Richardson, TX, USA, 2007. [Google Scholar]
  20. Han, C.; Wei, A.; Huang, K.; Luo, M.; Zhang, C. Ultra-High Temperature-Pressure Gas Well Testing in Ying-Qiong Basin. Spec. Oil Gas Reserv. 2018, 25, 150–154. [Google Scholar]
  21. Niu, X.; Zhang, J.; Zhou, H. Technological Challenges and Countermeasures in Well Control of Ultra-Deep, Ultra-High Temperature and Ultra-High Pressure Oil and Gas Wells. Pet. Drill. Tech. 2017, 45, 1–7. [Google Scholar]
  22. Scherer, G.W.; Funkhouser, G.P.; Peethamparan, S. Effect of pressure on early hydration of class H and white cement. Cem. Concr. Res. 2010, 40, 845–850. [Google Scholar] [CrossRef]
  23. Jupe, A.C.; Wilkinson, A.P.; Funkhouser, G.P. The effect of pressure on tricalcium silicate hydration at different temperatures and in the presence of retarding additives. Cem. Concr. Res. 2012, 42, 1083–1087. [Google Scholar] [CrossRef]
  24. Pang, X.; Jimenez, W.C.; Iverson, B.J. Hydration kinetics modeling of the effect of curing temperature and pressure on the heat evolution of oil well cement. Cem. Concr. Res. 2013, 54, 69–76. [Google Scholar] [CrossRef]
  25. Meyer, C.; Pang, X.; Darbe, R.; Funkhouser, G.P. Modeling the Effect of Curing Temperature and Pressure on Cement Hydration Kinetics. ACI Mater. J. 2013, 110, 137–147. [Google Scholar]
  26. Pang, X.; Otieno, P.A.; Funkhouser, G.P. Modeling the effect of curing pressure on the viscosity evolution of oilwell cement. In Proceedings of the 2014 AADE Fluid Technical Conference & Exhibition, Houston, TX, USA, 15–16 April 2014. [Google Scholar]
  27. Paiva, L.C.M.; Ferreira, I.M.; Martinelli, A.E.; Freitas, J.C.D.O.; Bezerra, U.T. Milled basalt fiber reinforced Portland slurries for oil well applications. J. Pet. Sci. Eng. 2019, 175, 184–189. [Google Scholar] [CrossRef]
  28. Yu, J.; Li, M.; Jin, J. Research Progress of Toughening-Enhancing Materials in Oil Well Cement. Bull. Chin. Ceram. Soc. 2017, 36, 3013–3019. [Google Scholar]
  29. Liu, H.; Yu, Y.; Liu, H.; Jin, J.; Liu, S. Hybrid effects of nano-silica and graphene oxide on mechanical properties and hydration products of oil well cement. Constr. Build. Mater. 2018, 191, 311–319. [Google Scholar] [CrossRef]
  30. Pang, X.; Meyer, C.; Funkhouser, G.P.; Darbe, R. Depressurization damage of oil well cement cured for 3days at various pressures. Constr. Build. Mater. 2015, 74, 268–277. [Google Scholar] [CrossRef]
  31. Zhou, C.; Ren, F.; Wang, Z.; Chen, W.; Wang, W. Why permeability to water is anomalously lower than that to many other fluids for cement-based material? Cem. Concr. Res. 2017, 100, 373–384. [Google Scholar] [CrossRef]
  32. Diamond, S. Mercury porosimetry: An inappropriate method for the measurement of pore size distributions in cement-based materials. Cem. Concr. Res. 2000, 30, 1517–1525. [Google Scholar] [CrossRef]
  33. Kaufmann, J. Pore space analysis of cement-based materials by combined Nitrogen sorption—Wood’s metal impregnation and multi-cycle mercury intrusion. Cem. Concr. Compos. 2010, 32, 514–522. [Google Scholar] [CrossRef]
  34. Zhou, J.; Ye, G.; van Breugel, K. Characterization of pore structure in cement-based materials using pressurization-depressurization cycling mercury intrusion porosimetry (PDC-MIP). Cem. Concr. Res. 2010, 40, 1120–1128. [Google Scholar] [CrossRef]
  35. Ma, Y.; Wang, G.; Ye, G.; Hu, J. A comparative study on the pore structure of alkali-activated fly ash evaluated by mercury intrusion porosimetry, N2 adsorption and image analysis. J. Mater. Sci. 2018, 53, 5958–5972. [Google Scholar] [CrossRef]
  36. Wyrzykowski, M.; McDonald, P.J.; Scrivener, K.L.; Lura, P. Water Redistribution within the Microstructure of Cementitious Materials due to Temperature Changes Studied with 1H NMR. J. Phys. Chem. C 2017, 121, 27950–27962. [Google Scholar] [CrossRef] [Green Version]
Figure 1. Comparison of curing conditions of previous studies. HPHT conditions in previous study tiers categorized by Baker Oil Tools [4,5,6,7,8,9,10,11,12,13,14,15,16,17,18].
Energies 15 06071 g001
Figure 2. Long-term macroscopic property of T1 to T5 cured under 200 °C and 50 MPa showed decreasing strength and modulus as well as increasing water/gas permeability from 2 to 180 d: (a) compressive strength; (b) Young’s modulus; (c) water permeability; (d) gas permeability.
Energies 15 06071 g002
Figure 3. Relationship between macroscopic properties and microscopic properties of slurry T4 cured under 200 °C and 50 MPa from 2 to 180 d. (a) Stress–strain response showed decreasing resistance to load; (b) XRD test showed possible C-S-H structural change; (c) MIP test showed increasing pore diameter; (d) TG test showed decreasing bound water content measured between 200 and 650 °C.
Energies 15 06071 g003
Figure 4. Long-term macroscopic property of slurries T1 to T5 cured under 200 °C and 150 MPa showed decreasing strength and modulus as well as increasing water/gas permeability from 2 to 360 d: (a) compressive strength; (b) Young’s modulus; (c) water permeability; (d) gas permeability.
Energies 15 06071 g004
Figure 5. Relationship between macroscopic properties and microscopic properties of slurries T3 and T4 cured under 200 °C and 150 MPa from 2 to 360 d. (a) Stress–strain response showed decreasing resistance to load; (b) XRD test showed possible C-S-H structural change; (c) MIP test showed increasing pore diameter; (d) TG test showed decreasing bound water content measured between 200 and 650 °C.
Energies 15 06071 g005
Figure 6. Influences of (a) specimen sizes; (b) and (c) sample quantity on the MIP test results.
Energies 15 06071 g006
Figure 7. The stress–strain curves of samples cured under 200 °C and 50 MPa from 2 to 180 d showed increasing strength with drying. (W: water-saturated samples D: vacuum-dried samples).
Energies 15 06071 g007
Figure 8. Mechanical properties and permeability of slurries T1 to T5 showed no significant influence of curing pressure on short-term test results: (a) compressive strength; (b) Young’s modulus; (c) water permeability; (d) gas permeability.
Energies 15 06071 g008
Figure 9. Mechanical properties and permeability of slurries T1 to T5 showed possible significant influence of curing pressure on the long-term test results: (a) compressive strength; (b) Young’s modulus; (c) water permeability; (d) gas permeability. (Note: it is expected that the 360 d test results at 50 MPa would be worse than 180 d according to the trend shown in Figure 2) (T1: low α-Al2O3 content, T2: no nano-Fe2O3, T3: control; T4: latex fiber, T5: nano-graphene).
Energies 15 06071 g009
Figure 10. MIP test results of slurries T3 to T5 showed higher curing pressure resulted in smaller pore size and lower porosity in long-term cured samples. (a) Pore size distribution frequency curve. (b) Cumulative pore size distribution curve. (c) General pore size statistics. (Note: it is expected that the pore size and porosity of the 50 MPa samples at 360 d would be larger than those measured at 180 d according to the trend shown in Figure 3).
Energies 15 06071 g010
Figure 11. SEM-BSE analysis of slurries T1 and T2 showed that higher curing pressure resulted in smaller pore size and lower porosity in long-term cured samples.
Energies 15 06071 g011
Figure 12. SEM-BSE analysis of slurries T3 to T5 showed that higher curing pressure resulted in smaller pore size and lower porosity in long-term cured samples. (T3: control; T4: latex fiber, T5: nano-graphene).
Energies 15 06071 g012
Table 1. Formulation design of cement slurries (%BWOC).
FormulationCement6 μm SilicaA-Al2O3Latex FiberGrapheneNano
-Fe2O3
Water
T110070500550.2
T2100701500060.4
T3100701500555.9
T4(LX)100701560557.3
T5(GR)100701500.4555.9
Note: The dosages of suspending agent (BDJ-300S), retarder (BCR-300L), fluid loss reducer (BXF-200L), dispersant (BCD-210L), and defoamer (G603) of the slurries in Table 1 were 4% BWOC, 4.5% BWOC, 6% BWOC, 5.5% BWOC, and 0.5% BWOC, respectively.
Table 2. Variation of test properties from 2 to 180 d and median pore size of 180 d sample (50 MPa).
SlurryChange in Compressive Strength (%)Change in Young’s Modulus (%)Change in Water Permeability (Multiple)180 d Median Pore Size (nm)
T3−71.9−50.1×121125
T4(LX)−66.1−31.1×83127
T5(GR)−64.2−14.6×91126
Table 3. Variation of test properties from 2 to 360 d and median pore size of 360 d sample (150 MPa).
SlurryChange in Compressive Strength (%)Change in Young’s Modulus (%)Change in Water Permeability (Multiple)360 d Median Pore Size (nm)
T3−66.8−47.5×6461
T4(LX)−46.5−15.5×943
T5(GR)−55.5−11.6×931
Publisher’s Note: MDPI stays neutral with regard to jurisdictional claims in published maps and institutional affiliations.

