Article

The Influence of Movable Water on the Gas-Phase Threshold Pressure Gradient in Tight Gas Reservoirs

School of Civil and Resource Engineering, University of Science and Technology Beijing, Beijing 100083, China
*
Author to whom correspondence should be addressed.
Energies 2022, 15(14), 5309; https://doi.org/10.3390/en15145309
Submission received: 18 June 2022 / Revised: 19 July 2022 / Accepted: 20 July 2022 / Published: 21 July 2022

Abstract

:
Threshold pressure gradient (TPG) is a key parameter determining the pore-scale fluid dynamics. In tight gas reservoirs, both gas and water exist in the porous rock, and the existing water can be divided into irreducible and movable water. However, how movable water saturation will influence TPG has not yet been investigated. Therefore herein, nuclear magnetic resonance (NMR) and high-pressure mercury intrusion (HPMI) experiments were performed to determine pore-scale water distribution, movable water saturation, and pore throat distribution in the core plugs. Subsequently, the air bubble method was used to measure TPG as a function of movable water saturation and permeability inside tight gas core plugs, finding that TPG increased from 0.01 MPa/m to 0.25 MPa/m with the movable saturation increased from 2% to 35%. Finally, a semi-empirical model was derived to describe the correlation between TPG, movable water saturation, and permeability, which performed better than previous models in the literature. These insights will advance the fundamental understanding of TPG in tight gas reservoirs and provide useful guidance on tight gas reservoirs development.

1. Introduction

As an unconventional gas resource, tight gas is widely distributed in major gas-bearing basins worldwide and has become a major focus in global unconventional gas exploration [1,2]. There is an abundance of tight gas in China, mostly in the Ordos Basin, Sichuan Basin, Qaidam Basin, and other basins, and production nowadays is increasing rapidly [3]. In recent years, the increasing development of tight gas reservoirs has promoted fundamental research into the flow characteristics of such reservoirs. It is well known that tight reservoirs are characterized by low porosity, ultra-low permeability, and high water saturation (The fraction of water in a given pore space), and the flow characteristics of tight reservoirs are very different from those of conventional reservoirs [4,5].
When gas flows in a tight reservoir, additional momentum is added due to the slip effect, while as gas flows in a water-bearing reservoir, additional resistance is created because of the Jamin effect (The presence of bubbles can retard the flow of water as it progresses through the pore throat of small diameter. The Jamin effect is defined as the resistance to flow under pressure through the smaller pore throat [6]). The two together make gas flow deviate from Darcy’s law and show non-Darcy flow characteristics [7]. During the water-driven development of tight gas reservoirs, the gas–water two-phase flow area continues to expand as the edge-bottom water gradually invades [8]. Compared with dry cores or low water saturation cores, the gas phase permeability of cores under high water saturation will be much smaller, with a difference of 10–1000 times, and the water saturation has a significant influence on the reservoir flow characteristics [9]. Tight gas reservoirs generally have a high water saturation, and gas–water interactions can cause the threshold pressure gradient (TPG) effect. The gas-phase TPG is the critical pressure gradient for gas flow when the two phases coexist [10,11], and the accurate description of TPG is an important prerequisite to understanding the gas–water two-phase flow characteristics in tight gas reservoirs.
Recent studies on TPG have shown that TPG increases with permeability decrease or water saturation increase [12]. Liu et al. [13] have pointed out that the minimal TPG of low-permeability tight gas reservoirs is a power function of flow rate in the gas–water two-phase case. Several scholars have studied the relationship between TPG and permeability and water saturation, proposing different models for predicting gas-phase TPG, which are broadly divided into two categories: single-factor variables and two-factor variables, as shown in Table 1.
Although the TPG effect has been extensively studied, there is still room for improvement. Current TPG prediction formulas, such as those listed in Table 1, mainly consider the effect of permeability or water saturation. However, the continuity of the gas phase is directly related to the TPG; the water saturation is the same, but the irreducible water saturation (Swi) and the moveable water saturation (Swm) are not necessarily the same. Therefore, the continuity of the gas phase in the reservoir cannot be accurately characterized by using the water saturation alone. Several studies show that the main source of water production is movable water trapped in reservoir pores, which will turn the gas single-phase flow into a gas–water two-phase flow [23,24]. Consequently, the objective of this work is to study the influence of movable water saturation on TPG experimentally and theoretically. These insights will advance the fundamental understanding of gas–water storage and transport mechanisms in tight gas reservoirs.

2. Materials and Methods

2.1. Experimental Materials

Core plugs used in this work were selected from the Daniudi gas field, located in the northern-eastern part of the Ordos Basin, China, which is a typical tight sandstone gas reservoir. The basic properties of the used core plugs are given in Table 2. The synthesized formation water was prepared to mimic the in situ water chemistry in the Daniudi gas field. As is shown in Table 3, the water type was CaCl2. Nitrogen (with a purity of 99.999%) was used to represent methane in this work.

2.2. Movable Water Saturation Measurement

NMR is a powerful, nondestructive technique for obtaining reservoir parameters, including porosity, permeability, irreducible water saturation, etc. [25,26,27]. Herein, NMR is used to determine the movable water saturation inside the tight sandstone core plugs, according to the following procedures:
(1)
Heat the selected core plug in a vacuum oven at 65 °C until the mass reaches constant, then record the final core plug weight;
(2)
Vacuum the heated core plug for over 12 h, and saturate it with the synthesized formation water until the core plug weight maintained constant. Subsequently, the saturated core plug is placed in the NMR instrument to obtain the T2 spectrum curve;
(3)
After the NMR measurement, weigh the core plug to make sure the water saturation does not change. Then transfer the saturated core plug into a core holder immediately for gas flooding under specific flowrates and confining pressure conditions until the prescribed water saturation is achieved. In order to achieve a relatively uniform distribution of irreducible water, the gas flooding direction is shifted periodically;
(4)
After gas flooding, the core plug is taken out of the core holder and weighed; then, repeat the NMR test.

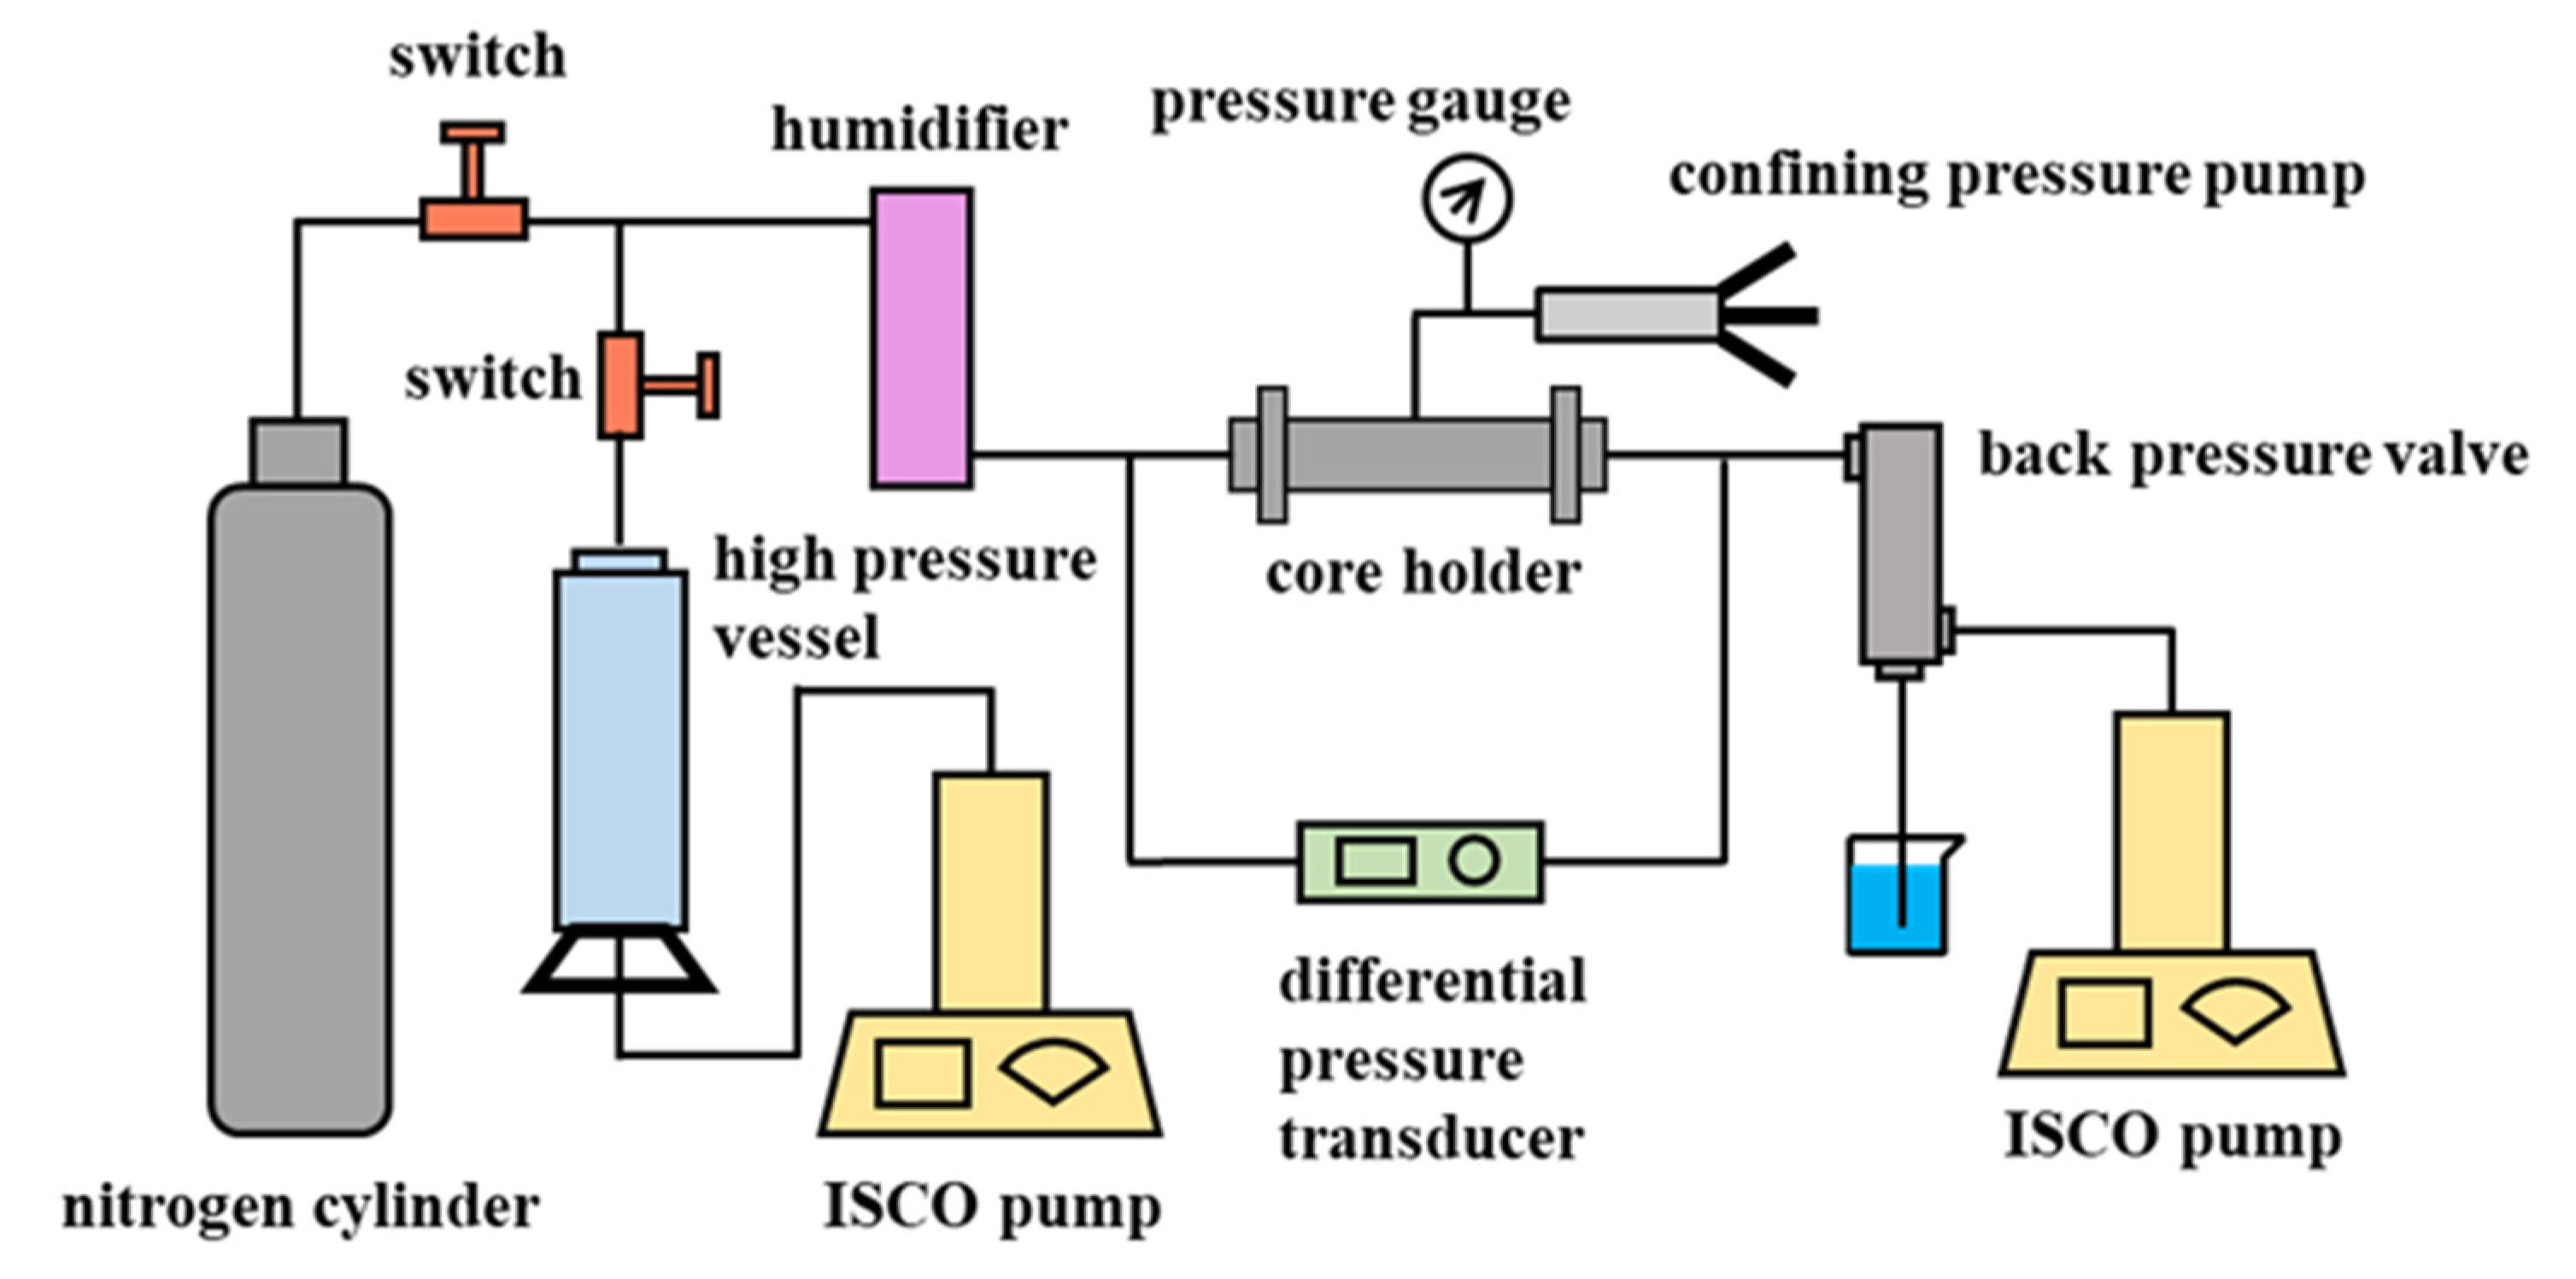
2.3. TPG Measurement

The experiment is carried out using the air bubble method [21]. Briefly, increase the upstream pressure gradually; the injected gas enters the pore when the pressure exceeds a certain value. Due to the transfer of pressure, the gas in the pore will flow slowly and transfer to the outlet end of the core plug. Record the pressure at the moment a bubble appears; that is, the threshold pressure.
The schematic of the TPG experimental setup is shown in Figure 1. The specific experimental procedures are demonstrated as follows:
(1)
After the NMR test, the core plug is ready for further gas displacement experiments under various displacement pressures depending on different core plug permeabilities;
(2)
Calibrate the instrument, and then synchronously increase the confining pressure and back pressure at an incremental of 2 MPa pressure and 30 min duration, the back pressure is increased to 18 MPa, and the confining pressure is increased to 22 MPa;
(3)
The pressure difference is started at 0.001 MPa and increased to the maximum set value. At each pressure, the pressure is stabilized for 5 h until the bubble in the beaker appears. Then the pressure gradient at the moment is regarded as the TPG. Otherwise, gradually increase the pressure difference until a bubble appears.
(4)
Release the system pressure, take out the core plug and measure the weight. If the difference in water saturation is less than 2%, then these experimental data are considered reliable. Otherwise, adjust the pressure difference, and repeat steps (1) to (3).
In order to match the actual formation conditions and ensure that there is only one single gas phase flow in the core plug, the water saturation should be kept at a constant value during the experiment. The injection pressure is gradually increased to avoid excessive pressure differences between the two ends of the core plug, which could cause water to start flowing in the pores. After the TPG experiment, if the difference in water saturation is less than 2%, then we consider that there is only one single gas phase flow during the experiment. Otherwise, there might be gas–water two-phase flow in the core plug, and the experiment must be restarted.

3. Results and Discussions

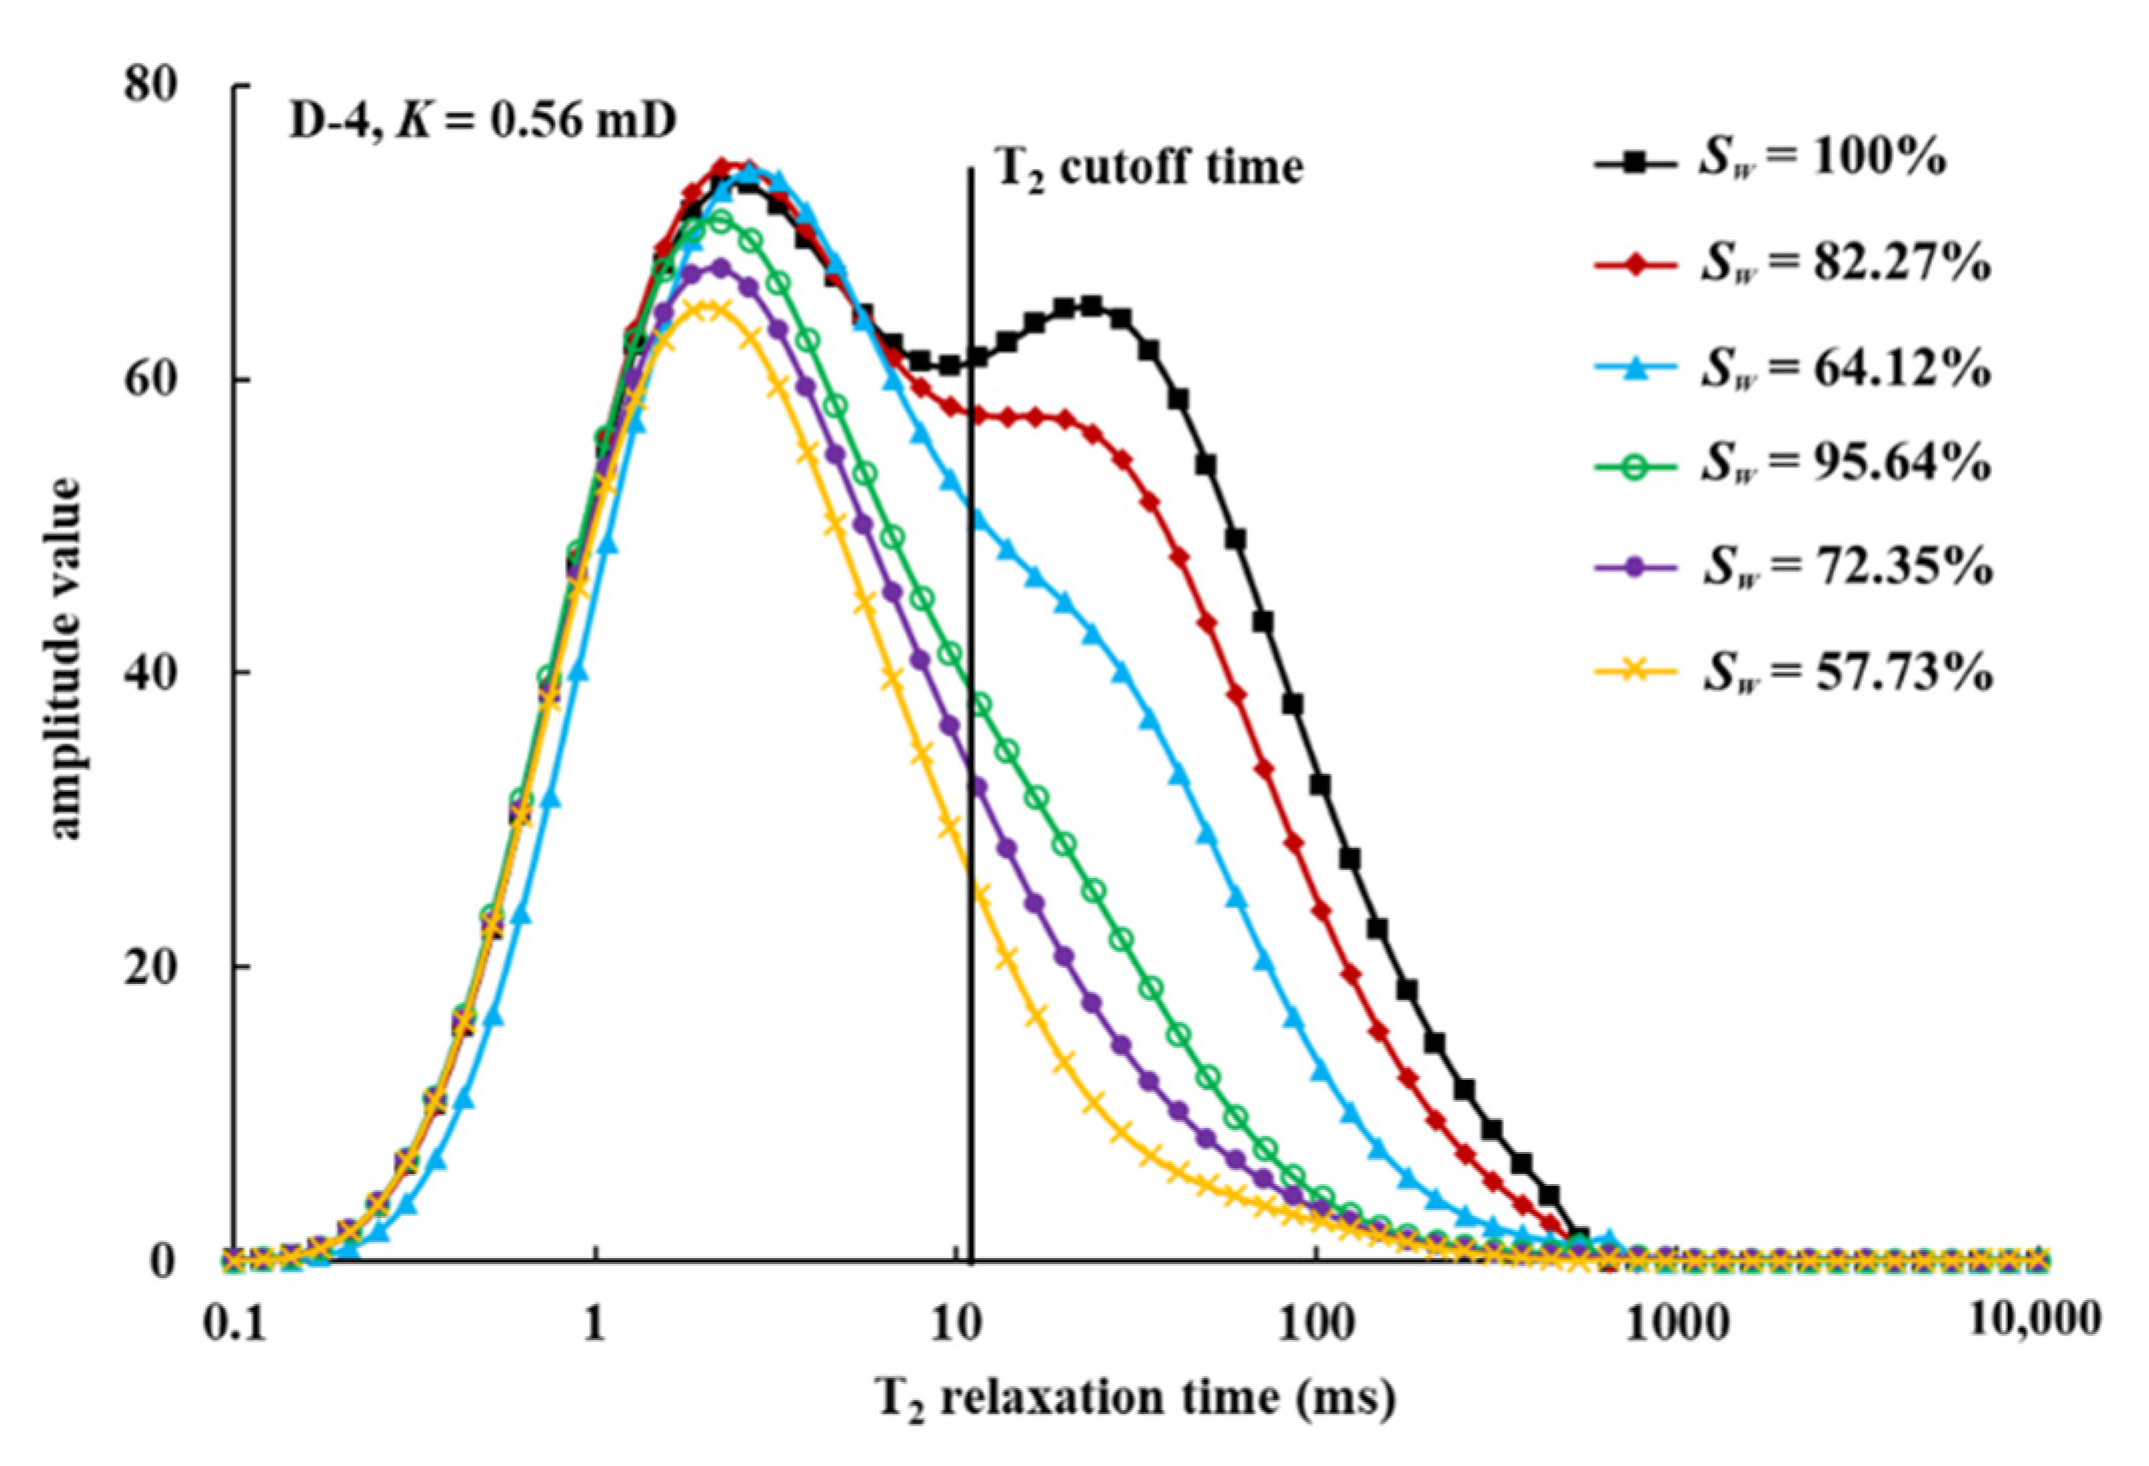
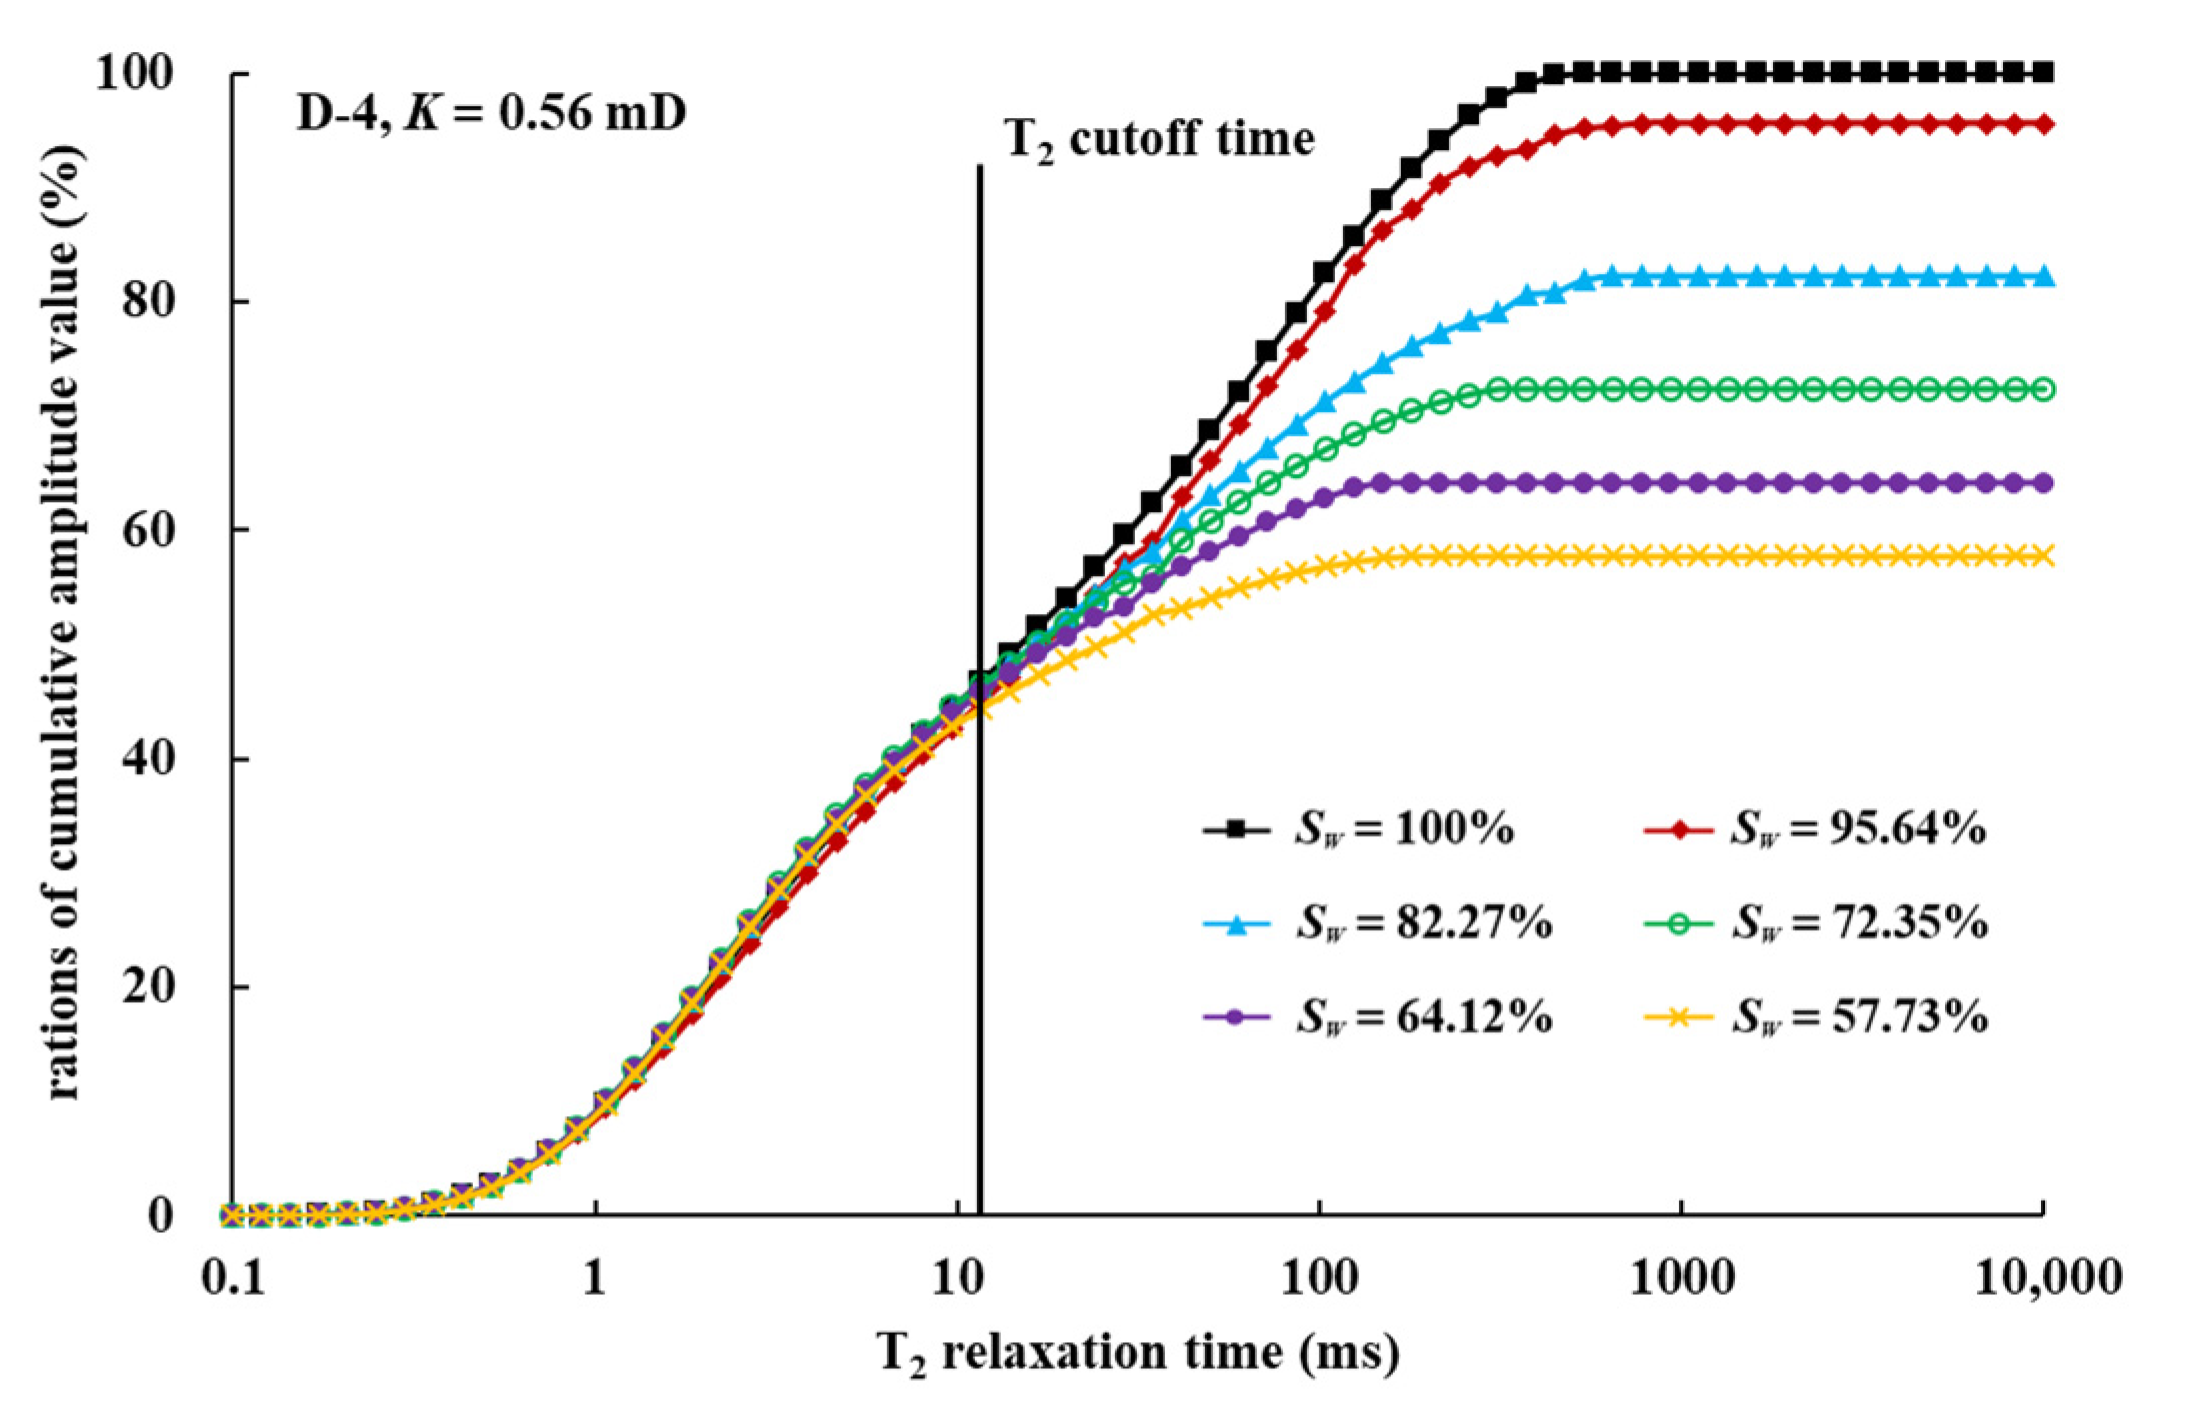
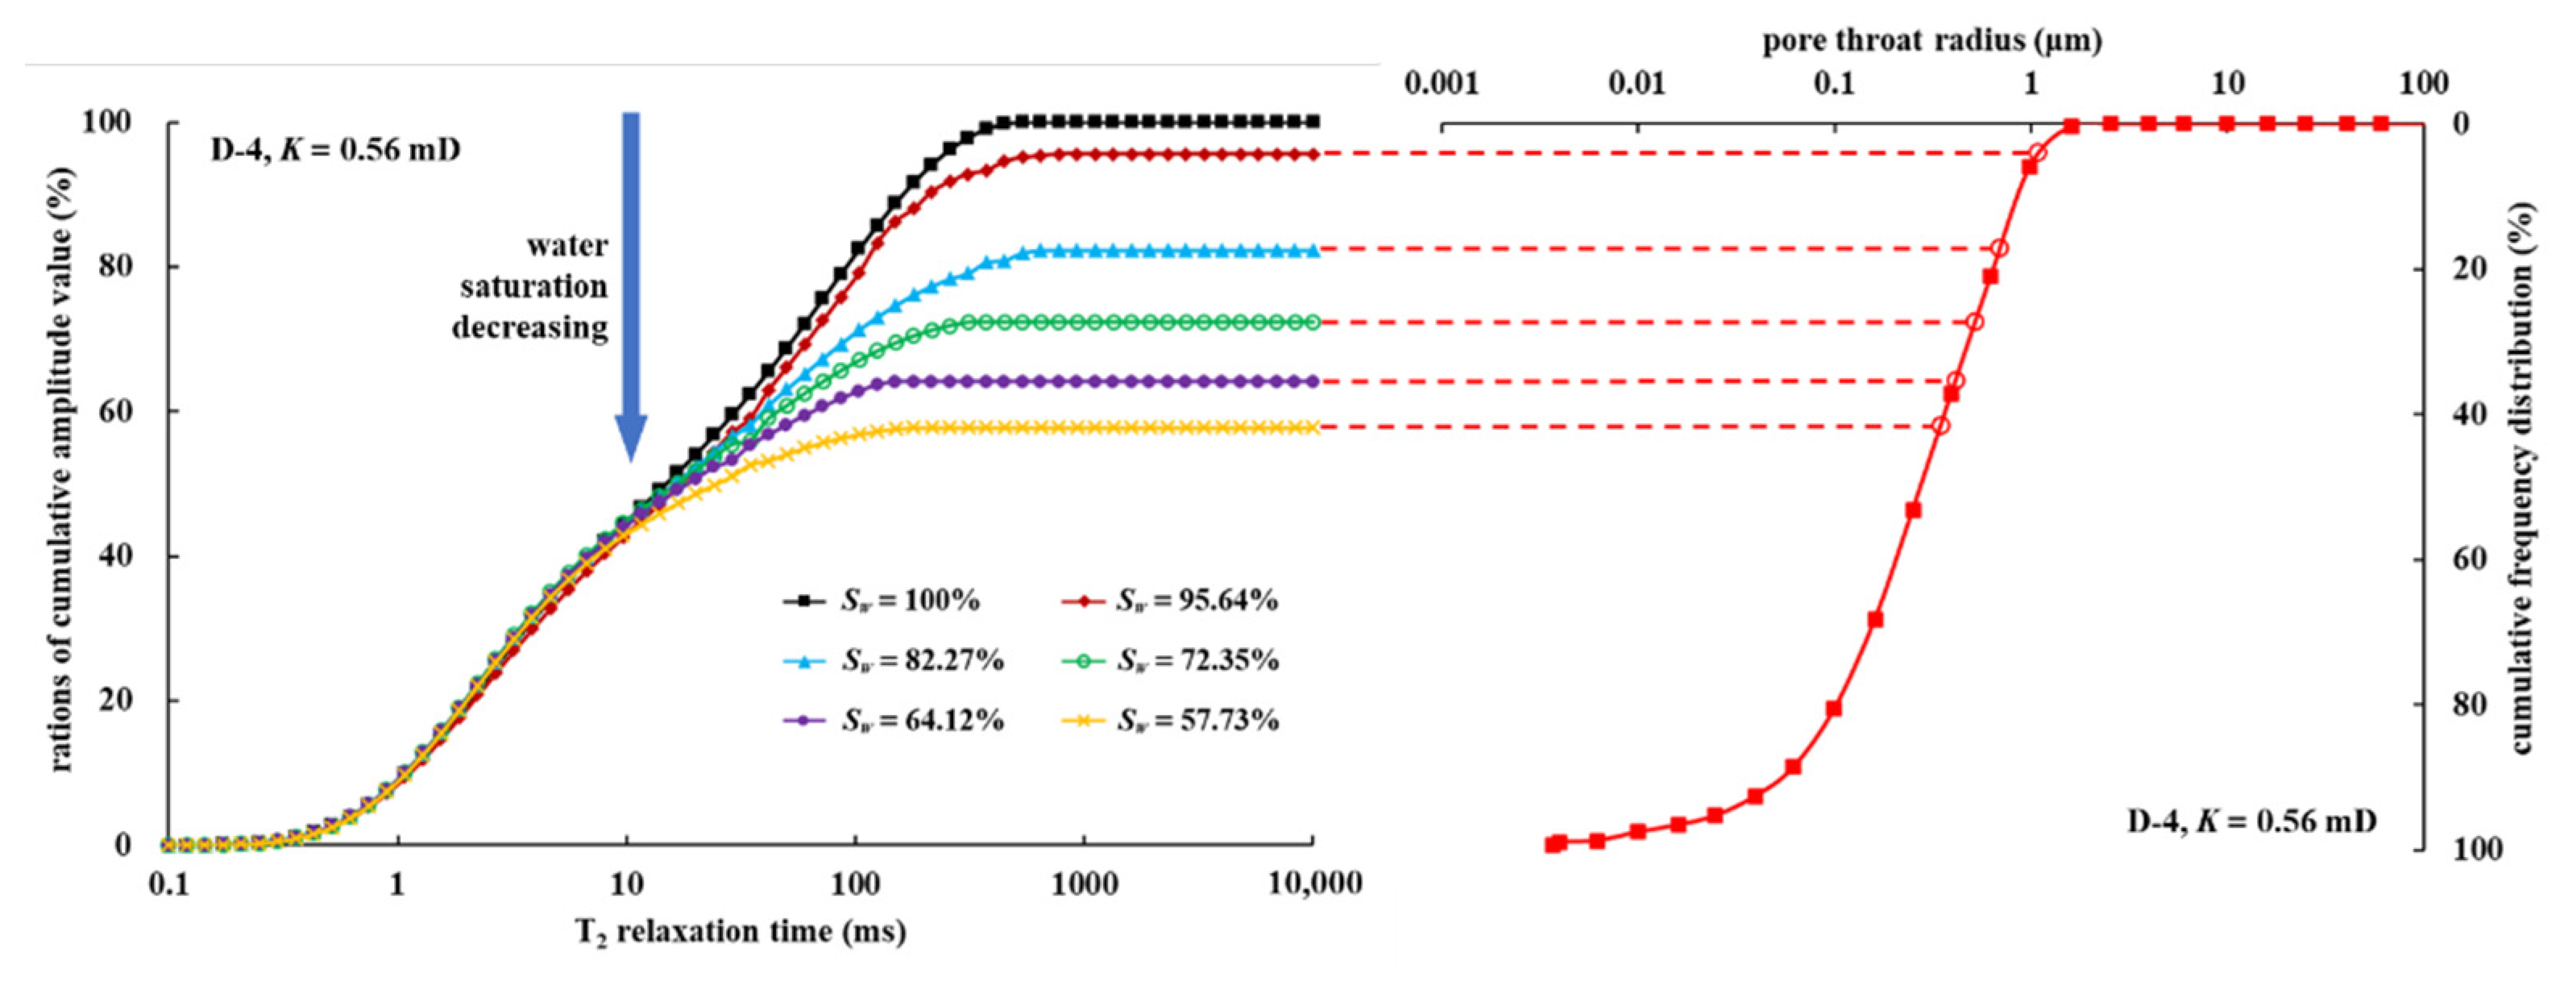
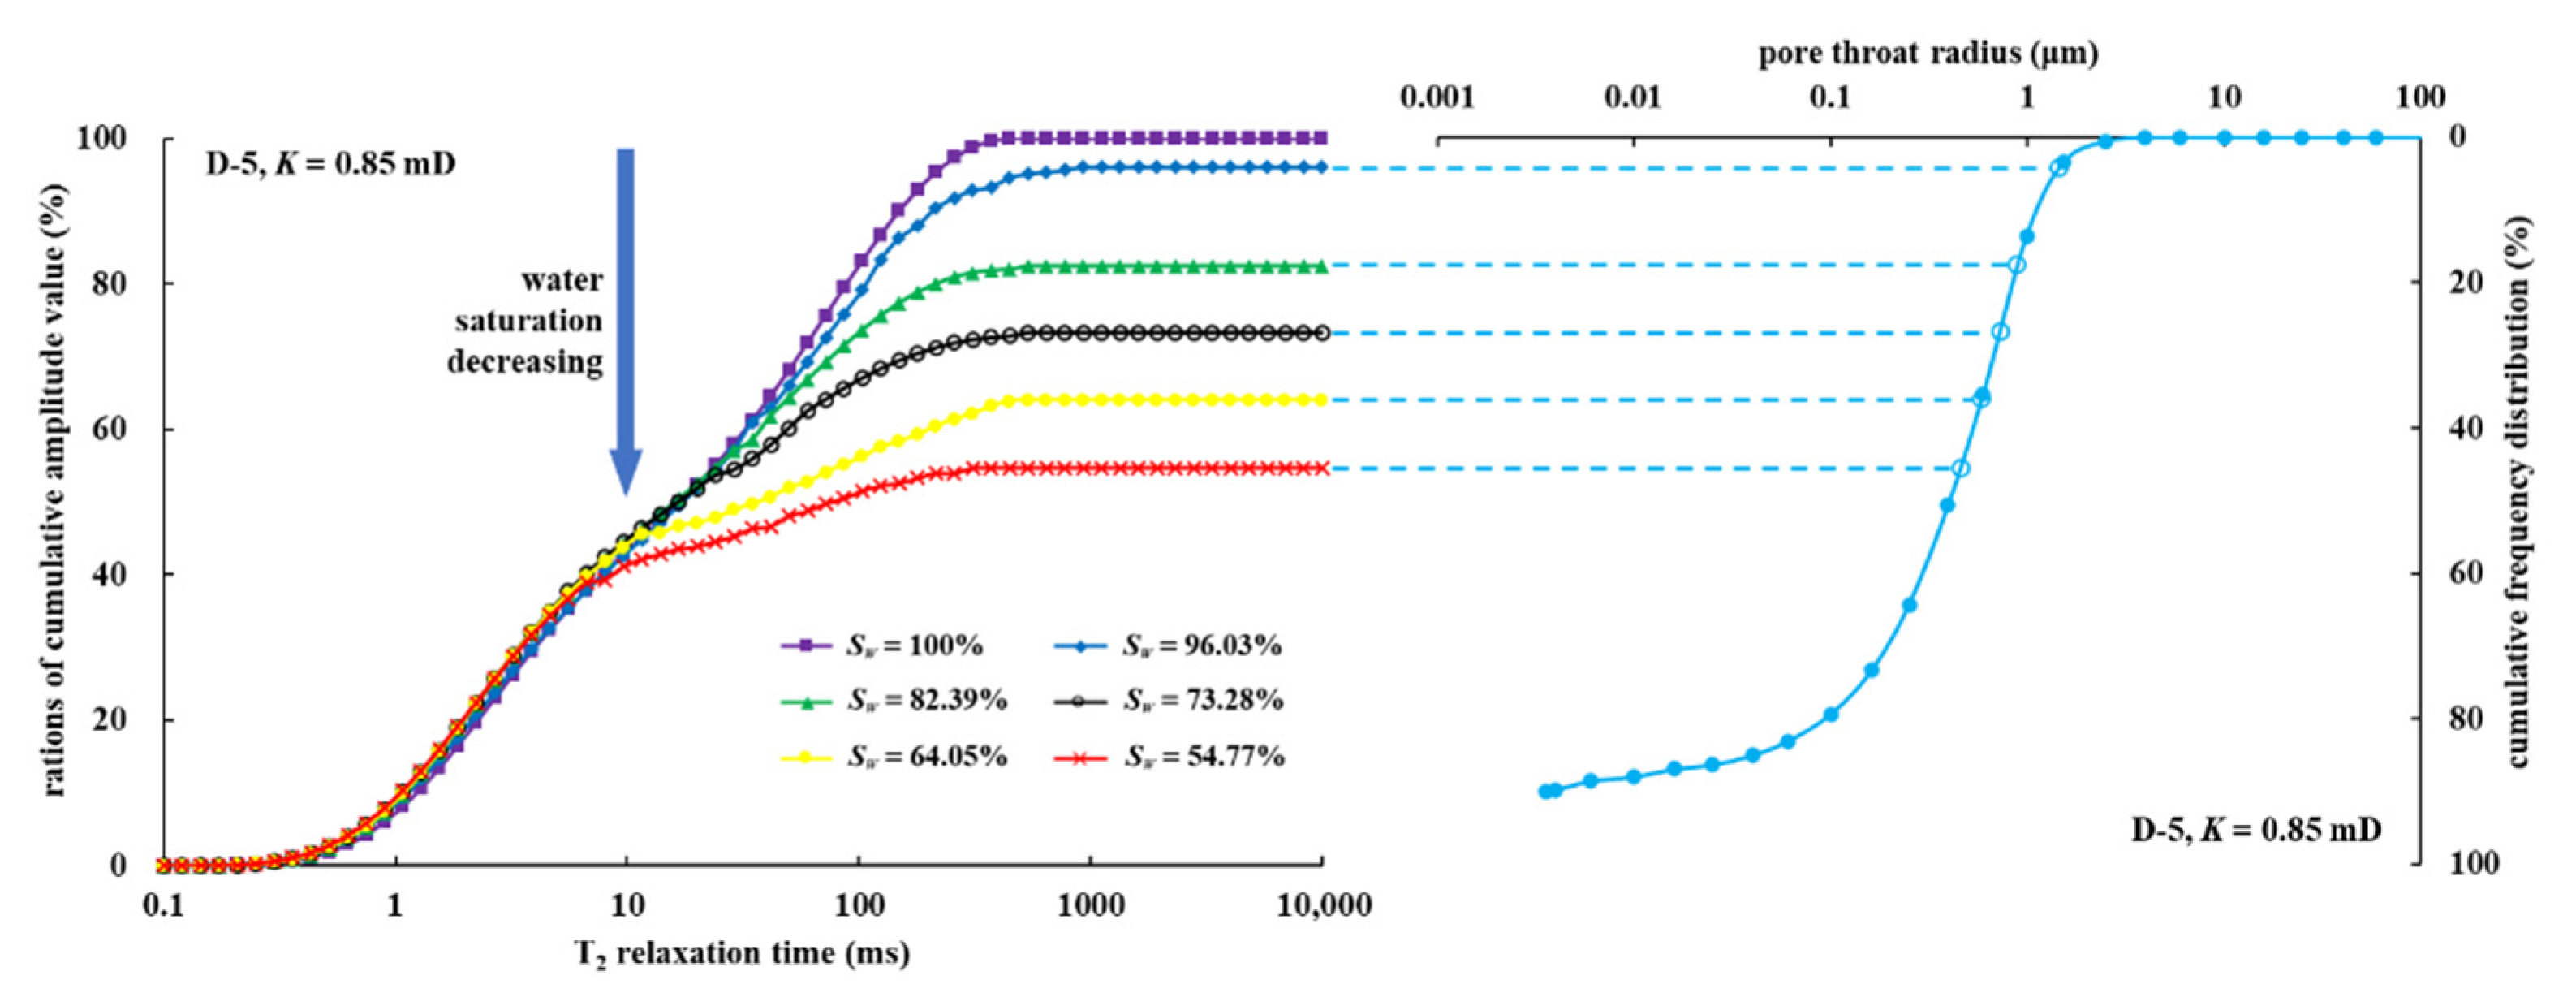
3.1. Movable Water Saturation
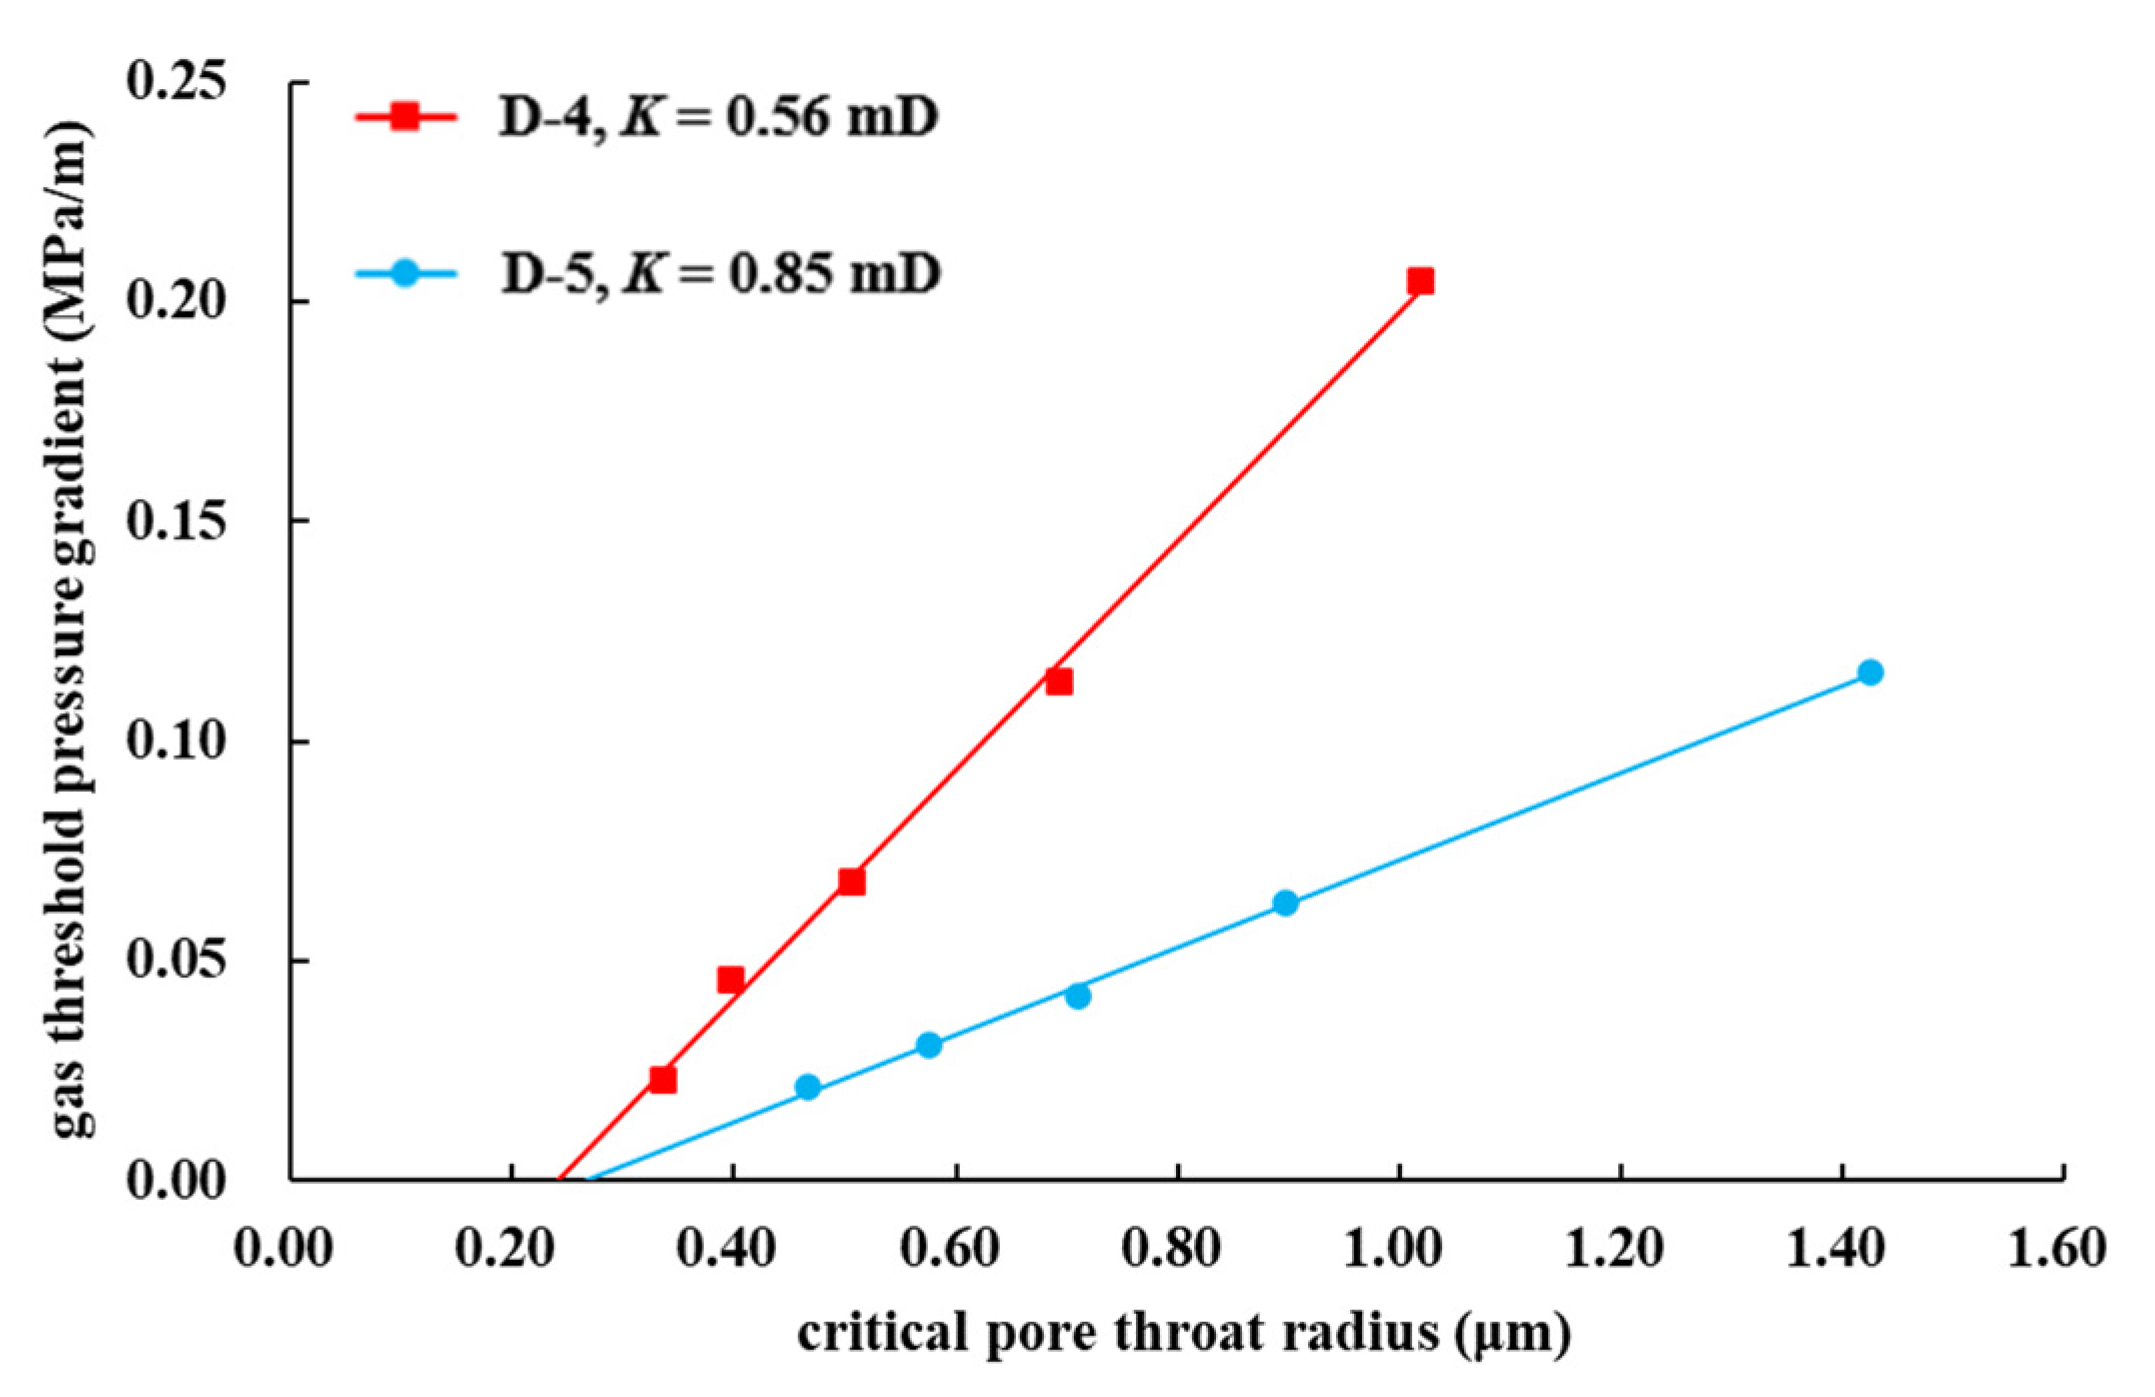
In order to study the TPG effect in tight gas reservoirs under certain water saturation, five core plugs at different water saturation levels were selected for the NMR test. The NMR test is a more effective method to look into the pore structure of porous media and the flow characteristics of the fluids in them [24].
The T2 spectrum curve and cumulative curve of core plug D-4 are shown in Figure 2 and Figure 3. When the core plug is fully saturated (Sw = 100%), as shown in Figure 2, the curve reflects the total volume of water in the pore space, while the area enclosed by the curve and the horizontal axis represents the total pore volume of the core plug. Meanwhile, the enclosed area of different T2 spectral curves in Figure 2 represents the pore space filled by water in that state [22].
The T2 cutoff time of the core plugs from the Daniudi gas field is between 12 to 16 ms. The area surrounded by the right side of the T2 cutoff calibration line and the T2 spectral line is the movable water saturation, and the rest is the irreducible water saturation [28]. In Figure 3, the difference between the final cumulative amplitude value and the corresponding cumulative amplitude value of the T2 cutoff time is the movable water saturation value of the core plug [29].
The T2 spectrum curve in Figure 2 has a bimodal shape, and according to the principles of the NMR test, the area of the left peak represents the irreducible water content, and the area of the right peak represents the movable water content. The area between adjacent T2 spectra curves represents the amount of water change in the core plug [29], which can be analyzed to determine which part of the water accounts for the greater percentage. The water saturation and moveable water saturation of the five core plugs are shown in Table 4.
For example, in Figure 2, as the water saturation changes from 100% to 57.73% in the core plug D-4, the enclosed area of the left peak decreases by a small margin, while that of the right peak decreases more significantly. This indicates that there is little change in the irreducible water, and it is mainly the moveable water that changes as the water saturation of the core plug decreases. The gas in the tight reservoir is mainly stored in the large pores, and the dominant channel for gas flow consists of the large pore throat, which is much more influenced by the moveable water. Thus, compared to irreducible water, movable water dominates the gas–water two-phase flowing in tight reservoirs.
To further investigate the effect of movable water on the TPG, two core plugs were selected for the high-pressure mercury intrusion (HPMI) test to obtain the microscopic pore structure. The HPMI is a powerful technique for the evaluation of capillary pressure, porosity, pore size distribution, and throat size in oil and gas reservoirs [30]. The porosity of core plug D-4 and D-5 is 11.61% and 13.04%, respectively, indicating that they are more porous, and as shown in Figure 4 and Figure 5, the pore throat radii for core plug D-4 and D-5 are mainly distributed in the range of 0.0003–1.0 µm, and over 60% of them are greater than 0.5 μm.
In order to explore the distribution of water in the core plug, the T2 spectrum accumulation curve and pore throat distribution accumulation curve were combined for analysis [31]. Each T2 spectrum accumulation curve is extended horizontally to the right to form a set of horizontal lines with various water saturations. Then superimpose the T2 spectrum accumulation curve on the pore throat distribution accumulation curve (inverted), with the line of 100% water saturation coinciding with the horizontal axis, and the two curves have the same vertical axis, as shown in Figure 4 and Figure 5. The intersection of the horizontal lines and the pore throat distribution accumulation curve is the critical pore throat radius, and water in pore spaces with a radius less than this critical value will not be driven out under the corresponding pressure difference.
Figure 6 shows the relationship between TPG and critical pore throat radius. A linear fit was made to the points to obtain the intersection point with the horizontal axis. The points on the same line represent different water saturation. As the gas drive pressure increases, the water in the large pore space is driven out first, followed by the water in the small pore space. In Figure 4 and Figure 5, high water saturation corresponds to a large critical pore throat, and low water saturation corresponds to a small critical pore throat, and for the various scales of pore spaces, there is a minimum radius at which water in pore spaces with a radius less than this value will not be driven out. The intersection point value is the minimal critical pore throat radius.
In the T2 spectrum curve of core plugs D-4 and D-5, the T2 cutoff time is between 12 ms and 16 ms, and the corresponding pore radius values are approximately the same as the intersection values in Figure 6. In the core plug D-4, for example, this value is approximately 0.24 μm. Pores with a radius greater than 0.24 μm are considered the large pores in the core plug D-4, and the movable water is in large pores. The gas-phase TPG in tight reservoirs is closely related to movable water.
Water is one of the main factors affecting TPG [32]. As shown in Figure 7, when the water saturation of the core plug is less than a certain value, TPG drops to zero and does not exist. When the water saturation increases and the critical pore throat radius exceeds the intersection value, TPG is generated. As the water saturation continues increasing, the critical pore throat radius increases, i.e., the pore space for water flowing decreases further. Thus gas in the core plug is difficult to form a continuous phase but is divided into small bubbles, which causes an increase in TPG. The lower the permeability of the core plug, the more pronounced this phenomenon becomes.

3.2. TPG Discussion

Figure 8 shows the relationship curve between TPG and water saturation, and Figure 9 shows the relationship curve between TPG and movable water saturation. According to Figure 8, a decrease in core plug permeability or an increase in water saturation leads to an increase in TPG. It is observed that TPG in the lower permeability core plugs is not necessarily greater than that in the higher permeability core plugs, even at the same water saturation. As shown in Figure 8 and Figure 9, the TPG values are nearly zero when the movable water saturation is approximately close to zero. This indicates that the influences caused by movable water and irreducible water on TPG are different; it is further concluded that movable water plays a more important role in TPG than irreducible water [21].
Figure 9 shows the relationship curve between TPG and movable water saturation (Swm). After fitting, it was determined that the power function would work well. Thus, the fitting formulas of different core plugs were obtained as follows in Table 5.
The power coefficients A and B were obtained by fitting and statistically related to the permeability [22]. The fitting formulas between power coefficients A and B and the permeability were obtained as follows:
A = 0.0025 K 0.212 ,
B = 1.0451 K 0.062 ,
The mathematical formula that accounts for movable water saturation and permeability is as follows:
λ = A ( S w m ) B = 0.0025 K 0.212 ( S w m ) 1.0451 K 0.062 ,
where λ is the gas-phase TPG, MPa/m; Swm is the movable water saturation, %; K is the permeability, mD.
Equation (3) takes into account the influence of permeability and movable water saturation on the TPG. Based on Equation (3), the accurate TPG can be calculated for actual reservoirs.
The prediction model of gas-phase TPG by Tian [21] and Li [22] is similar to the model in this study, as it takes into account both permeability and water saturation. It is advisable to adopt the modeling idea of Tian and Li et al. to establish the TPG prediction mathematical formula that considers water saturation and permeability, which is as follows:
λ = A ( S w ) B = 2 × 10 8 K 2.8672 ( S w ) 3.3374 K 0.195
where λ is the gas-phase TPG, MPa/m; Sw is the water saturation, %; K is the permeability, mD.
For the core plug D-4, the predicted values of TPG based on movable water saturation, the predicted values of TPG based on water saturation, and the experimental values were compared, as shown in Figure 10. The predicted values of TPG based on water saturation deviated significantly from the experimental values, while the predicted values of TPG based on movable water saturation were in good agreement with the experimental values. Meanwhile, the correlation coefficient R2 of the TPG prediction formulas based on movable water saturation and water saturation are 0.9591 and 0.5415, respectively, and the former is a better fit and more accurate.
Based on Equations (3) and (4), the predicted values of gas-phase TPG for all experimental groups were obtained, and the mean absolute errors between predicted values and experimental values were then calculated. As shown in Figure 11, the mean absolute errors calculated by the prediction model based on movable water saturation are in the range of 0.009 to 0.023 MPa/m, and the mean absolute errors calculated by the prediction model based on water saturation are in the range of 0.012 to 0.066 MPa/m.
As the water saturation increases, the gas phase changes from continuous to discontinuous, and the TPG rises sharply, resulting in large deviations between the predicted and experimental values. In the case of ultra-high water saturation, the TPG predicted values are not meaningful; while the prediction range is limited to the gas–water two-phase flow area, the prediction results can be more effectively applied.
As a semi-empirical formula, the gas-phase TPG prediction model based on movable water saturation is more accurate and thus provides a theoretical basis for the development plan. At the same time, the statistical method of the TPG prediction in this study can be used for other similar tight gas reservoirs. The prediction model is applicable to the gas–water two-phase flow, not to the oil–water two-phase flow [33]. In the follow-up study, the impact of movable water on TPG in the oil–water system will be explored.

4. Conclusions

TPG is important in tight gas reservoirs. However, the influence of movable water saturation on TPG is unclear, which has limited production capacity prediction, etc. Thus, in this study, impacts of movable water saturation on gas-phase TPG are investigated experimentally and theoretically, and the following conclusions can be drawn:
(1)
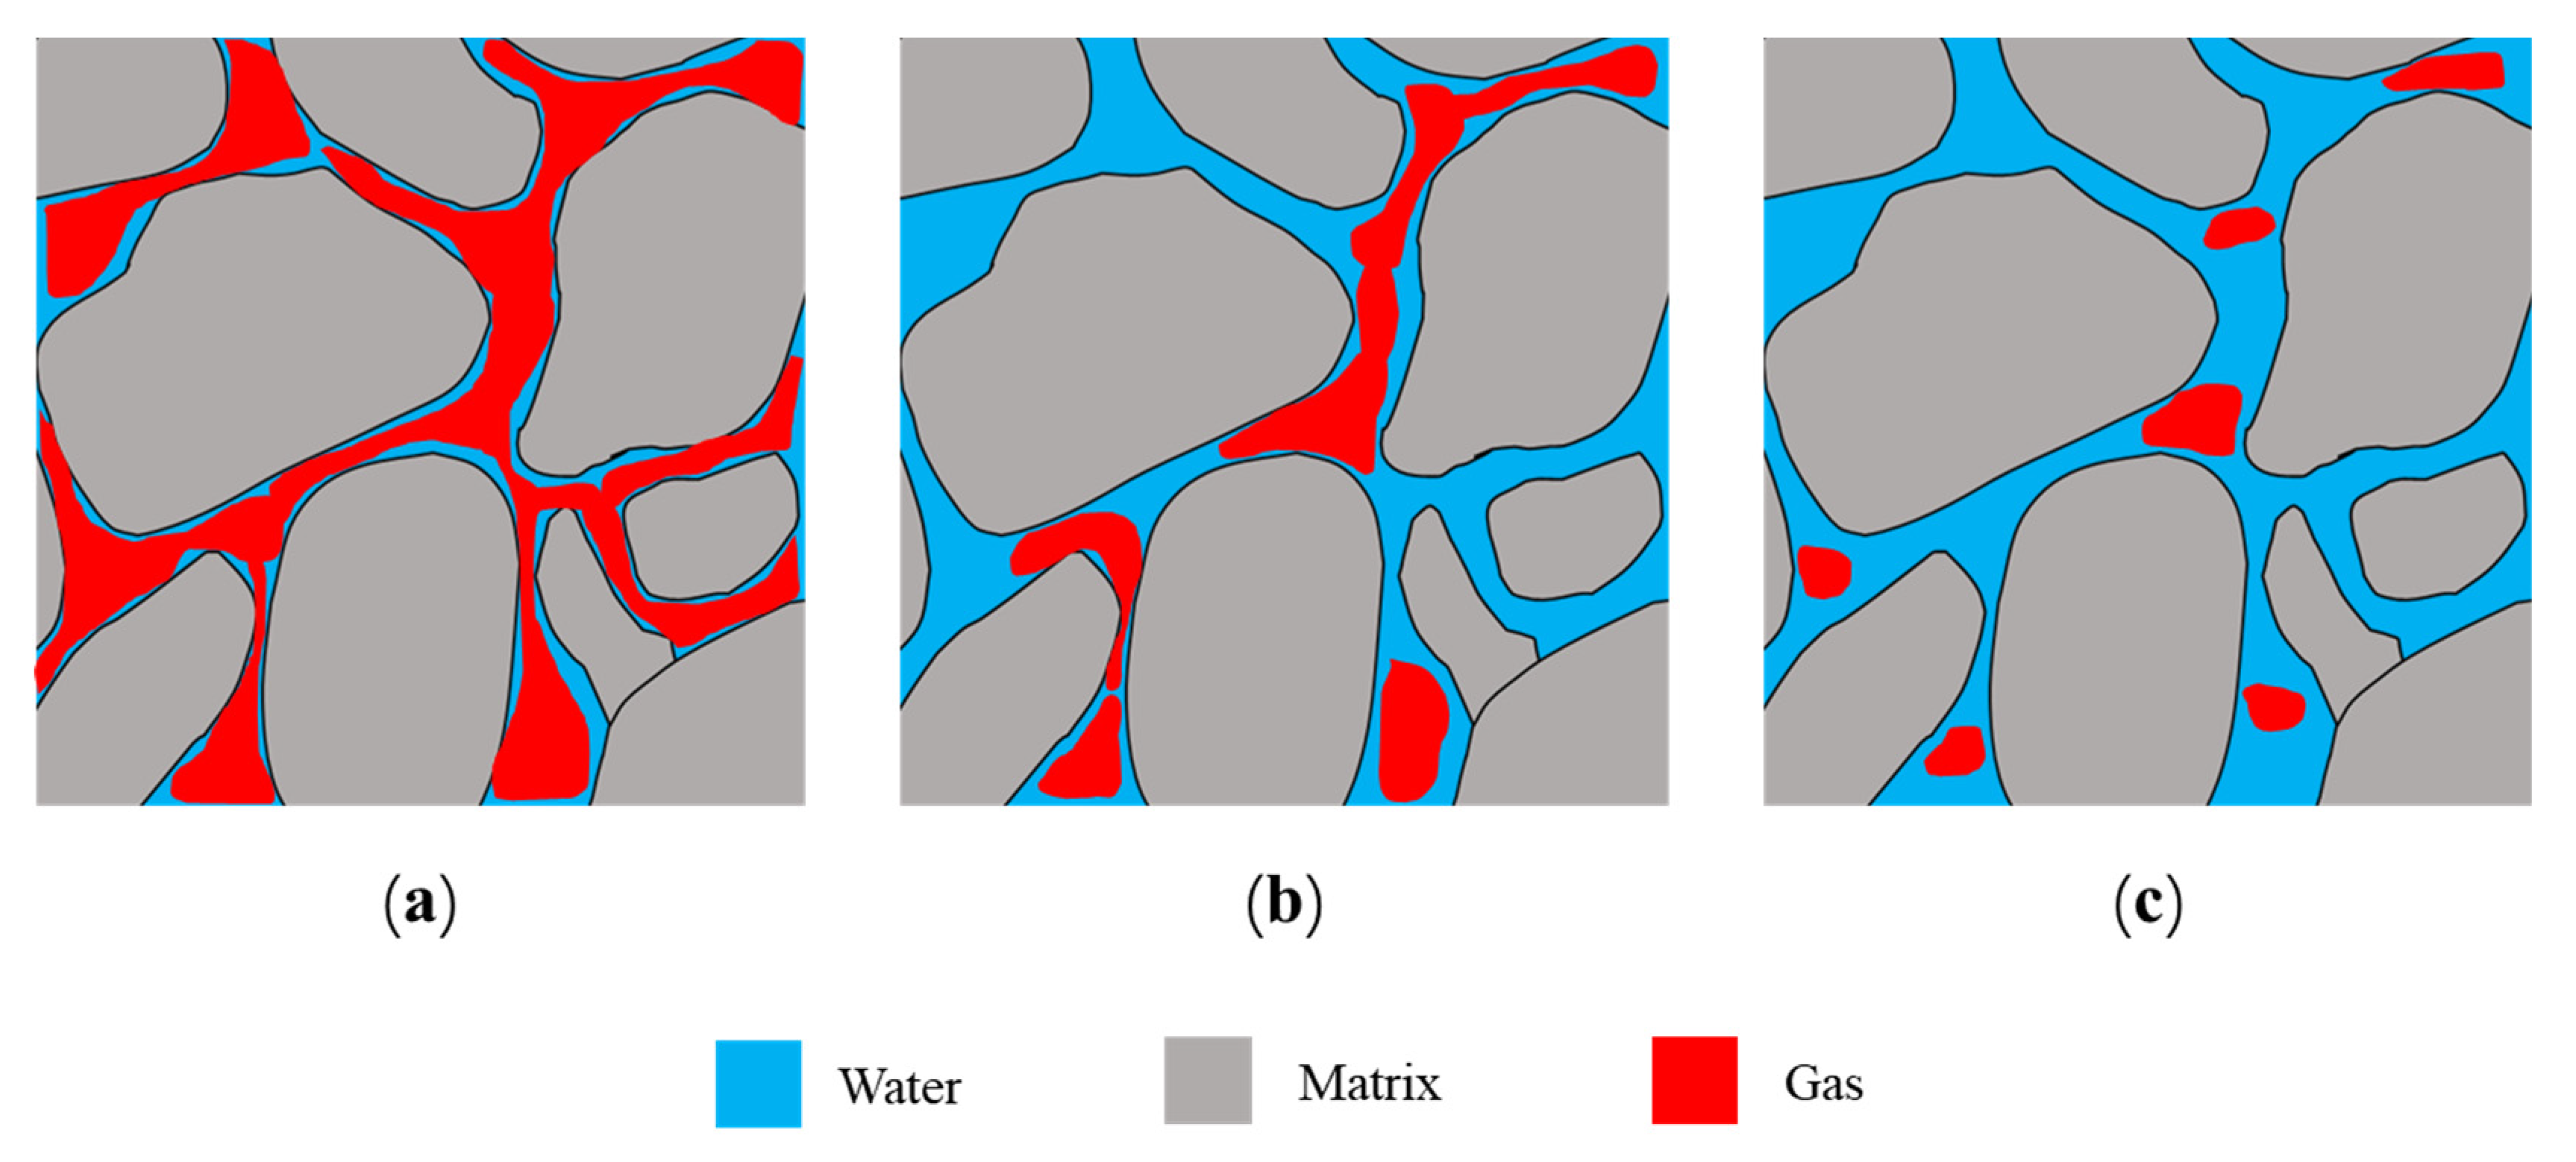
In water-bearing tight gas reservoirs, the gas flow shows non-linear characteristics, which result in the TPG effect. There is an overlap between the dominant channel for gas flow and the movable water distribution areas. The movable water dominates the gas–water two-phase flowing in tight gas reservoirs.
(2)
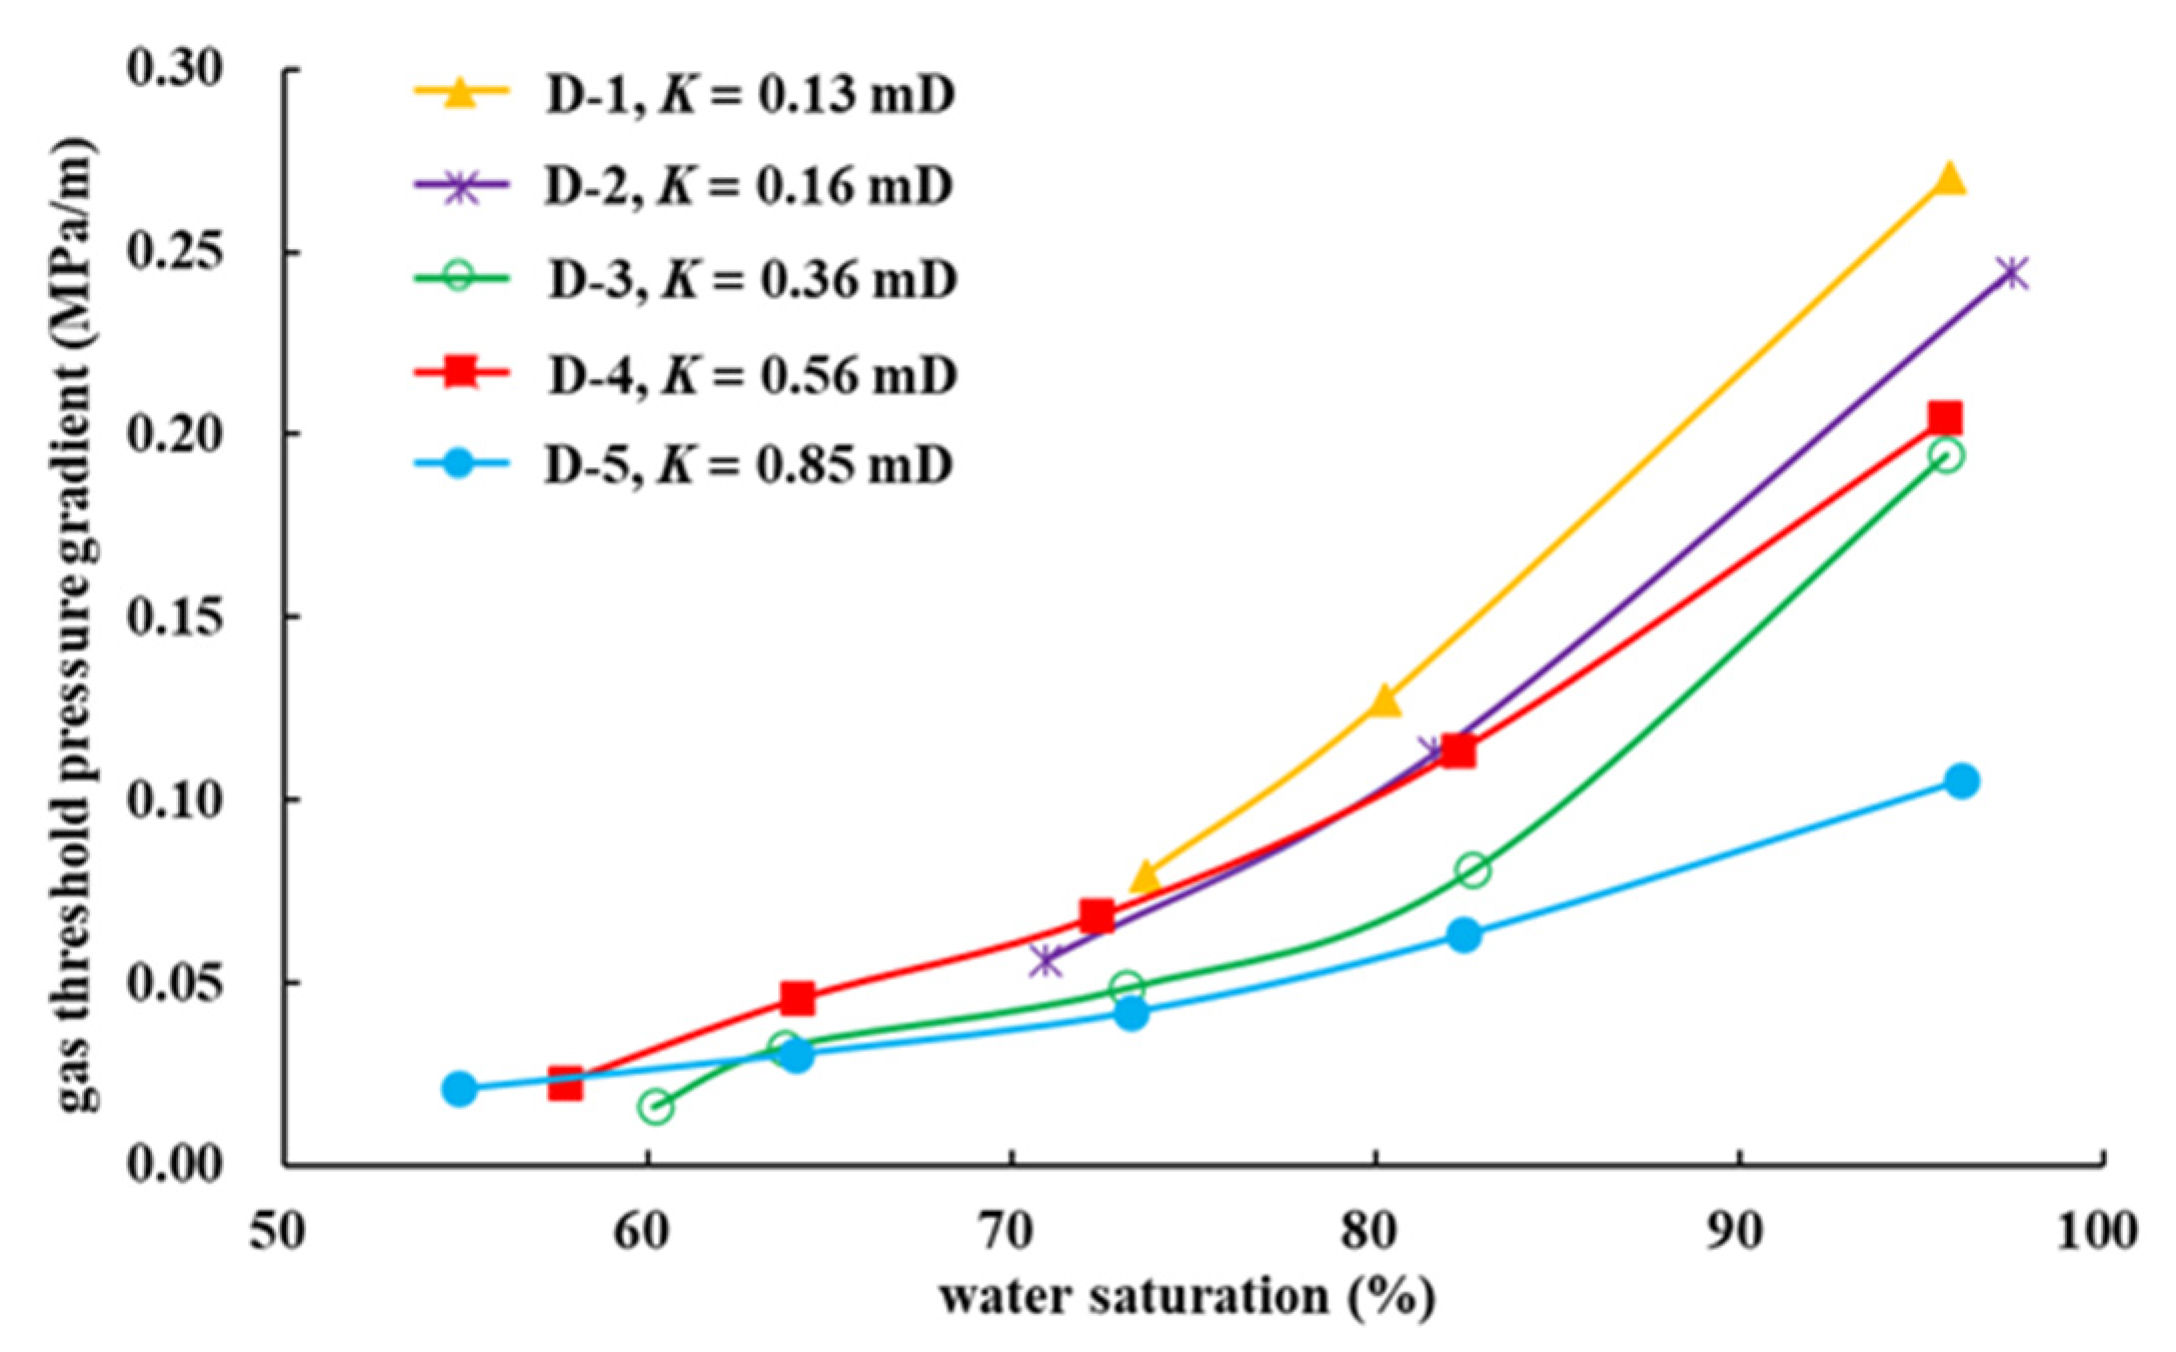
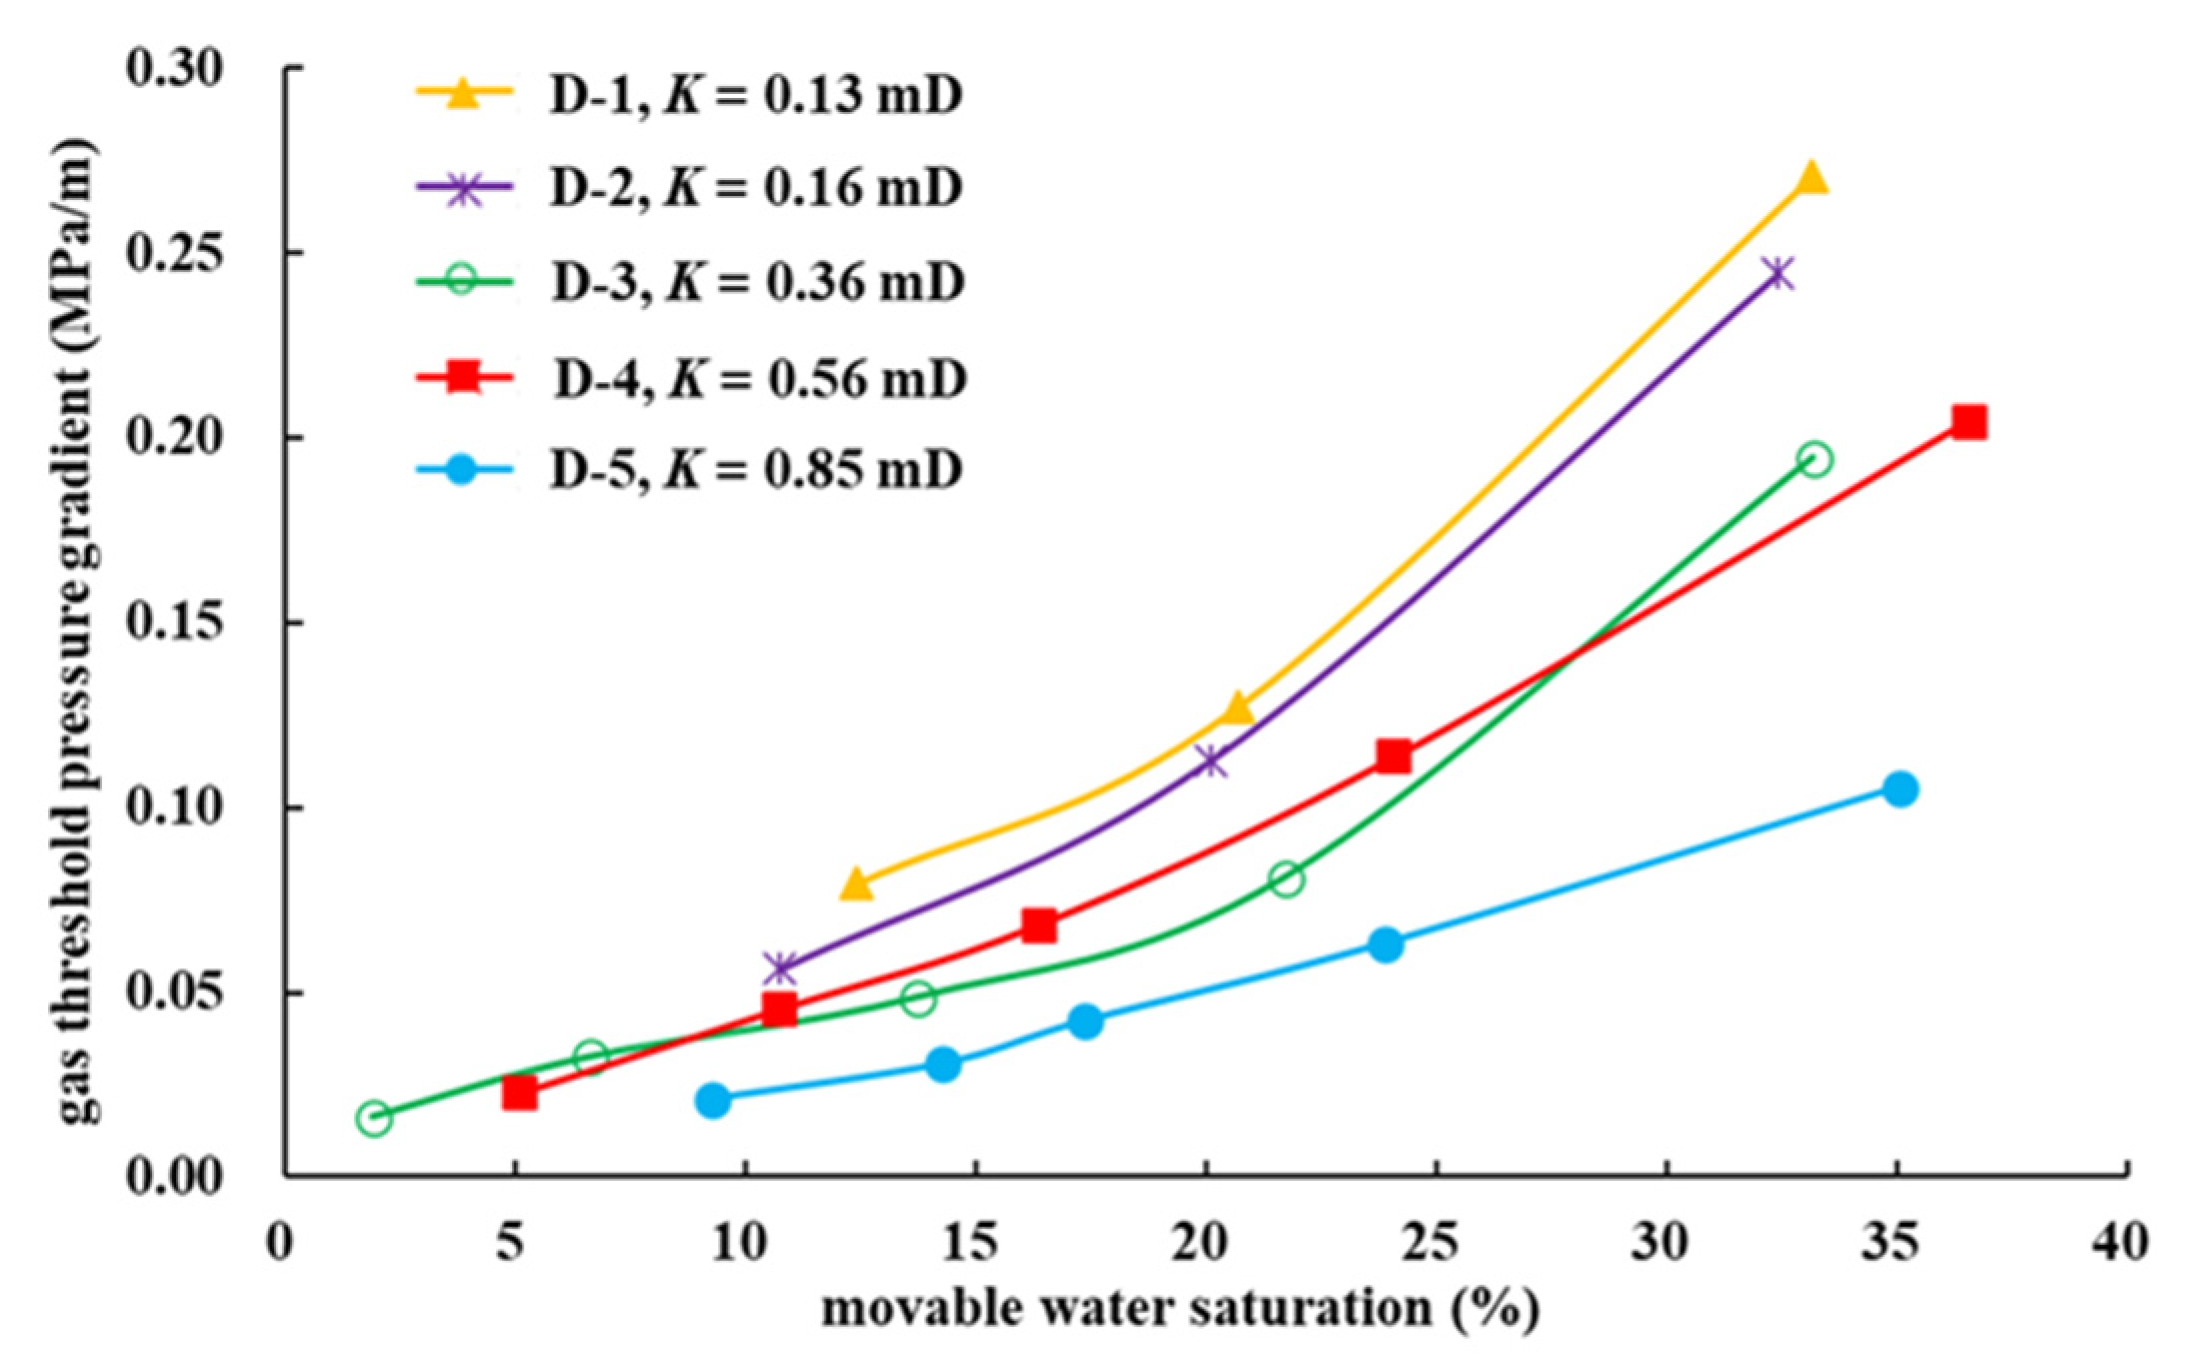
The gas-phase TPG increases with either an increase in movable water saturation or a decrease in core plug permeability. Movable water is an important cause of gas-phase TPG. Compared to water saturation, movable water saturation describes the variation of gas-phase TPG more accurately.
(3)
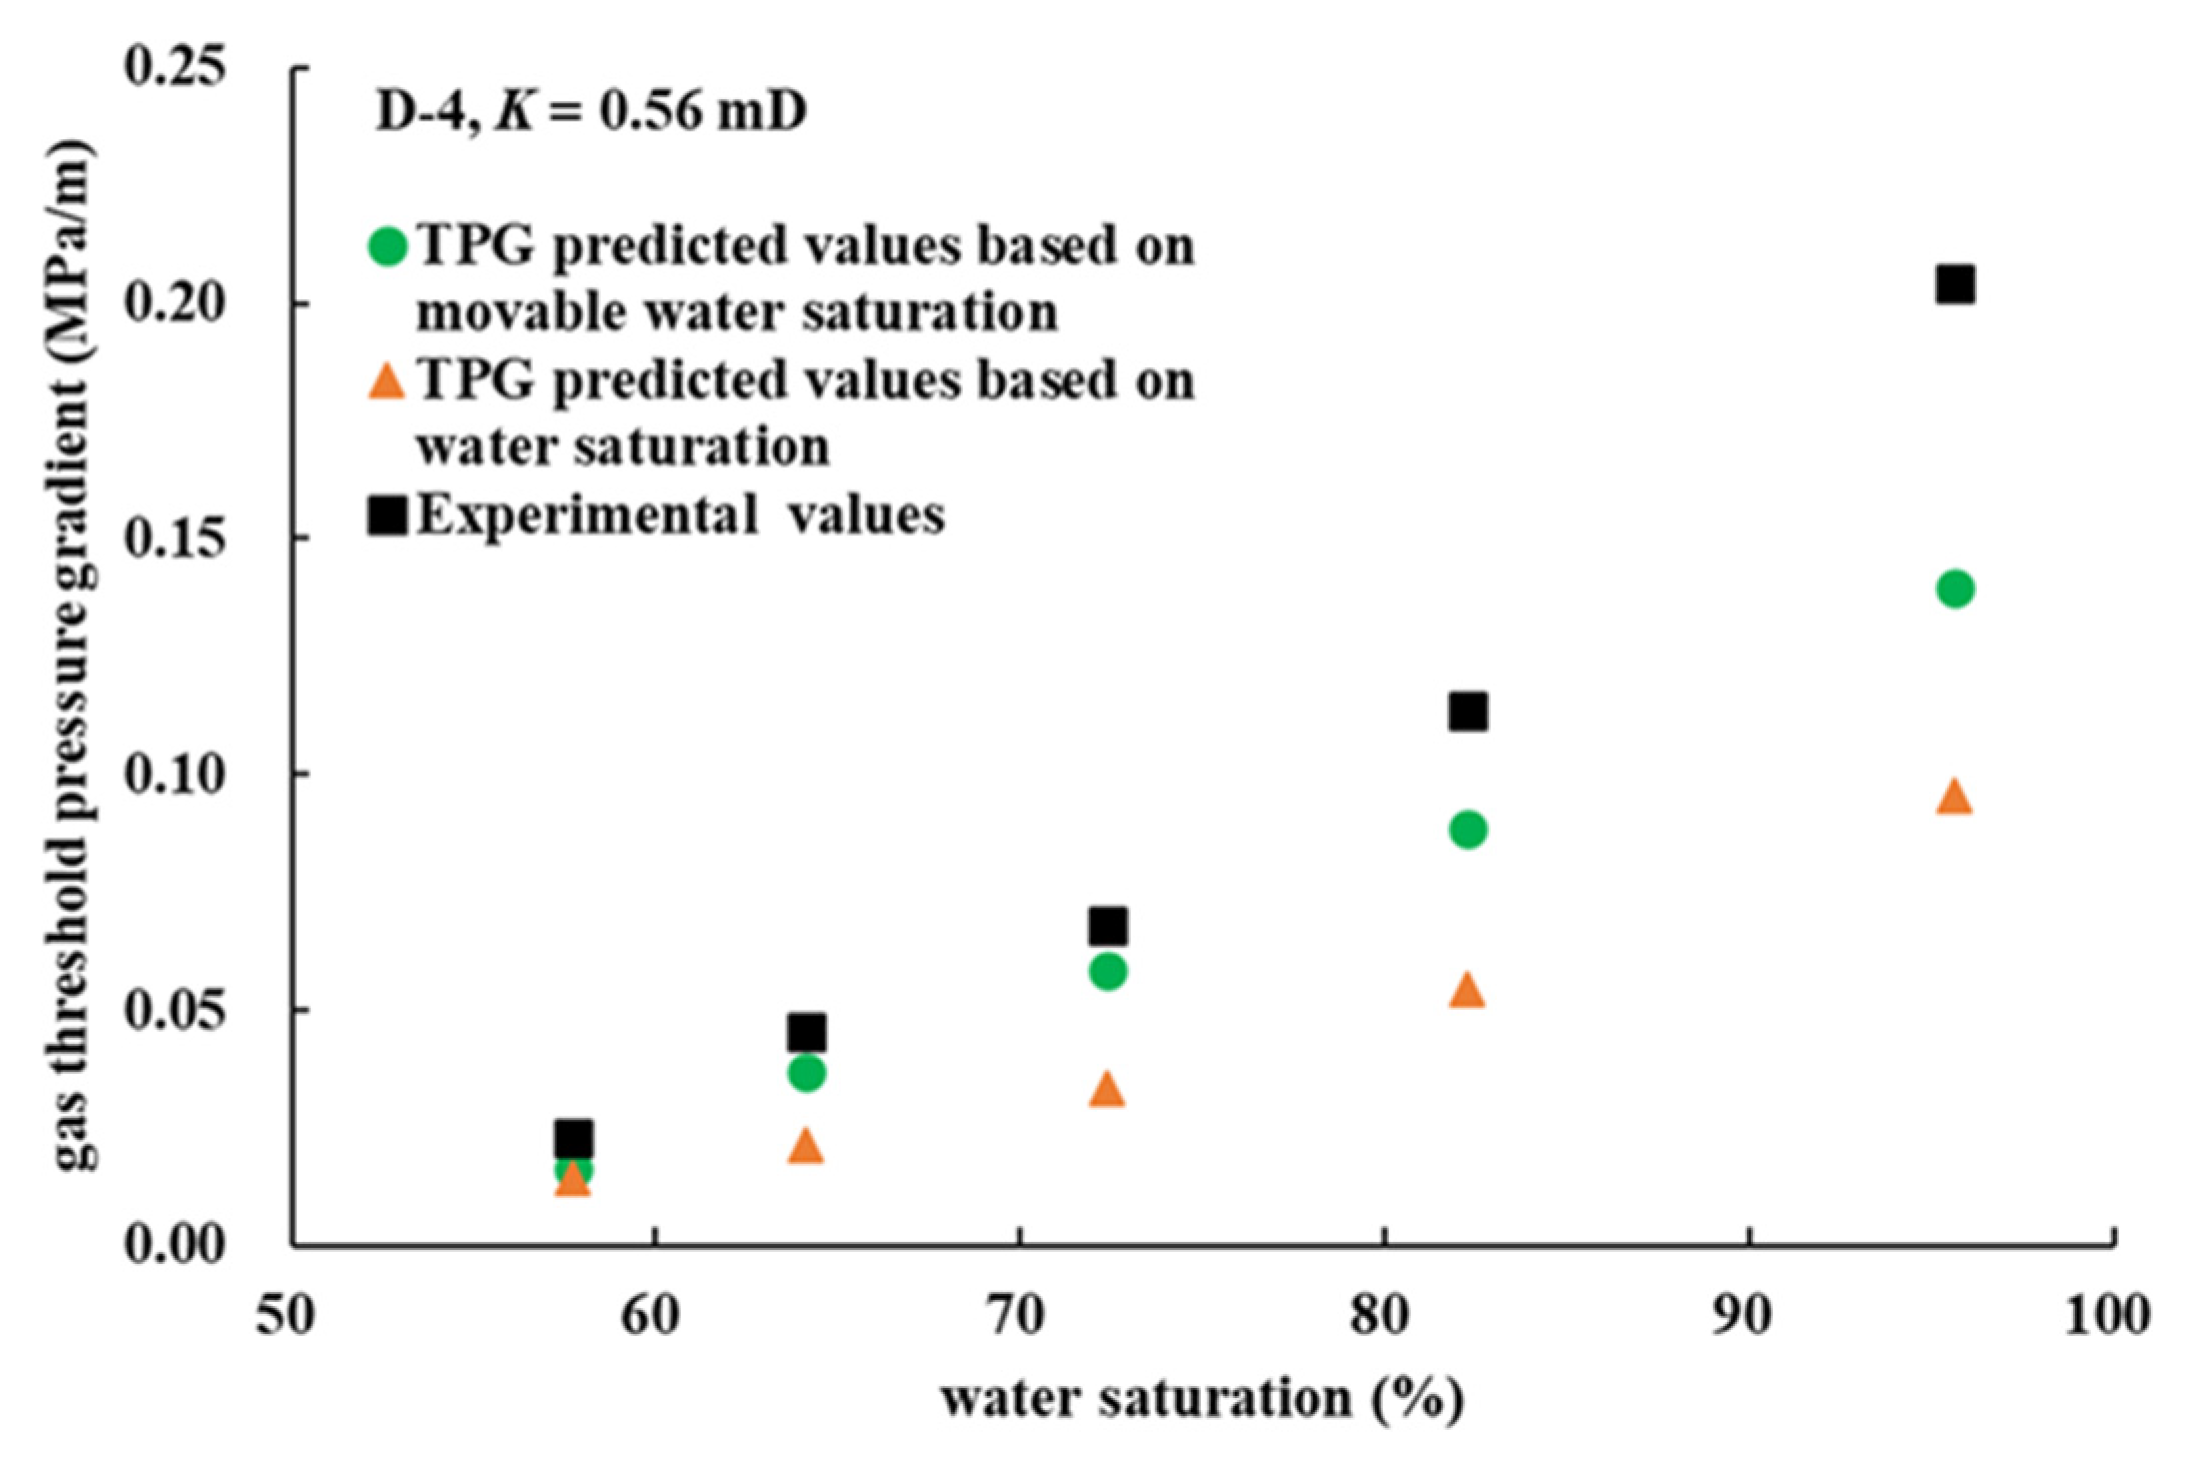
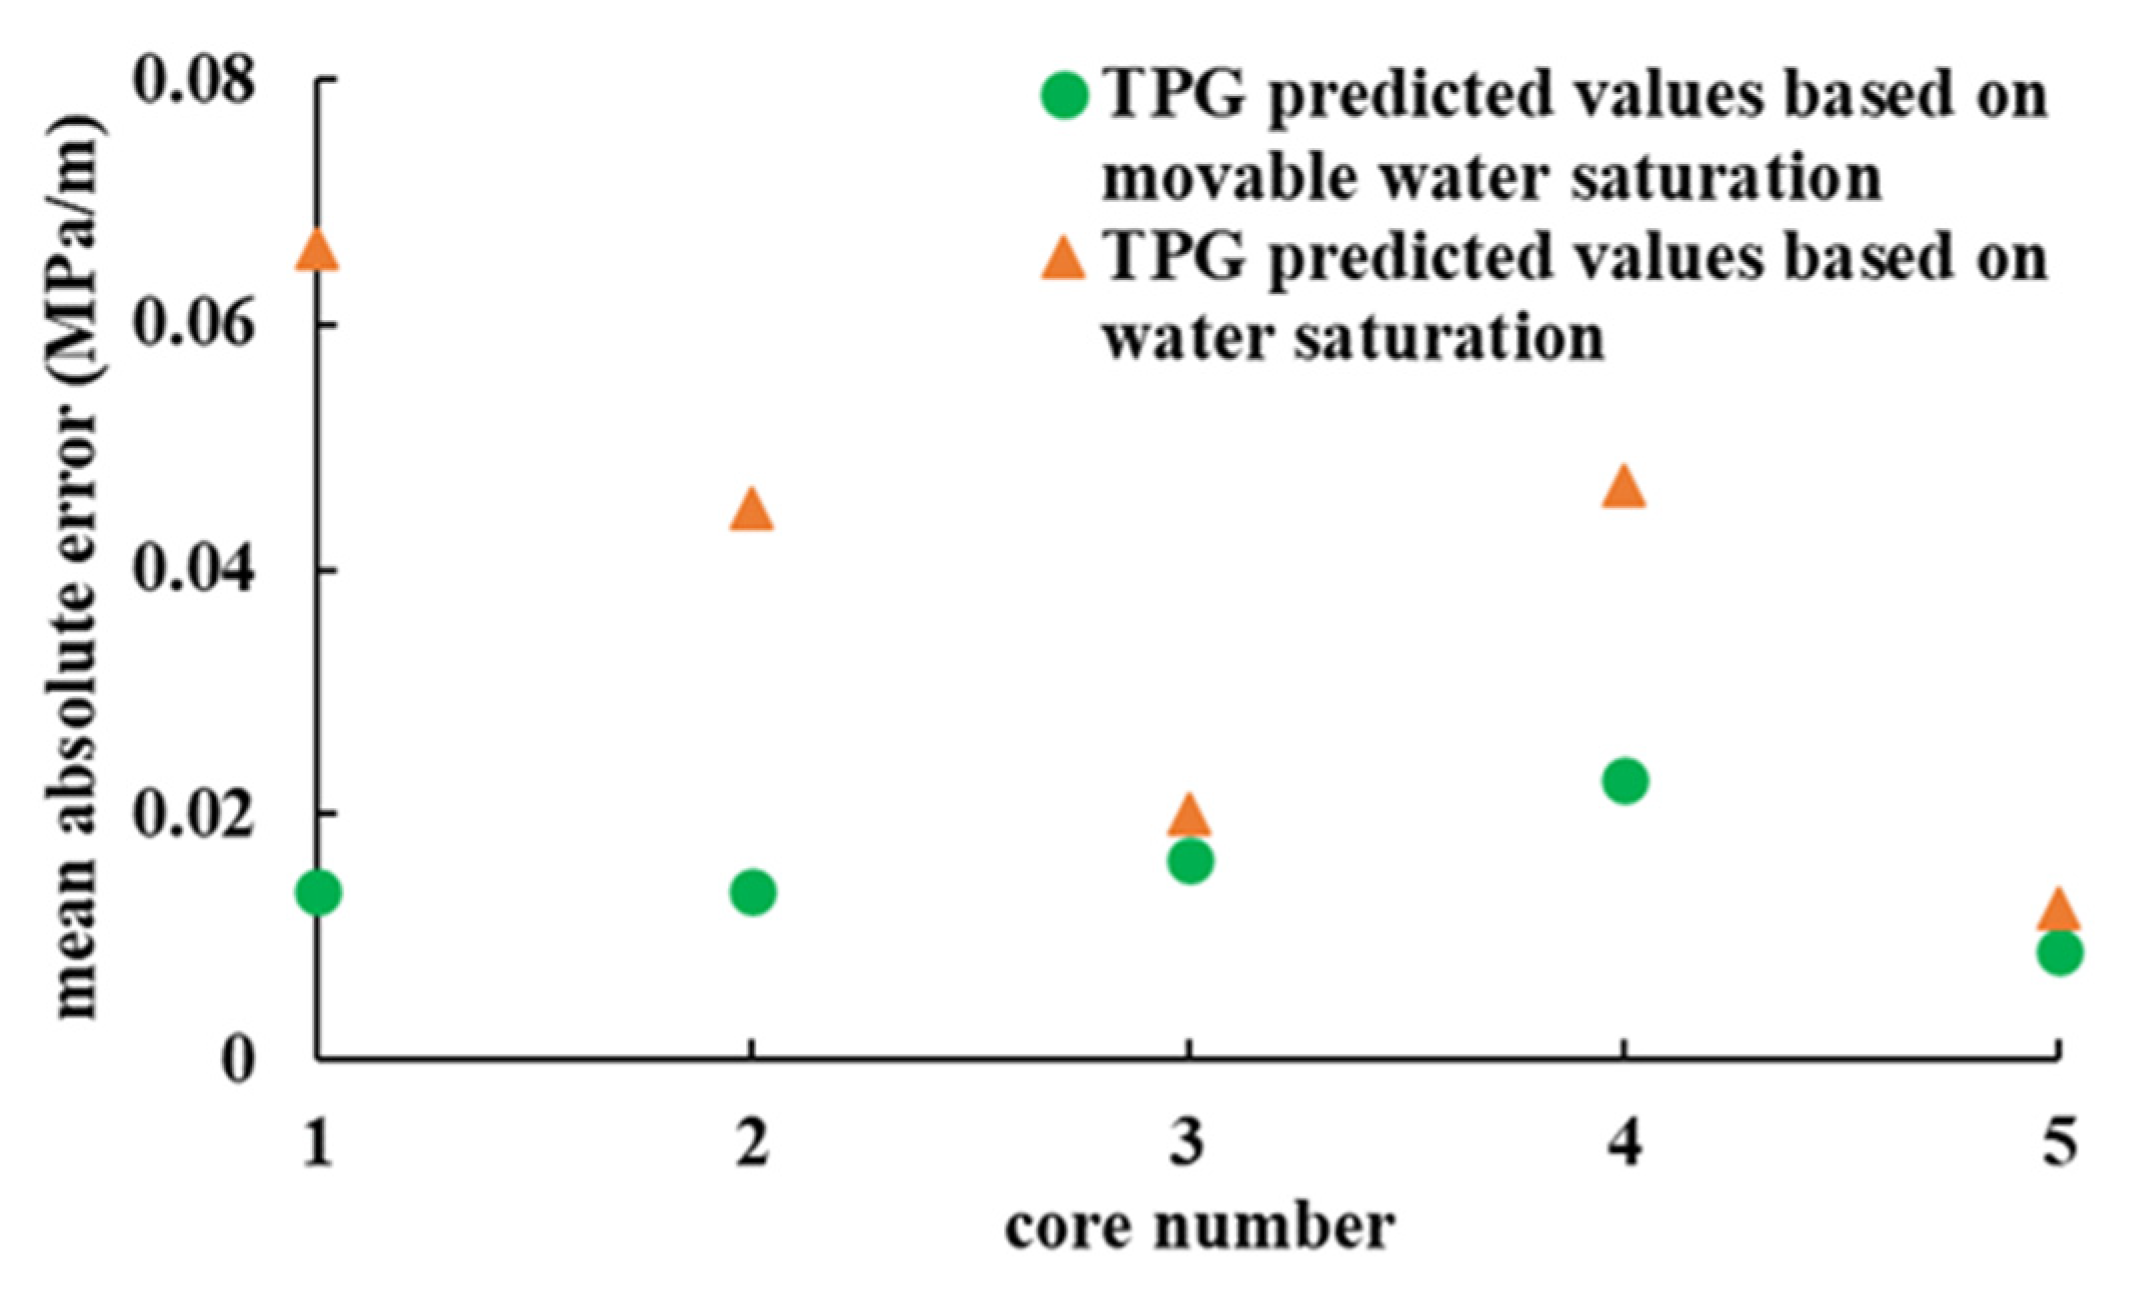
Considering permeability and movable water saturation, a new gas-phase TPG prediction model was established. Compared to the prediction model based on water saturation, the mean absolute errors calculated by the new model are lower. This study will improve the fundamental understanding of gas–water two-phase flow characteristics in tight gas reservoirs.

Author Contributions

This paper is a collaborative work of all the authors. W.Z. and G.Z. proposed the idea and wrote the manuscript. G.Z. designed the experiment, G.Z. and Y.L. performed the experiment. B.P. and Y.L. analyzed the experimental data. B.P. and W.L. revised and edited the paper. All authors have read and agreed to the published version of the manuscript.

Funding

This work was financially supported by the National Natural Science Foundation of China (Project No. 51974013) and the Fundamental Research Funds of the Central Universities (No. FRF-TP-20-006A1).

Institutional Review Board Statement

Not applicable.

Informed Consent Statement

Not applicable.

Data Availability Statement

Not applicable.

Conflicts of Interest

The authors declare no conflict of interest.

References

  1. Hughes, J.D. Energy: A reality check on the shale revolution. Nature 2013, 494, 307–308. [Google Scholar] [CrossRef] [PubMed]
  2. Shen, W.; Song, F.; Hu, X.; Zhu, G.; Zhu, W. Experimental study on flow characteristics of gas transport in micro- and nanoscale pores. Sci. Rep. 2019, 9, 10196. [Google Scholar] [CrossRef] [PubMed] [Green Version]
  3. Li, X.; Li, L.; Guo, Z.; Hu, Y.; Luo, R.; Su, Y.; Sun, H.; Liu, X.; Wan, Y.; Zhang, Y. Efficient development strategies for large ultra-deep structural gas fields in China. Pet. Explor. Dev. 2018, 45, 118–126. [Google Scholar] [CrossRef]
  4. Ji, G.; Jia, A.; Meng, D.; Guo, Z.; Wang, G.; Cheng, L.; Zhao, X. Technical strategies for effective development and gas recovery enhancement of a large tight gas field: A case study of Sulige gas field, Ordos Basin, NW China. Pet. Explor. Dev. 2019, 46, 629–641. [Google Scholar] [CrossRef]
  5. Zhang, H.; Zhong, Y.; Kuru, E.; Kuang, J.; She, J. Impacts of permeability stress sensitivity and aqueous phase trapping on the tight sandstone gas well productivity-A case study of the Daniudi gas field. Pet. Sci. Eng. 2019, 177, 261–269. [Google Scholar] [CrossRef]
  6. Song, H.; Liu, Q.; Yang, D.; Yu, M.; Lou, Y.; Zhu, W. Productivity equation of fractured horizontal well in a water-bearing tight gas reservoir with low-velocity non-Darcy flow. J. Nat. Gas Sci. Eng. 2014, 18, 467–473. [Google Scholar] [CrossRef]
  7. Qin, S.; Li, F.; Li, W.; Zhou, Z.; Zhou, G. Formation mechanism of tight coal-derived-gas reservoirs with medium-low abundance in Xujiahe Formation, central Sichuan Basin, China. Mar. Pet. Geol. 2018, 89, 144–154. [Google Scholar] [CrossRef] [Green Version]
  8. Fan, X.; Wang, G.; Dai, Q.; Li, Y.; Zhang, F.; He, Z.; Li, Q. Using image logs to identify fluid types in tight carbonate reservoirs via apparent formation water resistivity spectrum. J. Pet. Sci. Eng. 2019, 178, 937–947. [Google Scholar] [CrossRef]
  9. Shen, J.; Qin, Y.; Li, Y.; Wang, G. Experimental investigation into the relative permeability of gas and water in low-rank coal. J. Pet. Sci. Eng. 2018, 175, 303–316. [Google Scholar] [CrossRef]
  10. Cheng, Y.; Zhang, C.; Zhu, L. A fractal irreducible water saturation model for capillary tubes and its application in tight gas reservoir. J. Pet. Sci. Eng. 2017, 159, 731–739. [Google Scholar] [CrossRef]
  11. Yang, X.; Meng, Y.; Shi, X.; Li, G. Influence of porosity and permeability heterogeneity on liquid invasion in tight gas reservoirs. J. Nat. Gas Sci. Eng. 2017, 37, 169–177. [Google Scholar] [CrossRef]
  12. Zhu, W.; Song, H.; Huang, X.; Liu, X.; He, D.; Ran, Q. Pressure characteristics and effective deployment in a water-bearing tight gas reservoir with low-velocity non-Darcy flow. Energy Fuels 2011, 25, 1111–1117. [Google Scholar] [CrossRef]
  13. Liu, S.; Liao, W.; Zhou, H. Experimental study of gas/water two-phase flow threshold pressure of Xinchang Xujiahe gas reservoir. Pet. Geol. Eng. 2011, 25, 115–117. [Google Scholar] [CrossRef]
  14. Wang, X.; Liu, C.; Zheng, R. Start-up pressure gradient of tight gas reservoirs in Daniudi gas field and its appli-cation method. Oil Gas Geol. 2005, 26, 698–702. [Google Scholar] [CrossRef]
  15. Yi, G.; Tang, H.; Lü, D. The study and analysis of starting pressure gradient in low permeability gas reservoirs. Offshore Oil 2006, 26, 51–54. [Google Scholar] [CrossRef]
  16. Fu, D. Study on Seepage Flow Mechanism in Low Permeability Gas Reservoir. Master’s Thesis, Daqing Petroleum Institute, Daqing, China, 2009. [Google Scholar]
  17. Civan, F. Modeling gas flow through hydraulically-fractured shale-gas reservoirs involving molecular-to-inertial transport regimes and threshold pressure gradient. SPE Annu. Tech. Conf. Exhib. 2013, SPE-166324-MS. [Google Scholar] [CrossRef]
  18. Li, Q.; Gao, S.; Yang, Z.; Feng, Q.; Ye, L. Influence of the threshold pressure gradient on tight sandstone gas reservoirs recovery. Nat. Gas Geosci. 2014, 25, 1444–1450. [Google Scholar] [CrossRef]
  19. Huang, L.; Shi, J.; Yang, L.; Zang, J.; Zhang, L.; Yu, P. Experimental research and analysis on threshold pressure gradient in low-permeability gas reservoir. Fault-Block Oil Gas Field 2016, 23, 610–614. [Google Scholar] [CrossRef]
  20. Yang, Z.; Li, X.; Liu, S.; Gao, S.; Ye, L.; Liu, J. Threshold pressure effect of low permeability tight gas reservoirs in Sulige gas field. Acta Pet. Sin. 2015, 36, 347–354. [Google Scholar] [CrossRef]
  21. Tian, W.; Li, A.; Ren, X.; Josephine, Y. The threshold pressure gradient effect in the tight sandstone gas reservoirs with high water saturation. Fuel 2018, 226, 221–229. [Google Scholar] [CrossRef]
  22. Li, J.; Yang, S.; Qi, Z.; Yan, W.; Yuan, Y.; Huang, X. A prediction model for the gas threshold pressure gradients of water drive gas reservoirs. Nat. Gas Ind. 2019, 39, 66–73. [Google Scholar] [CrossRef]
  23. Ye, L.; Gao, S.; Yang, H.; Xiong, W.; Hu, Z.; Liu, H.; Du, S. Water production mechanism and development strategy of tight sandstone gas reservoirs. Nat. Gas Ind. 2015, 35, 41–46. [Google Scholar] [CrossRef]
  24. Shen, W.J.; Liu, X.H.; Li, X.Z.; Lu, J.L. Investigation of Water Coning Mechanism in Tarim Fractured Sandstone Gas Reservoirs. J. Central South Univ. 2015, 22, 344–349. [Google Scholar] [CrossRef]
  25. Timur, A. Pulsed nuclear magnetic resonance studies of porosity, movable fluid, and permeability of sandstones. J. Pet. Technol. 1969, 21, 775–786. [Google Scholar] [CrossRef]
  26. Wuthrich, K. Protein structure determination in solution by nuclear magnetic resonance spectroscopy. Science 1989, 243, 45–50. [Google Scholar] [CrossRef] [Green Version]
  27. Slijkerman, W.F.; Hofman, J.P.; Looyestijn, W.J.; Volokitin, Y. A practical approach to obtain primary drainage capillary pressure curves from NMR core and log data. Petrophysics 2001, 42, 4. [Google Scholar]
  28. Jarzyna, J.A.; Krakowska, P.I.; Puskarczyk, E.; Semyrka, R. Rock Reservoir Properties from the Comprehensive Interpretation of Nuclear Magnetic Resonance and Mercury Injection Porosimetry Laboratory Results. Appl. Magn. Reson. 2014, 46, 95. [Google Scholar] [CrossRef] [Green Version]
  29. Zhang, J.; Li, X.; Shen, W.; Gao, S.; Liu, H.; Ye, L.; Fang, F. Study of the Effect of Movable Water Saturation on Gas Production in Tight Sandstone Gas Reservoirs. Energies 2020, 13, 4645. [Google Scholar] [CrossRef]
  30. Gao, H.; Li, T.; Yang, L. Quantitative determination of pore and throat parameters in tight oil reservoir using constant rate mercury intrusion technique. J. Pet. Explor. Prod. Technol. 2016, 6, 309–331. [Google Scholar] [CrossRef] [Green Version]
  31. Zhu, H.; Xu, X.; An, L.; Guo, C.; Xiao, J. An experimental on occurrence and mobility of pore water in tight gas reservoirs. Acta Pet. Sin. 2016, 37, 230–236. [Google Scholar] [CrossRef]
  32. Wang, Y.; Long, Y.; Sun, Y.; Zhang, S.; Song, F.; Wang, X. Threshold Pore Pressure Gradients in Water-Bearing Tight Sandstone Gas Reservoirs. Energies 2019, 12, 4578. [Google Scholar] [CrossRef] [Green Version]
  33. Sedahmed, M.; Coelho, R.C.V.; Warda, H.A. An improved multicomponent pseudopotential lattice Boltzmann method for immiscible fluid displacement in porous media. Phys. Fluids 2022, 34, 023102. [Google Scholar] [CrossRef]
Figure 1. Schematic of the threshold pressure gradient experiment.
Energies 15 05309 g001
Figure 2. T2 spectrum curve of core plug D-4 under different water saturation.
Energies 15 05309 g002
Figure 3. T2 spectrum accumulation curve of core plug D-4 under different water saturation.
Energies 15 05309 g003
Figure 4. T2 accumulative curve under different water saturation and accumulative distribution curve of core plug D-4.
Energies 15 05309 g004
Figure 5. T2 accumulative curve under different water saturation and accumulative distribution curve of core plug D-5.
Energies 15 05309 g005
Figure 6. TPG versus critical pore throat radius.
Energies 15 05309 g006
Figure 7. Schematic of gas and water microscopic distribution in tight gas reservoirs: (a) gas flows in the dominant channel; (b) gas forms discontinuous phase; (c) gas is divided into small bubbles.
Energies 15 05309 g007
Figure 8. The relationship between TPG and water saturation.
Energies 15 05309 g008
Figure 9. The relationship between TPG and movable water saturation.
Energies 15 05309 g009
Figure 10. TPG predicted values versus experimental values of core plug D-4.
Energies 15 05309 g010
Figure 11. Mean absolute errors between experimental values and predicted values of the TPG.
Energies 15 05309 g011
Table 1. The TPG prediction models.
ScholarGas FieldPermeability (mD)Prediction Formula
Wang et al. [14]Daniudi0.080–1.500 λ = 0.0008 e 717.75 K g ,   λ = 0.0002 e 2.2388 S w
Yi et al. [15]Uxin Qi0.010–0.580 λ = 0.0002 S w 0.0037
Fu et al. [16]Guang’an0.048–7.410 λ = 0.0004 K + 0.0028
F·Civan et al. [17]// λ = a 1 ( K a μ ) b 1
Li et al. [18]Sulige0.001–0.144 λ = 1.563 × 10 10 e 26.632 S w K ( 3.692 S w 2.996 )
Huang et al. [19]/0.011–0.470 λ = e 4.061 K 0.357 S w 0.521 0.027833
Yang et al. [20]Sulige0.010–0.150 λ = 2234.4 S w 18.411 K 0.1879 S w 2.4547
Tian et al. [21]Sulige0.040–1.900 λ = 0.0036 K 1.239 S w d 6.2343 K 0.0436
Li et al. [22]Puguang0.0188–5.7304 λ = 0.0542 K 0.4116 S g f r 0.5038 K 0.2086
Where λ   is the gas-phase TPG, S w is the water saturation, S w d is the dimensionless water saturation, S g f r is the relative moveable gas saturation.
Table 2. The properties of the used core plugs in this work.
Core Plug NumberDiameter (cm)Length (cm)Porosity (%)Permeability (mD)
D-12.546.286.310.13
D-22.525.329.030.16
D-32.546.188.720.36
D-42.544.4011.610.56
D-52.534.7413.040.85
Table 3. The properties of the formation water from Daniudi gas field.
pHIon Concentration (mg/L)Total Salinity (g/L)
K+ + Na+Ca2+Mg2+Total CationClTotal Anion
6.086038.764174.73464.1310,677.6217,982.918,092.7428.77036
Table 4. The water saturation and the movable water saturation of core plugs.
Core Plug NumberPermeability (mD)Water Saturation (%)Movable Water
Saturation (%)
D-10.1373.6512.41
80.2220.69
95.7833.16
D-20.1670.9310.75
81.6220.09
97.4632.44
D-30.3660.181.88
63.736.59
73.1513.74
82.6621.71
95.6333.18
D-40.5657.735.07
64.1210.74
72.3516.35
82.2724.09
95.6436.57
D-50.8554.779.28
64.0514.28
73.2817.35
82.3923.89
96.0335.04
Table 5. The fitting formulas between TPG and Swm.
Core Plug
Number
Permeability (mD)Fitting FormulaAB
D-10.13 λ = 0.0033 S w m 1.2409 0.00331.2409
D-20.16 λ = 0.0024 S w m 1.3165 0.00241.3165
D-30.36 λ = 0.0082 S w m 0.7945 0.00820.7945
D-40.56 λ = 0.0035 S w m 1.1016 0.00351.1016
D-50.85 λ = 0.0013 S w m 1.2349 0.00131.2349
Publisher’s Note: MDPI stays neutral with regard to jurisdictional claims in published maps and institutional affiliations.

