
Energy Efficiency of Small Wind Turbines in an Urbanized Area—Case Studies


Abstract
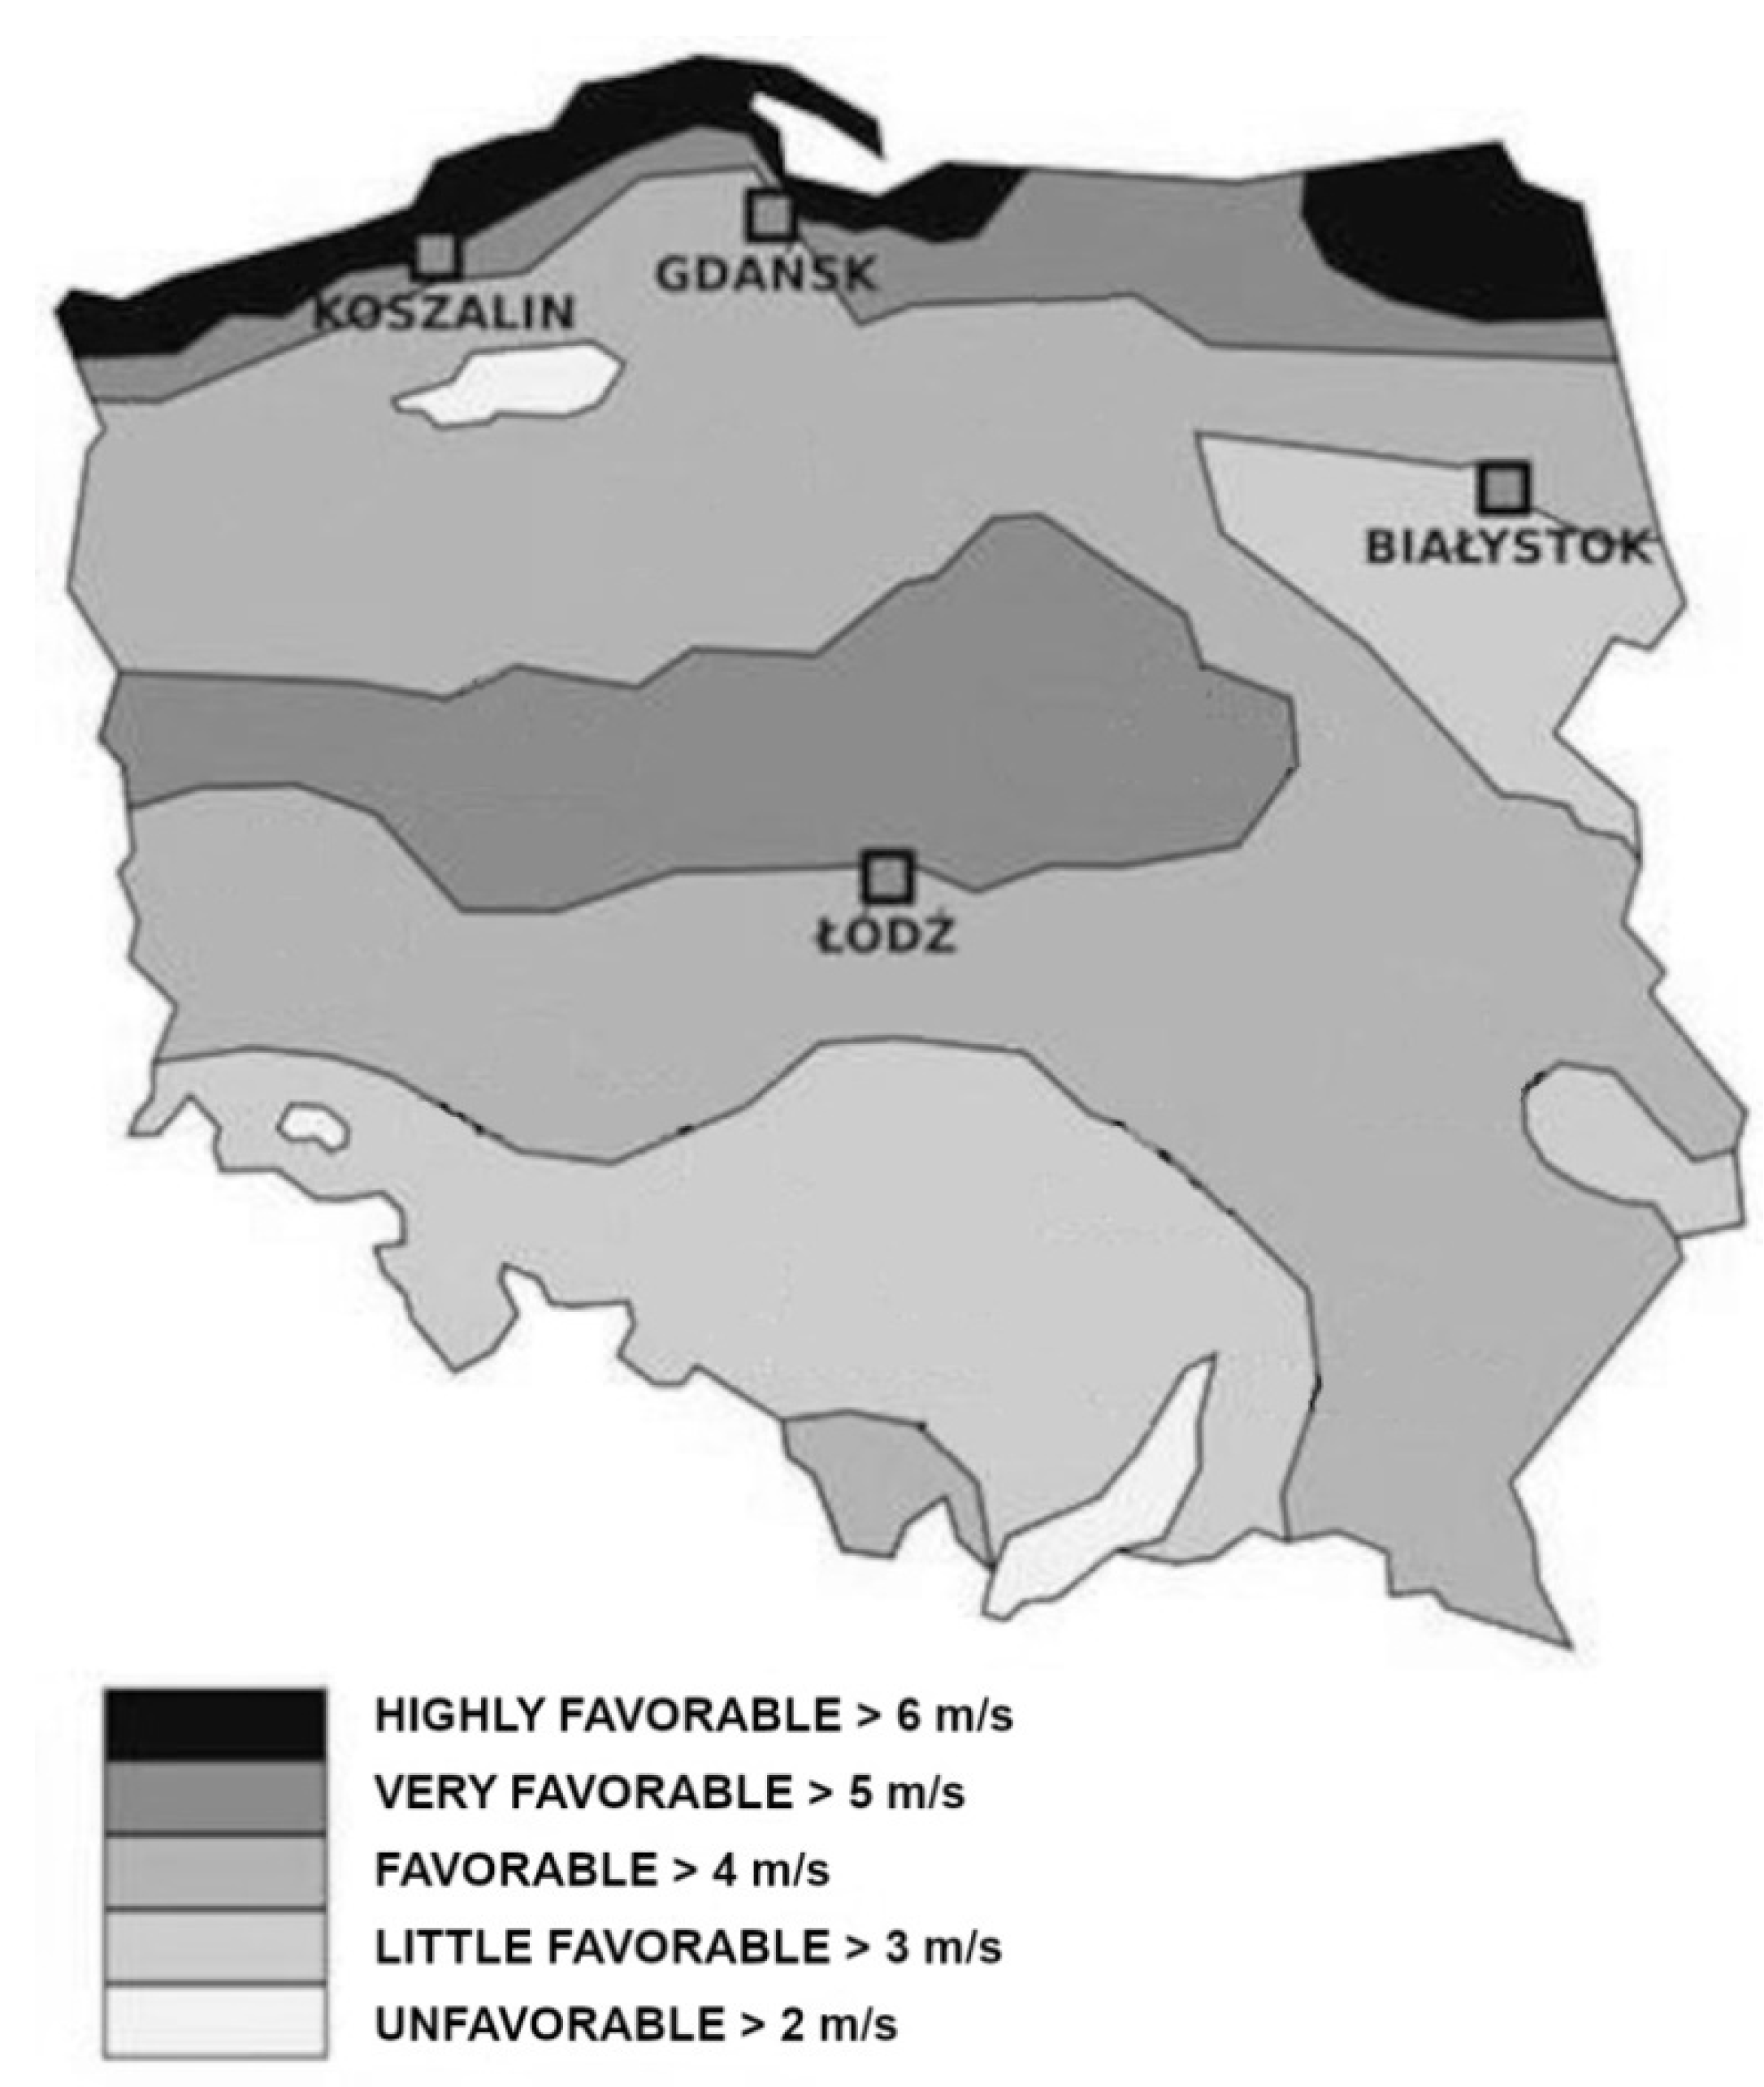
:1. Introduction
2. Materials and Methods
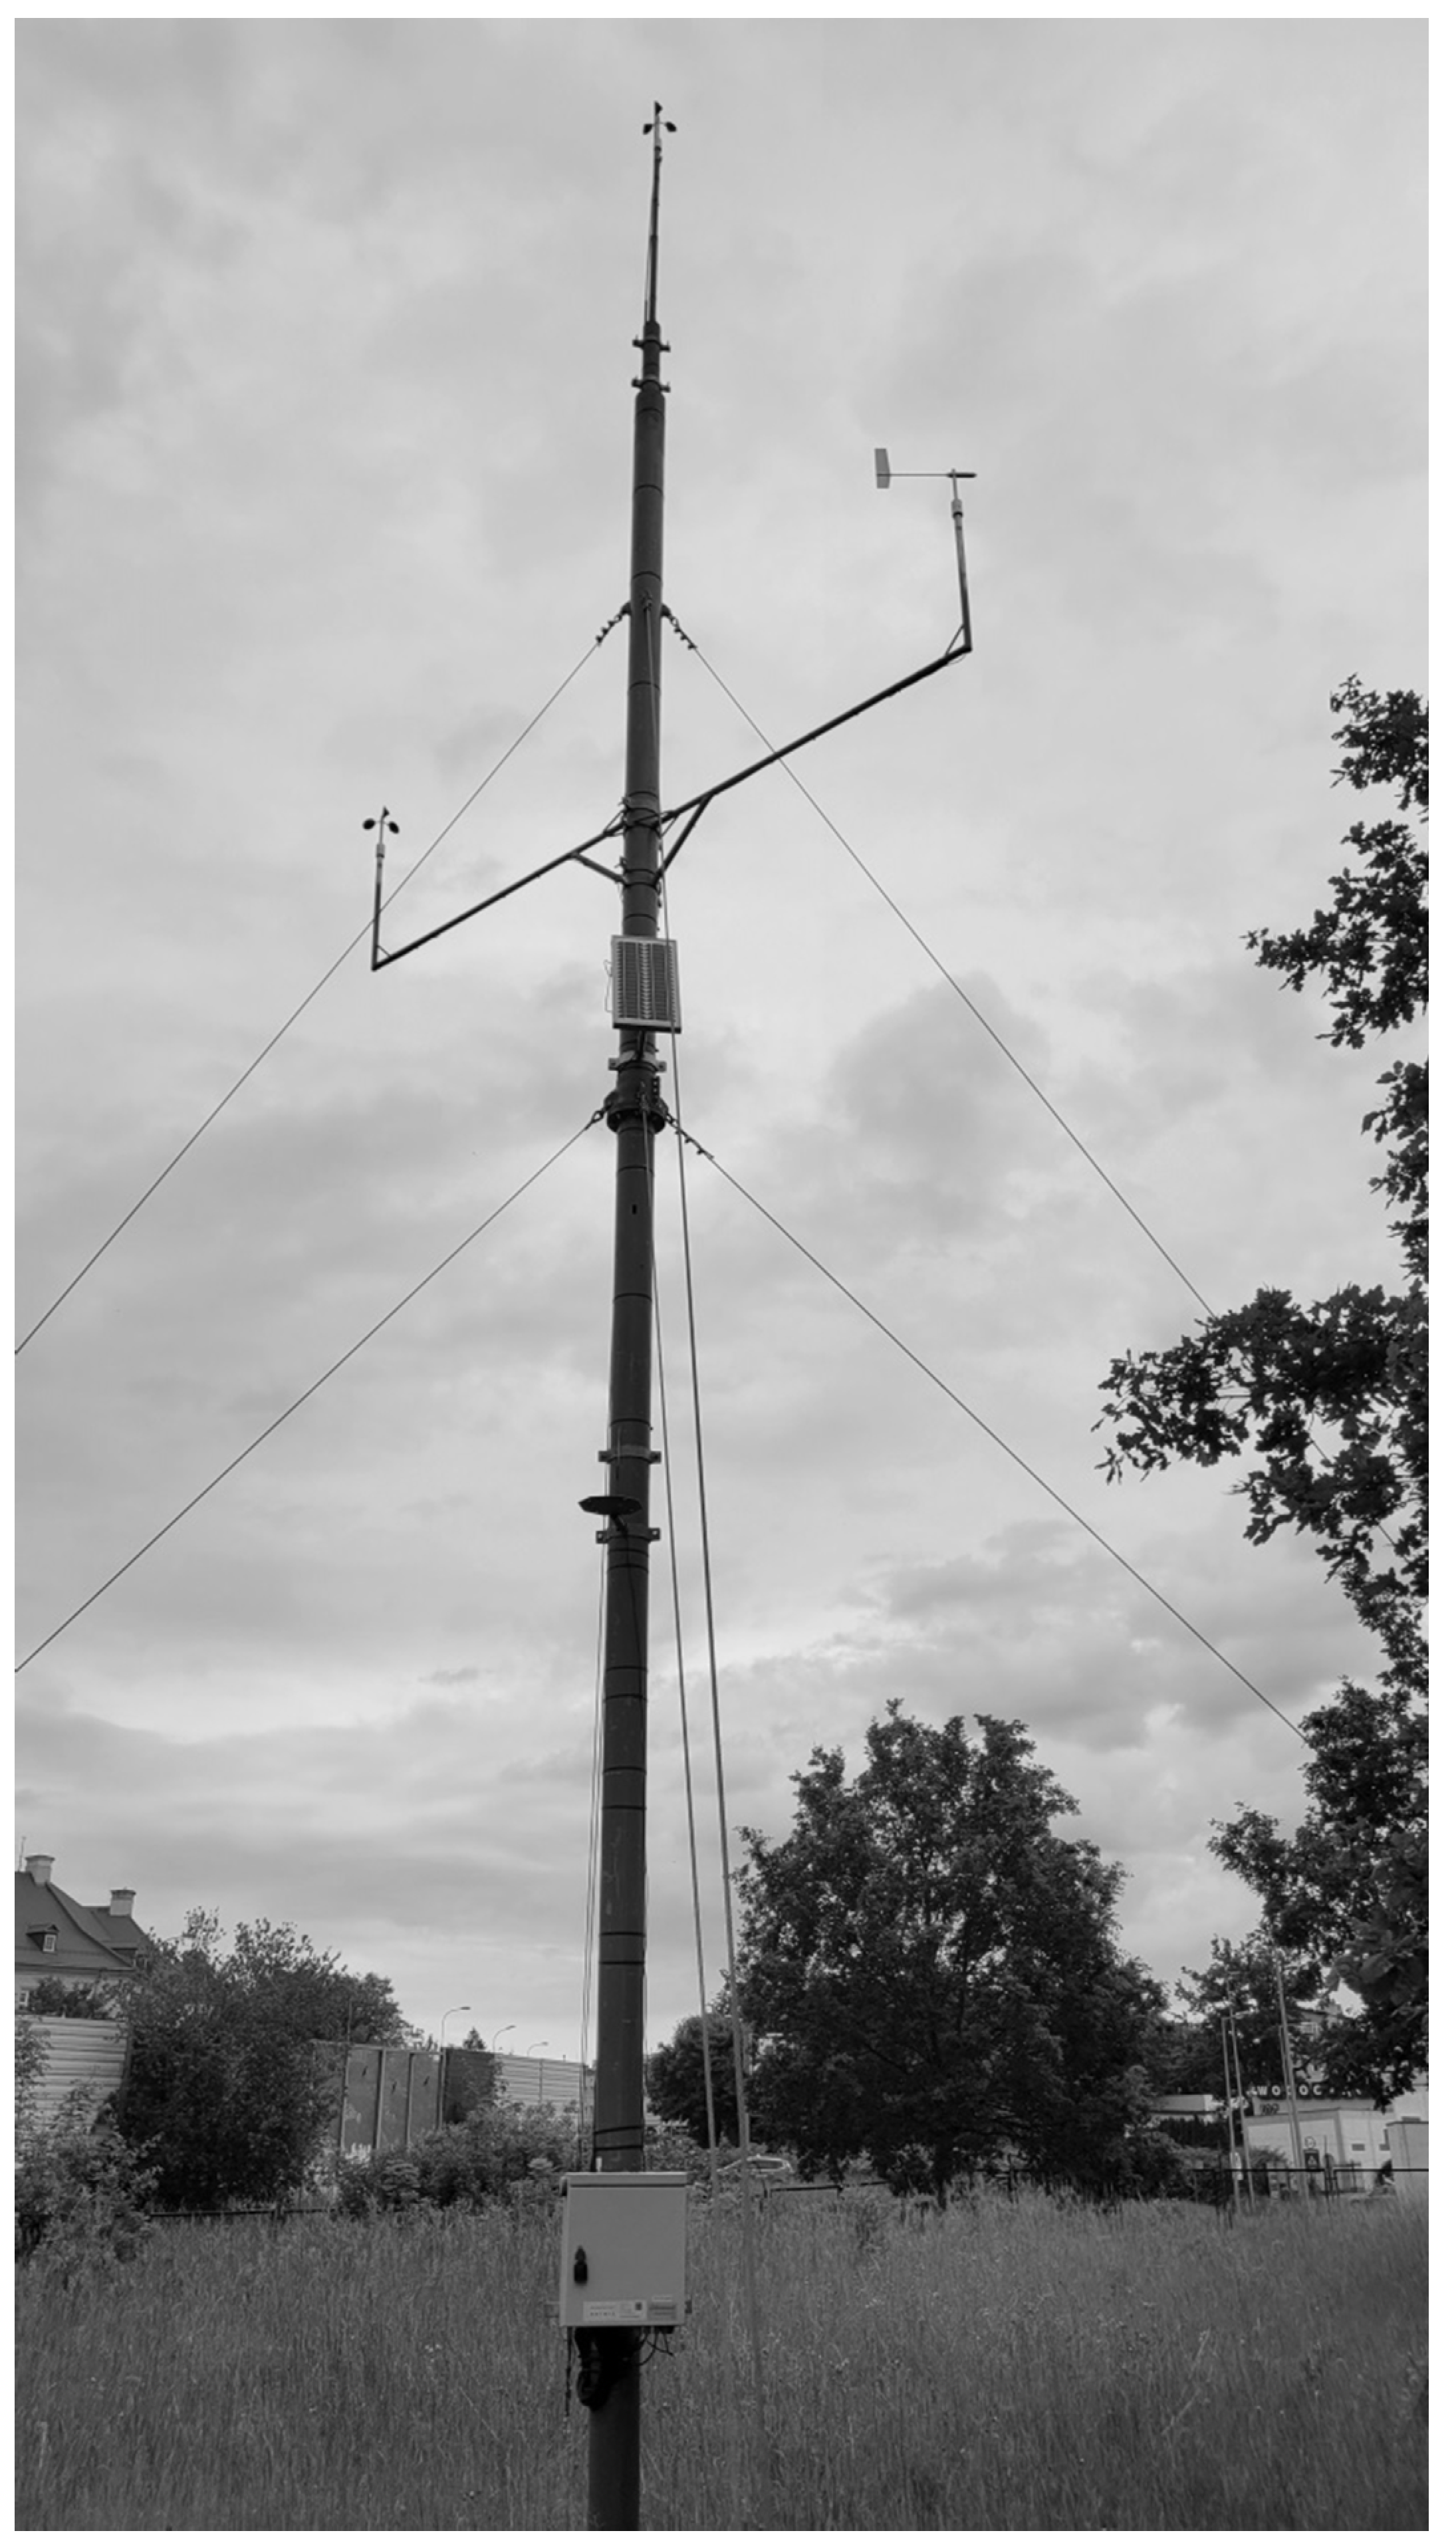
2.1. Presentation of Measurement Results
2.2. Locations Studied
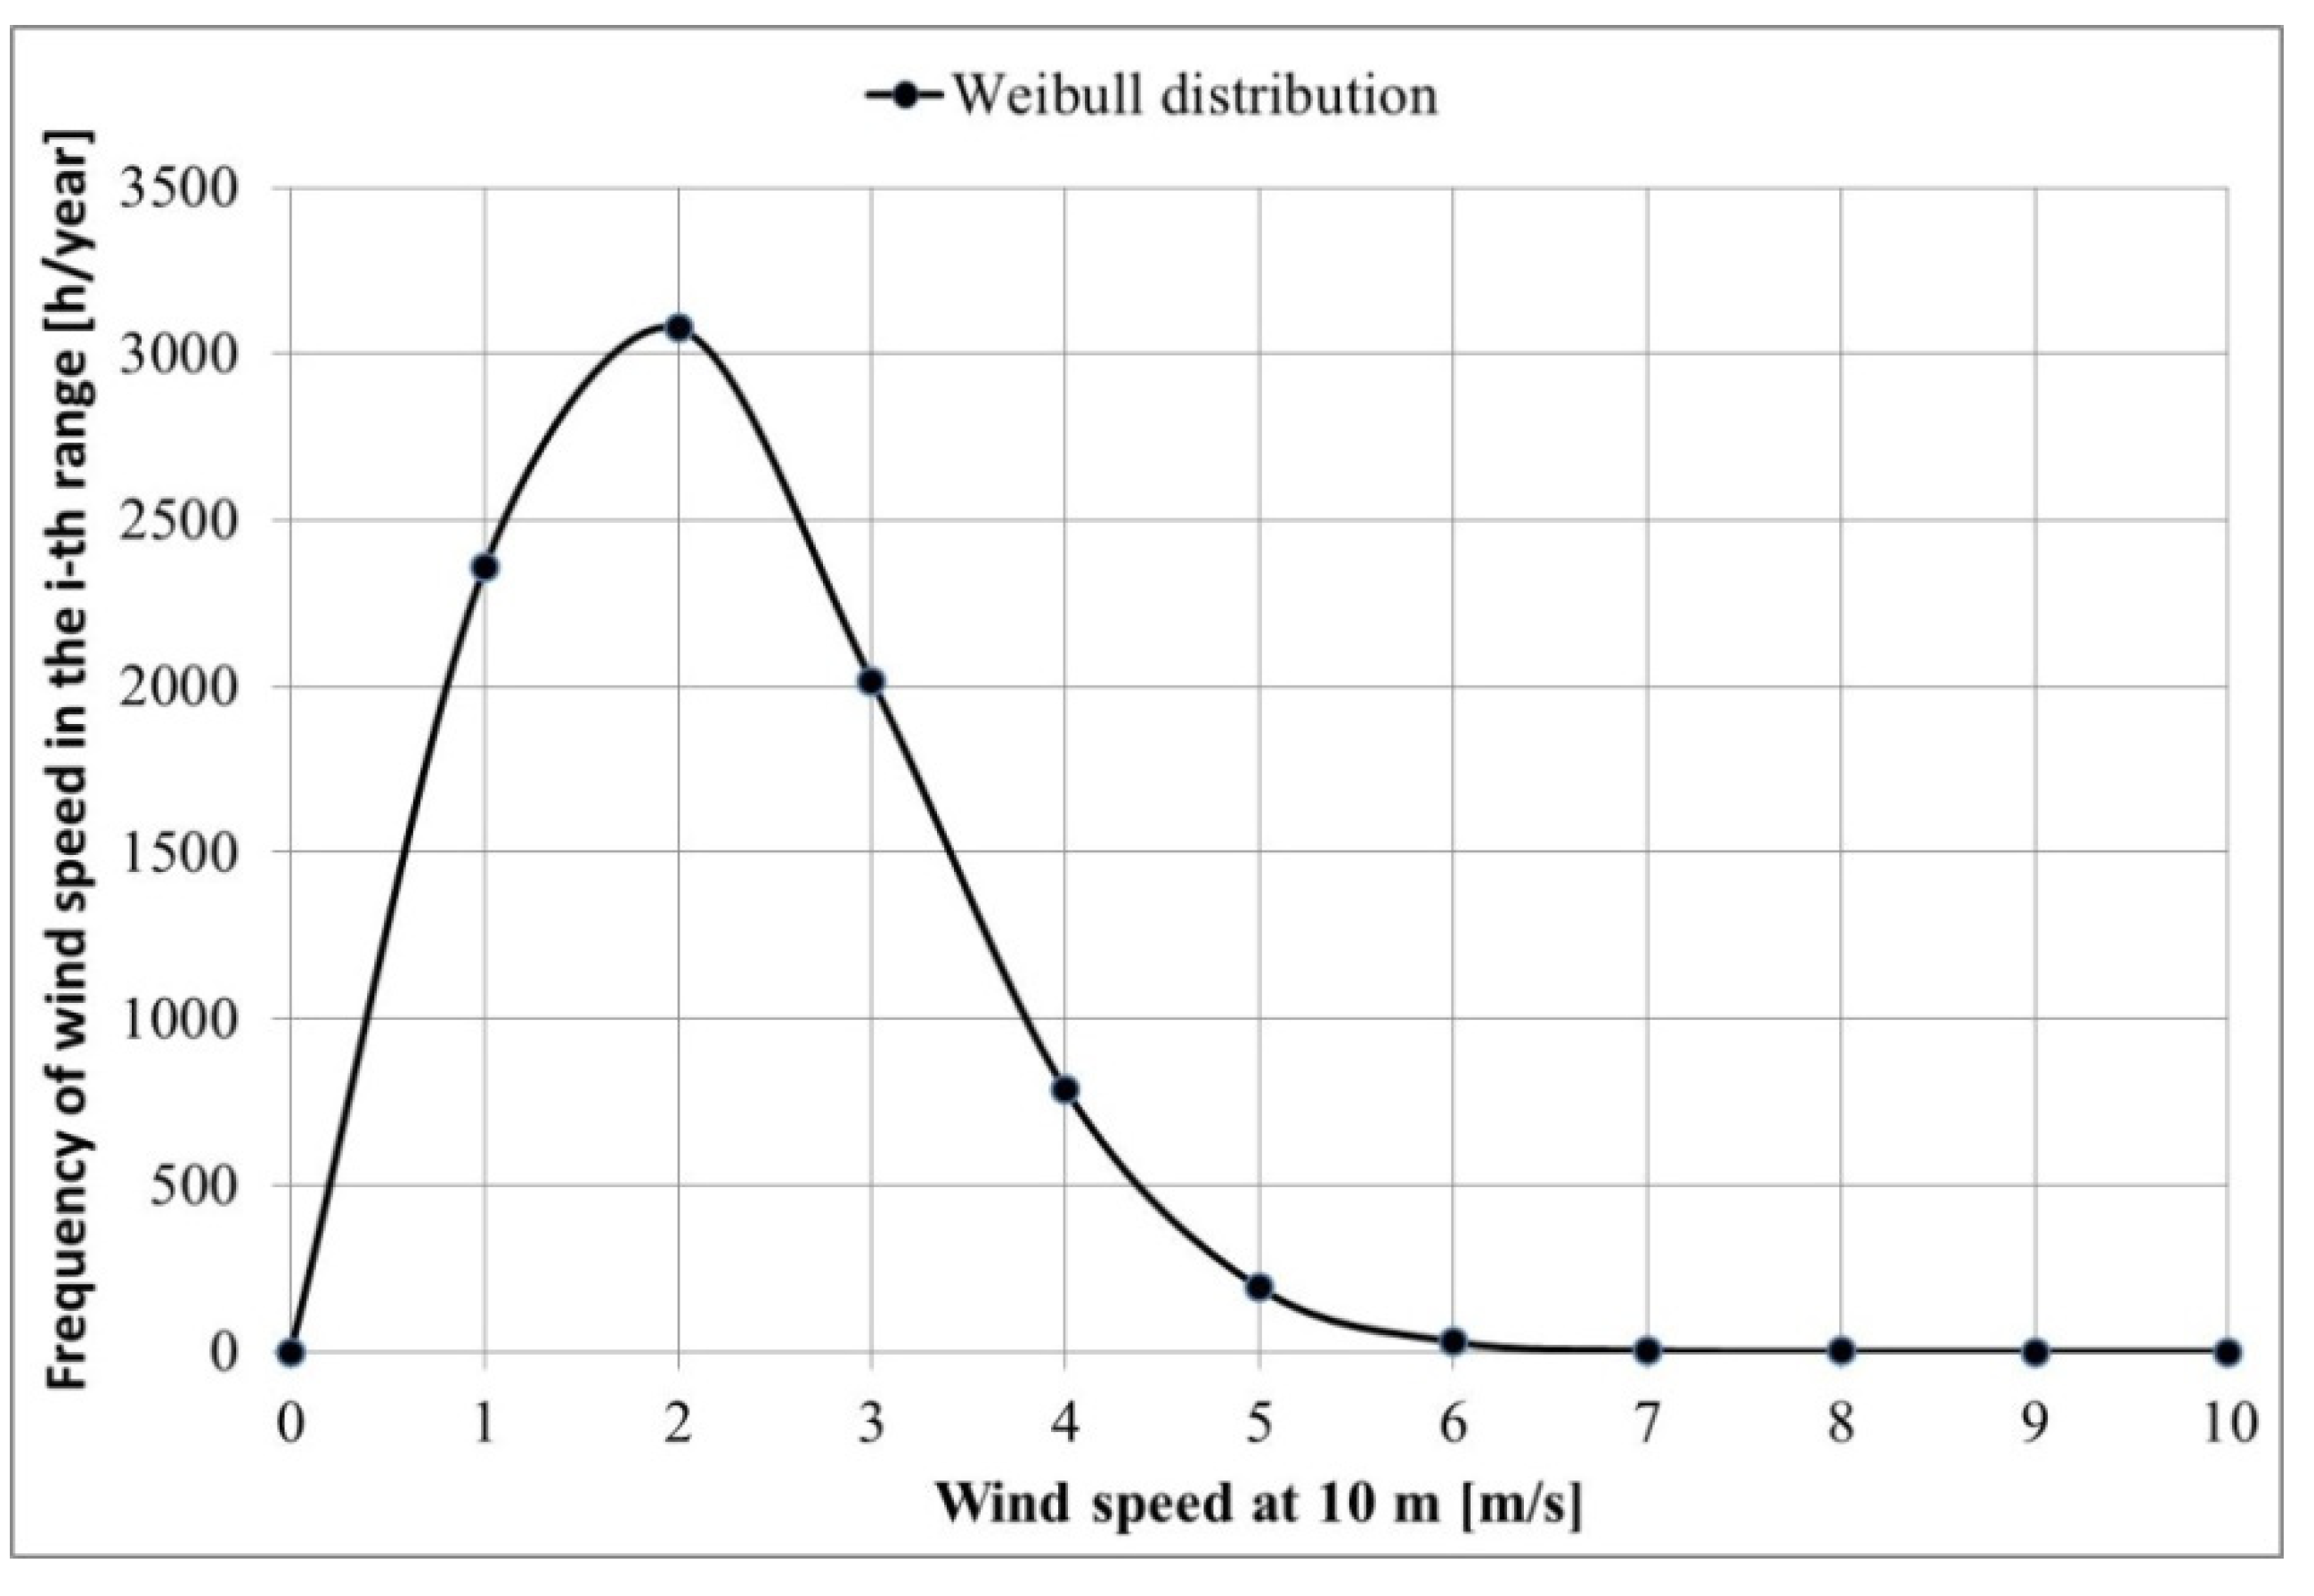
2.2.1. Location I (Loc I)
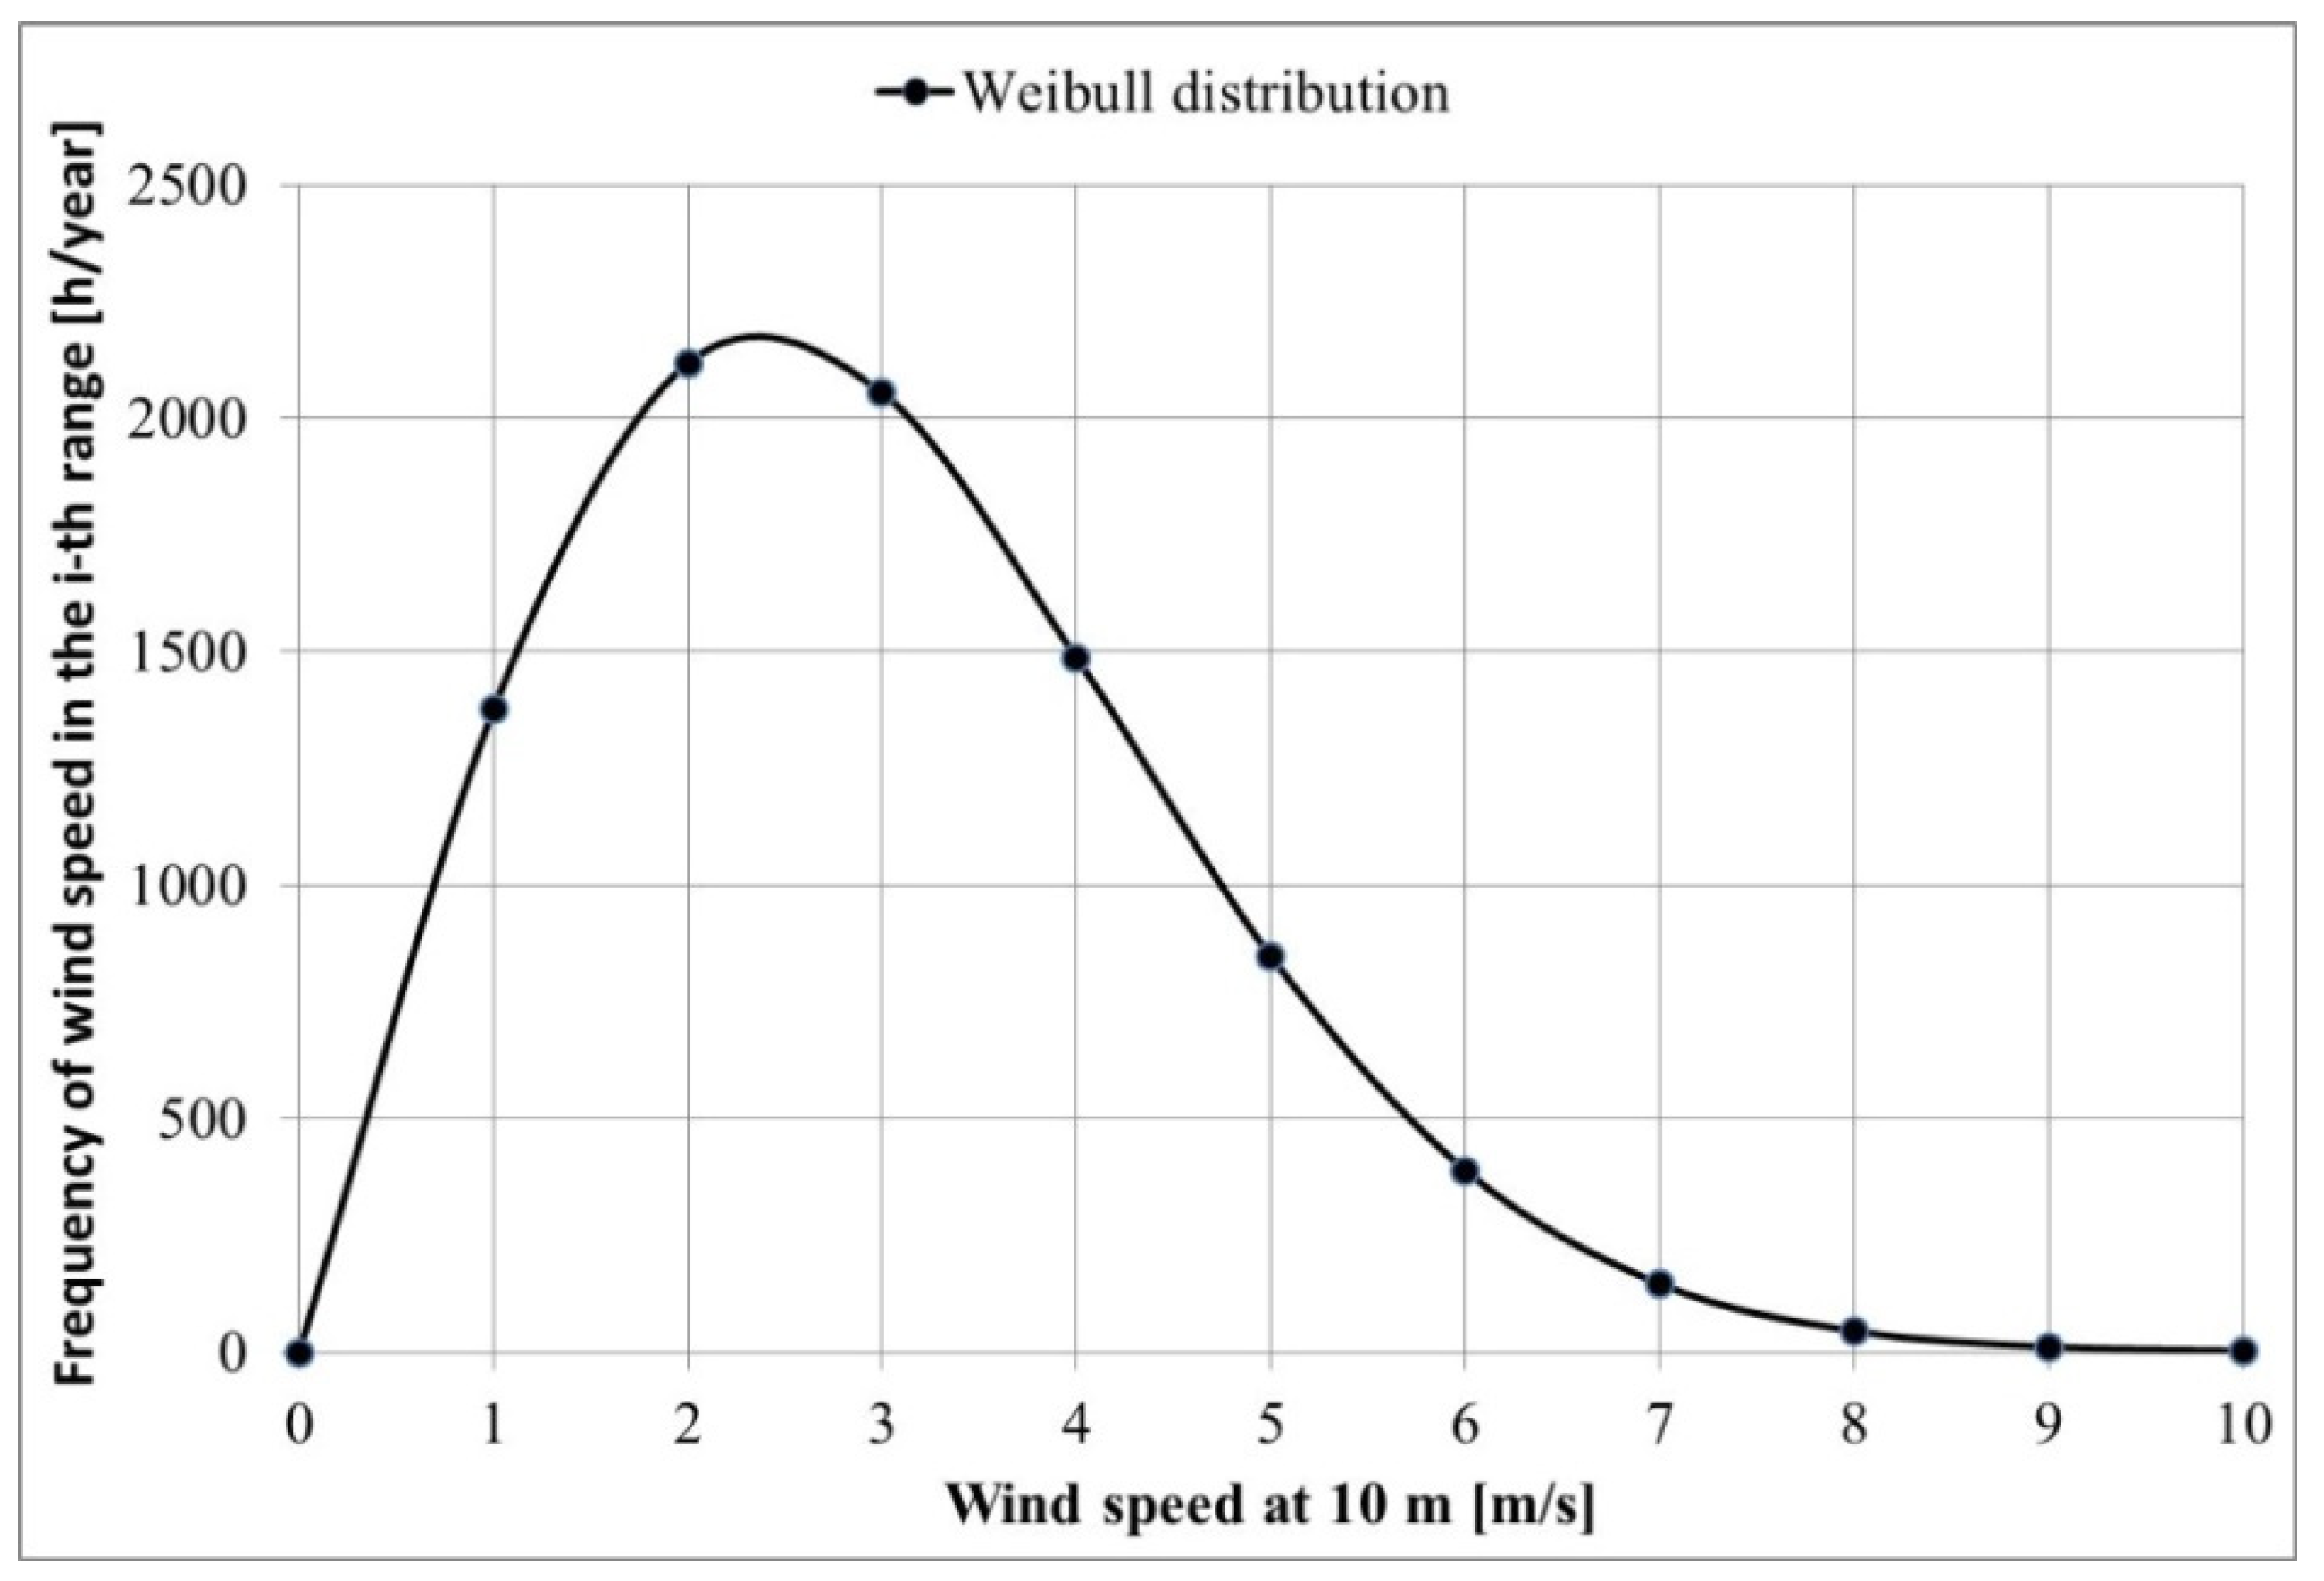
2.2.2. Location II (Loc II)
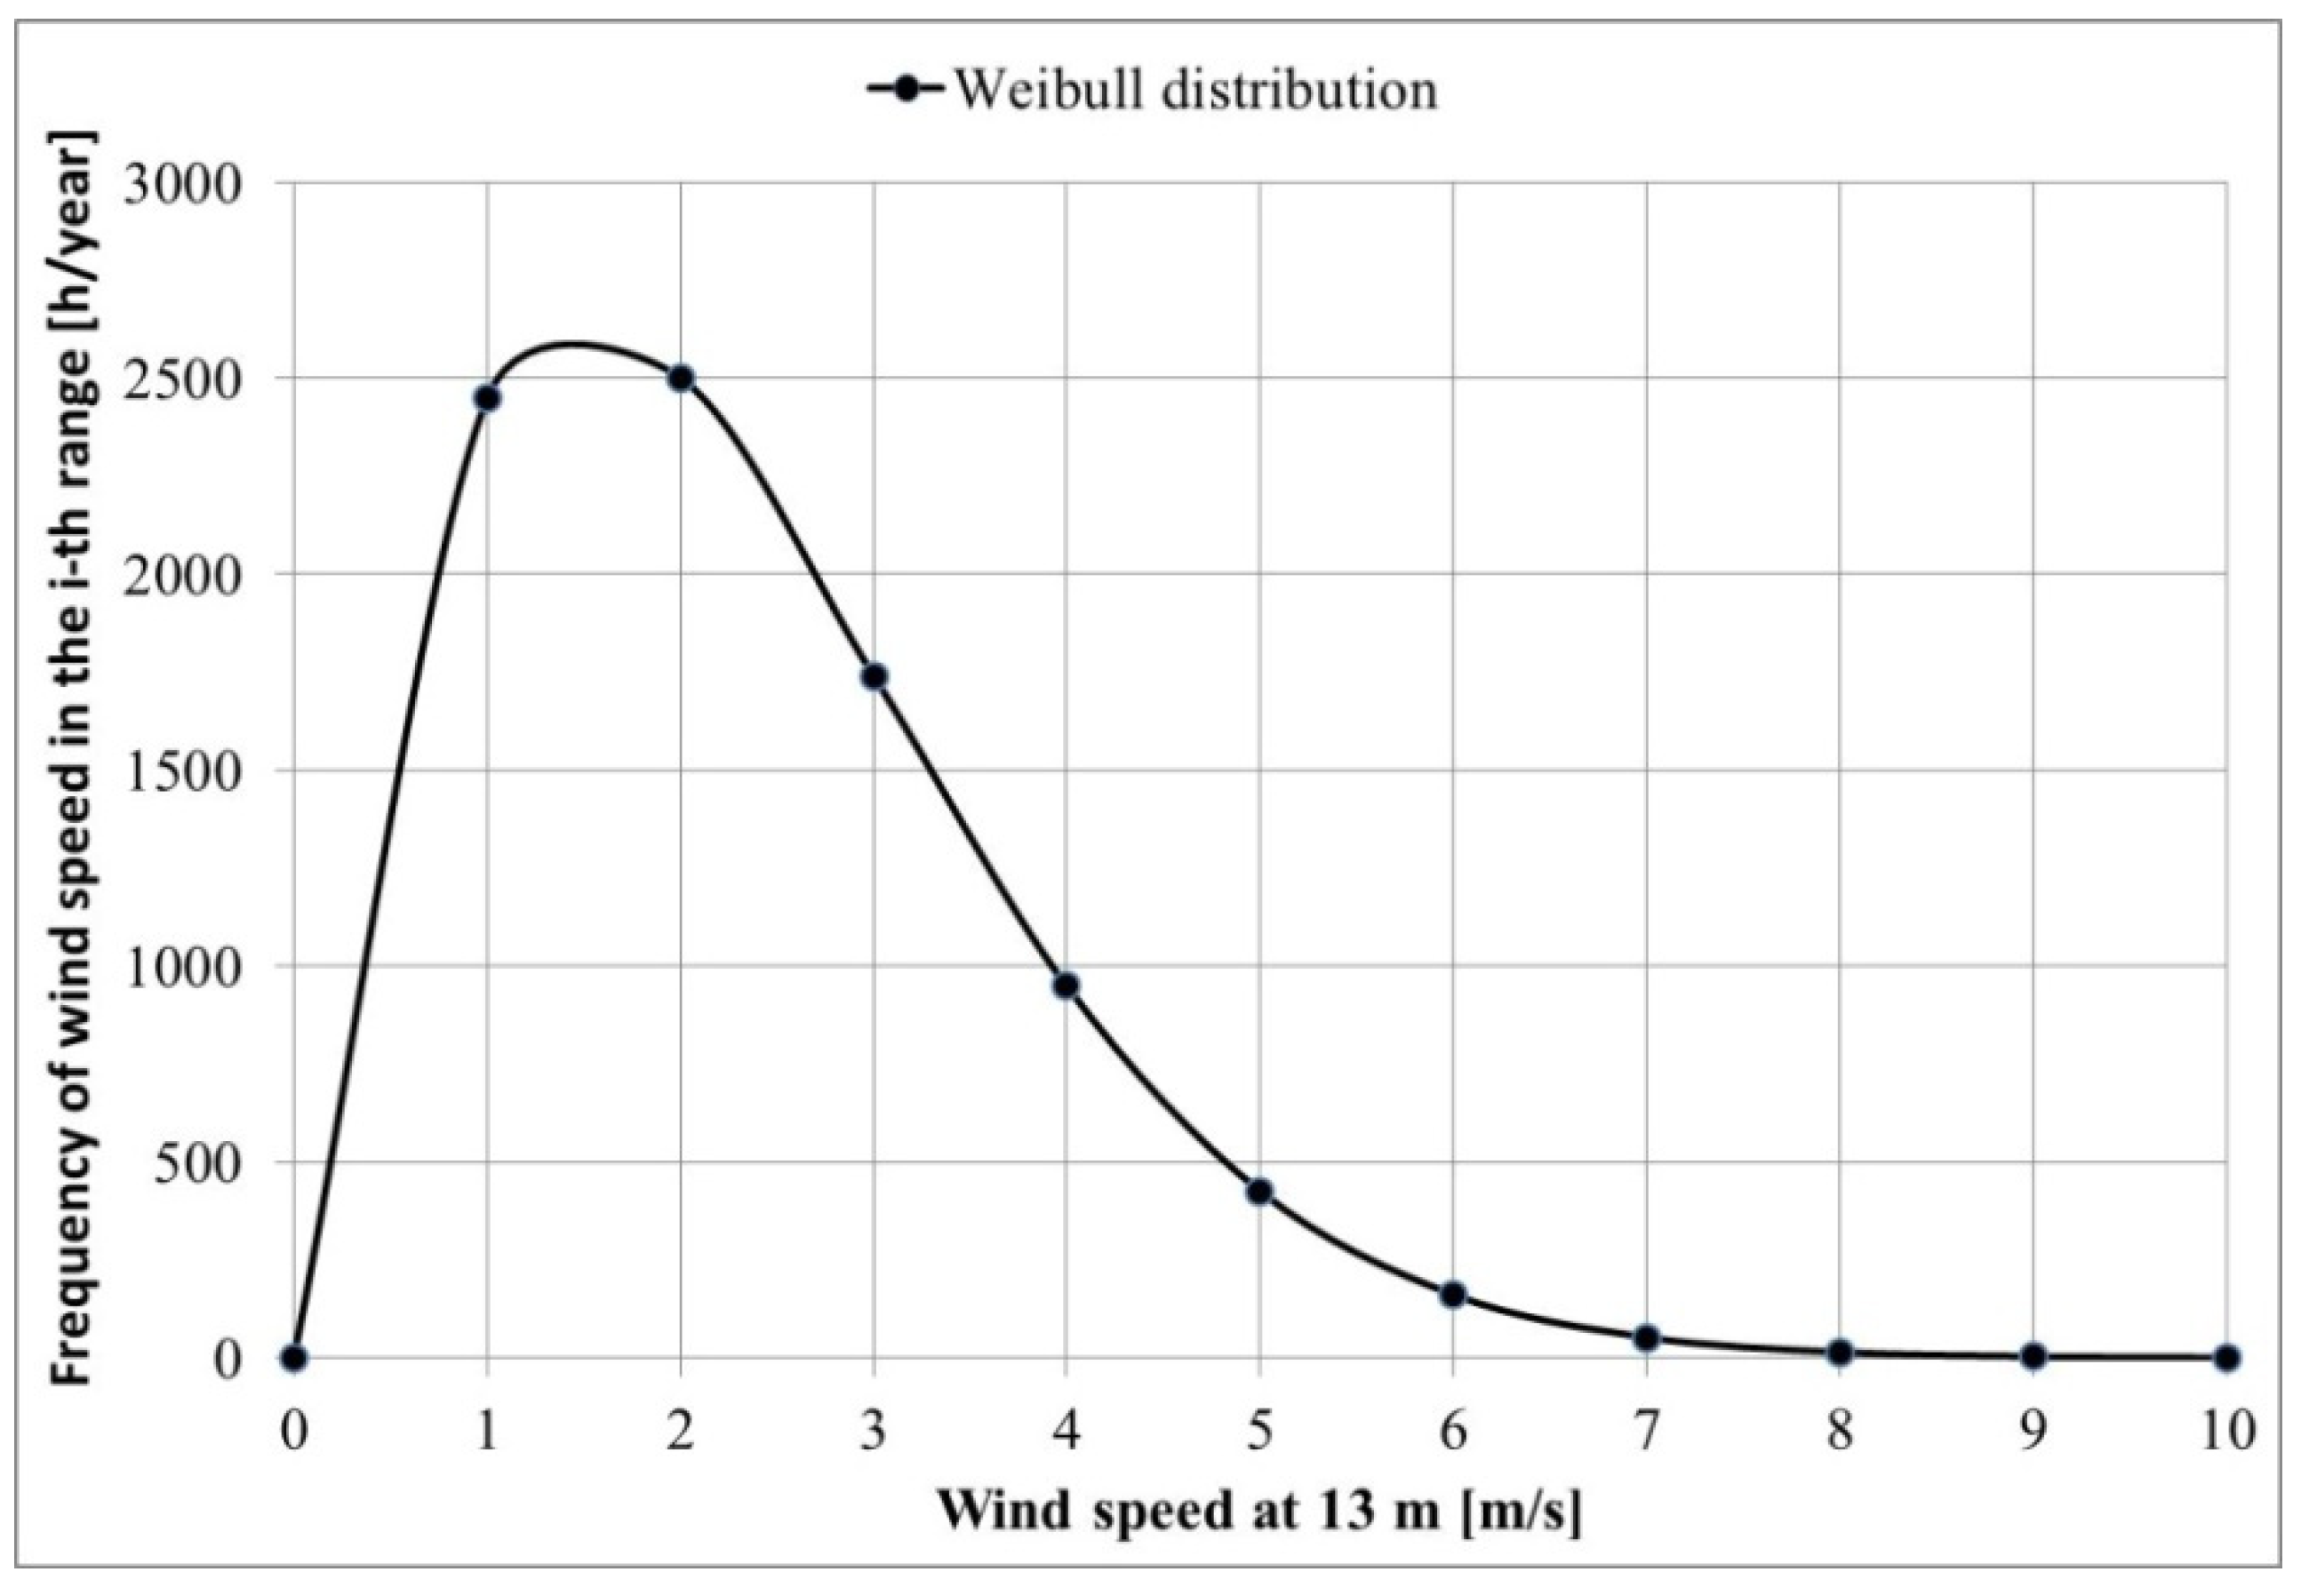
2.2.3. Location III (Loc III)
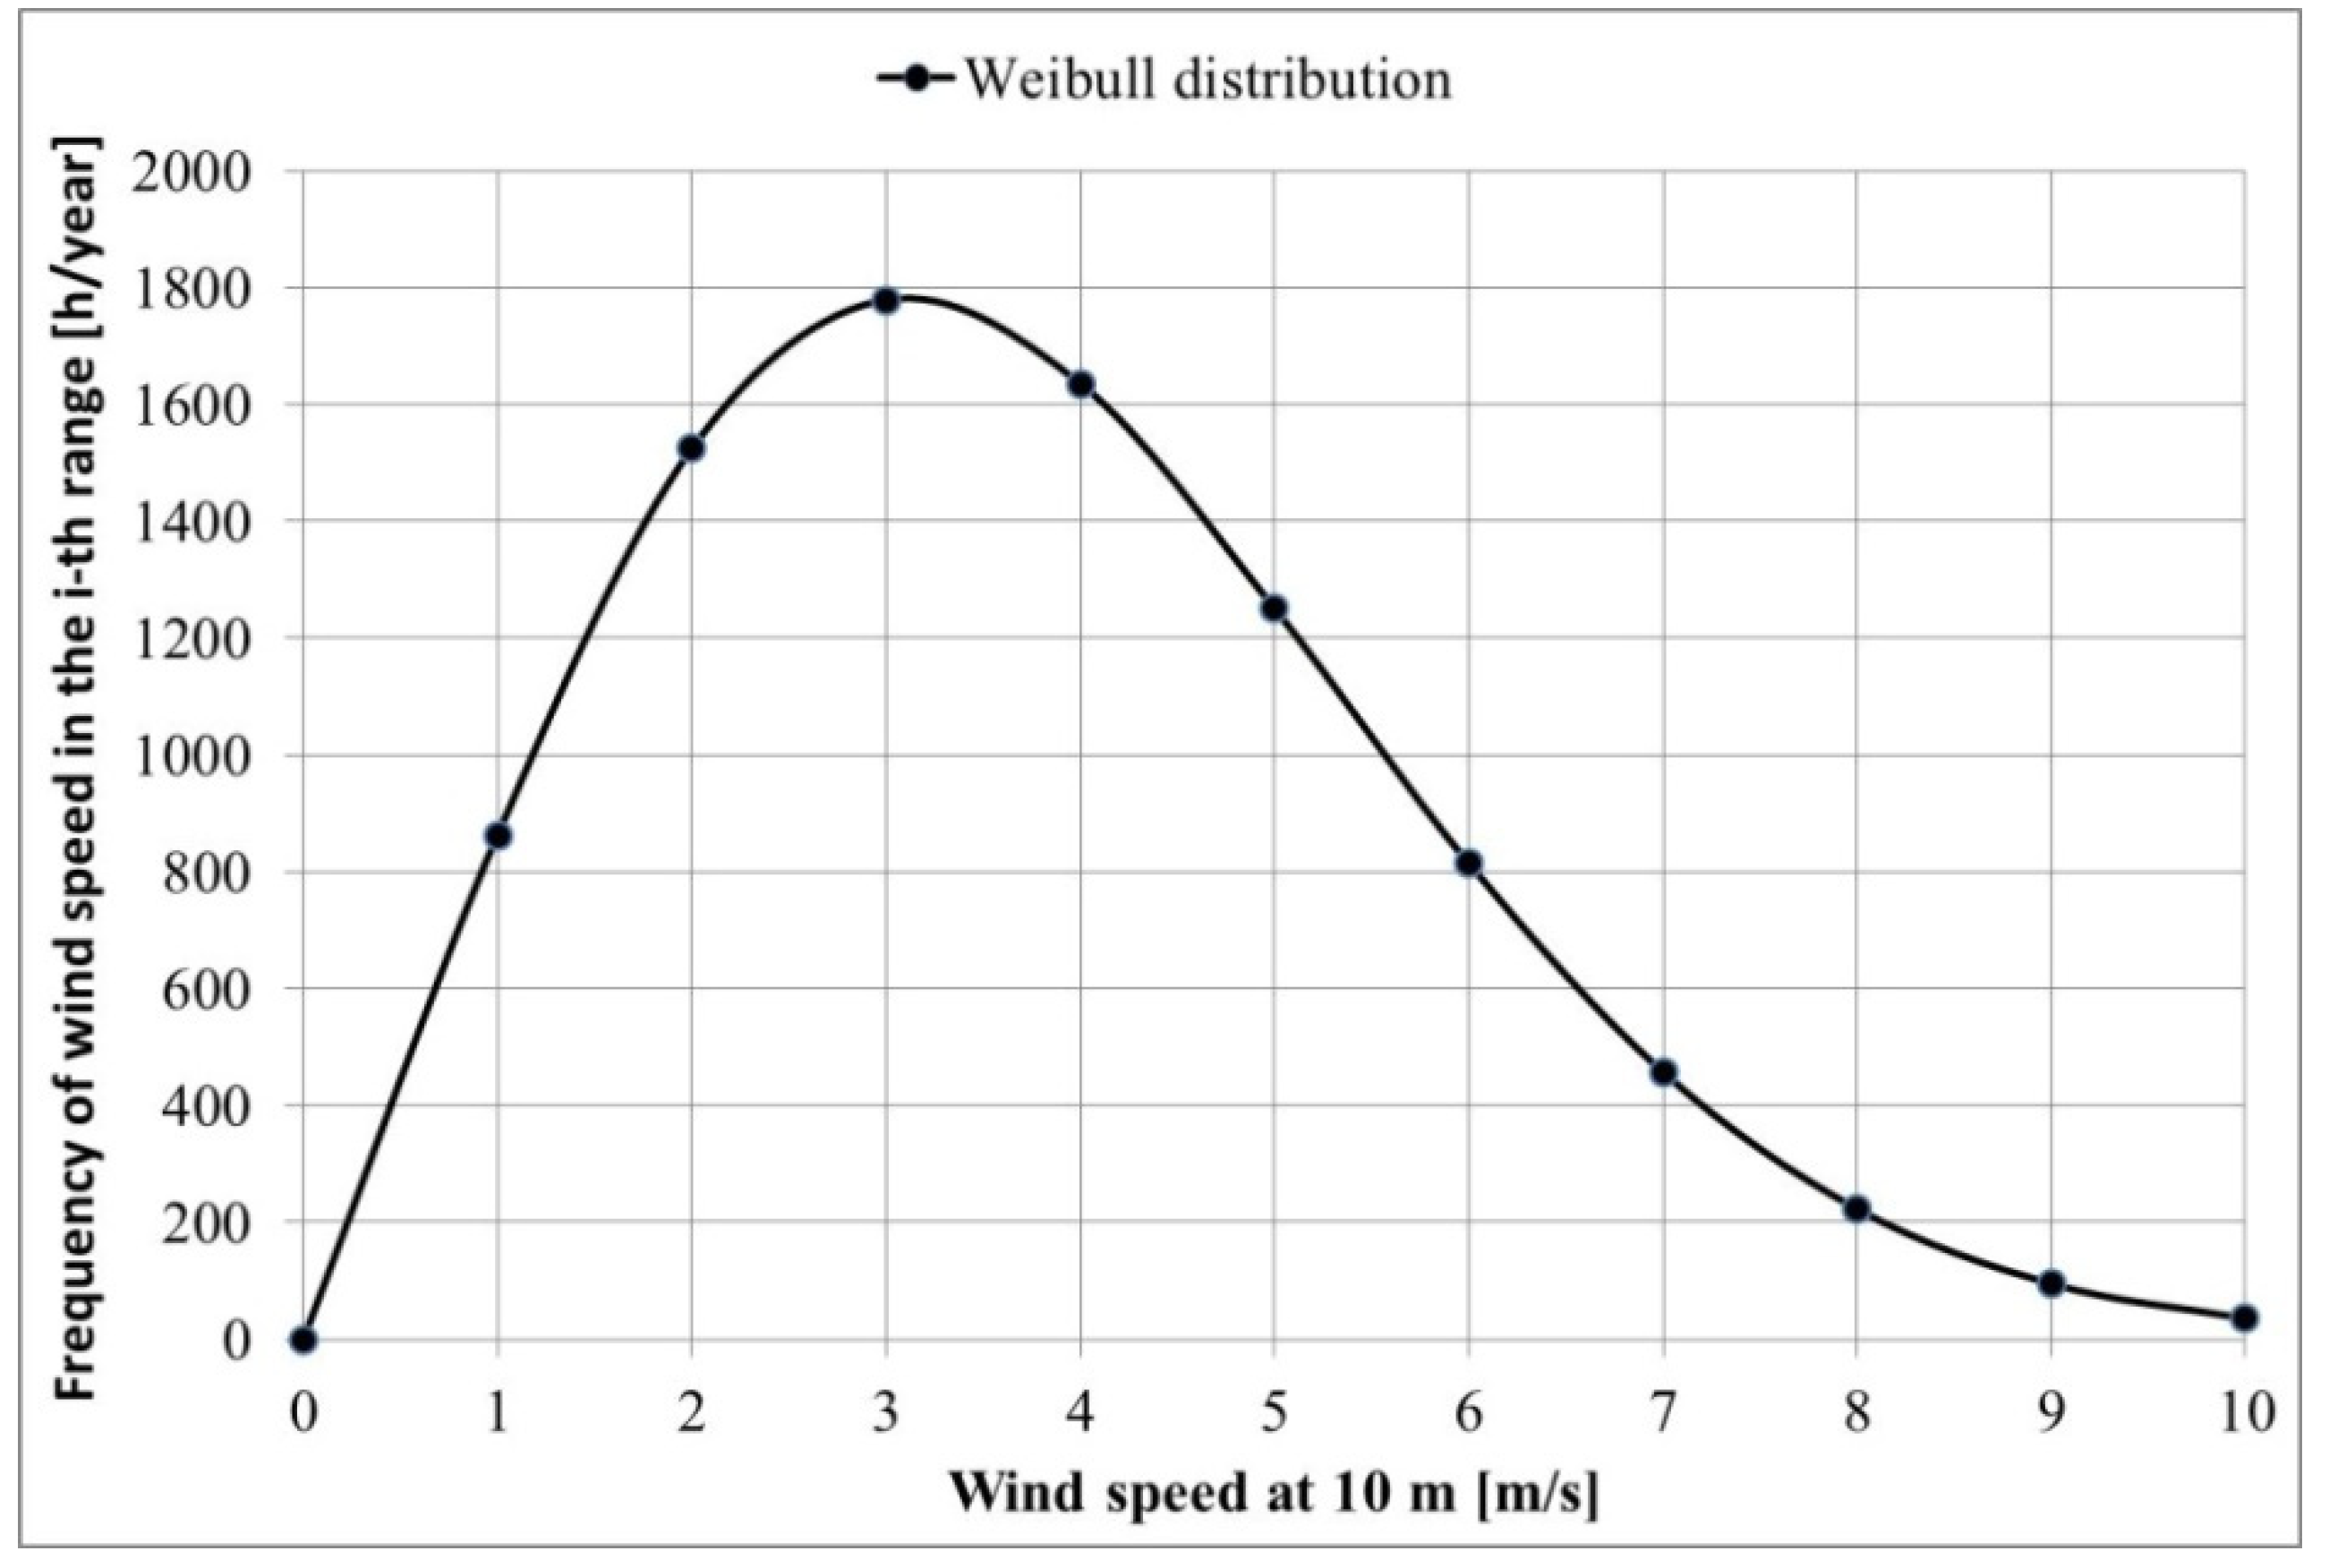
2.2.4. Location IV (Loc IV)
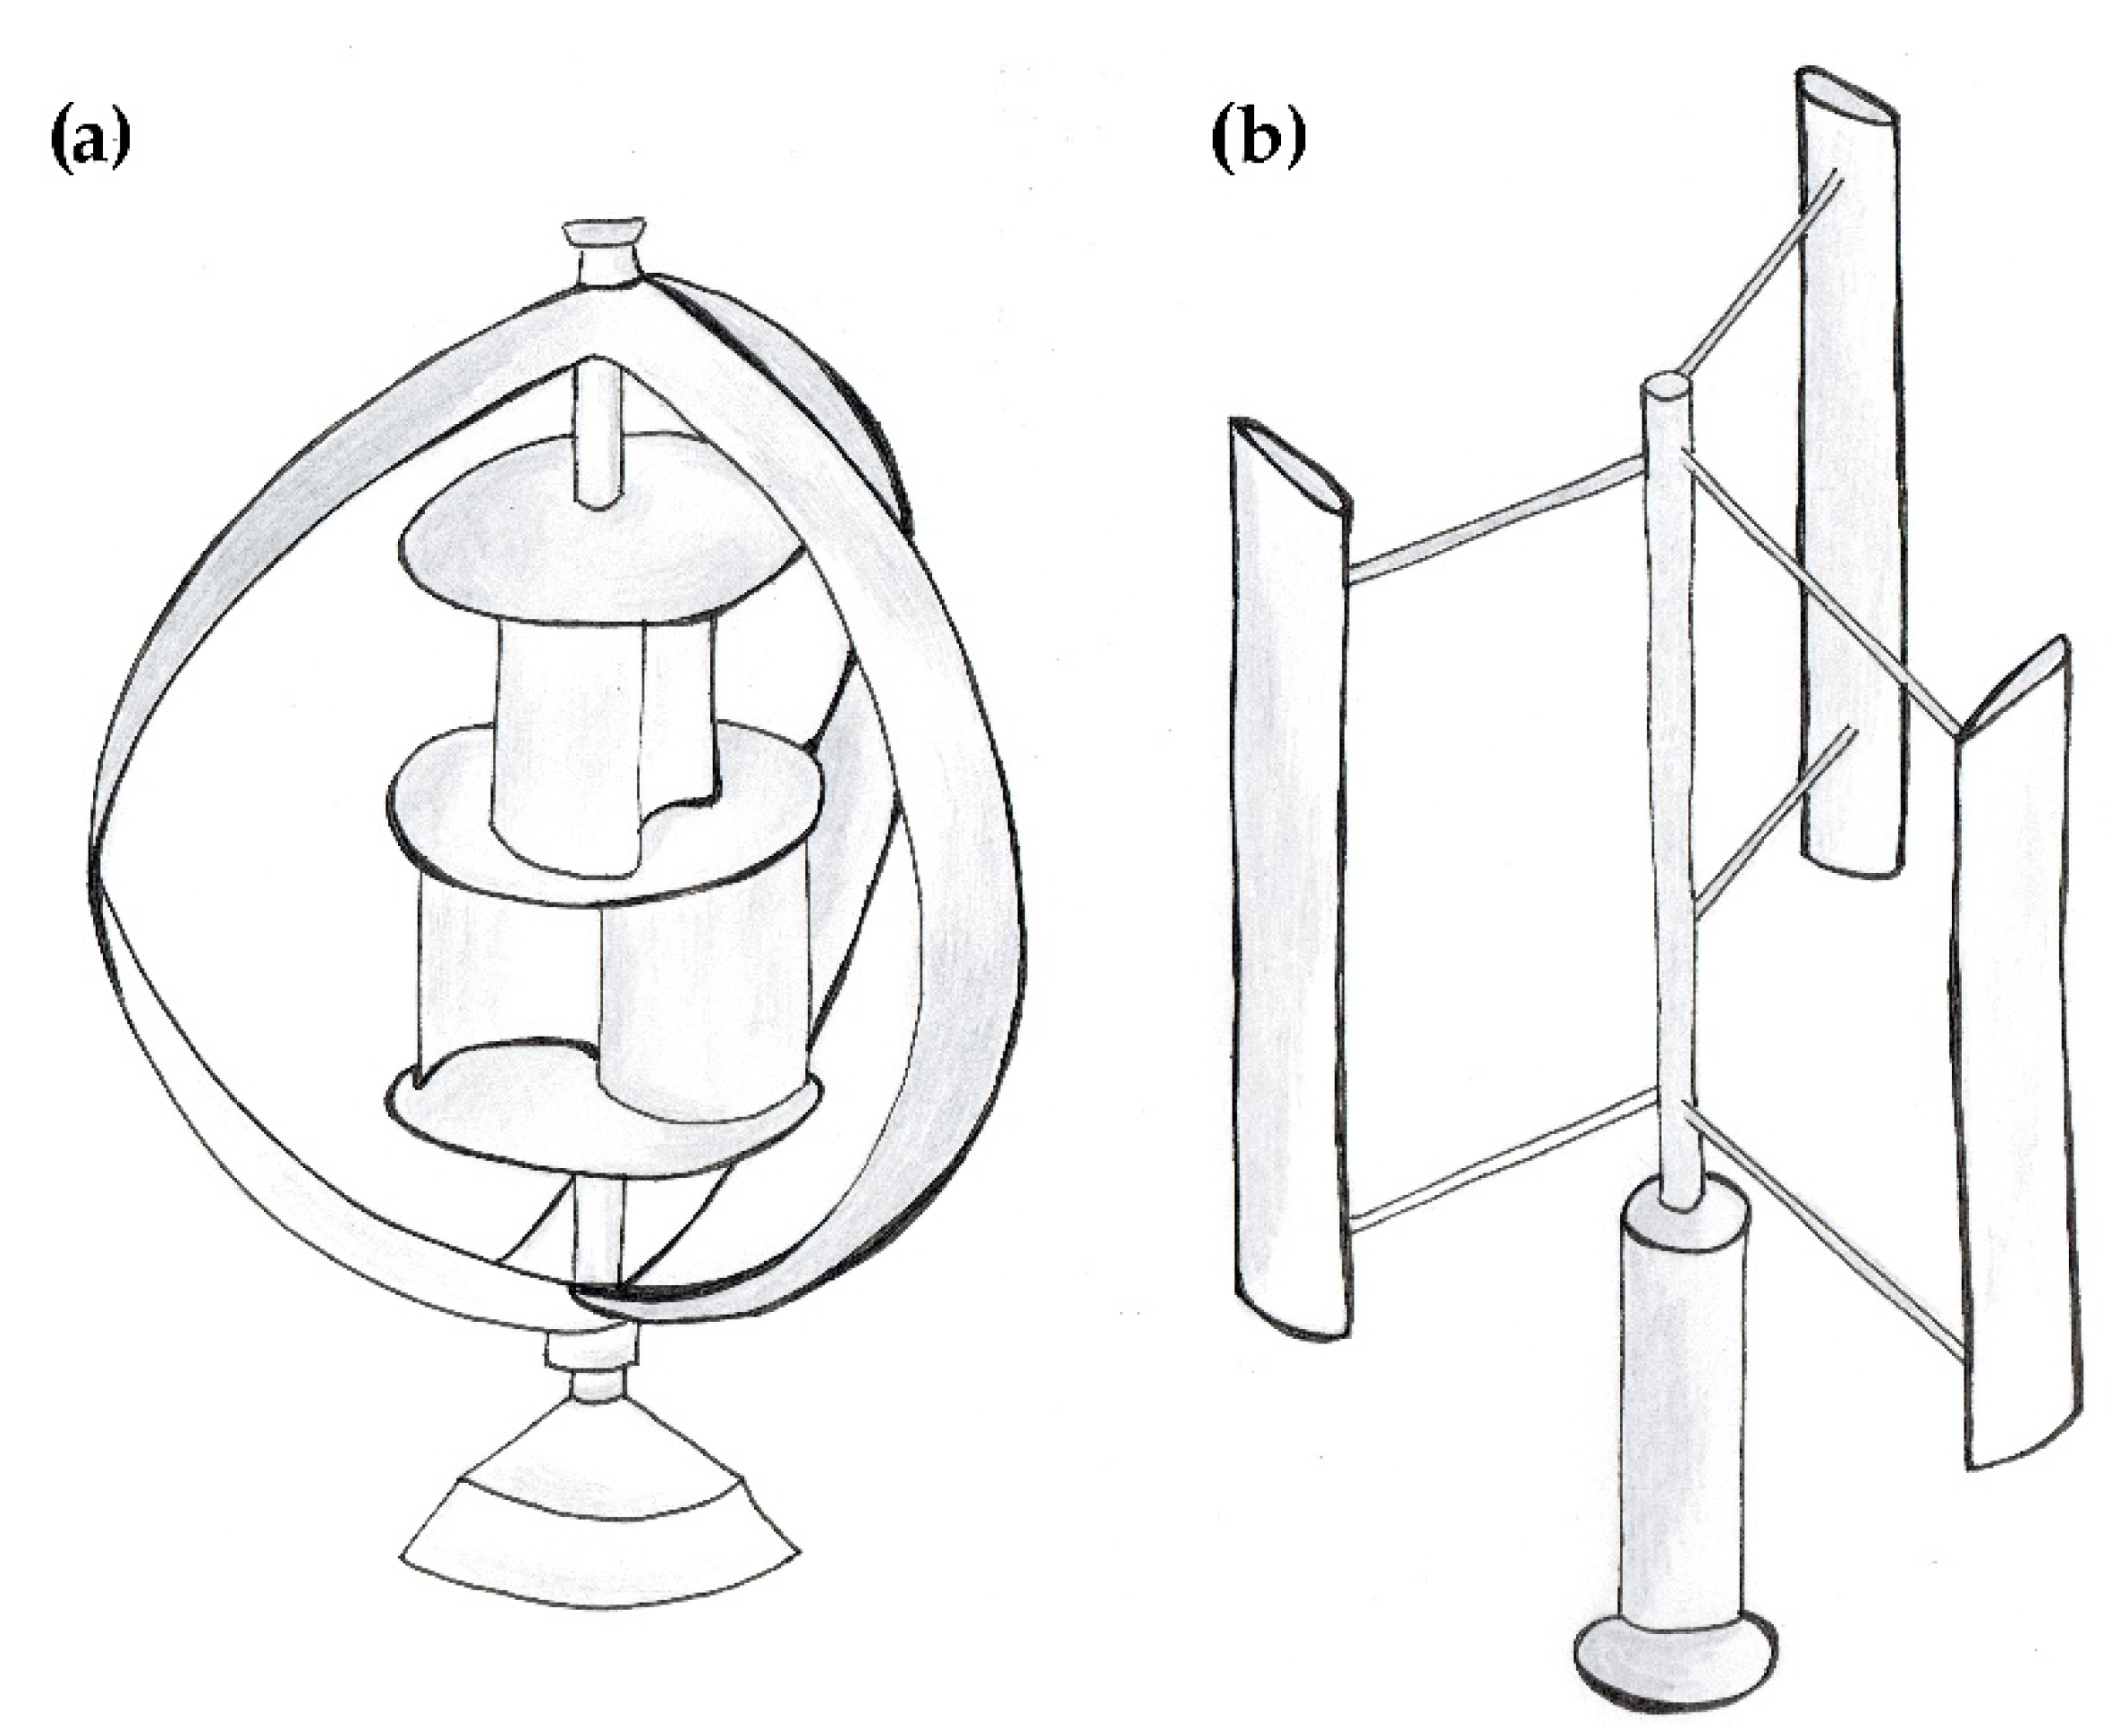
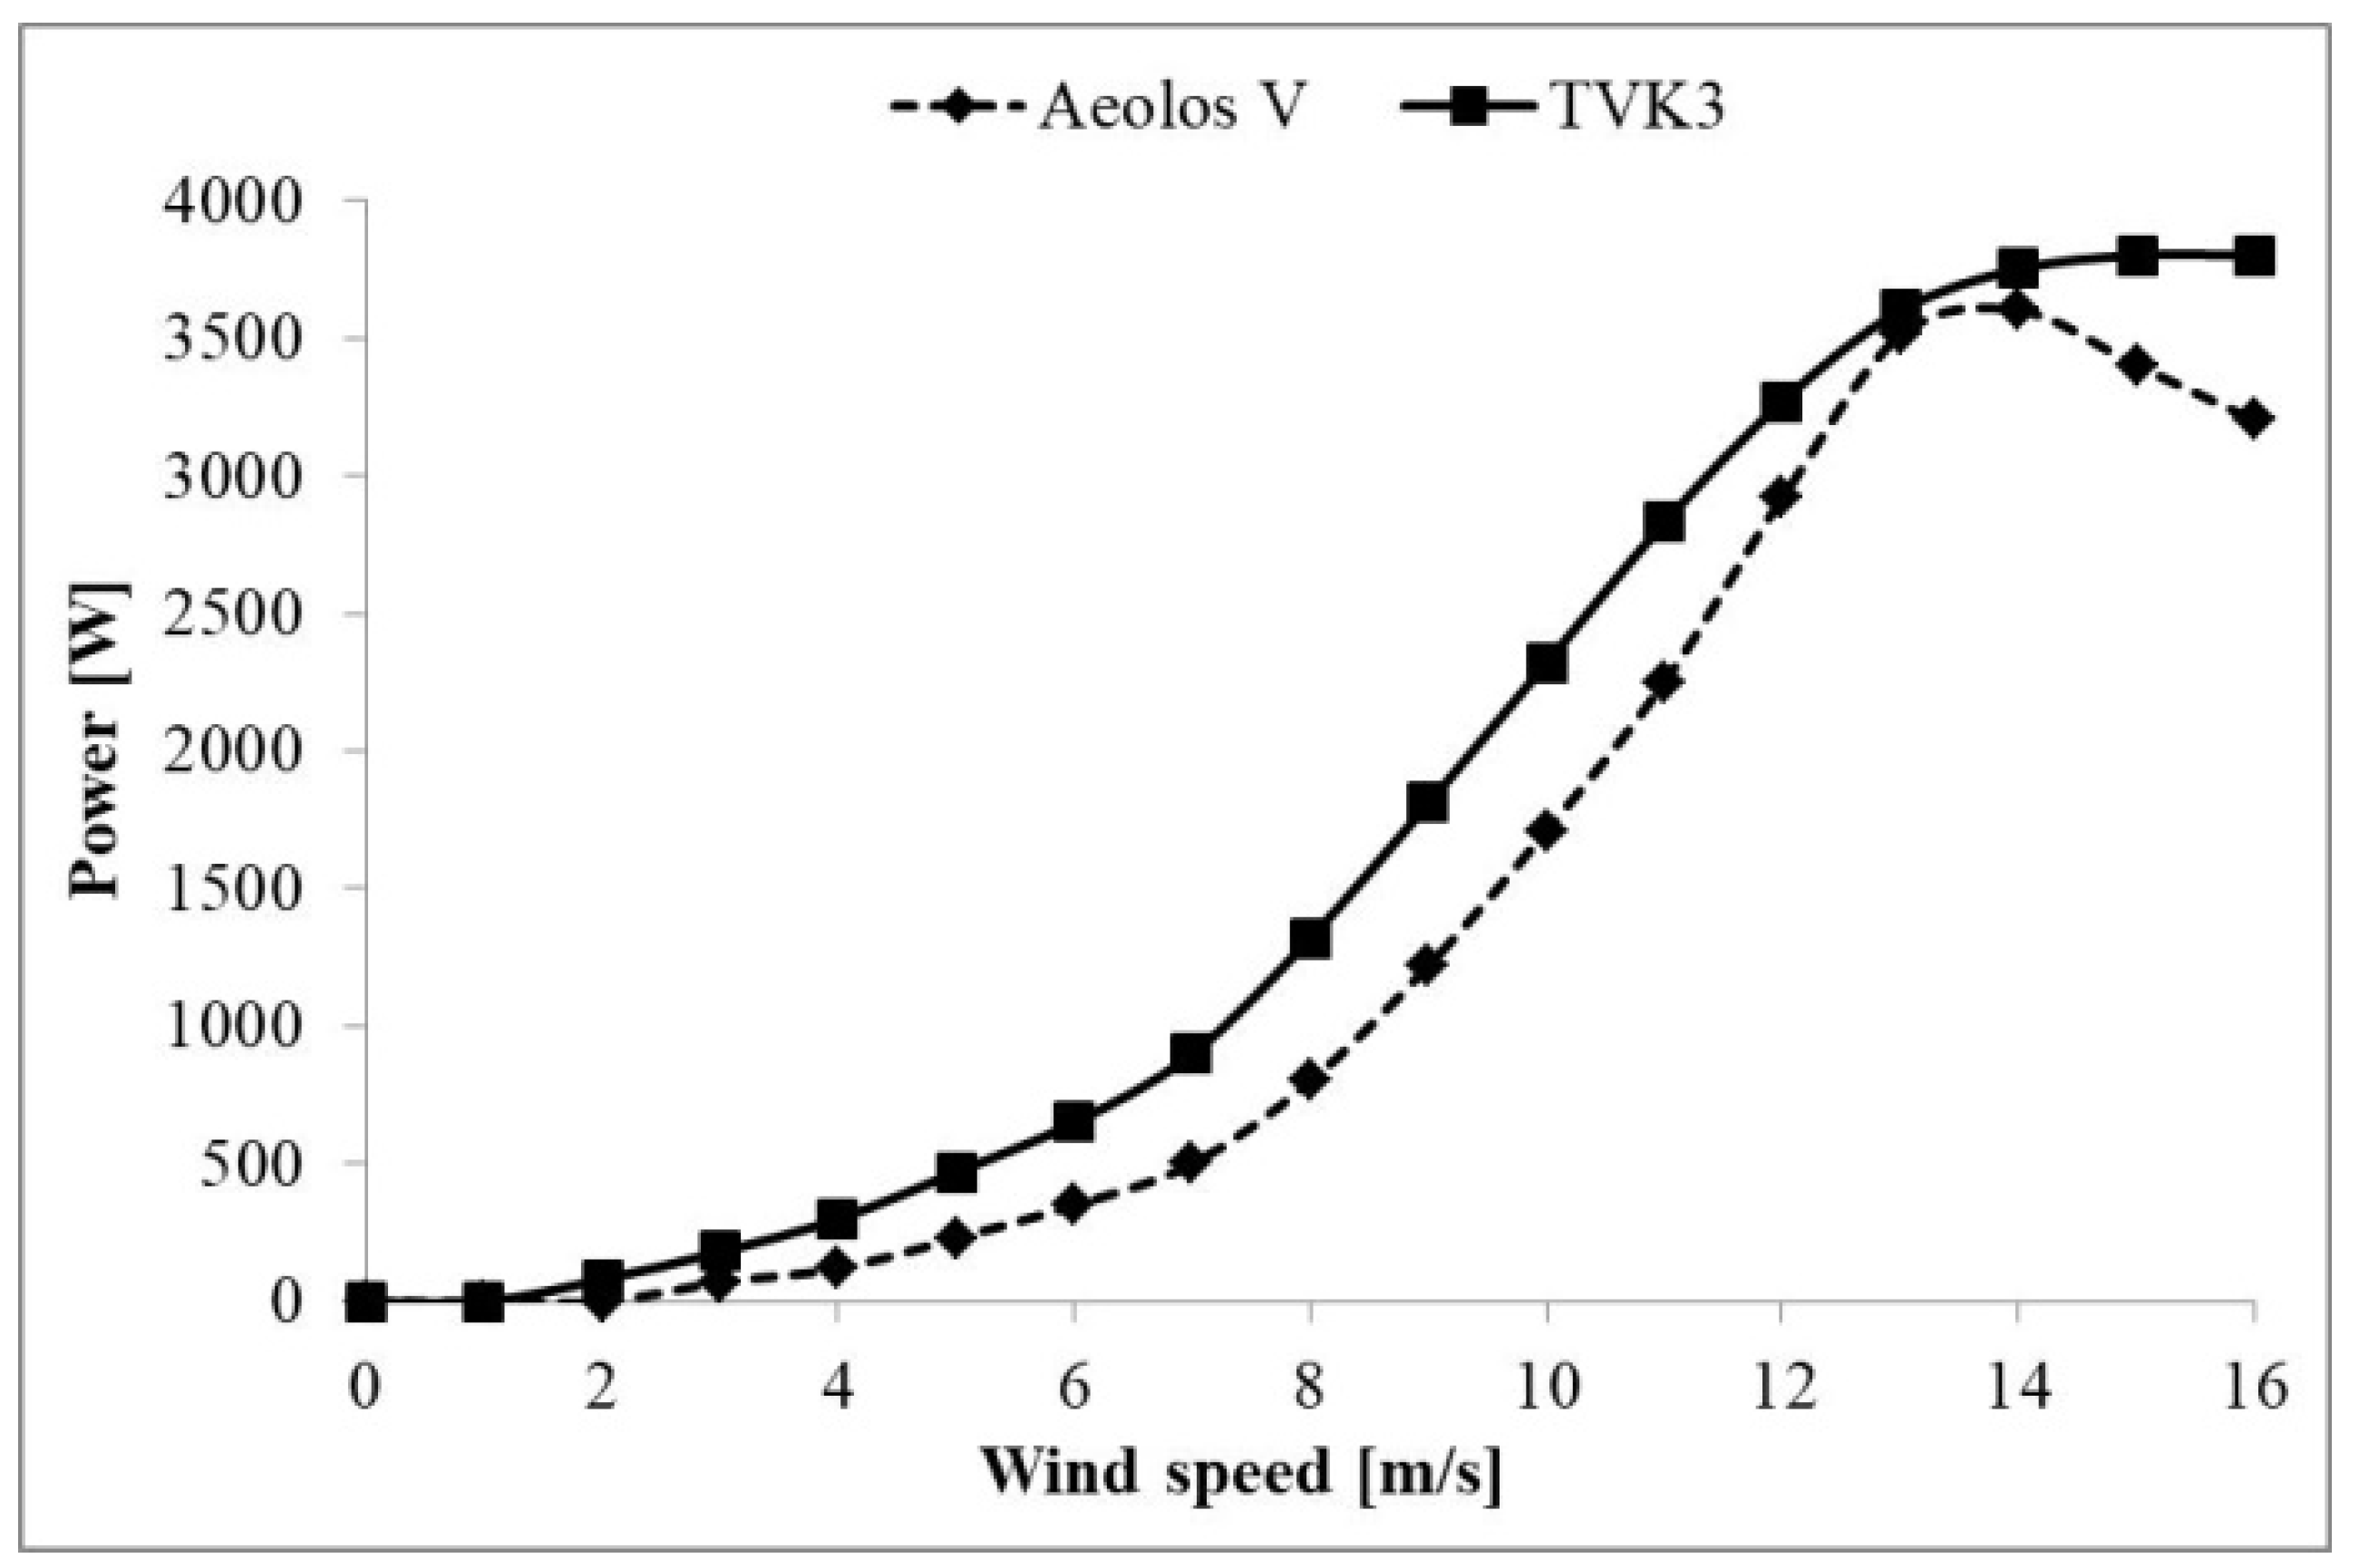
2.3. Comparative Turbines
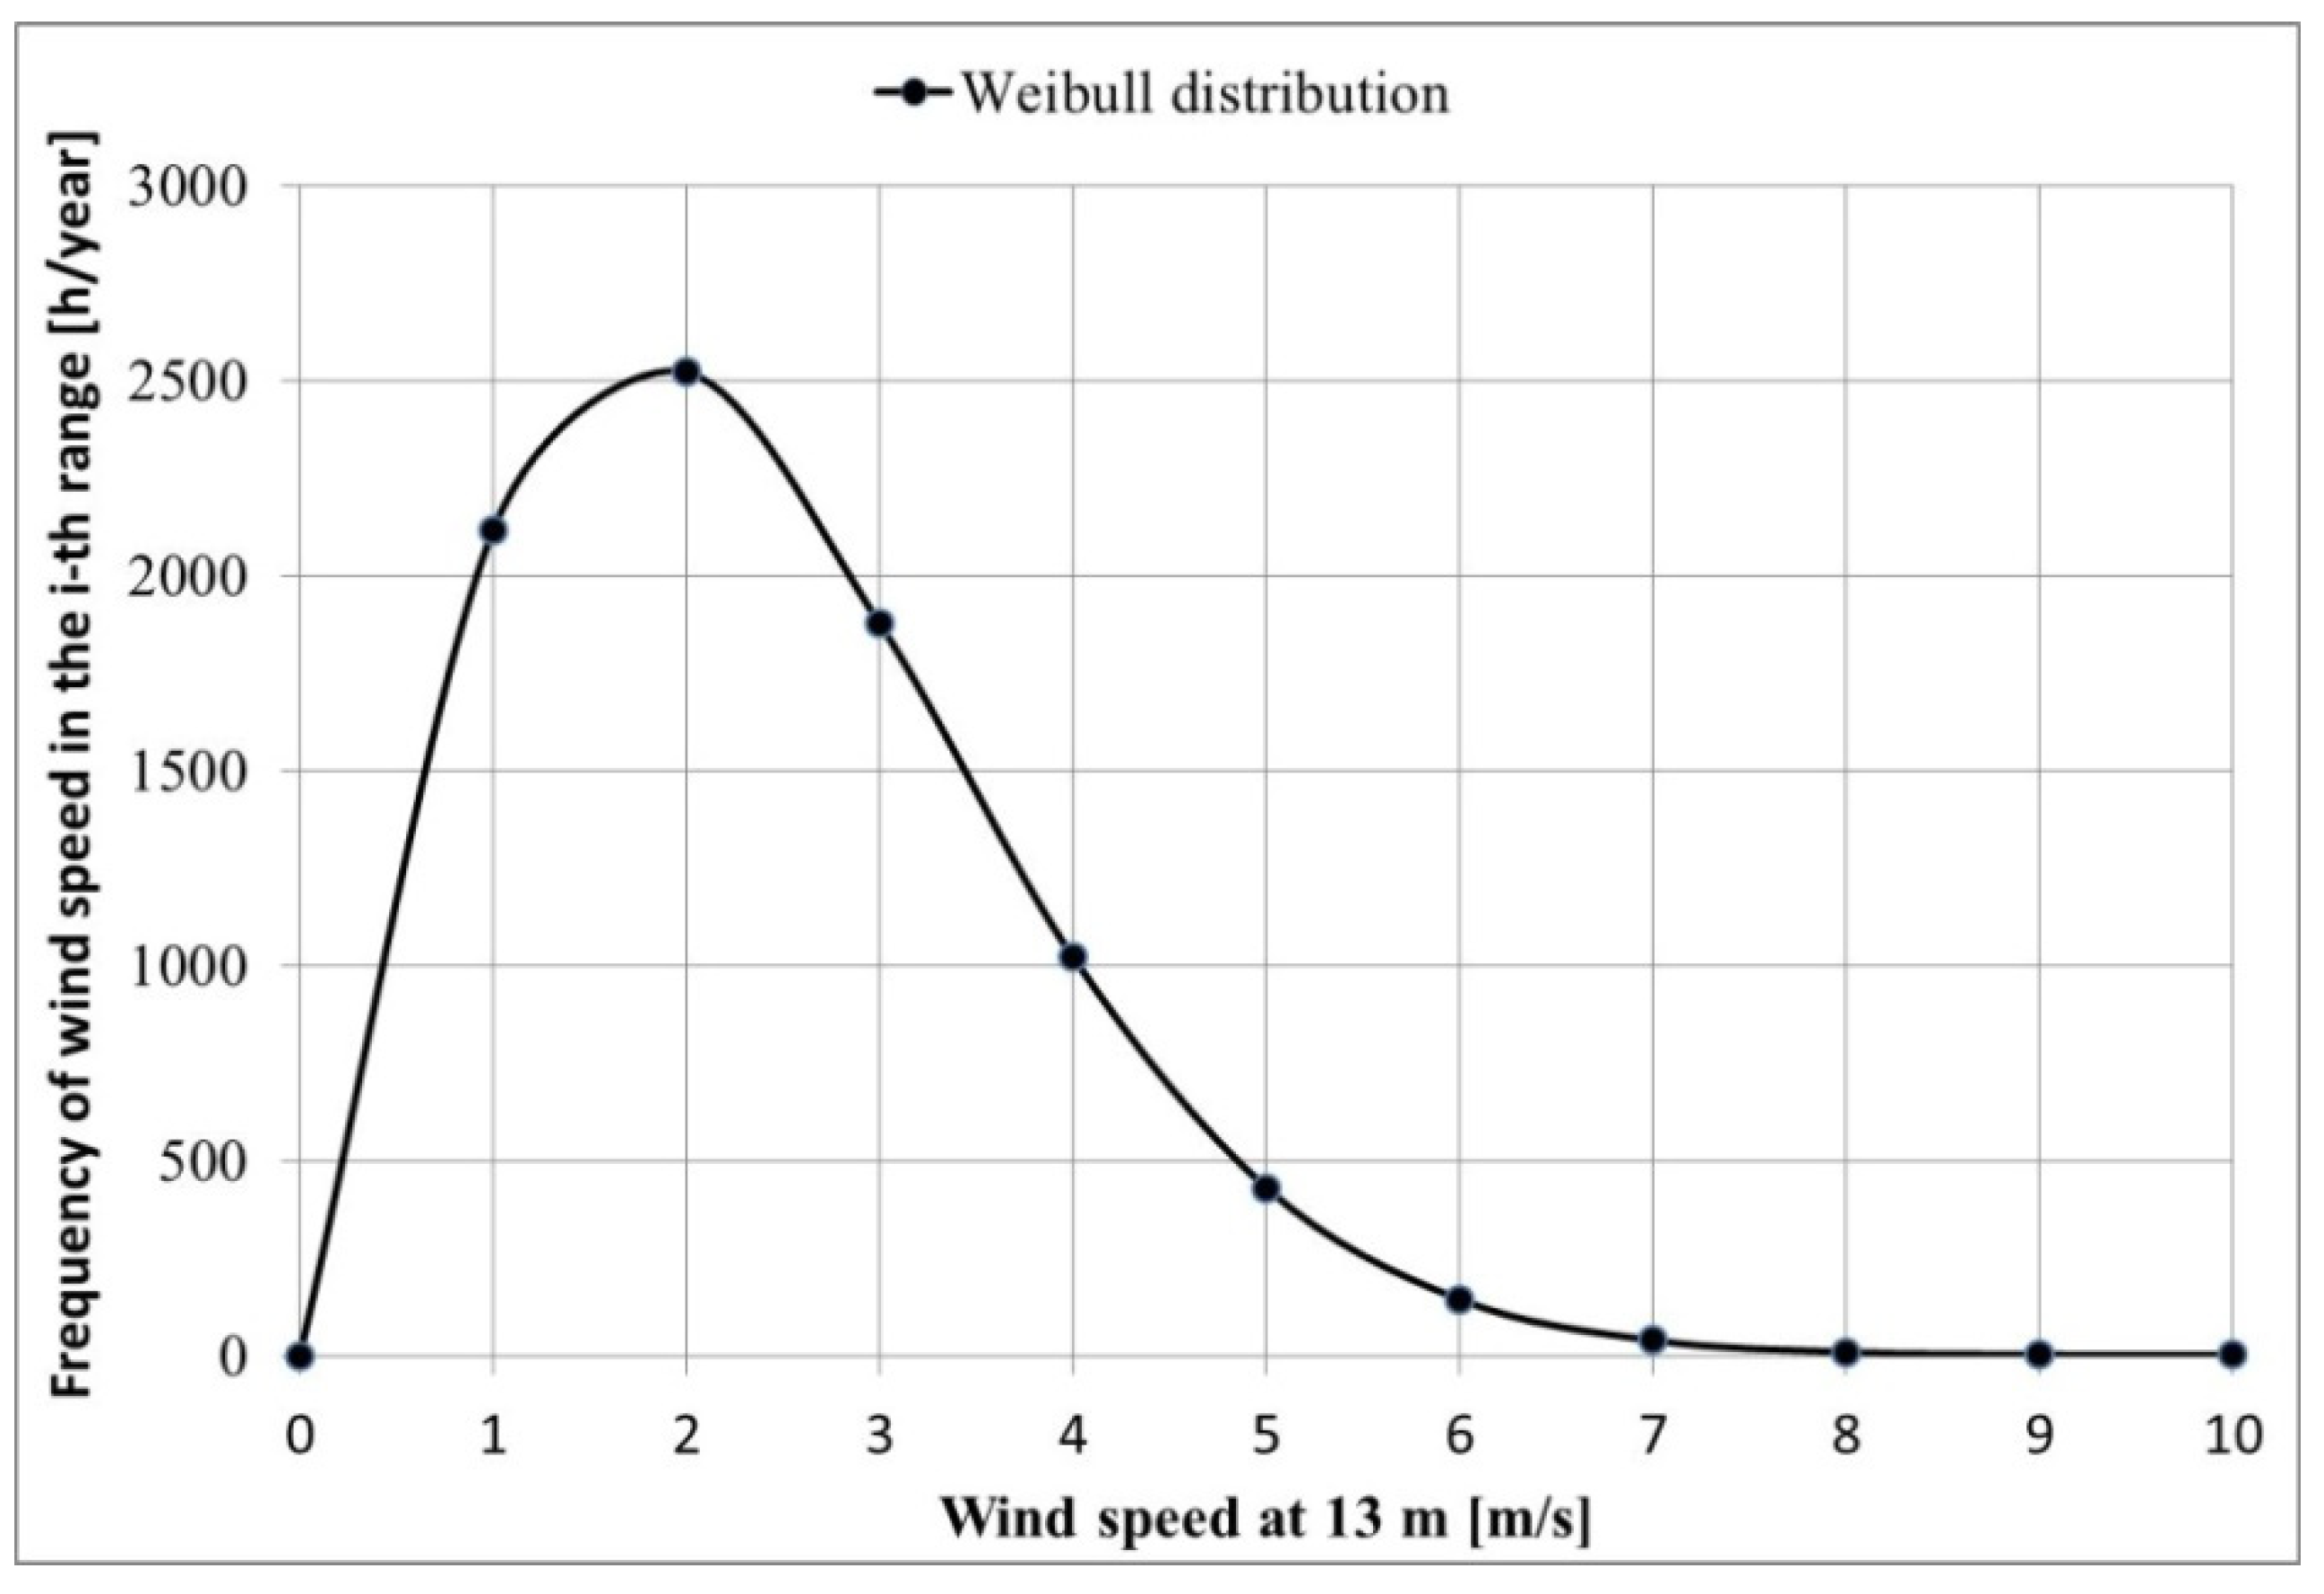
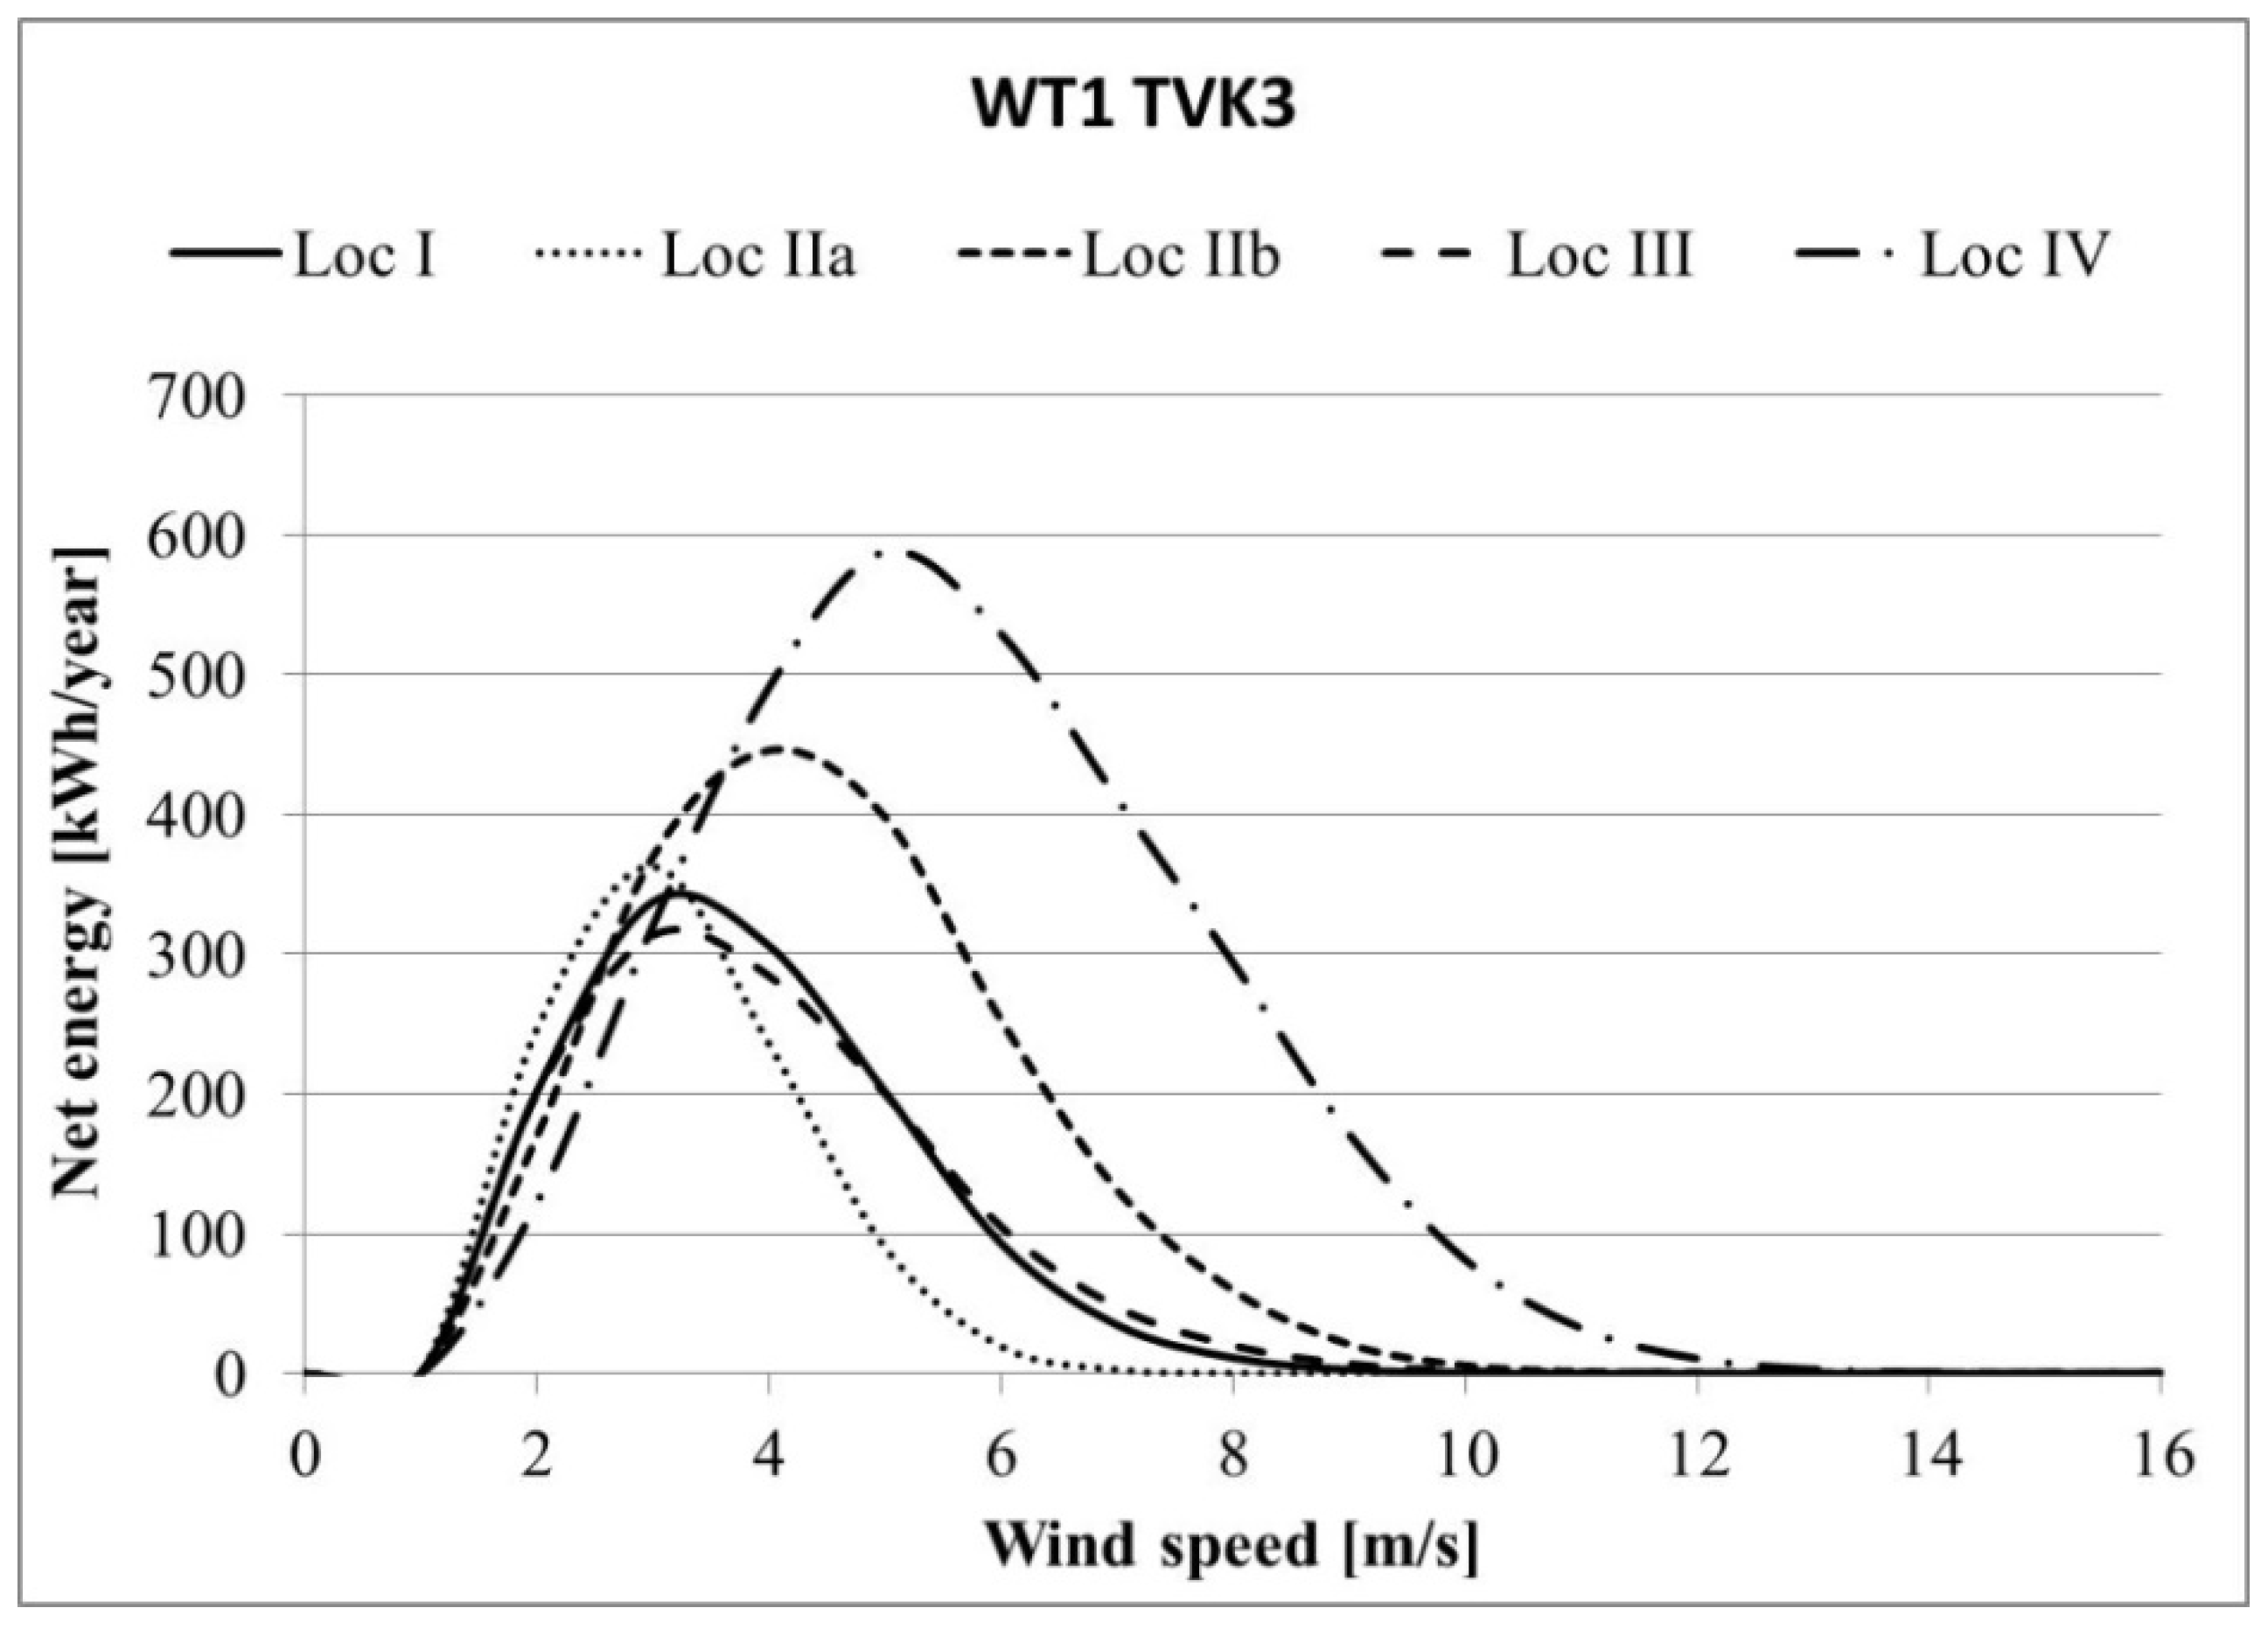
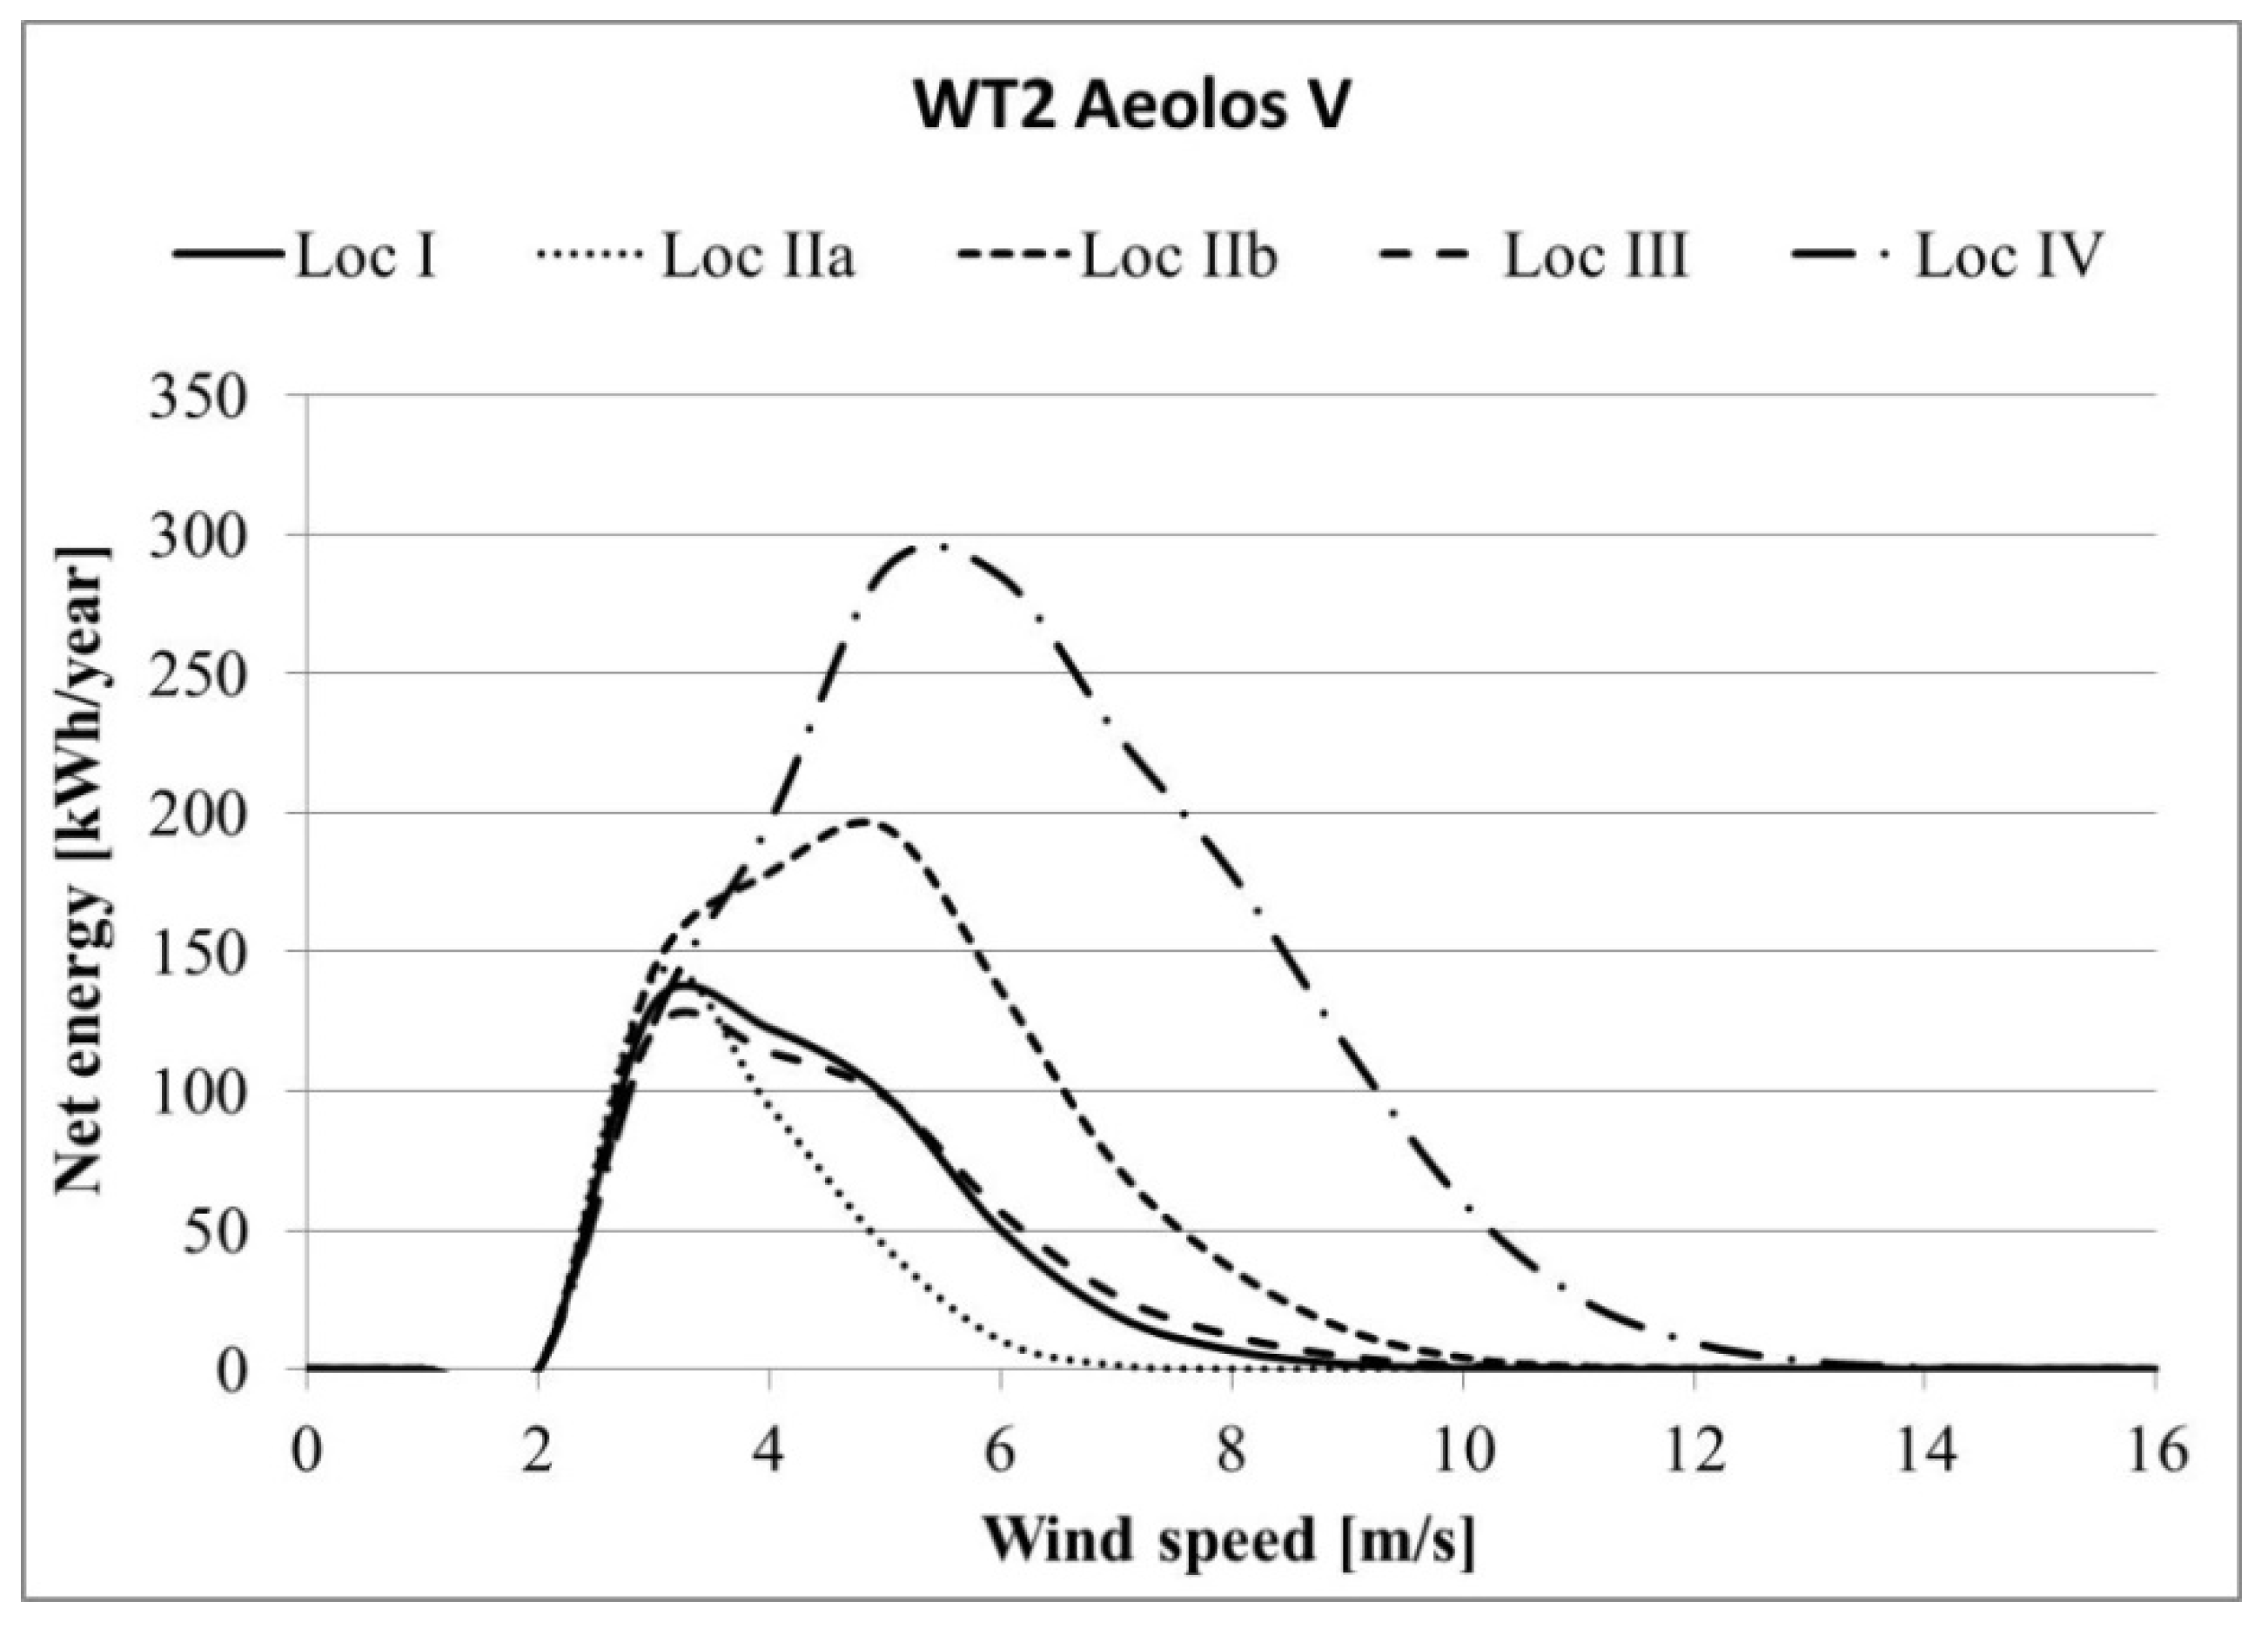
3. Results
- TY—one year expressed in hours, 8760 h
- fi—frequency of wind speed falling within the i-th range.
4. Discussion
5. Conclusions
- The location of a wind turbine requires individual analysis of wind speed over a period of at least 1 year and an assessment of energy potential.
- The impact of neighboring buildings on wind parameters should be determined before selecting a wind turbine location in an urbanized area.
- In the urbanized area, the wind reaches half of the speed throughout the year compared to the open area. There is a definite advantage of very light winds (up to 2 m/s) and a large proportion of so-called atmospheric calms, especially during night hours in spring and summer.
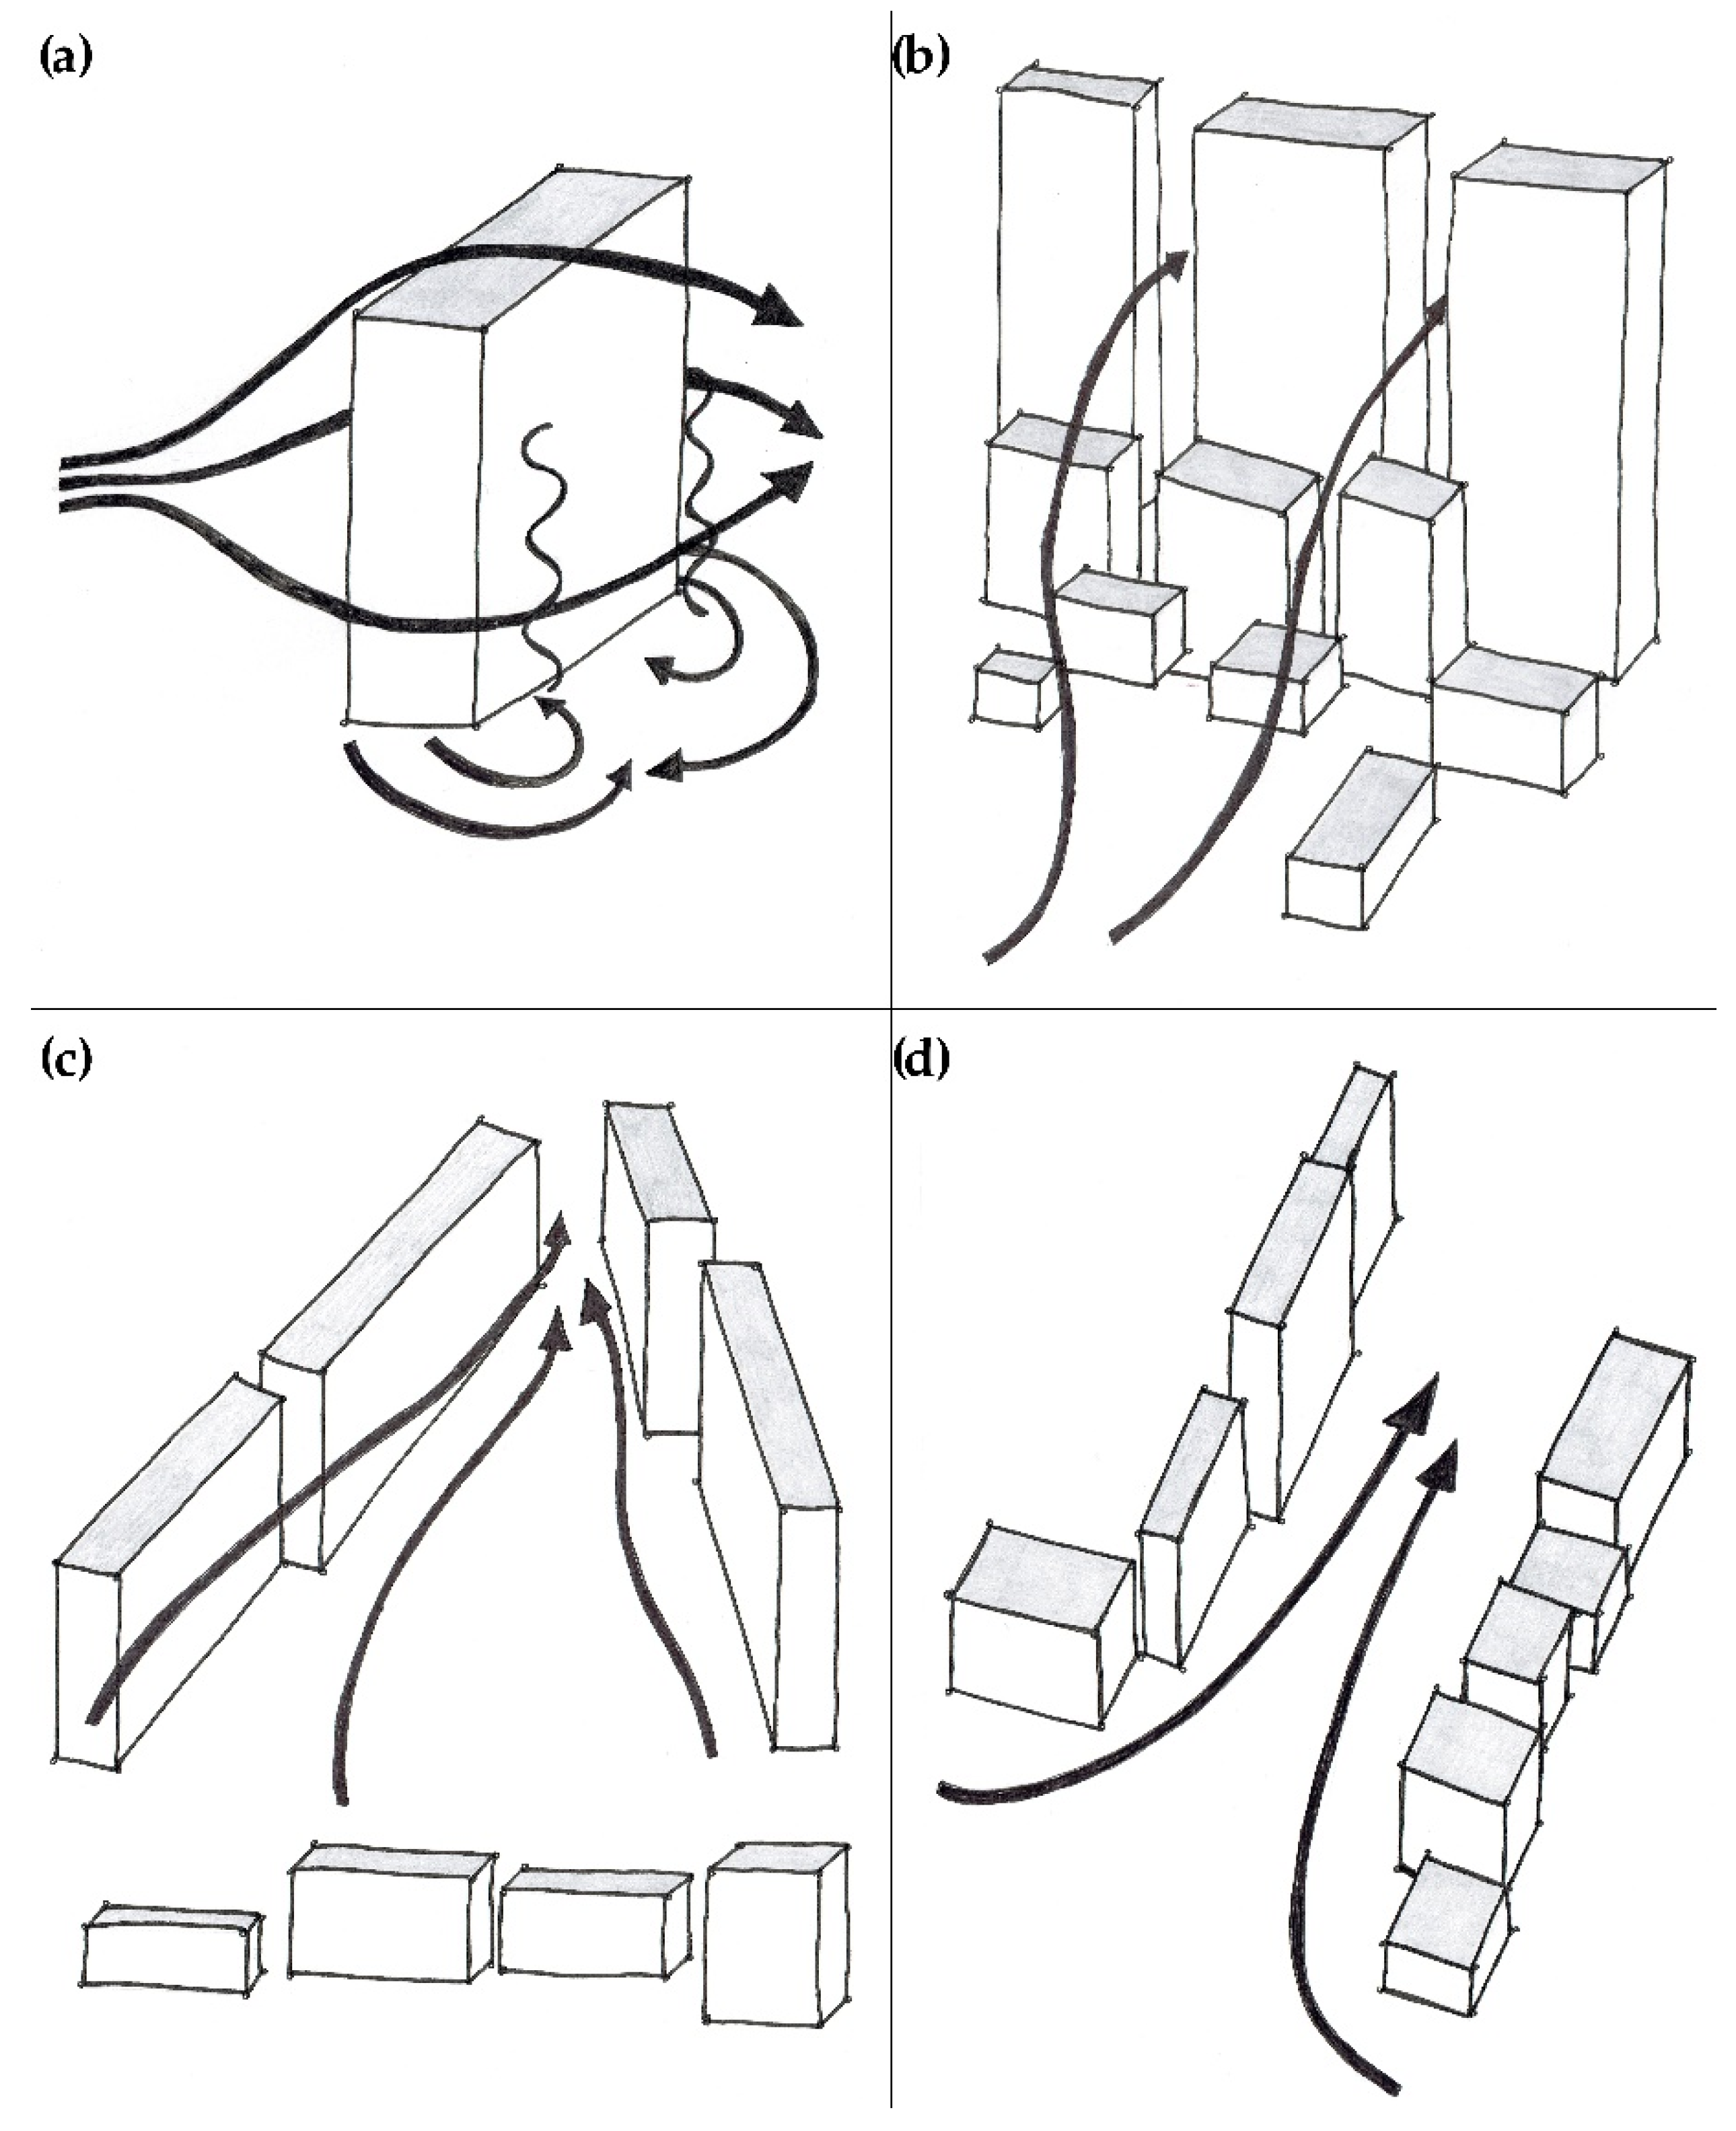
- Compared with the non-built up area, there are significant deformations of wind speed and direction in the urban area due to the presence of high roughness of anthropological type (buildings and structures, towers, poles).
- The locations studied do not demonstrate wind potential that can economically justify a wind turbine.
- Wind zones that characterize the wind potential of a given location in open area do not have a significant impact on wind conditions in built-up areas located in that region.
- It was demonstrated that energy productivity in a built-up area (Koszalin) located in a zone with very favorable wind conditions may be comparable to that in a zone with little favorable wind conditions (Białystok).
Author Contributions
Funding
Institutional Review Board Statement
Informed Consent Statement
Data Availability Statement
Conflicts of Interest
References
- Enevoldsen, P.; Permien, F.H.; Bakhtaoui, I.; von Krauland, A.K.; Jacobson, M.; Xydis, G.; Sovacool, B.; Valentine, S.; Luecht, D.; Oxley, G. How much wind power potential does europe have? Examining european wind power potential with an enhancedsocio-technical atlas. Energy Policy 2019, 132, 1092–1100. [Google Scholar] [CrossRef]
- Letcher, T.M. Wind Energy Engineering: A Handbook for Onshore and Offshore Wind Turbines, 1st ed.; Academic Press: Cambridge, MA, USA; Elsevier: Amsterdam, The Netherlands, 2017. [Google Scholar]
- Zagubień, A.; Ingielewicz, R. The analysis of similarity of calculation results and local measurements of wind farm noise. Measurement 2017, 106, 211–220. [Google Scholar] [CrossRef]
- Zagubień, A.; Wolniewicz, K. The impact of supporting tower on wind turbine noise emission. Appl. Acoust. 2019, 5, 260–270. [Google Scholar] [CrossRef]
- Wolniewicz, K.; Zagubień, A.; Wesolowski, M. Energy and Acoustic Environmental Effective Approach for a Wind Farm Location. Energies 2021, 14, 7290. [Google Scholar] [CrossRef]
- Kurpas, D.; Mroczek, B.; Karakiewicz, B.; Kassolik, K.; Andrzejewski, W. Health impact of wind farms. Ann. Agric. Environ. Med. 2013, 20, 595–605. [Google Scholar]
- DTU. Available online: https://windenergy.dtu.dk/english/research/publicationslist?dtulistcode=ISTLIST46&fr=1&mr=100&ptype=all&qt=DtuPublicationQuery (accessed on 12 April 2022).
- Jianu, O.; Rosen, M.; Naterer, G. Noise Pollution Prevention in Wind Turbines: Status and Recent Advances. Sustainability 2012, 4, 1104–1117. [Google Scholar] [CrossRef] [Green Version]
- Kovalovs, A.; Barkanov, E.; Ruchevskis, S.; Wesolowski, M. Modeling and design of a full-scale rotor blade with embedded piezocomposite actuators. Mech. Compos. Mater. 2017, 53, 179–192. [Google Scholar] [CrossRef]
- Bidaoui, H.; El Abbassi, I.; El Bouardi, A.; Moumen, D. Wind Speed Data Analysis Using Weibull and Rayleigh Distribution Functions, Case Study: Five Cities Northern Morocco. Procedia Manuf. 2019, 32, 786–793. [Google Scholar] [CrossRef]
- Pierzga, R.; Boczar, T.; Wotzka, D. Measurements and Acoustic Analyses of Infrasound Noise Emitted by Operation of Small, Building Mounted Wind Farm. Acta Phys. Pol. A 2015, 128, 294–299. [Google Scholar] [CrossRef]
- Wotzka, D.; Boczar, T.; Malec, T.; Pierzga, R. Analysis of Vibro-Acoustic Signals Generated during Operation of Micro Wind Turbines. Acta Phys. Pol. A 2013, 124, 595–597. [Google Scholar] [CrossRef]
- Zalewska, J.; Damaziak, K.; Malachowski, J. An Energy Efficiency Estimation Procedure for Small Wind Turbines at Chosen Locations in Poland. Energies 2021, 14, 3706. [Google Scholar] [CrossRef]
- Manwell, J.F.; McGowan, J.G.; Rogers, A.L. Wind Energy Explained: Theory, Design and Application; Wiley: Hoboken, NJ, USA, 2009. [Google Scholar]
- Jakubowski, M.; Mech, Ł.; Wolniewicz, K. A methodology of wind turbines selection for the given wind conditions. J. Mech. Energy Eng. 2017, 1, 171–178. [Google Scholar]
- Chen, X.; Jeong, S.; Park, H.; Kim, J.; Park, C.R. Urbanization has stronger impacts than regional climate change on wind stilling: A lesson from South Korea. Environ. Res. Lett. 2020, 15, 054016. [Google Scholar] [CrossRef]
- Palusci, O.; Cecere, C. Urban Ventilation in the Compact City: A Critical Review and a Multidisciplinary Methodology for Improving Sustainability and Resilience in Urban Areas. Sustainability 2022, 14, 3948. [Google Scholar] [CrossRef]
- Mittal, H.; Sharma, A.; Gairola, A. A review on the study of urban wind at the pedestrian level around buildings. J. Build. Eng. 2018, 18, 154–163. [Google Scholar] [CrossRef]
- Baidar, S.; Bonin, T.; Choukulkar, A.; Brewer, A.; Hardesty, M. Observation of the Urban Wind Island Effect. EPJ Web Conf. 2020, 237, 06009. [Google Scholar] [CrossRef]
- Tsichritzis, L.; Nikolopoulou, M. The effect of building height and façade area ratio on pedestrian wind comfort of London. J. Wind Eng. Ind. Aerodyn. 2019, 191, 63–75. [Google Scholar] [CrossRef]
- Palusci, O.; Monti, P.; Cecere, C.; Montazeri, H.; Blocken, B. Impact of morphological parameters on urban ventilation in compact cities: The case of the Tuscolano-Don Bosco district in Rome. Sci. Total Environ. 2022, 807, 150490. [Google Scholar] [CrossRef]
- Allegrini, J.; Dorer, V.; Carmeliet, J. Influence of morphologies on the microclimate in urban neighbourhoods. J. Wind. Eng. Ind. Aerodyn. 2015, 144, 108–117. [Google Scholar] [CrossRef]
- Yang, P.; Ren, G.; Yan, P.; Deng, J. Tempospatial Pattern of Surface Wind Speed and the “Urban Stilling Island” in Beijing City. J. Meteorol. Res. 2020, 34, 986–996. [Google Scholar] [CrossRef]
- Wang, J.W.; Yang, H.J.; Kim, J.J. Wind speed estimation in urban areas based on the relationships between background wind speeds and morphological parameters. J. Wind. Eng. Ind. Aerodyn. 2020, 205, 104324. [Google Scholar] [CrossRef]
- Stathopoulos, T. Wind environmental conditions around tall buildings with chamfered corners. J. Wind. Eng. Ind. Aerodyn. 1985, 21, 71–87. [Google Scholar] [CrossRef]
- Lam, K.M. Wind environment around the base of a tall building with a permeable intermediate floor. J. Wind. Eng. Ind. Aerodyn. 1992, 4, 2313–2314. [Google Scholar] [CrossRef]
- Siedlecki, M. Urban–rural wind speed differences in Łódź. In Proceedings of the Fifth International Conference on Urban Climate, Łódź, Poland, 1–5 September 2003; University of Lodz: Łódź, Poland, 2003; Volume 1, pp. 459–462. [Google Scholar]
- Jasiūnas, K.; Teleszewski, T.J. Wind Energy. In Buildings 2020+ Energy Sources; Printing House of Bialystok University of Technology: Białystok, Poland, 2019. [Google Scholar]
- Aydın, O.; Igliński, B.; Krukowski, K.; Siemiński, M. Analyzing Wind Energy Potential Using Efficient Global Optimization: A Case Study for the City Gdańsk in Poland. Energies 2022, 15, 3159. [Google Scholar] [CrossRef]
- Celik, A. Energy output estimation for small scale wind power generators using Weibull representative wind data. J. Wind. Eng. Ind. Aerodyn. 2003, 91, 693–707. [Google Scholar] [CrossRef]
- Wais, P. Two and three-parameter Weibull distribution in available wind power analysis. Renew. Energy 2017, 103, 15–29. [Google Scholar] [CrossRef]
- Open Weather Map. Available online: https://openweathermap.org (accessed on 24 October 2021).
- Sakka, E.G.; Bilionis, D.V.; Vamvatsikos, D.; Gantes, C.J. Onshore Wind Farm Siting Prioritization Based on Investment Profitability for Greece. Renew. Energy 2020, 146, 2827–2839. [Google Scholar] [CrossRef]
- Ayodele, T.R.; Ogunjuyigbe, A.S.O.; Amusan, T.O. Wind Power Utilization Assessment and Economic Analysis of Wind Turbines across Fifteen Locations in the Six Geographical Zones of Nigeria. J. Clean. Prod. 2016, 129, 341–349. [Google Scholar] [CrossRef]


| Performance | Wind Turbine WT1 | Wind Turbine WT2 |
|---|---|---|
| TVK3 | AEOLOS V | |
| Rated Power | 3000 W | 3000 W |
| Max Output Power | 3800 W | 3600 W |
| Cut In Wind Speed | 1.5 m/s | 2.5 m/s |
| Rated Wind Speed | 13 m/s | 12 m/s |
| Survival Wind Speed | 60 m/s | 55 m/s |
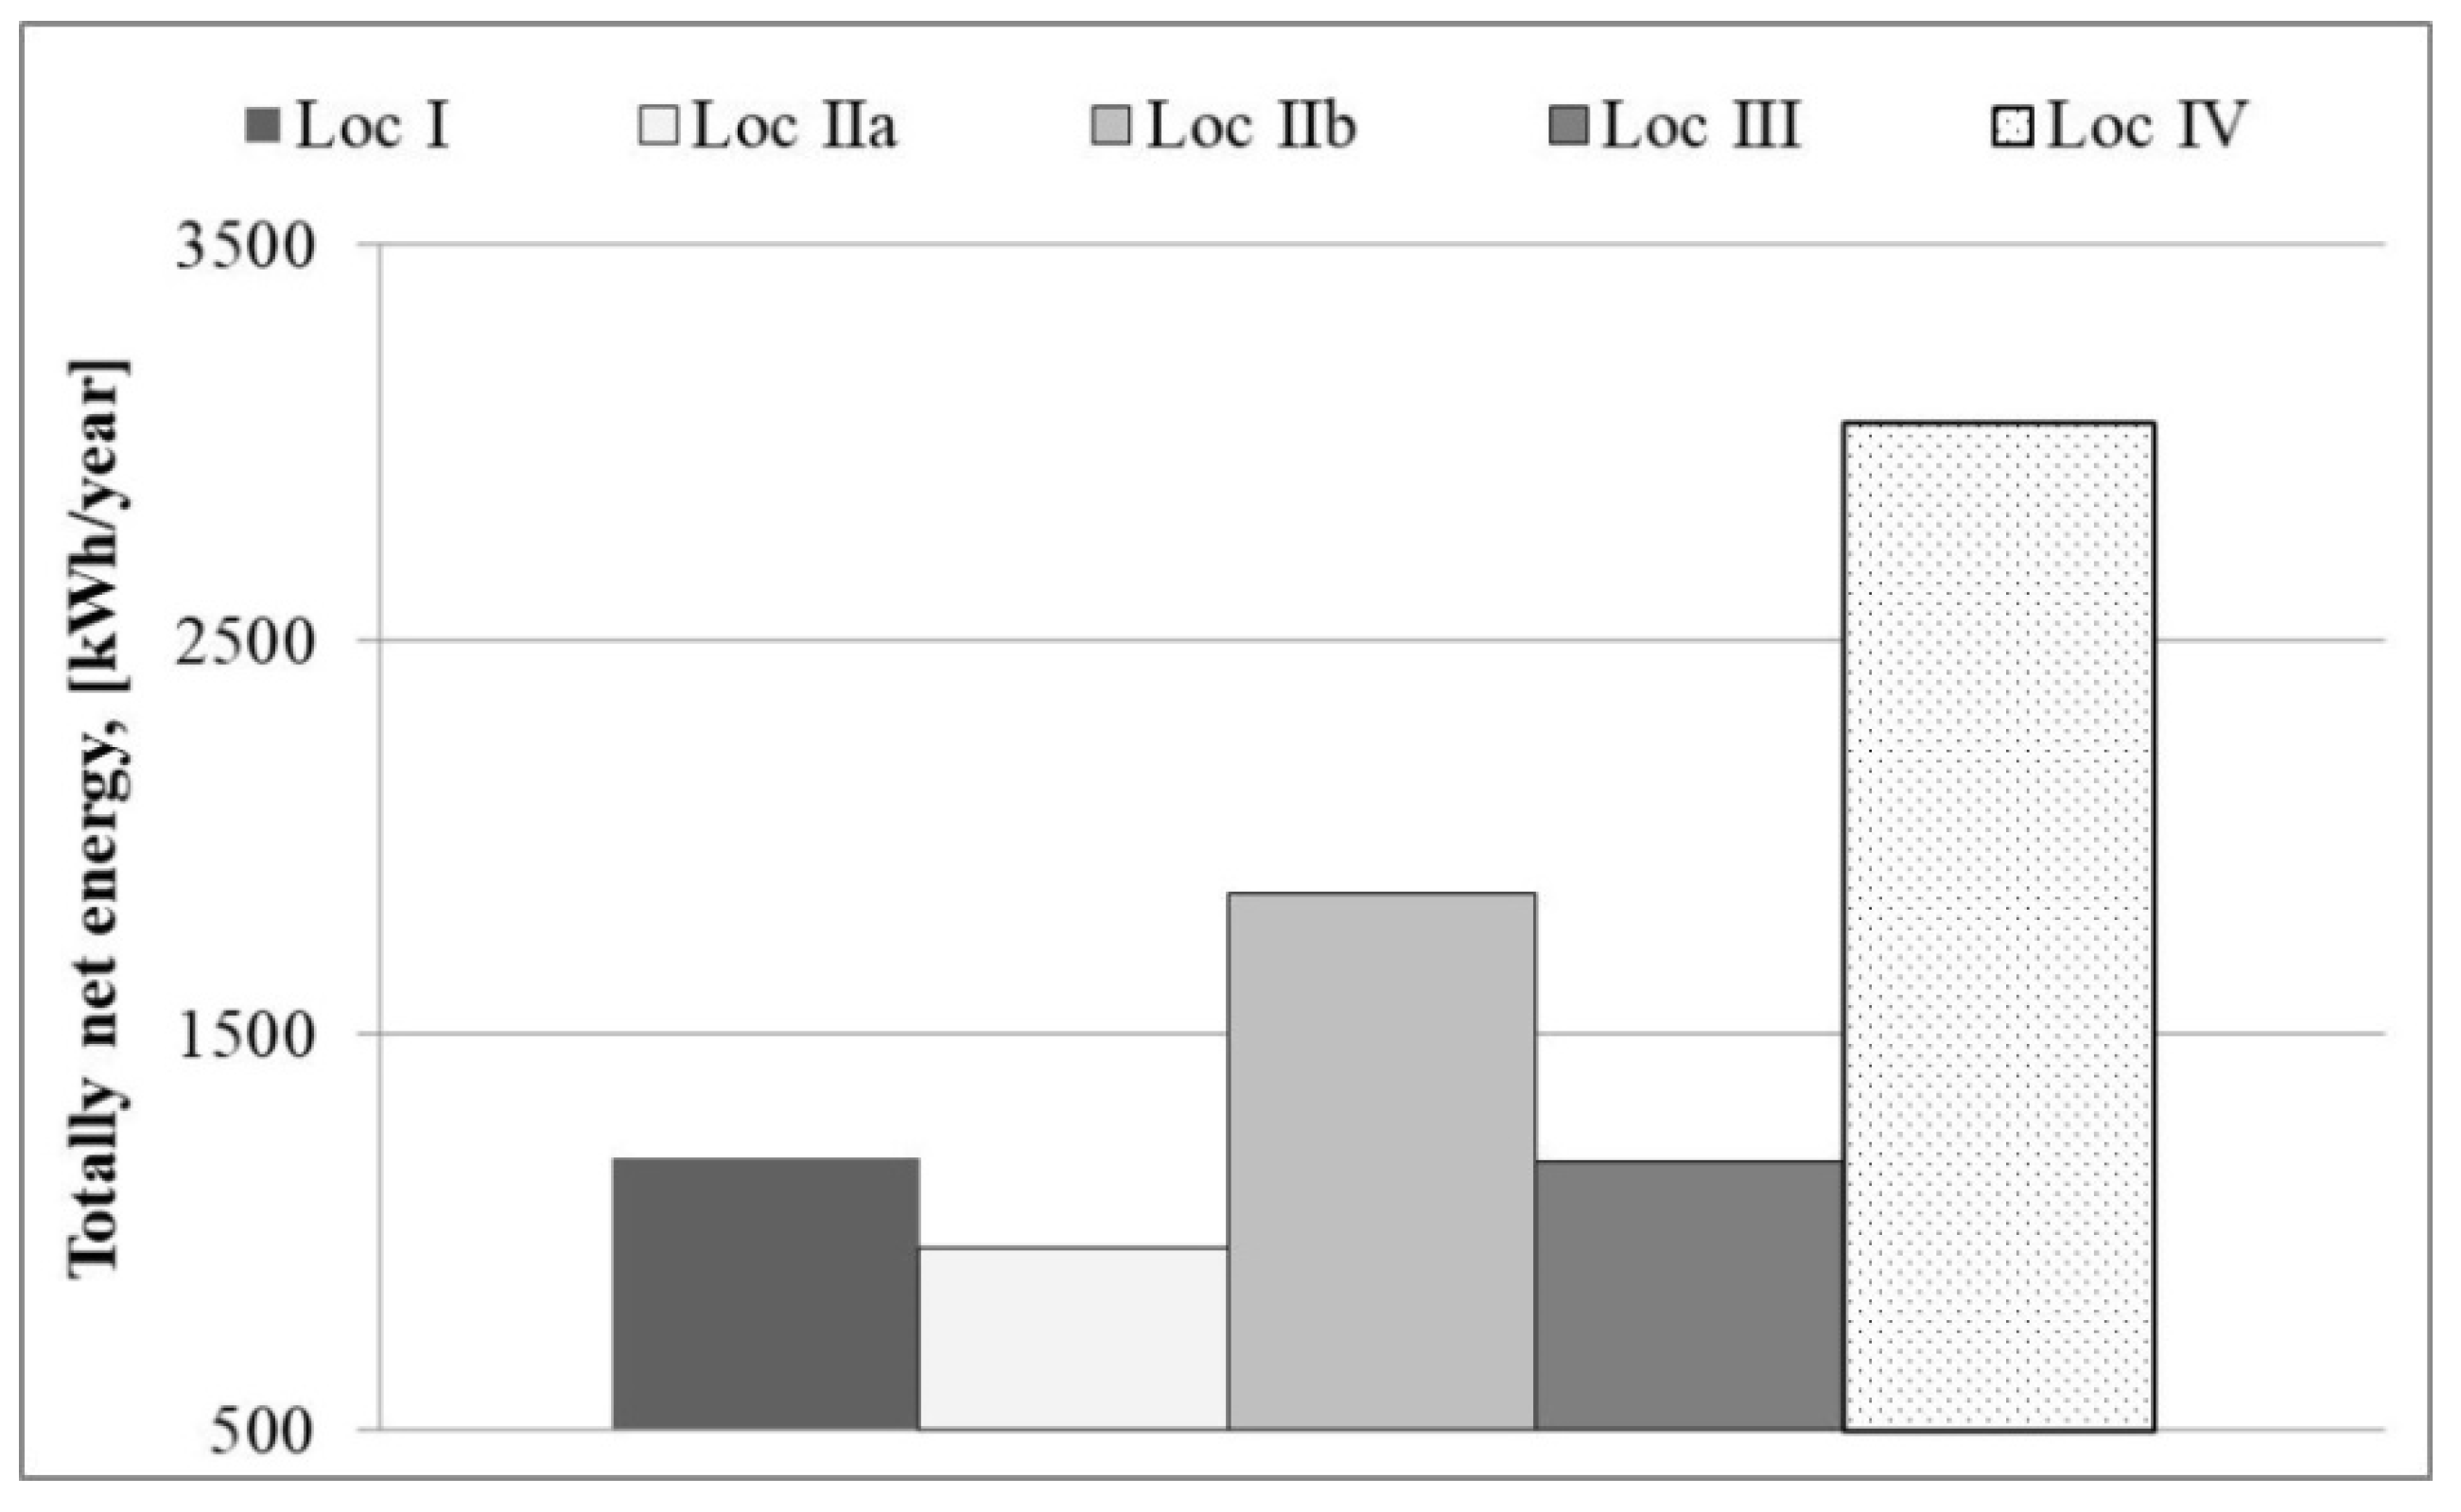
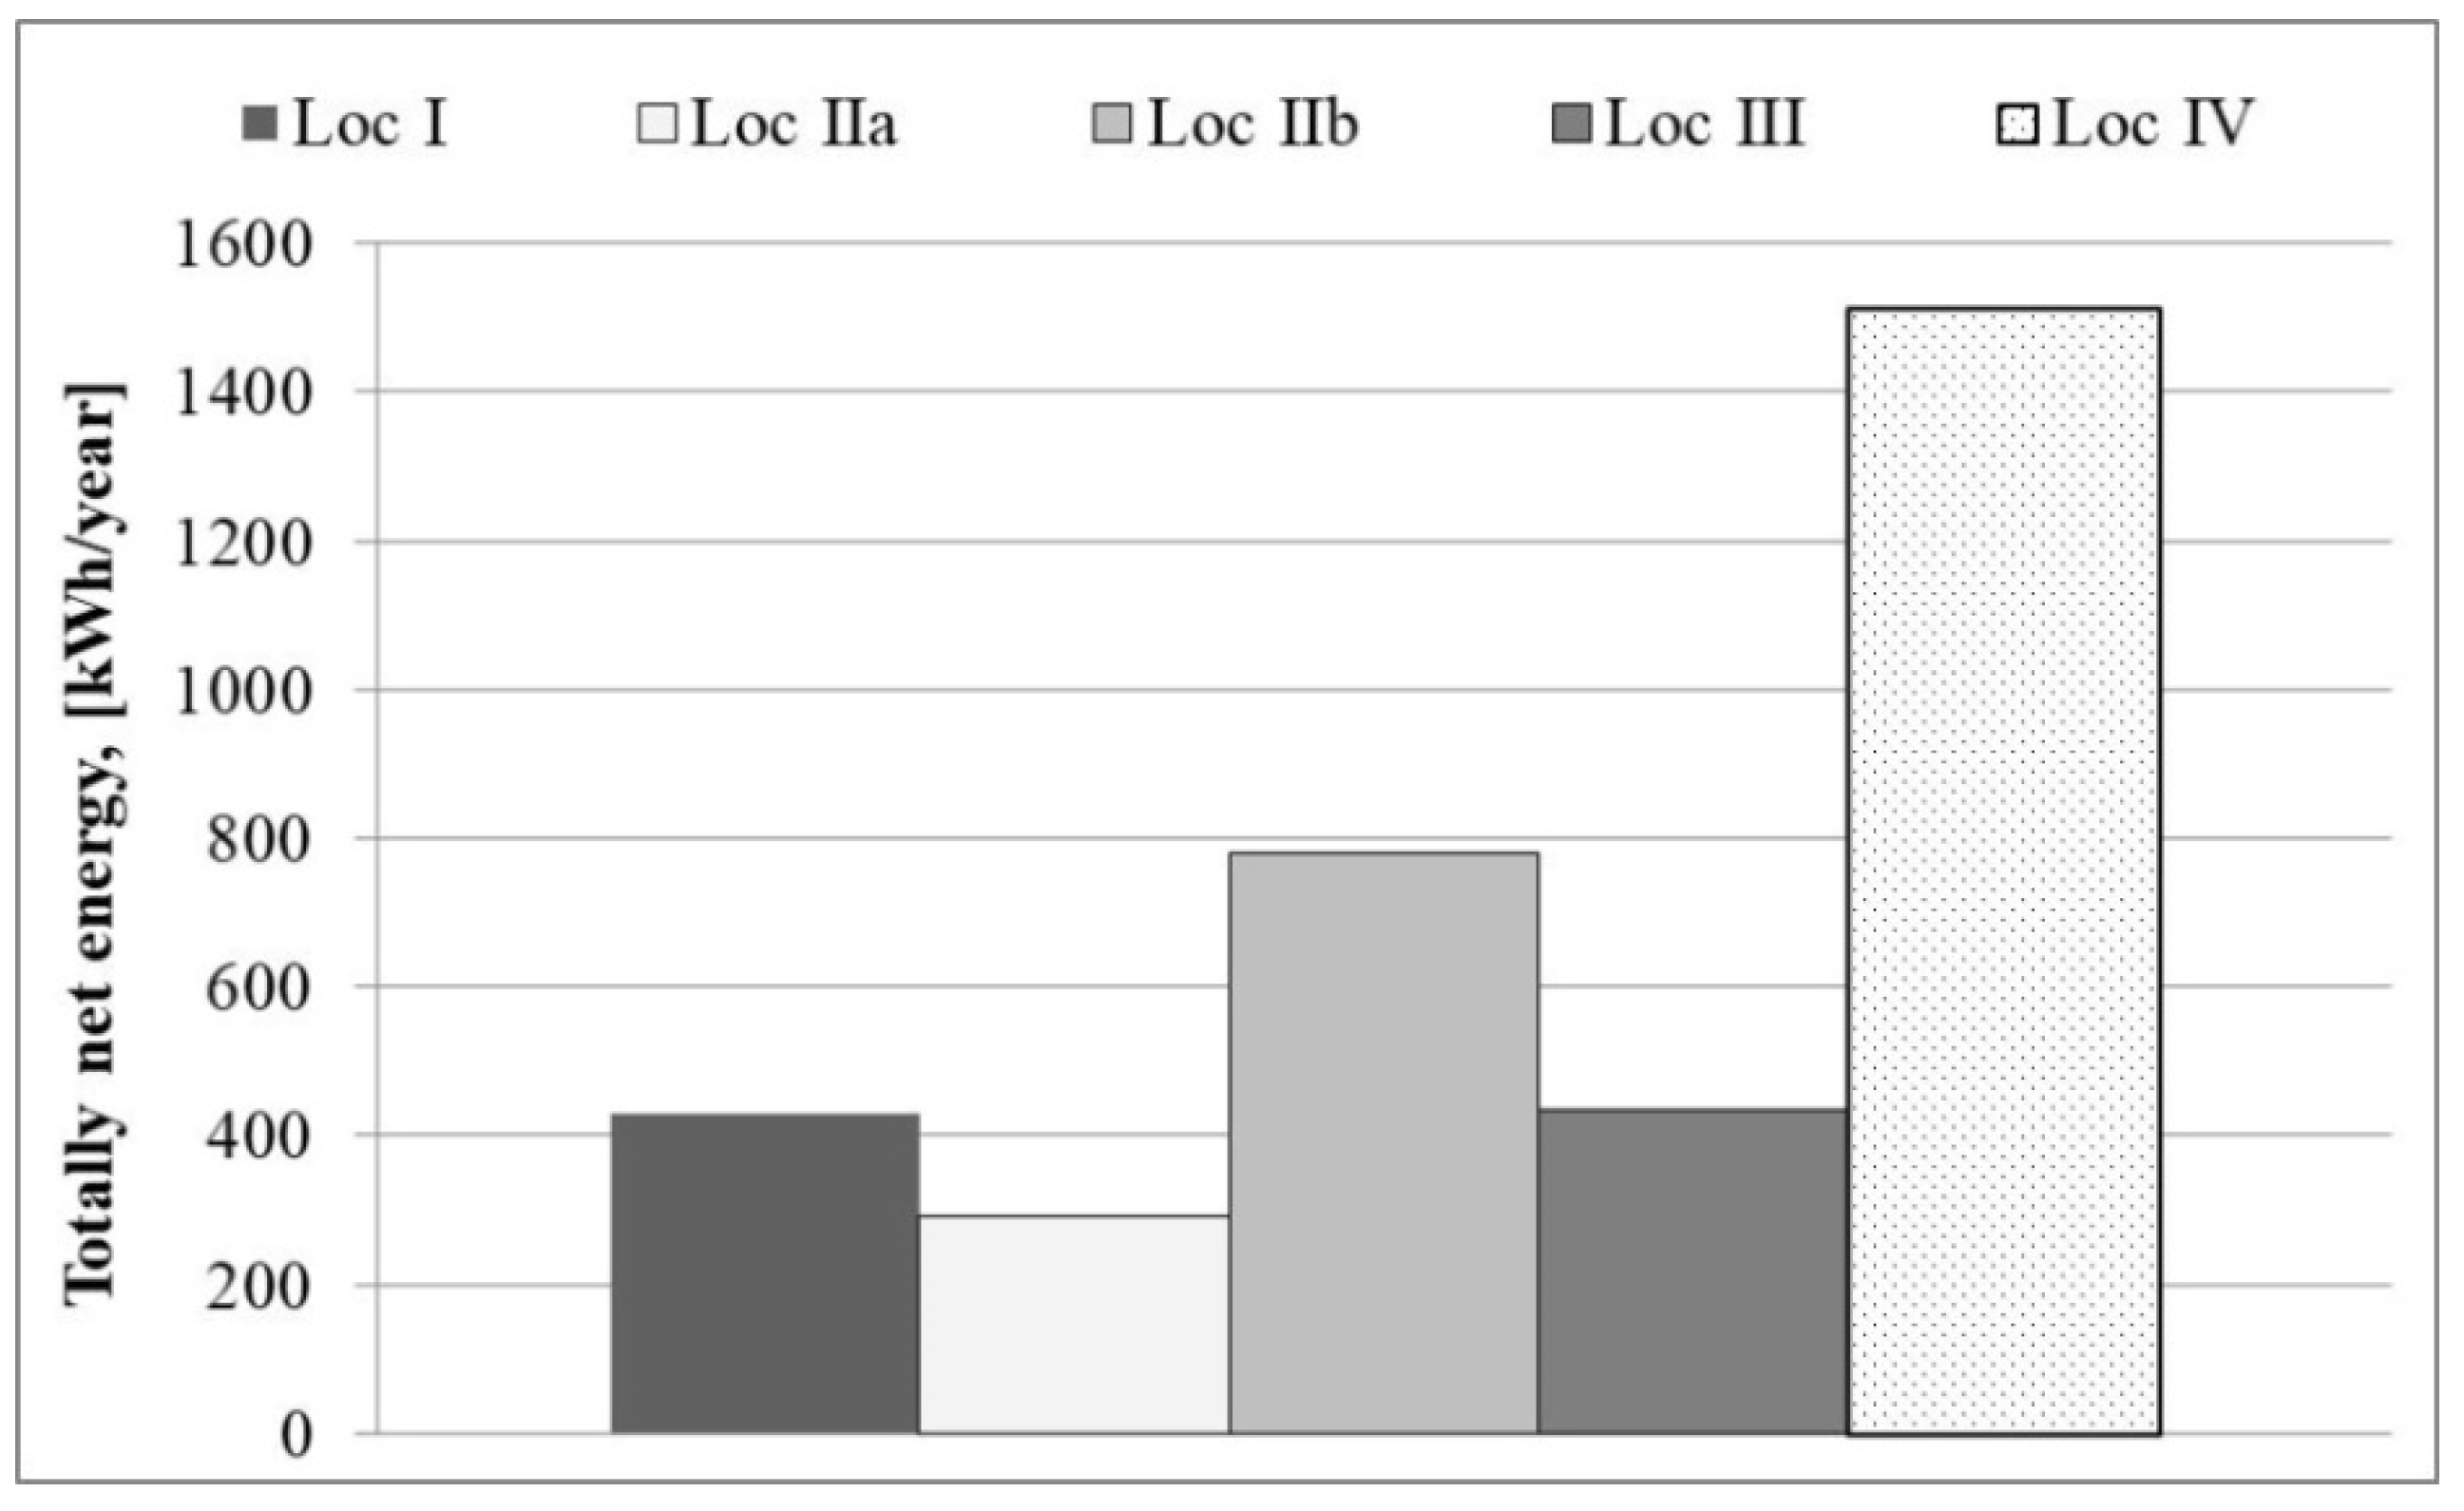
| Model WT | Total Net Energy, [kWh/Year] | ||||
|---|---|---|---|---|---|
| Loc I | Loc IIa | Loc IIb | Loc III | Loc IV | |
| WT1 | 1189 | 957 | 1855 | 1180 | 3054 |
| WT2 | 431 | 292 | 782 | 435 | 1514 |
| Model WT | Annual Profit, [EUR/year] | ||||
|---|---|---|---|---|---|
| Loc I | Loc IIa | Loc IIb | Loc III | Loc IV | |
| WT1 | 190 | 153 | 297 | 189 | 489 |
Publisher’s Note: MDPI stays neutral with regard to jurisdictional claims in published maps and institutional affiliations. |
© 2022 by the authors. Licensee MDPI, Basel, Switzerland. This article is an open access article distributed under the terms and conditions of the Creative Commons Attribution (CC BY) license (https://creativecommons.org/licenses/by/4.0/).
Share and Cite
Zagubień, A.; Wolniewicz, K. Energy Efficiency of Small Wind Turbines in an Urbanized Area—Case Studies. Energies 2022, 15, 5287. https://doi.org/10.3390/en15145287
Zagubień A, Wolniewicz K. Energy Efficiency of Small Wind Turbines in an Urbanized Area—Case Studies. Energies. 2022; 15(14):5287. https://doi.org/10.3390/en15145287
Chicago/Turabian StyleZagubień, Adam, and Katarzyna Wolniewicz. 2022. "Energy Efficiency of Small Wind Turbines in an Urbanized Area—Case Studies" Energies 15, no. 14: 5287. https://doi.org/10.3390/en15145287