Article

Synergy Degree Evaluation of Stakeholder Engagement in Integrated Municipal Solid Waste Management: A Case Study in Harbin, China

1
School of Economics and Management, Harbin Engineering University, Harbin 150001, China
2
School of International and Public Affairs, Shanghai Jiao Tong University, Shanghai 200240, China
3
China Institute for Urban Governance, Shanghai Jiao Tong University, Shanghai 200240, China
*
Author to whom correspondence should be addressed.
Energies 2022, 15(14), 5000; https://doi.org/10.3390/en15145000
Submission received: 1 June 2022 / Revised: 28 June 2022 / Accepted: 5 July 2022 / Published: 8 July 2022
(This article belongs to the Special Issue Advances in Energy and Resource Efficiency and Sustainable Policy)

Abstract

:
Municipal solid waste (MSW) has caused the increasing concern for environmental issues in recent years, and the wide engagement from all stakeholders of society has been involved in promoting integrated MSW management. Therefore, this study aims to identify the problems of dis-synergy among multi-stakeholders engaged in the integrated MSW management evolution, then contribute strategies to coordinated development of integrated MSW management system by bettering the engagement and interaction of different stakeholders combined with the region characteristics. From the perspective of the stakeholder theory and synergy theory, we constructed an integrated MSW management system with four stakeholder subsystems: governments, enterprises, residents, and NGO subsystems. We used integrated MSW management in Harbin as a case study and used the synergy degree model to estimate the system synergy degree from 2010 to 2019. Then, the synergetic development trend of integrated MSW management was studied, providing a feasible approach to boost the coordinated development of integrated MSW management in Harbin. The results were in concordance with the factual situation and pointed to integrated MSW management in Harbin and, although there is movement towards a more harmonious and orderly state over time, the government subsystem needs to be further reinforced.

1. Introduction

With the population growth and urban expansion, municipal solid waste (MSW) generation is rising sharply [1,2,3], leading to a major rising concern for both environment protection and public health in recent years [4,5]. As the largest developing country in the world, China has a huge population, inadequate resources, fragile eco-environment, and unbalanced development. Due to the improper management and littering of MSW, covering more than 500 million square meters of land nationwide, two thirds of China’s large and medium-sized cities are inundated with MSW [6]. This issue has caused tremendous pressure on sustainable environment development [7]. At present, the decrease and recycling of MSW are often considered the main targets of MSW management by governments [8]. Considering the traditional MSW treatment approaches may cause some environmental issues, including air contamination, groundwater and soil pollution, and GHG emissions, and putting the infrastructure in communities at risk as a negative consequence [9]. The first priority is to find the optimal approach to tackle MSW in the most effective and low negative effects [10]. Specifically, integrated MSW management, which is regarded as a systematic method to effectively deal with MSW challenges [11], has been implemented by numerous local governments to boost the effective MSW management in recent years [12].
Integrated MSW management is a systematic manner of decreasing MSW generation and increasing recycling, while doing no harm to public health or environment sustainability [13,14], by applying the proper management approaches [15,16]. An integrated MSW management seeks to contribute an efficient MSW management system by integrating each link during the MSW management process, including MSW generation, separation, collection, transportation, and disposal [17]. Integrated MSW management needs the communication and integration among the various stakeholders involved [18]. To provide effective, efficient, and sustainable MSW services, MSW management authorities must have an overall and extensive outlook of the circumstances and framework, considering the synthetic mutual impacts on involved stakeholders [19]. Morrissey and Browne [20] stated that more attention should be paid to encourage the participation of related stakeholders so as to provide structure decisions for MSW management. Achillas et al. [21] also hold the opinion that effective MSW management should take into consideration the stakeholders’ coordination. Joseph [22] and Joseph et al. [23] suggested sustainable MSW management was an approach for tackling MSW issues, they also believed that the wide participation of involved stakeholder such as the public was the main manner driving sustainable MSW management during the decision-making process. Specifically, Sharholy et al. [24] argued that the support from governments and individuals are necessary for effective MSW management, where the individuals refer to the residents with evolving community cognition and an interest in society. Fernando [25] stated that political conditions are the conditions needed for reaching a thorough revolution in integrated MSW management. Based on the information asymmetry theory, if governments are unable to obtain all MSW management information entirely and precisely in a timely manner, they will fail to tackle MSW and environmental issues, especially if isolated from other stakeholders [26,27,28,29,30]. Therefore, based on the public participation theory, individuals also should be involved in MSW management, since governments give residents rights to play an active role in the environmental protection activities [31].
However, existing research addressing stakeholders within the MSW management system is limited, mainly from the perspective of multiple stakeholder participation and social impact, and very little attention has been given to the evaluation of the multifaceted interactions and engagements among stakeholders. Only by evaluating the situation of stakeholder engagement can these stakeholders be effectively involved in the integrated MSW management. In general, stakeholder engagement plays a vital role in the interrelationships among integrated MSW management [32]. These involved stakeholders affect the diverse system elements (MSW generation, separation, transportation, disposal) through political, economic, social, technologic, and environmental aspects [33]. Therefore, developing an integrated MSW management system with integration among different stakeholders is paramount for protecting resources, the environment, and public health.
The aim of this paper was to investigate and identify the problems of dis-synergy among multi-stakeholders engaged in integrated MSW management processes and to better the engagement and interaction of different stakeholders, thus supporting a scientific reference for guiding the evolution of integrated MSW management systems associated with cold region characteristics. Specifically, this paper addressed the following questions related to integrated MSW management using Harbin as a case study: (1) Did the synergetic trend of different stakeholders in an integrated MSW management system change between 2010 to 2019? (2) Can the coordination interactions by different stakeholders promote the synergetic and stable state of an integrated MSW management system? (3) What are the key indicators and weaknesses of synergy among multi-stakeholders engaged in integrated MSW management process? To answer these questions, this paper formed an integrated MSW management system, including four stakeholder subsystems (government subsystem, enterprises subsystem, residents subsystem, and NGOs subsystem) based on the stakeholder theory. Then, we applied the synergy degree model to analyze the order degree changes of the four subsystems and the synergy system by different MSW management stakeholders. A coordinated development of integrated MSW management requires stakeholders who are able to better interact within the network. The synergy degree model is one of the principal methods to analyze the synergetic development trend and has the advantages of efficiently estimating the integrated MSW management state and ensuring the synergetic and stable mechanism of an integrated MSW management system. The results were in agreement with the factual circumstances and pointed out that although the integrated MSW management in Harbin is moving towards a more harmonious and orderly state over time, the government needs to be further reinforced. Moreover, Harbin, located in the northeast China, is a regional representative epitomized by the sever cold winters lasting nearly half of the year. Its unique cold weather means that MSW management faces more challenges and can even result in the ineffectiveness of MSW management. The integration of representative conditions makes Harbin distinct from other parts of China (particularly in the south). Thus, a case study in Harbin, China, can provide a scientific reference for improving stakeholder engagement and guiding the coordinated development of integrated MSW management in comparable northern and severely cold regions.
This study can provide theoretical insights and practical guidelines for authorities that want to achieve integrated MSW management goals. (1) The theoretical insights are to identify and construct an integrated MSW management system set, analyze the synergetic development trend of different stakeholders’ subsystems, understand the coordination mechanisms in integrating the various stakeholders, and determine the “short board” among the integrated MSW management system. (2) Practical guidelines are to provide valuable and acceptable policy implications for society, local governments managers, and relevant organizations in terms of promoting the diversity of integrated MSW management approaches to achieve sustainable goals.
The rest of this paper is structured as follows: Section 2 indicates the study area and presents the synergy degree model, and the evaluation indicators system for measuring the synergy degree of the integrated MSW management system is established. Section 3 describes the empirical results and discussion. Section 4 presents the policy implications. Finally, the conclusions are presented in Section 5.

2. Materials and Methods
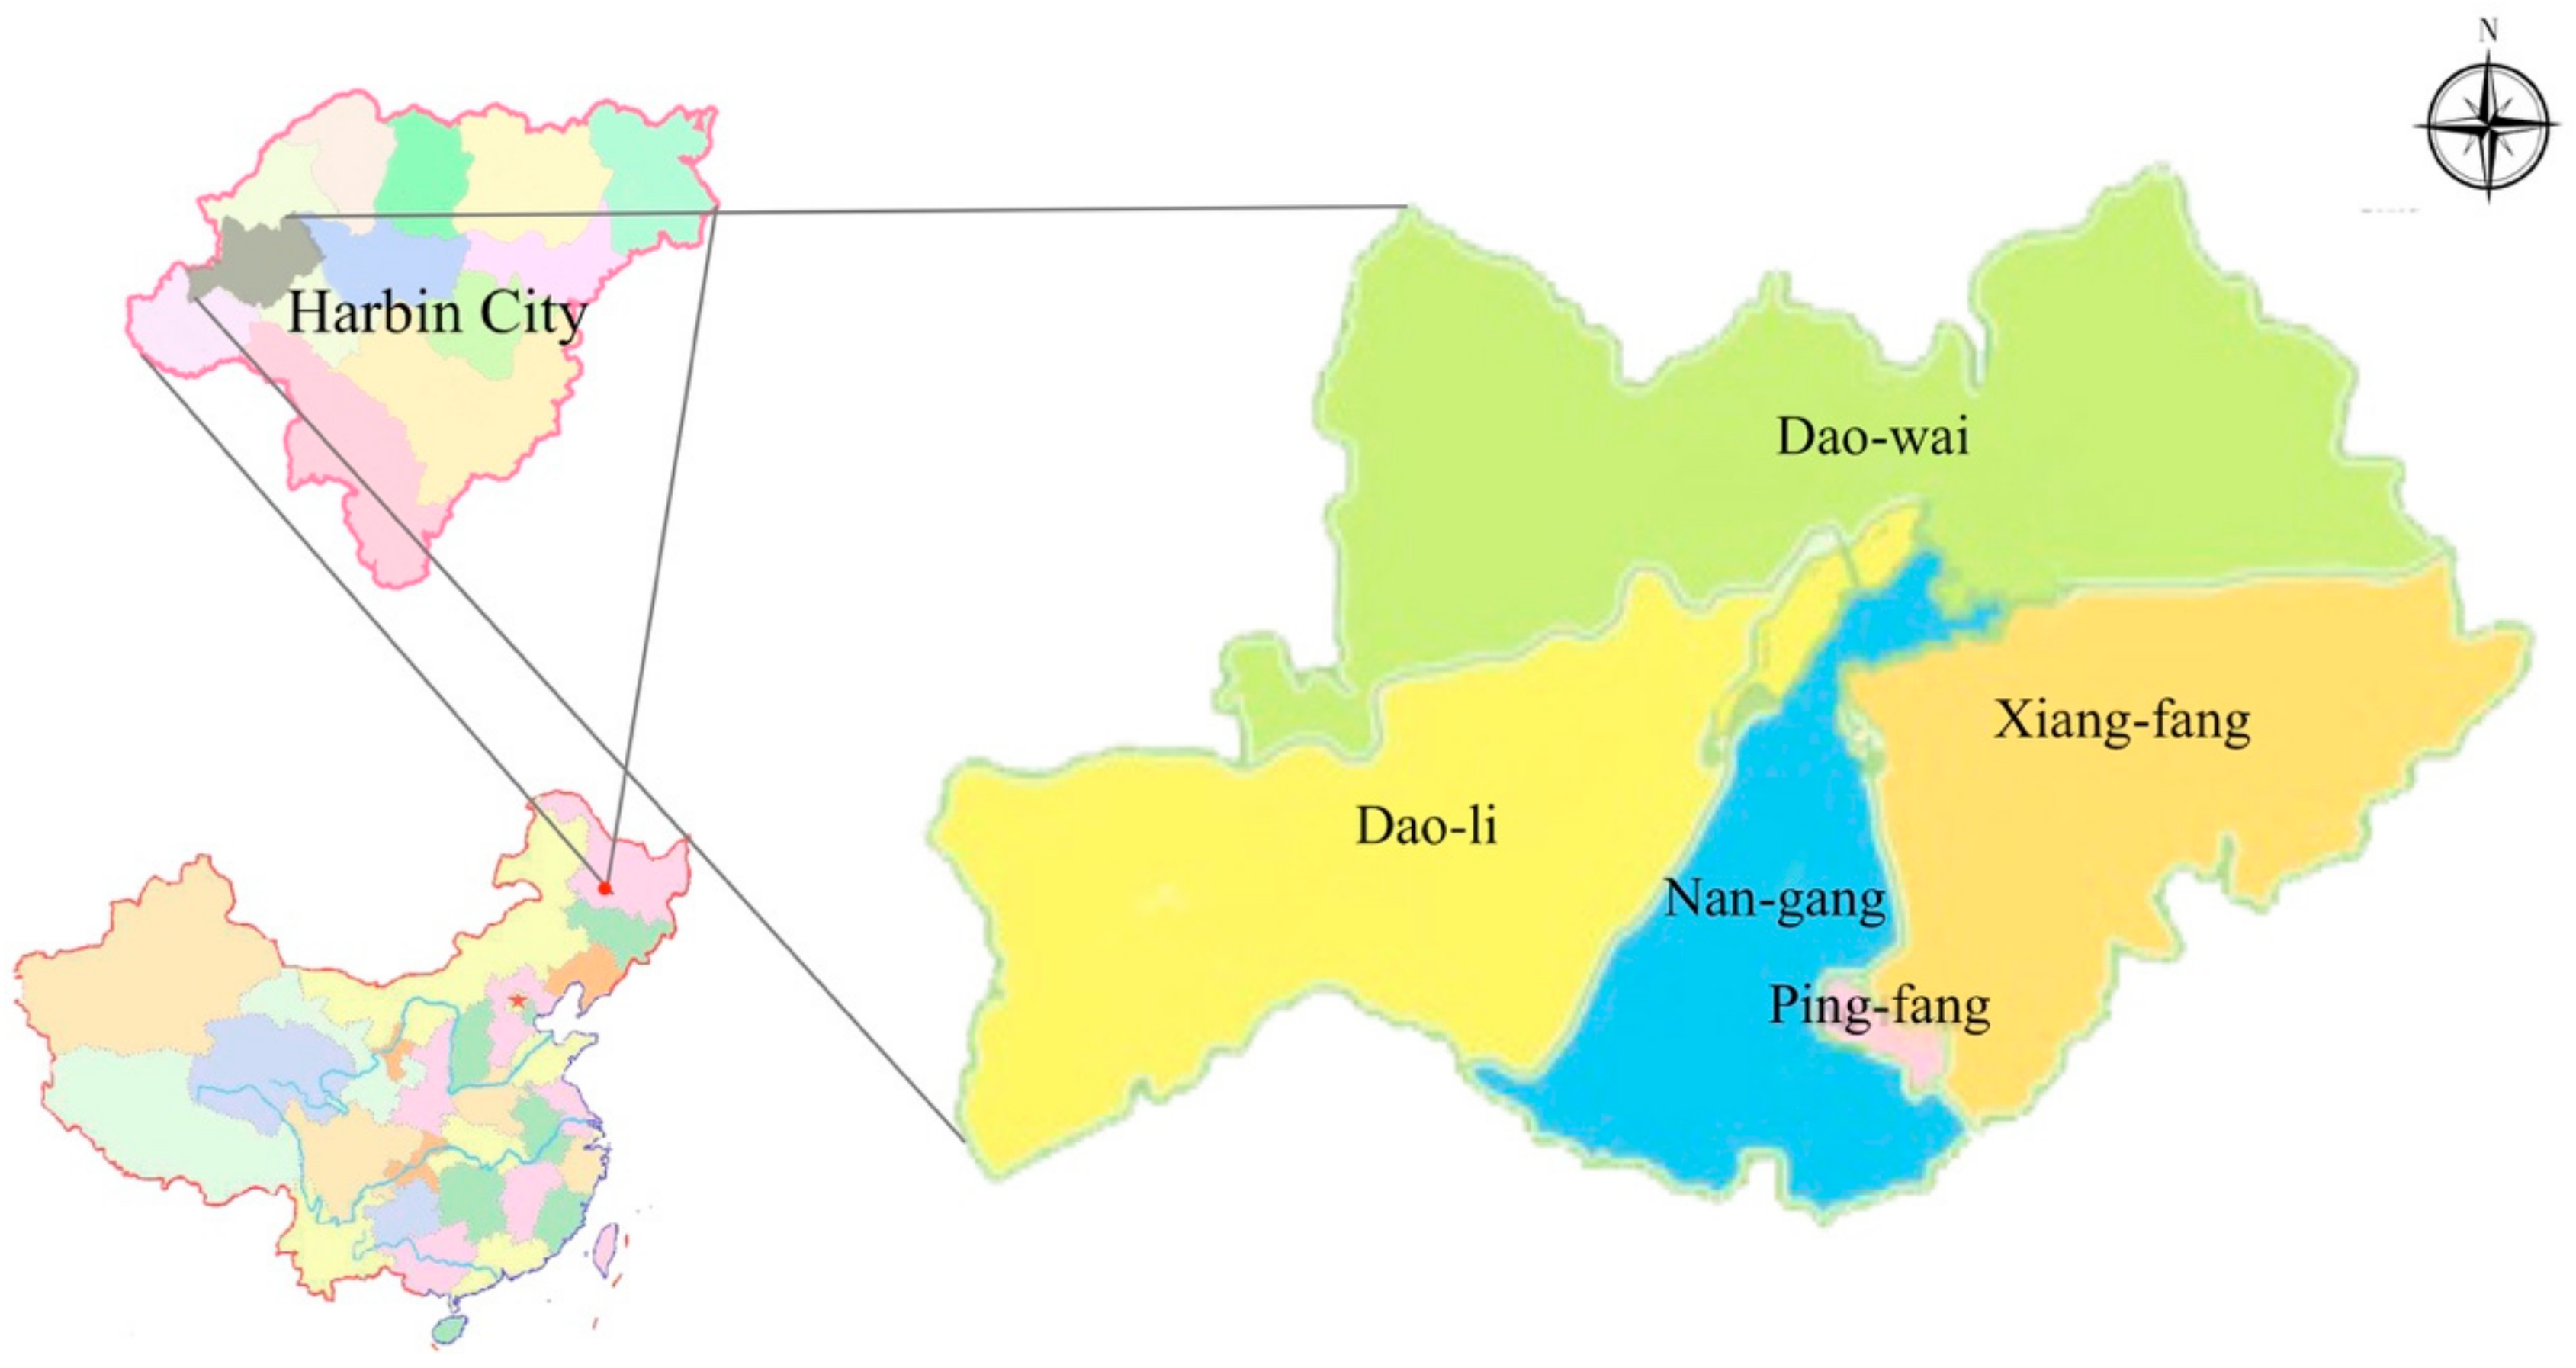
2.1. Study Area

Harbin, the provincial capital of Heilongjiang, was chosen as the study area to analyze the multi-stakeholders’ integration of MSW management. Harbin is located in the northeast China and typically has severely cold winters for up to 5 months of the year [34]. The extreme operating conditions with a distinctive climate and an extremely cold winter make Harbin face unique challenges in MSW management systems. The exposed MSW freezes easily in winter, which makes the collection, transportation, and treatment processes far more difficult. The MSW transport vehicles face the risk of skidding in the frozen ground in winter. Moreover, MSW transportation distances are long due to the low population density in Harbin, contributing to high MSW transportation costs. The integration of these conditions makes Harbin distinct from other parts of China. A case study in Harbin, China, can provide theoretical insights and practical guidelines for authorities that want to achieve sustainable MSW management goals. Specially, it can provide a scientific reference for improving stakeholder engagement and guide the coordinated development of integrated MSW management in comparable northern regions associated with severely cold region characteristics. Therefore, there is of theoretical and practical meaning to deeply study the integrated MSW management in Harbin city, combined with its region characteristics. Figure 1 shows the study area in this paper, including five districts in Harbin, namely Nan-gang District, Dao-li District, Dao-wai District, Xiang-fang District, and Ping-fang District.

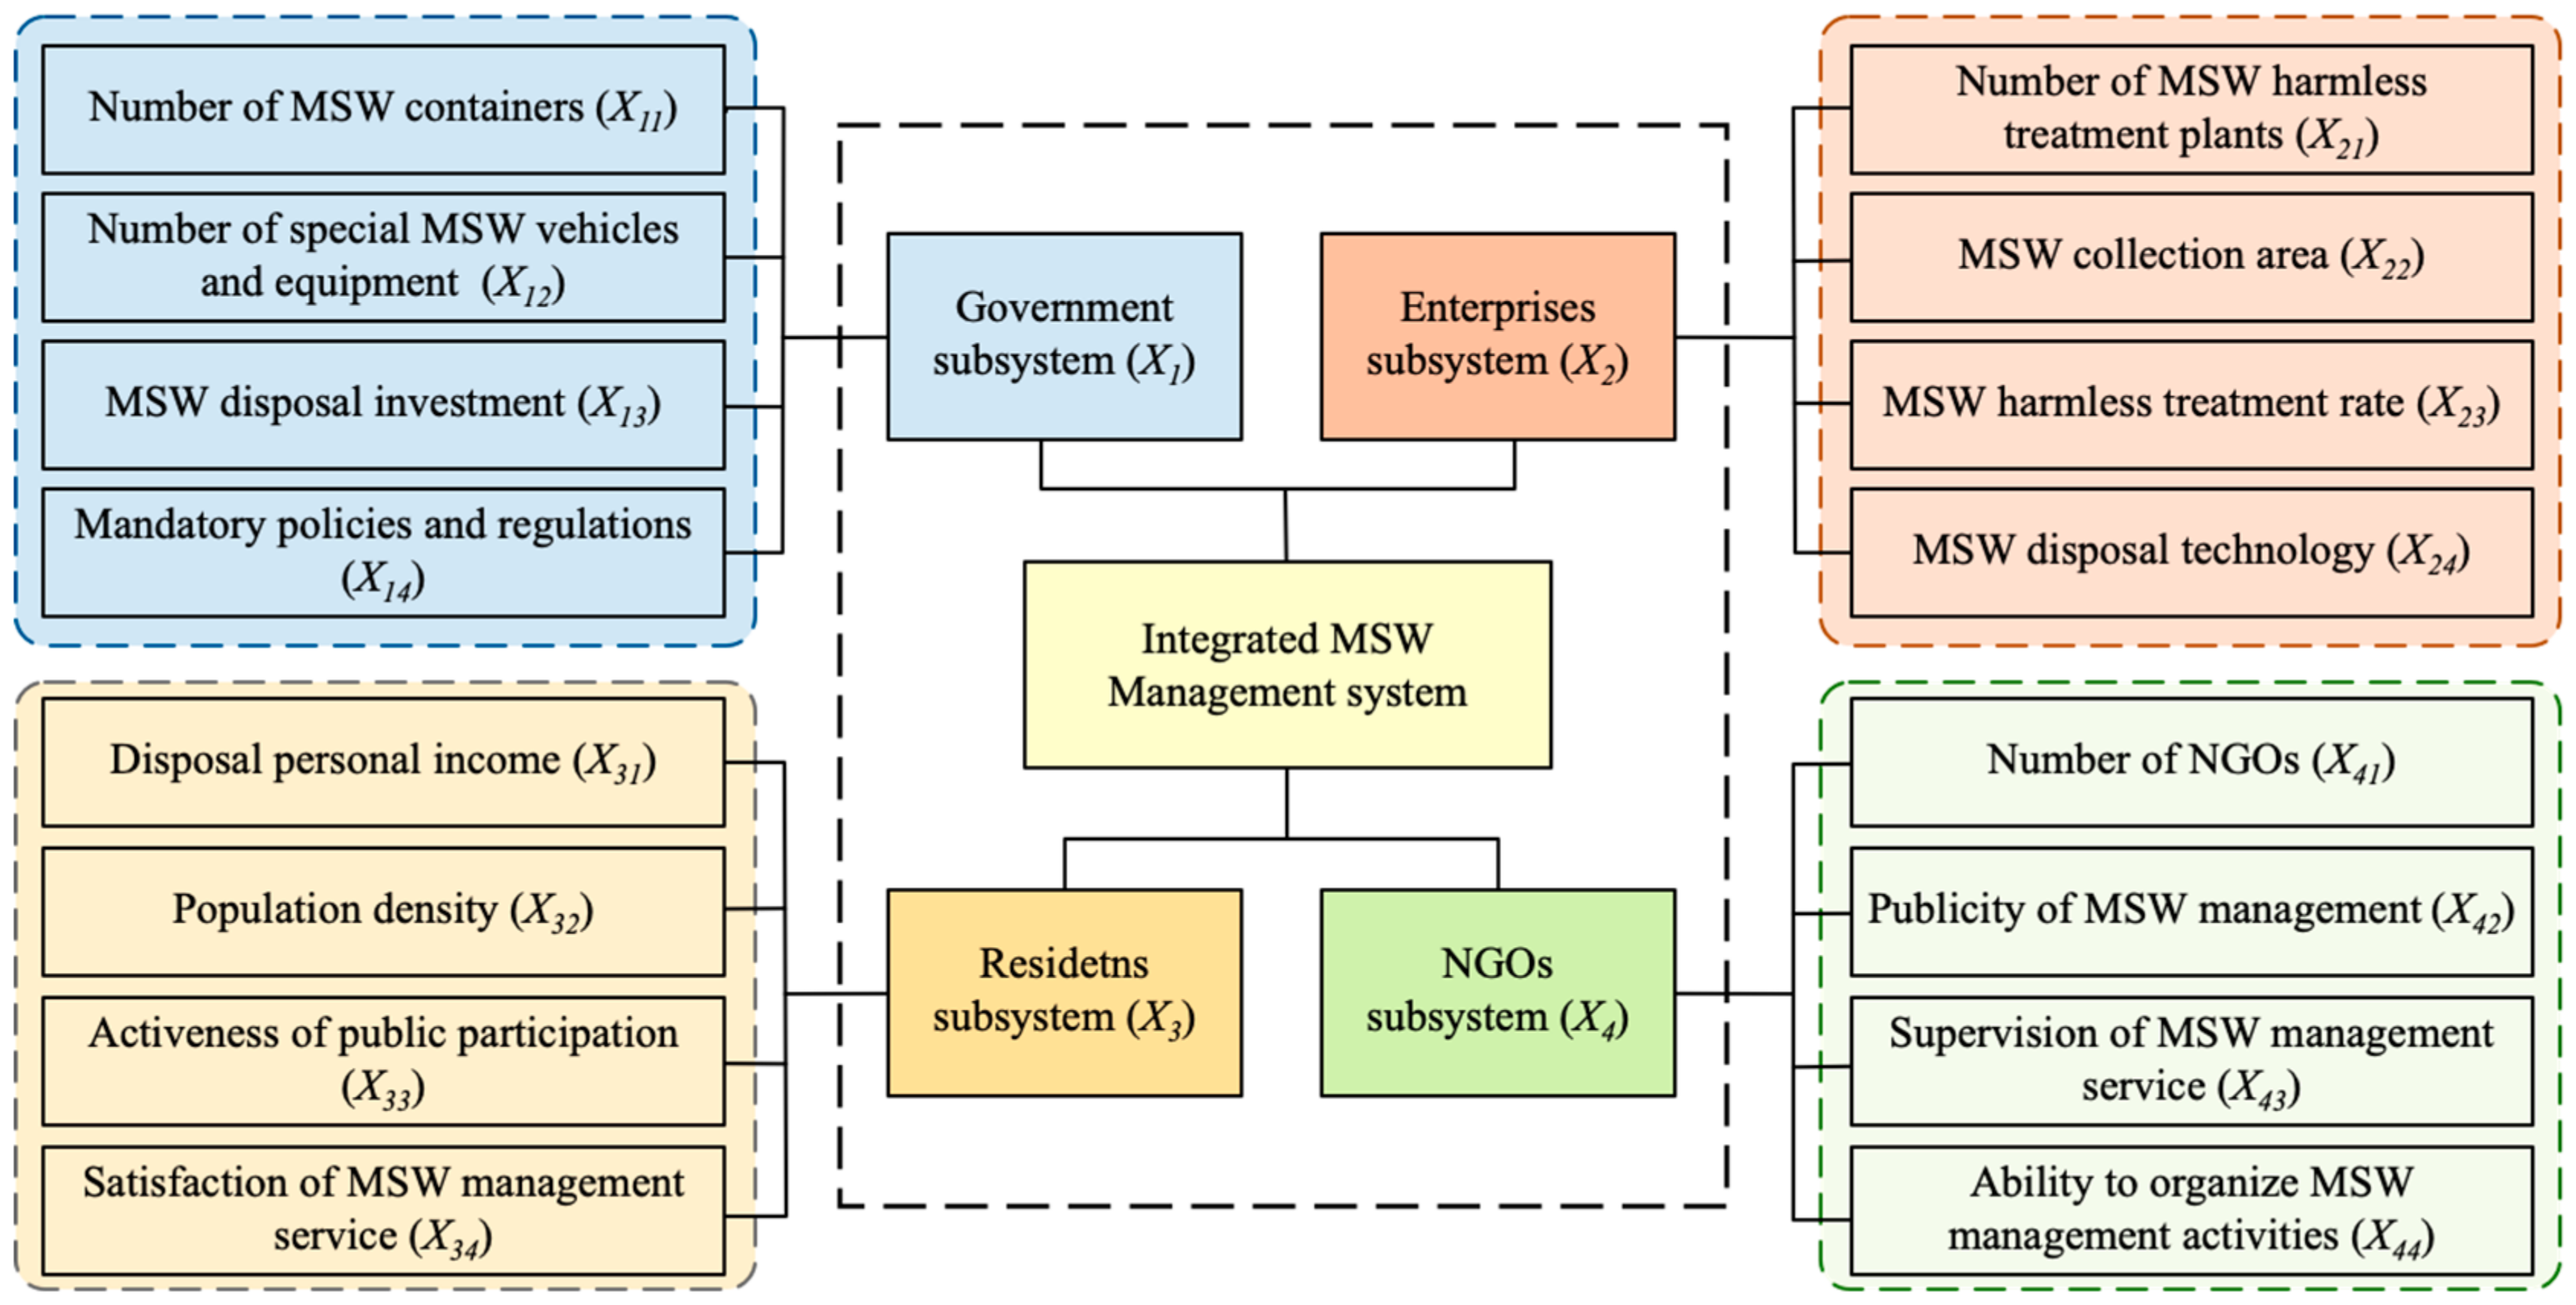
2.2. Evaluation Indicators System

The environmental problems of integrated MSW management can be addressed in large part by the interaction of several stakeholders, presented as governments, enterprises, residents, and NGOs (non-governmental organizations), who all have a role to play to support priority actions. Stakeholders engaged in integrated MSW management systems may have different preferences and concerns [35,36]. Meanwhile, the construction of the evaluation indicator system for stakeholder engagement in integrated MSW management systems is the basis for the examination of the synergy degree. For the purpose of reflecting the operating efficiency and the quality of the system, we constructed integrated MSW management as a system consisting of governments, enterprises, residents, and NGOs in view of the stakeholder theory and synergy theory, and the appropriate evaluation indicators are identified and selected for each subsystem. All members of the integrated MSW management system cooperate with each other to provide effective, efficient, and sustainable MSW management services. The structure of the stakeholder engagement evaluation indicators system in integrated MSW management is shown in Figure 2.
(1)
Government subsystem. China’s MSW management employs a typical a top-down administrative model [37]. The government acts as a policymaker to develop an MSW management system and establish targets for integrated MSW management. Mandatory policy and regulations are essential to ensure integrated MSW management regulatory enforcement [38], and appropriate policies could moderate the negative impacts of environmental deterioration toward MSW dumping procedures, storage control, and distribution processes [39]. Government is also in charge of the planning and operation of local MSW infrastructure and facilities, including the MSW containers and special MSW vehicles and equipment. Meanwhile, the role of financial investment in recycling improvement, infrastructure, awareness, transportation, buy-back centers, and organizations help modernize integrated MSW management systems [24,40,41]. Therefore, it is necessary to include these evaluation indicators in the analysis of government engagement in integrated MSW management.
(2)
Enterprises subsystem. Enterprises are core MSW management stakeholders, especially under the vigorous development of MSW incineration power generation projects by the Chinese government. The number of MSW treatment plants to reduce harmfulness and MSW treatment rate can measure enterprise treatment capacity with respect to integrated MSW management [42], and the MSW collection area is the key indicator of cleanliness in the improvement of MSW treatment infrastructure and the realization of the treatment of harmful MSW. To take advantage of recycling and reuse capabilities, MSW disposal technologies act as keys to integrated MSW management systems and should thus be included in the process of upgrading facilities or services [43]. Therefore, these evaluation indicators are essential for analyzing enterprise engagement in integrated MSW management.
There are various MSW management practices in many regions. As the direct landfill dumping of MSW (without pre-treatment) causes several environmental problems, including the release of greenhouse gases (GHGs) and toxic volatile organic compounds (VOCs), as well as groundwater pollution from leaching and sludge [44,45,46]. Most regions have turned away from landfills, either due to environmental concerns or scarcity of land area and have subsequently developed waste-to-energy technologies for MSW management. The valorization technologies and methods of MSW applied is divided into two parts. One is biochemical conversion technologies (including composting, vermicomposting, anaerobic digestion) and one is the thermal conversion technologies (incineration, gasification, pyrolysis). Studies have reported that the volume reduction of 80.00 to 95.00% is achievable for MSW generated by thermal conversion technologies [47,48]. Other advantages of modern-day thermal treatment system include hygienization (MSW is decomposed temperatures of >850 °C), mineralization, and the immobilization of hazardous substances and resource conservations [49]. Furthermore, high-tech MSW monitoring technologies, such as sensors, RFID (radio frequency identification), GIS (geographic information systems), and GSM/GPRS (mobile/general radio packet service) have been applied successfully in MSW management systems (including MSW collection, storage, separate collection, processing, and final disposal) as efficient monitoring tools [50].
(3)
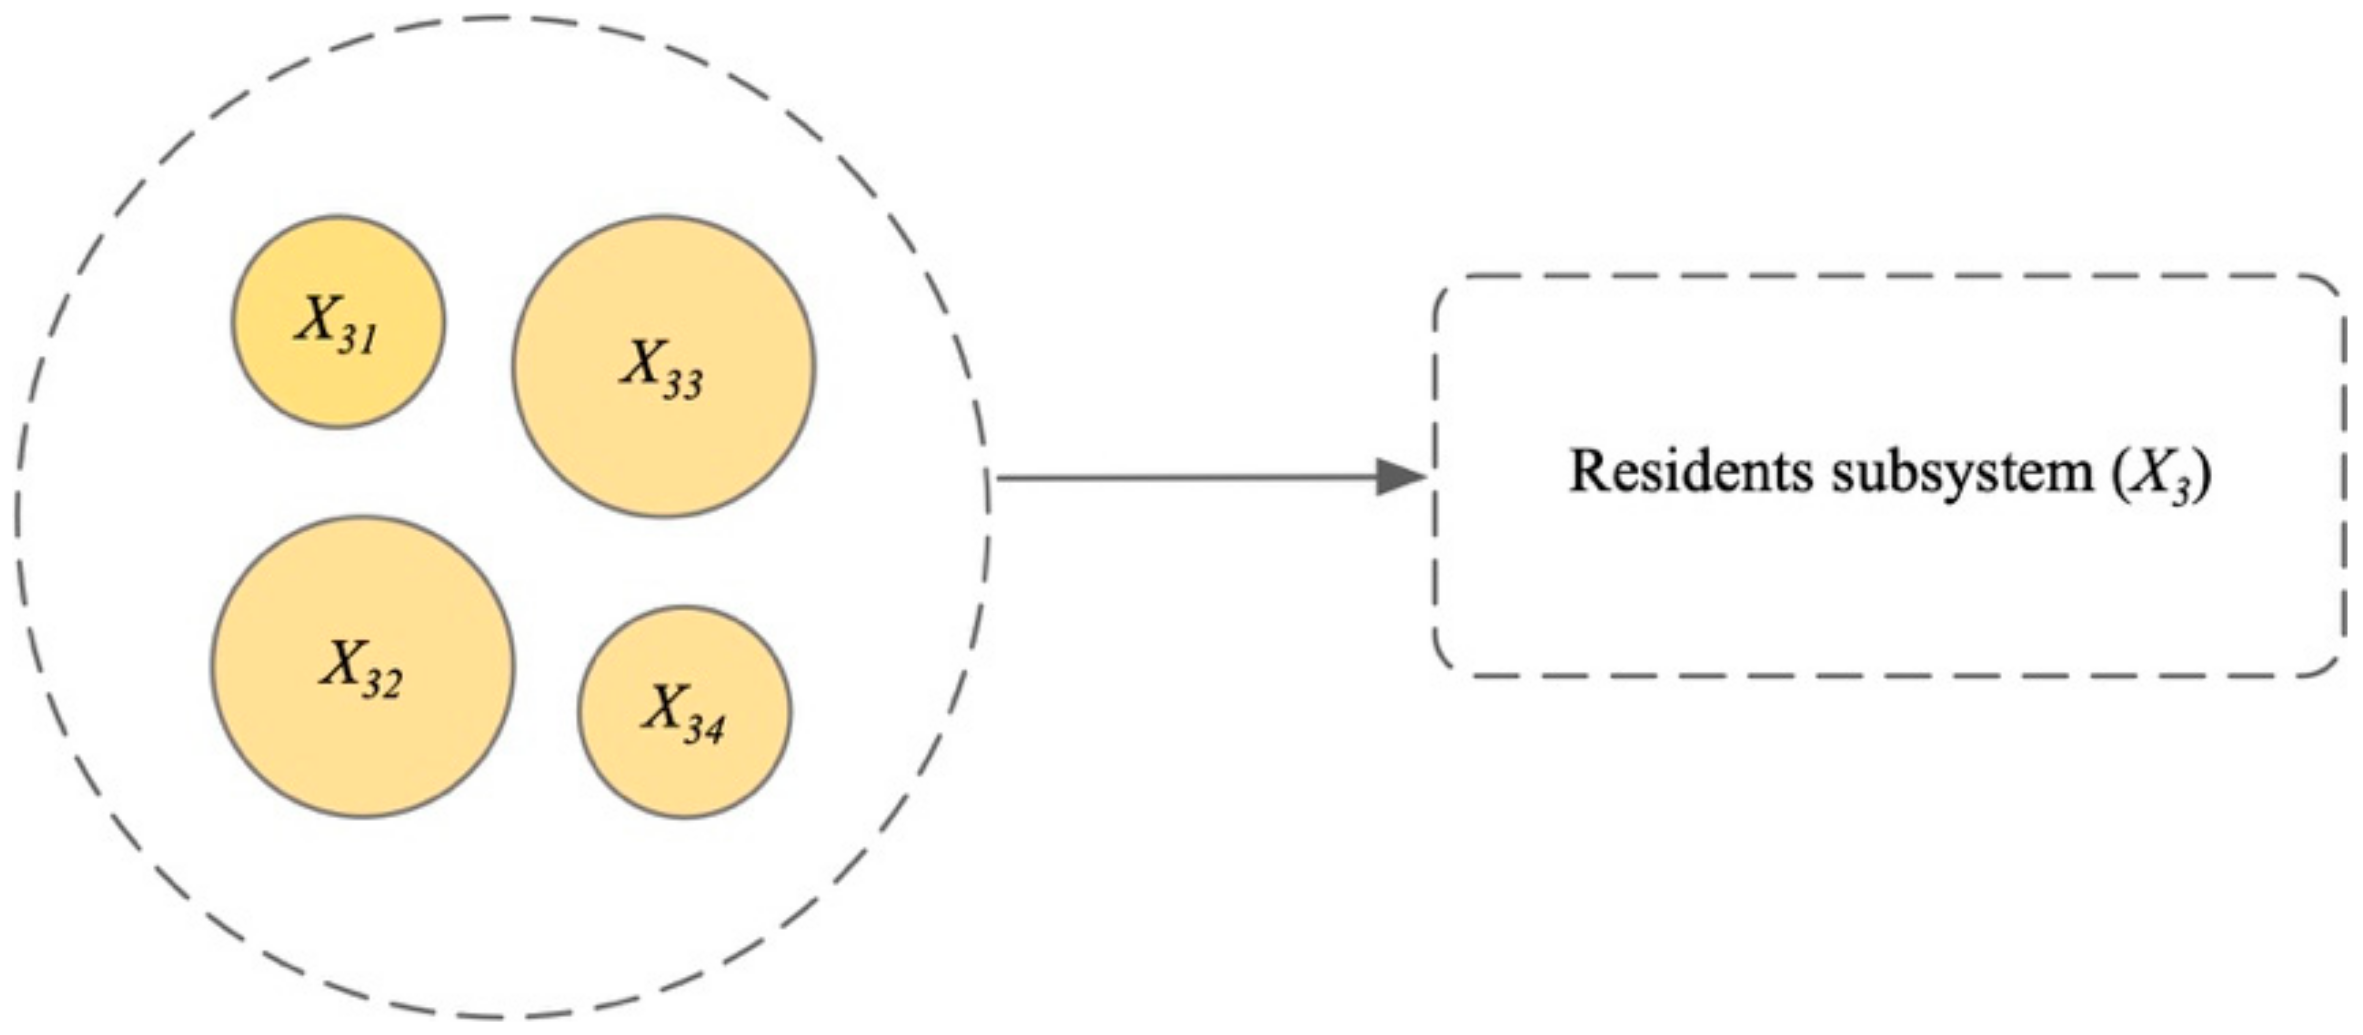
Residents subsystem. Integrated MSW management requires considering the living standard of residents [42] and disposal personal income plays a significant role in this [51]. Additionally, population density becomes essential for the accurate forecasting of the MSW generation and estimation of the proper capacity of the MSW management facilities [52]. Public participation in MSW management activities is required to develop better operational systems [53], and the emergence of public participation in municipal policymaking had an effect on MSW management within China’s decentralized political structure [54]. Public awareness and attitudes towards MSW management service can impact the entire integrated MSW management system, from household storage to separation, interest in MSW reduction, recycling, demand for collection services, willingness to pay for MSW management services, opposition to proposed locations of MSW facilities, the amount of MSW in the streets, and, ultimately, the success or failure of a MSW management system [41,43,55]. These evaluation indicators act as drivers of residents’ engagement in integrated MSW management.
(4)
NGOs subsystem. Environmental protection is one of the fields in which NGOs are active [56], and an increasing number of environmental NGOs and social work NGOs are participating in the mobilization of integrated MSW management [57]. NGOs tend to adopt a basic strategy of publicity and education by implementing a variety of MSW management activities the public can easily accept in order to improve the public’s knowledge of MSW treatment and their consciousness of environmental protection. Collaborative efforts with NGOs, including publicity and education can effectively raise the public’s environmental awareness. Moreover, NGOs play a role in organizing or sponsoring MSW management activities [22], and also share the supervision responsibilities of MSW management with the government to minimize the behaviors of rule violation [58]. NGOs’ supervisory (watchdog) role facilitates greater progress in integrated MSW management and sustainable development. Therefore, these evaluation indicators should be considered in NGO engagement in integrated MSW management.
Under the premise that integrated MSW management evaluation indicators system has been determined, the engagement of each stakeholder plays a vital role to upgrade the existing status of MSW management services. The evaluation indicators act on the behavior of each stakeholder in reverse and become a reflection of the evolutionary trend of the entire integrated MSW management synergy system and each subsystem. These four core subsystems are interrelated and interact with each other, and their coordinated interaction produces a positive synergistic effect, which guides the evolution of the whole system and holds the entire integrated MSW management system in an ordered and stable state, so that the requirements of high efficiency for integrated MSW management are achieved and the sustainable development of the environment is boosted.

2.3. Synergy Degree Model

On the basis of the evaluation indicators for the synergy degree of an integrated MSW management system, the synergy degree model is used to reveal the evolutionary trend of the integrated MSW management system in Harbin. Synergistics was first founded by Hermann Haken in 1977, and it can reflect the rule changes in the updating system procedure [59]. The degree of synergy is used to determine the coordination degree of the integrated MSW management synergy subsystems. Through the determination of the subsystem order degrees, the synergistic development level of the integrated MSW management system can be more easily analyzed.
Assuming that the integrated MSW management system X is composed by four subsystems, X = X 1 , X 2 , X 3 , X 4 , where X 1 is the government subsystem, X 2 is the enterprises subsystem; X 3 is the residents subsystem; and X 4 is the NGOs subsystem. The order parameters for subsystem X i   i = 1 , 2 , 3 , 4 are termed as X i = X i 1 , X i 2 , , X i 4 , n 1 , β i j X i j α i j , j 1 , n . α i j and β i j are the maximum and minimum values of X i j . The order degree for the order parameters of the subsystem u i ( X i j ) are:
u i ( X i j ) = X i j β i j α i j β i j ,   j 1 , k ,   w h e r e   X i j   i s   a   p o s i t i v e   o r d e r   p a r a m e t e r α i j X i j α i j β i j ,   j k + 1 , m ,   w h e r e   X i j   i s   a   n e g a t i v e   o r d e r   p a r a m e t e r
In the integrated order degree of subsystem u i ( X i ) 0 , 1 , the larger the u i ( X i ) value is, the larger the order degree of subsystem X i will be. u i ( X i ) can be expressed as:
u i ( X i ) = j = 1 n ω j u i ( X i j ) ,   0 ω j 1 ,   j = 1 n ω j = 1
where ω j states the effect of the order parameter of the subsystem. We can use the entropy weight method to calculate the ω j in order to obtain more objective results. The standardized matrix R = γ i j t × n ,   γ i j 0 , 1 can be obtained according to Equation (1). Thus, the entropy H j for the order parameter j for each subsystem can be expressed as:
H j = 1 l n t 1 t f i j l n f i j ,   j = 1 , 2 , , n
where f i j = γ i j / 1 t γ i j and f i j l n f i j = 0 if f i j = 0 . The entropy weight ω j for the order parameter j for each subsystem can be defined as:
ω j = 1 H j n j = 1 n H j ,   0 ω j 1 ,   j = 1 n H j = 1
Given the order degrees of each subsystem are u i 0 ( X i ) at a given initial time t 0 , the value changes to u i m ( X i ) at time t m as the system evolves. Then, the integrated MSW management synergy degree ρ can be expressed as follows:
ρ = θ i = 1 4 u i m ( X i ) u i 0 ( X i ) 1 / 4
θ = min i u i m ( X i u i 0 ( X i ) 0 ) min i u i m ( X i u i 0 ( X i ) 0 )
where θ = 1 if all the order degrees of four subsystems rise from time t 0 to t m , otherwise, θ = 1 . Regarding the synergy degree value ρ 1 , 1 , the greater the value of ρ is, the greater the synergy degree of the integrated MSW management system will be in that period, indicating the coordinated development of the entire integrated MSW management system.

2.4. Data Resource

According to the established evaluation indicators system above, we use Harbin’s original data from 2010 to 2019 for analysis. The data were obtained from the “Harbin Statistical Yearbook” (2011–2020) [60,61,62,63,64,65,66,67,68,69], the “China Urban Construction Statistical Yearbook” (2010–2019) [70,71,72,73,74,75,76,77,78,79], and some were collected from both simple random sampling and stratified sampling procedures of households. We sampled five communicates in each district, and twenty households were surveyed the questionnaires during 12–18 October 2019. A 5-point Likert scale [80] is used to mark the significance of each indicator compared with the principle (1, 2, 3, 4, 5) = (better, good, general, poor, worse). In this paper, the research group issued 600 questionnaires, 535 questionnaires were received, and 518 questionnaires were available. The recovery and effective rates were 89.17% and 86.33%, respectively. The original integrated MSW management evaluation indicators data are shown in Table 1.

3. Results and Discussion

The order degrees and the weights for the evaluation indicators in the integrated MSW management subsystems from 2010 to 2019 can be determined based on Equations (1), (3) and (4). The subsystem order degrees and the integrated MSW management system synergy degree can be determined based on Equations (2), (5) and (6). The evolutionary trend of each subsystem and the overall system is shown in Figure 3.

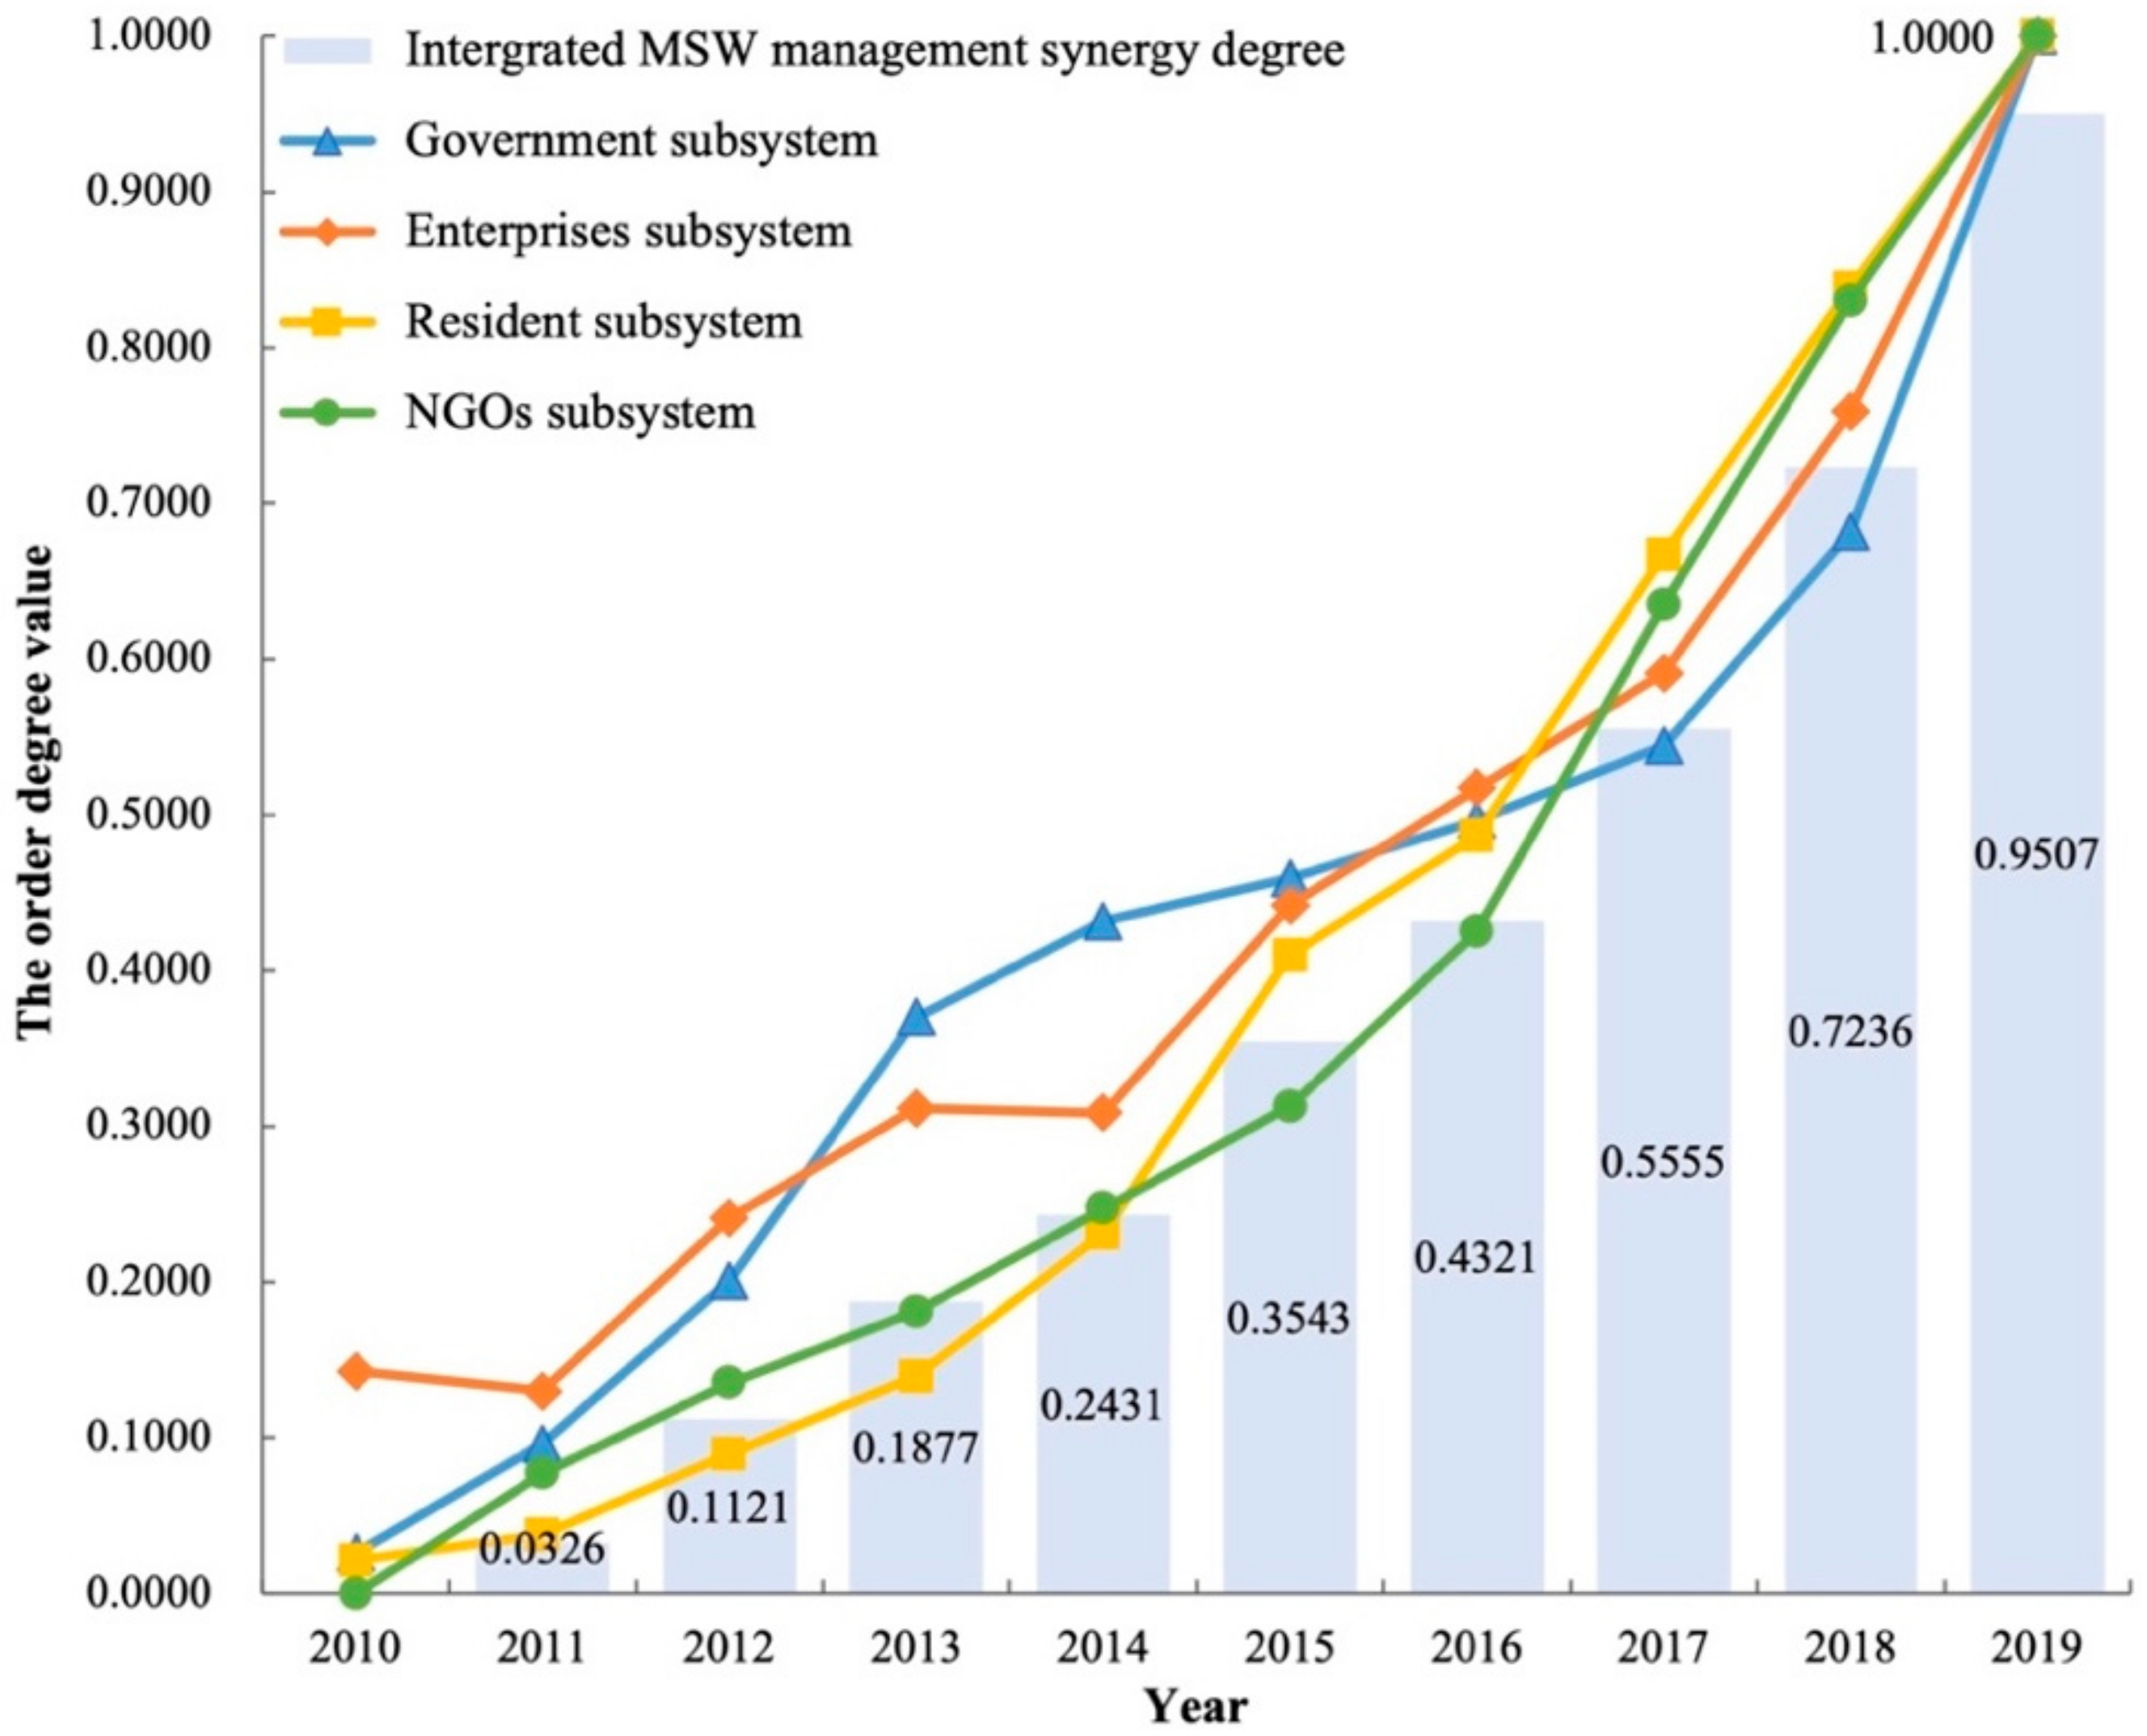
3.1. Analysis of Synergy Degree of Government Subsystem

During the observation period, the order degree of the government subsystem displayed a gradually rising trend with inflection points, indicating a positive and orderly state (Figure 3). The rate of the convoluted rise first sharply increased from 2010 to 2013, and evened out from 2014 to 2017, and then the order degree began to climb and continued to a maximum of 1.0000 in 2019. According to the interaction of the four evaluation indicators, the match of MSW disposal investment (X13) with mandatory policies and regulations (X14) greatly promoted the corresponding development trend of the government subsystem, and the other two indicators were affected slightly (Figure 4).
It can be seen that the order curve of the government subsystem in Figure 3 rose sharply at the medium-term of 12th Five-Year Plan period (2011–2015) and 13th Five-Year Plan period (2016–2020), due to the changes of the MSW disposal investment (X13) by the government as an implementation process. Specifically, The China’s State Council [81] released a reform guideline on MSW disposal to give priority to MSW disposal investment. Under this guideline, local government should assume responsibilities regarding MSW disposal facilities, law enforcement, and supervision at the local level, covering the expenditures in these areas. Appropriate allocations would be made from the China central government budget to support the local government. Therefore, the Harbin government has invested heavily in MSW disposal since 2011. The MSW disposal investment (X13) in Harbin increased from RMB 0 to RMB 216.32 million during the 12th Five-Year Plan period (2011–2015), leading to the changes of the order curve of the government subsystem during the period 2011–2015. Based on the achieved stable results in 2011–2015, the Harbin government made an additional investment during the 13th Five-Year Plan period (2016–2020) to reinforce the existing MSW management situations. MSW disposal investment (X13) was RMB 69.73 million in 2016 and reached to RMB 420.40 million in 2019, leading to the development curve of this subsystem during the period 2016–2019.
Furthermore, the order curve of the government subsystem in Figure 3 increased stepwise since 2016 due to the intensive implementation of relative mandatory policies and regulations (X14). To understand the MSW environmental impacts and improve the implementation of the MSW management systems, the Chinese central and Harbin local governments have formulated intensive strategical and tactical policies and regulations. MSW classification has been raised to a strategic issue since 2016. Xi Jinping, the president of China, specifically stated that it is of great significance to introduce the MSW classification system to more regions in China. The “Implementation Plan on the Municipal Solid Waste Classification System” required that mandatory MSW classification should be implemented by 46 cities in China and the MSW recycling rate reached over 35% by 2020, issued by China’s National Development and Reform Commission (NDRC) and the Ministry of Housing and Urban–Rural Development (MOHURD) released the “Implementation Plan on the Municipal Solid Waste Classification System” on 18 March 2017. Moreover, Heilongjiang People’s Government issued the “The Heilongjiang’s 13th Five-Year Plan for Environmental Protection” [82] and the “Implementation Opinions for the Heilongjiang Province on Municipal Solid Waste Classification” [83]; Harbin People’s Government issued the “Implementation Plan for Municipal Solid Waste Classification System in Harbin” [84]. Therefore, the normal increased trend of the government subsystem resumed after 2016 based on the support of intensive mandatory policies and regulations.

3.2. Analysis of Synergy Degree of Enterprises Subsystem

As is illustrated in Figure 3, the order degree of the enterprises subsystem fluctuated but steadily increased during the observation period, indicating that this subsystem is in a positive state. The order curve showed an accelerating trend, the rate was at a maximum of 1.0000 in 2019. Considering the mutual effect of the evaluation indicators, MSW treatment plants (X21), MSW treatment rate (X23), and MSW disposal technology (X24) mostly promoted the corresponding development trend of the enterprises subsystem (Figure 5).
It can be seen that there were declines in different degrees in the period 2010–2011 and 2013–2014 in Figure 3; the main reason for this decline is that the unsystematic state of the development of the MSW treatment plants affected the steady increase of the government subsystem collaboration, which indicates that the enterprises subsystem was severely restricted by MSW treatment plants (X21). During the 12th Five-Year Plan period, serval MSW treatment plants in Harbin, which were running under full load conditions with largely saturated disposal capacity, were closed because they failed to meet the requirements for national standards. So, there were five MSW treatment plants in 2010 in Harbin, but this number was reduced to four plants in 2011, then further reduced to three plants in 2014. The decrease of MSW treatment plants (X21) in Harbin resulted in a simultaneous decrease of order degree of this subsystem. In order to dispose of the dramatic increase in MSW properly and efficiently, new MSW treatment plants went into operation during the 13th Five-Year Plan period. The number of MSW treatment plants (X21) increased from three to four during the time period of 2014–2015 and was further raised from six to seven during the period of 2018–2019, resulting in a simultaneous increase of the order curve. Harbin is currently setting up a new MSW incineration treatment plant, and the MSW management performance will reach a higher level during the process.
Furthermore, despite several fluctuations, the order curve of the enterprises subsystem in Figure 3 increased stepwise during the observation period. The MSW treatment rate (X23) and MSW disposal technology (X24) played an important role and facilitated the synergetic evolution of this subsystem. The “Heilongjiang’s 12th Five-Year Plan for Environmental Protection” [85] created an MSW disposal system and claimed the MSW treatment rate reached at least 85% by 2015 in Harbin. During the 13th Five-Year Plan period, the MSW treatment rate was required to reach 93% by 2020 [82]. This policy intervention contributed to an extreme growth in the MSW treatment rate of the enterprises, improving the synergetic evolutionary status of this subsystem. Compared with landfill, incineration power generation offers the advantages of a small footprint, relative efficiency, low pollutant emissions, and is easy to control. Heilongjiang People’s Government [86] claimed to transform the MSW disposal method in a mandatory way to promote the MSW disposal technology conditions and support MSW disposal. Specifically, aiming to reduce landfill application, accelerate incineration application, and update the MSW disposal technology and facilities simultaneously. They also focused on gradually increasing technical standards, beginning with landfill gas and leachate control, incinerator gas and dioxin reduction, and now include odor control for composting facilities and anaerobic digesters. A possible solution for processing a large amount of MSW is thermal treatment (waste to energy) with energy recovery facility. This technology is considered to be the best alternative for accessing alternative renewable sources of energy [87], which can generate a significant amount of heat and energy from MSW, thereby reducing a lot of critical environmental issues associated with MSW management. Recycling and energy recovery processes can result in improved energy efficiency at MSW treatment and disposal facilities. Overall, growth coincided with volatility and the fluctuations disclosed that the evolution progress was not exactly going smoothly. Enterprises should play an active role in and accelerate the MSW management service of the process, increase the number of MSW treatment plants (X21), raise the MSW treatment rate (X23) and improve the MSW disposal technology (X24) to achieve deep integration and smooth processes. Enterprises’ responsibility for environmental protection emphasizes that the responsibility of producers should not only lie in the production process. Rather, it should also extend to the whole life cycle of products, including product design, circulation consumption, recycling, and MSW disposal (especially MSW recycling and disposal of their products).

3.3. Analysis of Synergy Degree of Residents Subsystem

From Figure 3, the order degree of residents subsystem was positive and there was an obvious rising trend during the observation period, the rate of the rise increased remarkably over the years, and the order degree achieved a peak of 1.0000 in 2019. Overall, the interactive relationship of the population density (X32) and activeness of public participation (X33) greatly promoted the synergetic evolution of the residents subsystem (Figure 6).
It can be noticed that the synergy degree of the residents subsystem in Figure 3 shows a growing trend, and the population density (X32) becomes the leading indicator to estimate the proportions of residents involved in the MSW management system. In general, urban population aggregation accelerates the demand for MSW management services. There are growing changes in urban populations in Harbin since recent years due to the urbanization migration from rural areas to the urban areas. It is worth noting that as urbanization and urban scale expansions continue, Harbin had a large population output. Residents in Harbin also migrate to other big cities in developed regions to meet their life satisfaction, resulting in a decline in population density. Since the 12th Five-Year Plan, Harbin put the emphasis on orderly population flow and reasonable population distribution. In Harbin, the urban population has decreased by 170 thousand in the past ten years, and the population density declined from 187.2 persons/km2 in 2011 to 179.3 persons/km2 in 2019, resulting in an increase in the urban road area per capita. Therefore, a reasonable population density leads to a stable order of the subsystem.
Moreover, the order curve of the residents’ subsystem in Figure 3 showed an upward shock during the observation period, in particular, there was a sharp rise in 2016. In general, the activeness of public participation (X33) also had an important effect on the residents subject subsystem. China’s NDRC and MOHURD [88] recommended that it was of great significance to motivate the residents to be involved in the MSW management. Measures are necessary to raise people’s awareness regarding MSW classification and to prevent them from simply dumping it. Along with wide publicity in how to classify MSW over the years, residents have formed pro-environmental awareness and they were eager to participate in MSW classification, reaching an ideal participation condition in 2016. Then China’s 13th Five-Year Plan claimed to guide the residents to self-consciously engaged in the MSW classification in the progress of MSW management. Hence, the activeness of public participation (X33) contributed a lot during the time period 2016–2019, promoting the residents’ subsystem to realize a self-organizational collaborative evolution.

3.4. Analysis of Synergy Degree of NGOs Subsystem

As presented in Figure 3, the order degree of the NGOs subsystem was positive and overall showed an upward trend over the years. The rate of the increase grew extremely rapidly during the observation period, and the order degree reached a maximum of 1.0000 in 2019. As a whole, the number of NGOs (X41) and publicity of MSW management (X42) played important roles in the NGOs subsystem, improving the coordination and synergetic evolution state of the NGOs subsystem (Figure 7).
The NGOs subject subsystem order degree in Figure 3 displayed an upward trend from 2010 to 2019, with the order of degree of improvement even obvious after 2015. Due to the increase of the number of NGOs (X41) and publicity of MSW management (X42), the subsystem has moved in an orderly direction. NGOs are considered public opinion representatives or mobilizers and have increasingly become involved in improving the sanitation and MSW situation in Harbin urban settlements. NGOs delicate a lot to the environment, society, and sustainability, and they perform such tasks as publicity and education and organize environmental protection activities. NGOs can fill the gaps left by government service provision, and they are recognized as key stakeholders in MSW management services. The publicity of the MSW management (X42) of NGOs may contribute to the acceleration of the capacity of MSW management to help the society take an active part in local MSW management by improving the consciousness of MSW management problems, especially MSW collection process from sources, and the ability to motivate residents to sort their MSW properly and to keep public premises clean. During the 12th Five-Year Plan period (2011–2015), the number of NGOs (X41) in Harbin increased from 625 to 675, resulting the order curve showing an upward trend. Since the 13th Five-Year Plan, Harbin has attached great importance to the NGOs participation in the effective management process and more attention had been paid to them. It has also been proposed that governments and NGOs should work together to promote MSW management services. By 2019, the number of NGOs (X41) in Harbin experienced an explosive growth to 927, resulting in the sharp increase of the order curve. The overall NGOs subject subsystem has been increasingly improved and has become more stable in Harbin.

3.5. Analysis of Synergy Degree of Integrated MSW Management System

From the above analysis, it can be found that if the order degrees of all subsystems at time tm are greater than its order degree at the initial time t0, there will be a positive degree value of the integrated MSW management system, indicating that the integrated system is in a state of synergistic evolution. As can be seen in Figure 3, the synergy degree of the integrated MSW management system was positive and increased steadily from 2010 to 2019, showing that four subsystems are in an ordered state, and subsystems are more efficient when coupled than when acting separately. Moreover, the synergistic evolution of an integrated system is decided by the synergistic mechanisms between the government, enterprises, residents, and NGOs subsystems (Figure 8). By this calculation, the synergy degree of the integrated system was 0.0326 in 2011 and had risen to 0.9507 in 2019, showing that the synergy system developed into a self-organizational state.
During the 12th Five-Year plan period (2011–2015), it was found that the government subsystem (X1) was the highest level among all the subsystems, illustrating that dramatic concerns have been raised regarding the improvement of government participation in Harbin. However, the residents subsystem (X3) and NGOs subsystem (X4) performed a low ordered state during this period. Moreover, according to the guidelines issued by China’s NDRC and MOHURD [89], Harbin had increased the financial and policy support to the MSW management service since 13tn Five-Year plan period (2016–2020), including improving the participation of residents, increasing the number of environmental NGOs, and upgrading the existing facilities for MSW disposal, etc. Therefore, the residents subsystem (X3) and NGOs subsystem (X4) had been greatly accelerated since 2016. Residents system (X3) had the highest order degree, indicating that more attention had been paid to it. Particularly, during the period of 2016–2019, the government subsystem (X1) became the “short board” and contributed the lower synergy degree of this subsystem due to the cutting down of relevant investment. It was found that, although synergistic effects were developing into an ordered state, there were still many possibilities for improvement, especially in terms of the government subsystem, in which necessary MSW disposal investment needs to be further reinforced.

4. Policy Implications

The effective integrated MSW management is based on effective coordination among the different stakeholders involved, such as governments, enterprises, residents, and NGOs. Poor coordination leads to the low efficiency of MSW treatment and disposal. Thus, more attention should be paid to the stakeholders’ coordination in integrated MSW management. The findings of this study have a number of important policy implications for different stakeholders, including both practitioners and policy makers.
First, it is necessary to clarify the roles and optimize the functions of different stakeholders in integrated MSW management. Compared with the monotony of the main body of MSW management in the traditional way, integrated MSW management emphasizes the diversity of main body, which can give full run to the functional advantages and positive roles of different stakeholders. The government should play a leading role in the integrated MSW management system. It is responsible for the formulation and implementation of MSW development strategies, plans, policies, and standards, as well as the supervision of market activities and the supply of public services. The enterprises should play a decisive role in resource allocation and is an important part of the integrated MSW management system. The orderly and positive market system is a basic guarantee for improving the efficiency of resource allocation. It is an essential requirement of socialist democratic politics for the residents to be the masters of public affairs, and the active participation of the masses is the driving force for the effective integrated MSW management. NGOs should undertake the transfer of government functions and supervise the exercise of government power in the integrated MSW management, as they also actively undertake tasks such as improving people’s livelihood, resolving social conflicts, and delivering public services.
Second, responsibilities and regional tasks should be assigned to each integrated MSW management stakeholder. Integrated MSW management emphasizes coordination and interaction between different stakeholders, and the basic requirement is to perform their respective duties, assign their tasks, fulfill their responsibilities in an orderly and coordinated manner. Each stakeholder needs to act according to responsibility in the integrated MSW management. To strengthen the sense of responsibility and promote the integrated MSW management, it is necessary to optimize the interaction mode of stakeholder around responsibility. On one hand, different types of stakeholder responsibilities should be distinguished. Although moral responsibility, legal responsibility and political responsibility, and many other aspects have the close relation, there is a certain difference. Different types of responsibility have different requirements for the stakeholders, so it is helpful to define the basic functions of the stakeholders more clearly to clarify the differences and connections between different types of responsibility. On the other hand, it is necessary to make clear the division of tasks and responsibilities of different stakeholders. Only in the case of a clear division of tasks and responsibility consistent with power and responsibility, can each stakeholder better complete their duties in the process of integrated MSW management and effectively avoid a lack of coordination.
Third, the behavior strategy of each integrated MSW management stakeholder should be analyzed. The coordinated interaction of stakeholders depends on their respective behavior strategies. The most effective way to analyze their behavior strategies is to introduce credit supervision mechanisms and supervision mechanisms for integrated MSW management. The credit supervision system of MSW management records bad behavior and a “blacklist” can promote the environmental behaviors of stakeholders by improving the costs of illegal activities. The supervision system is dominated by competent industry departments, environmental protection organizations, and third parties, playing the roles of each involved stakeholder in the publicity and supervision of MSW management knowledge and recruiting voluntary supervisors to strengthen the supervision of MSW management. The internet of things technologies should be also applied to monitor and control integrated MSW management systems, using video monitoring, spatial positioning, electronic labels, and other information technology, and the whole process of MSW generation, collection, storage, shipment, treatment, and disposal can be monitored by a computer real-time monitoring system.
Finally, stakeholders’ engagement should be encouraged in the integrated MSW management. Necessary encouragement activities should be carried out to raise the awareness of all stakeholders of integrated MSW management. Specific methods, purposes, and meanings of integrated MSW management should be explored at multiple levels through new media, we-media, and traditional media. In this way, all stakeholders can improve their understanding of integrated MSW management and form a new way of life identity. At the same time, it is necessary to strengthen the education of integrated MSW management, so that MSW management can become an important standard of urban civilization and progress. Only when all stakeholders put sufficient effort into it, can integrated MSW management work be carried out smoothly and run efficiently.

5. Conclusions

An integrated municipal solid waste (MSW) management system is a complex and composite system that is determined by different aspects. The effective implementation of integrated MSW management is based on effective coordination among multiple stakeholders, such as governments, enterprises, residents, and NGOs. Previous studies have examined MSW management stakeholders mainly from the perspective of mainly from the perspective of multiple stakeholder participation and social impact, but less attention was paid to the evaluation of the multifaceted interactions and engagements among the stakeholders. However, poor coordination leads to the low efficiency of integrated MSW management. Under such circumstances, this research attempted to identify the problems and weakness of dis-synergy among different stakeholders engaged in integrated MSW management, using Harbin as a case study. We formed an integrated MSW management system including four subsystems: government subsystem, enterprises subsystem, residents subsystem, and NGOs subsystem from the angle of stakeholder theory and synergy theory. To measure the integrated MSW management synergistic effects, we applied the synergy degree model to estimate the order of degree value changes of both the subsystems and synergy system, reflecting the systematic characteristics and evolution status of different stakeholders during the MSW management process. The results demonstrated that the coordination interactions by different stakeholders promote the synergetic state of integrated MSW management systems, and indicators that affect the synergy degree were determined by many aspects during the dynamic development process based on time series. It was also observed that although synergistic effects were developing into an ordered condition between 2010 to 2019, there was still much room for improvement, especially in terms of the government subsystem, and necessary MSW disposal investment needed to be further reinforced. Therefore, many policies need to be implemented, including clarifying the roles of different stakeholders, assigning regional tasks to each stakeholder, analyzing their behavior strategies, and encouraging their engagement. This research can provide a scientific reference for improving stakeholder engagement and guiding the coordinated development of the level and quality of integrated MSW management to achieve sustainable goals.

Author Contributions

Conceptualization, W.W. and Z.C.; methodology, W.W. and Z.C.; software, W.W. and Z.C.; validation, T.Z. and Z.C.; formal analysis, W.W. and T.Z.; investigation, T.Z.; resources, W.W. and T.Z.; data curation, W.W. and T.Z.; writing—original draft preparation, W.W.; writing—review and editing, W.W. and Z.C.; visualization, W.W.; supervision, Z.C.; project administration, Z.C.; funding acquisition, Z.C. All authors have read and agreed to the published version of the manuscript.

Funding

This research was funded by the Major Project of Philosophy and Social Sciences Research, Ministry of Education, grant number 17JZD026; National Key Research and Development Plan Key Special Project, grant number 2018YFC1903605; Fundamental Research Funds for the Central Universities, grant number HEUCFP201823 and GK2090260158; Ph.D. Student Research and Innovation Fund of the Fundamental Research Funds for the Central Universities, grant number HEUGIP201719; Leading Research Project of Shanghai Jiao Tong University—Think Tanks, grant number ZXYJ-2020017; Natural Science Foundation of China, grant number 72004130.

Institutional Review Board Statement

Not applicable.

Informed Consent Statement

Not applicable.

Data Availability Statement

Not applicable.

Conflicts of Interest

The authors declare no conflict of interest.

References

  1. Paul, K.; Chattopadhyay, S.; Dutta, A.; Krishna, A.P.; Ray, S. A comprehensive optimisation model for integrated solid waste management system: A case study on Kolkata city, India. Environ. Eng. Res. 2019, 24, 220–237. [Google Scholar] [CrossRef] [Green Version]
  2. Xi, B.D.; Su, J.; Huang, G.H.; Qin, X.S.; Jiang, Y.H.; Huo, S.L.; Ji, D.F.; Yao, B. An integrated optimization approach and multi-criteria decision analysis for supporting the waste-management system of the City of Beijing, China. Eng. Appl. Artif. Intell. 2010, 23, 620–631. [Google Scholar] [CrossRef]
  3. Chu, Z.; Fan, X.; Wang, W.; Huang, W. Quantitative evaluation of heavy metals’ pollution hazards and estimation of heavy metals’ environmental costs in leachate during food waste composting. Waste Manag. 2019, 74, 119–128. [Google Scholar] [CrossRef] [PubMed]
  4. Kharat, M.G.; Murthy, S.; Kamble, S.J.; Raut, R.D.; Kamble, S.S.; Kharat, M.G. Fuzzy multi-criteria decision analysis for environmentally conscious solid waste treatment and disposal technology selection. Technol. Soc. 2019, 57, 20–29. [Google Scholar] [CrossRef]
  5. Yuan, X.L.; Fan, X.H.; Liang, J.X.; Liu, M.Y.; Teng, Y.Q.; Ma, Q.; Wang, Q.S.; Mu, R.M.; Zuo, J. Public perception towards waste-to energy as a waste management strategy: A case from Shandong, China. Int. J. Environ. Res. Public Health 2019, 16, 2997. [Google Scholar] [CrossRef] [Green Version]
  6. Fei, F.; Qu, L.L.; Wen, Z.G.; Xue, Y.Y.; Zhang, H. How to integrate the informal recycling system into municipal solid waste management in developing countries: Based on a China’s case in Suzhou urban area. Resour. Conserv. Recycl. 2016, 110, 74–86. [Google Scholar] [CrossRef]
  7. Lee, C.K.M.; Yeung, C.L.; Xiong, Z.R.; Chung, S.H. A mathematical model for municipal solid waste management—A case study in Hong Kong. Waste Manag. 2016, 58, 430–441. [Google Scholar] [CrossRef]
  8. Meng, X.; Tan, X.; Wang, Y.; Wen, Z.; Tao, Y.; Qian, Y. Investigation on decision-making mechanism of residents’ household solid waste classification and recycling behaviors. Resour. Conserv. Recycl. 2019, 140, 224–234. [Google Scholar] [CrossRef]
  9. Hamer, G. Solid waste treatment and disposal: Effects on public health and environmental safety. Biotechnol. Adv. 2003, 22, 71–79. [Google Scholar] [CrossRef]
  10. Moberg, A.; Finnveden, G.; Johansson, J.; Lind, P. Life cycle assessment of energy from solid waste—part 2: Landfilling compared to other treatment methods. J. Clean. Prod. 2005, 13, 231–240. [Google Scholar] [CrossRef]
  11. Asefi, H.; Lim, S. A novel multi-dimensional modeling approach to integrated municipal solid waste management. J. Clean. Prod. 2017, 166, 1131–1143. [Google Scholar] [CrossRef]
  12. Asefi, H.; Shahparvari, S.; Chhetri, P.; Lim, S. Variable fleet size and mix VRP with fleet heterogeneity in integrated solid waste management. J. Clean. Prod. 2019, 230, 1376–1395. [Google Scholar] [CrossRef]
  13. Phonphoton, N.; Pharino, C. A system dynamics modeling to evaluate flooding impacts on municipal solid waste management services. Waste Manag. 2019, 87, 525–536. [Google Scholar] [CrossRef]
  14. Fagnani, E.; Guimarães, J.R. Waste management plan for higher education institutions in developing countries: The Continuous Improvement Cycle model. J. Clean. Prod. 2017, 147, 108–118. [Google Scholar] [CrossRef]
  15. Malakahmad, A.; Nasir, M.Z.Z.C.M.; Kutty, S.R.M.; Isa, M.H. Solid waste characterization and recycling potential for University Technology PETRONAS academic buildings. Am. J. Environ. Sci. 2010, 6, 422–427. [Google Scholar] [CrossRef]
  16. Kemirtlek, A. Integrated Solid Waste Management; Istanbul Environmental Management Industry and Trade Co., Ltd.: Istanbul, Turkey, 2010. [Google Scholar]
  17. Tsai, F.M.; Bui, T.; Tseng, M.; Lim, M.K.; Hu, J. Municipal solid waste management in a circular economy: A data-driven bibliometric analysis. J. Clean. Prod. 2020, 275, 124–132. [Google Scholar] [CrossRef]
  18. Song, X.; Geng, Y.; Dong, H.; Chen, W. Social network analysis on industrial symbiosis: A case of Gujiao eco-industrial park. J. Clean. Prod. 2018, 193, 414–423. [Google Scholar] [CrossRef]
  19. Caniato, M.; Vaccari, M.; Visvanathan, C.; Zurbrügg, C. Using social network and stakeholder analysis to help evaluate infectious waste management: A step towards a holistic assessment. Waste Manag. 2014, 34, 938–951. [Google Scholar] [CrossRef]
  20. Morrissey, A.J.; Browne, J. Waste management models and their application to sustainable waste management. Waste Manag. 2004, 24, 297–308. [Google Scholar] [CrossRef]
  21. Achillas, C.; Moussiopoulos, N.; Karagiannidis, A.; Banias, G.; Perkoulidis, G. The use of multi-criteria decision analysis to tackle waste management problems: A literature review. Waste Manag. Res. 2013, 31, 115–129. [Google Scholar] [CrossRef]
  22. Joseph, K. Stakeholder participation for sustainable waste management. Habitat Int. 2006, 30, 863–871. [Google Scholar] [CrossRef]
  23. Joseph, K.; Rajendiran, S.; Senthilnathan, R.; Rakesh, M. Integrated approach to solid waste management in Chennai: An Indian metro city. J. Mater. Cycles Waste Manag. 2012, 14, 75–84. [Google Scholar] [CrossRef]
  24. Sharholy, M.; Ahmad, K.; Mahmood, G.; Trivedi, R.C. Municipal solid waste management in Indian cities–A review. Waste Manag. 2008, 28, 459–467. [Google Scholar] [CrossRef]
  25. Fernando, R.L.S. Solid waste management of local governments in the Western Province of Sri Lanka: An implementation analysis. Waste Manag. 2019, 84, 194–203. [Google Scholar] [CrossRef]
  26. Danso, G.; Drechsel, P.; Fialor, S.; Giordano, M. Estimating the demand for municipal waste compost via farmers’ willingness-to-pay in Ghana. Waste Manag. 2006, 26, 1400–1409. [Google Scholar] [CrossRef]
  27. Begum, R.A.; Siwar, C.; Pereira, J.J.; Jaafar, A.H. Factors and values of willingness to pay for improved construction waste management—A perspective of Malaysian contractors. Waste Manag. 2007, 27, 1902–1909. [Google Scholar] [CrossRef]
  28. Yang, J.; Zou, L.; Lin, T.; Wu, Y.; Wang, H. Public willingness to pay for CO2 mitigation and the determinants under climate change: A case study of Suzhou, China. J. Environ. Manag. 2014, 146, 1–8. [Google Scholar] [CrossRef] [PubMed]
  29. Challcharoenwattana, A.; Pharino, C. Wishing to finance a recycling program? Willingness-to-pay study for enhancing municipal solid waste recycling in urban settlements in Thailand. Habitat Int. 2016, 51, 23–30. [Google Scholar] [CrossRef]
  30. Song, X.; Geng, Y.; Li, K.; Zhang, X.; Wu, F.; Pan, H.; Zhang, Y. Does environmental infrastructure investment contribute to emissions reduction? A case of China. Front. Energy 2020, 14, 57–70. [Google Scholar] [CrossRef]
  31. Hasan, A.; Nahiduzzaman, K.M.; Aldosary, A.S. Public participation in EIA: A comparative study of the projects run by government and non-governmental organizations. Environ. Impact Assess. Rev. 2018, 72, 12–24. [Google Scholar] [CrossRef]
  32. Song, X.; Ali, M.; Zhang, X.; Sun, H.; Wei, F. Stakeholder coordination analysis in hazardous waste management: A case study in China. J. Mater. Cycles Waste Manag. 2021, 23, 1873–1892. [Google Scholar] [CrossRef]
  33. Chu, Z.; Wang, W.; Zhou, A.; Huang, W. Charging for municipal solid waste disposal in Beijing. Waste Manag. 2019, 94, 85–95. [Google Scholar] [CrossRef]
  34. Wang, Z.; Xue, Q.; Ji, Y.; Yu, Z. Indoor environment quality in a low-energy residential building in winter in Harbin. Build. Environ. 2018, 135, 194–201. [Google Scholar] [CrossRef]
  35. Yau, Y. Domestic waste recycling, collective action and economic incentive: The case in Hong Kong. Waste Manag. 2010, 30, 2440–2447. [Google Scholar] [CrossRef]
  36. Kurisu, K.H.; Bortoleto, A.P. Comparison of waste prevention behaviors among three Japanese megacity regions in the context of local measures and socio-demographics. Waste Manag. 2011, 31, 1441–1449. [Google Scholar] [CrossRef]
  37. Hacking, N.; Flynn, A. Protesting against neoliberal and illiberal governmentalities: A comparative analysis of waste governance in the UK and China. Polit. Geogr. 2018, 63, 31–42. [Google Scholar] [CrossRef]
  38. Visvanathan, C. Solid Waste Management in Asian Perspectives; Asian Institute of Technology: Bangkok, Thailand, 2006; pp. 131–142. [Google Scholar]
  39. Zhang, Y.; Huang, G.H.; He, L. A multi-echelon supply chain model for municipal solid waste management system. Waste Manag. 2014, 34, 553–561. [Google Scholar] [CrossRef]
  40. Guerrero, L.A.; Maas, G.; Hogland, W. Solid waste management challenges for cities in developing countries. Waste Manag. 2013, 33, 220–232. [Google Scholar] [CrossRef]
  41. Henry, R.K.; Zhao, Y.S.; Dong, J. Municipal solid waste management challenges in developing countries–Kenyan case study. Waste Manag. 2006, 26, 92–100. [Google Scholar] [CrossRef]
  42. Guo, W.; Xi, B.; Huang, C.; Li, J.; Tang, Z.; Li, W.; Ma, C.; Wu, W. Solid waste management in China: Policy and driving factors in 2004–2019. Resour.Conserv. Recycl. 2021, 173, 105727. [Google Scholar] [CrossRef]
  43. Zurbrügg, C.; Gfrerer, M.; Ashadi, H.; Brenner, W.; Küper, D. Determinants of sustainability in solid waste management–The Gianyar Waste Recovery Project in Indonesia. Waste Manag. 2012, 32, 2126–2133. [Google Scholar] [CrossRef]
  44. Ramachandra, T.V.; Bharath, H.A.; Kulkarni, G.; Han, S.S. Municipal solid waste: Generation, composition and GHG emissions in Bangalore, India. Renew. Sustain. Energy Rev. 2018, 82, 1122–1136. [Google Scholar] [CrossRef]
  45. Patil, B.S.; Agnes Anto, C.; Singh, D.N. Simulation of municipal solid waste degradation in aerobic and anaerobic bioreactor landfills. Waste Manag. Res. 2017, 35, 301–312. [Google Scholar] [CrossRef]
  46. Hameed, Z.; Aslam, M.; Khan, Z.; Maqsood, K.; Atabani, A.E.; Ghauri, M.; Khurram, M.S.; Rehan, M.; Nizami, A.S. Gasification of municipal solid waste blends with biomass for energy production and resources recovery: Current status, hybrid technologies and innovative prospects. Renew. Sustain. Energy Rev. 2021, 136, 110375. [Google Scholar] [CrossRef]
  47. Singh, R.P.; Tyagi, V.V.; Allen, T.; Ibrahim, M.; Kothari, R. An overview of exploring the possibilities of energy generation from municipal solid waste (MSW) in Indian scenario. Renew. Sustain. Energy Rev. 2011, 15, 4797–4808. [Google Scholar] [CrossRef]
  48. Kumar, A.; Samadder, R.S. A review on technological options of waste to energy for effective management of municipal solid waste. Waste Manag. 2017, 69, 407–422. [Google Scholar] [CrossRef]
  49. Brunner, P.H.; Rechberger, H. Waste to energy—key element for sustainable waste management. Waste Manag. 2015, 37, 3–12. [Google Scholar] [CrossRef]
  50. Kundariya, N.; Mohanty, S.S.; Varjani, S.; Ngo, H.H.; Wong, J.W.C.; Taherzadeh, M.J.; Ng, H.Y.; Kim, S.H.; Bui, X.T. A review on integrated approaches for municipal solid waste for environmental and economical relevance: Monitoring tools, technologies, and strategic innovations. Bioresour. Technol. 2021, 342, 125982. [Google Scholar] [CrossRef]
  51. Scarlat, N.; Fahl, F.; Dallemand, J.F. Status and opportunities for energy recovery from municipal solid waste in Europe. Waste Biomass Valorization 2019, 10, 2425–2444. [Google Scholar] [CrossRef] [Green Version]
  52. Pires, A.; Martinho, G.; Chang, N.B. Solid waste management in European countries: A review of systems analysis techniques. J. Environ. Manag. 2011, 92, 1033–1050. [Google Scholar] [CrossRef]
  53. Ekere, W.; Mugisha, J.; Drake, L. Factors influencing waste separation and utilization among households in the Lake Victoria crescent, Uganda. Waste Manag. 2009, 29, 3047–3051. [Google Scholar] [CrossRef] [PubMed]
  54. Wong, N.W.M.; Grano, S.A. Environmental protests and NIMBY activism: Local politics and waste management in Beijing and Guangzhou. China Inf. 2016, 30, 143–164. [Google Scholar] [CrossRef]
  55. Yousif, D.F.; Scott, S. Governing solid waste management in Mazatenango, Guatemala. Int. Dev. Plan. Rev. 2007, 29, 433–450. [Google Scholar] [CrossRef]
  56. Zhan, X.; Tang, S.Y. Political opportunities, resources constraints and policy’s advocacy of environmental NGOs in China. Public Adm. 2013, 91, 381–399. [Google Scholar] [CrossRef]
  57. Guo, S.; Chen, L. Why is China struggling with waste classification? A stakeholder theory perspective. Resour. Conserv. Recycl. 2022, 183, 106312. [Google Scholar] [CrossRef]
  58. Contreras, F.; Hanaki, K.; Aramaki, T.; Connors, S. Application of analytical hierarchy process to analyze stakeholders preferences for municipal solid waste management plans, Boston, USA. Resour. Conserv. Recycl. 2008, 52, 979–991. [Google Scholar] [CrossRef]
  59. Haken, H. Basic concepts of synergetics. Appl. Phys. A 1993, 57, 111–115. [Google Scholar] [CrossRef]
  60. China’s National Bureau of Statistics (NBS). Harbin Statistical Yearbook 2011; China Statistics Press: Beijing, China, 2011. (In Chinese) [Google Scholar]
  61. China’s National Bureau of Statistics (NBS). Harbin Statistical Yearbook 2012; China Statistics Press: Beijing, China, 2012. (In Chinese) [Google Scholar]
  62. China’s National Bureau of Statistics (NBS). Harbin Statistical Yearbook 2013; China Statistics Press: Beijing, China, 2013. (In Chinese) [Google Scholar]
  63. China’s National Bureau of Statistics (NBS). Harbin Statistical Yearbook 2014; China Statistics Press: Beijing, China, 2014. (In Chinese) [Google Scholar]
  64. China’s National Bureau of Statistics (NBS). Harbin Statistical Yearbook 2015; China Statistics Press: Beijing, China, 2015. (In Chinese) [Google Scholar]
  65. China’s National Bureau of Statistics (NBS). Harbin Statistical Yearbook 2016; China Statistics Press: Beijing, China, 2016. (In Chinese) [Google Scholar]
  66. China’s National Bureau of Statistics (NBS). Harbin Statistical Yearbook 2017; China Statistics Press: Beijing, China, 2017. (In Chinese) [Google Scholar]
  67. China’s National Bureau of Statistics (NBS). Harbin Statistical Yearbook 2018; China Statistics Press: Beijing, China, 2018. (In Chinese) [Google Scholar]
  68. China’s National Bureau of Statistics (NBS). Harbin Statistical Yearbook 2019; China Statistics Press: Beijing, China, 2019. (In Chinese) [Google Scholar]
  69. China’s National Bureau of Statistics (NBS). Harbin Statistical Yearbook 2020; China Statistics Press: Beijing, China, 2020. (In Chinese) [Google Scholar]
  70. China’s Ministry of Housing and Urban-Rural Development (MOHURD). China Urban Construction Statistical Yearbook 2010; China Statistics Press: Beijing, China, 2011. (In Chinese) [Google Scholar]
  71. China’s Ministry of Housing and Urban-Rural Development (MOHURD). China Urban Construction Statistical Yearbook 2011; China Statistics Press: Beijing, China, 2012. (In Chinese) [Google Scholar]
  72. China’s Ministry of Housing and Urban-Rural Development (MOHURD). China Urban Construction Statistical Yearbook 2012; China Statistics Press: Beijing, China, 2013. (In Chinese) [Google Scholar]
  73. China’s Ministry of Housing and Urban-Rural Development (MOHURD). China Urban Construction Statistical Yearbook 2013; China Statistics Press: Beijing, China, 2014. (In Chinese) [Google Scholar]
  74. China’s Ministry of Housing and Urban-Rural Development (MOHURD). China Urban Construction Statistical Yearbook 2014; China Statistics Press: Beijing, China, 2015. (In Chinese) [Google Scholar]
  75. China’s Ministry of Housing and Urban-Rural Development (MOHURD). China Urban Construction Statistical Yearbook 2015; China Statistics Press: Beijing, China, 2016. (In Chinese) [Google Scholar]
  76. China’s Ministry of Housing and Urban-Rural Development (MOHURD). China Urban Construction Statistical Yearbook 2016; China Statistics Press: Beijing, China, 2017. (In Chinese) [Google Scholar]
  77. China’s Ministry of Housing and Urban-Rural Development (MOHURD). China Urban Construction Statistical Yearbook 2017; China Statistics Press: Beijing, China, 2018. (In Chinese) [Google Scholar]
  78. China’s Ministry of Housing and Urban-Rural Development (MOHURD). China Urban Construction Statistical Yearbook 2018; China Statistics Press: Beijing, China, 2019. (In Chinese) [Google Scholar]
  79. China’s Ministry of Housing and Urban-Rural Development (MOHURD). China Urban Construction Statistical Yearbook 2019; China Statistics Press: Beijing, China, 2020. (In Chinese) [Google Scholar]
  80. Morgan-Davies, J.; Morgan-Davies, C.; Pollock, M.L.; Holland, J.P.; Waterhouse, A. Characterisation of extensive beef cattle systems: Disparities between opinions, practice and policy. Land Use Policy 2014, 38, 707–718. [Google Scholar] [CrossRef]
  81. China’s State Council. Guidelines on Further Strengthening the Municipal Solid Waste Disposal. 2011. Available online: http://www.gov.cn/zhengce/content/2011-04/25/content_4700.htm (accessed on 19 April 2011). (In Chinese)
  82. Heilongjiang People’s Government. The Heilongjiang’s 13th Five-Year Plan for Environmental Protection. 2016. Available online: https://www.hlj.gov.cn/n200/2017/0424/c75-10823279.html (accessed on 30 December 2016). (In Chinese)
  83. Heilongjiang People’s Government. Implementation Opinions for the Heilongjiang Province on Municipal Solid Waste Classification. 2017. Available online: https://www.hlj.gov.cn/n200/2017/1225/c75-10857839.html (accessed on 25 December 2017). (In Chinese)
  84. Harbin People’s Government. Implementation Plan for Municipal Solid Waste Classification System in Harbin. 2018. Available online: http://www.harbin.gov.cn/art/2021/10/26/art_17780_1190011.html (accessed on 30 March 2018). (In Chinese)
  85. Heilongjiang People’s Government. The Heilongjiang’s 12th Five-Year Plan for Environmental Protection. 2012. Available online: https://www.dowater.com/info/2012-05-18/85502.html (accessed on 18 May 2012). (In Chinese).
  86. Heilongjiang People’s Government. Implementation Opinions for the Heilongjiang Province on Further Strengthening the Municipal Solid Waste Disposal. 2012. Available online: https://www.hlj.gov.cn/n200/2012/0329/c75-10323571.html (accessed on 29 March 2012). (In Chinese)
  87. Khanal, S.K.; Varjani, S.; Sze Ki Lin, C.; Awasthi, M.K. Waste-to-resources: Opportunities and challenges. Bioresour. Technol. 2020, 317, 123987. [Google Scholar] [CrossRef]
  88. China’s National Development and Reform Commission; China’s Ministry of Housing and Urban-Rural Development. The China’s 12th Five-Year Plan on Facility Construction of Municipal Solid Waste Harmless Disposal. 2012. Available online: http://www.gov.cn/zhengce/content/2012-05/05/content_5109.htm (accessed on 5 May 2012). (In Chinese)
  89. China’s National Development and Reform Commission; China’s Ministry of Housing and Urban-Rural Development. The China’s 13th Five-Year Plan on Facility Construction of Municipal Solid Waste Harmless Disposal. 2016. Available online: https://www.ndrc.gov.cn/xxgk/zcfb/ghwb/201701/t20170122_962225_ext.html (accessed on 31 December 2016). (In Chinese)
Figure 1. Study area.
Energies 15 05000 g001
Figure 2. Stakeholder engagement evaluation indicators system in integrated MSW management.
Energies 15 05000 g002
Figure 3. Development trend of the synergy degree.
Energies 15 05000 g003
Figure 4. Indicators interaction in government subsystem.
Energies 15 05000 g004
Figure 5. Indicators interaction in the enterprises subsystem.
Energies 15 05000 g005
Figure 6. Indicators interaction in residents subsystem.
Energies 15 05000 g006
Figure 7. Indicators interaction in NGOs subsystem.
Energies 15 05000 g007
Figure 8. Integrated MSW management system.
Energies 15 05000 g008
Table 1. Original integrated MSW management evaluation indicators data.
Indicators2010201120122013201420152016201720182019
X1X1115,15328,72034,72035,22032,22034,22036,08036,23536,55444,220
X121020170321722314301130673118346634863641
X13297608292270272180021632375401049642040
X143.063.123.093.083.333.393.954.144.274.30
X2X215444344467
X224835572066897125794582558980941089089676
X2398.8996.15107.14114.7118.22131.26142.23143.86151.79184.88
X242.682.843.013.143.243.273.303.573.703.80
X3X3118,370.420,960.623,538.826,363.428,815.930,978.033,190.035,546.037,828.040,007.0
X32186.90187.20187.40187.50186.00181.10181.20179.90179.60179.30
X332.872.883.003.043.083.053.163.574.034.36
X342.392.432.502.632.702.682.883,003.203.50
X4X41612625625627657675726873916927
X422.192.212.272.402.502.582.762.813.363.72
X432.522.883.243.283.253.473.493.513.553.92
X442.913.163.313.413.473.533.563.593.704.12
Note: The data of X11, X22, X31, X32, and X41 were obtained from “Harbin Statistical Yearbook” (2011–2020). The data of X12, X13, X21, and X23 were obtained from “China Urban Construction Statistical Yearbook” (2010–2019). The data of X14, X24, X33, X34, X42, X43, and X44 were calculated from surveys.
Publisher’s Note: MDPI stays neutral with regard to jurisdictional claims in published maps and institutional affiliations.

