Article

The Evolution of the Spatial-Temporal Differences of Municipal Solid Waste Carbon Emission Efficiency in China

1
School of Environment, Tsinghua University, Beijing 100084, China
2
School of Management and Economics, Beijing Institute of Technology, Beijing 100081, China
3
The Economy and Management School, Harbin Engineering University, Harbin 150001, China
4
China Institute for Urban Governance, Shanghai Jiao Tong University, Shanghai 200240, China
*
Author to whom correspondence should be addressed.
Energies 2022, 15(11), 3987; https://doi.org/10.3390/en15113987
Submission received: 29 April 2022 / Revised: 21 May 2022 / Accepted: 24 May 2022 / Published: 28 May 2022
(This article belongs to the Special Issue Advances in Energy and Resource Efficiency and Sustainable Policy)

Abstract

:
Municipal solid waste (MSW) treatment is one of the major contributors to carbon emissions. The improvement in MSW treatment carbon emission efficiency is crucial for China to achieve its CO2 emission targets. Firstly, this study used the super-efficiency SBM-DEA model to calculate the MSW treatment carbon emission efficiency in 31 provinces in China from 2010 to 2019. The results show that the MSW treatment carbon emission efficiency in all provinces except Shanghai and Jiangsu is less than 1, and the provinces with high efficiency are mainly located in eastern China. Secondly, the spatial auto correlation model and spatial Markov chain are used to test the regional differences and the spatial spillover effect of efficiency. The results show that the national average efficiency shows a fluctuating downward trend, and only the western region achieves a gradual increase. The regional differences in China’s MSW processing efficiency of carbon emissions show a fluctuating upward trend, and the regional background affects the spatiotemporal evolution pattern of the efficiency. Finally, the special error model was used to analyze the factors and influence paths that affect the efficiency, and to find that the degree of government intervention as an influencing factor that restricts the improvement of efficiency. Based on the research results, we put forward countermeasures and suggestions to improve the MSW treatment carbon emission efficiency in each province and the country as a whole.

1. Introduction

The Intergovernmental Panel on Climate Change (IPCC) released its Synthesis Report: Climate Change 2014, stating that global warming has become an important international political issue [1]. According to the International Energy Agency (IEA), China emitted 6.2 billion tons of carbon dioxide in 2007, surpassing the United States as the world’s largest emitter [2]. China’s carbon emissions are increasing rapidly; in the baseline scenario, China emitted more than a third of the world’s carbon emissions during 2021 [3,4]. Faced with this grim reality, the Chinese government takes reducing carbon emissions and developing a low carbon economy as a national strategy [5,6]. China has made a solemn commitment to the world to reduce its carbon emissions intensity, from the levels of 2005, by 40% to 45%, by 2020 [7,8]. In the meantime, to combat global climate change and sustainable development, the Chinese central government intends to achieve the peaking of carbon dioxide emission around 2030 [9].
The increasing complexity of human socio-economic activities has proved to be the main cause of global warming [10,11]. With the increasing amount of municipal solid waste (MSW) generated by China’s consumer activities and the increasing amount of disposal, MSW treatment activities contribute to several environmental problems and health effects, and generate emissions of greenhouse gases (GHGs), with an important contribution to the global climate change problem [12,13]. China is the largest developing country in the world [14], and the relationship between the current increase in MSW production and the suppression of GHG emissions is intensifying [15]. The development of the MSW industry in China is faced with the dual constraints of MSW treatment quantity control and carbon emission control [16]. In this case, the scientific and appropriate improvement of MSW treatment carbon emission efficiency is the fundamental solution to solve the long-term problems in the development of the MSW treatment industry in China. However, MSW treatment carbon emission efficiency in China has not been determined, and there is no relevant research in the previous literature, and so the subject requires further exploration. This paper will be a zero breakthrough in the literature on MSW treatment industry carbon emission efficiency in China.
With the above background, the research of this paper is imperative. This study used the super-efficiency SBM-DEA model to measure MSW treatment carbon emission efficiency. By considering both the expected output and unexpected output, the problem of high efficiency estimation caused by slack variables is solved, and the MSW treatment carbon emission efficiency of 31 provinces across the country is accurately calculated and compared. In addition, this study also analyzed the spatial correlation and spatial spillover effect of the MSW treatment carbon emission efficiency in different regional backgrounds through ESDA, and comprehensively analyzed the carbon emission efficiency of China’s MSW industry from the perspectives of time and space. The purpose of this paper is that the conclusions of this study can provide some references for the study of carbon emissions from MSW treatment, and provide some help for the development of MSW treatment plans in different regions of our country. We hope that we can make some contributions to our country’s carbon emission reduction goals in 2030.

2. Literature Review

At present, the main treatment methods of MSW in China include sanitary landfill, incineration power generation, aerobic composting, and anaerobic fermentation [17]. The quantity of GHGs, expressed in terms of CO2 equivalent (CO2e), are measured as they are emitted into the atmosphere by an MSW treatment system from within a specified boundary. The set of GHGs and boundaries are defined in accordance with the methodology adopted and the objective of carbon foot-printing. Bogner and Matthews [18] used the method recommended by the IPCC 2006 Guide to research CH4 emissions and the recycling situation in MSW landfills all over the world from 1980 to 1996 on an annual basis. The results showed that in the United States and some other developed countries, the recovery rate of CH4 is increasing year by year, and the emissions are reducing year by year. Studies have shown that landfills emit the most GHGs compared with composting and incineration technologies, suggesting that landfills should be reduced or combined with composting and incineration [19,20,21,22]; however, some scholars have reached opposite conclusions [23]. Friedrich and Trois [24] analyzed and compared the GHG emissions in three landfill scenarios by integrating transport, recovery, composting, and landfill gas recovery. Wang et al. [25] and Wang et al. [26], analyzed which of the two approaches, incineration combined with energy recovery or landfill combined with landfill gas utilization, is more effective under different climatic conditions in China for GHG emission reduction. The results showed that the former is more suitable in the north and the latter in the south, and the efficiency of energy recovery in China needs to be improved compared with that in Europe. Bi et al. [27] took Hong Kong as a case to study the carbon emissions of waste collection, transportation, and treatment from the perspective of logistics. They found that poor choice of facilities, disorganized travel chains, and severe underloading were responsible for poor waste management, and they developed a combined approach that not only improves the efficiency of waste collection and transport, but also helps to reduce waste and carbon emissions from the treatment process. Mariëlle et al. [28] used the simulation model to compare the energy savings and CO2 emissions under the two modes of MSW recycling and incineration. The results, referring to the MSW treatment in the Netherlands in 2008, showed that high-quality recycling can reduce 2.3 MtCO2 per year, while the incineration can only reduce 1/3 of the recycling, and reduces 0.7 MtCO2 per year. However, the economy and technology of the high-quality MSW recycling policy should be further evaluated. Razza et al. [29] used the LCA method to evaluate the treatment methods of tableware and bottles in MSW. The results showed that when using a composting method instead of landfill and incineration to treat such wastes, energy consumption decreased from 1490 kJ to 128 kJ, and GHG emissions decreased from 64 CO2-eq to 22 CO2-eq.
A measurement of MSW treatment carbon emission efficiency is the MSW industry input and output relationship, which is an important indicator to assess the level of the low carbon economic development of the MSW treatment industry, reflecting the extent and effectiveness of the MSW treatment industry in the implementation process, for both economic and environmental assessment values. The principle of carbon efficiency emphasizes the potential of carbon emission reduction, and a higher carbon efficiency means that less carbon emissions will be produced for the same economic output [30]. Therefore, in the study of MSW treatment carbon emission efficiency, better GDP output and less carbon emissions imply that there will be higher carbon emission efficiency of MSW treatment than when the same human, material, and financial resources are invested to treat MSW. Domestic and international studies on carbon emission efficiency mainly use data envelopment analysis (DEA) models, stochastic frontier models, TOPSIS, and CGE models. However, in terms of measurement indicators, carbon efficiency does not reflect the comprehensive performance of production factors by a single indicator [31]. To better deal with the multi-input multi-output problem, methods such as data envelopment analysis (DEA) and further evolution of super-efficiency slacks-based measure (SE-SBM) models are more widely used to assess carbon emission efficiency [32]. The International Energy Agency [33] uses DEA by sector to study the regional differences in carbon emission efficiency. Zhao et al. [34] proposed a stochastic radial DEA model extended to a non-radial approach to measure energy use and carbon dioxide emission efficiency by analyzing data from 2010. The results showed that CO2 emission efficiency has a significant effect in different regions. Ramanathan [35] used the DEA model to investigate the relationship between economic growth, energy consumption, and CO2 emissions from a global perspective to explore the factors affecting carbon emissions. Maradan and Vassiliev [36] investigated the cross-country differences in carbon emission reduction costs by distinguishing between developing and developed countries, using a DEA model.
DEA is one of the methods for efficiency measurement under the condition of multiple inputs and multiple outputs. Its advantage is that the optimal weight is only obtained from the actual input and output data of the decision-making unit, which has strong objectivity. However, the assumption of the DEA model is that the proportion of expected output increase and the non-expected output decrease is the same, which is not completely consistent with the actual production activities, due to the absence of slack variables, which will the cause overestimation of efficiency. The super-efficiency SBM-DEA model proposed by Tone [37] can correct such errors in efficiency evaluation and improve the accuracy of the efficiency measurement. The super-efficiency SBM-DEA model has been widely used in the service industry [38], green energy efficiency [39,40], and eco efficiency [41,42]; however, it is rarely used to study MSW treatment carbon emission efficiency and the spatial characteristics of MSW treatment carbon emission efficiency. According to Tobler’s First Law of Geography [43], all things are connected, and things that are closer are more closely connected. The spatial correlation characteristics of MSW treatment carbon emission efficiency cannot be effectively analyzed by traditional mathematical statistical methods. However, using the exploratory spatial data analysis method (ESDA), it is possible to scientifically identify the spatial characteristics of MSW treatment carbon emission efficiency, and to reveal the current status of its spatial distribution and spatial structure. In this study, the exploratory spatial data analysis, spatial autocorrelation model, and spatial Markov chain were used to analyze the spatial structure and spatial spillover effect of MSW treatment carbon emission efficiency.

3. Methods

3.1. Super-Efficiency SBM-DEA

This paper selects the super-efficiency SBM model to measure the carbon emission efficiency of China’s MSW. Using this method, one can consider the two dimensions of economy and environment at the same time, and incorporate multiple factors, such as carbon emissions, human resources, and capital, into the efficiency evaluation system, so as to obtain a more comprehensive efficiency measurement value. The super-efficiency SBM model is a non-radial DEA model proposed by Tone [37], which allows for the simultaneous analysis of carbon emission efficiency in the two dimensions of input and output. The radial DEA model does not contain slack variables, while the super-efficiency SBM model contains slack variables. In addition, the super-efficiency SBM model can be used to compensate for the inherent limitations of the radial measurement and can further evaluate multiple effective decision making units. Tone [44] proposed the non-expected super-efficiency SBM model, which considered the non-expected output for the first time and could better reflect the nature of the efficiency evaluation. Super-efficiency SBM-DEA has been verified by domestic and international studies to be an effective method for measuring MSW treatment carbon emission efficiency. In this paper, the non-oriented super-efficiency SBM model is used to measure the carbon emission efficiency of MSW treatment in 31 provinces of China. The formula under the unguided assumption is:
m i n ρ S E = 1 + 1 m i = 1 m S i / x i k 1 + 1 s 1 + s 2 r = 1 s 1 s r g / y r k g + r = 1 s 2 s t b / y r k b
s . t : j = 1 ,   j k n x i j λ j s i x i k ,   i = 1 , 2 , , m
j = 1 ,   j k n y r j λ j + s r + y r k ,   r = 1 , 2 , , s 1
j = 1 ,   j k n b t j λ j s t + b t k ,   t = 1 , 2 , , s 2
1 1 s 1 + s 2 r = 1 s 1 s r g / y r k g + r = 1 s 2 s t b / y r k b   >   0
λ ,   s ,   s + 0
In the formula, x i j , y r k represent input and output, respectively, λ is the index weight, and ρ S E represents the carbon emission efficiency value of DMU. It is worth emphasizing that the symbols that appear in all formulas are described in Table A1.

3.2. Spatial Autocorrelation Model

3.2.1. Global Spatial Autocorrelation

The global spatial autocorrelation describes the average degree of correlation of all spatial units with the surrounding area over the entire region, and it is tested with the global Moran index [45]. It is calculated as follows:
I = n i = 1 n j = 1 n ω i j y i y y j y i = 1 n j = 1 n ω i j y i y 2  
In the formula, n represents the number of spatial units in the region; ω i j represents the spatial weight; y i and y j represent the observed values of the i th and j th spatial units in the spatial region, respectively; and y represents the average value of the observations. Moran’s I value is from −1 to 1. In this paper, when Moran’s I is greater than 0 and significant, it means that there are clusters of provinces with high efficiency values and provinces with low efficiency values in space. When Moran’s I is less than 0 and significant, it indicates that the attribute values of provinces are negatively correlated in space, and provinces with larger (smaller) efficiency values are less likely to cluster together. When Moran’s I = 0, it means that the efficiency values of all provinces are randomly distributed and there is no spatial correlation.

3.2.2. Local Spatial Autocorrelation

Global spatial autocorrelation can help to avoid potential instability problems at different locations, to some extent. Local spatial autocorrelation can accurately reveal the spatial heterogeneity of spatial elements in the entire region, and can count the spatial agglomeration patterns at different locations. Equation (4) is the local Moran index formula:
I i = Z i S 2 j i n ω i j Z j
Z i = y i y ¯
Z j = y j y ¯
S 2 = 1 n y i y ¯ 2
ω i j is the spatial weight value, n is the total number of all regions in the study area, and I i is the local Moran index of the i th region. Local Moran index range is not limited to −1~1. In this paper, the local spatial autocorrelation method is used to show the influence of each province on the efficiency value of the surrounding provinces, and to show the clustering areas that exist in each province in China; there are four cases, namely high-high, high-low, low-high, and low-low. I i represents the impact of high/low carbon emission efficiency of MSW in province i on the high/low carbon emission efficiency of MSW in its surrounding areas. In this paper, local indicators of the spatial association (LISA) cluster map are used to present the local spatial correlation of MSW treatment carbon emission efficiency.

3.3. Spatial Markov Chain

Spatial Markov chain combines spatial lag and the traditional Markov method [46], which can effectively calculate the transition probability change of MSW treatment carbon emissions efficiency in different periods and different types (that is, from t period m type to the probability of type n in t + 1 period). The Markov method divides the carbon emission efficiency of MSW into k types, and is used to calculate the probability of converting from one type to another type; the spatial Markov method is to establish a k k transition probability matrix. This study uses the first-order Rook adjacency matrix as the spatial weight matrix. The element X m n in the matrix represents the probability of converting a province with efficiency type m to a province with efficiency type n in year t . The matrix element X m n can be calculated using the following equation estimate:
X m n = Y m n Y m
Y m n refers to the number of provinces of type m in year t converted to provinces of type n in year t + 1 , and Y m refers to the sum of the number of provinces of type m in all years. By comparing the transition probabilities, the upward or downward transition probability of MSW treatment carbon emissions efficiency under different geographical backgrounds will be discovered, and the influence of geographical background on provinces with different efficiency types can be clarified.

3.4. Spatial Error Model

This study considers that there may be spatial correlation between the MSW processing carbon emission efficiency between regions. Therefore, it is necessary to use spatial econometric methods to conduct empirical research to prevent traditional econometric models from ignoring the spatial spillover effect and resulting in biased empirical results. In addition to the explained variables, the spatial correlation may also come from explanatory variables and error terms. After the Wald and LR tests, this paper finally chooses to use the spatial error model. In this paper, the spatial error model is used to conduct a more accurate analysis of the influencing factors of carbon emission efficiency, fully considering the mutual influence between adjacent provinces. The spatial error model (SEM) is as follow:
Y = X β + ε ,   ε = λ W ε + μ ,   μ ~ N 0 ,   σ 2 I
In the formula, λ is the spatial error correlation coefficient, which measures the influence of the error impact of the adjacent individuals on the individual observations. The element W i j of the spatial matrix W describes the correlation between the error items of the j th section individual and the i th section individual.

4. Data Sources and Variables Selection

4.1. Input-Output Data

This study uses the super-efficiency SBM-DEA model to calculate the MSW treatment carbon emissions efficiently in 31 provinces of China from 2010 to 2019. The research on MSW treatment carbon emission efficiency aims at reducing the carbon emissions of MSW treatment, achieving sustainable development, and solving the problem of MSW treatment under the carbon neutral blueprint. On the basis of the comprehensive consideration of scientific, systematic, comparable, and operability selections, this paper refers to the selection of the carbon emission efficiency evaluation index based on existing research results, and finally constructs the efficiency evaluation index system. To ensure the reliability and scientificity of the conclusions of this study, all data are authoritative from the official government documents “China Urban-Rural Construction Statistical Yearbook” and “China Statistical Yearbook”. Input and output variables are shown in Table 1.
The efficiency evaluation index system constructed in this study consists of input variables, output variables, and external environmental variables. In the selection of specific indicators, this paper combines, from two aspects of economic and ecological benefits, the characteristics of MSW to consider, and selects three input variables: (1) Urban resident population [47,48]. In the traditional agricultural society, changes in population have a direct impact on environmental changes, because changes in population will directly lead to changes in MSW and GHG emissions. When human beings enter the industrialized society, population changes have an indirect and composite impact on the field of MSW through urbanization and industrialization. (2) Government green technology expenditure [49,50]. In recent years, green and sustainable development is an important issue in the construction and development of China’s MSW field. Green technology innovation, as a key measure to unlock the “economic and environmental” dilemma, has attracted increasing attention. The relationship between the development of green technology and the field of MSW has been fully confirmed by many scholars. The government’s green technology expenditure has become an important basis for evaluating the low carbon competitiveness of MSW in different provinces and cities in China. (3) MSW treatment capacity [51,52]. Under the same MSW disposal mode, the more MSW that is processed, the higher the GHG emissions. Two output indicators were selected: (1) GDP as expected output. GDP is the most common indicator in the development of MSW [47,53,54]. The lifestyle of high income and high consumption groups will produce more MSW. (2) MSW treatment carbon emissions, as the ultimate goal of this study, were set to be the unexpected output.

4.2. Influence Factors of MSW Treatment Carbon Emissions

Due to the differences in the level of economic development, technological innovation, and government intervention among provinces, the MSW treatment carbon emissions efficiency in the provinces considered was affected.
Economic development level [55,56,57]: Determined by selecting the added value of the tertiary industry to represent the economic development of China’s provinces. This is important because the prosperity and development level of the tertiary industry has become one of the main indicators to measure modern society’s economic development degree. MSW is mostly produced by some aspect of the industry that has a link to the development of the tertiary industry, but does not necessarily entirely belong to the tertiary industry. If properly used, it can not only help to improve the MSW treatment carbon emission efficiency, but can also feedback to the tertiary industry and bring more economic benefits. The United States, for example, has vigorously developed MSW recycling as the most promising tertiary industry. Therefore, the tertiary industry, as a major component of economic development in each province, has a significant impact on the MSW treatment carbon emission efficiency.
Level of science and technology [6,50]: Research and development (R&D) input represents the level of science and technology in various provinces and cities in China. R&D refers to the systematic and creative activities in a field of science and technology that aim to increase the total amount of knowledge and use this knowledge to create new applications, including basic research, applied research, and experimental development. Internationally, R&D investment indicators are usually used to reflect a country’s technological innovation strengths and core competitiveness. Technological progress has improved the MSW treatment carbon emission efficiency. Therefore, there is no doubt that in the field of MSW in this study, the input of R&D greatly affects the MSW treatment carbon emission efficiency.
Government intervention degree [58,59,60,61]: Government intervention degree refers to the government regulating the economic activities of the industry through various actions to regulate the MSW treatment carbon emissions, and can mainly be understood as economic intervention. Therefore, we chose the ratio of government expenditure to GDP to represent the degree of provincial government intervention in MSW treatment carbon emissions. In the rapid development of MSW, fiscal expenditure plays an irreplaceable central role. Through the proportion of government expenditure in GDP, we can measure the financial situation, financial structure, and China’s provinces’ level of attention to the MSW industry, which is beneficial to improve the regulation level of financial expenditure in the MSW industry. Therefore, this study selects the ratio of government expenditure to GDP to represent the government intervention degree in the MSW industry, which effectively helps us to study the MSW treatment carbon emission efficiency.

5. Results and Discussion

This paper studies the temporal and spatial evolution of China’s MSW treatment carbon emission efficiency, and discusses the research conclusions from four aspects. First, the text measures the carbon emission efficiency of China’s MSW, and discusses the temporal and spatial characteristics of the three major regions of China’s eastern, central, and western regions. Second, from an inter-provincial perspective, this paper explores the spatial characteristics of MSW treatment carbon emission efficiency, studies the degree of correlation between provinces, and highlights four types of clusters. Third, from the perspective of time, this paper obtains the probability of inter-provincial efficiency transition, both considering and not considering the background factor. Fourth, this paper considers the spatial correlation and analyzes the factors that affect the efficiency of MSW treatment carbon emission efficiency.

5.1. Preliminary Results on MSW Treatment Carbon Emission Efficiency

In this section, this paper uses the super-efficiency SBM model to measure China’s overall MSW carbon emission efficiency, and analyzes the five provinces with the highest and lowest efficiency. Subsequently, this paper divides China into three regions (east, middle, and west), discusses the spatial characteristics and temporal evolution of the different regions, and uses the coefficient of variation to measure the inter-provincial efficiency differences within the regions.

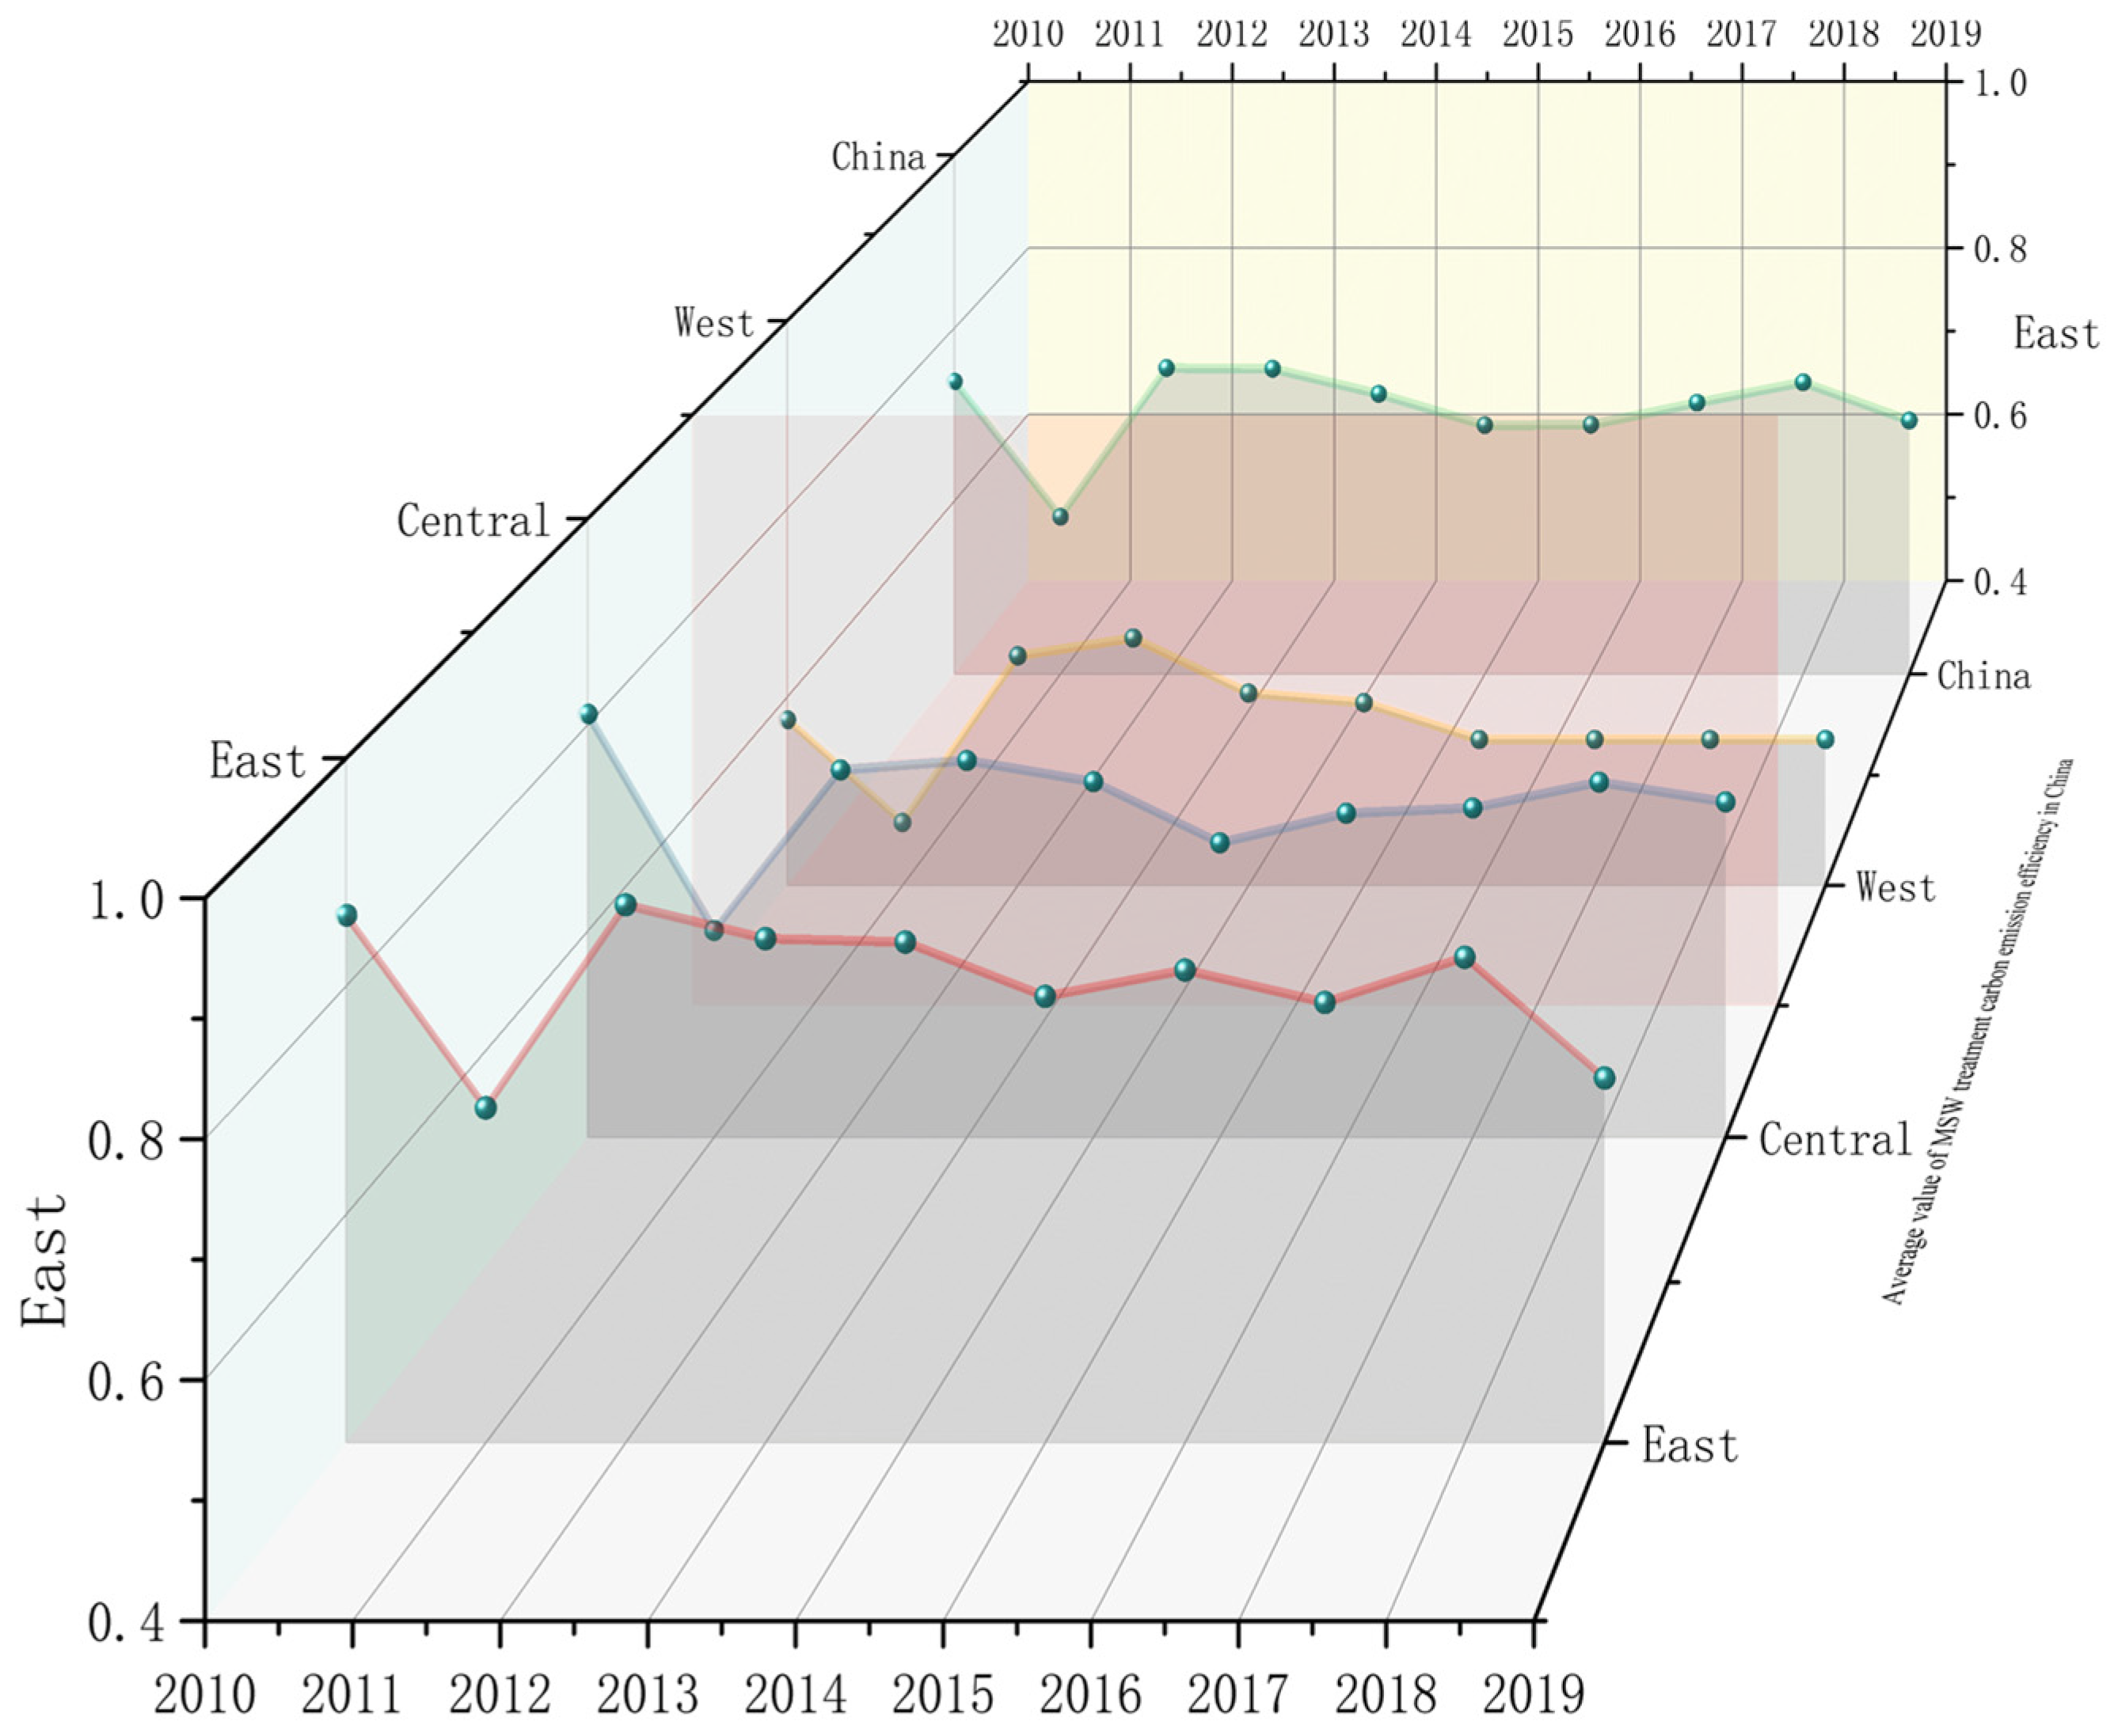
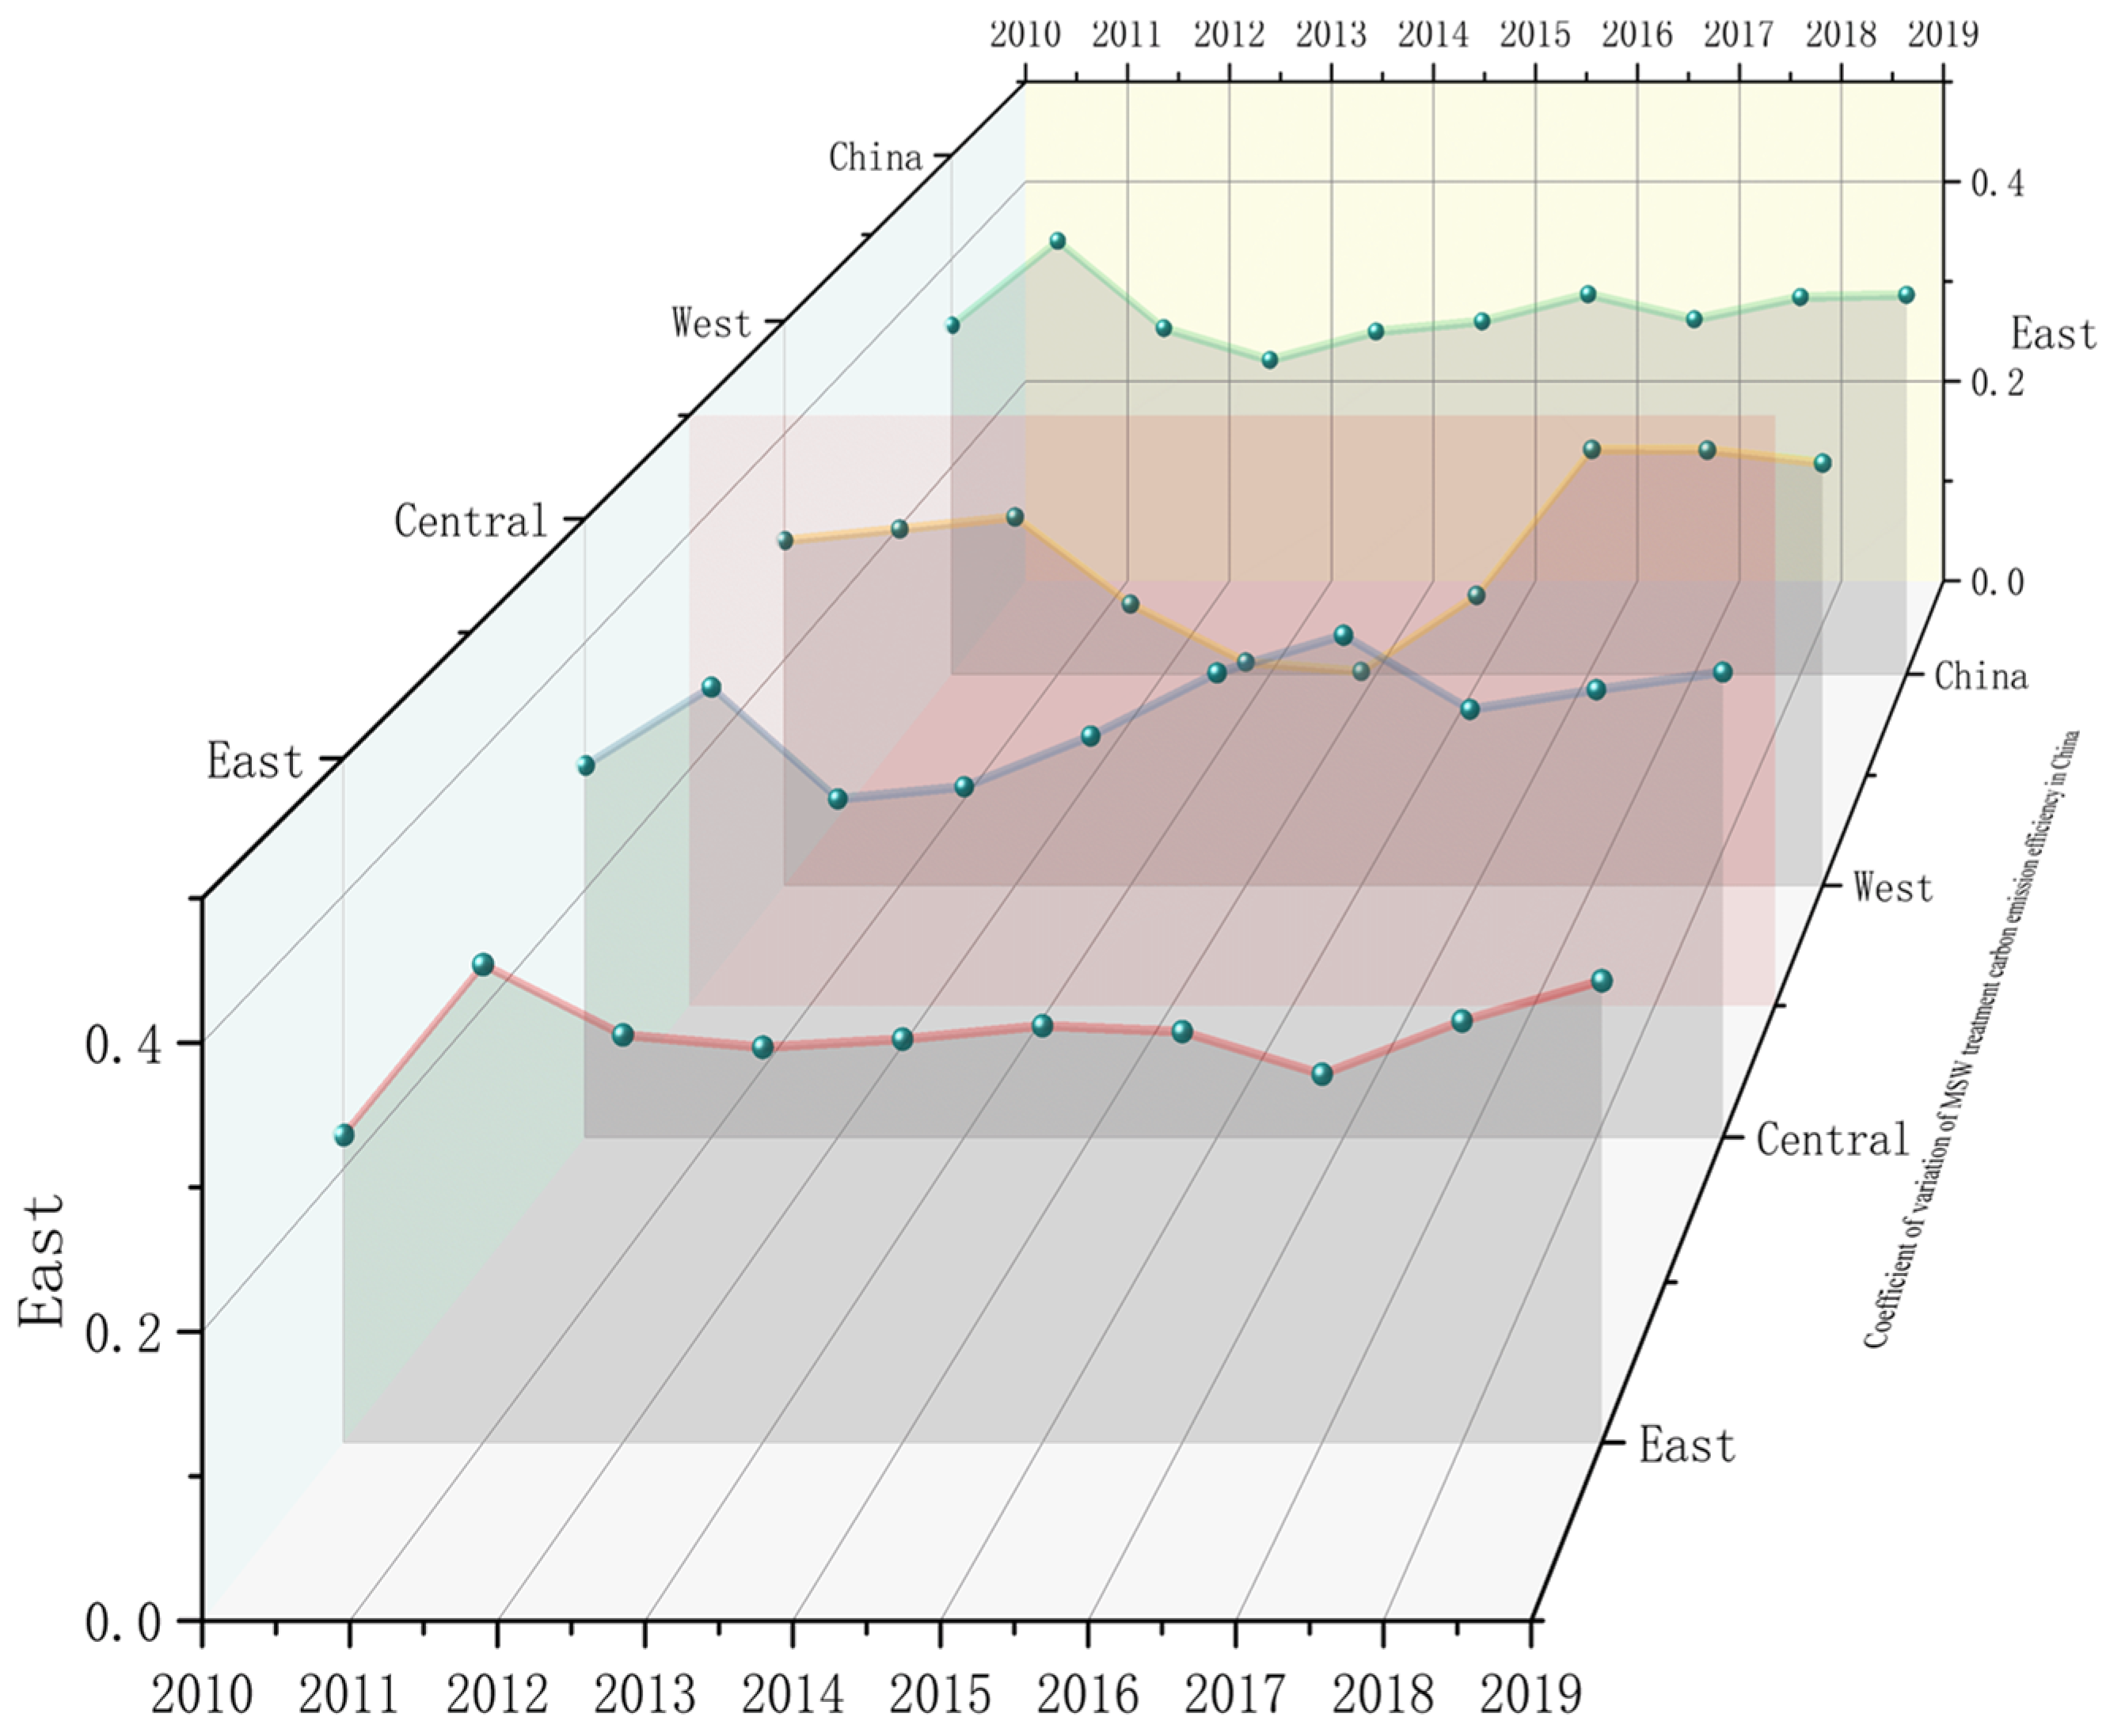
5.1.1. Interprovincial Difference Analysis of MSW Treatment Carbon Emission Efficiency

Based on the data of China’s MSW treatment carbon emissions from 2010 to 2019, this paper calculates the MSW treatment carbon emission efficiency in 31 provinces based on the super-efficiency SBM panel model. Because the MSW treatment data of the Tibet Autonomous Region from 2010 to 2015 are not disclosed, they cannot be calculated. The results of MSW treatment carbon emission efficiency are shown in Figure 1. The number in each square represents the carbon emission efficiency value of the province in that year, and the percentage in blue represents the level of the province’s efficiency value in that year. As Figure 1 shows, except for Shanghai and Jiangsu, the MSW treatment carbon emission efficiency in all provinces is lower than one. The average MSW treatment carbon emission efficiency in Tibet from 2016 to 2019 is 0.2731, which is at a very low level. This means that the MSW treatment carbon emission efficiency in most provinces of China has not been optimized and needs further improvement.
From 2010 to 2019, the MSW treatment carbon emission efficiency in different provinces showed different trends. Shanghai, Jiangsu, Fujian, Beijing, and Zhejiang were the top five provinces in the value of MSW treatment carbon emission efficiency. The high carbon emission efficiency of these provinces may benefit from the two dimensions of policy and economy. On the one hand, the MSW treatment policies of these five provinces are complete, and they have detailed requirements for MSW treatment methods and GHG emission standards. For example, Zhejiang Province and Jiangsu Province have introduced “Zhejiang MSW Management Regulations” and “Jiangsu MSW Management Regulations”, respectively, which formally incorporate MSW treatment into the legal framework, and clearly require the acceleration of the use of incineration, composting, and other resource treatment methods to replace landfill, reducing the huge carbon emissions generated by the landfill treatment of MSW, thereby improving the MSW treatment carbon emissions efficiency in China. On the other hand, most of these provinces are located on the eastern coast, with a superior geographical location, high levels of openness, and a strong economic level. The government has adequate financial support and promotes the implementation of MSW treatment and carbon reduction policies. For example, in 2017 and 2018, only Xicheng, Chaoyang, and Fengtai districts in Beijing invested CNY 2.343 billion in MSW carbon reduction treatment. In 2010, the Shanghai government invested CNY 14.7 billion to establish the largest old port MSW incineration plant in China, which laid a solid material foundation for the carbon reduction practice of MSW treatment in Shanghai. The government’s capital investment to achieve the stable development of the MSW treatment industry can introduce advanced MSW treatment technology and reduce carbon emissions per unit of MSW treatment, thereby improving the MSW treatment carbon emissions efficiency.
Jilin, Hainan, Heilongjiang, Ningxia, and Qinghai are the five provinces with the lowest MSW treatment carbon emission efficiency. The low efficiency of these five provinces may be due to two reasons. Firstly, the construction of MSW treatment facilities in these provinces is unadvanced, and the capacity of carbon reduction treatment is weak. For example, only seven cities in the Jilin Province have established MSW incineration plants, and the MSW treated by incineration is as low as 24.3%. In 2019, nearly 20% of the MSW did not undergo harmless treatment, which seriously restricted the goal of carbon reduction in MSW treatment, resulting in high MSW treatment carbon emissions, and thus becoming an important reason for the low MSW treatment carbon emissions efficiency. Secondly, the government’s investment in carbon reduction in MSW treatment has been wasted, and a large number of harmless waste treatment projects have been left unfinished. For example, in 2008, the central government offered CNY 1.64 billion to help Heilongjiang Province build 102 harmless waste treatment projects, aiming to introduce advanced MSW treatment technologies to reduce carbon emissions in the treatment process. However, by 2016, 34 projects had not been completed and 21 projects had not been put into operation. This greatly slows down the process of MSW carbon reduction and means that government funding is no longer expected to reduce carbon emissions, thus reducing the MSW treatment efficiency. Finally, these provinces lack the guidance of an MSW treatment system, and MSW violations occur frequently. For example, some areas in Qinghai and Ningxia still use in situ landfill and in situ incineration to treat MSW. This backward treatment will produce a large number of GHG and reduce the MSW treatment carbon emissions efficiency. In addition, the lack of MSW treatment system and the lack of regulation will further promote the generation of the illegal treatment of MSW, forming a vicious cycle of more MSW treatment and lower MSW treatment carbon emission efficiency.

5.1.2. Analysis of Regional Differences in Carbon Emission Efficiency

According to the Chinese government’s geographical division rules, this paper divides China into three regions—eastern, western, and central—to compare the efficiency of MSW between different regions. The eastern region includes 11 provinces, including Beijing, Shanghai, and Tianjin. The western region includes 12 provinces, including Chongqing, Xinjiang, and Inner Mongolia. The central part includes eight provinces, including Heilongjiang, Jilin, and Hunan. The average efficiency of the eastern region is significantly higher than that of the central and western regions, which is due to the MSW harmless disposal construction and the implementation of carbon reduction. The eastern region is often used as a choice for pilot cities, who can first understand and realize the national policy orientation of MSW disposal and carbon reduction. With the support of national finance, technology, and policy, the eastern region government vigorously promotes the reform of the MSW treatment industry, comprehensively carries out carbon reduction activities, and establishes a complete set of low carbon treatment systems for MSW, so the MSW treatment carbon emission efficiency is higher.
Figure 2 depicts the future development trend of MSW treatment carbon emission efficiency in eastern, central, and western China. Overall, during 2010–2019, the average MSW treatment carbon emission efficiency in China increased first and then decreased, generally showing an inverted U-shaped, which is inconsistent with the typical EKC, and may be closely related to the change of the actual situation of MSW treatment in China. During the 12th Five-Year Plan period, the central government deepened the reform of MSW treatment methods, required the full implementation of incineration and other methods for the reduction of MSW treatment carbon emissions, such as incineration, and promulgated a series of policies, such as the “12th Five-Year Plan for the Construction of National Urban MSW Innocuous Treatment Facilities” to provide protection for them, so that the MSW treatment carbon emission efficiency in China increased from 2010 to 2014. However, since the 13th Five-Year Plan, the central government has shifted its focus and reduced its attention on MSW treatment, and the optimization of carbon reduction methods for MSW treatment has slowed down. The improvement of China’s carbon reduction capacity cannot offset the negative impact of the sharp increase in MSW production, so the MSW treatment carbon emission efficiency shows a downward trend.
From the perspective of the change trend, the MSW treatment carbon emission efficiency in the western region is the only region with growth. The average MSW treatment carbon emission efficiency increased from 0.3840 in 2010 to 0.4324 in 2019 (an increase of 12.60%), while the MSW treatment carbon emission efficiency in the eastern and central regions showed a fluctuating downward trend, and the decline in the eastern region was more obvious. The growth of the western region may benefit from the country’s attention to the western region, giving more financial and technical support under the policy guidance of the western development; the western region also recognizes its shortcomings and promulgates a series of policies on MSW treatment and carbon reduction to respond to the national orientation. For example, Ningxia promulgated the “Thirteenth Five-Year Plan for the Implementation of Greenhouse Gas Emission Control in Ningxia Hui Autonomous Region”, advocating for low carbon packaging, and reducing the carbon emissions generated by MSW treatment from the source. Therefore, it is brave to make counter current progress within the context of the overall downward trend of national efficiency. In the future, the western region cannot be careless and should continue to maintain the trend of progress, while the eastern and central regions cannot relax their requirements for MSW treatment and carbon reduction. It is necessary to find new impetus for efficiency improvement by strengthening control and enacting policies, to curb the downward trend in time.
Figure 3 shows the variation coefficient of MSW treatment carbon emission efficiency in three regions and the whole of China. The variation coefficient is the ratio of standard deviation to the average value of MSW treatment carbon emission efficiency, which is used to measure the statistical deviation and spatial difference of the inter-provincial efficiency value. From 2010 to 2019, the spatial difference of MSW treatment carbon emission efficiency in China fluctuated and was at a high level. In terms of the differences within the three regions, different characteristics were observed, and the spatial difference of MSW treatment carbon emission efficiency in the eastern region increased slowly. The central region showed a “U” trend (first convergence and then diffusion) in 2010–2015 and 2015–2019, respectively, and reached the peak in 2019. The difference in the western region was small and low in 2010–2016, with a large fluctuation in 2016–2018, reaching its peak in 2017 and basically returning to its initial state in 2019. In general, the variation coefficient of the three regions has a rising trend, indicating that with the passage of time, the difference of MSW carbon emission efficiency in various provinces is gradually widening.

5.2. Spatial Correlation Analysis of MSW Treatment Carbon Emission Efficiency

In this section, this paper uses the global spatial autocorrelation model to judge the correlation of the efficiency of MSW treatment carbon emission efficiency in our country’s provinces. At the same time, according to the local autocorrelation model, the distribution of different efficiency clusters in China is found, and the clusters at different time nodes are compared to discover the evolution trend of China’s efficiency clusters.

5.2.1. Global Spatial Autocorrelation

According to Tobler’s First Law of Geography, the spatial distance affects the correlation between object attribute values. Closer spatial distance means a stronger correlation between object attribute values (i.e., stronger spatial dependence). In this study, according to the 0–1 spatial weight matrix adjacent to the provinces, the Moran index of the MSW treatment carbon emission efficiency in 31 provinces of China from 2010 to 2019 can be found. As shown in Table 2, the global Moran index of all the years exceeded 0, and passed the 1% significance level test. These results show that the MSW treatment carbon emission efficiency has a positive spatial correlation, and there are obvious high-high or low-low agglomeration areas. The results obtained in this paper are consistent with the study of Tian et al. [62] There is also a significant spatial correlation in China’s overall carbon efficiency, and this trend continues to increase over time.

5.2.2. Local Spatial Autocorrelation

The global Moran index shows the overall spatial correlation characteristics of MSW treatment carbon emission efficiency, but it ignores the spatial correlation model of some regions. Therefore, in this study, the LISA clustering map was used to determine the aggregation points of high-high, low-low, high-low, and low-high MSW treatment carbon emission efficiency. Figure 4 shows the clustering maps of MSW treatment carbon emission efficiency in China in 2010, 2015, and 2019.
In 2010, high-high concentration areas were distributed in Shandong, Jiangsu, Anhui, Zhejiang, and Shanghai (East China), and low-low concentration areas included Inner Mongolia, Gansu, and Shaanxi (Northwest China); in 2015, Shandong was removed from the high-high concentration area, reducing it to just four provinces, while the low-low concentration area further expanded, gaining Jilin Province; by 2019, the high-high concentration area included four provinces, with Anhui being replaced by Shandong, and the low-low concentration area further expanded, including the entire northwest and parts of the northeast and southwest. Overall, the spatial differentiation of MSW treatment carbon emission efficiency in China is obvious, showing a spatial differentiation pattern of “high in the south and low in the north” and “high in the east and low in the west”. The distribution of high-high concentration areas is relatively stable, and the low-low concentration areas continue to spread.

5.3. Spatial Spillover Effect of MSW Treatment Carbon Emission Efficiency

In this section, the Markov matrix and the spatial Markov matrix are used to study the change of transition probability of MSW treatment carbon emission efficiency in different periods and types. At the same time, by comparing the transition probabilities, we can discover the change law of MSW treatment carbon emission efficiency within the context of different geographical backgrounds, and clarify the influence of the geographical background on provinces with different efficiency types.

5.3.1. Markov Matrix

The spatial pattern analysis shows that the MSW treatment carbon emission efficiency in China has obvious global and regional spatial agglomeration. In this paper, the Markov and the spatial Markov transition matrix are used to determine the spillover effect of MSW treatment carbon emission efficiency in China. According to the level of MSW treatment carbon emission efficiency, 30 selected provinces are divided into four categories (because the efficiency deviation in Tibet from 2010 to 2015 will lead to the distortion of the probability of conversion from a high level to a low level, it is eliminated): low level (<25%), medium and low level (25–50%), medium and high level (50–75%), and high level (>75%).
Figure 5 shows the traditional Markov transition matrix; the diagonal elements represent the probability that the regional MSW treatment carbon emission efficiency remains unchanged, rather than the diagonal elements representing the probability that the regional carbon emission efficiency changes. As shown in Figure 5, from 2010 to 2019, the probabilities of high-level and low-level provinces maintaining the original level of MSW treatment carbon emission efficiency are 0.8382 and 0.8261, respectively, indicating that the levels of MSW treatment carbon emission efficiency in each province are consistent, and the transition probability of the efficiency level is low. Yca B et al.’s research on China’s water efficiency reached a similar conclusion [63]. Most provinces with high efficiency levels and provinces with low efficiency levels were able to maintain stability, and the probability of downward and upward jumps was small. Compared with the above provinces, the stability of the provinces with a medium MSW treatment efficiency level is relatively low, and their efficiency level is more likely to change compared with the provinces with high and low efficiency (the probability of the medium efficiency level remaining unchanged is 0.6515 and 0.6866, which is less than the probability of maintaining a high or low level). In addition, the change of MSW treatment carbon emission efficiency mostly occurs between two adjacent efficiency levels, and the probability of a jump transition (e.g., from a low level to a high level) is relatively small. Overall, the MSW treatment carbon emission efficiency in China has strong stability in a certain range, and the change probability is small.

5.3.2. Spatial Markov Matrix

The spatial Markov matrix of MSW treatment carbon emission efficiency in China is shown in Figure 6. If the regional background does not affect the efficiency transformation, the probability of efficiency transformation in Figure 6 should be the same as that in Figure 5. However, the comparison between Figure 5 and Figure 6 shows that the influence of the regional background in different provinces on the MSW treatment carbon emission efficiency is different. Therefore, it is necessary to comprehensively analyze the transfer matrix, considering the regional background. The conclusions are as follows:
(1)
The transfer of MSW treatment carbon emission efficiency types is not geographically isolated but is largely related to the surrounding economic environment. On the one hand, for the provinces in the middle and high levels, the better the regional background, the greater the probability of upward transfer (for example, for the provinces in the middle and high levels, the probability of upward transfer is 0, 0.0500, 0.1111, and 0.2778, respectively, when the regional background gradually improves); on the other hand, for provinces in the low and medium levels, the influence of the regional background on the probability change is not the same (for example, for provinces in low levels, the probability of efficiency increase is 0.1538, 0.222, 0.1, and 0, respectively, when the regional background gradually improves). This result shows that the background conditions of adjacent regions play a very important role in the change process of MSW treatment carbon emission efficiency in provinces and affect the spatial spillover effect of MSW treatment carbon emission efficiency in China through different ways and with different intensities.
(2)
In any regional background, a province has the highest probability of maintaining low or high MSW treatment carbon emission efficiency, and usually has stronger efficiency stability than the provinces with medium-low and medium-high types (for example, in the high level regional background, the probability of maintaining low or high is 1 and 0.9020, respectively, and the probability of maintaining medium or high is only 0.55). This shows that the regional differences in MSW treatment carbon emission efficiency in China’s provinces are relatively stable, and the differences will persist for a long time.
(3)
The provinces with medium-low or medium-high MSW treatment carbon emission efficiency are relatively active, which means that they are more likely to experience the transformation of their efficiency level than other provinces. Generally, there is a high type conversion probability between the MSW treatment carbon emission efficiency levels of the two adjacent types, and there is a low type conversion probability between the efficiency levels with large differences. However, it can be seen from the probability, which is far away from the matrix diagonal, and which is close to zero, that regardless of the regional background, the probability of the continuous transition across multiple levels in a short time is very low.

5.4. Analysis of Influencing Factors on MSW Treatment Carbon Emission Efficiency

The spatial effect test results based on the residuals of the ordinary OLS estimation results (Table 3) show that the statistics of the spatial lag model (SLM) and the spatial error model (SEM) significantly reject the null hypothesis of “no spatial lag” at the 1% level, which confirms the rationality of using a spatial economic model. The robust LM-lag has not passed the significance level test, which means that the spatial error model (SEM) is a better model. The Wald test and the LR test also proved that the spatial error model is suitable.
This paper selects the influencing factors from the perspectives of economy, environment, government, science, technology, etc. However, due to the strong multicollinearity between the explanatory variables, after the variable selection, the economic development level, economic technology level, and government intervention were the final explanatory variables for the efficiency in dealing with MSW carbon emissions. Table 4 shows the regression results of the above factors. The spatial autocorrelation coefficient λ is 0.2082, which is remarkable at the 0.01 level, indicating that there are still some unmeasured factors in addition to the influencing factors selected in this paper, resulting in the spatial dependence of MSW treatment carbon emission efficiency in China. Each influencing factor is described as follows:
(1)
The coefficient of economic development level is positive, passing the 5% significance test. The results show that the added value of the tertiary industry is positively correlated with the MSW treatment carbon emission efficiency. The better the development of the tertiary industry, the higher the MSW treatment carbon emission efficiency. This result can be explained from both government and business perspectives. On the one hand, the governments in the developed regions of the tertiary industry have more financial income and less economic pressure, so they will focus more on sustainable development, have the confidence to promulgate stronger policies and strictly supervise their implementation, and will take the MSW treatment carbon emission as the focus of urban development, thereby improving the efficiency level. On the other hand, the tertiary industry developed areas have a high level of consumption and a large amount of MSW. There will be a huge profit space in the MSW treatment industry, which is expected to become a “blue ocean area”. Under the call of the government and the guidance of the market, the MSW treatment industry has formed a good market atmosphere, attracting the inflow of talent, technology, and social funding, helping the MSW treatment industry to reach a new height in the cause of carbon emission reduction, and thus improving the MSW treatment carbon emission efficiency.
(2)
The coefficient of scientific and technological level is positive, and passed the 5% significant indigenous test, which shows that government R&D investment is positively correlated with the MSW treatment carbon emission efficiency. Good fiscal expenditure is a necessary condition for the development of the industry. On the one hand, the higher government expenditure on science and technology will help to realize more accurate support for the key technologies and core areas of MSW treatment, as well as the creation of a good academic ecology and innovation environment, and more scientific research institutions and high-quality talents, who will be attracted to the work of MSW treatment and carbonization reduction. The results obtained are consistent with the findings of Lybecker et al. [50], who found that government support for innovative technologies motivates researchers to develop clean technologies and enables wider dissemination of technologies and innovations in the country. Researchers are looking forward to the prospect of carbon reduction in MSW treatment, and are constantly creating new values for reducing carbon emissions in the process of MSW treatment, and improving the efficiency of carbon emissions in MSW treatment. On the other hand, science and technology expenditure can promote the improvement of technology, changing the nature of domestic garbage and garbage treatment. R&D can promote the production of new materials such as degradable plastics, and the carbon emissions generated by processing new materials will be significantly reduced. In addition, the increase in science and technology expenditure will promote the implementation of resource utilization methods such as composting, which will reduce carbon emissions in the treatment process, and improve the carbon emission efficiency of MSW treatment.
(3)
The coefficient of government intervention is negative, and the 1% test shows that the ratio of government expenditure to GDP is negatively correlated with the MSW treatment carbon emission efficiency, which may be due to two reasons. From the perspective of the government, many developing countries, led by China, have relatively unadvanced carbon reduction methods for MSW treatment. People have not formed the concept of “zero carbon emission” in ideology, so most of the methods adopted by the national government are mandatory. In particular, the government always puts forward mandatory requirements for residents with mandatory expenditure. For example, investment in 4 + n classification of MSW bins nationwide, in order to force residents to perform MSW classification. Too much government intervention will lead to the residents’ rebellious psychology, hurt the rights and interests of policy subjects to some extent, and promote an effect which is not good. From the business perspective, the high proportion of government expenditure to GDP will increase the operating pressure of MSW treatment enterprises, and even cause excessive implementation of policies by enterprises, reduce the enthusiasm of social capital entry, destroy the sustainability of MSW treatment, and thus reduce the MSW treatment carbon emission efficiency.

6. Extended Discussion with Current Studies in Related Fields

To increase the scientific significance of the study, we extended our discussion of the above findings with other current studies dealing with the topic of MSW and CO2 emissions. Through the calculation of the spatial autocorrelation model and the Moran Index, this paper finds that there is agglomeration in the MSW treatment carbon emission efficiency of various provinces in China, and the reasons for the agglomeration are consistent with the research conclusions of Li and Cheng [64]. Li and Cheng hope to find a way to improve the carbon emission efficiency of cities. Their research found that the convenience of transportation can have a positive impact on the carbon emission efficiency of a region, and this positive impact is more obvious for large cities and their surrounding cities. Taking the Yangtze River Delta region as an example, as one of the earliest and fastest regions for high-speed rail construction in China, the number of high-speed rail trips between Nanjing and Shanghai has reached 230 times a day, and the relationship between cities is particularly close. Convenient transportation helps cities in the Yangtze River Delta region to communicate with each other, owing to their economy, talent, and technology. The conclusion also indirectly verifies the calculation results of this paper. The convenient transportation realizes the environmental scale effect between the solid waste fields, and then the phenomenon of high-efficiency aggregation occurs. Moreover, most of the low and middle agglomeration areas in this paper are in remote areas in the north and west, and underdeveloped transportation may be one of the reasons for this phenomenon. Previous studies have provided more explanations and possibilities for the conclusion of this paper, and more effective solutions to improve the MSW treatment carbon emission efficiency.
Kosajan et al. [65] started from the perspective of MSW treatment with carbon emission reduction. They calculated the effect of different processes on reducing carbon emissions by comparing different MSW treatment technologies. By comparing the conclusions of the two papers, it is found that the high carbon emission efficiency in the MSW treatment of certain provinces, calculated by the super-efficient SBM-DEA model, is not only due to their complete relevant policies and rapid economic development, but also due to their high level of CKC (co-processing in cement kiln) technology development [65,66]. The inspiration to this paper of the past successful cases is to pay full attention to the technology and processes of MSW treatment, vigorously promote the treatment methods with good carbon reduction benefits such as CKC, and replace the treatment methods with large carbon emissions such as landfills. In future research, we will pay more attention to the above research hotspots.
Wang et al. [67] summarized the characteristics of China’s carbon emission market in their research, and the research conclusions have many similarities with the conclusions obtained in this paper through local spatial autocorrelation and the Markov model operation. First of all, there are great differences between different carbon emission markets in China, with high efficiency markets and low efficiency markets. The same problem is faced in the field of MSW in China. From the coefficient of variation of efficiency, it can be seen that the level of intra-regional differences in various regions of China is gradually increasing, and there is a great gap in the MSW treatment with carbon emission between regions. Whether it is the carbon emission market or the field of MSW, most of the agglomeration areas with high carbon emission efficiency overlap in the eastern provinces with rapid economic development. Second, Wang et al. [67] believe that the spillover effect between different carbon markets is unstable, and the exchange volume between them is small. We also found through Markov’s test that the MSW treatment with carbon emissions of each province in China has the highest probability of remaining unchanged in the future, indicating that high-concentration areas have limited driving help for other regions and that there is still the problem of an efficiency gap. When this article discusses how to bridge the gap between the various clusters, the suggestions of Wang et al. provide us with a reference: High-efficiency gathering areas can participate in MSW treatment in other regions through cooperation, investment, etc., establish an integrated MSW treatment information platform, and share the latest MSW treatment technology, management experience, and carbon reduction methods with surrounding areas in a timely manner. The more convenient the information transfer, the stronger the effectiveness of carbon reduction technology and experience sharing, and the easier it is to fluctuate and spill over with other agglomeration areas, thereby driving efficiency improvements.
To summarize, the research results of this paper have something in common with previous research in related fields. By comparing and learning from previous successful research cases, it provides valuable reference information for the calculation results and research conclusions of this paper. At the same time, an extended discussion with other current studies dealing with the topic of MSW and CO2 emissions will increase the scientific significance of the study and will affect its accessibility to a broader audience.

7. Conclusions

The conclusions of this study are as follows: (1) From 2010 to 2019, the MSW treatment carbon emission efficiency in most provinces of China was at a low level. From the perspective of the change trend, the overall average MSW treatment carbon emission efficiency in China shows a fluctuating downward trend, and the central and eastern regions have different degrees of downward trends, and the western region is the only region to realize the gradual increase in carbon emission efficiency. (2) The spatial differentiation of MSW treatment carbon emission efficiency in China is obvious, and the overall pattern is “high in the south and low in the north” and “high in the east and low in the west”. The high-high concentration areas are mainly concentrated in the eastern coastal areas, and the low-low concentration areas are mainly distributed in the northern areas, and gradually spread to the northwest. (3) The probability of keeping the efficiency level of MSW treatment in China unchanged is the highest. The MSW treatment carbon emission efficiency in China has a great relationship with the surrounding economic environment, which is affected by different ways and intensities of background conditions in adjacent regions. (4) The level of economic development and technological innovation has promoted the improvement of MSW treatment carbon emission efficiency, while the degree of government intervention has inhibited the MSW treatment carbon emission efficiency.
The research conclusions of this paper expand the boundaries of domestic research on MSW carbon emissions. At the same time, it is helpful for the construction of my country’s MSW management system, and provides a basis for the formulation of MSW treatment plans in different regions of our country. However, due to the limited research time, conditions, and resources, this paper still has some limitations. On the one hand, although the model-based research method has good scientificity and stability, the model is a simulation of the actual prototype, not the prototype itself, and the research accuracy is still affected by the data sample size, accuracy, and model design. The calculation results have errors within a certain range. On the other hand, this paper selected the data of 31 provinces from 2010 to 2019, which limited the sample range to some extent. The number, timeliness, and richness of the cases still need to be improved, so more verification is needed in the promotion of the conclusions. Local governments should formulate MSW treatment policy according to local conditions. In future research, we will further expand the scope of the sample data, hoping to evaluate the national MSW treatment carbon emission efficiency in real time. In the future, we will be committed to research on the MSW treatment carbon emission efficiency in more developing countries, and we will help developing countries to improve their overall system of MSW management.

Author Contributions

Conceptualization, X.C. and Y.J.; methodology, X.W. (Xuan Wang) and X.C.; software, X.W. (Xuan Wang); formal analysis, X.C.; investigation, X.C.; resources, Y.J.; data curation, X.C. and X.W. (Xuan Wang); writing—original draft preparation, X.C. and X.W. (Xiankun Wang); writing—review and editing, X.S.; supervision, Y.J. and X.S.; funding acquisition, Y.J. and X.S. All authors have read and agreed to the published version of the manuscript.

Funding

This research was funded by the National Key Research and Development Program of China (2020YFD1100104), the Major Project of Philosophy and Social Sciences Research, Ministry of Education (grant number 17JZD026) and the Natural Science Foundation of China (No. 72004130).

Institutional Review Board Statement

Not applicable.

Informed Consent Statement

Informed consent was obtained from all subjects involved in the study.

Data Availability Statement

Not applicable.

Conflicts of Interest

The authors declare that they have no known competing financial interests or personal relationships that could have appeared to influence the work reported in this paper.

Appendix A

Table A1. Different notations and their descriptions.
SectionNotationsDescriptions
3.1 ρ S E MSW carbon emission efficiency value
m Number of input variables
s 1 Number of expected outputs
s 2 Number of unexpected outputs
S i Input redundancy
S r + Shortfall in expected output
S t + Redundancy of undesired output
S r g Shortfall in expected output
S t b Redundancy of undesired output
x i k Input value of the k th DMU
y r k Expected output value of the k th decision variable
b t k Unexpected output value of the k th decision variable
y r k g Expected output value of the k th decision variable
y r k b Unexpected output value of the k th decision variable
λ Weight of DMU
3.2 I Moran index
ω i j Spatial weight
y i Observation value of the i th space unit
y j Observation value of the j th space unit
y Observed average
S 2 Variance
n Total number of study areas
3.3 X m n Transition probability value
Y m n M-type area in year t converted to n -type areas in t + 1 year
Y m Total number of areas of type M
3.4 Y Dependent variable (efficiency value)
X Independent variable (influencing factor)
β Variable coefficient
λ Spatial error correlation coefficient
W ε Spatial matrix

References

  1. Buse, K.; Tomson, G.; Kuruvilla, S.; Mahmood, J.; Alden, A.; Meulen, M.V.D.; Ottersen, O.P.; Haines, A. Tackling the politics of intersectoral action for the health of people and planet. BMJ 2022, 376. [Google Scholar] [CrossRef]
  2. Olivier, J.G.J.; Janssens-Maenhout, G.; Muntean, M.; Peters, J.A.H.W. Trends in Global CO2 Emissions: 2013 Report; PBL Netherlands Enviornmental Assessment Agency: Hague, The Netherlands, 2013; Available online: https://www.researchgate.net/publication/277507390_Trends_in_Global_CO2_Emissions_2013_Report (accessed on 29 April 2022).
  3. Guan, D.B.; Hubacek, K.; Weber, C.L.; Peters, G.P.; Reiner, D. The drivers of Chinese CO2 emissions from 1980 to 2030. Global Environmental Change: Human and Policy Dimensions. Glob. Environ. Chang. 2008, 18, 626–634. [Google Scholar] [CrossRef] [Green Version]
  4. Xu, X.B.; Tan, Y.; Chen, S.; Yang, G.S.; Su, W.Z. Urban Household Carbon Emission and Contributing Factors in the Yangtze River Delta, China. PLoS ONE 2015, 10, e0121604. [Google Scholar] [CrossRef] [PubMed] [Green Version]
  5. Miranda-Da-Cruz, S.M. A model approach for analysing trends in energy supply and demand at country level: Case study of industrial development in China. Energy Econ. 2007, 29, 913–933. [Google Scholar] [CrossRef]
  6. Chen, S. The Abatement of Carbon Dioxide Intensity in China: Factors Decomposition and Policy Implications. World Econ. 2011, 34, 1148–1167. [Google Scholar] [CrossRef]
  7. Wang, X.J.; Chen, Y.S. Discuss the Applications of the Automotive Lightweight Materials in China Briefly. Adv. Mater. Res. 2012, 621, 148–152. [Google Scholar] [CrossRef]
  8. Dong, J.; Xue, G.; Dong, M.; Xu, X.L. Energy-saving power generation dispatching in China: Regulations, pilot projects and policy recommendations—A review. Renew. Sustain. Energy Rev. 2015, 43, 1285–1300. [Google Scholar] [CrossRef]
  9. The White House. U.S.-China Joint Announcement on Climate Change. 2014. Available online: http://www.whitehouse.gov/the-press-office/2014/11/11/us-china-joint-announcement-climate-change (accessed on 10 December 2014).
  10. Feng, Z.H.; Zou, L.L.; Wei, Y.M. The impact of household consumption on energy use and CO2 emissions in China. Energy 2011, 36, 656–670. [Google Scholar] [CrossRef]
  11. Kurniawan, T.A.; Liang, X.; Goh, H.; Othman, M.H.D.; Avtar, R.; Kusworo, R.; Li, M.S. Transformation of Solid Waste Management in China: Moving towards Sustainability through Digitalization-Based Circular Economy. Sustainability 2022, 4, 2374. [Google Scholar] [CrossRef]
  12. Bogner, J.P.; Pipatti, R.; Hashimoto, S.; Diaz, C.; Mareckova, K.; Diaz, L.; Kjeldsen, P.; Monni, S.; Faaij, A.; Gao, Q. Mitigation of global greenhouse gas emissions from waste: Conclusions and strategies from the Intergovernmental Panel on Climate Change Fourth Assessment Report. Working Group III (Mitigation). Waste Manag. Res. 2008, 26, 11–32. [Google Scholar] [CrossRef]
  13. Ghafourian, K.; Kabirifar, K.; Mahdiyar, A.; Yazdani, M.; Ismail, S.; Tam, V.W.Y. A Synthesis of Express Analytic Hierarchy Process (EAHP) and Partial Least Squares-Structural Equations Modeling (PLS-SEM) for Sustainable Construction and Demolition Waste Management Assessment: The Case of Malaysia. Recycling 2021, 6, 73. [Google Scholar] [CrossRef]
  14. Wu, Y.; Que, W.; Liu, Y.G.; Cao, L.; Liu, S.B.; Zhang, J. Is resilience capacity index of Chinese region performing well? Evidence from 26 provinces. Ecol. Indic. 2020, 112, 106088. [Google Scholar] [CrossRef]
  15. Liu, G.; Zhao, T.; Guofang, M.I. Forecast of the Carbon Emission Intensity and Analysis of Coal Energy’s Proportion in China. Resour. Sci. 2012, 34, 677–687. [Google Scholar]
  16. Yazdani, M.; Kabirifar, K.; Frimpong, E.; Shariati, M. Improving Construction and Demolition Waste Collection Service in an Urban Area Using a Simheuristic Approach: A Case Study in Sydney, Australia. J. Clean. Prod. 2021, 280, 124138. [Google Scholar] [CrossRef]
  17. Yinhua, J.; Hui, Z.; Jiajun, H.; Yanqin, Z. Carbon Emission of Municipal Solid Waste in Shanghai. IOP Publ. 2020, 555, 012058. [Google Scholar]
  18. Bogner, J.; Matthews, E. Global methane emissions from landfills: New methodology and annual estimates 1980e1996. Glob. Biogeochem. Cycles 2003, 17, 1e18. [Google Scholar]
  19. Wang, Z.; Geng, L. Carbon emissions calculation from municipal solid waste and the influencing factors analysis in China. J. Clean. Prod. 2015, 104, 177–184. [Google Scholar] [CrossRef]
  20. Liu, Y.; Ni, Z.; Kong, X.; Liu, J. Greenhouse gas emissions from municipal solid waste with a high organic fraction under different management scenarios. J. Clean. Prod. 2017, 147, 451–457. [Google Scholar] [CrossRef]
  21. Iqbal, A.; Zan, F.; Liu, X.; Chen, G.-H. integrated municipal solid waste management scheme of Hang Kong: A comprehensive analysis in terms of global warming potential and energy use. J. Clean. Prod. 2019, 225, 1079–1088. [Google Scholar] [CrossRef]
  22. Song, X.; Ali, M.; Zhang, X.; Sun, H.P. Stakeholder coordination analysis in hazardous waste management: A case study in China. J. Mater. Cycles Waste Manag. 2021, 23, 1873–1892. [Google Scholar] [CrossRef]
  23. Chen, Y.C.; Lo, S.L. Evaluation of greenhouse gas emissions for several municipal solid waste management strategies. J. Clean. Prod. 2016, 113, 606–612. [Google Scholar] [CrossRef]
  24. Friedrich, E.; Trois, C. Current and future greenhouse gas (GHG) emissions from the management of Municipal solid waste in the eThekwini Municipality-south Africa. J. Clean. Prod. 2016, 112, 4071–4083. [Google Scholar] [CrossRef]
  25. Wang, Y.; Yan, Y.; Chen, G.; Zuo, J.; Du, H. Effective approaches to reduce greenhouse gas emissions from waste to energy process: A China study. Resour. Conserv. Recycl. 2015, 104, 103–108. [Google Scholar] [CrossRef]
  26. Wang, Y.; Yan, Y.; Chen, G.; Zuo, J.; Yan, B.; Yin, P. Effectiveness of waste-to-energy approaches in China: From the perspective of greenhouse gas emission reduction. J. Clean. Prod. 2017, 163, 99–105. [Google Scholar] [CrossRef]
  27. Bi, W.; Lu, W.S.; Zhao, Z.; Webster, C.J. Combinatorial optimization of construction waste collection and transportation: A case study of Hong Kong. Resour. Conserv. Recycl. 2022, 179, 106043. [Google Scholar] [CrossRef]
  28. Corsten, M.; Worrell, E.; Rouw, M.; van Duin, A. The potential contribution of sustainable waste management to energy use and greenhouse gas emission reduction in the Netherlands. Resour. Conserv. Recycl. 2013, 77, 13–21. [Google Scholar] [CrossRef]
  29. Razza, F.; Fieschi, M.; Innocenti, F.D.; Bastioli, C. Compostable cutlery and waste management: An LCA approach. Waste Manag. 2009, 29, 1424–1433. [Google Scholar] [CrossRef]
  30. Cucchiella, F.; Gastaldi, M.; Miliacca, M. The management of greenhouse gas emissions and its effects on firm performance. J. Clean. Prod. 2017, 167, 1387–1400. [Google Scholar] [CrossRef]
  31. Zhang, N.; Wei, X. Dynamic Total Factor Carbon Emissions Performance Changes in the Chinese Transportation Industry. Appl. Energy 2015, 146, 409–420. [Google Scholar] [CrossRef]
  32. Mukherjee, K. Energy use efficiency in the Indian manufacturing sector: An interstate ananlysis. Energy Policy 2008, 36, 662–672. [Google Scholar] [CrossRef]
  33. Ferriter, J.P. The Prospects for International Energy Policy Cooperation. Heat Pumps 1990, 861–866. [Google Scholar] [CrossRef]
  34. Zhao, Y.; Zhao, L.L.; Bian, Y.W. Measuring regional efficiency of energy and carbon dioxide emissions in China: A chance constrained DEA approach. Comput. Oper. Res. 2016, 66, 351–361. [Google Scholar] [CrossRef]
  35. Ramanathan, R. A multi-factor efficiency perspective to the relationships among world GDP, energy consumption and carbon dioxide emissions. Technol. Forecast. Soc. Chang. 2006, 73, 483–494. [Google Scholar] [CrossRef]
  36. Maradan, D.; Vassiliev, A. Marginal costs of carbon dioxide abatement: Empirical evidence from crosscountry ananlysis. Swiss J. Econ. Stats 2005, 141, 377–410. [Google Scholar]
  37. Kaoru, T. A slacks-based measure of super-efficiency in data envelopment analysis. Eur. J. Oper. Res. 2002, 143, 32–41. [Google Scholar]
  38. Sun, P.; Liu, L.; Qayyum, M. Energy efficiency comparison amongst service industry in Chinese provinces from the perspective of heterogeneous resource endowment: Analysis using undesirable super efficiency SBM-ML model. J. Clean. Prod. 2021, 328, 129535. [Google Scholar] [CrossRef]
  39. Khan, S.U.; Cui, Y.; Khan, A.A.; Ali, M.; Khan, A.; Xia, X.L.; Liu, G.B.; Zhao, M.J. Tracking sustainable development efficiency with human-environmental system relationship: An application of DPSIR and super efficiency SBM model—ScienceDirect. Sci. Total Environ. 2021, 783, 146959. [Google Scholar] [CrossRef]
  40. Meng, M.; Qu, D. Understanding the green energy efficiencies of provinces in China: A Super-SBM and GML analysis. Energy 2021, 239, 121912. [Google Scholar] [CrossRef]
  41. Zhou, C.; Shi, C.; Wang, S.; Zhang, G.J. Estimation of eco-efficiency and its influencing factors in Guangdong province based on Super-SBM and panel regression models. Ecol. Indic. 2018, 86, 67–80. [Google Scholar] [CrossRef]
  42. Song, X.; Geng, Y.; Dong, H.; Chen, W. Social network analysis on industrial symbiosis: A case of Gujiao eco-industrial park. J. Clean. Prod. 2018, 193, 414–423. [Google Scholar] [CrossRef]
  43. Tobler, W.R. A computer movie simulating urban growth in the Detroit region. Econ. Geogr. 1970, 46 (Suppl. S1), 234–240. [Google Scholar] [CrossRef]
  44. Tone, K. Dealing with undesirable outputs in DEA: A Slacks-Based Measure (SBM) approach. GRIPS Res. Rep. Ser. 2004, 1-B-8, 44–45. [Google Scholar]
  45. Moran, P.A.P. The interpretation of statistical maps. J. R. Stat. Soc. Ser. B–Stat. Methodol. 1948, 10, 243–251. [Google Scholar] [CrossRef]
  46. Rey, S.J.; Montouri, B.D. US regional income convergence: A spatial econometric perspective. Reg. Stud. 1999, 33, 143–156. [Google Scholar] [CrossRef]
  47. Wang, W.; Zhao, D.; Kuang, Y. Decomposition analysis on influence factors of direct household energy-related carbon emission in Guangdong province-Based on extended Kaya identity. Environ. Prog. Sustain. Energy 2015, 35, 298–307. [Google Scholar] [CrossRef] [Green Version]
  48. Zou, J. Research on Carbon Emission of Residents’ Consumption-Based on the City of Guangzhou. Low Carbon Econ. 2017, 8, 31–39. [Google Scholar] [CrossRef] [Green Version]
  49. Lin, B.; Ma, R. Green technology innovations, urban innovation environment and CO2 emission reduction in China: Fresh evidence from a partially linear functional-coefficient panel model. Technol. Forecast. Soc. Chang. 2022, 176, 121434. [Google Scholar] [CrossRef]
  50. Lybecker, K.M. Innovation and Technology Dissemination in Clean Technology Markets and the Developing World: The Role of Trade, Intellectual Property Rights, and Uncertainty. Soc. Sci. Electron. Publ. 2015, 10, 7–38. [Google Scholar] [CrossRef] [Green Version]
  51. Malkow, T. Novel and innovative pyrolysis and gasification technologies for energy efficient and environmentally sound MSW disposal. Waste Manag. 2004, 24, 53–79. [Google Scholar] [CrossRef]
  52. He, P.J.; Chen, M.; Yang, N.; Shao, L.M. GHG emissions from Chinese MSW incineration and their influencing factors-Case study of one MSW incineration plant in Shanghai. Zhongguo Huanjing Kexue/China Environ. Sci. 2011, 31, 402–407. [Google Scholar]
  53. Liu, W.; Guo, C.; Chen, J. Characteristics and Influence Factors for Mega-urban Resident Daily Trip CO_2 Emissions in China. J. Beijing Inst. Technol. 2015, 17, 32–39. [Google Scholar] [CrossRef]
  54. Ying, R.Y.; Hao, H.U. China Urban Resident’s Motives of Willingness to Pay for Low-carbon Agricultural Products. China Popul. Resour. Environ. 2012, 22, 165–171. [Google Scholar]
  55. Wang, Z.; Zhu, Y.B.; Liu, C.X.; Ma, X.Z. Integrated Projection of Carbon Emission for China under the Optimal Economic Growth Path. Acta Geogr. Sin. 2010, 65, 1559–1568. [Google Scholar]
  56. Liao, H.; Cao, H.S. How does carbon dioxide emission change with the economic development? Statistical experiences from 132 countries. Glob. Environ. Chang. 2013, 23, 1073–1082. [Google Scholar] [CrossRef]
  57. Mulia, R.; Widayati, A.; Suyanto Agung, P.; Zulkarnain, M.T. Low carbon emission development strategies for Jambi, Indonesia: Simulation and trade-off analysis using the FALLOW model. Mitig. Adapt. Strateg. Glob. Chang. 2014, 19, 773–788. [Google Scholar] [CrossRef] [Green Version]
  58. Gai, M.; Cao, G.; Tian, C.; Lina, K.E. Decoupling Analysis of Energy Carbon Emissions and Regional Economic Growth in the Liaoning Coastal Economic Belt. Resour. Sci. 2014, 36, 1267–1277. [Google Scholar]
  59. Zhao, X.; Wan, C.; Xuan, H. Regional Difference of Efficiency in China’s Circulation Industry with Low Carbon Constraint Based on Three-stage DEA Model Measurement. J. Beijing Technol. Bus. Univ. 2018, 33, 41–52. [Google Scholar]
  60. Song, X.; Geng, Y.; Li, K.; Zhang, X.; Fei Wu Pan, H.; Zhang, Y. Does environmental infrastructure investment contribute to emissions reduction? A case of China. Front. Energy 2020, 14, 57–70. [Google Scholar] [CrossRef]
  61. Sheraz, R.; Akseer, H.; Tariq, A.; Khoso, N.A. How does a democratic government with limited intervention affect environmental quality? Fresh evidence with international panel data. Int. J. Adv. Appl. Sci. 2021, 8, 130–137. [Google Scholar]
  62. Tian, J.; Song, X.; Zhang, J.; Chen, M.E. Spatial-Temporal Pattern and Driving Factors of Carbon Efficiency in China: Evidence from Panel Data of Urban Governance. Energies 2022, 15, 2536. [Google Scholar] [CrossRef]
  63. Yca, B.; Gya, B.; Kai, L. Regional differences in the industrial water use efficiency of China: The spatial spillover effect and relevant factors. Resour. Conserv. Recycl. 2020, 167, 105239. [Google Scholar]
  64. Li, X.; Cheng, Z.H. Does high-speed rail improve urban carbon emission efficiency in China? Socio-Econ. Plan. Sci. 2022, 101308. [Google Scholar] [CrossRef]
  65. Kosajan, V.; Wen, Z.G.; Fei, F.; Dinga, C.D.; Wang, Z.J.; Zhan, J.Y. The feasibility analysis of cement kiln as an MSW treatment infrastructure: From a life cycle environmental impact perspective. J. Clean. Prod. 2020, 267, 122113. [Google Scholar] [CrossRef]
  66. Kosajan, V.; Wen, Z.G.; Zheng, K.F.; Fei, F.; Wang, Z.J.; Tian, H.K. Municipal solid waste (MSW) co-processing in cement kiln to relieve China’s Msw treatment capacity pressure. Resour. Conserv. Recycl. 2021, 167, 105384. [Google Scholar] [CrossRef]
  67. Wang, H.H.; Shi, W.Y.; He, Y.Y.; Dong, J.Q. Spill-over effect and efficiency of seven pilot carbon emissions trading exchanges in China. Sci. Total Environ. 2022, 156020. [Google Scholar] [CrossRef]
Figure 1. MSW treatment carbon emissions efficiency of 31 provinces of China during 2010–2019.
Energies 15 03987 g001
Figure 2. Mean of the MSW treatment carbon emission efficiency for the whole of China and for the three regions.
Energies 15 03987 g002
Figure 3. Coefficient of variation of the MSW treatment carbon emission efficiency for the whole of China and for the three regions.
Energies 15 03987 g003
Figure 4. LISA cluster map (a) 2010, (b) 2015, and (c) 2019.
Energies 15 03987 g004aEnergies 15 03987 g004b
Figure 5. Markov transition matrix of the MSW treatment carbon emission efficiency in China during 2010–2019.
Energies 15 03987 g005
Figure 6. Spatial Markov matrix of the MSW treatment carbon emission efficiency in China during 2010–2019.
Energies 15 03987 g006
Table 1. Variable description.
VariableIndicator Description
Input indicatorsHumanUrban resident population
CapitalGovernment green technology expenditure
Pollution emission inputMSW harmless treatment capacity
Output indicatorsEconomic outputGDP
Unexpected outputPollution outputMSW treatment carbon emissions
Environmental factorEconomic development levelValue added of tertiary industry
Technology levelGovernment R&D investment
Degree of government interventionGovernment expenditure to GDP ratio
Table 2. Moran’s I index of the MSW treatment carbon emission efficiency in China during 2010–2019.
Global Moran’s Iz-Scorep-Value
20100.4644.32840.002
20110.3763.55680.003
20120.4834.31760.001
20130.4153.82650.001
20140.4333.97590.001
20150.4524.11430.001
20160.6485.95080.001
20170.3063.07360.006
20180.5004.60180.001
20190.4824.53830.001
Table 3. LM test.
Table 3. LM test.
TestStatisticdfp-Value
Spatial error
Moran’s I3.01 ***10.003
Lagrange multiplier148.932 ***10
Robust Lagrange multiplier119.81 ***10
Spatial lag
Lagrange multiplier29.199 ***10
Robust Lagrange multiplier0.07610.783
Note: *** denote the significance at the 1% levels.
Table 4. Regression results of the influencing factors of the MSW treatment carbon emission efficiency in China.
VariableCoefficientStd.Errzp > z
Three.0.036414 **0.0178362.040.041
Tec.0.716677 **0.0292642.450.014
Gov.−0.42762 ***0.138248−3.090.002
λ0.208212 ***0.0145914.270
Note: ***, ** denote the significance at the 1%, 5% levels.
Publisher’s Note: MDPI stays neutral with regard to jurisdictional claims in published maps and institutional affiliations.

