
An Optical Engine Used as a Physical Model for Studies of the Combustion Process Applying a Two-Color Pyrometry Technique

 ,
,  , , , and
Abstract
:1. Introduction
2. Experimental Facility Description
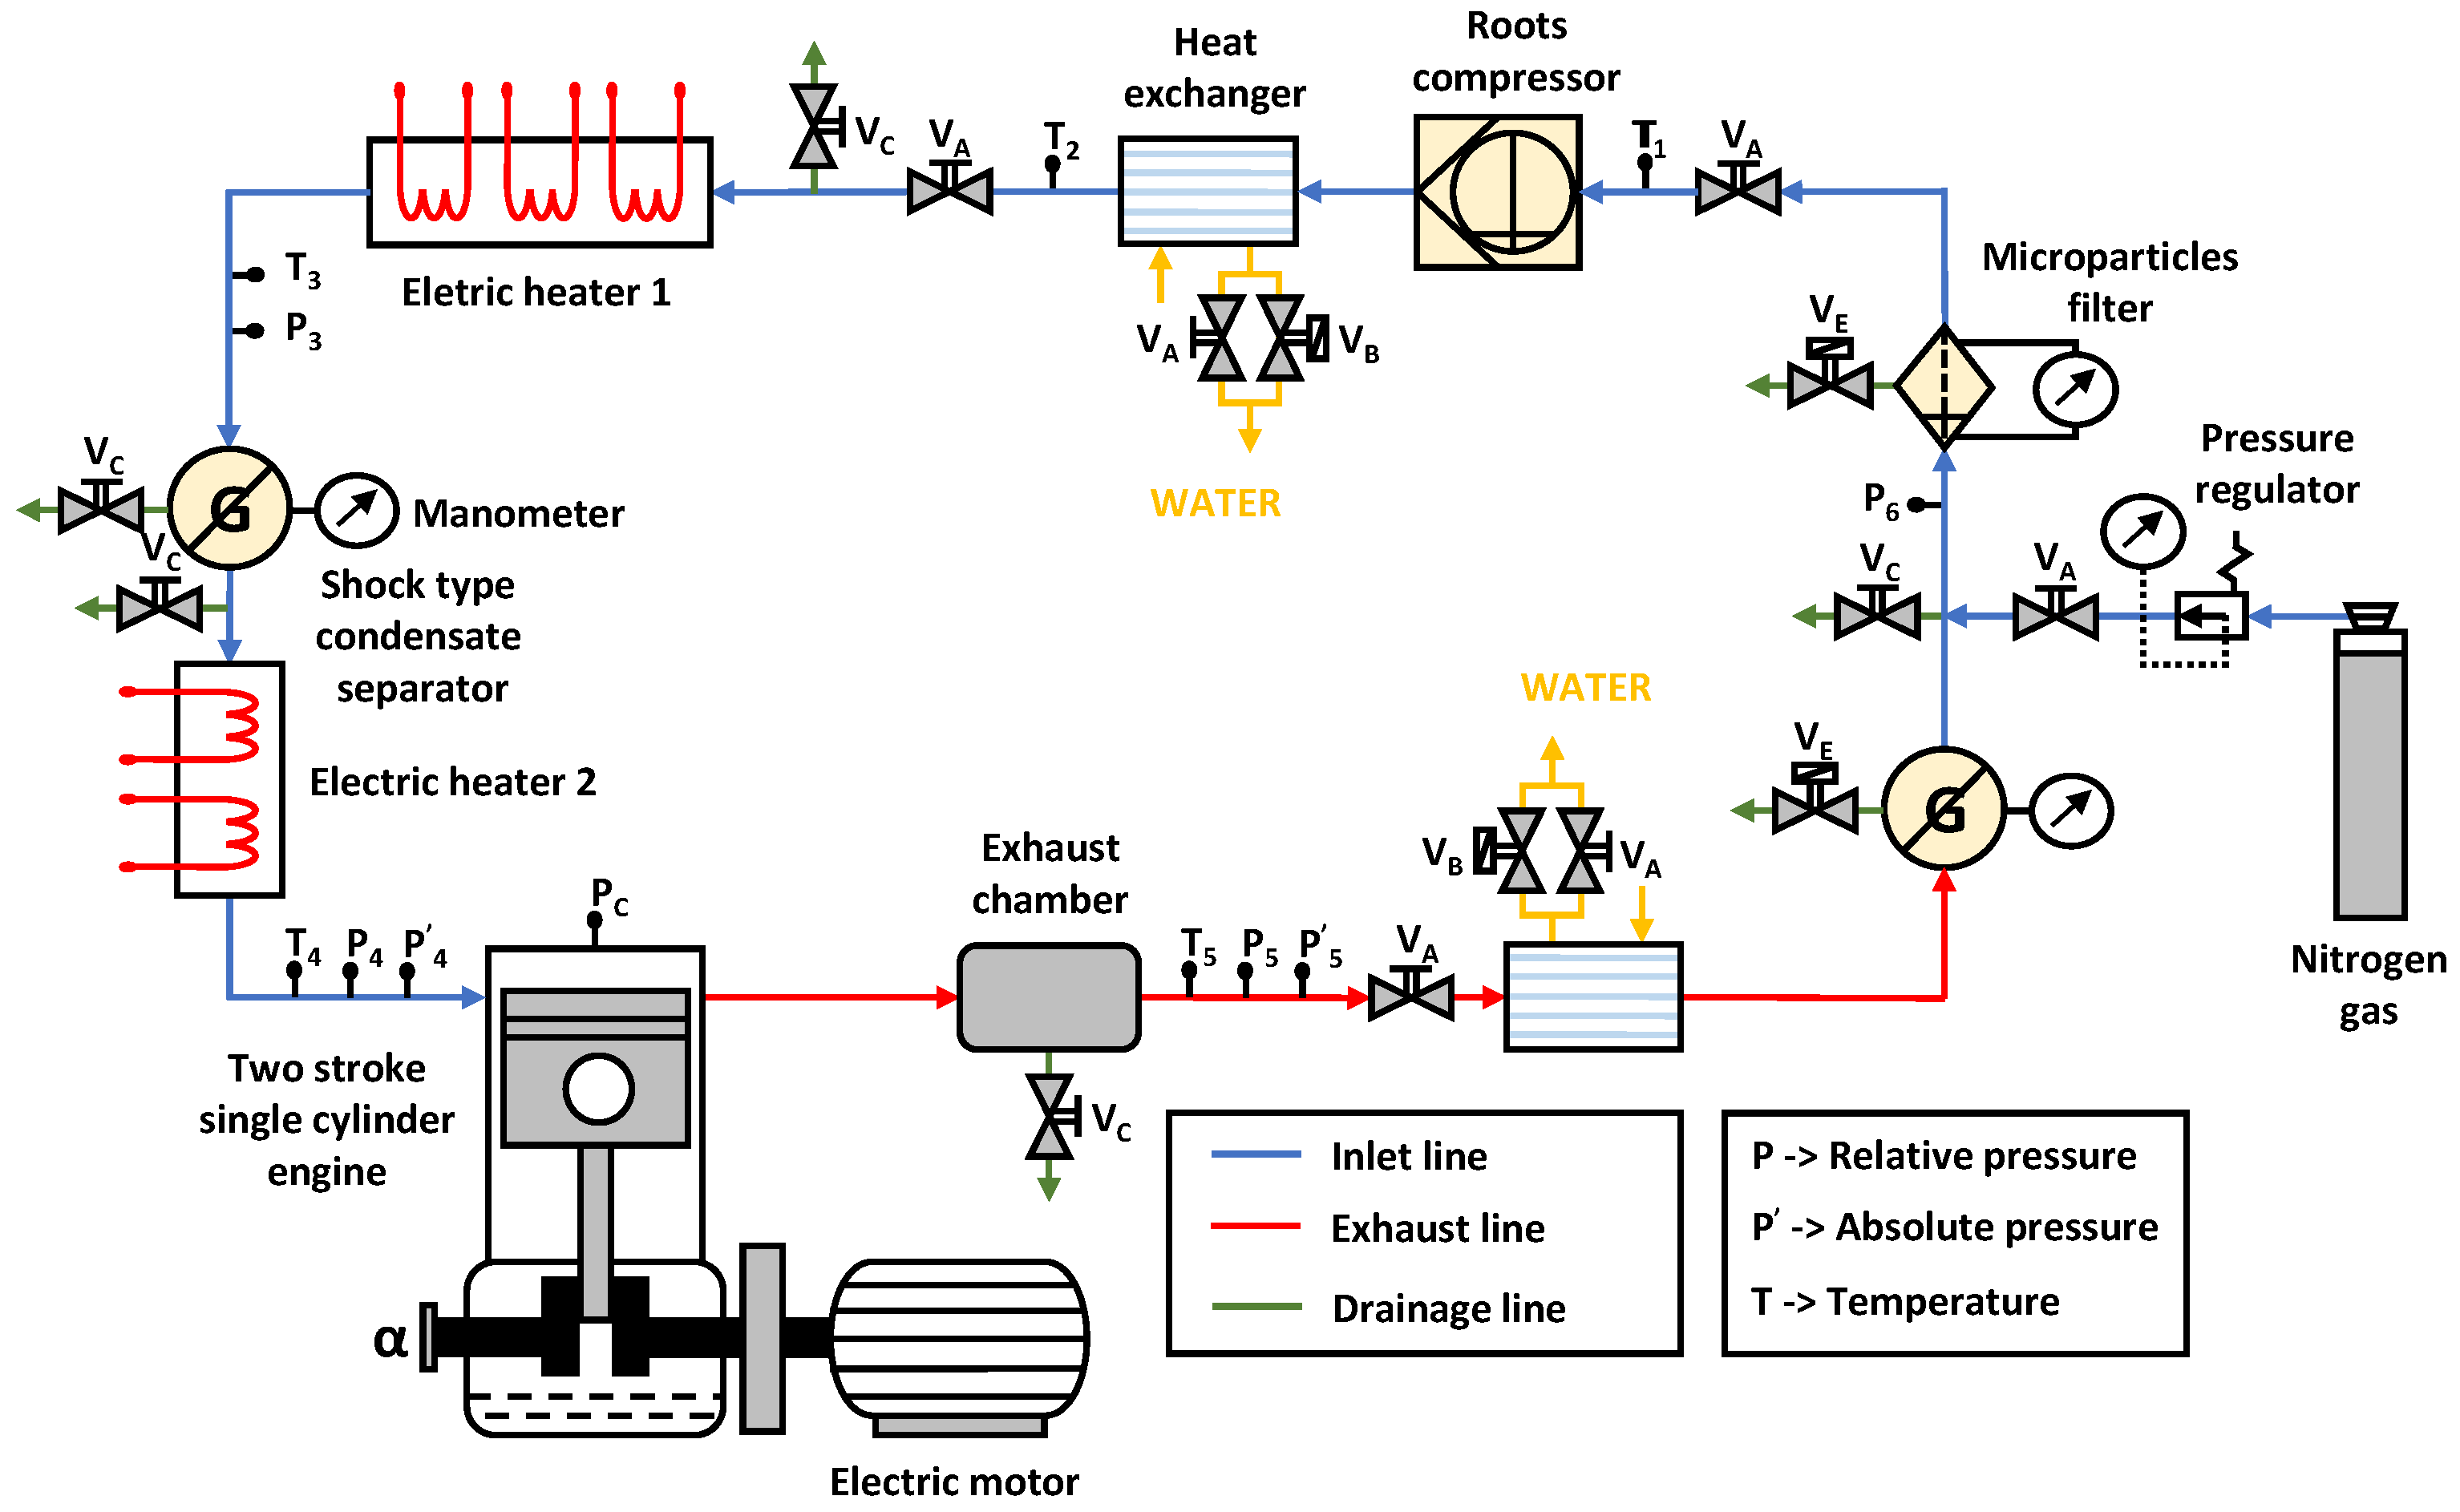
2.1. Gas Charging and Transfer System in Closed and Open Circuit
- Inert Atmosphere and Closed Circuit
- Reactive Atmosphere and Open Circuit
2.2. Engine and Drive System
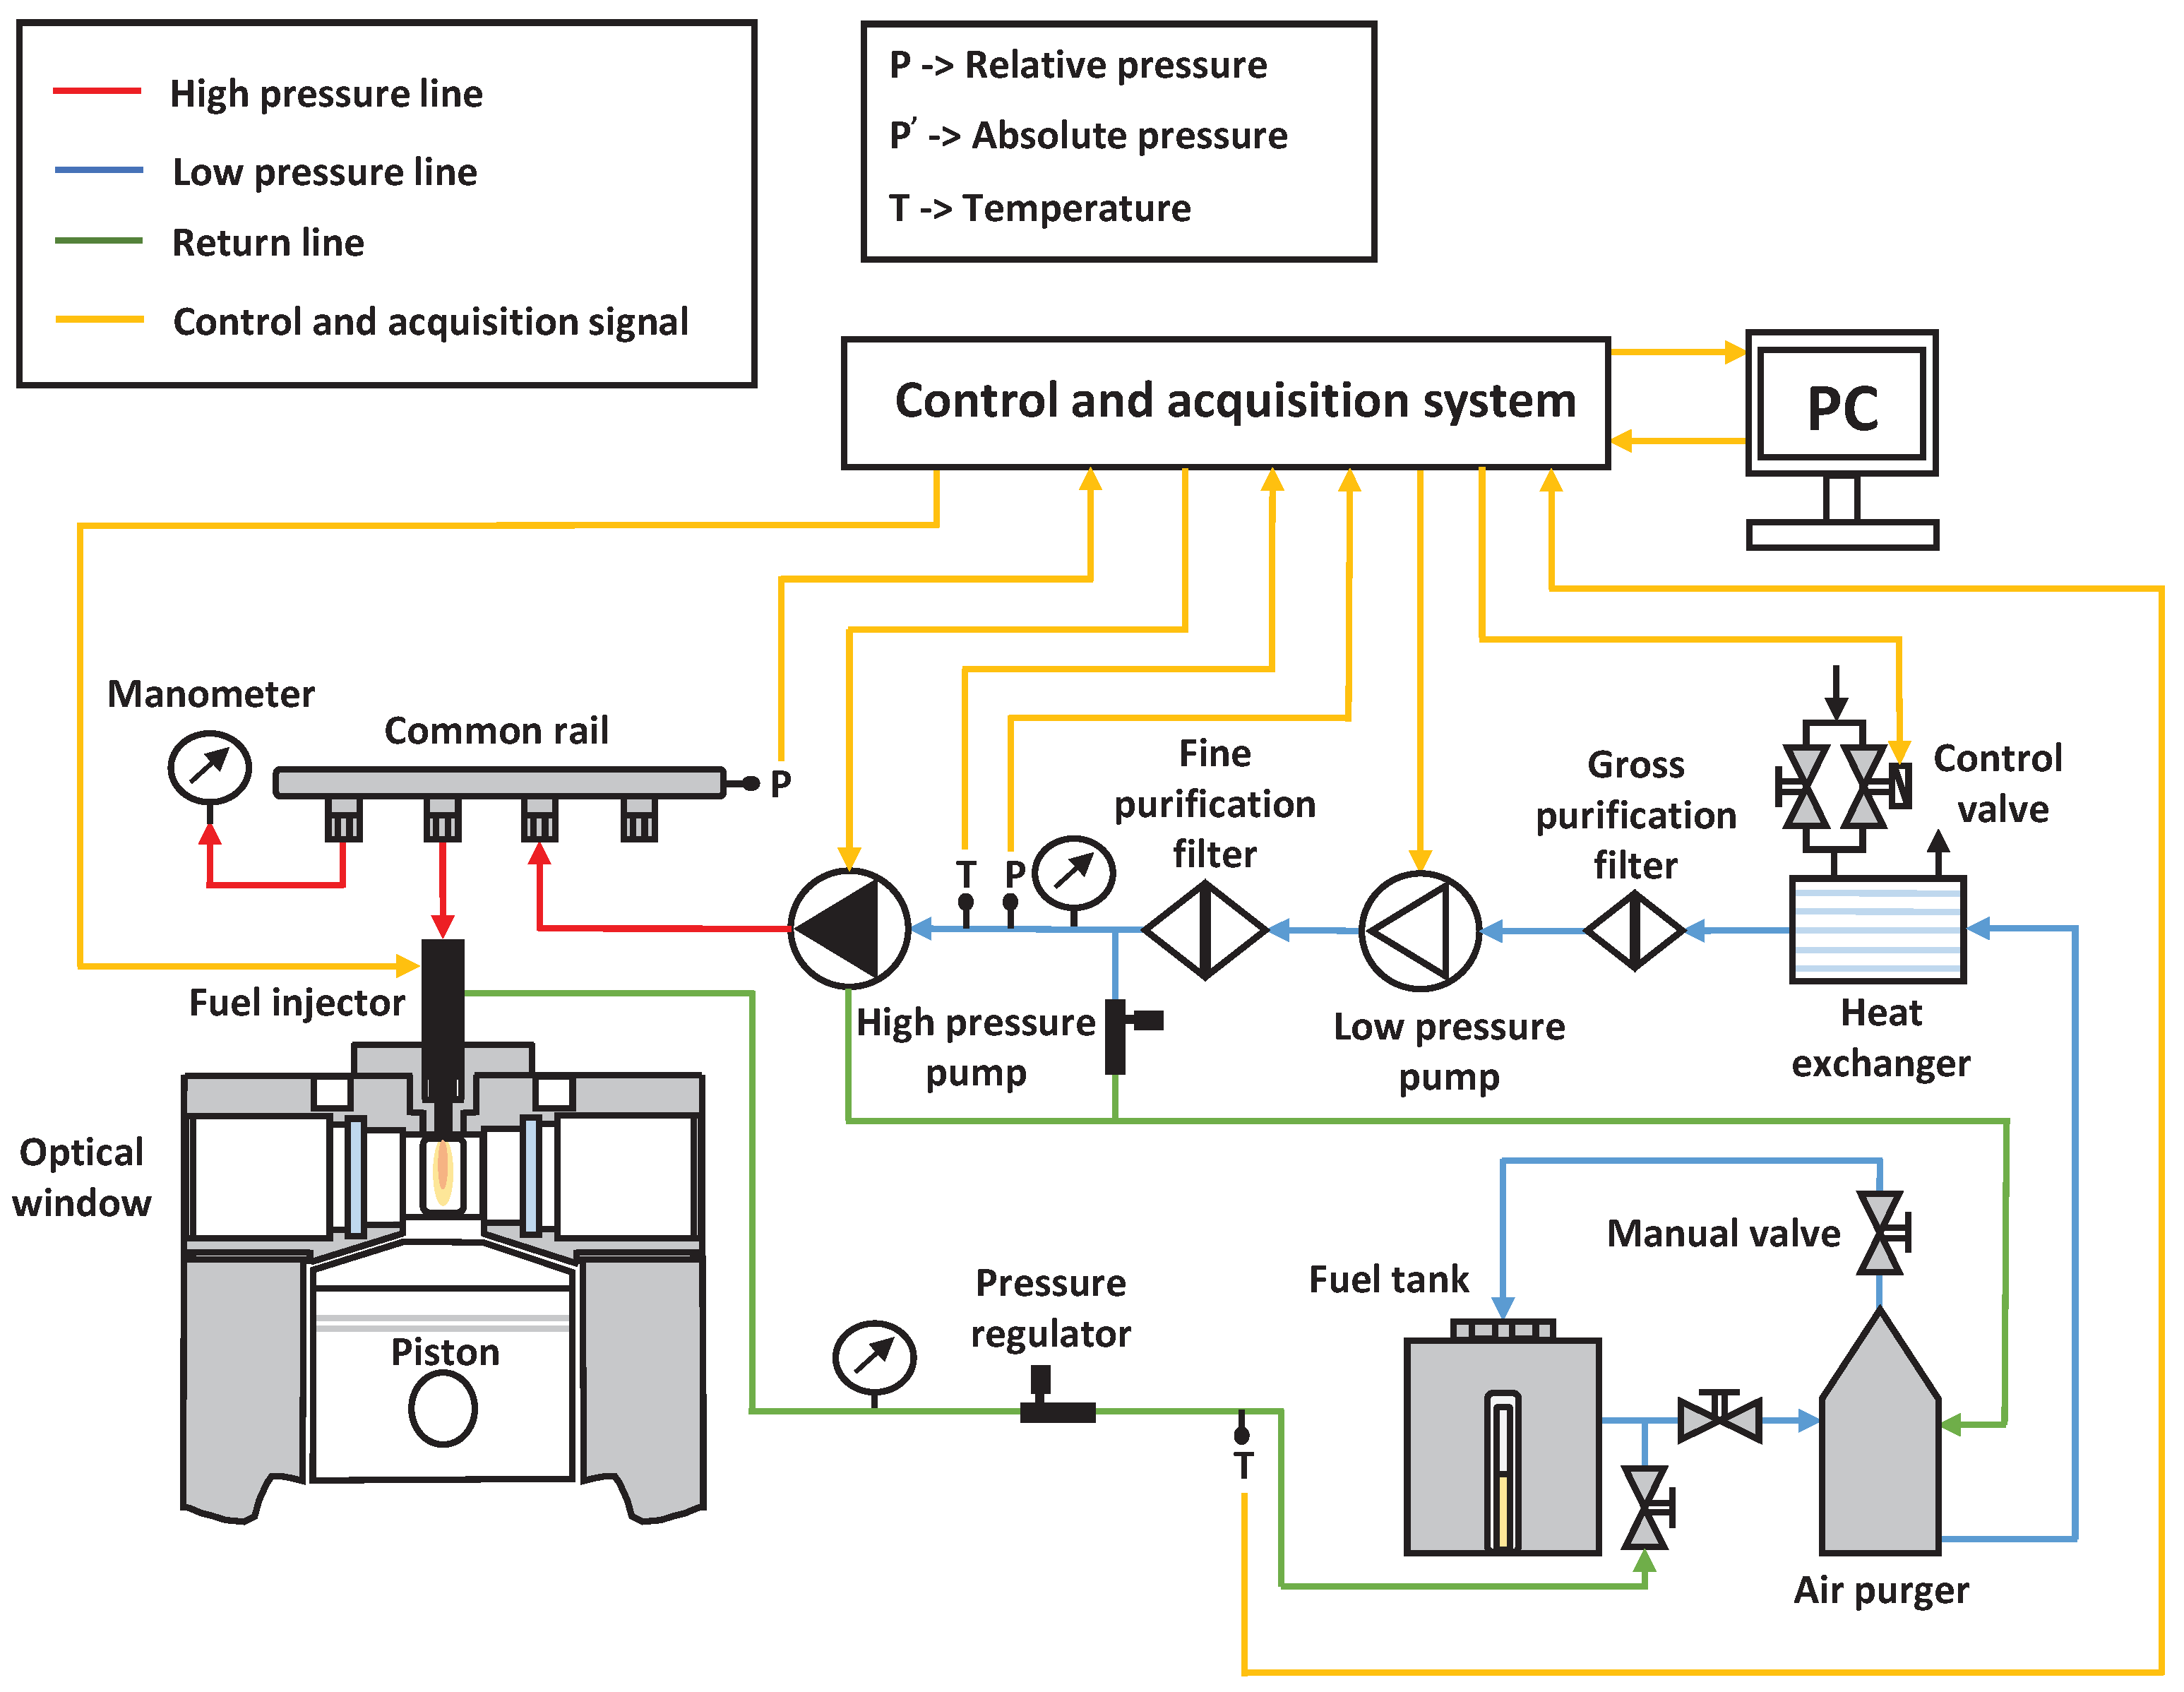
2.3. Fuel Injection System
2.4. Visualization System
3. Experimental Procedure
4. Results and Discussion
5. Conclusions
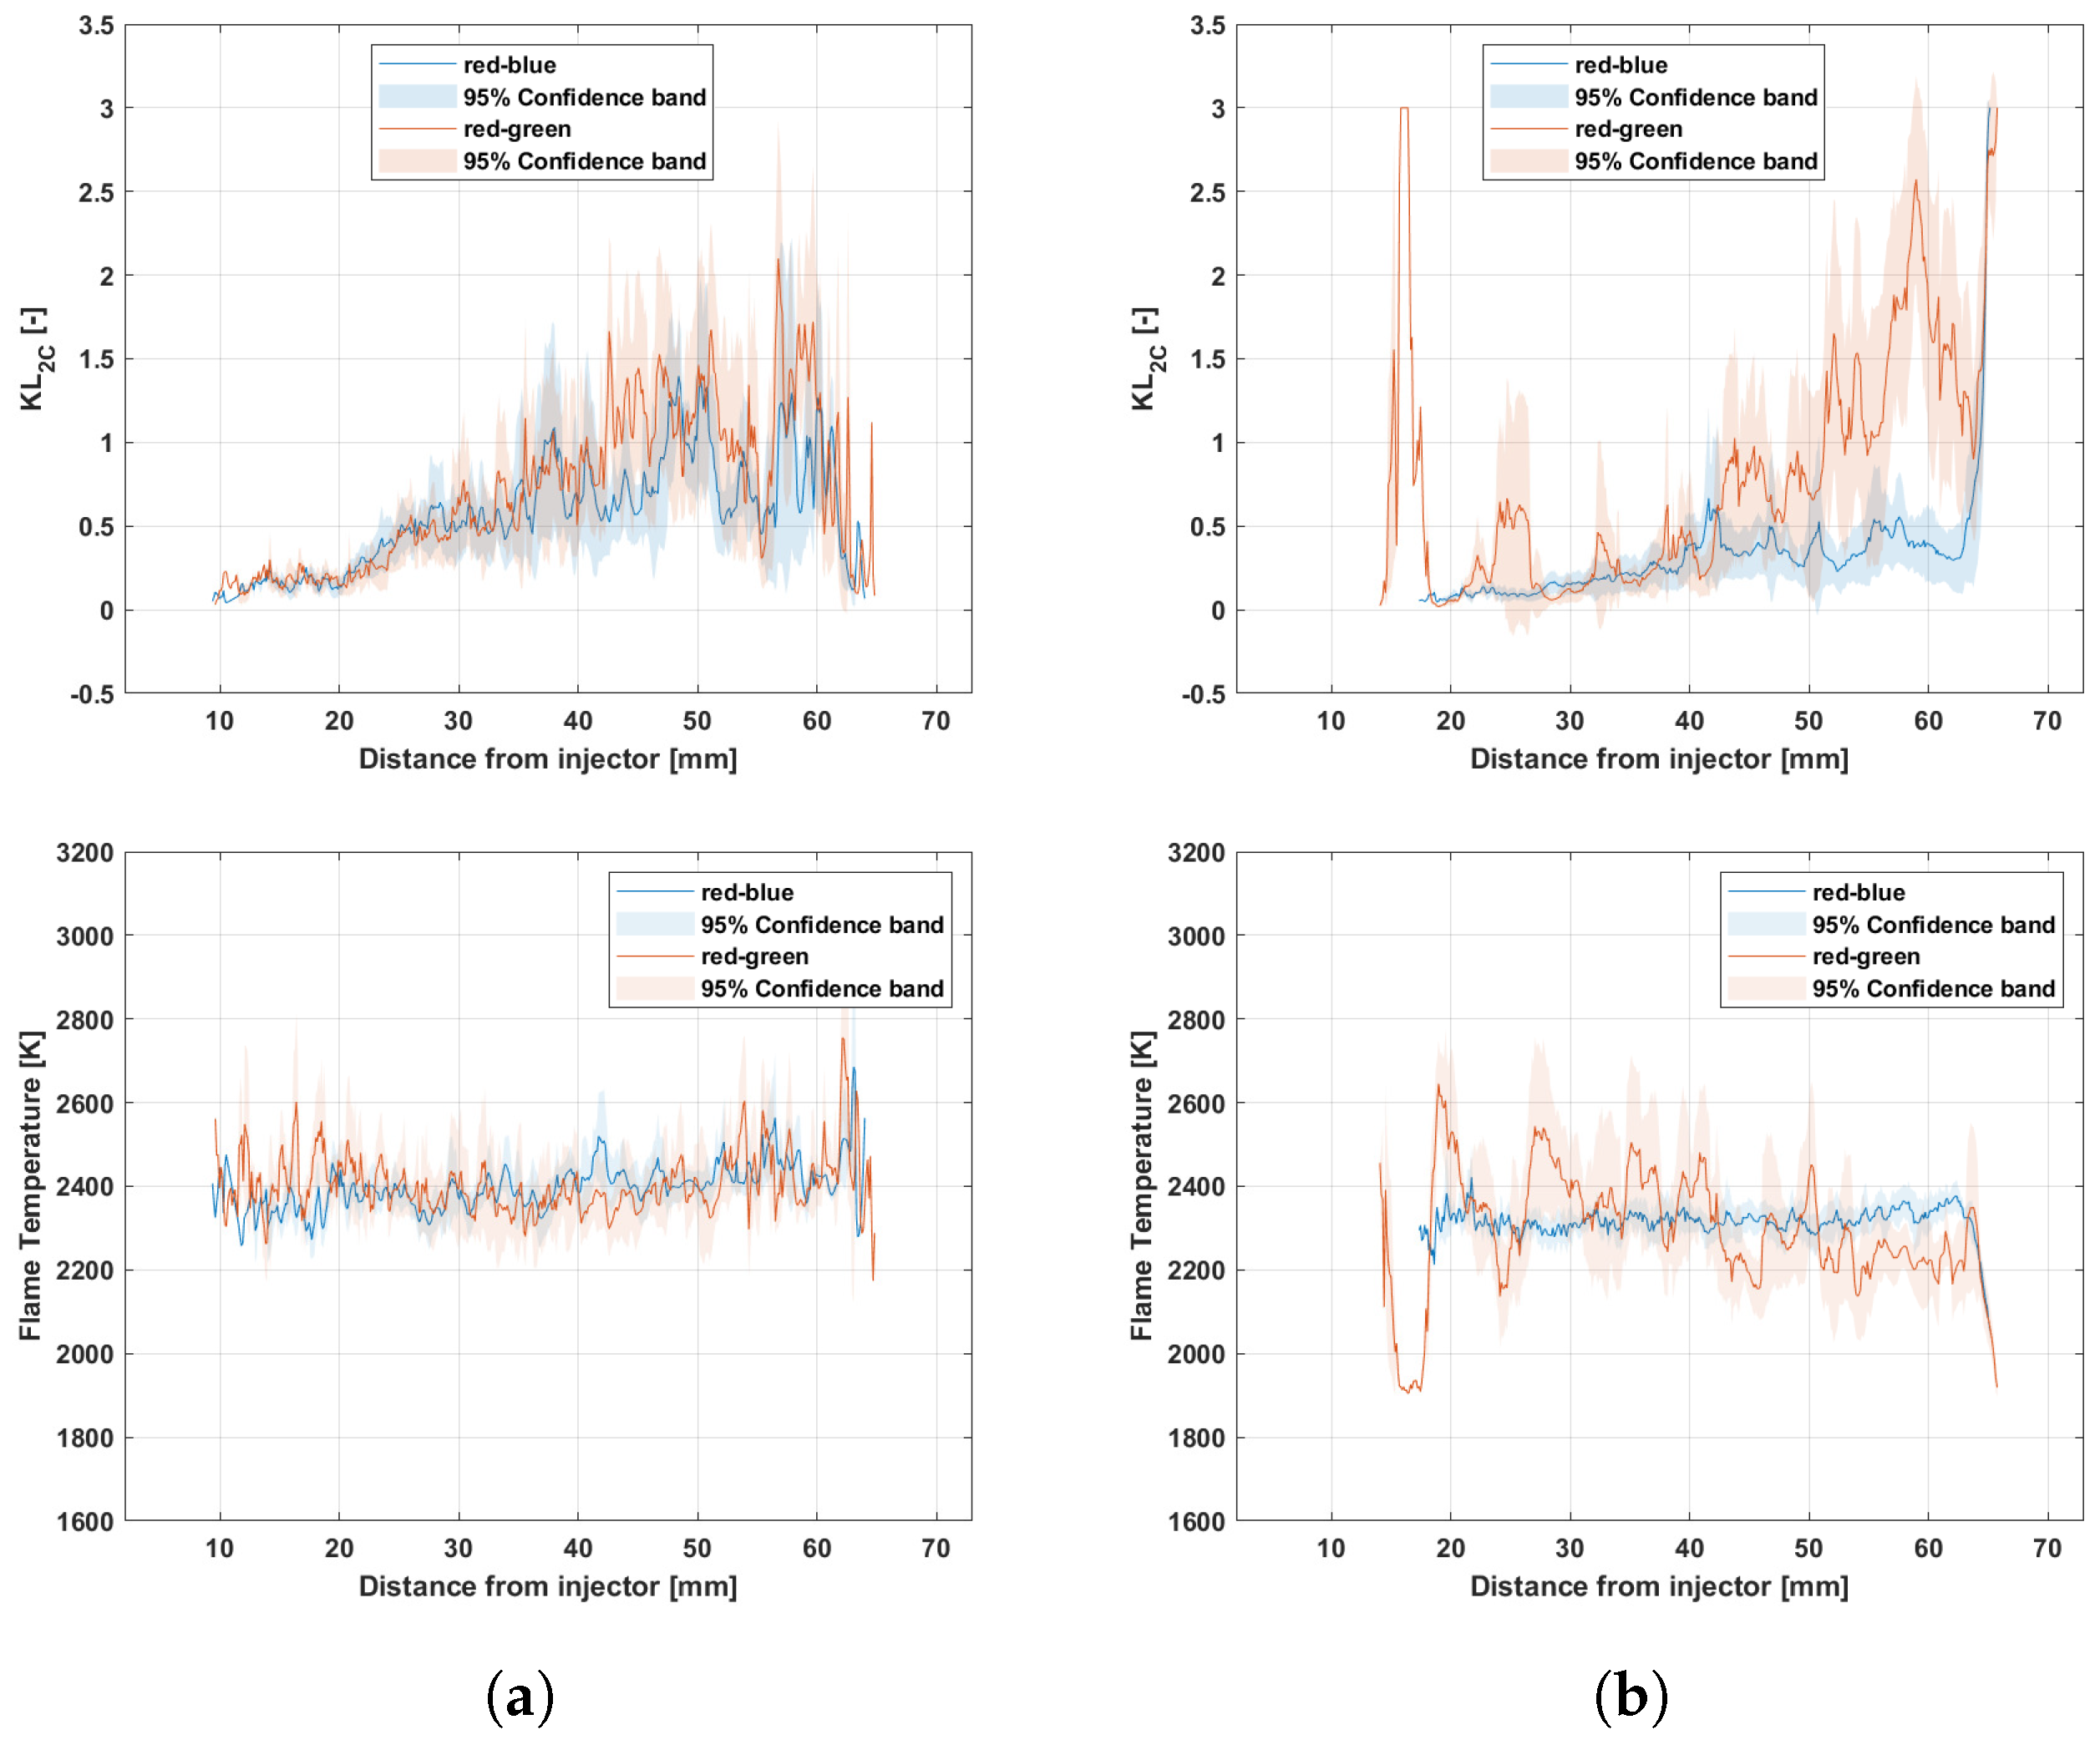
- Working with cameras in high dynamic range (no filter) provides better results since the system seems to be less sensitive to measurement noise, and fewer points with a non-physical solution are obtained. This is seen for the three operating points studied in this work. Despite the differences, it seems that the different configurations used are capable of determining the combustion behavior according to the changes in the operating conditions used in this work.
- The combination of red–blue interference filters provides better results, yielding a much smaller area of non-physical solutions. This is because the greater the difference between the wavelengths of the two interference filters, the fewer points there are with non-physical solutions. For low-soot conditions, significant discrepancies were seen, including values that did not represent the differences in operating conditions or the effect they should have on combustion.
Author Contributions
Funding
Institutional Review Board Statement
Informed Consent Statement
Acknowledgments
Conflicts of Interest
References
- Birol, F. World Energy Outlook; International Energy Agency: Paris, France, 2010; Volume 1. [Google Scholar]
- Khatib, H. IEA world energy outlook 2011—A comment. Energy Policy 2012, 48, 737–743. [Google Scholar] [CrossRef]
- Nabi, M.N.; Rahman, M.M.; Akhter, M.S. Biodiesel from cotton seed oil and its effect on engine performance and exhaust emissions. Appl. Therm. Eng. 2009, 29, 2265–2270. [Google Scholar] [CrossRef]
- ConairSystem. New Diesel Engine for UAV and GA. Available online: http://www.conairsystem.com/en/projects/new-diesel-engine.html (accessed on 15 June 2022).
- Cosworth. Aerospace Unmanned Aerial Vehicle (UAV). Available online: https://www.cosworth.com/capabilities/electrification/motor/aerospace-uav/ (accessed on 15 June 2022).
- Borchardt, J.K. Unmanned aerial vehicles spur composites use. Reinf. Plast. 2004, 48, 28–31. [Google Scholar] [CrossRef]
- Finn, R.L.; Wright, D. Unmanned aircraft systems: Surveillance, ethics and privacy in civil applications. Comput. Law Secur. Rev. 2012, 28, 184–194. [Google Scholar] [CrossRef]
- Dudek, M.; Tomczyk, P.; Wygonik, P.; Korkosz, M.; Bogusz, P.; Lis, B. Hybrid fuel cell–battery system as a main power unit for small unmanned aerial vehicles (UAV). Int. J. Electrochem. Sci. 2013, 8, 8442–8463. [Google Scholar]
- Thibbotuwawa, A.; Nielsen, P.; Zbigniew, B.; Bocewicz, G. Energy consumption in unmanned aerial vehicles: A review of energy consumption models and their relation to the UAV routing. In Proceedings of the International Conference on Information Systems Architecture and Technology, Wroclaw, Poland, 15–17 September 2018; Springer: Berlin/Heidelberg, Germany, 2018; pp. 173–184. [Google Scholar]
- Li, J.; Zhou, L.; Zhao, Z.; Wang, X.; Zhang, F. Research on knocking characteristics of kerosene spark-ignition engine for unmanned aerial vehicle (UAV) by numerical simulation. Therm. Sci. Eng. Prog. 2019, 9, 1–10. [Google Scholar] [CrossRef]
- Lee, J.; Bae, C. Application of JP-8 in a heavy duty diesel engine. Fuel 2011, 90, 1762–1770. [Google Scholar] [CrossRef]
- Korres, D.M.; Karonis, D.; Lois, E.; Linck, M.B.; Gupta, A.K. Aviation fuel JP-5 and biodiesel on a diesel engine. Fuel 2008, 87, 70–78. [Google Scholar] [CrossRef]
- Baird, B.; Etemad, S. Advanced Glow Plug for Heavy Fuels Applications; SAE Technical Paper; SAE: Warrendale, PA, USA, 2013. [Google Scholar]
- Ning, L.; Duan, Q.; Wei, Y.; Zhang, X.; Yang, B.; Zeng, K. Experimental investigation on combustion and emissions of a two-stroke DISI engine fueled with aviation kerosene at various compression ratios. Fuel 2020, 259, 116–224. [Google Scholar] [CrossRef]
- Duddy, B.J.; Lee, J.; Walluk, M.; Hallbach, D. Conversion of a spark-ignited aircraft engine to JP-8 heavy fuel for use in unmanned aerial vehicles. SAE Int. J. Engines 2011, 4, 82–93. [Google Scholar] [CrossRef]
- Hooper, P. Initial development of a multi-fuel stepped piston engine for unmanned aircraft application. Aircr. Eng. Aerosp. Technol. 2001, 73, 459–465. [Google Scholar] [CrossRef]
- Dinc, A.; Otkur, M. Emissions prediction of an aero-piston gasoline engine during surveillance flight of an unmanned aerial vehicle. Aircr. Eng. Aerosp. Technol. 2020, 93, 462–472. [Google Scholar] [CrossRef]
- Mangus, M.; Depcik, C. Comparison of ULSD, used cooking oil biodiesel, and JP-8 performance and emissions in a single-cylinder compression-ignition engine. SAE Int. J. Fuels Lubr. 2012, 5, 1382–1394. [Google Scholar] [CrossRef]
- Arkoudeas, P.; Kalligeros, S.; Zannikos, F.; Anastopoulos, G.; Karonis, D.; Korres, D.; Lois, E. Study of using JP-8 aviation fuel and biodiesel in CI engines. Energy Convers. Manag. 2003, 44, 1013–1025. [Google Scholar] [CrossRef]
- Fernandes, G.; Fuschetto, J.; Filipi, Z.; Assanis, D.; McKee, H. Impact of military JP-8 fuel on heavy-duty diesel engine performance and emissions. Proc. Inst. Mech. Eng. Part D J. Automob. Eng. 2007, 221, 957–970. [Google Scholar] [CrossRef]
- Gowdagiri, S.; Cesari, X.M.; Huang, M.; Oehlschlaeger, M.A. A diesel engine study of conventional and alternative diesel and jet fuels: Ignition and emissions characteristics. Fuel 2014, 136, 253–260. [Google Scholar] [CrossRef]
- Corral-Gómez, L.; Rubio-Gómez, G.; Martínez-Martínez, S.; Sánchez-Cruz, F. Effect of diesel-biodiesel-ethanol blends on the spray macroscopic parameters in a common-rail diesel injection system. Fuel 2019, 241, 876–883. [Google Scholar] [CrossRef]
- EASA. Implementation of the Latest CAEP Amendmentsto ICAO Annex 16 Volumes I, II and III. 2019. Available online: https://www.easa.europa.eu/sites/default/files/dfu/NPA%202020-06.pdf (accessed on 15 June 2022).
- Neves, R.C.; Klein, B.C.; da Silva, R.J.; Rezende, M.C.A.F.; Funke, A.; Olivarez-Gómez, E.; Bonomi, A.; Maciel-Filho, R. A vision on biomass-to-liquids (BTL) thermochemical routes in integrated sugarcane biorefineries for biojet fuel production. Renew. Sustain. Energy Rev. 2020, 119, 109607. [Google Scholar] [CrossRef]
- Flynn, P.; Mizusawa, M.; Uyehara, O.A.; Myers, P.S. An experimental determination of the instantaneous potential radiant heat transfer within an operating Diesel engine. SAE Trans. 1972, 81, 95–126. [Google Scholar]
- Boulouchos, K.; Eberle, M.; Ineichen, B.; Klukowski, C. New insights into the mechanisms of in-cylinder heat transfer in diesel engines. SAE Trans. 1989, 98, 1064–1082. [Google Scholar]
- Kim, T.; Alder, B.; Laurendeau, N.; Gore, J. Effects of partial premixing on NOx emission indices of soot-containing flames. Combust. Sci. Tech. 1995, 111, 361–370. [Google Scholar] [CrossRef]
- Akihama, K.; Takatori, Y.; Inagaki, K.; Sasaki, S.; Dean, A.M. Mechanism of the smokeless rich diesel combustion by reducing temperature. SAE Trans. 2001, 110, 648–662. [Google Scholar]
- Ogawa, H.; Li, T.; Miyamoto, N. Characteristics of low temperature and low oxygen diesel combustion with ultra-high exhaust gas recirculation. Int. J. Engine Res. 2007, 8, 365–378. [Google Scholar] [CrossRef]
- Xuan, T.; Pastor, J.V.; García-Oliver, J.M.; García, A.; He, Z.; Wang, Q.; Reyes, M. In-flame soot quantification of diesel sprays under sooting/non-sooting critical conditions in an optical engine. Appl. Therm. Eng. 2019, 149, 1–10. [Google Scholar] [CrossRef]
- Baert, R.S.; Frijters, P.J.; Somers, B.; Luijten, C.C.; de Boer, W. Design and Operation of a High Pressure, High Temperature Cell for HD Diesel Spray Diagnostics: Guidelines and Results; SAE Technical Paper; SAE: Warrendale, PA, USA, 2009. [Google Scholar]
- Parker, A.; Wanstall, C.T.; Reggeti, S.A.; Bittle, J.A.; Agrawal, A.K. Simultaneous rainbow schlieren deflectometry and OH* chemiluminescence imaging of a diesel spray flame in constant pressure flow rig. Proc. Combust. Inst. 2020, 38, 5557–5565. [Google Scholar] [CrossRef]
- Yip, H.; Fattah, I.R.; Yuen, A.; Yang, W.; Medwell, P.; Kook, S.; Yeoh, G.; Chan, Q. Flame–wall interaction effects on diesel post-injection combustion and soot formation processes. Energy Fuels 2019, 33, 7759–7769. [Google Scholar] [CrossRef]
- Fattah, I.R.; Ming, C.; Chan, Q.; Wehrfritz, A.; Pham, P.; Yang, W.; Kook, S.; Medwell, P.; Yeoh, G.; Hawkes, E.; et al. Spray and combustion investigation of post injections under low-temperature combustion conditions with biodiesel. Energy Fuels 2018, 32, 8727–8742. [Google Scholar] [CrossRef] [Green Version]
- Payri, R.; Gimeno, J.; Viera, J.P.; Plazas, A.H. Needle lift profile influence on the vapor phase penetration for a prototype diesel direct acting piezoelectric injector. Fuel 2013, 113, 257–265. [Google Scholar] [CrossRef] [Green Version]
- Payri, R.; Salvador, F.J.; Martí-Aldaraví, P.; Vaquerizo, D. ECN Spray G external spray visualization and spray collapse description through penetration and morphology analysis. Appl. Therm. Eng. 2017, 112, 304–316. [Google Scholar] [CrossRef]
- Bermúdez, V.; García, J.; Juliá, E.; Martínez, S. Engine with Optically Accessible Cylinder Head: A Research Tool for Injection and Combustion Processes; SAE Technical Paper; SAE: Warrendale, PA, USA, 2003. [Google Scholar]
- Mancaruso, E.; Merola, S.; Vaglieco, B. Study of the multi-injection combustion process in a transparent direct injection common rail diesel engine by means of optical techniques. Int. J. Engine Res. 2008, 9, 483–498. [Google Scholar] [CrossRef]
- Pastor, J.; Payri, R.; Gimeno, J.; Nerva, J. Experimental study on RME blends: Liquid-phase fuel penetration, chemiluminescence, and soot luminosity in diesel-like conditions. Energy Fuels 2009, 23, 5899–5915. [Google Scholar] [CrossRef]
- Fang, T.; Lin, Y.C.; Foong, T.M.; Lee, C.f. Biodiesel combustion in an optical HSDI diesel engine under low load premixed combustion conditions. Fuel 2009, 88, 2154–2162. [Google Scholar] [CrossRef]
- Payri, R.; Gimeno, J.; Bardi, M.; Plazas, A.H. Study liquid length penetration results obtained with a direct acting piezo electric injector. Appl. Energy 2013, 106, 152–162. [Google Scholar] [CrossRef] [Green Version]
- Payri, R.; Salvador, F.; Garcia, A.; Gil, A. Combination of visualization techniques for the analysis of evaporating diesel sprays. Energy Fuels 2012, 26, 5481–5490. [Google Scholar] [CrossRef]
- Briceño Sánchez, F.J. Aportaciones al Estudio de la Evolución Transitoria de Llamas de Difusión Diesel. Ph.D. Thesis, Universitat Politècnica de València, Valencia, Spain, 2016. [Google Scholar]
- Xuan, T. Optical Investigations on Diesel Spray Dynamics and in-Flame Soot Formation. Ph.D. Thesis, Universitat Politècnica de València, Valencia, Spain, 2018. [Google Scholar]
- Yon, J.; Cruz, J.J.; Escudero, F.; Morán, J.; Liu, F.; Fuentes, A. Revealing soot maturity based on multi-wavelength absorption/emission measurements in laminar axisymmetric coflow ethylene diffusion flames. Combust. Flame 2021, 227, 147–161. [Google Scholar] [CrossRef]
- Densmore, J.M.; Biss, M.M.; McNesby, K.L.; Homan, B.E. High-speed digital color imaging pyrometry. Appl. Opt. 2011, 50, 2659–2665. [Google Scholar] [CrossRef]
- Pastor, J.V.; García, A.; Micó, C.; Lewiski, F. Simultaneous high-speed spectroscopy and 2-color pyrometry analysis in an optical compression ignition engine fueled with OMEX-diesel blends. Combust. Flame 2021, 230, 111437. [Google Scholar] [CrossRef]
- Pastor, J.V.; García, A.; Micó, C.; Lewiski, F. An optical investigation of Fischer-Tropsch diesel and Oxymethylene dimethyl ether impact on combustion process for CI engines. Appl. Energy 2020, 260, 114238. [Google Scholar] [CrossRef]
- Zhang, J.; Jing, W.; Roberts, W.L.; Fang, T. Soot temperature and KL factor for biodiesel and diesel spray combustion in a constant volume combustion chamber. Appl. Energy 2013, 107, 52–65. [Google Scholar] [CrossRef]
- Jeon, J.; Park, S. Effect of injection pressure on soot formation/oxidation characteristics using a two-color photometric method in a compression-ignition engine fueled with biodiesel blend (B20). Appl. Therm. Eng. 2018, 131, 284–294. [Google Scholar] [CrossRef]
- Fu, T.; Liu, J.; Tian, J. VIS-NIR multispectral synchronous imaging pyrometer for high-temperature measurements. Rev. Sci. Instrum. 2017, 88, 064902. [Google Scholar] [CrossRef] [PubMed]
- Lowe, D.G. Distinctive image features from scale-invariant keypoints. Int. J. Comput. Vis. 2004, 60, 91–110. [Google Scholar] [CrossRef]
- Hottel, H.C.; Broughton, F. Determination of true temperature and total radiation from luminous gas flames. Ind. Eng. Chem. Anal. Ed. 1932, 4, 166–175. [Google Scholar] [CrossRef]
- Zhao, H.; Ladommatos, N. Optical diagnostics for soot and temperature measurement in diesel engines. Prog. Energy Combust. Sci. 1998, 24, 221–255. [Google Scholar] [CrossRef]
- Zhao, H.; Ladommatos, N. Engine Combustion Instrumentation and Diagnostics; Society of Automotive Engineers: Warrendale, PA, USA, 2001. [Google Scholar]
- Payri, F.; Pastor, J.V.; García, J.; Pastor, J.M. Contribution to the application of two-colour imaging to diesel combustion. Meas. Sci. Technol. 2007, 18, 2579. [Google Scholar] [CrossRef]
- Tree, D.R.; Svensson, K.I. Soot processes in compression ignition engines. Prog. Energy Combust. Sci. 2007, 33, 272–309. [Google Scholar] [CrossRef]


| Parameter | Ranges | Units |
|---|---|---|
| In-cylinder gas pressure | 4.5–8 | MPa |
| In-cylinder gas temperature | 800–900 | K |
| In-cylinder gas density | 17.7–35.3 | kg/m |
| Density at 373 K (kg/m) | Derived Cetane Number | C-C Bonds | H/C |
|---|---|---|---|
| 703.7 | 85.4 | 12.56 | 2.146 |
| Operating Points | Energizing Time (s) | Injection Pressure (bar) | Pressure TDC (bar) | Temperature TDC (K) |
|---|---|---|---|---|
| Low soot | 2000 | 1500 | 53 | 800 |
| Medium soot | 2000 | 1500 | 53 | 900 |
| High soot | 2000 | 500 | 53 | 900 |
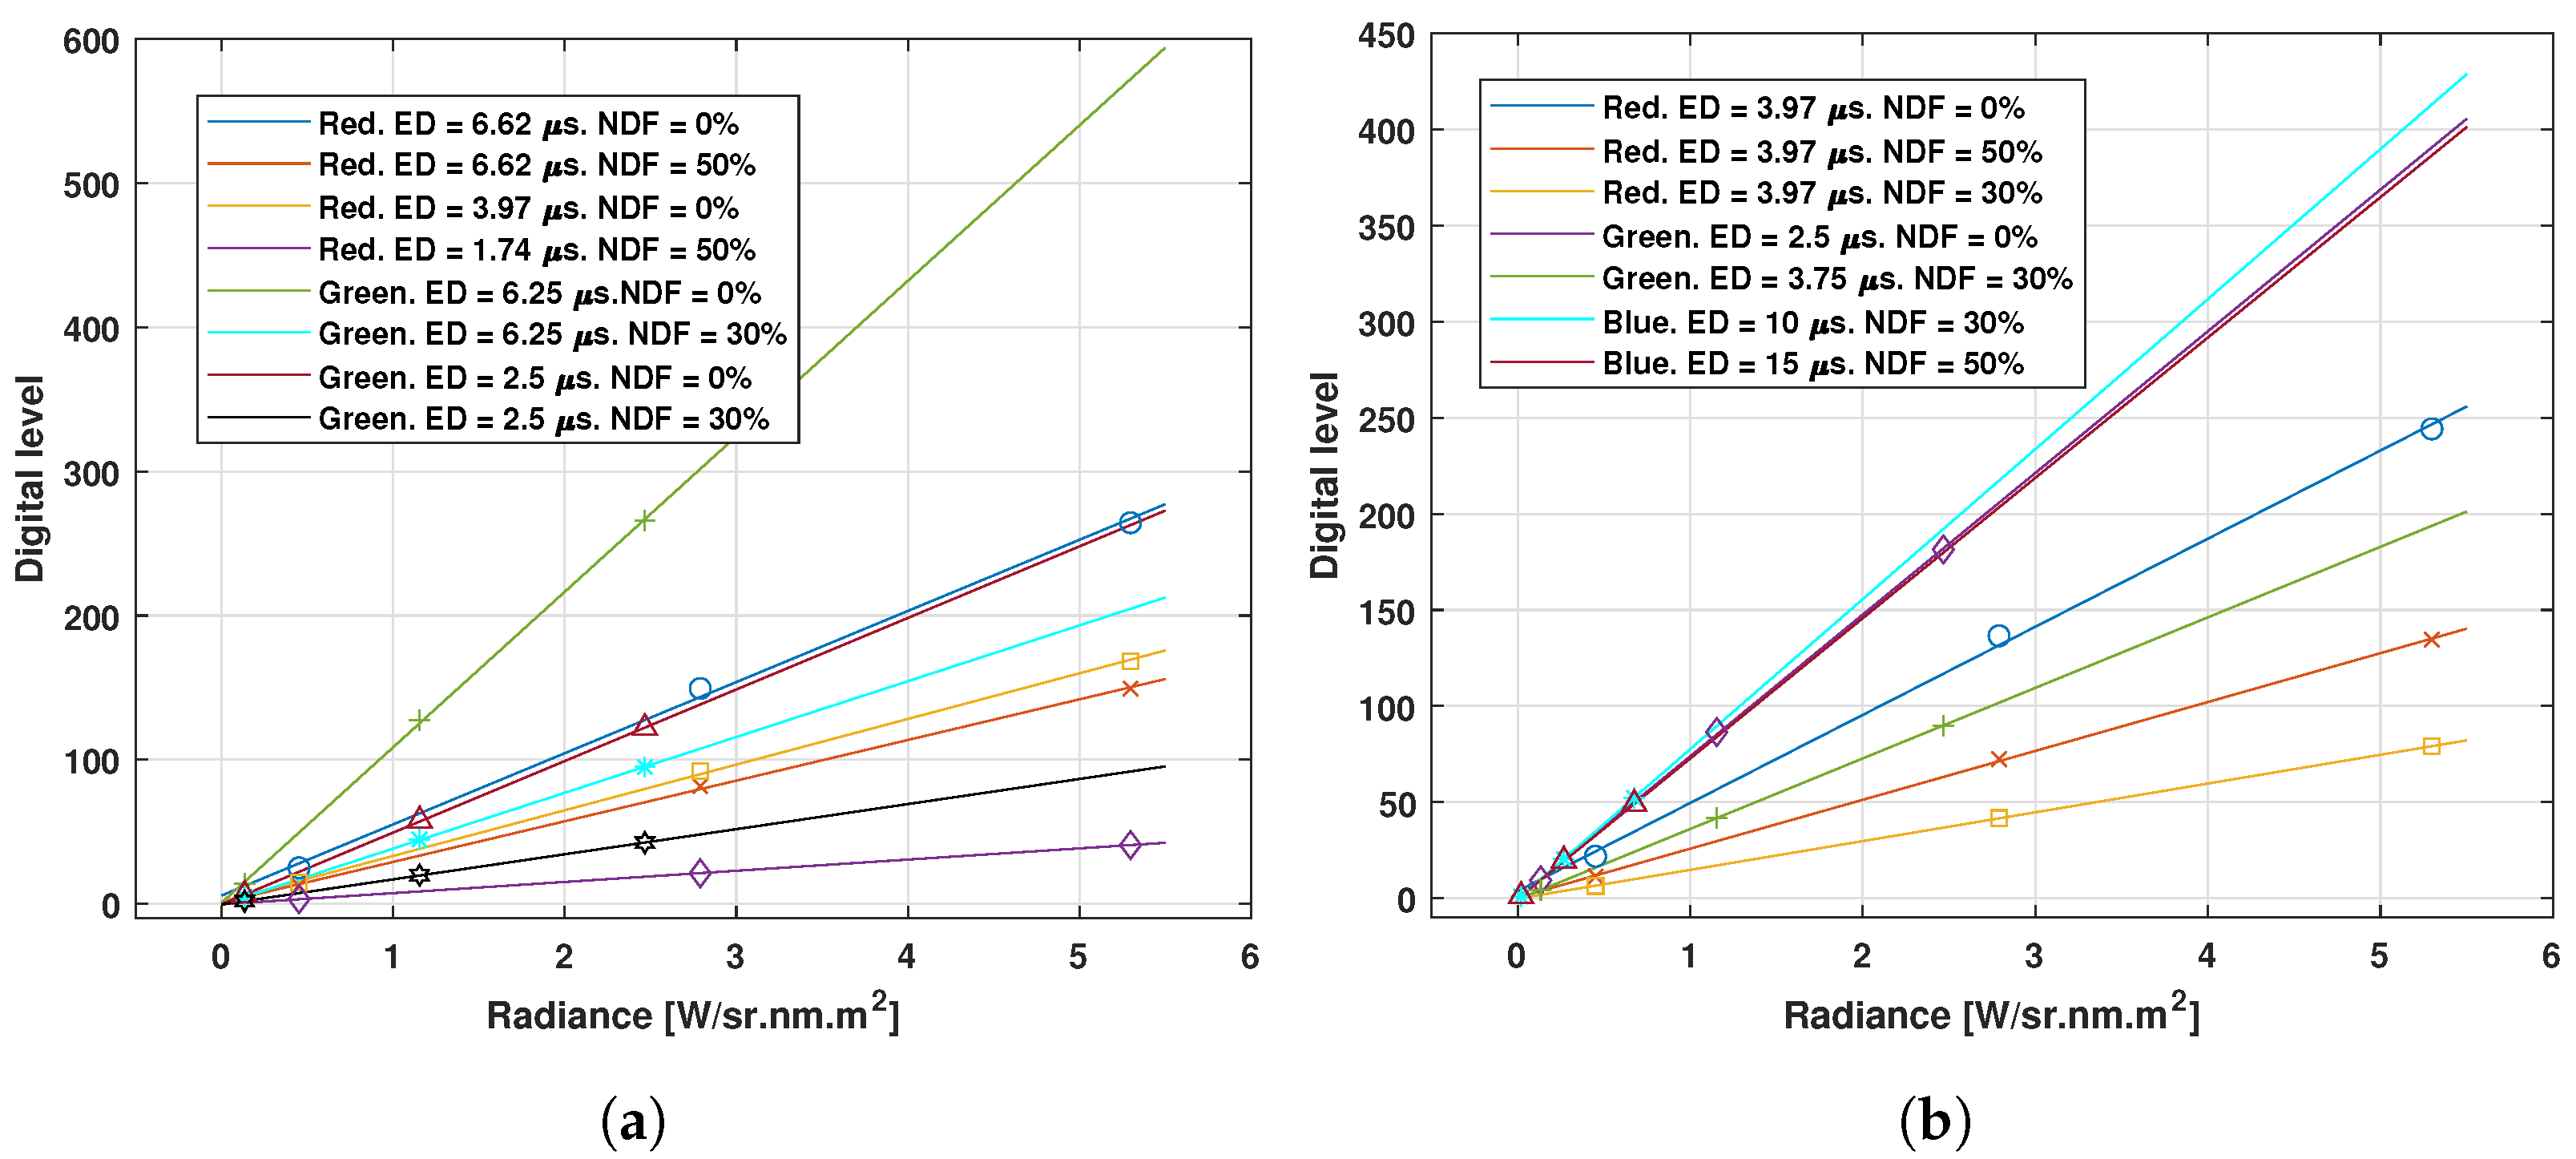
| Operating Points | Exposure Duration (Red) (s) | Neutral Density Filter Opacity (Red) (%) | Exposure Duration (Green) (s) | Neutral Density Filter Opacity (Green) (%) |
|---|---|---|---|---|
| Low soot | 6.62 | 0 | 6.25 | 0 |
| Low soot | 6.62 | 50 | 6.25 | 30 |
| Medium soot | 3.97 | 0 | 2.5 | 0 |
| Medium soot | 1.74 | 50 | 2.5 | 30 |
| High soot | 3.97 | 0 | 2.5 | 0 |
| High soot | 1.74 | 50 | 2.5 | 30 |
| Combination Filters | Operating Points | Exposure Duration (Red) (s) | Neutral Density Filter Opacity (Red) (%) | Exposure Duration (s) | Neutral Density Filter Opacity (%) |
|---|---|---|---|---|---|
| Red–Green | Low soot | 3.97 | 0 | 2.5 | 0 |
| Medium soot | 3.97 | 50 | 3.75 | 30 | |
| High soot | 3.97 | 50 | 3.75 | 30 | |
| Red–Blue | Low soot | 3.97 | 30 | 10 | 30 |
| Medium soot | 3.97 | 30 | 15 | 50 | |
| High soot | 3.97 | 30 | 15 | 50 |
Publisher’s Note: MDPI stays neutral with regard to jurisdictional claims in published maps and institutional affiliations. |
© 2022 by the authors. Licensee MDPI, Basel, Switzerland. This article is an open access article distributed under the terms and conditions of the Creative Commons Attribution (CC BY) license (https://creativecommons.org/licenses/by/4.0/).
Share and Cite
Corral-Gómez, L.; Armas, O.; Soriano, J.A.; Pastor, J.V.; García-Oliver, J.M.; Micó, C. An Optical Engine Used as a Physical Model for Studies of the Combustion Process Applying a Two-Color Pyrometry Technique. Energies 2022, 15, 4717. https://doi.org/10.3390/en15134717
Corral-Gómez L, Armas O, Soriano JA, Pastor JV, García-Oliver JM, Micó C. An Optical Engine Used as a Physical Model for Studies of the Combustion Process Applying a Two-Color Pyrometry Technique. Energies. 2022; 15(13):4717. https://doi.org/10.3390/en15134717
Chicago/Turabian StyleCorral-Gómez, Lis, Octavio Armas, José A. Soriano, José V. Pastor, José M. García-Oliver, and Carlos Micó. 2022. "An Optical Engine Used as a Physical Model for Studies of the Combustion Process Applying a Two-Color Pyrometry Technique" Energies 15, no. 13: 4717. https://doi.org/10.3390/en15134717