1. Introduction
Managing world energy production and consumption is the key to human longevity. Thus, international agreements such as the RIO+20 and the Paris Conference (COP-21), have established strategies and goals to reduce energy consumption and global emission levels. In an attempt to limit global warming to 2 °C, the COP-21 signatory countries are committed to drastically reducing the levels of CO
2 emissions, 70% of which are caused by the burning of fossil fuels [
1]. However, after a period of stability in CO
2 emission levels between 2014 and 2016, recent data show a regrowth tendency over the last couple of years, even though the COVID-19 pandemic scenario caused the levels of CO
2 emissions to reduce between 2019 and 2020.
The production resumption and consumption of goods recovery have raised the levels of CO
2 emissions to values higher than those reached before the pandemic, refs. [
2,
3]. Aiming to further press the countries to reduce their carbon dioxide emissions, the Glasgow Climate Pact (COP-26) was established, seeking to keep global warming to 1.5 °C and dictates the coal use reduction [
4].
Globally, the road transport sector is one of the main CO
2 emission sources. Among the OEDC (Organization for Economic Co-operation and Development) countries, the road transportation achieved an average of 26.6% of total CO
2 emissions in 2016 [
5]. Nevertheless, even in countries in which initiatives to increase energy efficiency and use renewable energy sources are well advanced, the road traffic sector has not contributed significantly to reducing CO
2 emissions. For instance, the overall emissions from Germany, converted into CO
2 equivalents, were reduced by 27% between 1990 and 2015, and the main sectors responsible for these reductions were the construction sector (34%) and industry (32%). The road traffic sector, on the other hand, achieved a reduction of only 2%, which even decreased to 0% at the end of 2016. According to [
6], the increase in CO
2 emissions levels, despite the reduction in fuel consumption per distance traveled, is attributed to the growing vehicular fleet. Globally, it is estimated that the number of cars worldwide will be around 2 billion by 2050.
Given the necessity to reduce the carbon dioxide emissions by the road transport sector, automotive companies have been researching and developing new technologies for internal combustion engines (ICE) over the last few years. The evolution of the engine’s design might be verified by the new technologies applied to modern propulsion systems, such as fuel direct injection (DI), turbochargers, variable valve actuation (VVA) systems, internal or external exhaust gas recirculation (I-EGR /E-EGR), variable compression ratio (VCR) systems, water injection (WI), among others [
7,
8,
9,
10]. Furthermore, these technologies have been used along with engine design concepts such as downsizing, down-speeding, and the most recent approach, rightsizing. While the engine downsizing and down-speeding concepts are currently well known by the engineering community, the rightsizing concept is not so widespread. In an overview, it can be defined as the engine displaced volume adequacy in relation to the vehicle weight in order to achieve the required results by the homologation cycles and a better vehicle drivability [
11,
12,
13].
Besides the aforementioned technologies and engine concepts, the use of alternative fuels, such as ethanol, has shown to be a promising way to reach the established levels of fuel consumption and pollutant emissions defined by international agencies. The physicochemical properties of ethanol, such as the high octane rating and the high latent heat of vaporization, allows the engine to operate at high load conditions with a lower knock tendency, which in turn makes possible the development of a turbocharged engine with a high volumetric compression ratio. As a result, there would be both an increase in the thermal efficiency of the engine and a reduction in CO
2 emission levels [
13,
14].
Worldwide, the ethanol production presented a continuous growth between 2012 and 2019, despite an 8.8% decrease in 2020 compared to 2019 [
15]. In Brazil, the ethanol production followed the same worldwide trend, showing an average growth of 6.1% between 2007 and 2019, followed by an average decrease of 7.9% between 2020 and 2021 [
16]. Therefore, it could be concluded that the resumption of the ethanol fuel production and consumption could assist the other strategies to reduce CO
2 emissions.
In Brazil, ethanol is known as hydrated ethanol or hydrated ethyl alcohol. It is mainly extracted from sugar cane and is composed by 94% of ethanol and 6% of water, on a volumetric basis [
17]. As an alternative to hydrated ethanol produced from sugar cane, other sources for hydrated ethanol production such as corn, sweet sorghum and biomass have been presented, aiming at competitive fuel prices and production stability during the sugarcane off-season [
18]. In order to comply with the international standards for energy consumption and pollutant emissions, the Brazilian government created two main programs called RenovaBio and Route 2030. RenovaBio aims to promote the expansion of biofuels in the Brazilian energy matrix and ensure fuel market predictability. Route-2030 aims to develop the automobile industry by reducing taxes, increasing energy efficiency and reducing vehicle pollutant emissions [
19,
20].
Among the recent articles exploring the use of ethanol in spark-ignition engines, Ahmed et al. [
21] found improved performance and lower pollutant emissions when using a 12% ethanol blend by volume in gasoline compared to the pure fossil fuel. Experimental tests in a single-cylinder engine revealed an average gain of 5.27% in brake torque, up to a 5% increase in thermal efficiency, and average reductions in CO and HC emissions by 22.35% and 32.20%, respectively. In a 1.5 L, 4-cylinder, naturally-aspirated engine operating at 2000 rpm, a 20% blend of ethanol in gasoline led to a 1.09 MPa in-cylinder pressure increase, producing lower combustion noise compared to pure gasoline [
22]. The homogeneous lean combustion of a modern downsized ethanol DI engine was evaluated by Golke et al. [
23]. At a fixed speed of 1500 rpm, the authors could test the engine under partial loads until the limit of lambda 1.4 with stable combustion, assessed through the COV of IMEP below 3.0%. The Ford Ecoboost 1.0 L engine showed up to 9.2% indicated fuel conversion efficiency gains when altering the lambda factor from 1.0 to 1.4.
Nowadays, despite the strong appeal for the use of electric vehicles (EVs), the spread of the growing technological development of ICEs remains very important for the sustainable future of mobility. This happens because in order to evaluate the environmental impact of EVs, it is essential to analyze their entire life cycle, from their production to battery recycling, rare metals and their extraction techniques and the power generation sources. Only 5% of the lithium-ion batteries are recycled and the mining activity needed to extract their rare minerals is still a concern, since the contamination of water and soil with heavy metals constitutes large-scale pollution and security issues. Beyond that, 65% of global electricity still comes from the burning of non-renewable fossil fuels. In addition, electric vehicles are only CO
2-free if their electric power comes from renewable sources, which is also true for ICE vehicles fueled by biofuels, such as ethanol [
24].
Hence, it is clear that the association between electric vehicles and sustainability is not necessarily correct (although often used by stakeholders to promote electric mobility, with questionable intentions). For instance, when addressing a holistic and cognitive approach to vehicle sustainability, Zöldy et al. [
25] report that, beyond the use phase, the precepts of sustainable development should be deemed during design, production, and waste management. As the literature shows, the sustainability concept has different dimensions, such as environmental, economic, social, and cultural, and its analysis should not be simplified or limited to a certain type of vehicle propulsion system. According to Andersson et al. [
26], the transition to a more sustainable transportation should not disregard the consumer’s cost perception, which is preponderant in the decision-making process. This is one of the factors that lead Gonçalves et al. [
27] to state that, for future Brazilian mobility, the use of ethanol in flex-fuel vehicles is still the best solution when managing economic, environmental, social, and infrastructure aspects.
In Brazil, the first ethanol-fueled engines were launched in the market in the 1970 s as a result of the Proalcool government program. However, at that time, these engines were basically gasoline engines with a high compression ratio and a colder spark plug, without any further updates for the proper use of the ethanol as a fuel option. Posteriorly, the flex-fuel engine technology was created. A flex-fuel engine is able to run using gasoline, ethanol or any proportion of them. Despite the advantages of a flex-fuel ICE, there is a problem related to the lack of ideal performance and specific fuel consumption for ethanol and gasoline, which highlights the need for engine optimization for each kind of fuel [
13,
28].
In this context, the development of a novel internal combustion engine employing modern design concepts, equipped with state-of-the-art technologies and conceived to operate with the exclusive use of ethanol as a fuel, is understood as an innovative and promising pathway for Brazilian future mobility, from both technological and sustainability perspectives. Therefore, this work presents a method to establish the engine main dimensions such as displacement, volumetric compression ratio, cylinder bore, bore pitch, stroke-to-bore ratio, crank stroke, crank radius, connecting rod ratio, piston and crankshaft offset and piston true-stroke as part of the initial process for a novel prototype engine (
Figure 1). This new engine aims to use Brazilian ethanol as fuel, assisted by water injection in order to achieve the full spark authority condition. Furthermore, a 1D model was developed in order to obtain the predicted indicated engine performance and evaluate the influence of the water injection approach on it.
2. Methods
2.1. Engine Displacement Limit and Number of Cylinders
During the last few years, most of the engine development has followed the downsizing engine concept; however, recent research pointed to rightsizing as the future tendency. The rightsizing engine concept has an aim to achieve a better balance between engine displacement and its vehicle application. A better compromise between engine required performance and its vehicle application could lead to lower fuel consumption, reduced engine production costs, reduced engine mechanical stress and improved durability.
For the Brazilian market, the engine rightsizing concept faces an economic barrier. In order to encourage low-cost vehicle purchases, the Brazilian government established the vehicle manufacturing tax IPI (from Portuguese—
imposto sobre produto industrializado) according to the engine displacement. As shown in
Table 1, a vehicle equipped with a flex-fuel engine of up to 1.0 L displacement pays 4% less tax than a vehicle equipped with engine displacement higher than 1.0 L. Thus, in the case of a highly boosted 1.0 L engine applied to a premium vehicle, such as an SUV (sport utility vehicle), it could lead to a cheaper and more efficient vehicle, compared to a larger displacement, naturally-aspirated engine [
29]. Based on the economic advantage to use an engine up to 1.0 L, along with the ethanol fuel properties, which allow the engine to run efficiently at high loads, the displacement of 1.0 L was defined for the engine developed in this work. Furthermore, in order to keep the engine as compact as possible, a 3-cylinder engine was designed, despite the vibrational stress of the crankshaft due to its first order moment.
2.2. Volumetric Compression Ratio
The definition of the volumetric compression ratio for the engine developed in this work considered several studies, such as [
9,
13,
30,
31], which investigated the use of hydrated ethanol as fuel along with different engine technologies. In conclusion from these works, it was realized that an ethanol-fueled engine is able to run efficiently on high boost pressures and high volumetric compression ratios, due to the fuel heat of vaporization. Furthermore, the results from these investigations showed that the combustion process on the MBT (maximum brake torque) condition has a higher contribution to the engine fuel conversion efficiency than the volumetric compression ratio. Thus, the most suitable volumetric compression ratio would be as high as possible, provided that it ensured a regular combustion process, with an upper limit characterized by the knock occurrence.
Considering the technologies applied to the engine designed in this work, such as fuel direct injection and port water injection, as well as the results from previous studies reported in the literature, a 14:1 volumetric compression ratio was defined.
2.3. Cylinder Bore and Bore Pitch
The cylinder bore pitch depends on the arrangement of cylinder head studs, crankcase sleeves upper support dimensions and its cooling gallery design, and sufficient crankshaft fatigue strength. According to [
32], the bore pitch, BP in mm, can be calculated in function of the cylinder bore using Equation (1), and large values are recommended for engines operating with higher combustion pressure, in order to promote adequate cooling between the engine cylinders. For a 4-valve engine fitted with a single piece cylinder head, a bore pitch factor,
, from 1.21 to 1.25 is recommended [
32].
where
B is the cylinder bore in mm.
Considering the scarcity of articles that present the entire engine development and optimization, the works presented in the
Internationales Wiener Motorensymposium were adopted as references for the engine bore definition. Evaluating the bore size of the engines presented in the symposium throughout the last few years, taking into account only engine displacements up to 1.0 L, it could be concluded that majority of the bore size diameters were between 70 and 74 mm, as shown in
Table 2 [
33,
34,
35,
36]. Considering the average bore diameter of the engines presented in
Table 2 and keeping the engine dimensions as simple as possible, 71.5 mm was established as the bore size of the engine designed in this work.
Considering 1.23 as the average of the suggested bore pitch factor and the cylinder bore of 71.5 mm, the bore pitch was calculated according to Equation (2).
The cylinder bore pitch calculated value of about 88 mm is commonly observed in several downsized engines developed by the Volkswagen (VW) company, based on the downsized engines presented in the International Vienna Motor Symposium. Therefore, considering the observed bore pitch values trend from the VW engines and the aforementioned assumptions to calculate the cylinder bore space, an 88 mm value was defined as the bore pitch to be applied in the engine designed in this work [
37].
2.4. Stroke-to-Bore Ratio
The stroke-to-bore ratio (
S/
B) is one of the most important parameters that affect the SI (spark ignited) engine fuel conversion efficiency and it can be calculated using Equation (3). In general, a higher
S/
B ratio leads to a higher thermal efficiency through a faster combustion process and a lower overall combustion chamber heat loss. However, a higher
S/
B ratio also increases the engine friction losses, mainly at high engine speeds, which in turn diminishes the thermal efficiency gains. These conclusions are presented in several studies, such as [
38,
39,
40,
41].
where
S is the engine stroke in mm.
The faster combustion process achieved with a higher S/B ratio is related to the turbulence intensity achieved during the intake and compression strokes, which is produced due to the higher flow mean velocity, as a consequence of a greater piston speed and a higher intake flow velocity in the long-stroke engine. The drawbacks of both higher intake flow velocity and higher turbulence intensity on the engine volumetric efficiency can be diminished by means of a turbocharger. The lower combustion chamber heat loss, as a result of the higher S/B ratio, is achieved due to the lower combustion chamber area-to-volume ratio. More specifically, the higher S/B ratio leads to a higher burning flame front area per unit of the combustion chamber volume. The increase in the friction losses as the S/B increases has, as the main source, the piston ring pack, due to the longer piston displacement.
According to the results presented in the studies [
38,
39,
40,
41], the engine fuel conversion efficiency improvements showed non-linear behavior as the
S/
B ratio increased. Furthermore, the positive fuel conversion efficiency gains were not significant for
S/
B ratios further than 1.2, as shown in
Table 3. Based on the results presented by the aforementioned authors, it was defined that the
S/
B ratio of 1.2 would be applied in the engine developed in this work.
2.5. Engine Crank-Stroke and Crank-Radius
The engine crank-stroke is also called engine stroke when the engine has no piston or crankshaft offset. The engine crank-stroke
S, in mm, can be calculated using Equation (4).
where
r is the crank-radius in mm.
Combining Equations (2) and (3), along with the bore and stroke-bore ratio previously defined, the crank-radius was calculated according to Equation (5).
In order to maintain the engine calculated values as simple as possible without any significant changes to the engine design, the crank-radius was considered as 43 mm for the engine designed in this work.
It is worth pointing out that it was intended that one would apply piston and crankshaft offsets in the cranktrain mechanism of the engine designed in this work, which affects the piston stroke. Furthermore, in the case of an offset crank-slider mechanism, the connecting rod ratio must be considered for the engine true-stroke calculation.
2.6. Connecting Rod Ratio
The connecting rod ratio is an important parameter that affects the piston kinetic performance throughout the engine strokes. The connecting rod ratio is calculated using Equation (6).
The piston instantaneous position, velocity, and acceleration are directly affected by the connecting rod ratio. It could be considered as a percentage increase in the piston velocity and acceleration over the uniform circular motion of the cranktrain mechanism.
The ideal thermodynamic Otto working cycle has the heat introduced at a constant volume. Thus, an engine with a lower connecting rod ratio promotes a higher piston dwell time at the TDC (top dead center), which in turn could lead to a combustion process towards the ideal working cycle condition. On the other hand, a higher piston dwell time at the TDC could lead to a higher heat loss from the combustion flame front to the piston crown [
42]. Furthermore, the engine running with a higher piston dwell time at the TDC can induce high combustion noise, also called the sound of efficiency, due to the pressure rise rate [
43,
44].
Besides engine thermal efficiency, the connecting rod ratio affects the engine running smoothness. Considering the engineering range application with the connecting rod ratio up to 1.0, it was presented by ref. [
45] that connecting rod ratios larger than 0.263 start to promote a dual minimum acceleration behavior and the connecting rod ratio of 0.357 promotes the minimum acceleration on the piston dynamic behavior.
The engine friction loss is another parameter influenced by the connecting rod ratio. Based on Equation (7), it can be concluded that a lower connecting rod ratio leads to a lower connecting rod pivot angle
ψ, in rad, which in turn reduces the normal (lateral or side) piston force, and hence the engine FMEP (friction mean effective pressure). However, the engine FMEP can increase in case of an excessive low connecting rod ratio. According to ref. [
46], the FMEP increase is related to a smaller load bearing area of the piston skirt, as a consequence of the lower piston normal force. A proper piston skirt deformation leads to a wider load bearing area, and thus prevents friction from increasing.
In summary, a proper connecting rod ratio is a balance among its effects on the engine thermal efficiency, the engine running smoothness, and the engine friction. Thus, the connecting rod ratio defined for the engine developed in this work was 0.295.
Figure 2 presents a comparison of the piston acceleration curve related to various connecting rod ratios for a non-de-axed cranktrain mechanism.
In order to minimize the heat losses from the combustion flame front to the piston crown due to the lower connecting rod ratio, a TBC (thermal barrier coating) was applied on the piston crown using ceramic-based material.
Considering the previously defined values for crank radius and connecting rod ratio, the connecting rod length was calculated using Equation (8).
2.7. Piston Pin and Crankshaft Offset
Additional engine friction reduction can be achieved by applying an offset to crankshaft toward the major thrust side of the piston. By offsetting the crankshaft center with respect to the cylinder center line, the piston side force distributes appropriately on either thrust or anti-thrust side. Thereby, the piston friction is reduced effectively by offsetting the crankshaft center, as presented in ref. [
44].
The studies presented by [
46,
47] concluded that the crankshaft increase leads to the piston friction reduction up to a certain level, in which the piston normal force is not the major factor on the piston friction and the friction reduction, as a result of the crankshaft offset, is more pronounced at a low engine speed and low engine load, respectively. The crankshaft offset for a passenger car engine with a maximum speed of around 5500 rpm should be in a range from 5 to 10 mm. A crankshaft offset of 5 mm would minimize the engine power loss at a high engine load and speed, whereas a 10 mm crankshaft offset would improve the engine performance at partial loads and lower engine speed operation conditions.
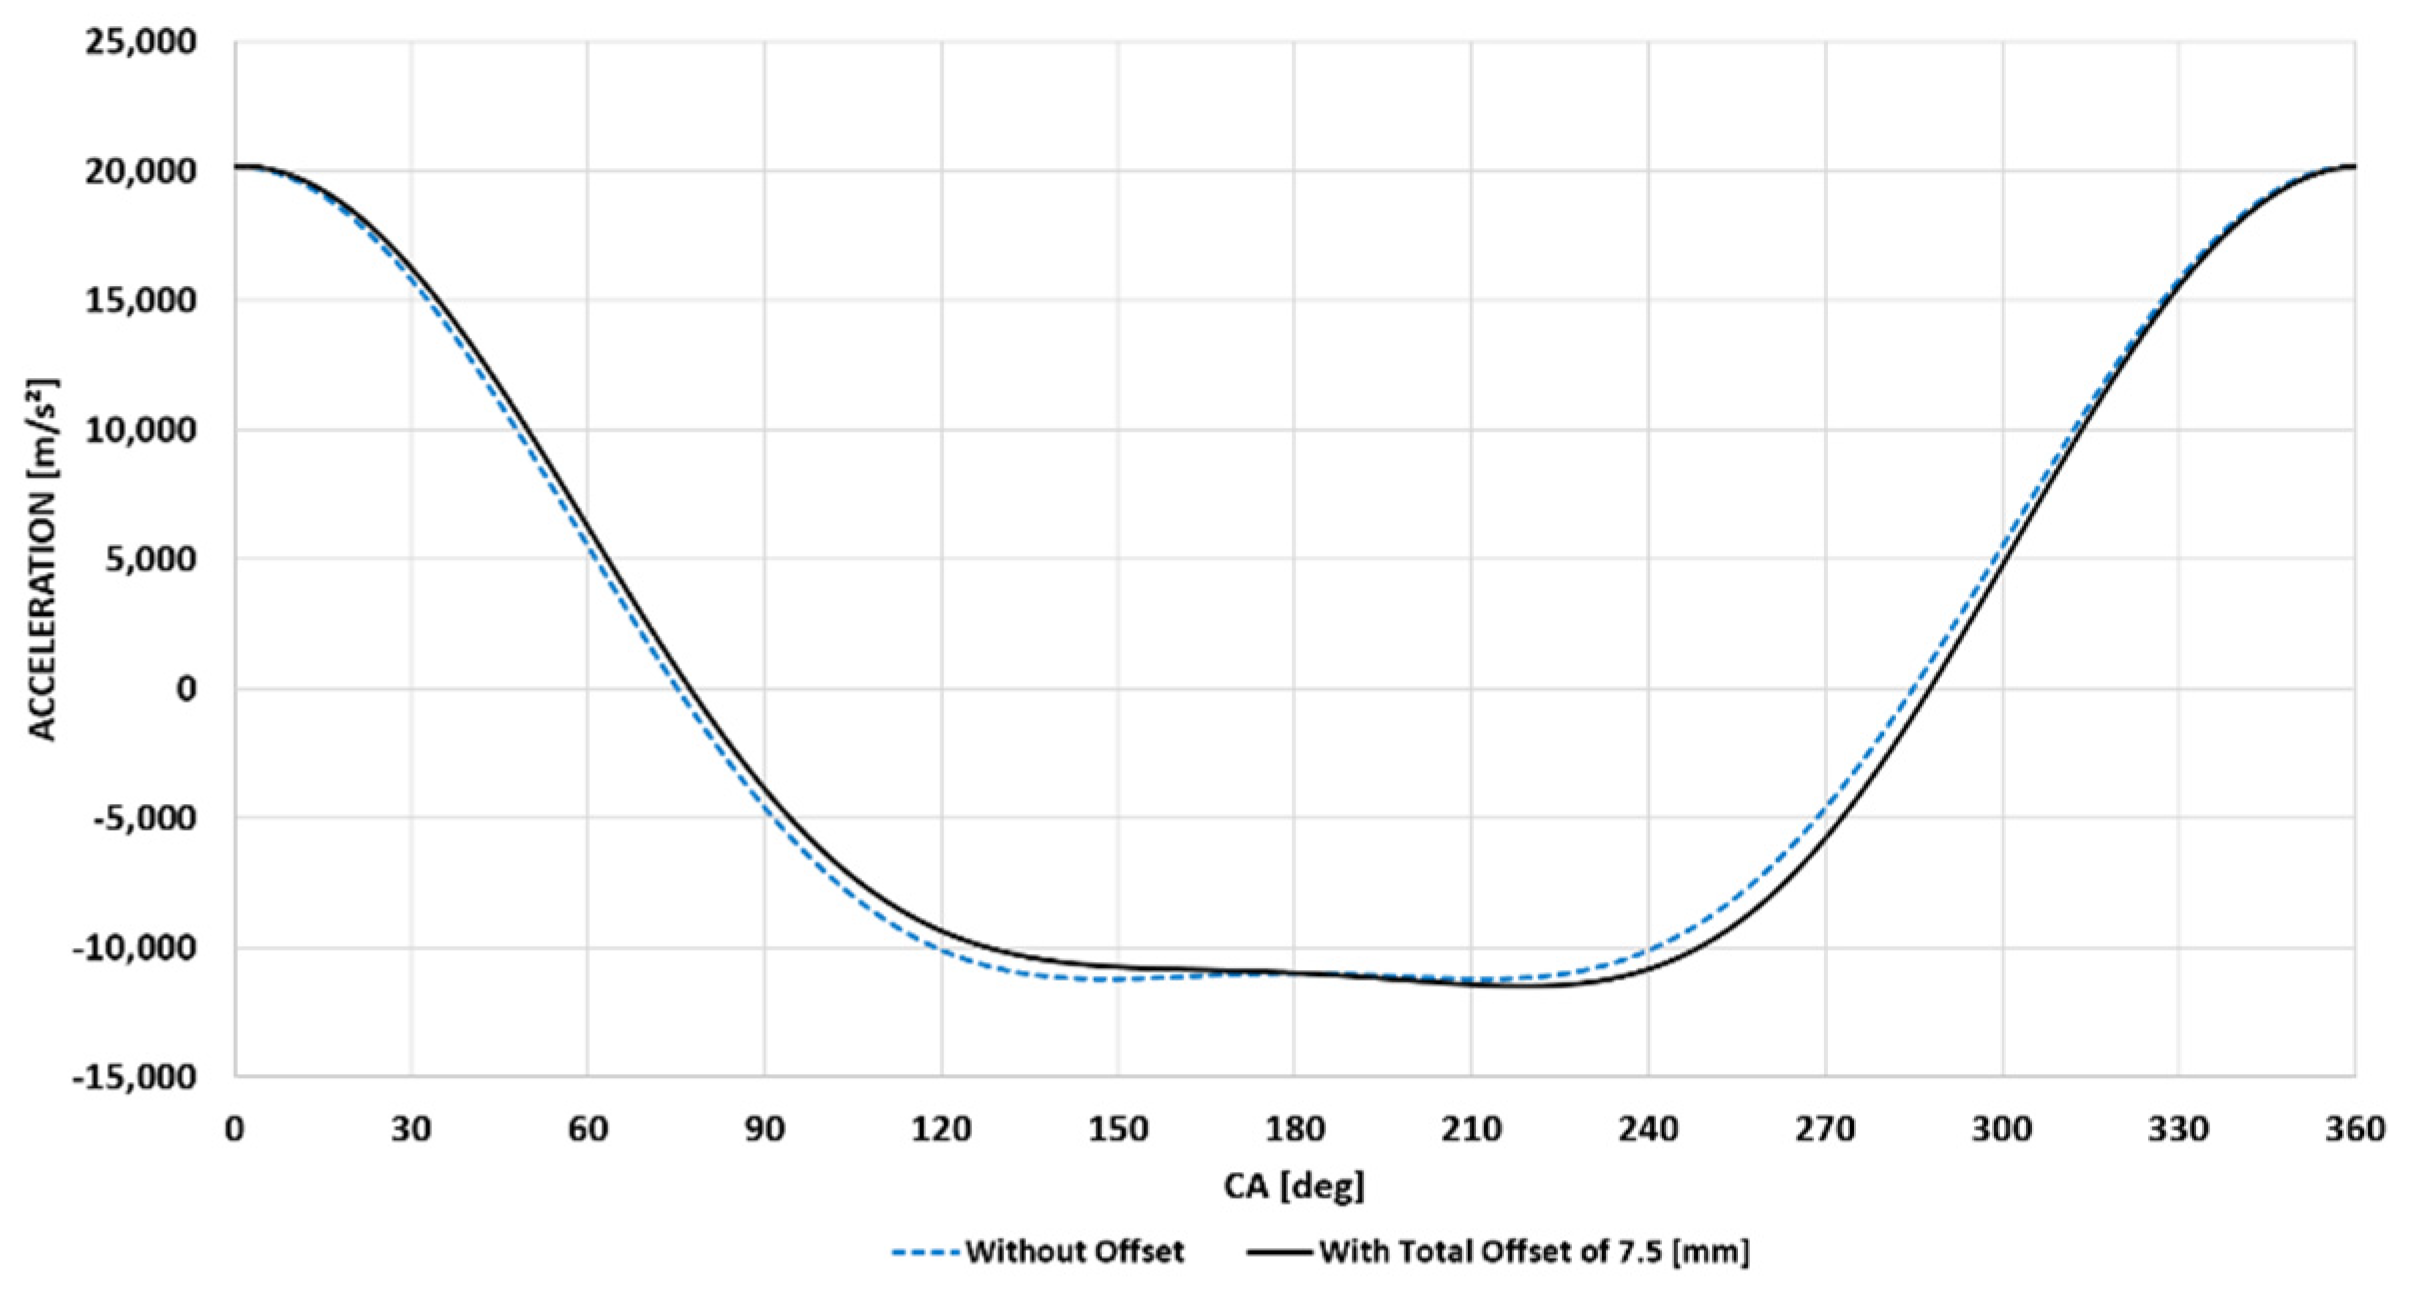
In addition to the piston lateral force, the crankshaft offset also affects the piston instantaneous displacement, velocity, and acceleration throughout the engine strokes. As shown in
Figure 3, a crankshaft offset of 10 mm leads to a higher piston acceleration during its movement from TDC to BDC (bottom dead center) and, on the other hand, it leads to a lower piston acceleration during its movement from BDC to TDC. A higher piston acceleration from TDC to BDC can improve the engine thermal efficiency by reducing the heat losses to the piston crown. However, the lower piston acceleration from BDC to TDC may affect the flow turbulence dissipation throughout the compression stroke, leading to large turbulence eddies at piston TDC. In addition to piston dynamic changes, the crankshaft offset drifts the piston TDC to a delayed position related to the crankshaft angle. Hence, the combustion process is affected by the in-cylinder instantaneous volume change.
In order to minimize the engine noise, an offset was applied to the piston pin. However, the crankshaft offset along with the piston offset affects the piston friction. The piston pin offset combined with the combustion force determines the moment magnitude of the piston secondary movement. Thus, a greater moment about the pin axis increases the piston tilt, which in turn reduces the oil hydrodynamic film development between the piston skirt and cylinder wall, increasing friction. The crankshaft offset changes the timing when the piston position moves from the anti-thrust side to the thrust side from near TDC to the middle stroke, at which the piston has high speed and the oil film is already formed [
46,
48].
The total engine offset
y, in mm, is given by the difference between the crankshaft offset and the piston pin offset. Nevertheless, the engine total offset is expressed as a function of the connecting rod length as shown by Equation (9).
According to the definition of Volkswagen and to use the following equations, the parameter ±e should be positive in case of an offset towards the anti-thrust side and negative in case of an offset towards the thrust side [
49].
Considering the effects of the crankshaft offset on the engine performance, the application of the engine developed in this work for a passenger car, and seeking a smaller piston secondary movement moment, a crankshaft offset of 8 mm and a piston pin offset of 0.5 mm towards the major thrust side were defined. Therefore, the cranktrain presents a total crankshaft offset of 7.5 mm.
2.8. Engine Stroke (Piston True Stroke)
The engine stroke of a cranktrain mechanism, considering the crankshaft and piston offset, is calculated using Equation (10). For this type of cranktrain, the engine stroke is also called piston true stroke.
By substituting the aforementioned crank radius, connecting rod ratio and total cranktrain offset as a function of the connecting rod ratio in Equation (10), a piston true stroke of 86.1 mm was obtained.
2.9. Engine Indicated Performance Targets
The indicated performance targets defined for the engine designed in this work were established, aiming to take advantage of hydrous ethanol properties that allow the engine to run at higher loads and use the water injection for further performance improvements. As a reference, the engine performance results achieved by ref. [
30] were used. In this work, the engine achieved a maximum IMEP (indicated mean effective pressure) of 33 bar, albeit there was a margin for further improvements if a more adequate turbocharger could be used. In the present work, 35 bar of IMEP was defined as the load target, considering the engine cylinder head port and valve arrangements, combustion chamber geometry and the new turbocharger. Considering an IMEP of 35 bar and the engine displacement defined in
Section 2.1, the engine indicated torque can be calculated using Equation (11).
For the engine peak power, the value of 135 kW was defined based on the engine power predicted in ref. [
21] for the newly designed turbocharger at 5500 rpm. Furthermore, an additional 250 rpm after the engine peak power speed as the maximum engine speed was established. Thus, the maximum engine speed of the engine developed in this work was defined as 5750 rpm.
2.10. Engine Specification Summary
After all the engine main data calculations, the engine specification can be summarized as shown in
Table 4.
2.11. The 1D Numerical Simulation Model
The numerical simulation has been largely used to predict the engine structural, thermal, and fluid dynamic performance. Based on an engine CAD (computer-aided design) model, several interactions among engine systems are performed throughout the engine design process. The main goal of using numerical simulation is to reduce the overall time and cost required to develop or optimize an engine.
The computational fluid dynamics (CFD) approach divides a domain into smaller pieces; evaluates the main fluid properties in each one and its interaction with the neighboring pieces. However, instead of using finite elements, the CFD method uses the finite volume method (FVM) for the flow domain discretization. For each finite volume, the equations of mass, momentum and energy conservation at the center of the volume are applied in order to calculate the fluid scalar properties such as pressure, temperature, density, internal energy, enthalpy and species concentration. The vector properties (mass flow, flow velocity, etc.) are calculated at the volume boundary [
50,
51].
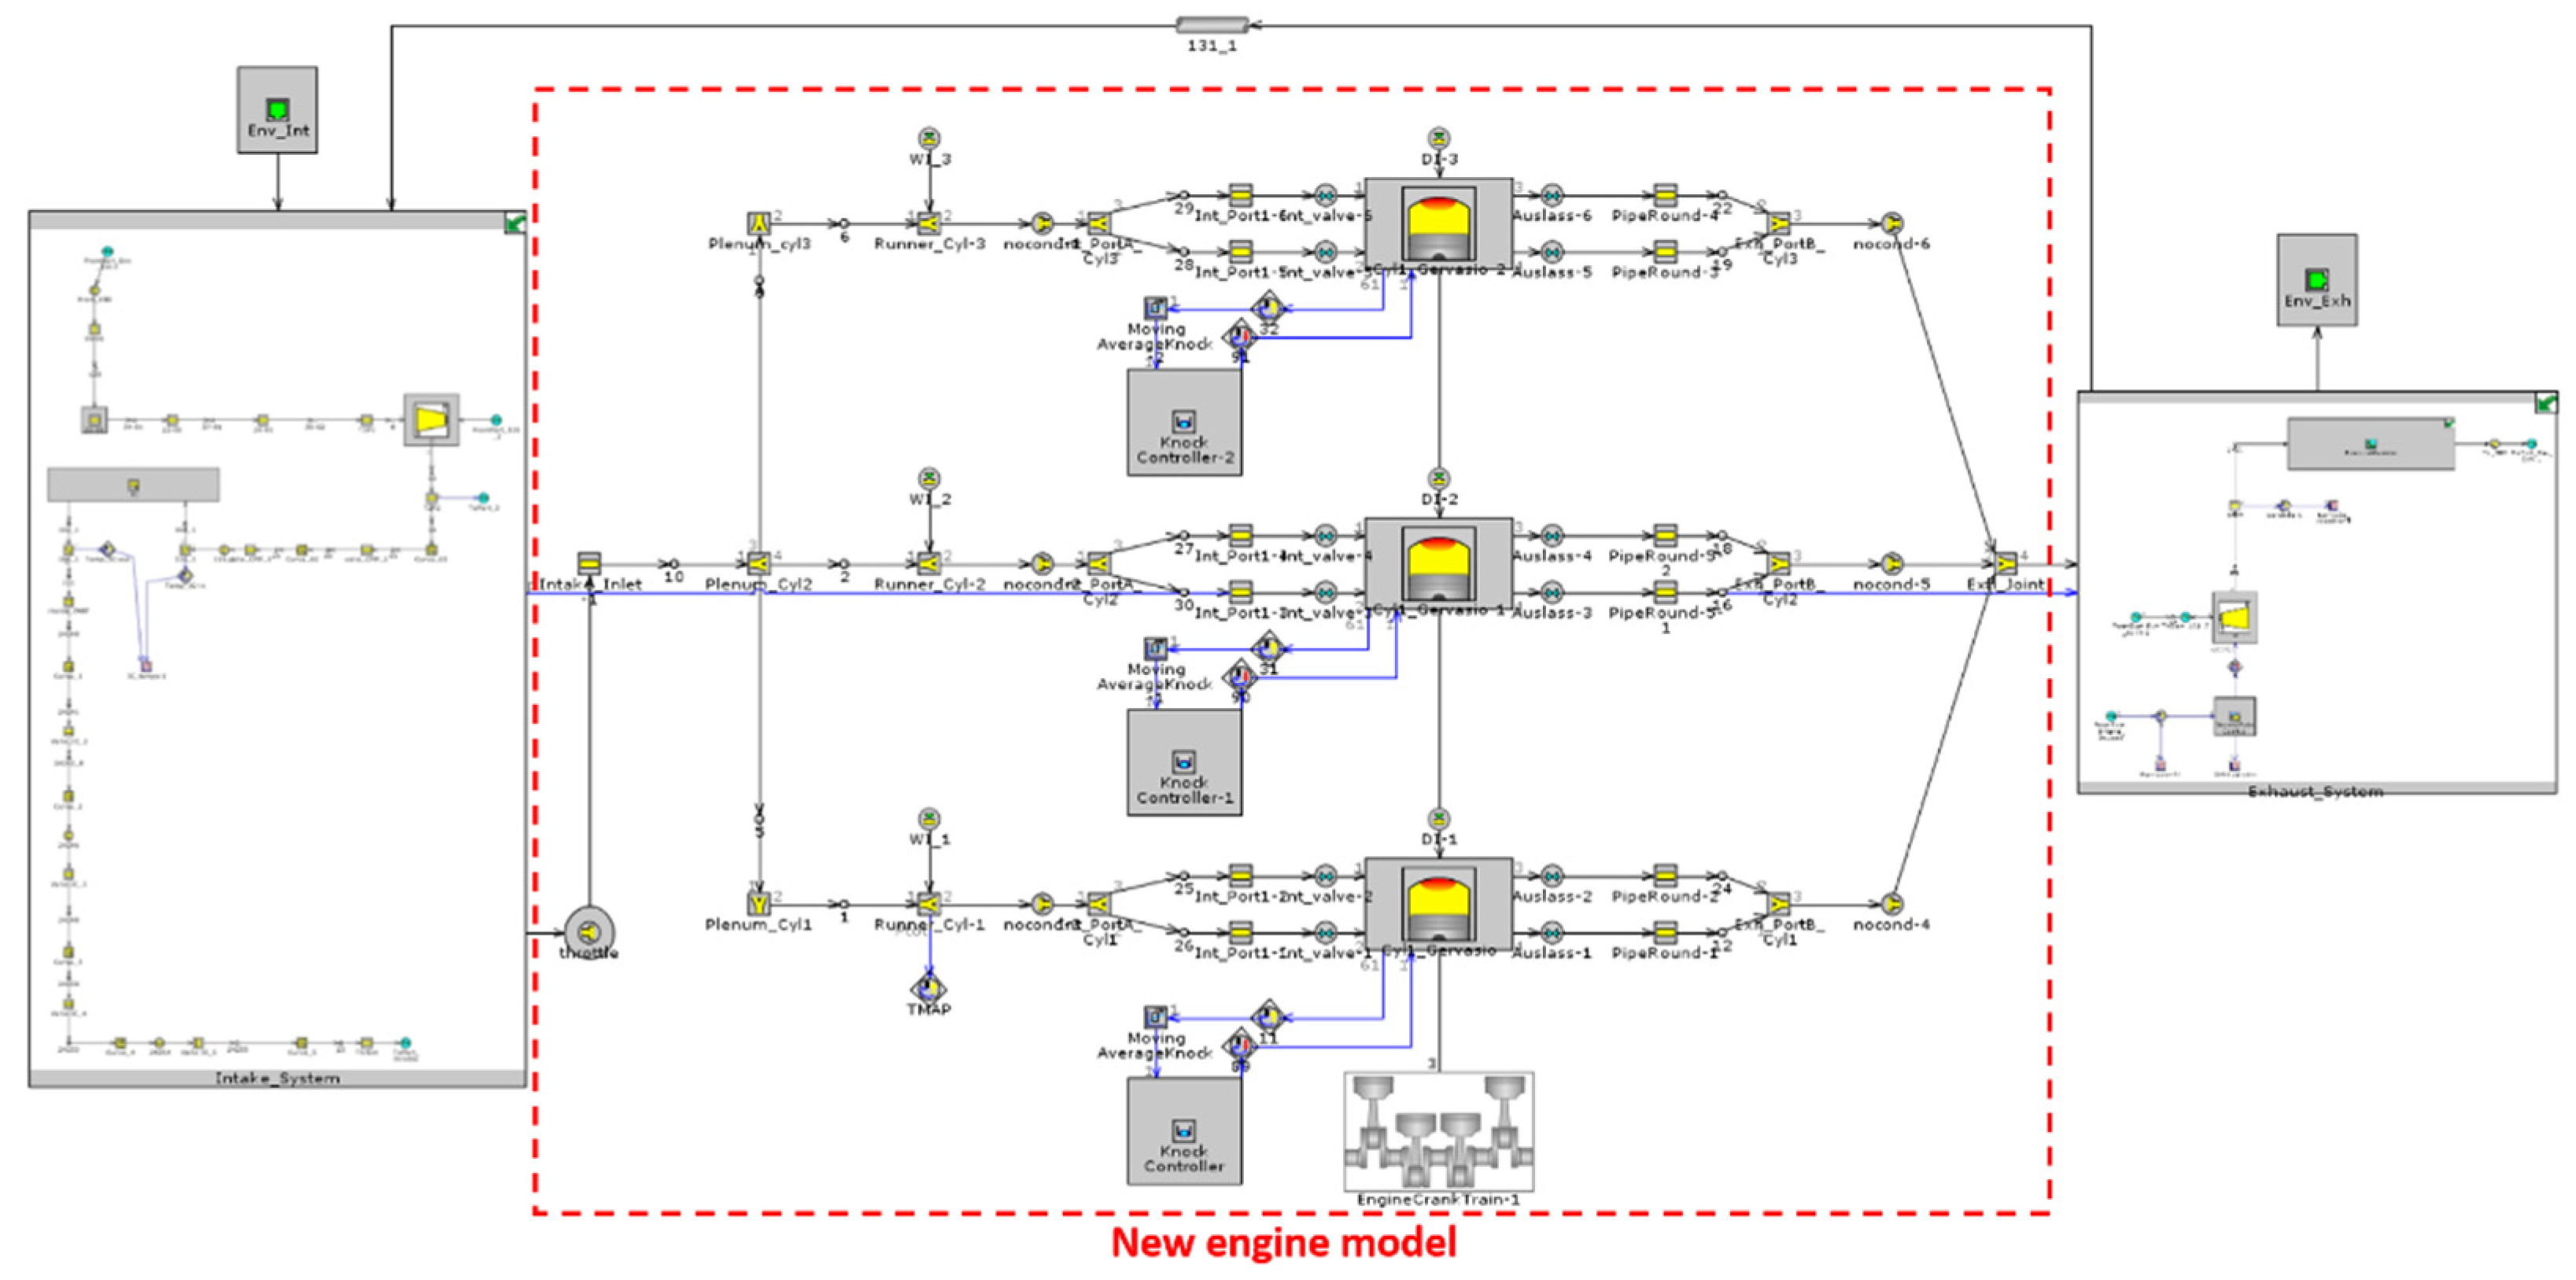
For the 1D numerical simulation, the GT-Suite software was used, whose choice is justified by its robust simulation tools and its user-friendly interface. The 1D model built in this work was based on the engine 3D geometry, which physically defines the system’s load losses, employing the vehicle intake and exhaust systems used in the engine model presented by ref. [
30]. Thus, the main engine model was constructed from the throttle body inlet to the exhaust ports outlet, as shown in
Figure 4.
The main numerical model inputs used were as follows: engine friction, engine coolant, lubricant oil and intake air temperatures, fuel properties, the exhaust backpressure as the first reference value and the intake manifold pressure, intake and exhaust valve timing and the water mass injected to assist the combustion process.
The predicted engine friction input was taken from ref. [
30]. However, as it was intended to fit the engine with modern accessory drive, the engine friction input was only used to make the simulation run. For the engine coolant and lubricant oil temperature, the values were 90 °C and 110 °C, respectively. The intake air temperature boundary condition was defined as 50 °C, considering the modern water cooler air charge (WCAC) system fitted in the vehicle, which was able to maintain the temperature required throughout the entire engine running conditions. As previously mentioned, the engine developed in this work runs exclusively on Brazilian ethanol (E100) by means of a DI system. Thus, the Brazilian ethanol properties presented in
Table 5 were configured into the model. Furthermore, all the engine simulation was conducted for a stoichiometric air-fuel mixture.
The exhaust backpressure values on the first simulation loop were predicted based on a 3-cylinder engine, which is fitted with a similar cylinder head designed with integrated exhaust manifold technology. However, the exhaust backpressure values were extrapolated for the higher gas mass flow (air plus fuel) rate achieved by the engine of this work. For the intake manifold pressures, the first estimated values took into account the predicted air mass flow required to achieve the engine target performance and the boost pressures achieved by ref. [
30].
To determine the intake and exhaust valve timings, an optimization tool available in the GT-Power software was used, which was configured to maximize the engine volumetric efficiency by varying the intake and exhaust valve timings within the VVA phaser limits used for this project, as shown in
Figure 5. The VVA phaser used in this work was provided by Hilite and has a continuous moving range of 40° CA. During the valve timing optimization procedure, the engine was considered to be running in a motoring condition and the inlet and outlet air state as a simple boundary condition.
The water was injected into the engine intake runners and its injected mass was defined as a ratio between the water and the fuel mass supplied to the engine. The parameter water-to-fuel ratio (WFR) was defined to illustrate this relation. The water temperature was defined as 25 °C and a differential pressure of 5 bar related to the intake manifold pressure was defined for water injection pressure. The water injection aim is to assist the combustion process and promote a full spark authority. Benefits from the water injection use were also presented by refs. [
30,
53,
54,
55,
56,
57]. Therefore, the amount of water injected was established in order to place the MFB50% (mass fraction burned) at 8.0° CA. The first WFR values configured in the model were calculated based on the linear response of water consumption associated with the load increase presented by ref. [
30].
For the combustion process, the combustion model presented by ref. [
58] was used. However, the model was adapted to the engine developed in this work. Furthermore, it was included in the model a knock controller in order to manage the knock onset during the engine simulation. The knock controller is based on the model developed by Douaud and Eyzat (1978) [
59], and its output value was used in a PID (proportional integral derivative) controller to change the spark timing input of the engine model. The knock model was validated considering the experimental data obtained by ref. [
30].
Table 6 presents a comparison from ref. [
30] and the predicted performance for the engine developed in this work at 2500 rpm and 33 bar of IMEP.
Several turbocharger maps, provided by BorgWarner, were used throughout the turbo-matching procedure. Due to engine requirements to achieve high torque values at a low engine speed and high power output, a VTG (variable turbine geometry) was chosen to be used in the engine. Some advantages arising from the use of a VGT were presented by [
60,
61]. The VGT position related to each engine operation condition was established using the optimization tool available in GT-Power. The optimization was configured to target the required air mass flow for the engine performance, minimizing the exhaust backpressure. During the VGT position optimization process, the intake air was modeled as a simple boundary condition and the complete exhaust system was used. Once the VGT positions were established, the compressor feature along with the entire intake system were included in the model and several compressor maps were evaluated to avoid a compressor surge and choke condition throughout the engine simulation. Furthermore, it was intended that one would place the higher compressor polytropic efficiencies in a range of the most common speeds predicted for this engine application.
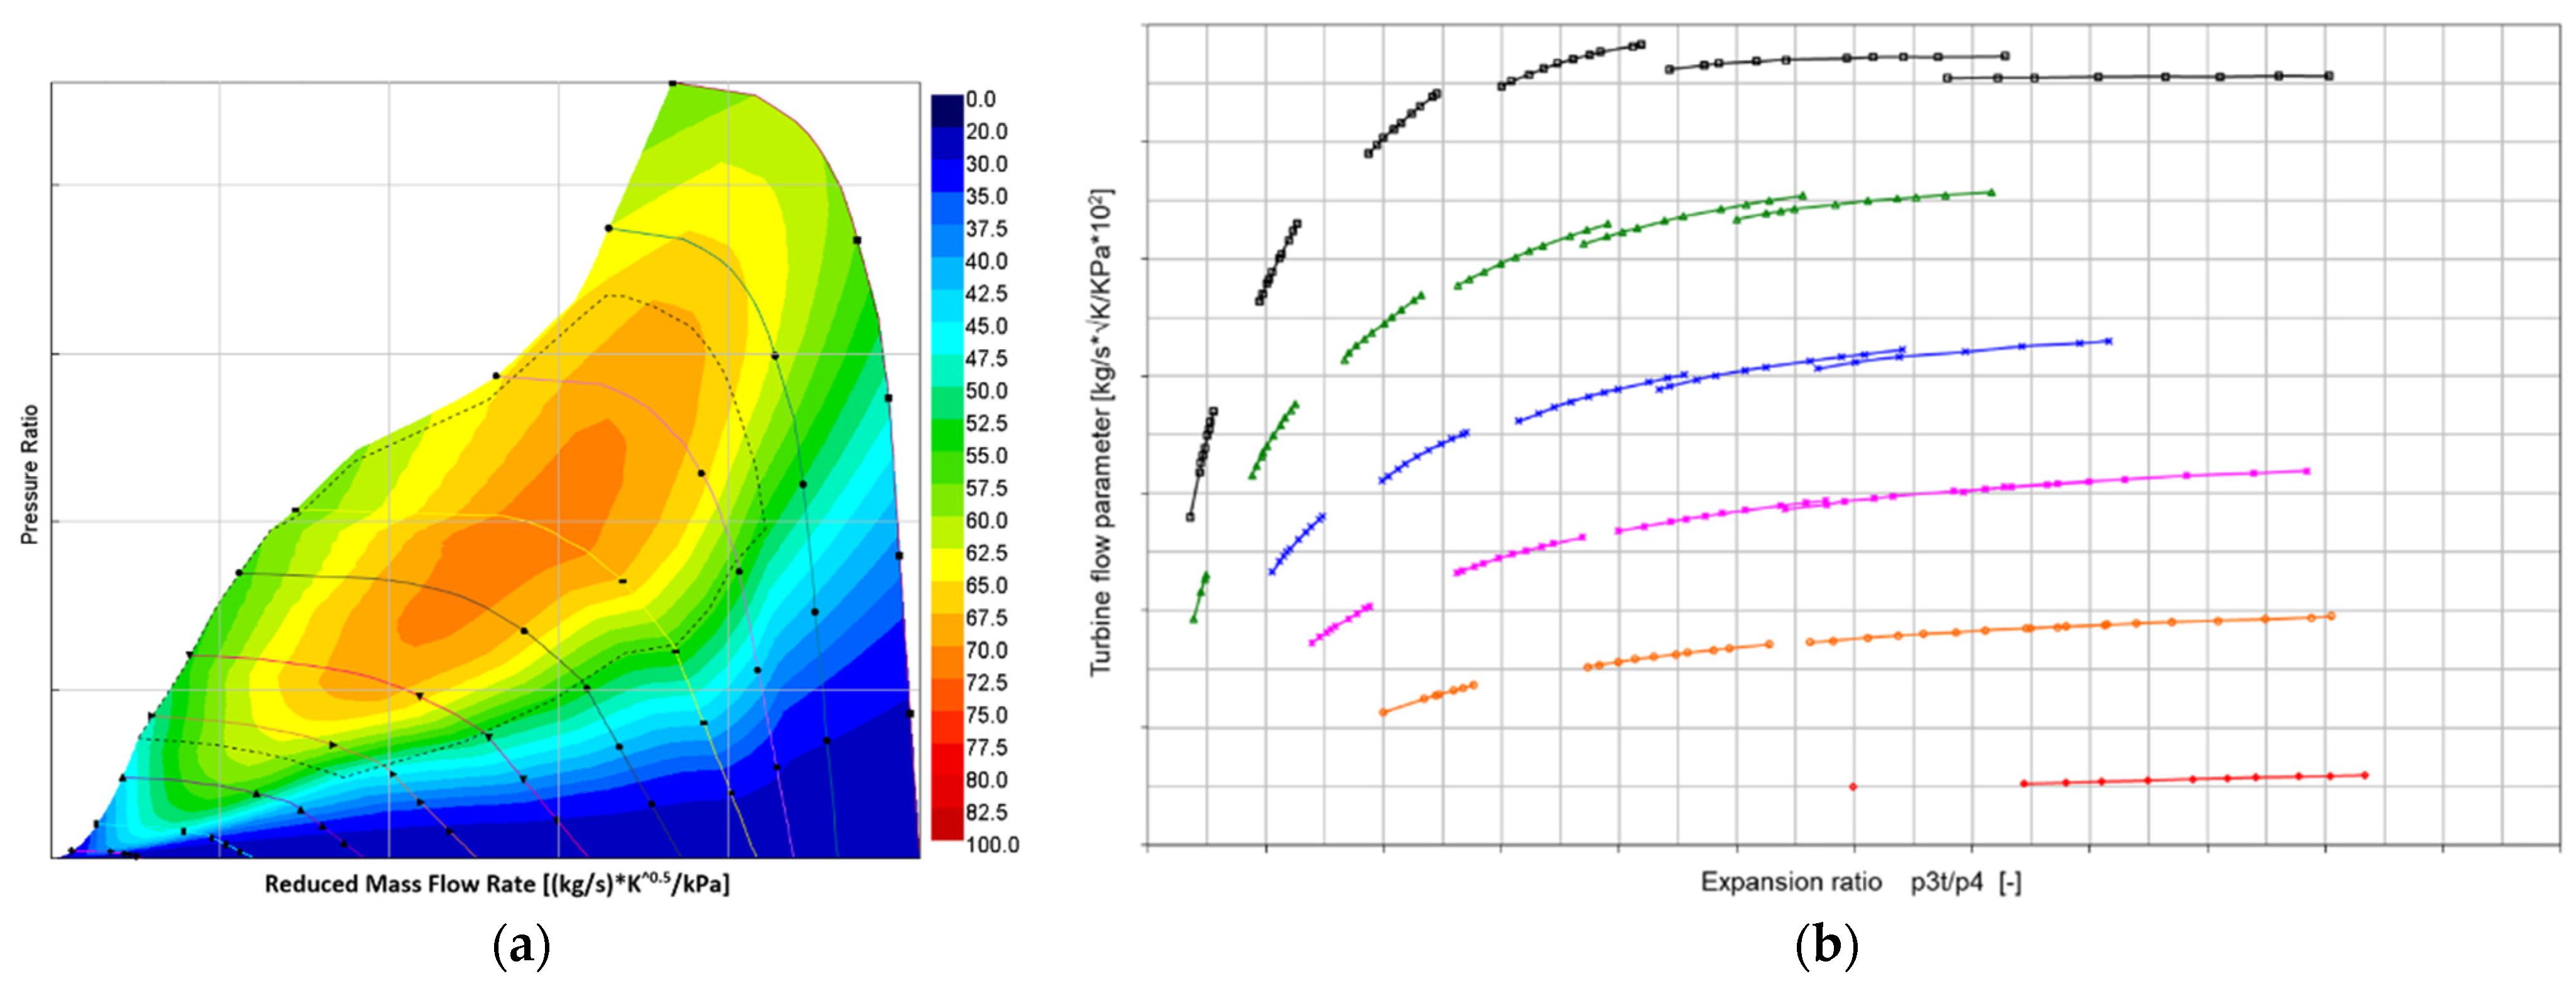
Figure 6 illustrates the final compressor and turbine maps used in the simulation.
3. Results and Discussion
In this section, the simulation results of the engine overall predicted performance, the required amount of water injected and the engine turbo-matching are carefully discussed. As presented in
Table 4, the engine developed in this work aims to achieve an indicated power of 135 kW at 5500 rpm and 279 Nm of maximum indicated torque. To reach the desired torque output, it was required to run the engine at 35 bar of IMEP, considering the engine displacement volume. Those engine performance parameters were established based on the results presented by ref. [
30]. The engine simulations were conducted based on the IMEP required to achieve the established engine overall performance. Considering a new accessory drive package to fit the engine developed in this work, the results were evaluated related to the indicated parameters.
The downsized engine should reach the maximum indicated torque at the lowest possible engine speeds to promote satisfactory vehicle drivability. Based on the downsized engines available on the market, 2000 rpm was determined as the lowest speed for the engine to achieve the maximum indicated torque, which must be maintained for additional 2000 rpm. These requirements imposed a challenge on the engine turbo-matching procedure.
Figure 7 shows the predicted IMEP according to the engine speed.
As the cylinder head used on the engine developed in this work was designed with integrated exhaust manifold technology, the maximum indicated torque ending at 4000 rpm was defined, taking into consideration the compromise between achieving the required engine performance and keeping the exhaust temperature and backpressure as low as possible. Additionally, the engine IMEP levels from 4000 to 5500 rpm were determined to promote a smooth engine running transition from maximum torque to maximum power. In this regard,
Figure 8 and
Figure 9 present the predicted engine indicated torque and power curves, respectively.
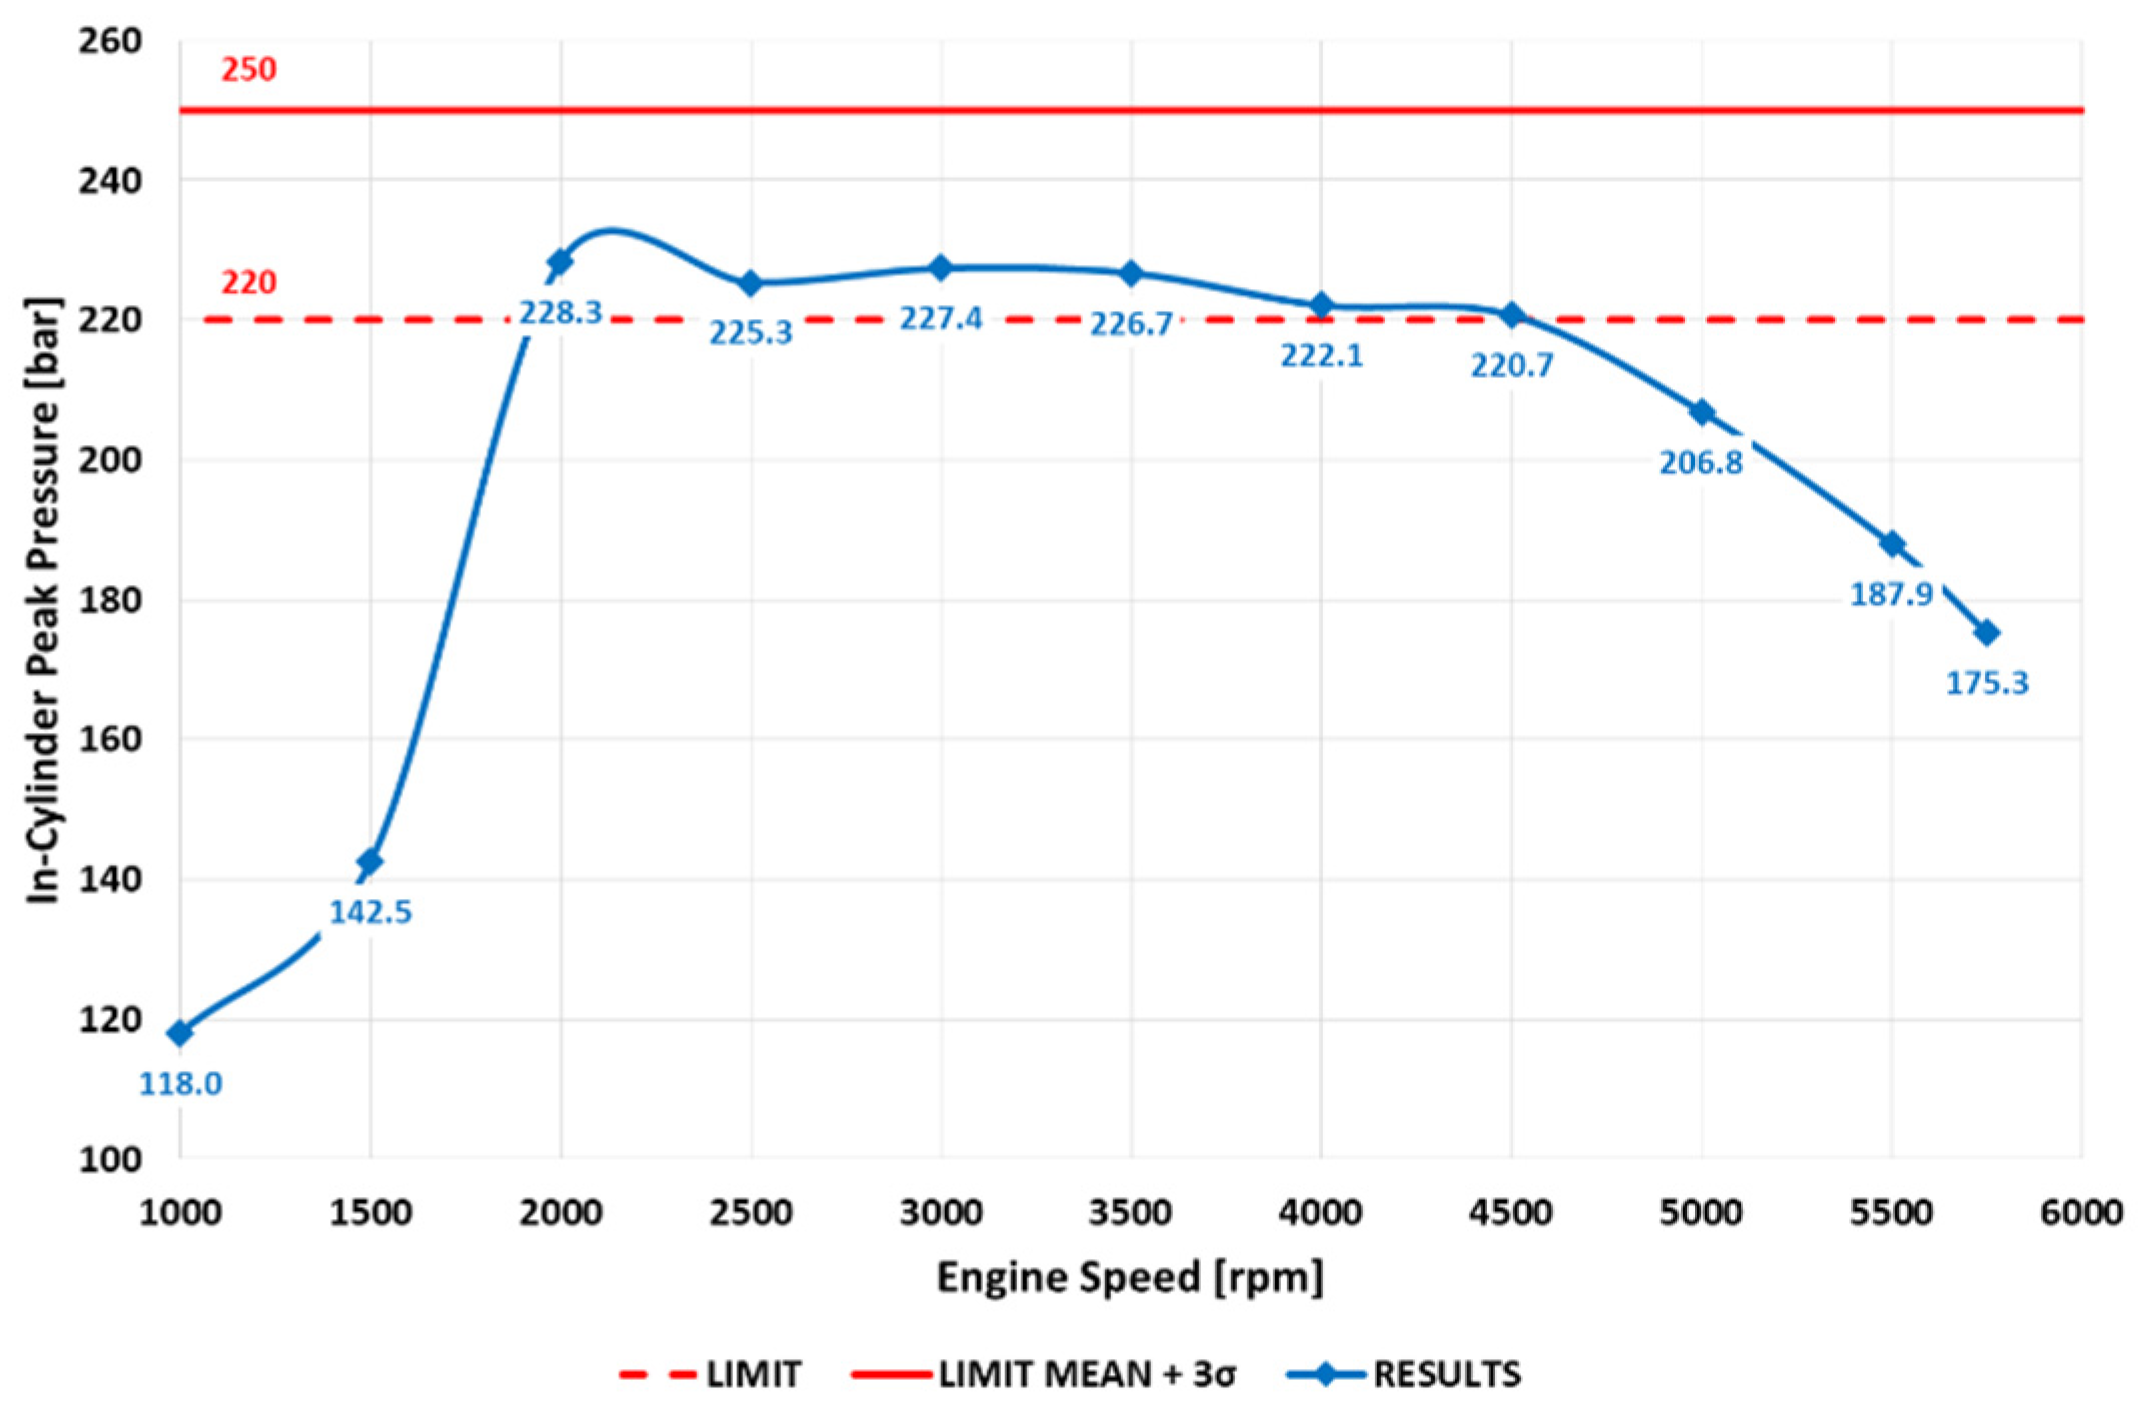
The in-cylinder peak pressure and its standard deviation are important parameters used to design engine components. Frequently, the in-cylinder pressure plus three times its standard deviation is considered as a reference for the limit operation condition. The experimental result obtained by ref. [
30] at the highest load had an in-cylinder peak pressure of 220 bar and a standard deviation of 14.37 bar. Comparatively, the simulation results from the model of this work presented an in-cylinder peak pressure average of 225.3 bar, as exhibited in
Figure 10. Throughout the engine speed values, the average of the in-cylinder peak pressure slightly overcomes 220 bar, as presented in
Figure 11. Therefore, the in-cylinder peak pressure value of 220 bar and its three times standard deviation values choice as a reference for the engine components design is considered a reasonable approach.
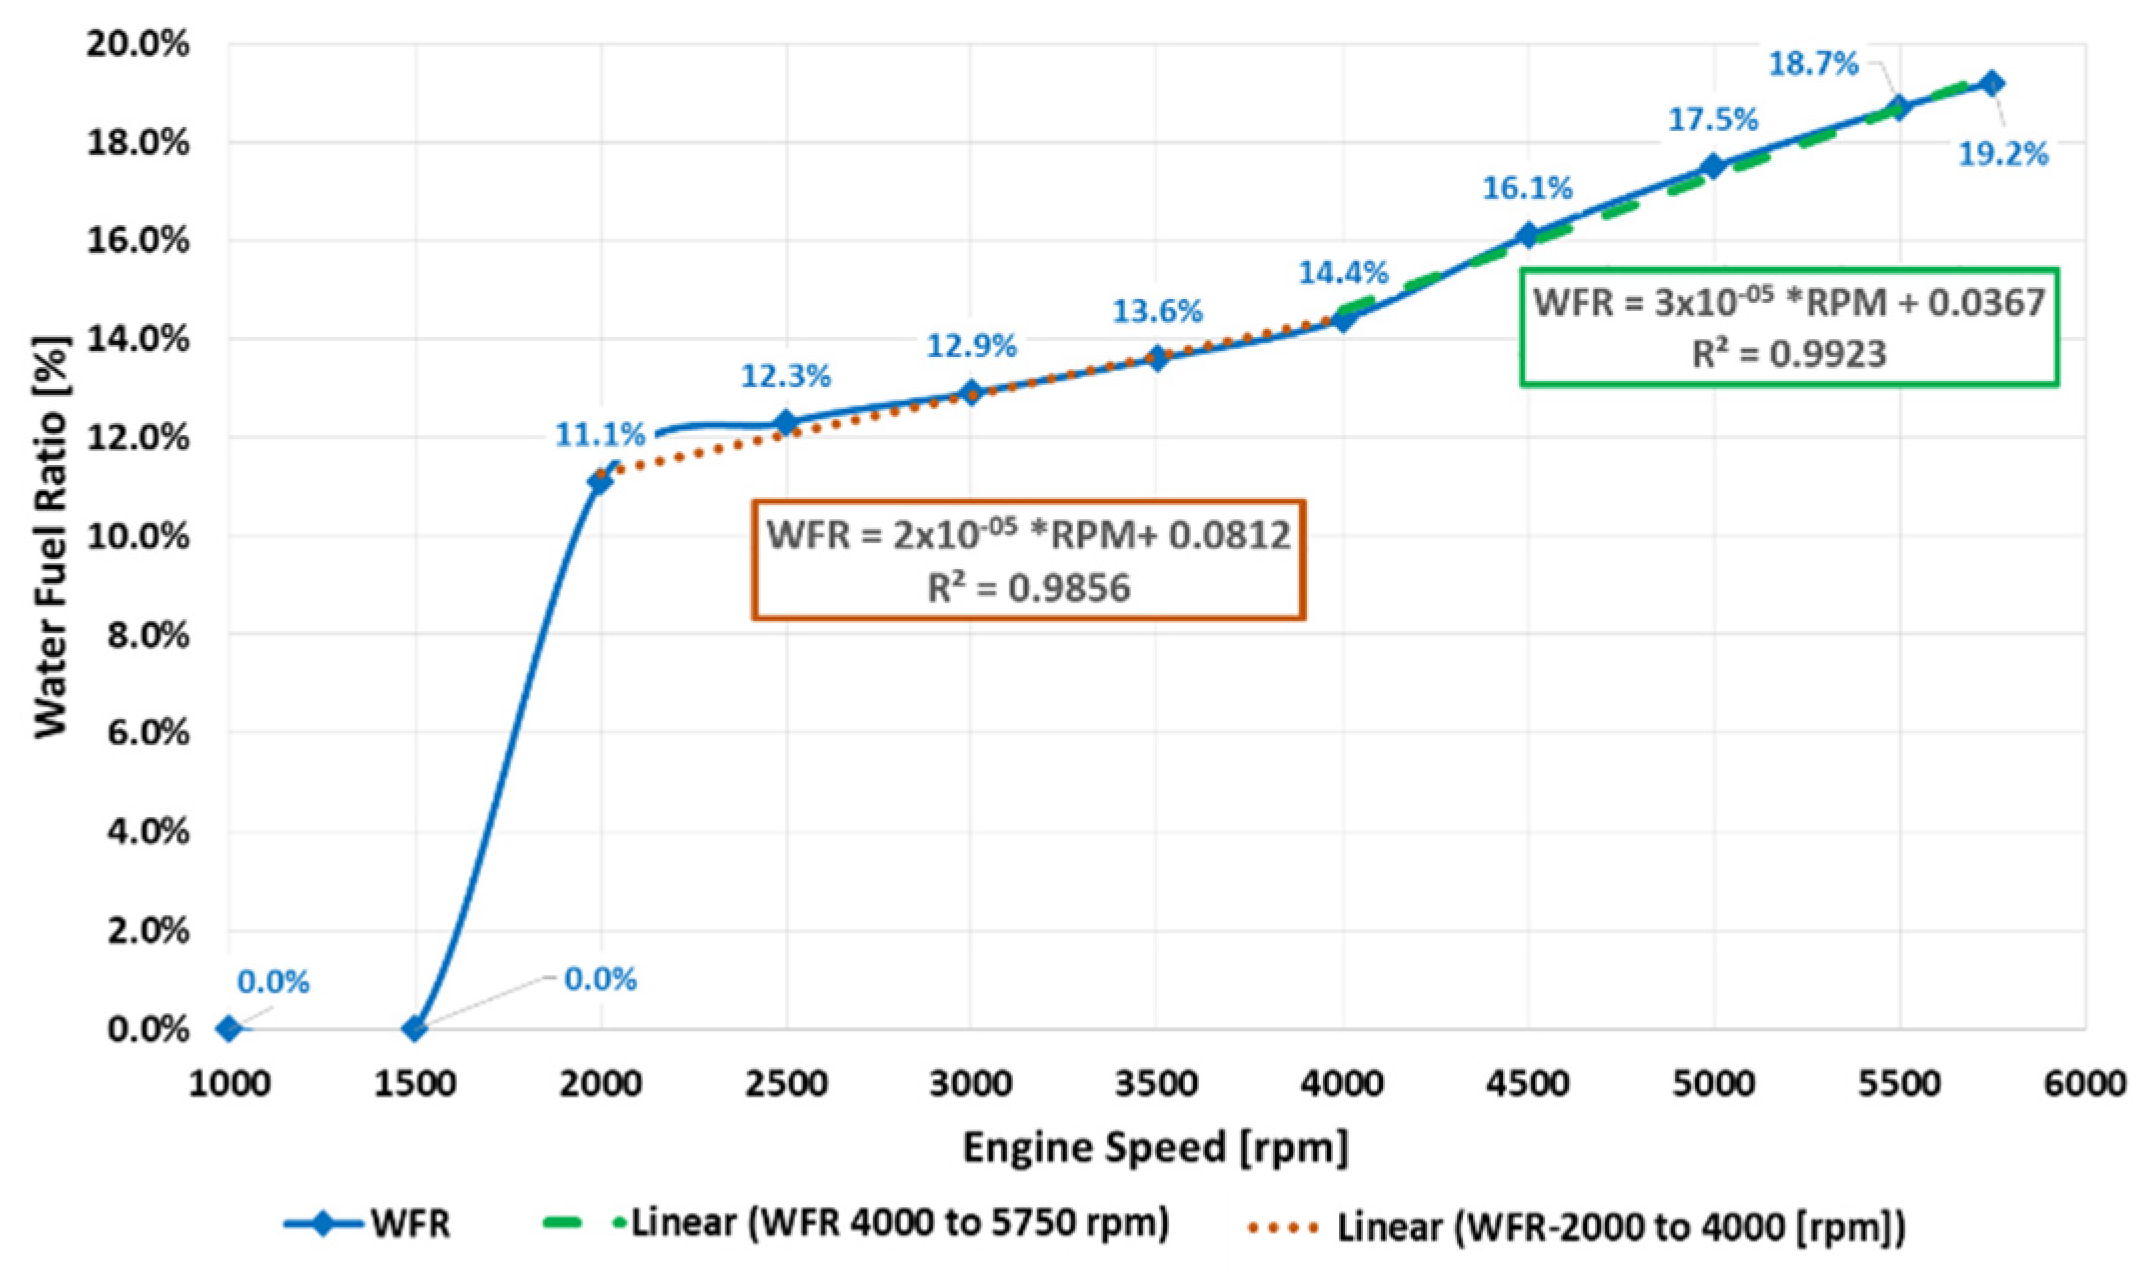
The water injection was used to assist the combustion process and promote a full spark authority to the engine, regardless of the operation condition. The full spark authority is characterized by MFB50% around 8.0° CA. The amount of water mass injected was correlated to the amount of fuel mass injected by cycle using the parameter WFR. As shown in
Figure 12, the water consumption presented two linear responses throughout the engine operating conditions. The first linear sector occurred between 2000 and 4000 rpm and the second linear sector took place between 4000 and 5750 rpm. The inflection behavior between the linear sectors occurred at 4000 rpm. This inflection effect could be justified based on the exhaust backpressure increase from 4000 rpm onwards, which can be observed in
Figure 13a. In the case of a higher exhaust backpressure running condition, a higher amount of residual gas remains trapped in the combustion chamber, which in turn enhances the knock occurrence tendency. In order to mitigate the knock onset, a larger amount of water is required. However, by injecting more water, the total mass flow through the engine increases, also raising the backpressure. The compromise between the amount of water injected and exhaust backpressure is critical for the engine performance.
The water consumed by the engine to assist the combustion process decreases the exhaust temperature. As shown in
Figure 13b, besides the abrupt exhaust temperature increase onwards 4000 rpm, the water injection was able to maintain the exhaust temperature under the safety limit of 950 °C for the exhaust valves. The highest amount of water injected was 19.2% of WFR. At peak power, the WFR reached 18.7%. It was 3.5% higher than that estimated by ref. [
30] for the same indicated power output. The higher amount of water injected could also be justified due to the higher exhaust backpressure of the novel engine portrayed in this work.
The WI approach was focused on promoting a combustion phasing at the MBT condition, rather than managing the engine emissions. The water acts as a charge dilution agent, which may lead to an incomplete combustion process. In addition, the water could end up being trapped in the piston crevice, resulting in inefficient combustion in this region. These adverse effects could lead to an increase in CO and HC emissions.
Figure 14a presents the engine HC predicted emissions primarily determined by the exhaust gas equivalence ratio. Therefore, as the engine was simulated running in the stoichiometric condition, the HC emissions increase was related to the amount of water injected. A similar behavior is expected for CO, as it is also affected by the charge dilution levels and incomplete combustion process. It is worth pointing out that the high latent heat of vaporization of ethanol requires a smaller amount of water to be injected to achieve a combustion phasing at MBT compared to gasoline [
62,
63,
64,
65,
66]. Furthermore, Brazilian ethanol contains 6% of water, which contributes to lower water consumption.
The higher heat of vaporization achieved by combining ethanol and water injection leads to lower in-cylinder charge temperature, which in turn results in lower NO emissions. However, as the combustion phasing was adjusted to MBT condition, the in-cylinder charge temperature tends to increase, diminishing the NO emissions’ reduction potential.
Figure 14b illustrates the NO emissions throughout the engine full load condition. It was noticed that the lowest NO emissions values were achieved between 2000 and 3500, and they started to increase at higher engine speeds. As the exhaust backpressure also increased at higher engine speeds, the amount of water injected was only enough to mitigate the knock onset, while a higher amount of water would be required to minimize the NO emissions.
Figure 15 illustrates the CO
2 emissions values predicted for the engine, which presented a well-correlated tendency according to the engine indicated fuel conversion efficiency, as the CO
2 formation is closely related to the engine fuel consumption pattern. The lowest CO
2 emission value was 620 g/kW·h at 3000 rpm. Despite the WI effectiveness to promote a full spark authority to the engine, the WI approach requires attention to its possible adverse effects. Some of them are the engine lubricant oil dilution, the chemical incompatibility of the engine components materials and the water, and the development of control strategies to protect the engine by downgrading its performance in case of lack of water.
The water injection assists the combustion process by mitigating knock occurrence, and thus enabling the engine to run at the MBT condition (MFB50%—8.0° CA). Furthermore, the water injection affects the combustion duration by delaying it. However, for the small percentages of injected water used in this work, the slower rate of combustion was compensated by the advanced spark ignition. Similar combustion rate behavior was presented by refs. [
30,
53,
54].
Figure 16 presents the MFB50% and the combustion duration (MFB10–90%) results for the full load engine simulation. The purpose of combining a high volumetric compression ratio, high boost levels, a biofuel whose properties can reach such high loads, running on a stoichiometric mixture and using the water injection to assist the combustion process is to achieve the highest possible indicated fuel conversion efficiency.
Figure 17 presents the engine indicated fuel conversion efficiency simulation results, and the highest value achieved was 45.3% at 3000 rpm, which reinforces the great potential arising from the proposed methodology of combining the WI system, ethanol as fuel and highly boosted engine design. Additionally, the technologies used in the engine developed in this work achieved over 40% indicated fuel conversion efficiency during almost its entire full load condition.
The turbocharger used in this work was instrumental in enabling the engine to achieve the aforementioned performance and overall efficiency. It was defined through a turbo-matching procedure. To do so, several compressor and turbine maps supplied by BorgWarner were evaluated. In order to reach the desirable engine performance at low-end torque and maximum power, a VGT was used in this application. The compressor and turbine fitted on the engine are modern and highly efficient components, designed to withstand the higher working temperatures compared to diesel engines. The operating points of the compressor and turbine maps are presented in
Figure 18.
Figure 18a shows that the compressor turbo-matching resulted in the highest compressor efficiency coincident, with relevant engine speeds for driving cycles of vehicles equipped with the engine developed in this work, ranging from 2500 to 3500 rpm. Furthermore, a reasonable safety margin from the compressor surge curve at the engine low-end torque could be established. Additionally, the engine was able to reach the required peak power without achieving a compressor choke condition. Similarly, as illustrated in
Figure 18b, the turbine was able to work at the highest total mass flow (air plus fuel plus water), far from turbine choke condition. This fact indicates that the use of smaller, and consequently lighter, turbine wheels could be considered to improve the turbo lag response. Furthermore, it could be concluded that the exhaust ports’ design had a major contribution to the exhaust backpressure increase.
Regarding the turbocharger working reliability and protection, the turbine working condition should be in accordance with the manufacturer’s specification. The engine exhaust temperature and the turbocharge wheel speed are the two most important parameters to be managed. The turbocharger manufacturer specified the values of 970 °C and 240,000 rpm as the limit for the exhaust temperature and turbocharger wheel speed, respectively. As presented in
Figure 13b, the highest exhaust temperature achieved by the engine was 17 °C lower than the upper limit specified by the turbocharger manufacturer. In the same way, the maximum turbocharger wheel speed achieved was approximately 9000 rpm lower than the specified limit. As the engine simulation was carried out considering the ambient conditions at sea level, the safety turbocharger margin related to the surge, choke and over-speed conditions allow the engine to maintain its performance in higher altitude regions.


 and
and 


