Article

Dynamic Accumulation of the Quaternary Shale Biogas in Sanhu Area of the Qaidam Basin, China

1
Exploration and Development Institute of Qinghai Oilfield Company, PetroChina, Dunhuang 736202, China
2
State Key Laboratory of Petroleum Resources, Prospecting China University of Petroleum, Beijing 102249, China
*
Author to whom correspondence should be addressed.
Energies 2022, 15(13), 4593; https://doi.org/10.3390/en15134593
Submission received: 24 May 2022 / Revised: 16 June 2022 / Accepted: 21 June 2022 / Published: 23 June 2022
(This article belongs to the Special Issue New Challenges in Unconventional Oil and Gas Reservoirs)

Abstract

:
Biogas resources in the Sanhu area of the Qaidam Basin have great potential, but there are few studies on biogas from shale, especially on the accumulation conditions of shale biogas. The study of biogas accumulation conditions of quaternary shale in the Sanhu area is of great significance to the theory of biogas accumulation and the guidance of exploration and development. This paper takes Quaternary shale in the Sanhu area as the research object. It is analyzed from multiple perspectives of shale hydrocarbon generation conditions, reservoir conditions, as well as hydrodynamic and structural conditions. Through the experiments of soluble organic carbon analysis and porosity and permeability analysis, the accumulation conditions of shale biogas reservoirs are clarified. The results show that the quaternary shale has a high soluble organic carbon content and high salinity formation water, which is conducive to late methane biochemical generation. Quaternary shale has the characteristics of high porosity and low permeability, mainly developing intergranular pores and intragranular pores. The large pore volume and specific surface area provide a lot of storage space for free gas and adsorbed gas, and the reservoir conditions are good. Under the structural characteristics of high in the south and low in the north and the action of formation hydrodynamics, biogas migrated from the south and deep to the north of the basin. The north slope is the main biogas-rich zone. On the whole, the quaternary shale in the Sanhu area has the characteristics of continuous hydrocarbon generation and dynamic accumulation, which has huge resource potential and exploration and development value.

1. Introduction

The Qaidam Basin is located between the Qilian Mountains, Kunlun Mountains, and Altun Mountains [1]. It is a Mesozoic–Cenozoic intermountain basin developed after the Indo-Chinese Movement [2]. The Qigequan Formation (Q1+2) is the main sedimentary strata in the eastern Qaidam Basin, with a thickness of about 3000 m [3,4]. The thick shale of the Qigequan Formation provides gas sources for the formation of Quaternary biogas so that the Sanhu Depression becomes the main biogas exploration area [5]. The Quaternary biogas production in the Sanhu Depression is large and the benefit is high [6]. However, with the continuous development of the gas field, the water and sand production problems are serious, and the stable production pressure increases. Regarding the exploration potential of conventional sandstone gas reservoirs, it is difficult to maintain stable production and increase production, so it is urgent to find new exploration replacement areas. Shale biogas resources have great potential and can be used as a new exploration field. However, the hydrocarbon generation-reservoir-accumulation mechanism and enrichment theory of “low carbon, low evolution, and weak diagenesis” shale biogas is still blank, and relevant theoretical research is urgently needed. Since 2018, the exploration of shale biogas has achieved initial results. For example, well Tainan 18 has obtained industrial airflow in shale rock, and the daily gas production can reach 2 × 10⁴ m3. Therefore, shale biogas reservoirs in the Sanhu area have a certain exploration and development potential.
Based on the investigation of the causes and geological conditions of shale gas reservoirs in China and abroad, the formation and distribution of shale in the Wufeng–Longmaxi Formation in the Sichuan Basin are controlled by the semi-deep water-deep water continental shelf facies sedimentary environment. The overall distribution of shale is stable [7,8]. It has the characteristics of high organic matter (TOC) content, high thermal evolution degree, good organic matter type, organic pore development of shale reservoir, and high mineral brittleness index, which is beneficial to the later fracturing development [9]. The formation is due to the formation of the crude oil pyrolysis stage [10]. It is found that the geological conditions of shale gas formation in Wufeng–Longmaxi Formation in the Sichuan Basin are controlled by factors, such as structure and preservation conditions, dominant lithofacies combination, sedimentary environment, and thermal evolution degree [11]. Most of the studies on shale gas reservoirs are focused on thermogenic gas [12]. There is almost no special study on biogenic gas, let alone a large-scale shale gas area dominated by biogenic gas in the Sanhu area of the Qaidam Basin. Compared with thermogenic gas, biogenic gas has its particularity in hydrocarbon generation conditions, reservoir conditions, and structural preservation conditions, which cannot completely copy the research results of thermogenic gas [13,14]. Therefore, relevant research needs to be carried out. For example, compared with the Antrim shale in the United States and Yangxin shale in the Jiyang Depression of Shandong Province, the types and sizes of reservoir spaces have different characteristics [15]. The reservoir spaces of Antrim shale and Yangxin shale gas reservoirs in the Jiyang Depression are dominated by natural fractures, while the pores of shale in the Sanhu area are relatively developed (porosity can reach 10~35%) and the physical properties are better, which are more suitable for the formation of shale gas (Table 1) [16,17]. Therefore, the study and analysis of the formation conditions of biological shale gas reservoirs are of the most practical significance for the increase of natural gas reserves and production in the Qinghai Oilfield [18,19,20].
In view of the research on the geological conditions for the formation of shale biogas reservoirs, taking the shale of the Qigequan Formation of Quaternary in the Sanhu area as an example, the authors used TOC, nitrogen adsorption, high-pressure mercury injection, scanning electron microscopy, and other test methods to study the gas generation mechanism of methane bacteria, the distribution characteristics of organic matter components, and the development characteristics of shale reservoirs, and analyzed the control effect of gas generation conditions, reservoir conditions, stratigraphic structure characteristics, and hydrodynamic conditions on the formation of shale biogas reservoirs, providing a reference for the exploration and development of shale bio-gas in the Qaidam Basin and other areas.

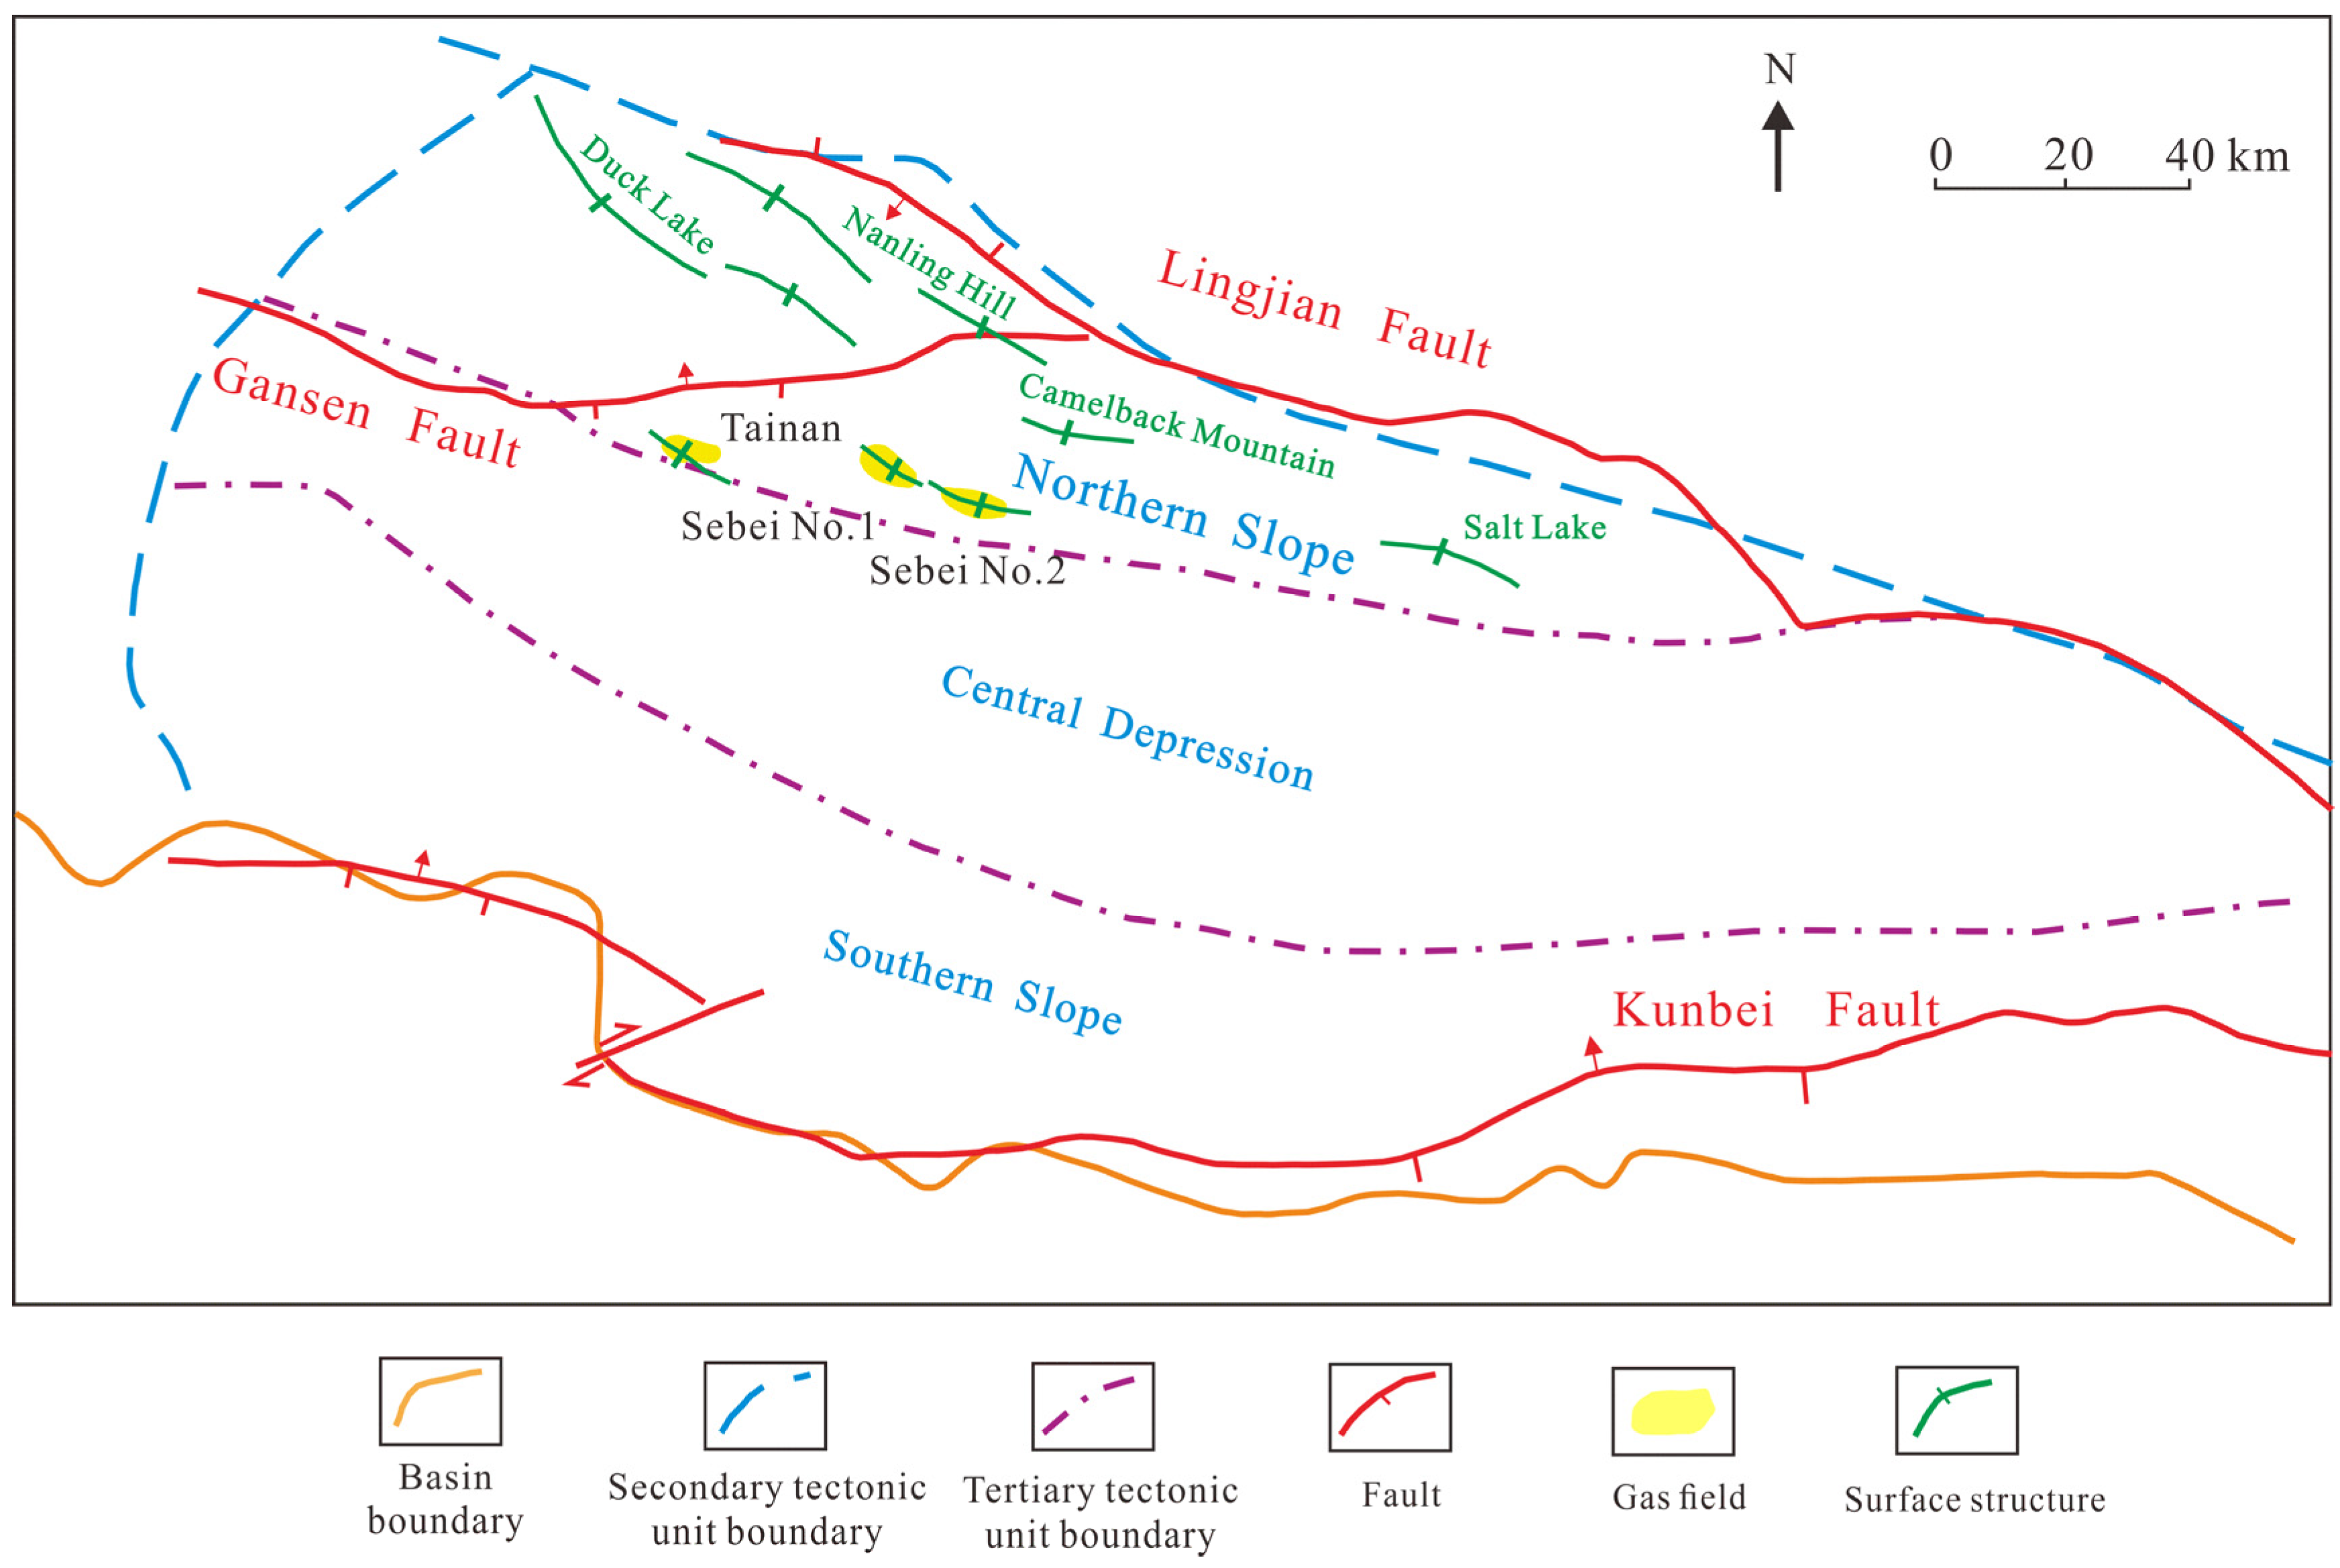
2. Geological Background

The Qaidam Basin is a large inland basin of Mesozoic and Cenozoic [21]. The faults and depressions at the edge of the basin are formed by the uplift of the Altun Mountains, Qilian Mountains and Kunlun Mountains due to the Indosinian and Yanshanian movements and the elevation is 2650~3000 m [22]. The Sanhu area covers an area of about 5 × 10⁴ km2, which is bound by the Lingjian, Xinan and Enan faults in the north and the Kunzhongshan front faults in the south, from Nabei to Luoyanshan to Hongsanhan No. 4 in the west and from the east to the north and south of Hobson Lake [23]. The Quaternary developed thick shale with a thickness of nearly 3000 m [24]. In the area with Taijinaier and Senie Lake as the sedimentary centers, the thickness of shale exceeded 1000 m, which is the main division of Quaternary shale [25].
The Qaidam Basin has experienced three sedimentary evolution stages from Mesozoic to Cenozoic, forming three major tectonic zones, namely, the northern slope zone, the central depression zone and the southern slope zone [26,27,28] (Figure 1). The Quaternary in the Sanhu area deposited a set of lacustrine strata in the process of the transfer of the sedimentary center, that is, the main stratum of the Quaternary in the eastern Qaidam Basin, Qigequan Formation, whose thickness is more than 3000 m [4,29]. Such a huge sedimentary thickness provides sufficient gas source rocks for the formation of Quaternary biogas, which is the key area of Quaternary biogas exploration and development in the Qaidam Basin.

3. Sample and Experimental Method

3.1. Microbiology Detection

In a sterile laboratory environment, the total DNA of the samples was extracted by using the US Soil DNA Extraction Kit (DNeasy PowerSoil Kit 100) by enzymatic chemical and physical methods. Gel imaging technology was used to detect the extracted DNA and a Nanodrop ND-3300 nano fluorescence spectrophotometer (Thermo, MA, USA) was used to quantitatively determine the concentration of total genomic DNA extracted from soil. After completion, the DNA solution was stored at −80 °C for standby. After the DNA genome in samples was successfully extracted, it was used as the amplification template. After PCR amplification, 1% agarose gel electrophoresis was used for detection and subsequent gel cutting recovery. According to the quantitative requirements of gel recovery and purification quality, the total mass of each sample was set at 30 ng by a quantitative instrument. Finally, three repeated gel recovery products of each sample were mixed equally and the purity test was qualified and sent to the biological company. The PE250/300 double-end sequencing method on the Illumina MiSeq platform was used for sequencing [30].

3.2. TOC

Total organic carbon content (TOC) was measured by a CS-230 carbon sulfur analyzer. The samples were crushed into 100 mesh, and then all powder samples were treated with hydrochloric acid at 60 °C for 24 h for decarburization and washed with deionized water to remove the residual hydrochloric acid [31,32].

3.3. SEM

Based on the backscattering electron imaging principle of the ZEISS GeminiSEM scanning electron microscope (Carlzeiss, Oberkochen, Germany), the mudstone samples were cut and the samples were ground by argon ions with HitachiIM4000 (Hitachi, Tokyo, Japan) for imaging observation [33]. The shape, size, abundance, distribution, direction, connectivity and configuration relationship of pores were described and the pore structure of mudstone in this work area was scientifically classified.

3.4. Porosity

UltraPore-200 Helium Porosity Meter was used to measure the porosity of samples. The principle according to Boyle’s law P1V1 = P2V2, helium gas with poor adsorption performance and small molecules was used as the test gas. The particle volume and pore volume were measured by the double chamber method and single chamber method, respectively. Then the porosity was calculated, that is, known P1 and V1, measured P2, and calculated V2 [34].

3.5. Permeability

The permeability was measured by the CMS-300 permeability tester. The principle is to record the flow at the outlet of the core through the gas flowmeter according to the one-dimensional Darcy flow law of gas. When the gas flow reached a stable state, the inlet pressure and flow of the core were recorded, and then the inlet pressure was gradually changed to record the corresponding steady flow under different pressures. The permeability of the rock sample could be calculated by using the Darcy formula [35].

3.6. XRD

The whole rock minerals and clay minerals were analyzed and detected by a D8AA25 X-ray diffractometer. The whole rock mineral samples were crushed and ground to below 40 μm grain size and pressed into tablets by the back pressure method. The diffraction spectra of 3~45° were obtained on the computer. According to the corresponding formula in the standard and the mineral K value, the content data of various minerals were calculated. The relative content analysis of clay minerals The samples were crushed to 1 mm particle size, soaked and dispersed, and less than 5 μm (sandstone) and 2 μm (mudstone) particles were extracted to make natural slices. The diffraction spectrum of 2.5~15° was obtained on the computer. The relative content data of clay minerals were calculated according to the formula in the standard [36].

3.7. N2 Adsorption

The nitrogen adsorption experiment adopts the Model ISOSORP-HP Static isothermal adsorption instrument produced in Germany. The main aperture measurement range of nitrogen adsorption was 2~500 nm. The test condition temperature was 77 K (−195.8 °C). At 77 K, the pressure was increased to the saturated vapor pressure P0 (P0 was about 0.13 MPa) of nitrogen, and then the pressure was gradually decreased to measure the nitrogen adsorption capacity of the sample under different relative pressures P/P0. The powder size was required in a 40~60 mesh [37]. The test site was completed in the State Key Laboratory of Petroleum Resources and Exploration, China University of Petroleum (Beijing, China).

3.8. High Pressure Mercury Injection (HPMI)

The HPMI experiment used the American Canta Poremaster-60 automatic mercury injection instrument, the pore diameter distribution range was mainly 0.1~3 nm, the test used a 1 cubic centimeter block sample; the sample was placed in the drying box for 24 h, and after cooling to room temperature, could be used. The experiment was carried out in the Heilongjiang Province Key Laboratory of Unconventional Hydrocarbon Accumulation and Development, Northeast Petroleum University [38].

4. Results

4.1. Organic Geochemistry and Petrology

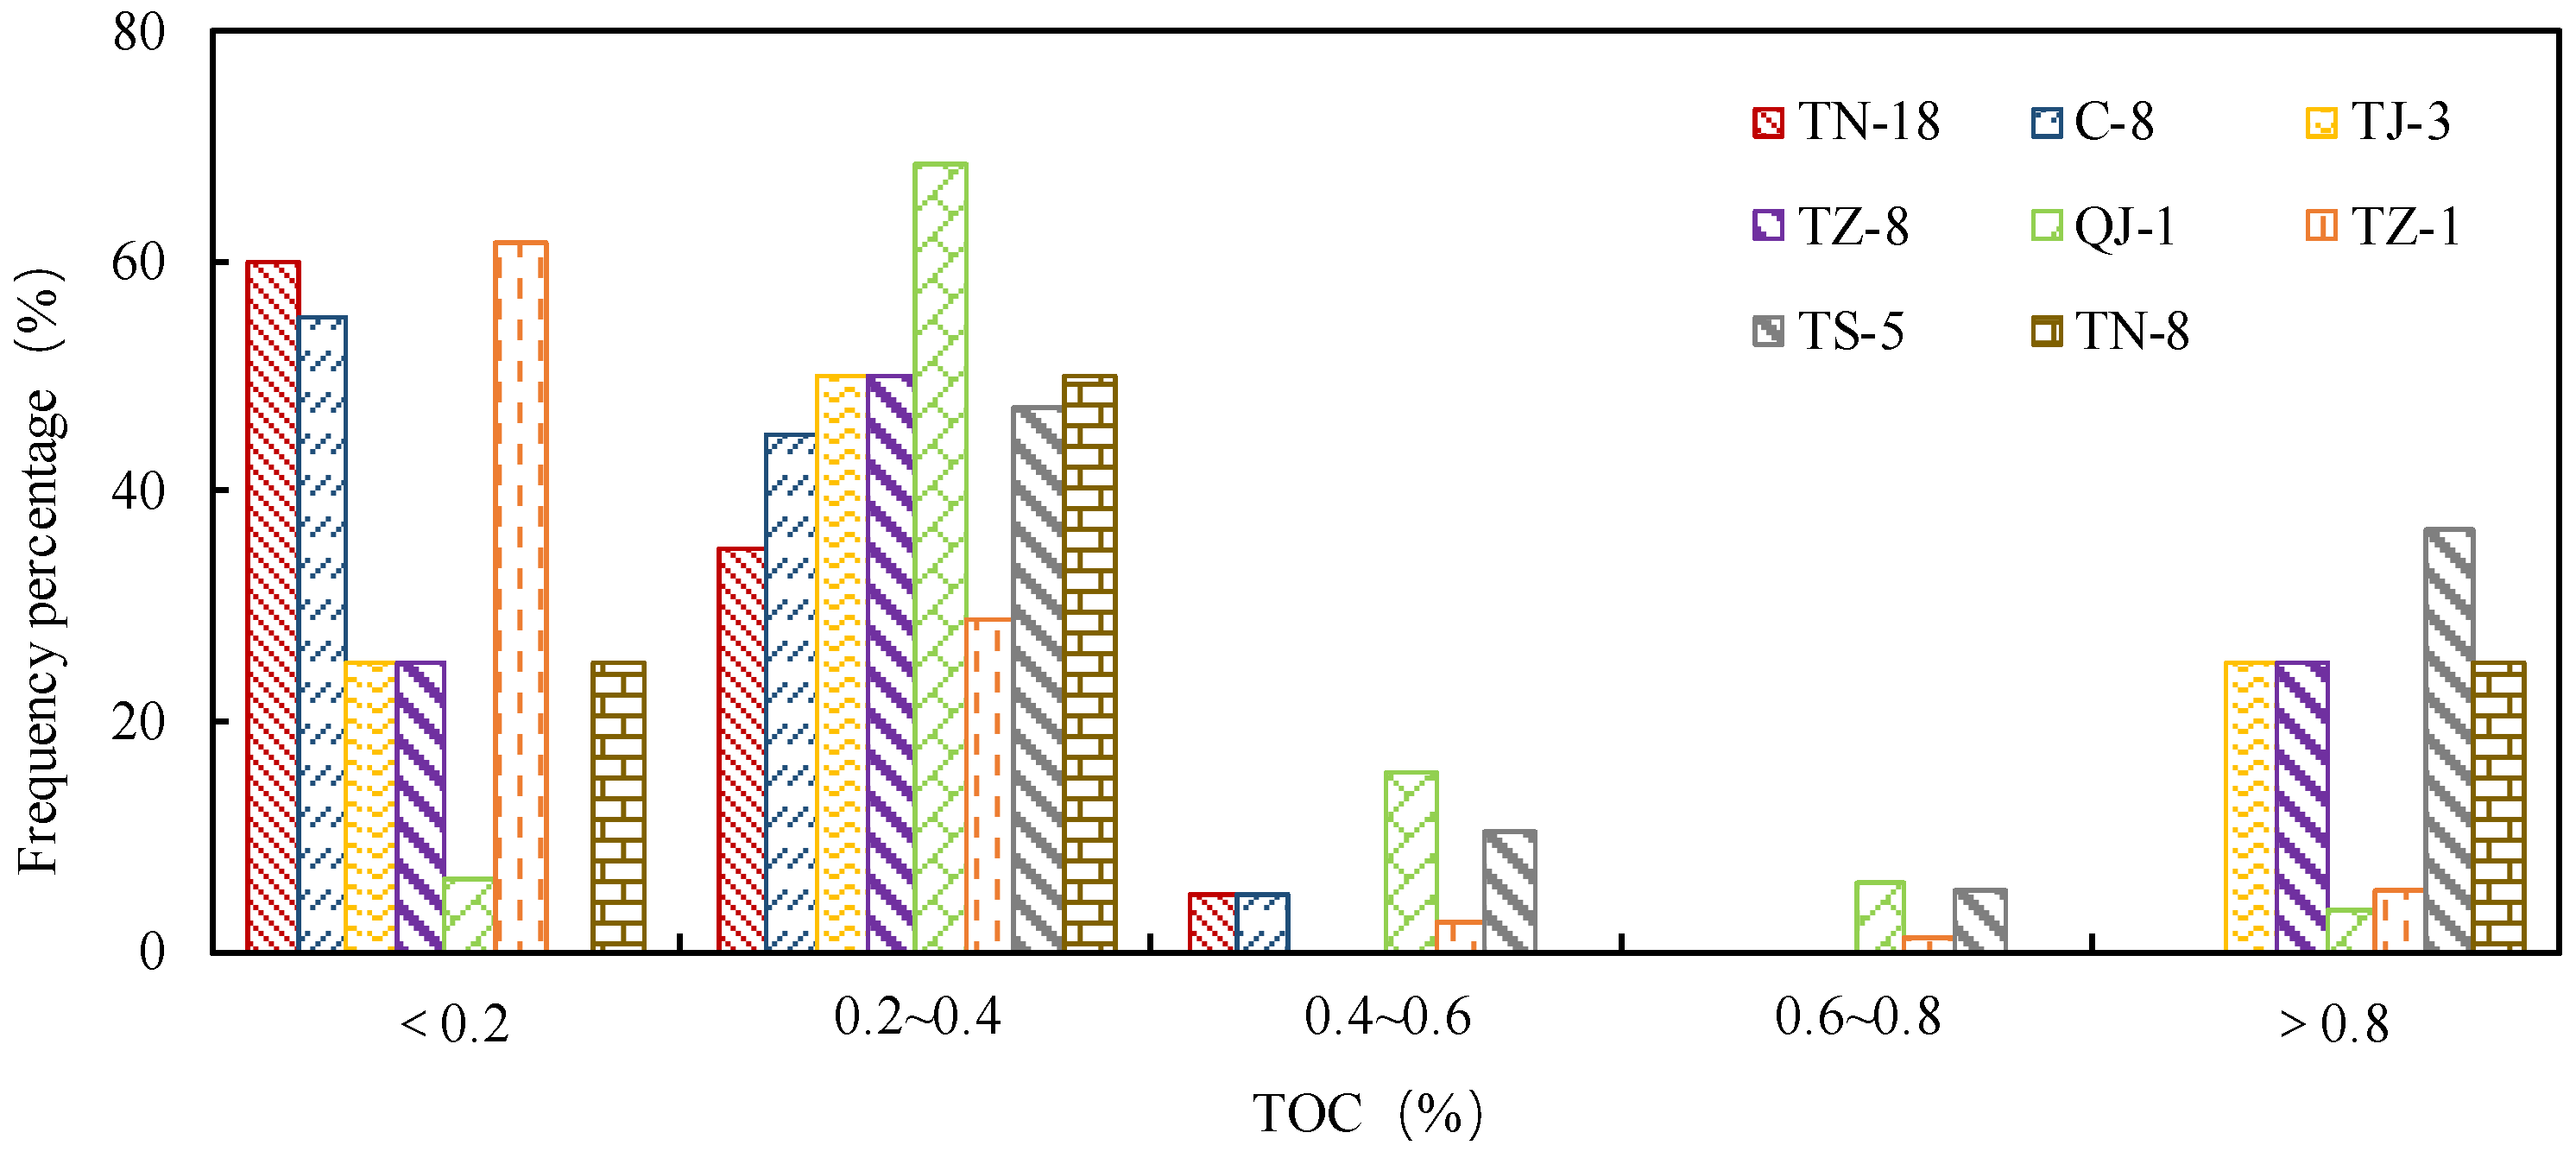
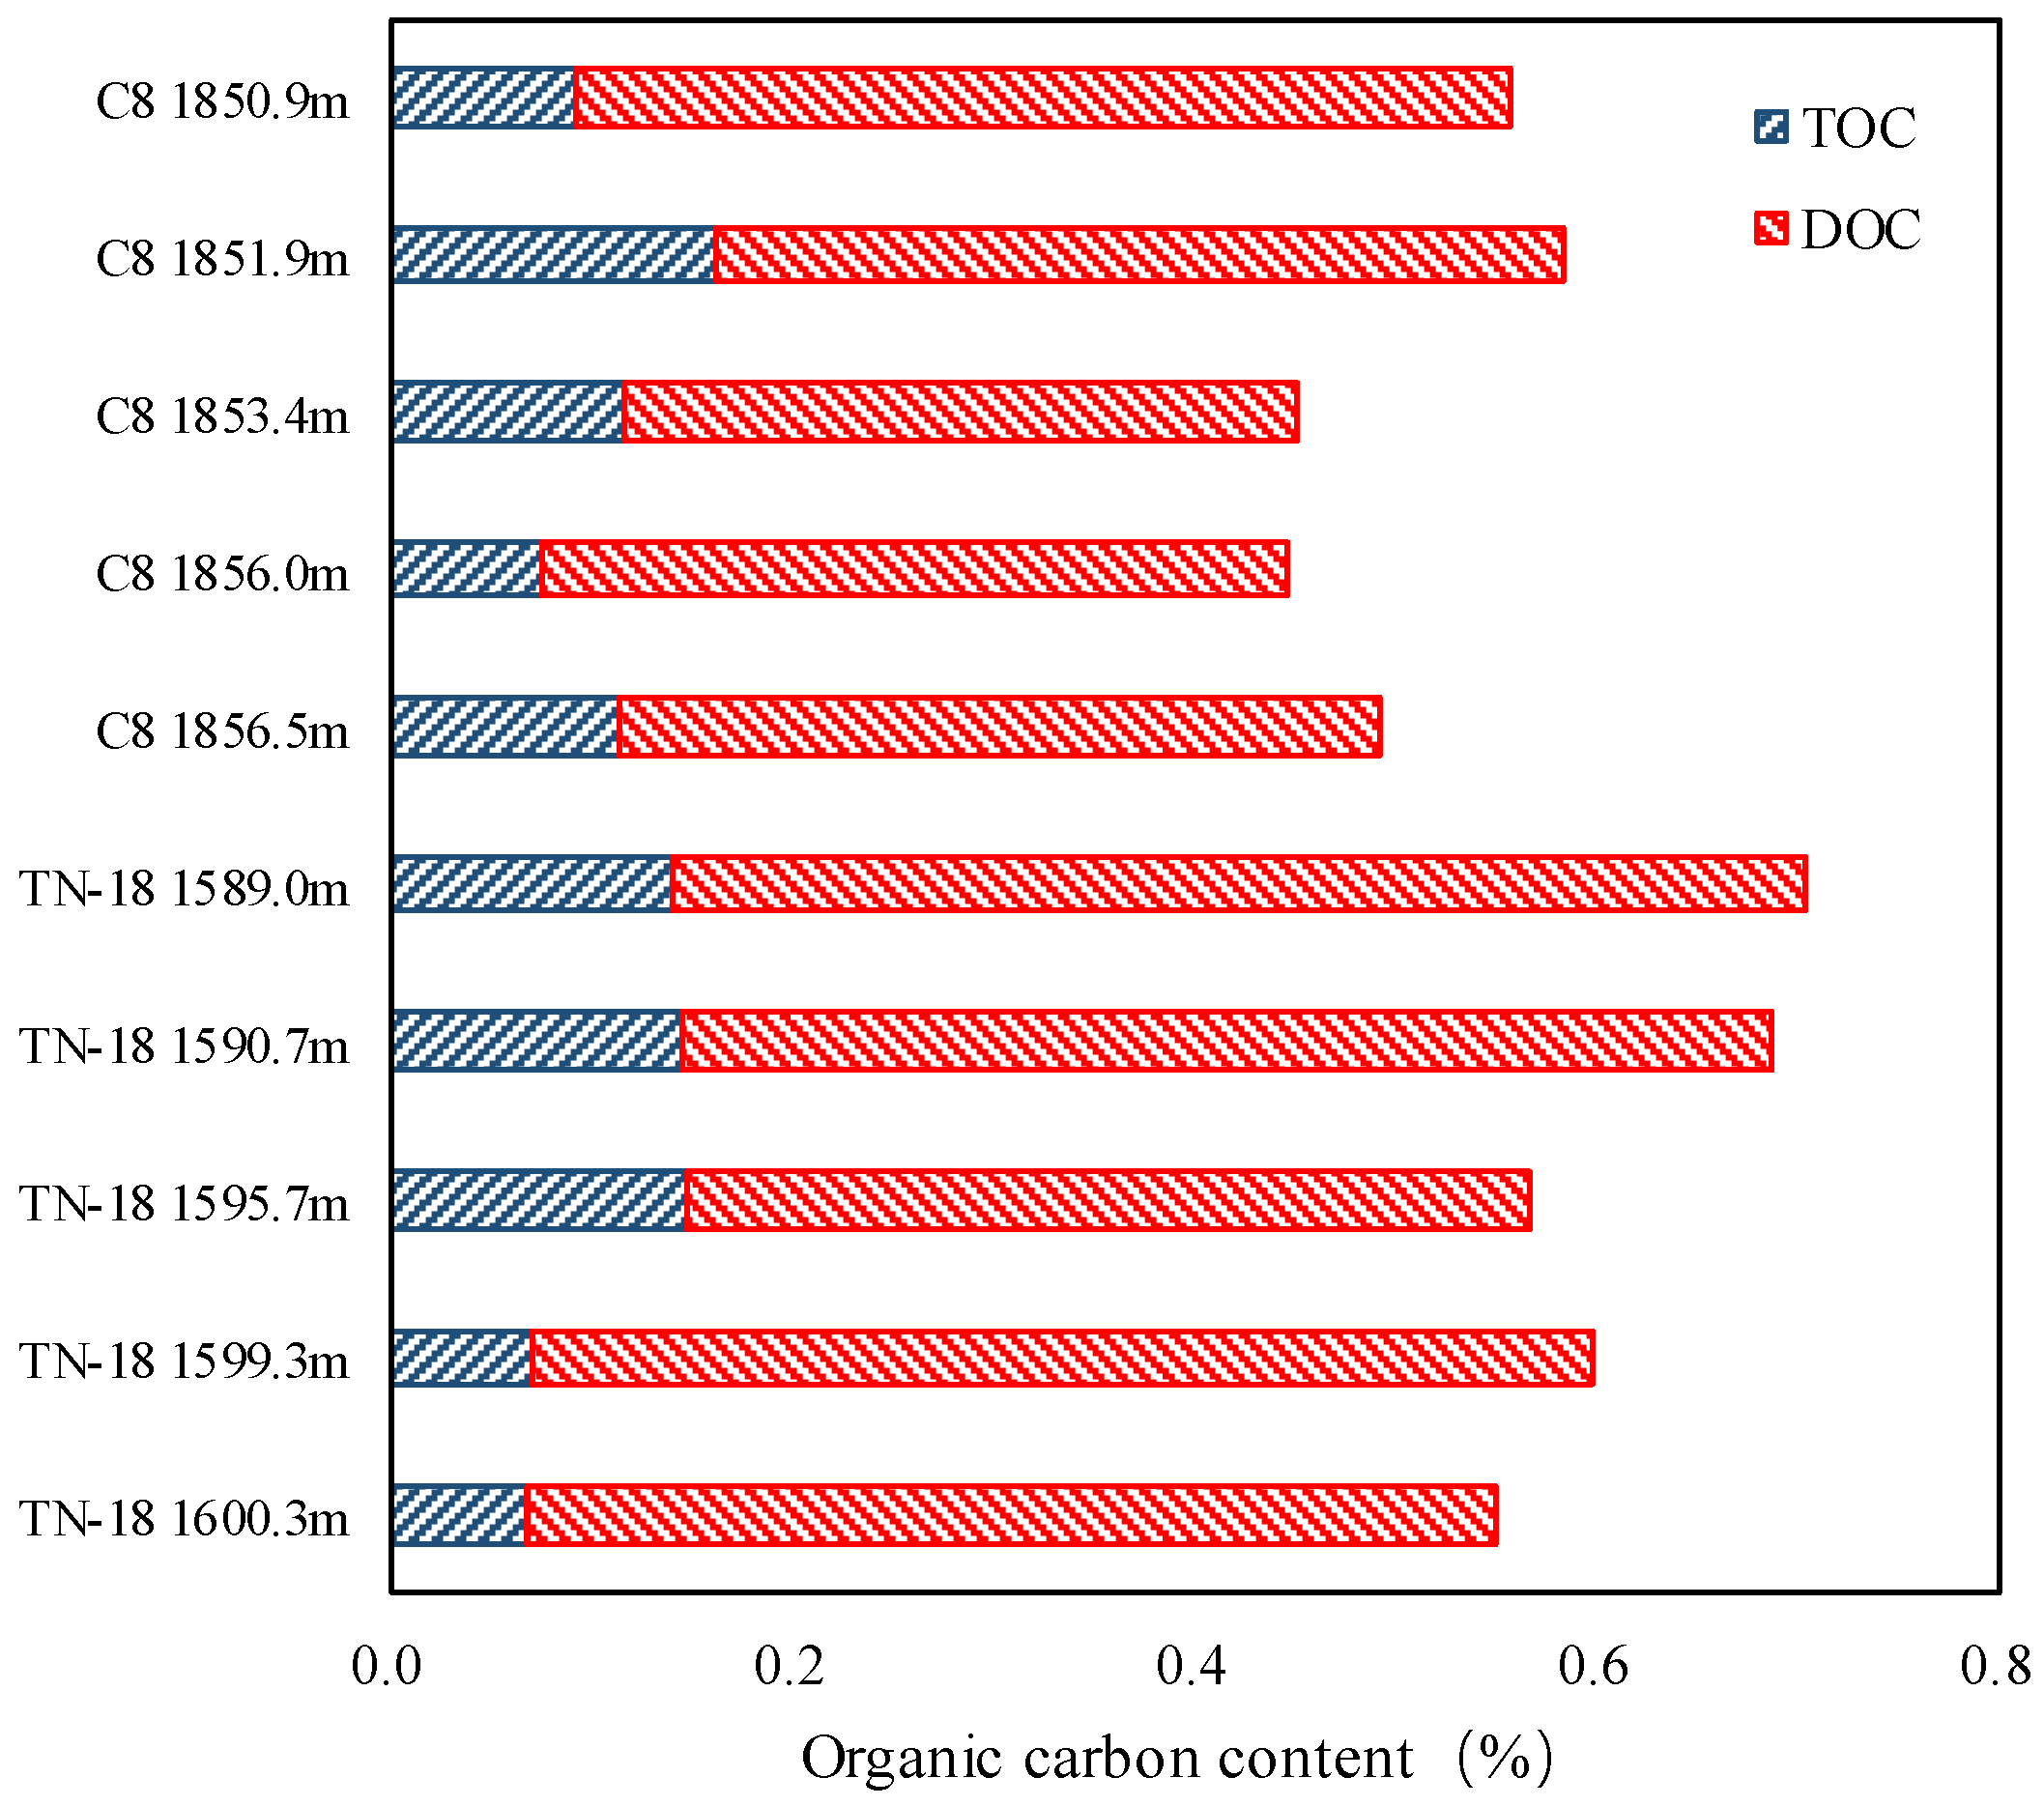
4.1.1. Organic Carbon

The content of organic carbon Quaternary shale in the Sanhu area is 0.2~0.4%, among which, the TOC content of Well TN-18 and Well C-8 is 0.06~0.24%. According to previous standards, it is a medium-poor source rock, which is inconsistent with the gas production of Well TN-18 (Figure 2).
Considering that pickling and washing have a great influence on the abundance of organic matter in source rocks during organic carbon analysis, the experimental process is improved and the dissolve organic carbon (DOC) parameter is introduced. The improved experimental steps are as follows: a sample is divided into three parts, and the total content of carbon (TC), the content of inorganic carbon and the content of insoluble organic carbon (TOC in routine testing) are determined, respectively. Subtract inorganic carbon and insoluble organic carbon (TOC in routine testing) from TC to obtain the DOC content. According to the calculation, the soluble organic carbon content of Well TN-18 and Well C-8 is 1~3 times that of insoluble organic carbon, which is an important substrate available to microorganisms (Figure 3).

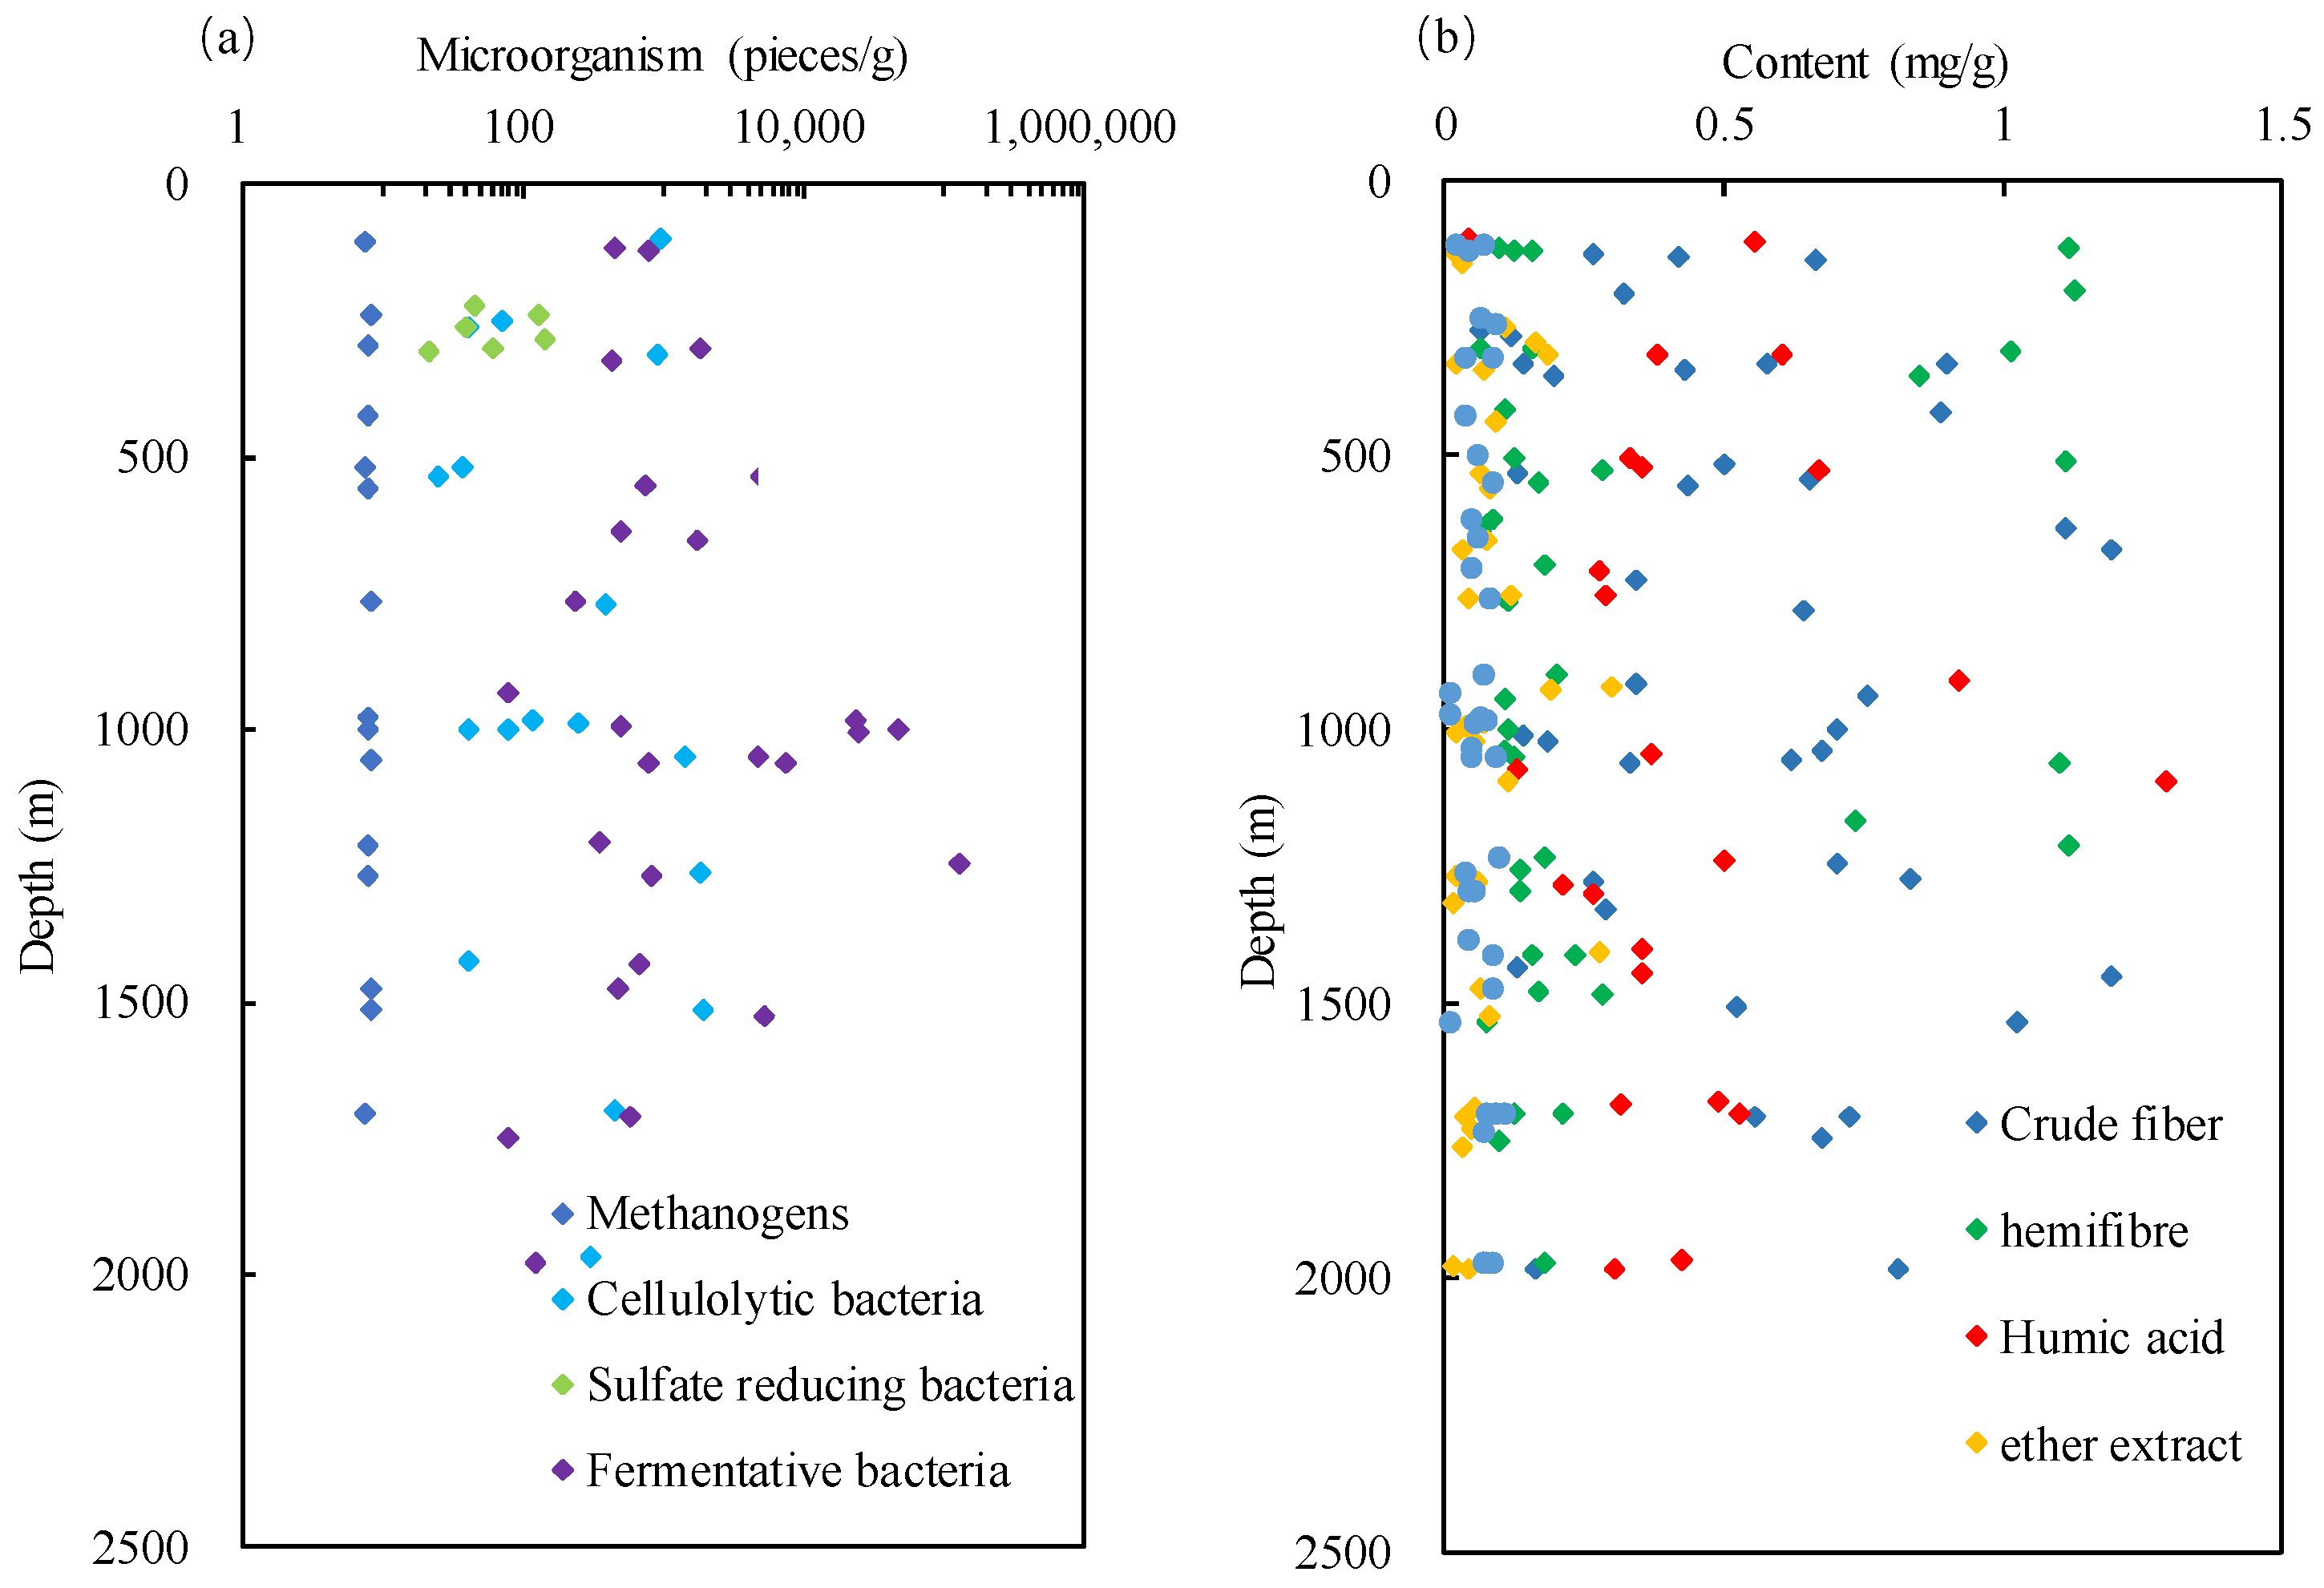
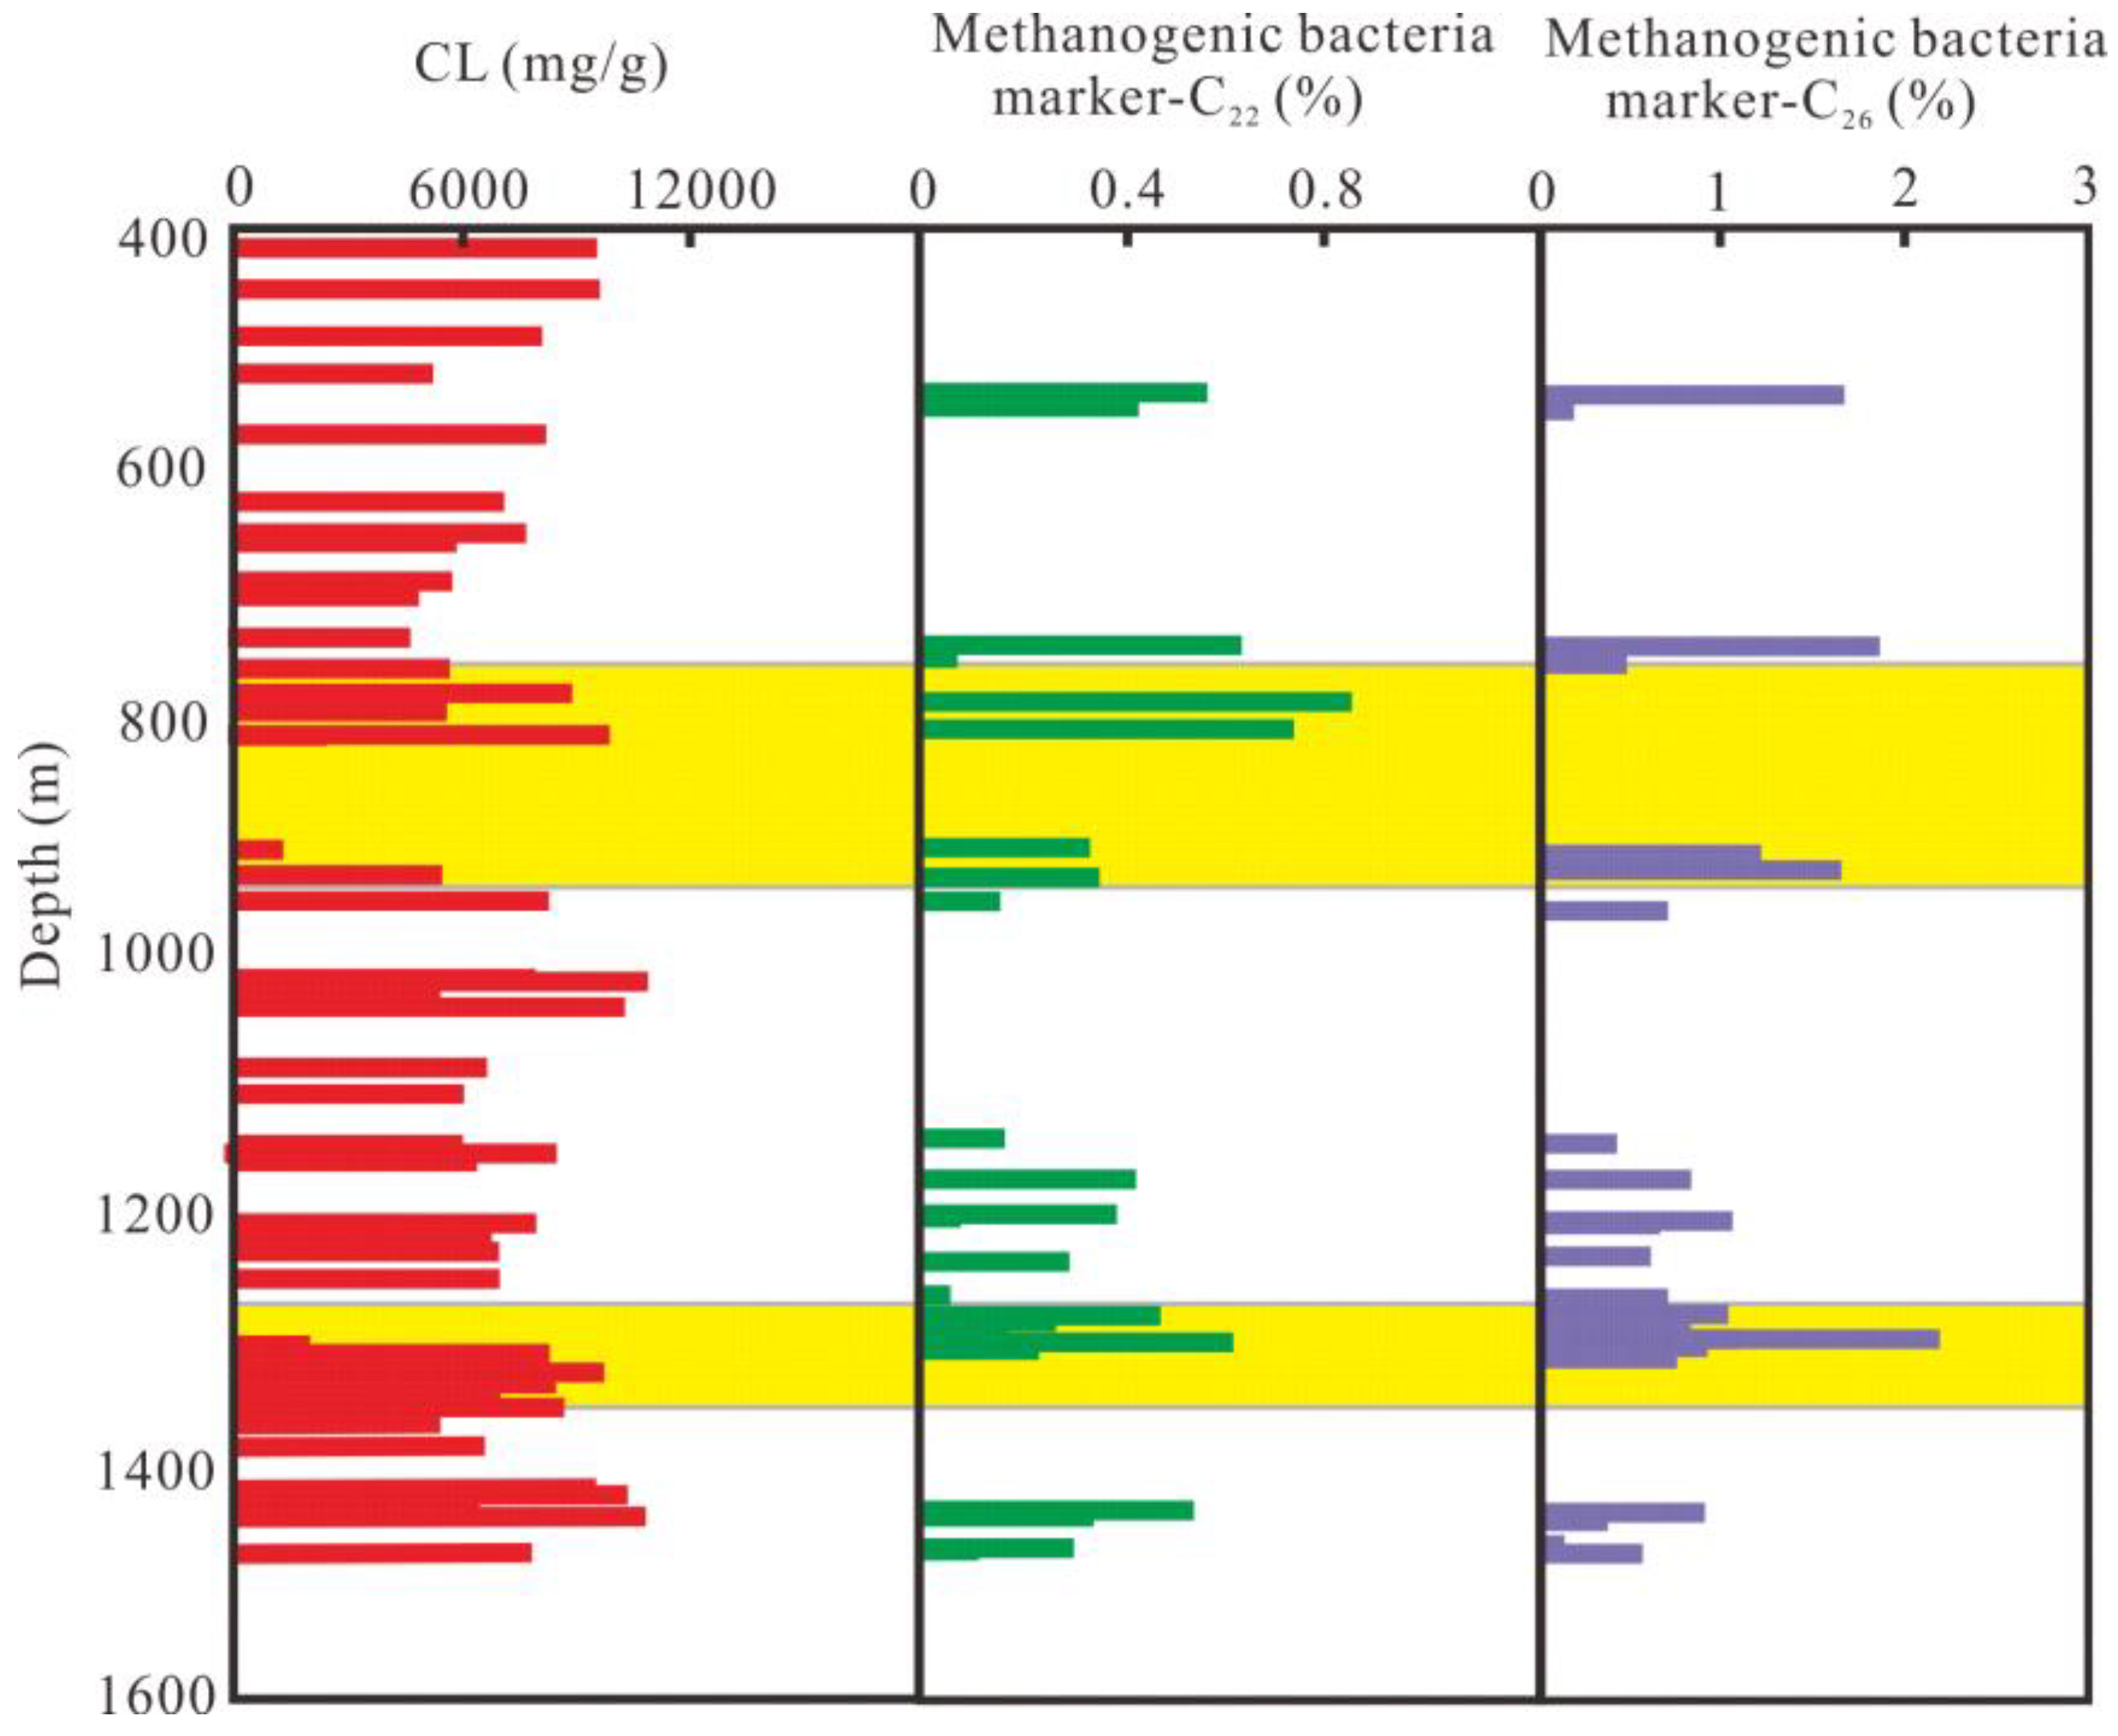
4.1.2. Microorganism

Biogas is one of the final products produced by the biochemical coupling reaction of microorganisms in the diagenetic evolution stage of shallow burial depth. Microorganisms undergo the hydrocarbon generation reaction by dividing the reaction matrix into two stages in the early stage. The first stage is the decomposition of organic components, such as cellulose and lipid compounds by microorganisms to obtain organic acids, methanol and carbon dioxide. In the second stage, sulfate-reducing bacteria reacted with the products obtained in the first stage to oxidize organic acids (such as propionic acid fatty acids) into acetic acid, carbon dioxide and other substances. Finally, methane bacteria decompose and metabolize the products of the above two stages and obtain the final products, such as methane and carbon dioxide. In summary, the types and numbers of microorganisms and their effective utilization of organic matter components jointly control the hydrocarbon generation intensity of shale.
There were significant differences in the vertical distribution of biological colonies in the Qigequan Formation of Quaternary in the Sanhu area. The distribution law was mainly as follows. Sulfate-reducing bacteria were the main bacteria in the strata above 200 m. Cellulose-degrading bacteria and fermentation bacteria were distributed from shallow to deep in the strata. There was a peak period of reproduction and development in the strata of 200~600 m and 1000~1600 m, and the number increased significantly. Due to the increase in temperature, the colonies below 1600 m were rarely developed. The distribution of methanogens is mainly concentrated at 1000~1200 m, mainly bacillus, coccus and sarcinus, which is the peak of methane production (Figure 4a). There is no obvious difference in the vertical distribution of crude fiber, semi-fiber, humic acid and other components of the main role of microorganisms. The organic components of the Qigequan Formations are distributed from shallow to deep (Figure 4b). From the perspective of provenance, the shale of Qigequan Formation has the possibility of gas generation from shallow layer to deep layer, and the gas generation process has continued until now, thus forming a large Quaternary biogas field group.

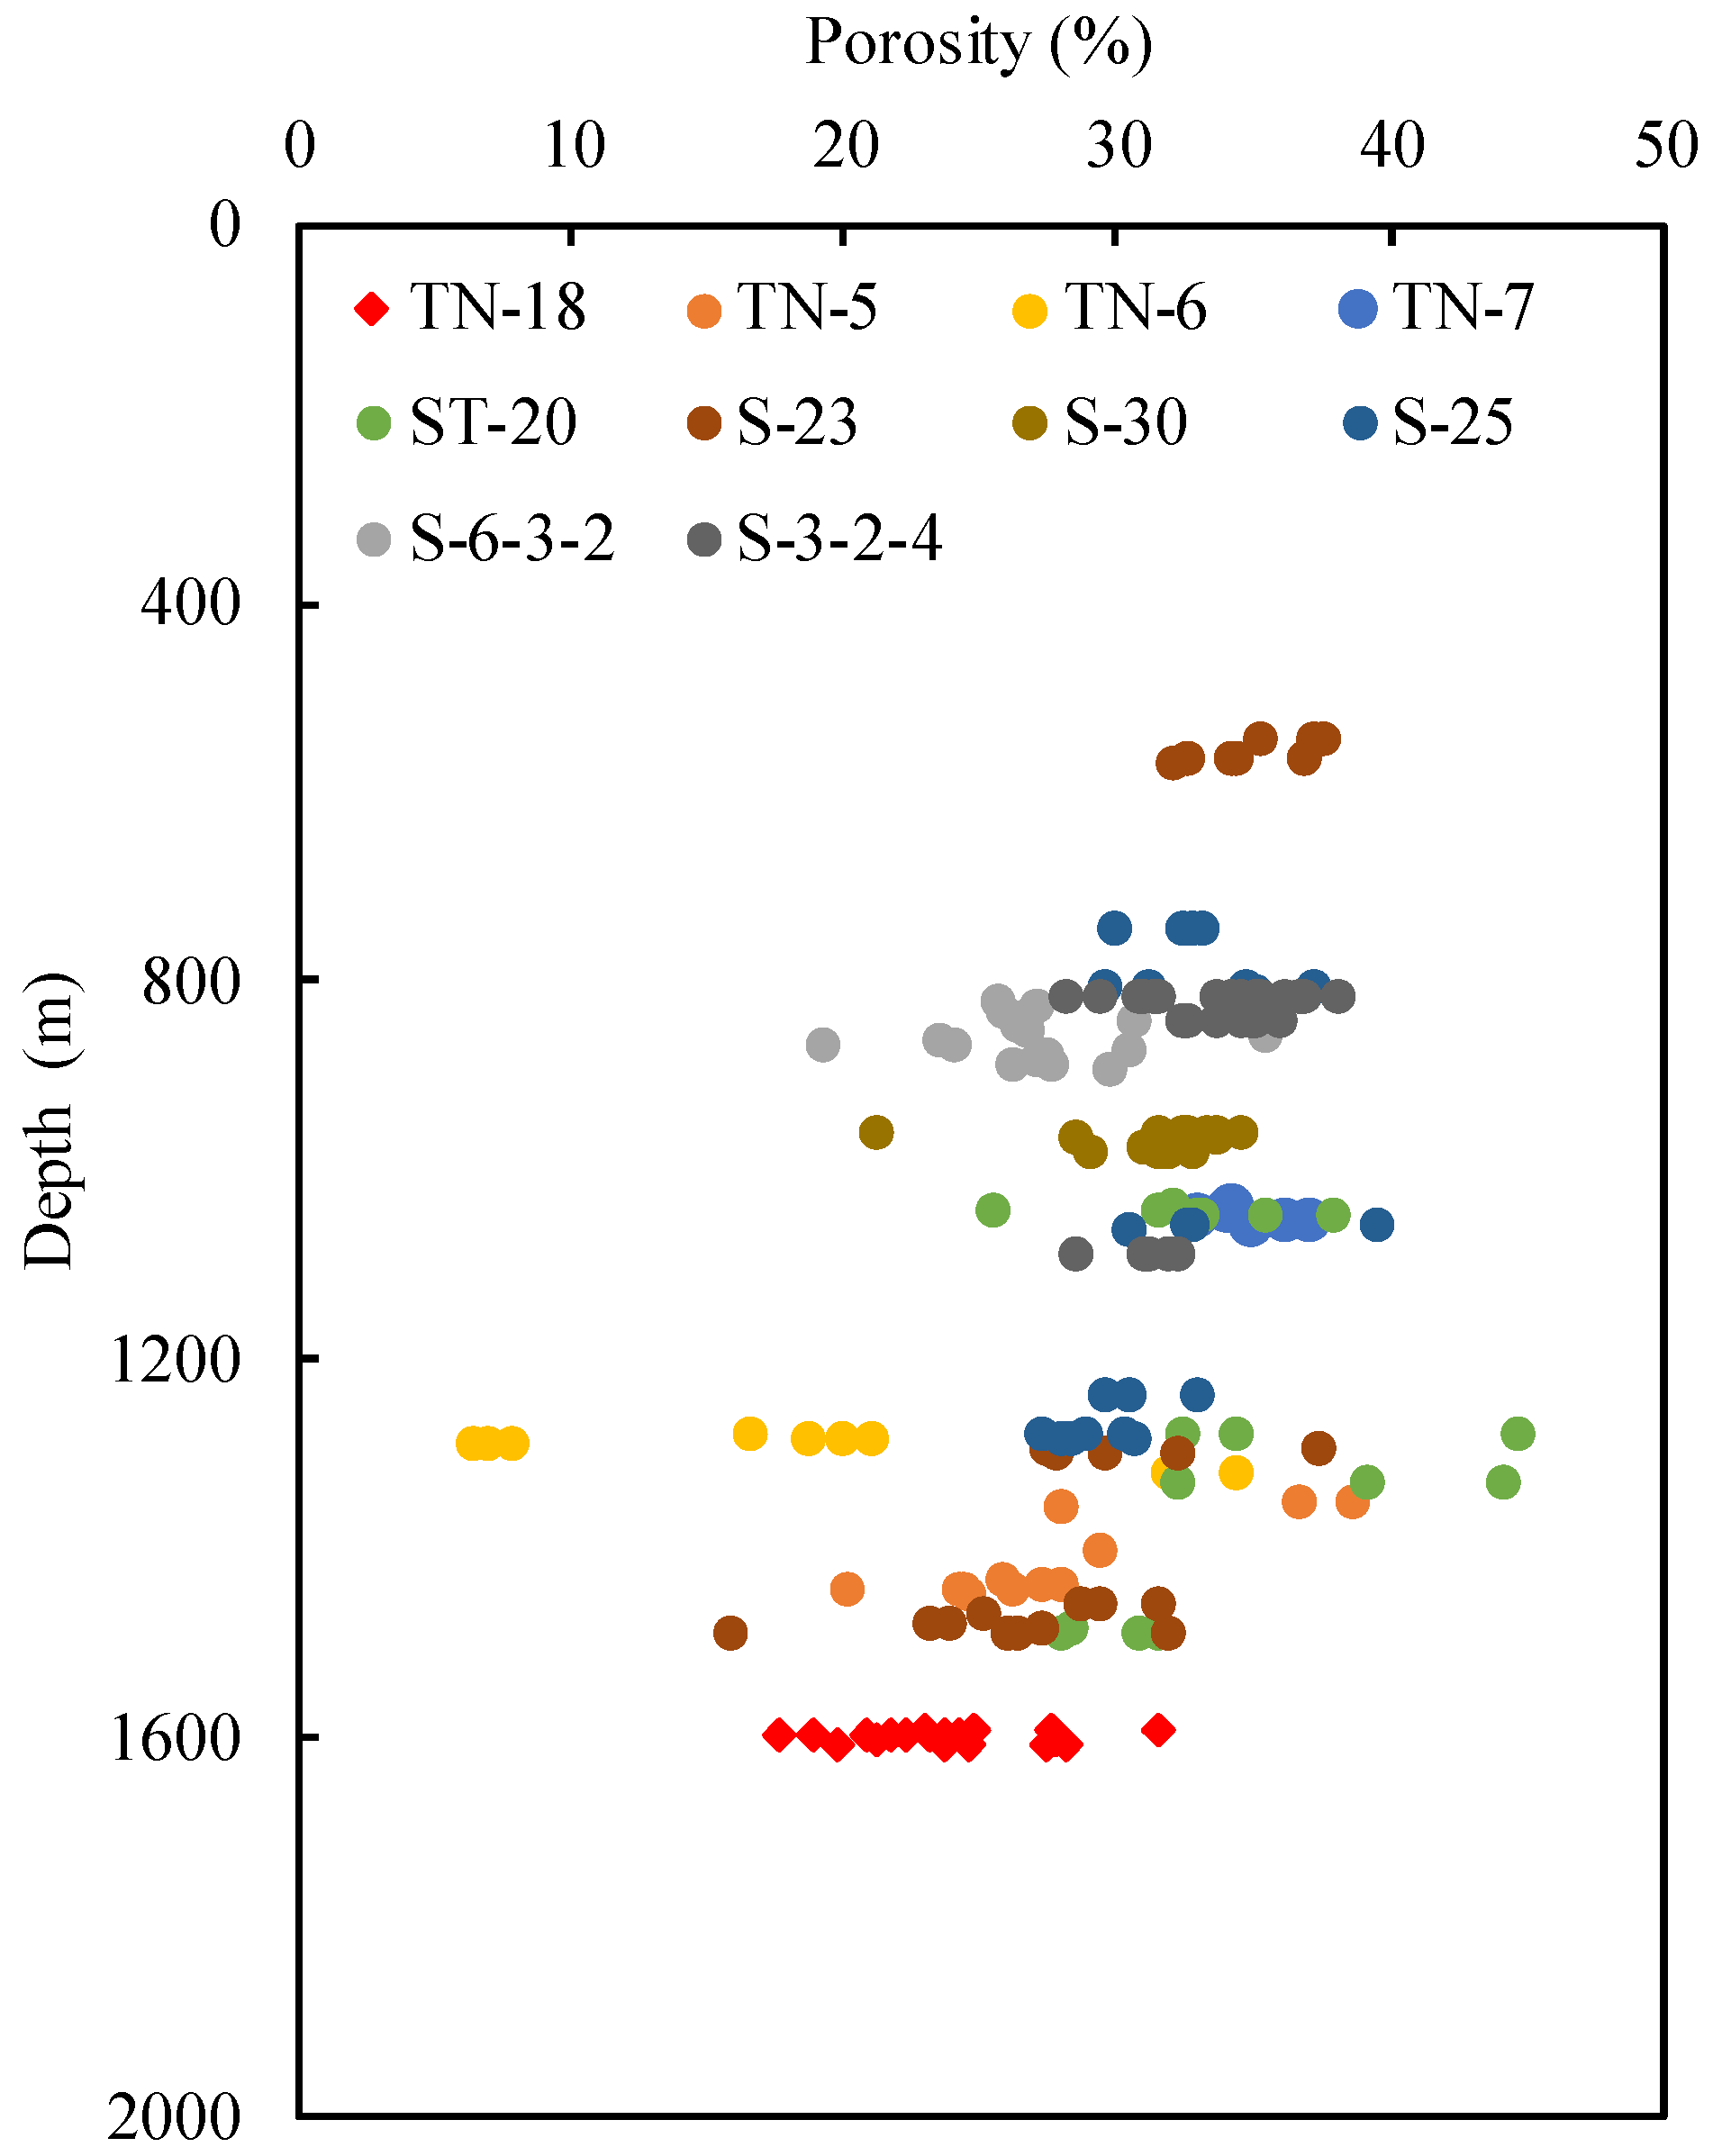
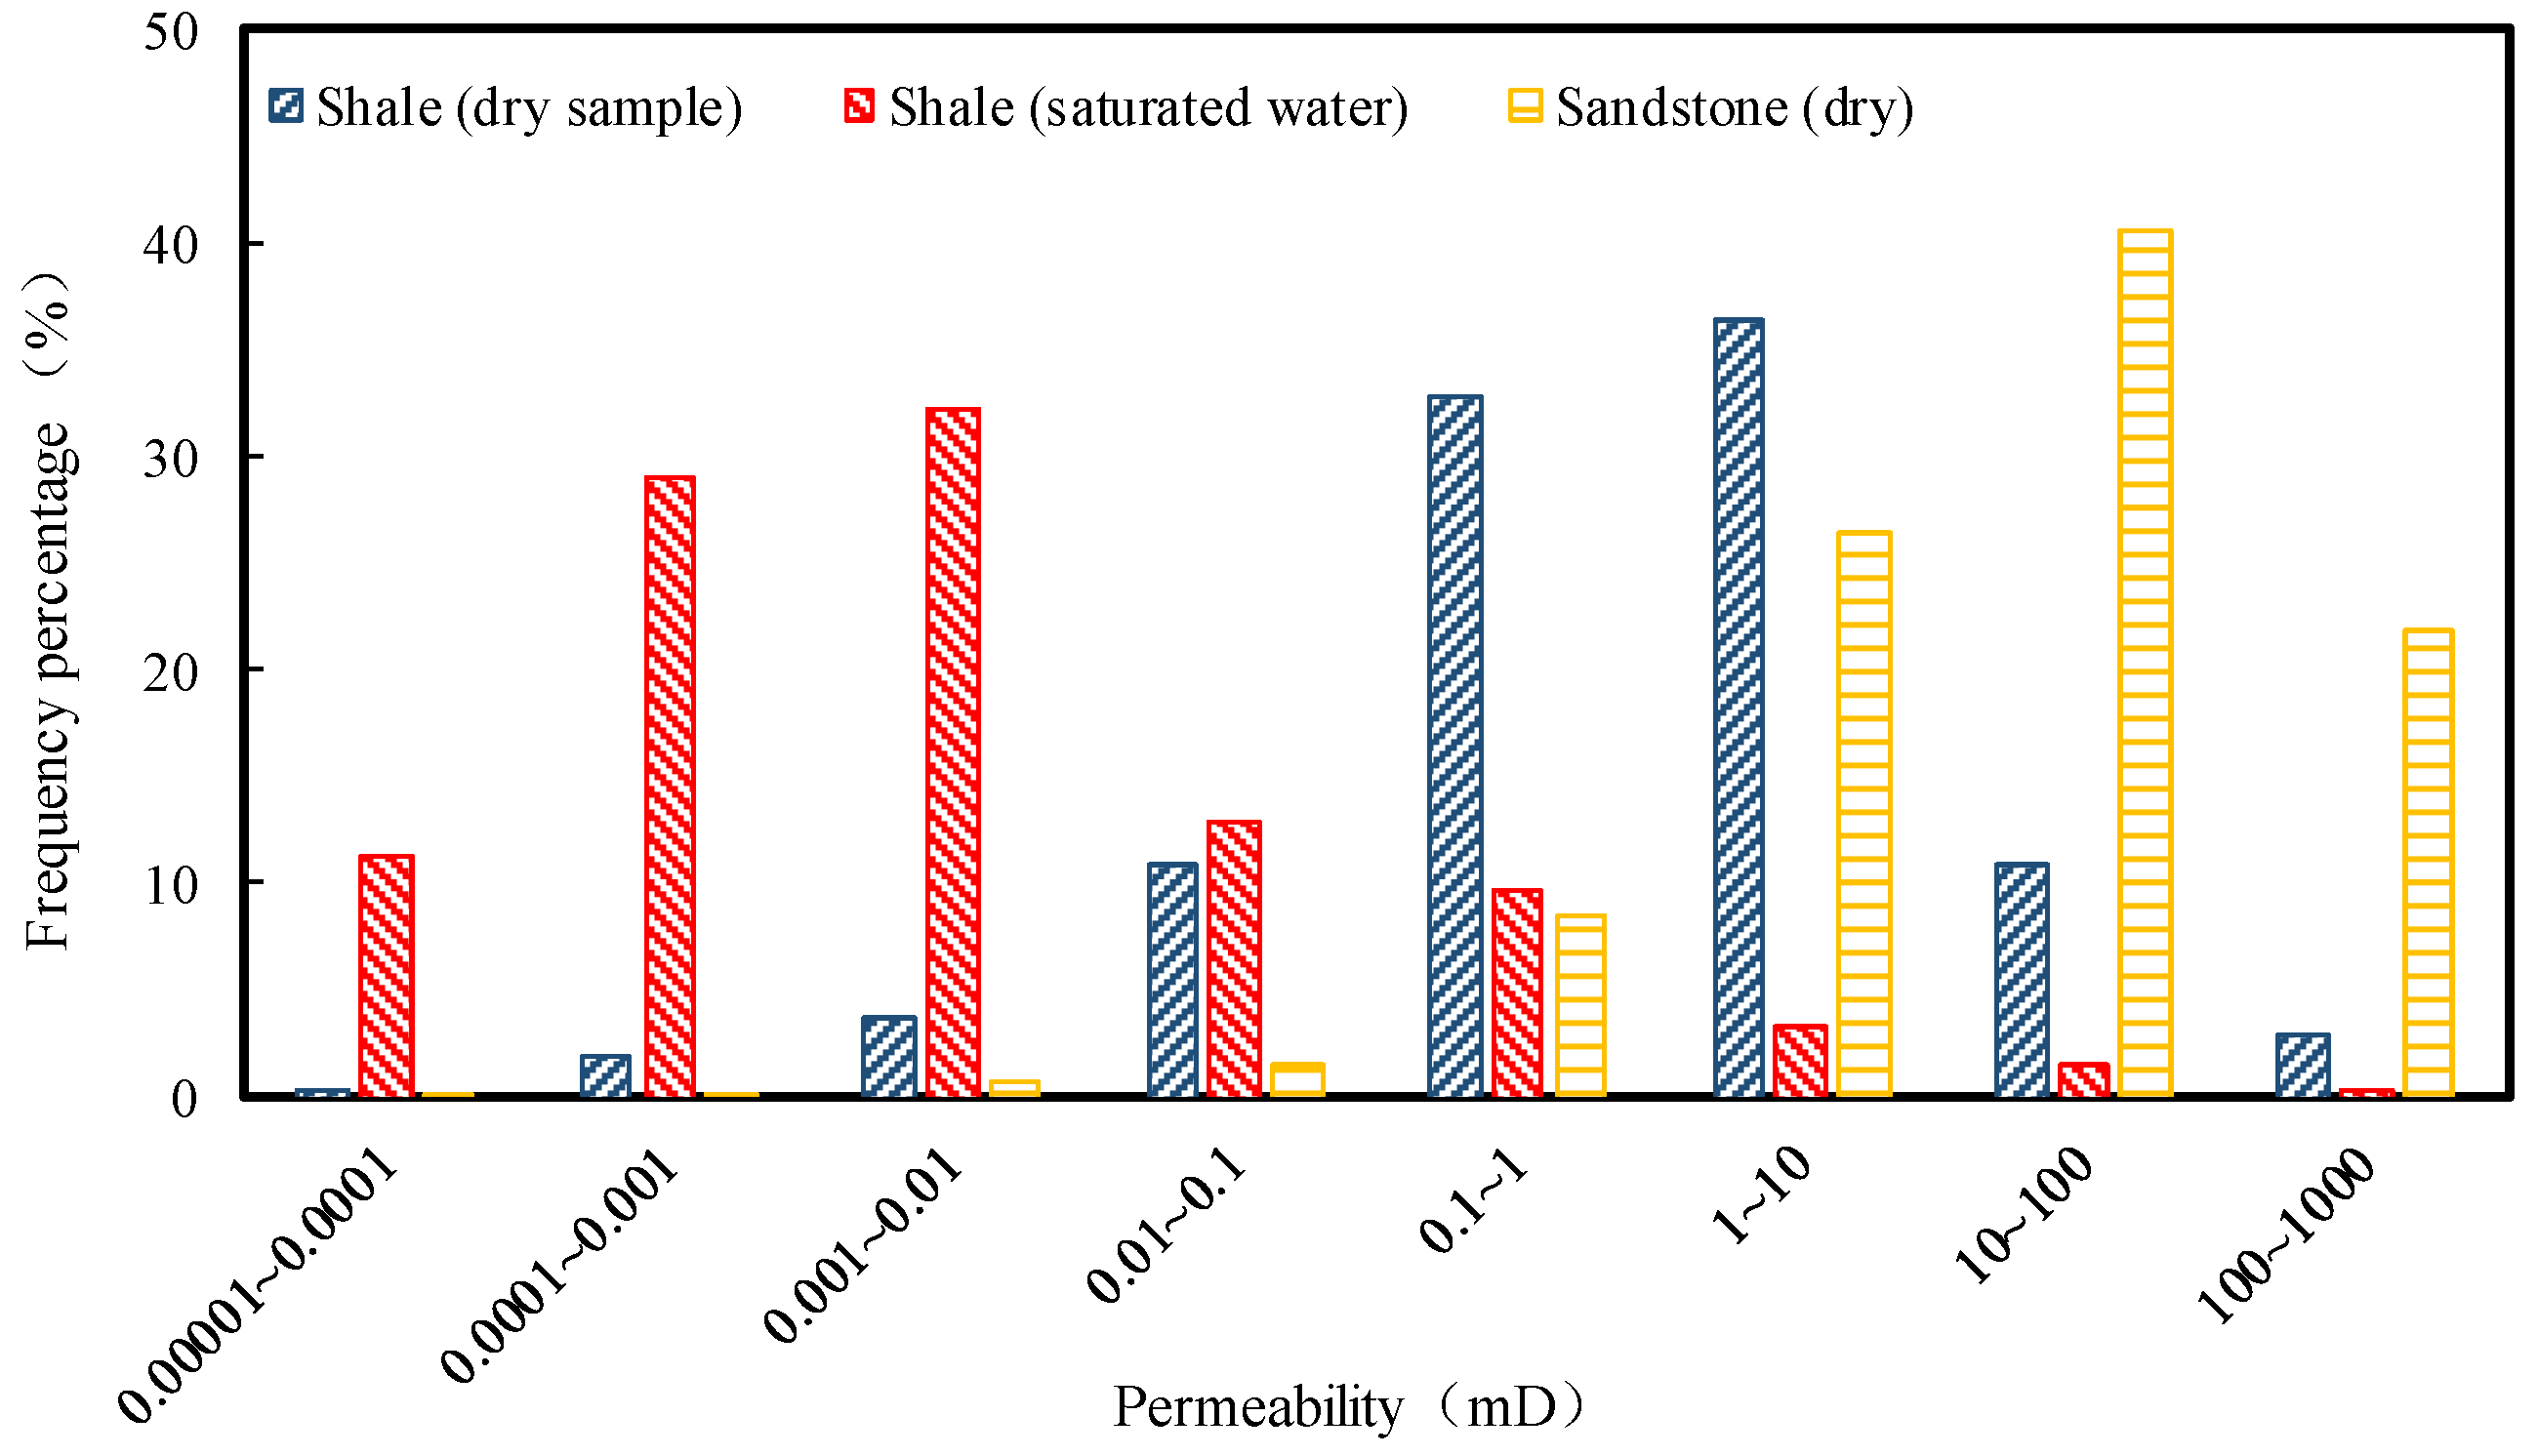
4.1.3. Porosity and Permeability
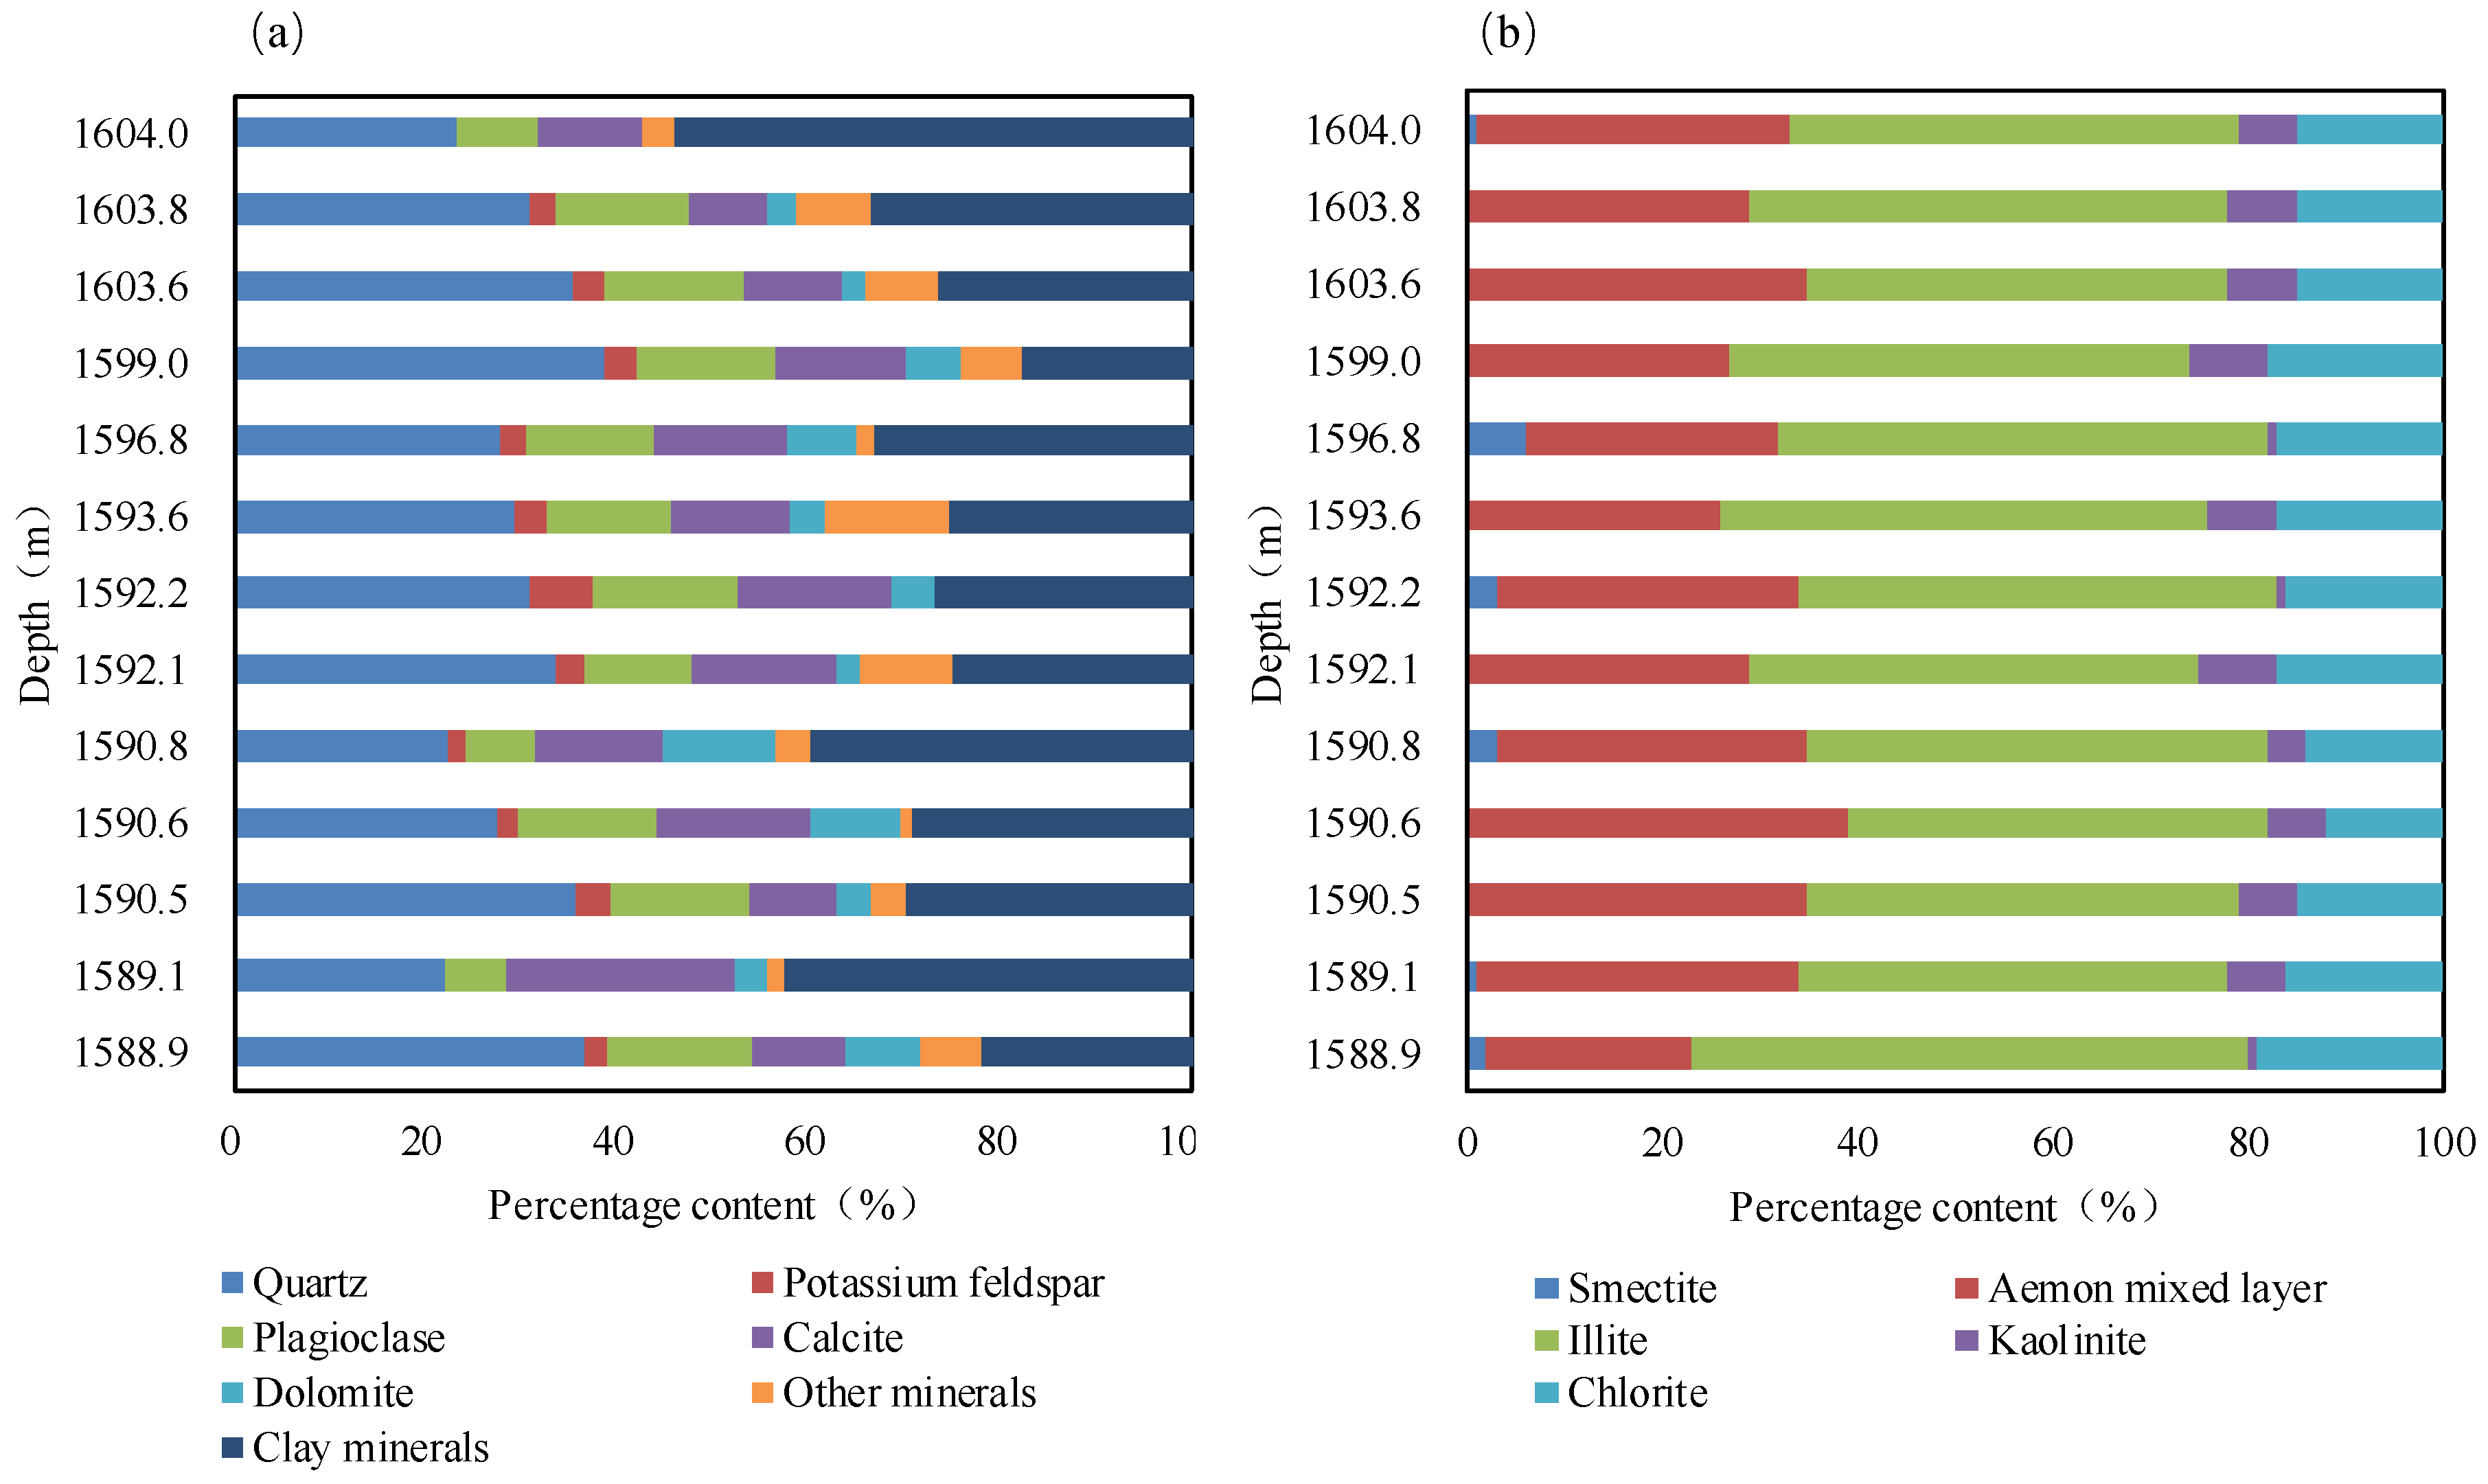
The porosity of Quaternary shale in the Qaidam Basin gradually decreases with the increase of depth. Due to the fast deposition rate and weak compaction, the overall porosity of the shale is 15~30% (Figure 5) rock with good storage space. The permeability of Quaternary shale is about 0.1~10 mD (Figure 6). The Quaternary shale has developed clay minerals, which swell when exposed to water. Therefore, after saturation with the formation water with the high salinity in the approximate study area, the permeability decreases by three degrees. Therefore, the Quaternary shale in the Sanhu area is a set of reservoirs with high porosity and low permeability, which provides a large amount of pore space for the occurrence of free gas and favorable conditions for the preservation of gas.

4.1.4. XRD

XRD analysis results (Figure 7a) show that terrigenous clastic components are mainly quartz, feldspar and clay minerals, and a small number of samples develop stone salt, anhydrite and other minerals. The whole rock mineral mass fraction of quartzite is 22.1~38.6%, with an average value of 30.3%. Under the microscope, the quartz is mainly irregular granular, and the grinding circle is sub-angular, and the sorting is good. The mineral mass fraction of feldspar ranges from 6.4~21.8%, with an average of 15.1%. The mineral mass fraction of carbonate ranges from 10.9~27.0%, with an average of 18.2%. The content of terrigenous detrital stable components quartz and clay minerals is relatively high, feldspar is also relatively stable plagioclase, and mineral composition maturity is high.
The clay minerals in the argillaceous rocks in the Sanhu area are mainly illite, with the relative content ranging from 43~57%, with an average of 47.3%. The second is Aemon mixed layer and Chlorite, the content of the Aemon mixed layer is 21~39%, with an average of 30.4%; the content of Chlorite ranged from 12~19%, with an average of 15.85%. The content of Kaolinite ranged from 1% to 8%, with an average of 5.23% (Figure 7b). Montmorillonite is only found in some rock samples of the Tainan Gas field. Quaternary clay minerals are mainly illite and lack montmorillonite, which is caused by the special sedimentary environment. The quaternary salt water medium is rich in potassium ions, which lays the foundation for a large amount of illite formation. Clay minerals have strong expansibility when they meet water under the conditions of high water saturation in the Sanhu area, due to the hydrophilicity of clay minerals, the sealing ability of quaternary mud shale will be greatly improved.
The content of brittle minerals in mud shale is high, concentrated at 45~55%. Moreover, the brittleness index of Sebei No. 1 shales is the highest, and the proportion of shales with a brittleness index between 45% and 55% is 85%. It indicates that in the mud shale in this area it is easy to form secondary pores, such as fractures and it has good storage performance (Figure 8).

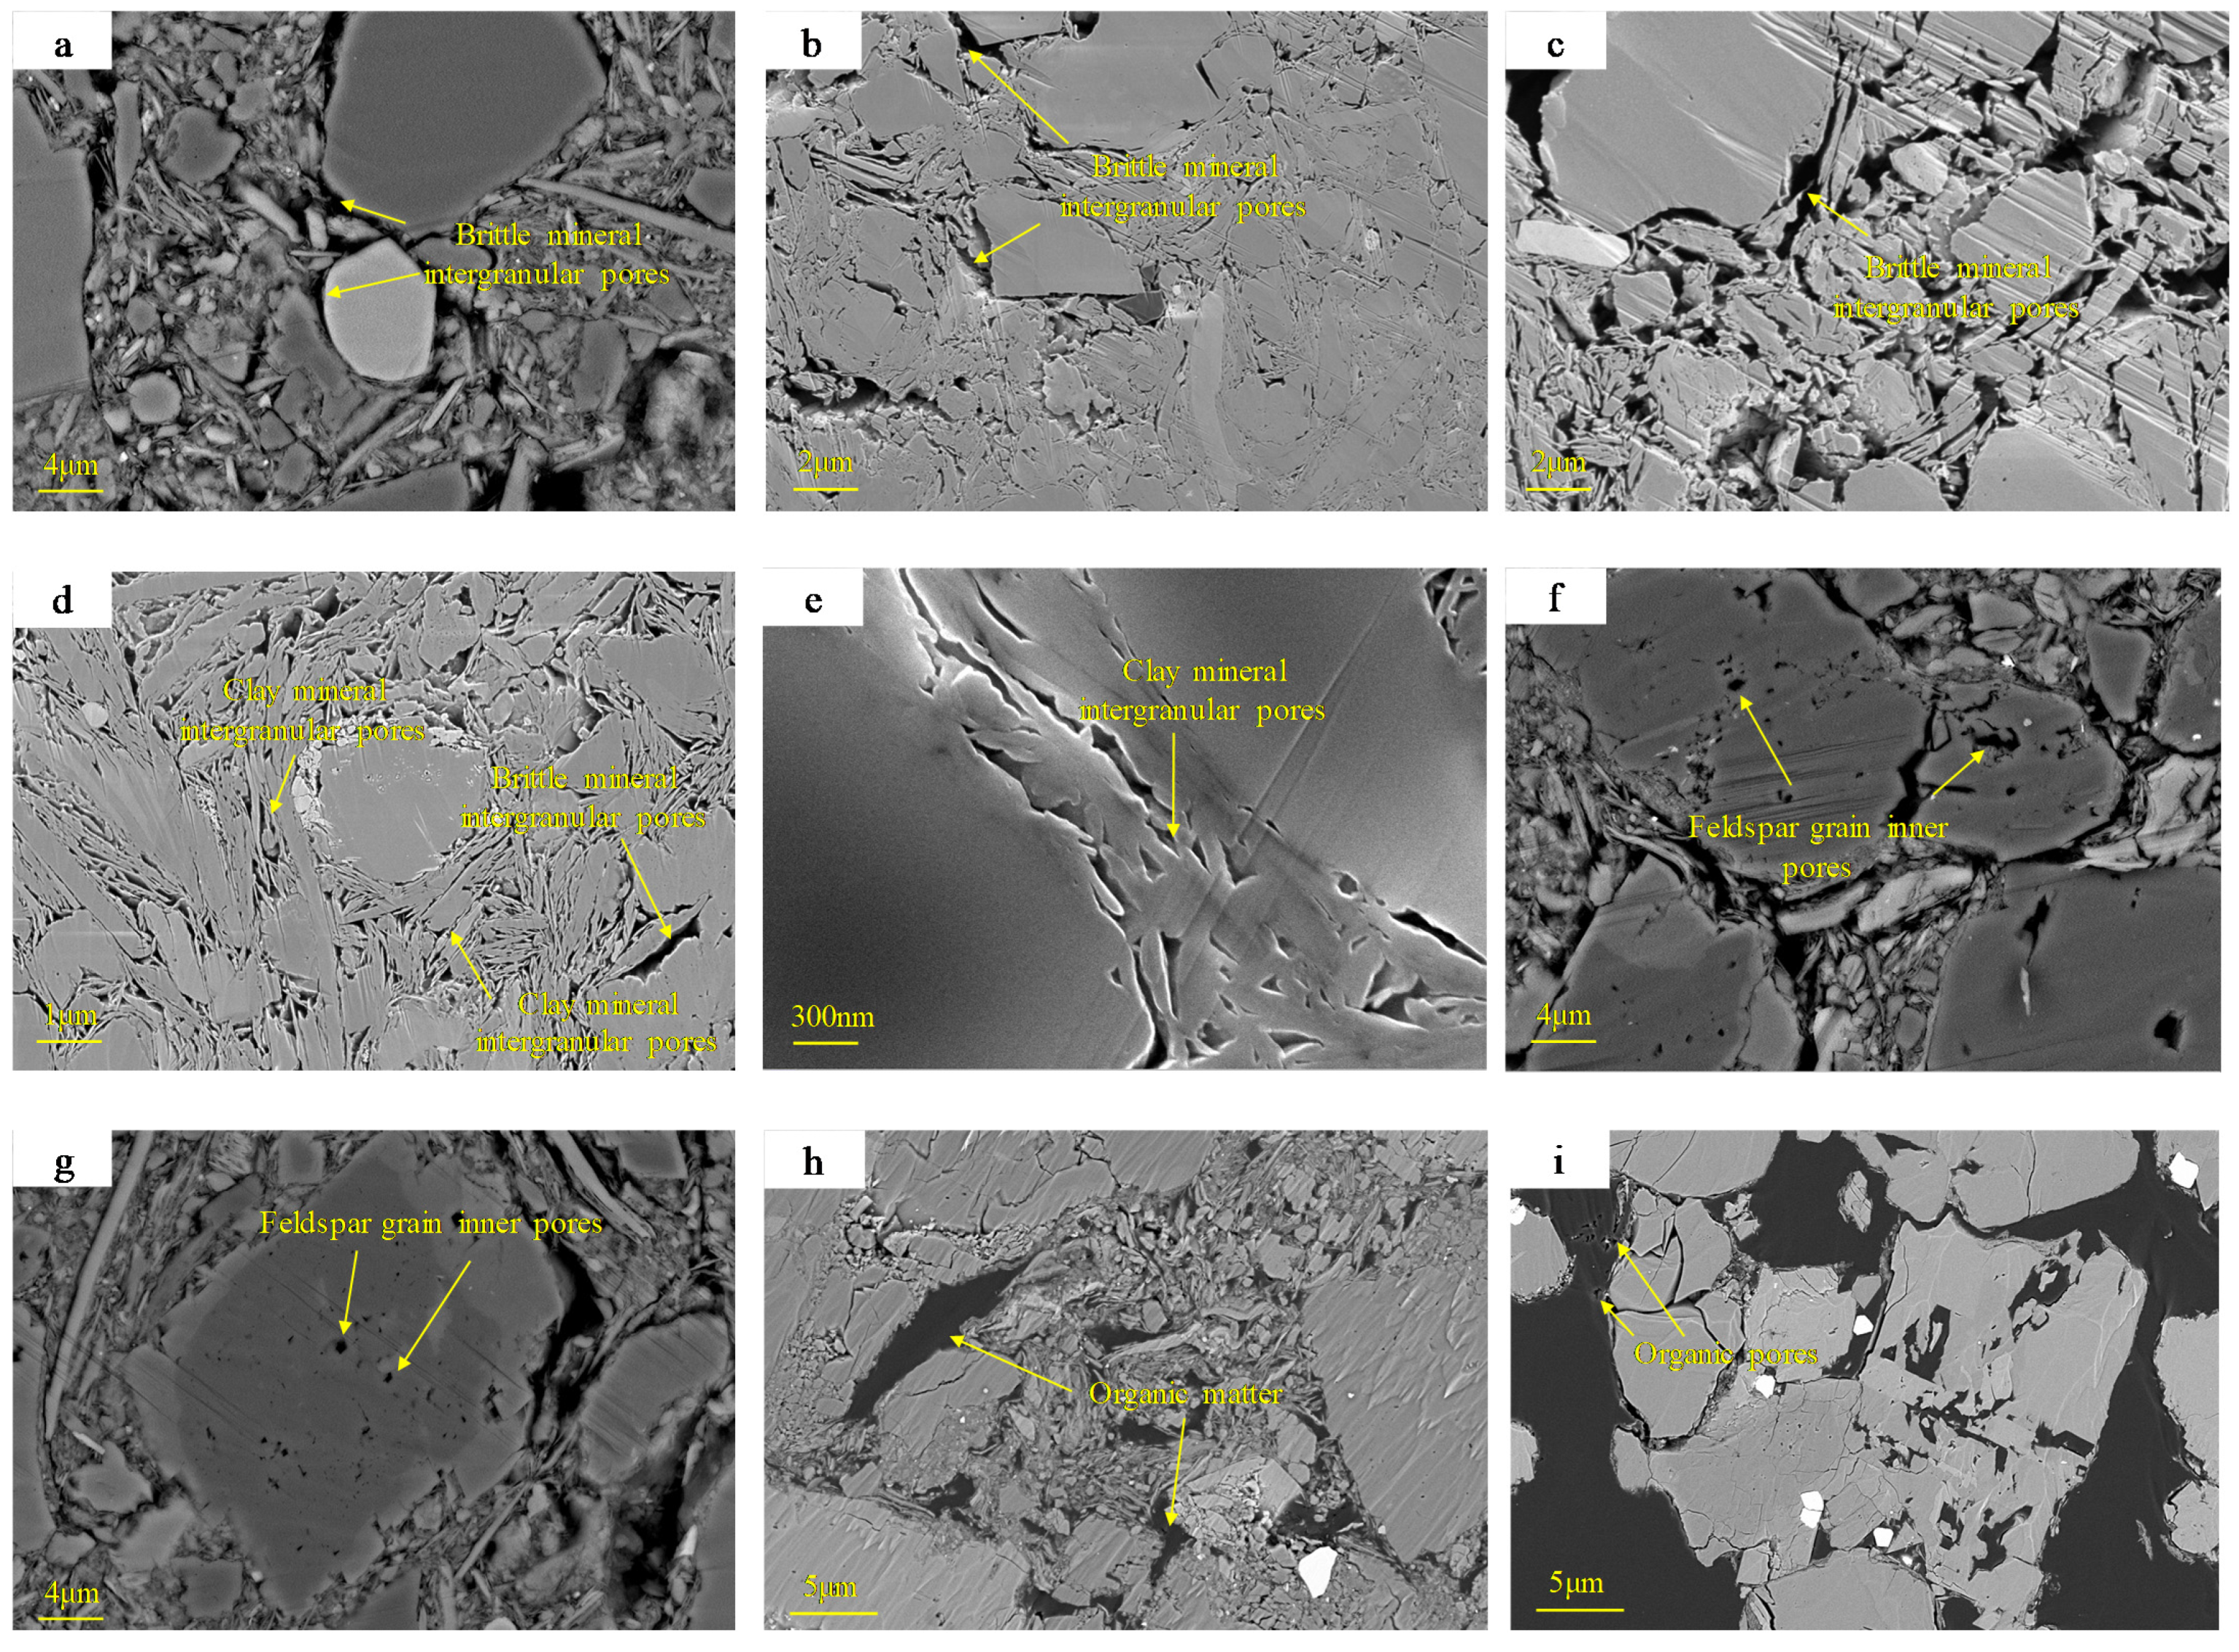
4.2. Pore Types and Morphological Characteristics

The shale of the Qigequan Formation of Quaternary in the Sanhu area can be divided into inorganic pores and organic pores according to their genetic types. Organic pores are mainly formed in the interior or surface of organic matter due to the contraction of thermal hydrocarbon generation. Inorganic pores are the pores formed by deposition and diagenesis of inorganic minerals, which can be divided into intergranular pores, intragranular pores and dissolution pores.
There are three kinds of inorganic pores in the shale of the Qigequan Formation of Quaternary in the Sanhu area. The first type is the pores existing between rigid mineral particles, such as quartz, feldspar and other minerals (Figure 9a–c). The shale of the Qigequan Formation is in the weak diagenetic stage, and the primary intergranular pores have not been destroyed, so they are relatively developed. The pore size range is mostly in dozens of nanometers to microns, the long axis type is the majority. The second type is a small number of pores and fractures between clay minerals, with pore sizes ranging from tens of nanometers to one hundred nanometers, and most of them are narrow and long (Figure 9d,e). The third type is the dissolution pores formed on the surface of feldspar minerals by the action of acidic fluid. The pore sizes are relatively small and generally at the nanometer level (Figure 9f–h).
The shale of the Qigequan Formation of the Quaternary system in the Sanhu Depression is generally buried shallow. Meanwhile, The Qaidam Basin is located on a plateau and the thermal evolution degree of shale is low due to low temperature. Therefore, organic pores in the quaternary shale reservoir are rarely developed, as shown in the figure, a small amount of organic pores were observed in the shale sample (Figure 9h,i). This is because organic pores are controlled by the abundance and maturity of organic matter, the overall TOC of the shale in the Qigequan Formation ranges from 0.07~0.23%, and the vitrinite reflectance of organic matter is mostly less than 0.5%, the shale of the Qigequan Formation has less organic matter and is in an immature stage, so it can not meet the demand of a large amount of organic pores development.

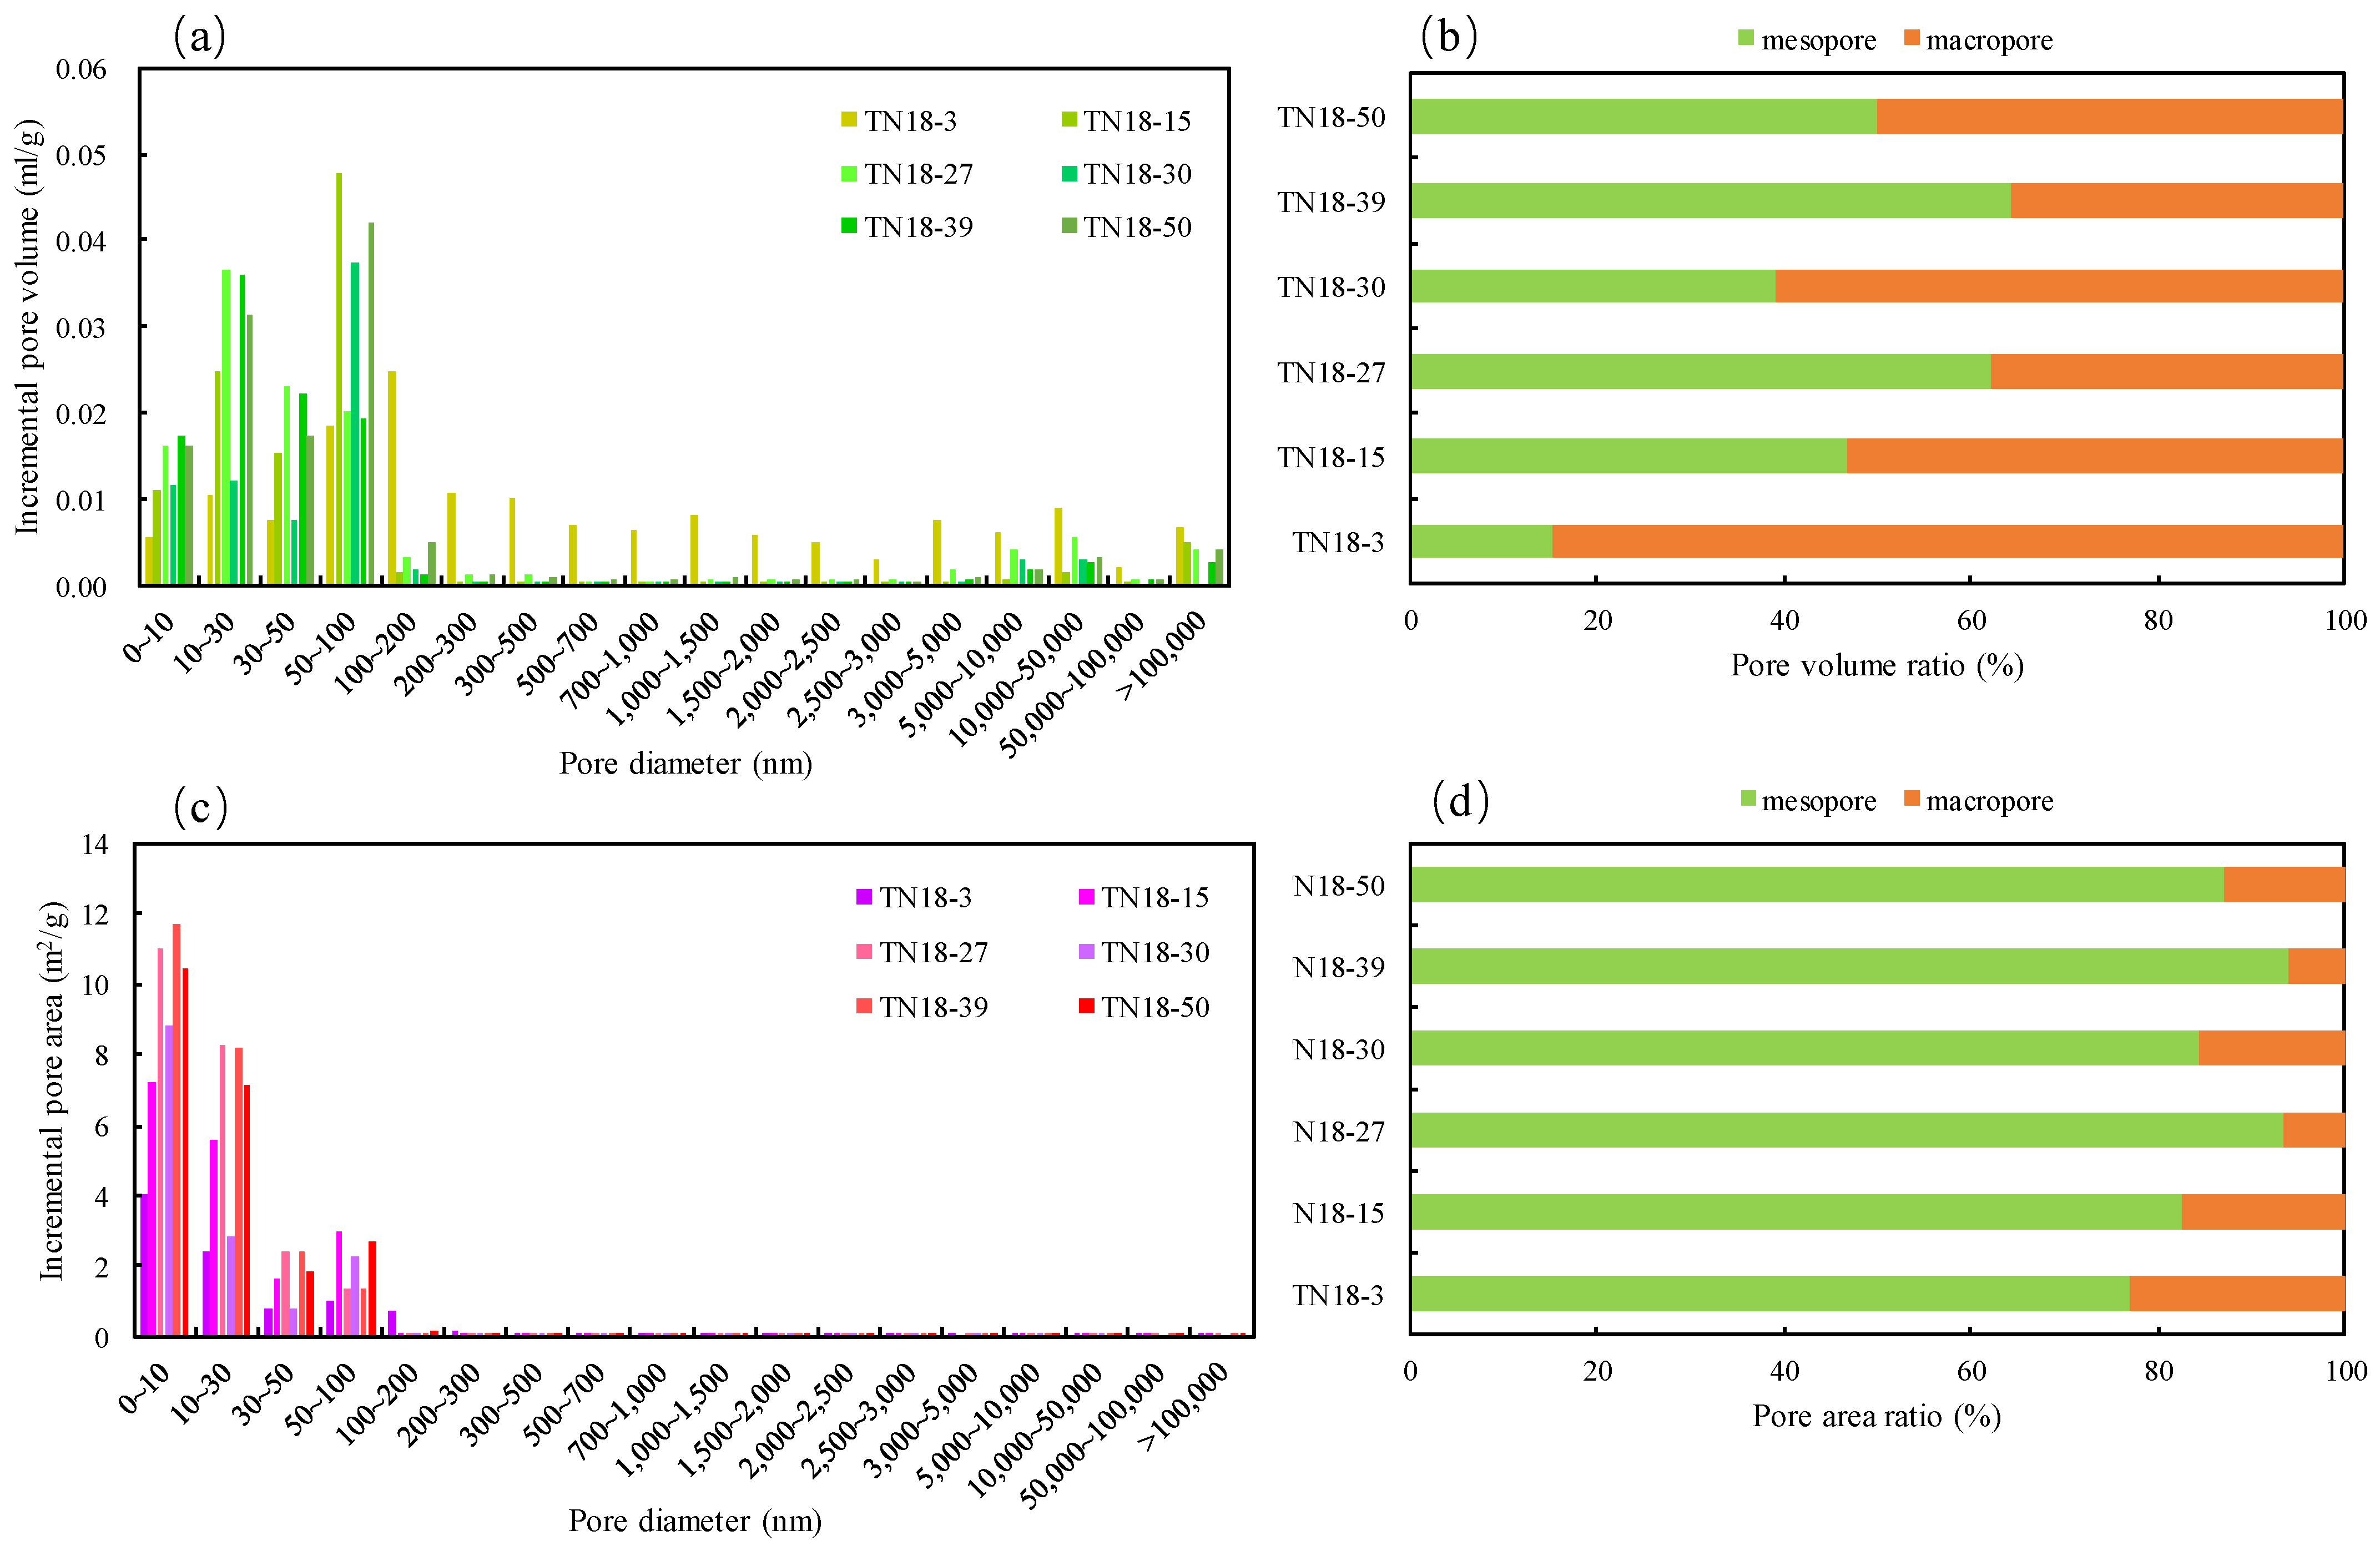
4.3. Quantitative Characterization of Pore Structure

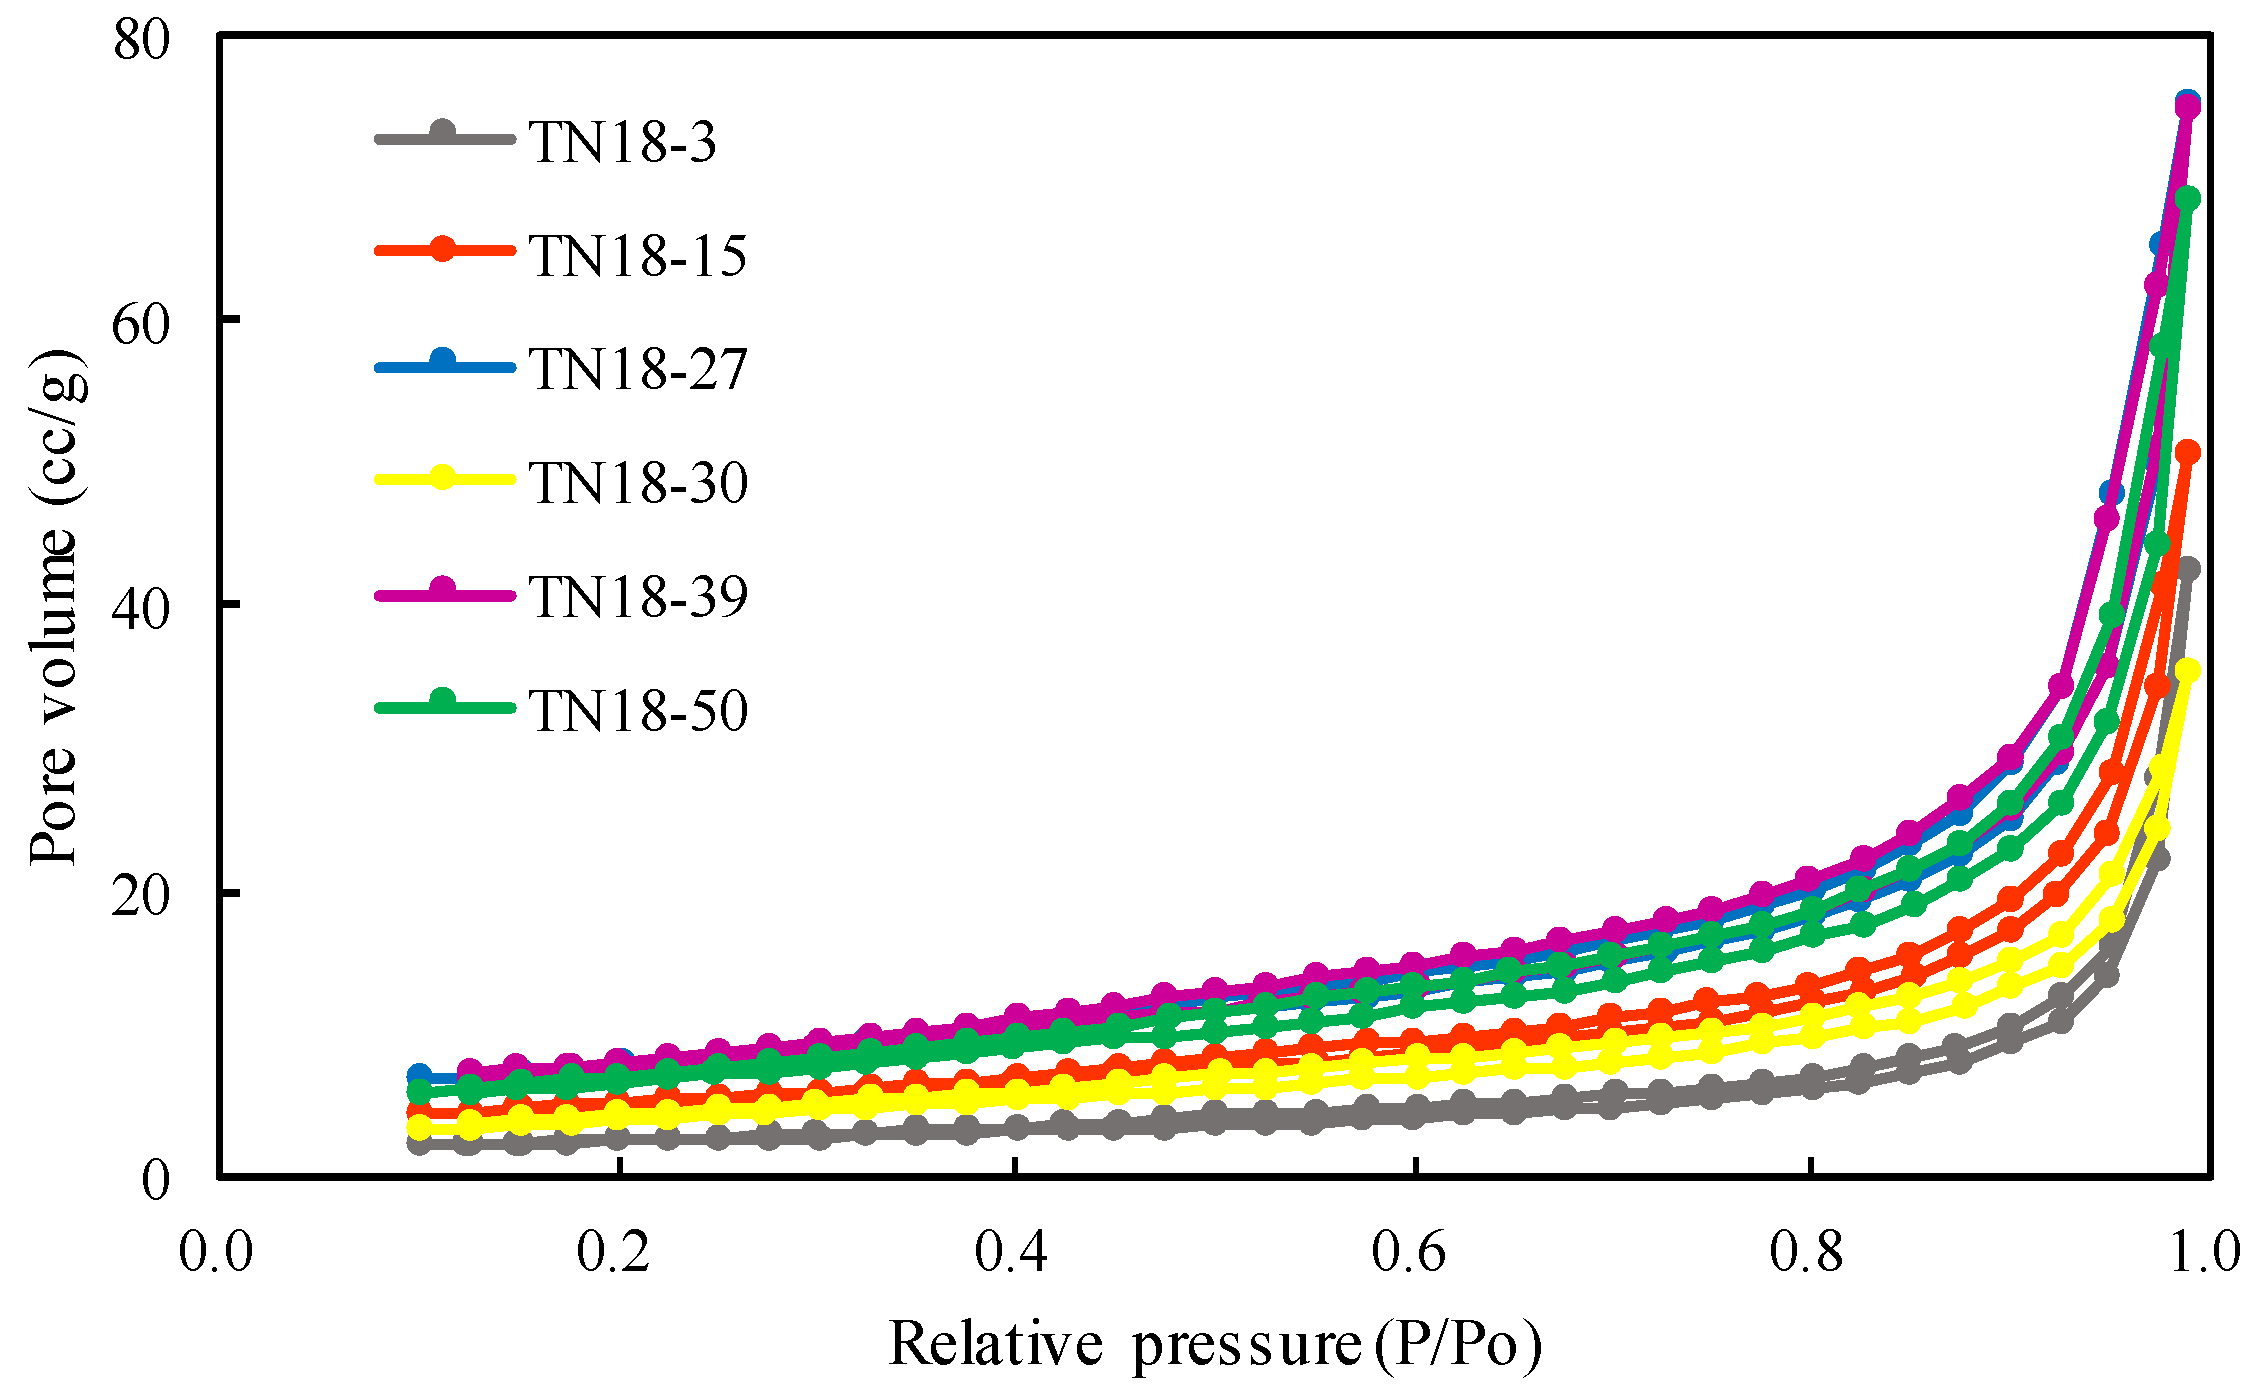
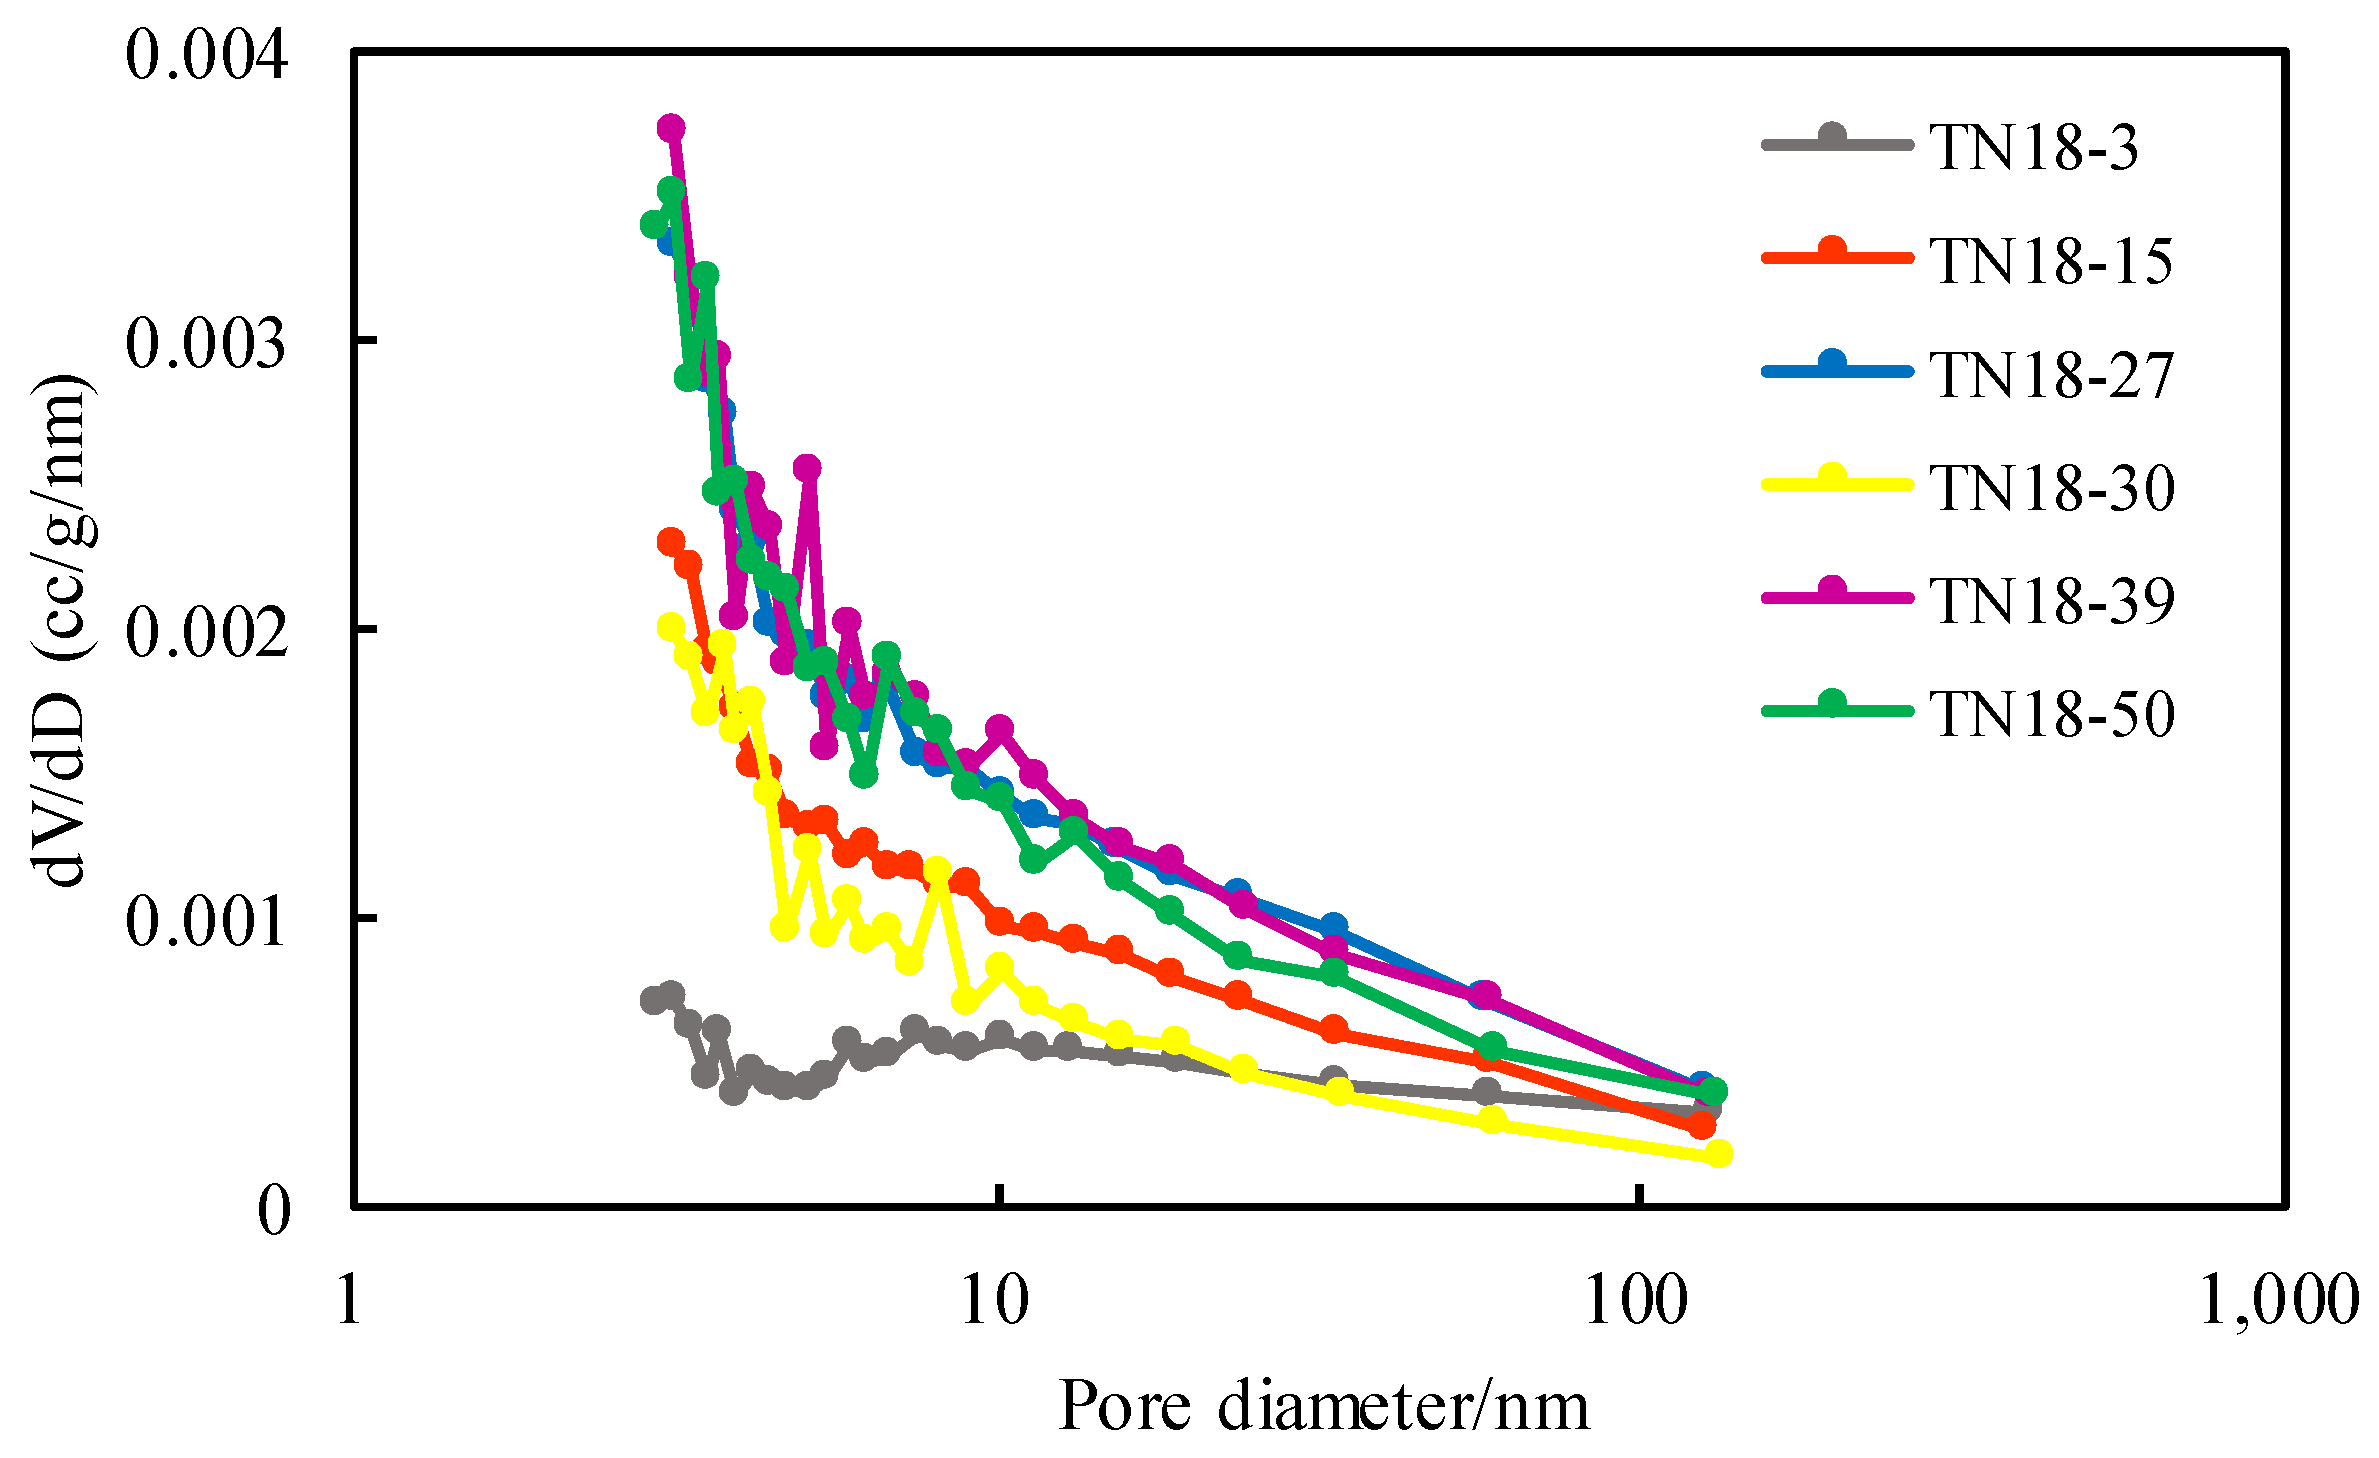
4.3.1. Pore Structure Characterization Using N2 Adsorption

According to the classification scheme of nitrogen adsorption hysteresis loop by IUPAC, shale samples mainly developed H3 and H4 pore structures. Most of the pore structures of shale samples are H3 type pore structures, representing four-sided open cone-shaped flat holes, cracks and wedge-shaped tube holes with two ends open. The adsorption hysteresis loop is small, indicating that the shale pore connectivity is good. H4, which represents the slit type parallel plate hole structure, has the characteristics of some ink bottle holes. Most of them developed flake granular materials, and the adsorption hysteresis of these pores was large, indicating that the shale mesopores were very developed (Figure 10).
The distribution characteristics of pore volume change rate are obtained by the BJH equation. It is found that the pore volume and specific surface area of shale are similar to the pore size distribution. The pore volume of shale is mainly contributed by pores within the pore size range of 5~20 nm. The pores within the pore size range of 20~30 nm of individual samples also provide part of the pore volume, while the pores in the pore section of shale have little contribution to the pore volume and specific surface area (Figure 11).

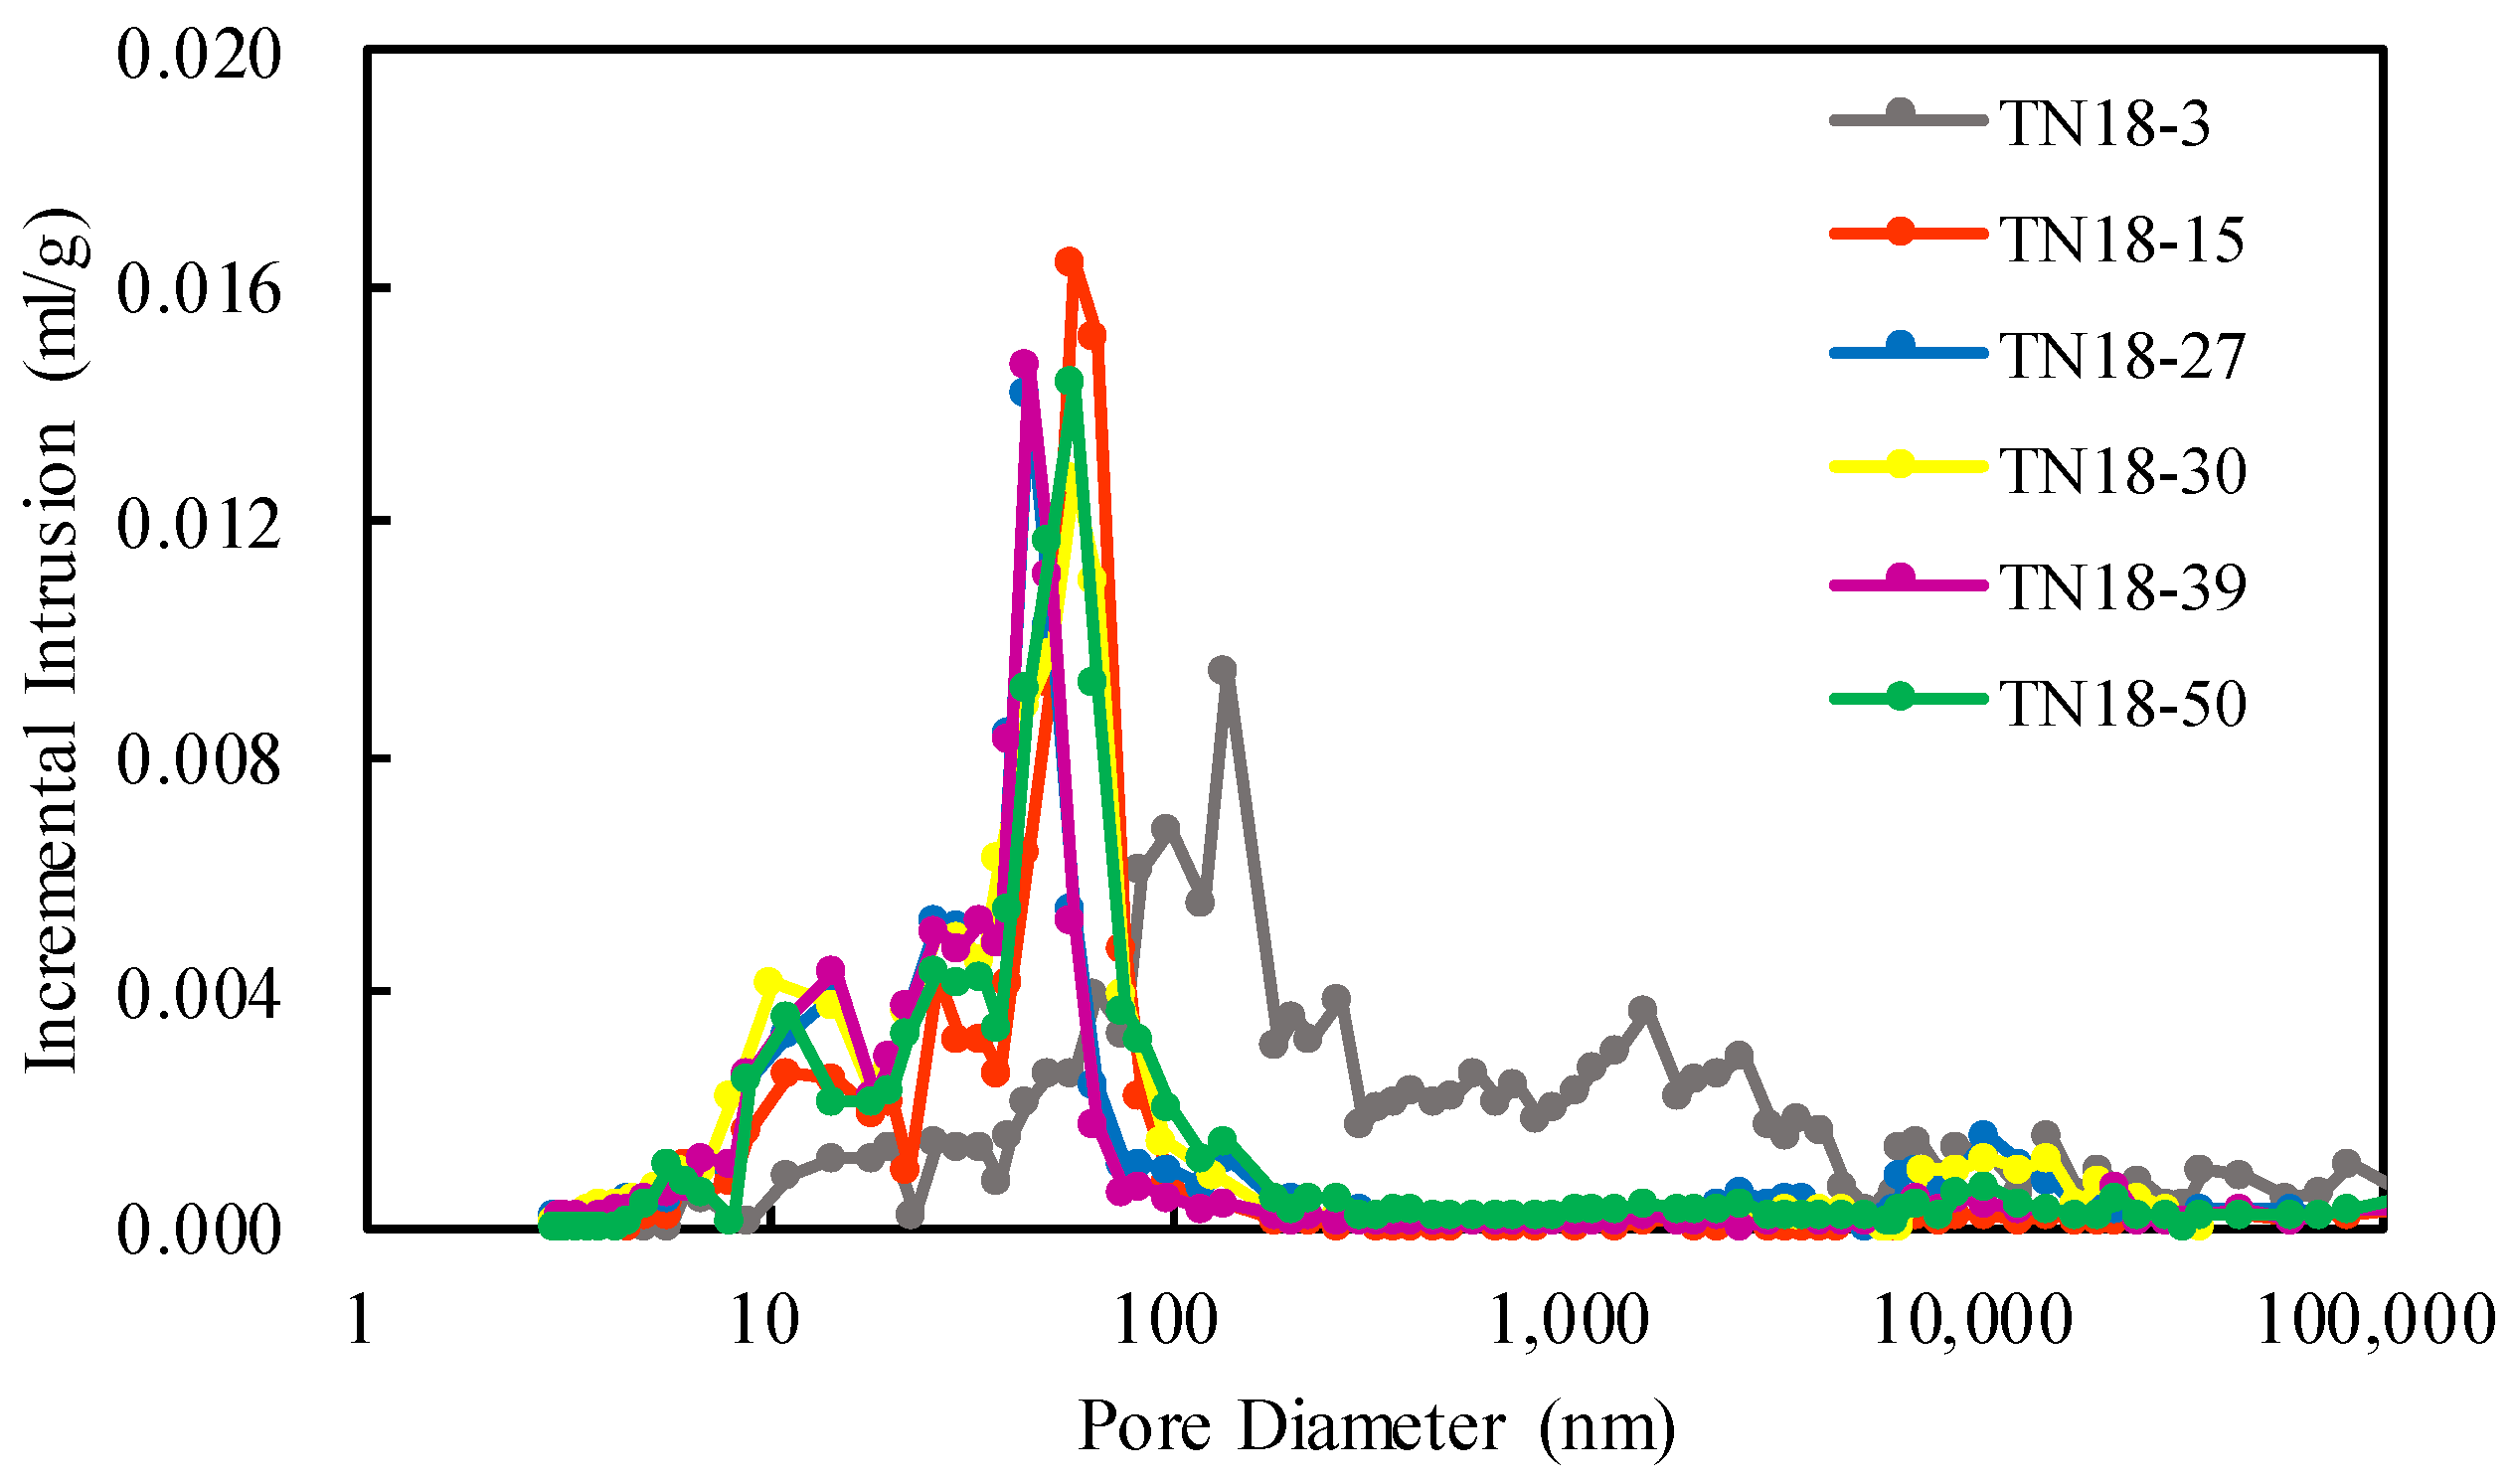
4.3.2. Pore Structure Characterization Using HPMI

Based on the pore size distribution curve of shale under HPMI, the curve results show that the change rate of the pore volume of Quaternary shale in the study area increases first and then decreases with the increase in pore size. The pore volume of shale presents a unimodal phenomenon with the pore size distribution, and the main development pore size is 50~100 nm. The pore volume of some shale (sample TN18-3) presents a bimodal phenomenon with the pore size distribution. The curves of the shale pore size of less than 100 nm in the seven spring groups show obvious changes, indicating that pores within the pore size of less than 100 nm contribute significantly to the total pore volume (Figure 12).

5. Discussions

5.1. Hydrocarbon Generation Characteristics

5.1.1. Late Hydrocarbon Generation

The formation water salinity and total dissolve solids (TDS) of the Quaternary Qigequan Formation in the Sanhu area are relatively high, with an average TDS of 108.8 g/L. Compared with the salinity of seawater (35 g/L), the formation water of the Quaternary Qigequan Formation has a higher salinity, the chemical composition of formation water is affected by evaporation, and the infiltration and mixing of atmospheric precipitation affect the chemical composition of formation water. Strong evaporation is an important cause of formation water salinization, and it also indicates that the overall preservation conditions of the formation in the study area are better.
The high salinity of water inhibits the oxidative decomposition of organic matter in the early stage of deposition, controls the rate of biochemical methane production, and releases it slowly, which is beneficial to the accumulation and preservation in the later stage. When the salinity of shale water-soluble salt (Figure 13a) or the chloride ion content of water-soluble salt (Figure 13b) reaches a certain value, it is positively correlated with its methane production potential, indicating that a high concentration of formation water is beneficial to the preservation of organic matter.

5.1.2. Hydrocarbon Generation Model

Biogas reservoirs in the Sanhu area have the characteristics of “continuous gas generation and late accumulation”. Continuous gas generation is manifested in the following aspects. After stratigraphic deposition, as long as the environment is suitable for the survival of methanogenic bacteria, methanogenic activities begin. A single set of gas source rocks has the ability to continuously generate biogas from the shallow to deep burial. The temporal continuity is shown as follows: in the early stage, acetic acid fermentation generates inherited active organic matter, and in the late stage, secondary organic matter is generated under the thermal effect. The spatial continuity is manifested by the developed multiple sets of source rocks which constitute spatial continuity, which lays a rich material foundation for continuous hydrocarbon generation. The sustained performance of late supplement is the very fast deposition rate formed during early aggregation, and continuous gas supplement early aggregation. Biogas accumulates in the whole biochemical methane production process through the dynamic balance of continuous accumulation, continuous breakthrough, continuous loss and continuous re-accumulation. The dynamic equilibrium of biogas accumulation and dispersion exists in any gas reservoir, and the difference is the degree of strength. Due to the geological background of weak diagenesis in the Sanhu area, natural gas is more likely to be lost, and it is difficult to accumulate without rapid and continuous supplementation. Therefore, the continuous filling of high-quality source rocks is an important factor for biogas accumulation in the Sanhu area.
Through the study of the variation law of microbial flora, organic components and methane yield at different depths, the generation and evolution law of biogas in the Qigequan Formation of Quaternary system was obtained; 0~200 m: Due to the influence of sulfate-reducing bacteria, the intensity of organic matter hydrocarbon generation by methane bacteria is weak, and the amount of methane gas produced is small. Due to the loose surface shale and large porosity, it is impossible to form an effective barrier layer, so the generated methane gas is difficult to accumulate to form an enriched biogas reservoir; 200~600 m: With the increase of depth, organic components change, and sulfate-reducing bacteria disappear, resulting in the existence of a large number of microbial communities. They begin to enter the peak stage of hydrocarbon generation. Biogas reservoirs can be found in shallow high parts of shale and sandstone; 600~1000 m: Due to the changes in organic components and pressure and temperature, the hydrocarbon generation intensity of shallow microbiota decreases, so there are few biogas reservoirs at this depth; 1000~1600 m: With the increase in temperature, the organic components change, and at this time, the organic substances suitable for microbial utilization increase, so the hydrocarbon generation intensity reaches the peak period. At the same time, the porosity of shale increases with the increase of burial depth, and the sealing of shale increases. Therefore, the shale biogas reservoirs are the most developed in this depth area; 1600~2000 m: With the increase in formation temperature, the microbial activity and population number decreased greatly, and the hydrocarbon generation intensity decreased. However, due to the deep thermal effect, the thermal evolution of organic matter can also develop some small gas layers.

5.2. Reservoir Characteristics

At present, many methods, technologies and means have been developed in China and abroad to qualitatively and quantitatively characterize the pore structure of shale reservoirs. For the division of reservoir pore diameter, the pore is divided into micropores (0 nm < pore diameter < 2 nm), mesopores (2 nm < pore diameter < 50 nm), macropores (pore diameter > 50 nm), according to IUPAC standards. The Quaternary shale in the Sanhu area is generally in the shallow burial, early diagenetic stage, unconsolidated form, and the degree of microporous development is poor. Therefore, this paper mainly studies the distribution of mesopores and macropores with pore size. The pore structure of 0~50 nm was characterized by nitrogen adsorption experiment data, and the macro pore structure of more than 50 nm was characterized by HMIP data. The most reliable interval of the two methods was used to realize the comprehensive characterization of shale reservoirs at a full range pore size scale.
The micropore volume of shale in the Qigequan formation of the Sanhu area is rarely developed. The main contribution of mesopores is 10~30 nm, and the macropores volume is mainly contributed by pores of 50~100 nm. The total pore volume distribution of Quaternary shale in the Sanhu area is 0.079~0.098 mL/g, with an average of 0.090 mL/g. The proportion of mesopores volume is 46.3%, and the proportion of macropores volume is 53.7%. The specific surface area of Quaternary shale in the Sanhu area is mainly contributed to by the mesopores of shale, while the contribution of macropores to the specific surface area of shale is very small and almost negligible. The total specific surface area of shale ranges from 8.52 m2/g~27.77 m2/g, with an average of 19.95 m2/g. The proportion of the mesopore specific surface area is 86.5%, and the proportion of the macropore specific surface area is 13.5% (Figure 14).

5.3. Formation Water and Structural Characteristics

Biogas formation and accumulation are closely related to the formation water and late meteoric precipitation. The formation and accumulation of biogas are closely related to the formation water and late meteoric precipitation and are controlled by the hydrodynamic pressure difference between the north and south, the north slope is the main biogas accumulation zone.
The activity of microorganisms, such as methanogens is controlled by the formation water salinity: The bioactivity of stratum digit with lower salinity of formation water is stronger. At the same time, the content of hydrogen required by methanogens for survival and methane formation is relatively high in low salinity layers. On the one hand, a relatively open water environment is formed, which can dissolve more Martian organic matter. At the same time, the mixing and dilution of fresh water reduces the salinity and is used by methanogens to survive through methanogenesis. Therefore, it is believed that the time of biogas generation is not the deposition period, but the period when atmospheric freshwater penetrated into the stratum, and it is still strongly gas today (Figure 15).
The current sedimentary characteristics show that the south slope is the main supply area of surface water, which is an area of high water level and high fluid potential. The water supply in the north slope is weak and fluid potential is low. Under the control of the hydrodynamic pressure, the difference between the north and the south, the southward migration of biogas is inhibited. With mainly northward migration, forming the Sebei and Tainan structural gas fields, the gas-water interface is obviously characterized by south high and north low (Figure 16). When the water potential gradient drops, there will be a hydrodynamic circulation system in the formation. The deep depression in the middle part of the Sanhu area is favorable for gas generation, forming biogas and dissolving in water. In the catchment-drainage area, salty water and low water pressure are conducive to the separation of dissolved gas. Biogas carried by formation water migrates from the south and deep of the basin to the north and biogas is separated out and accumulated on the northern slope of the Sanhu Depression. This dynamic process is a long-term continuous process and the dissolve gas precipitation position is relatively concentrated so it has high efficiency for the accumulation of natural gas nearby.

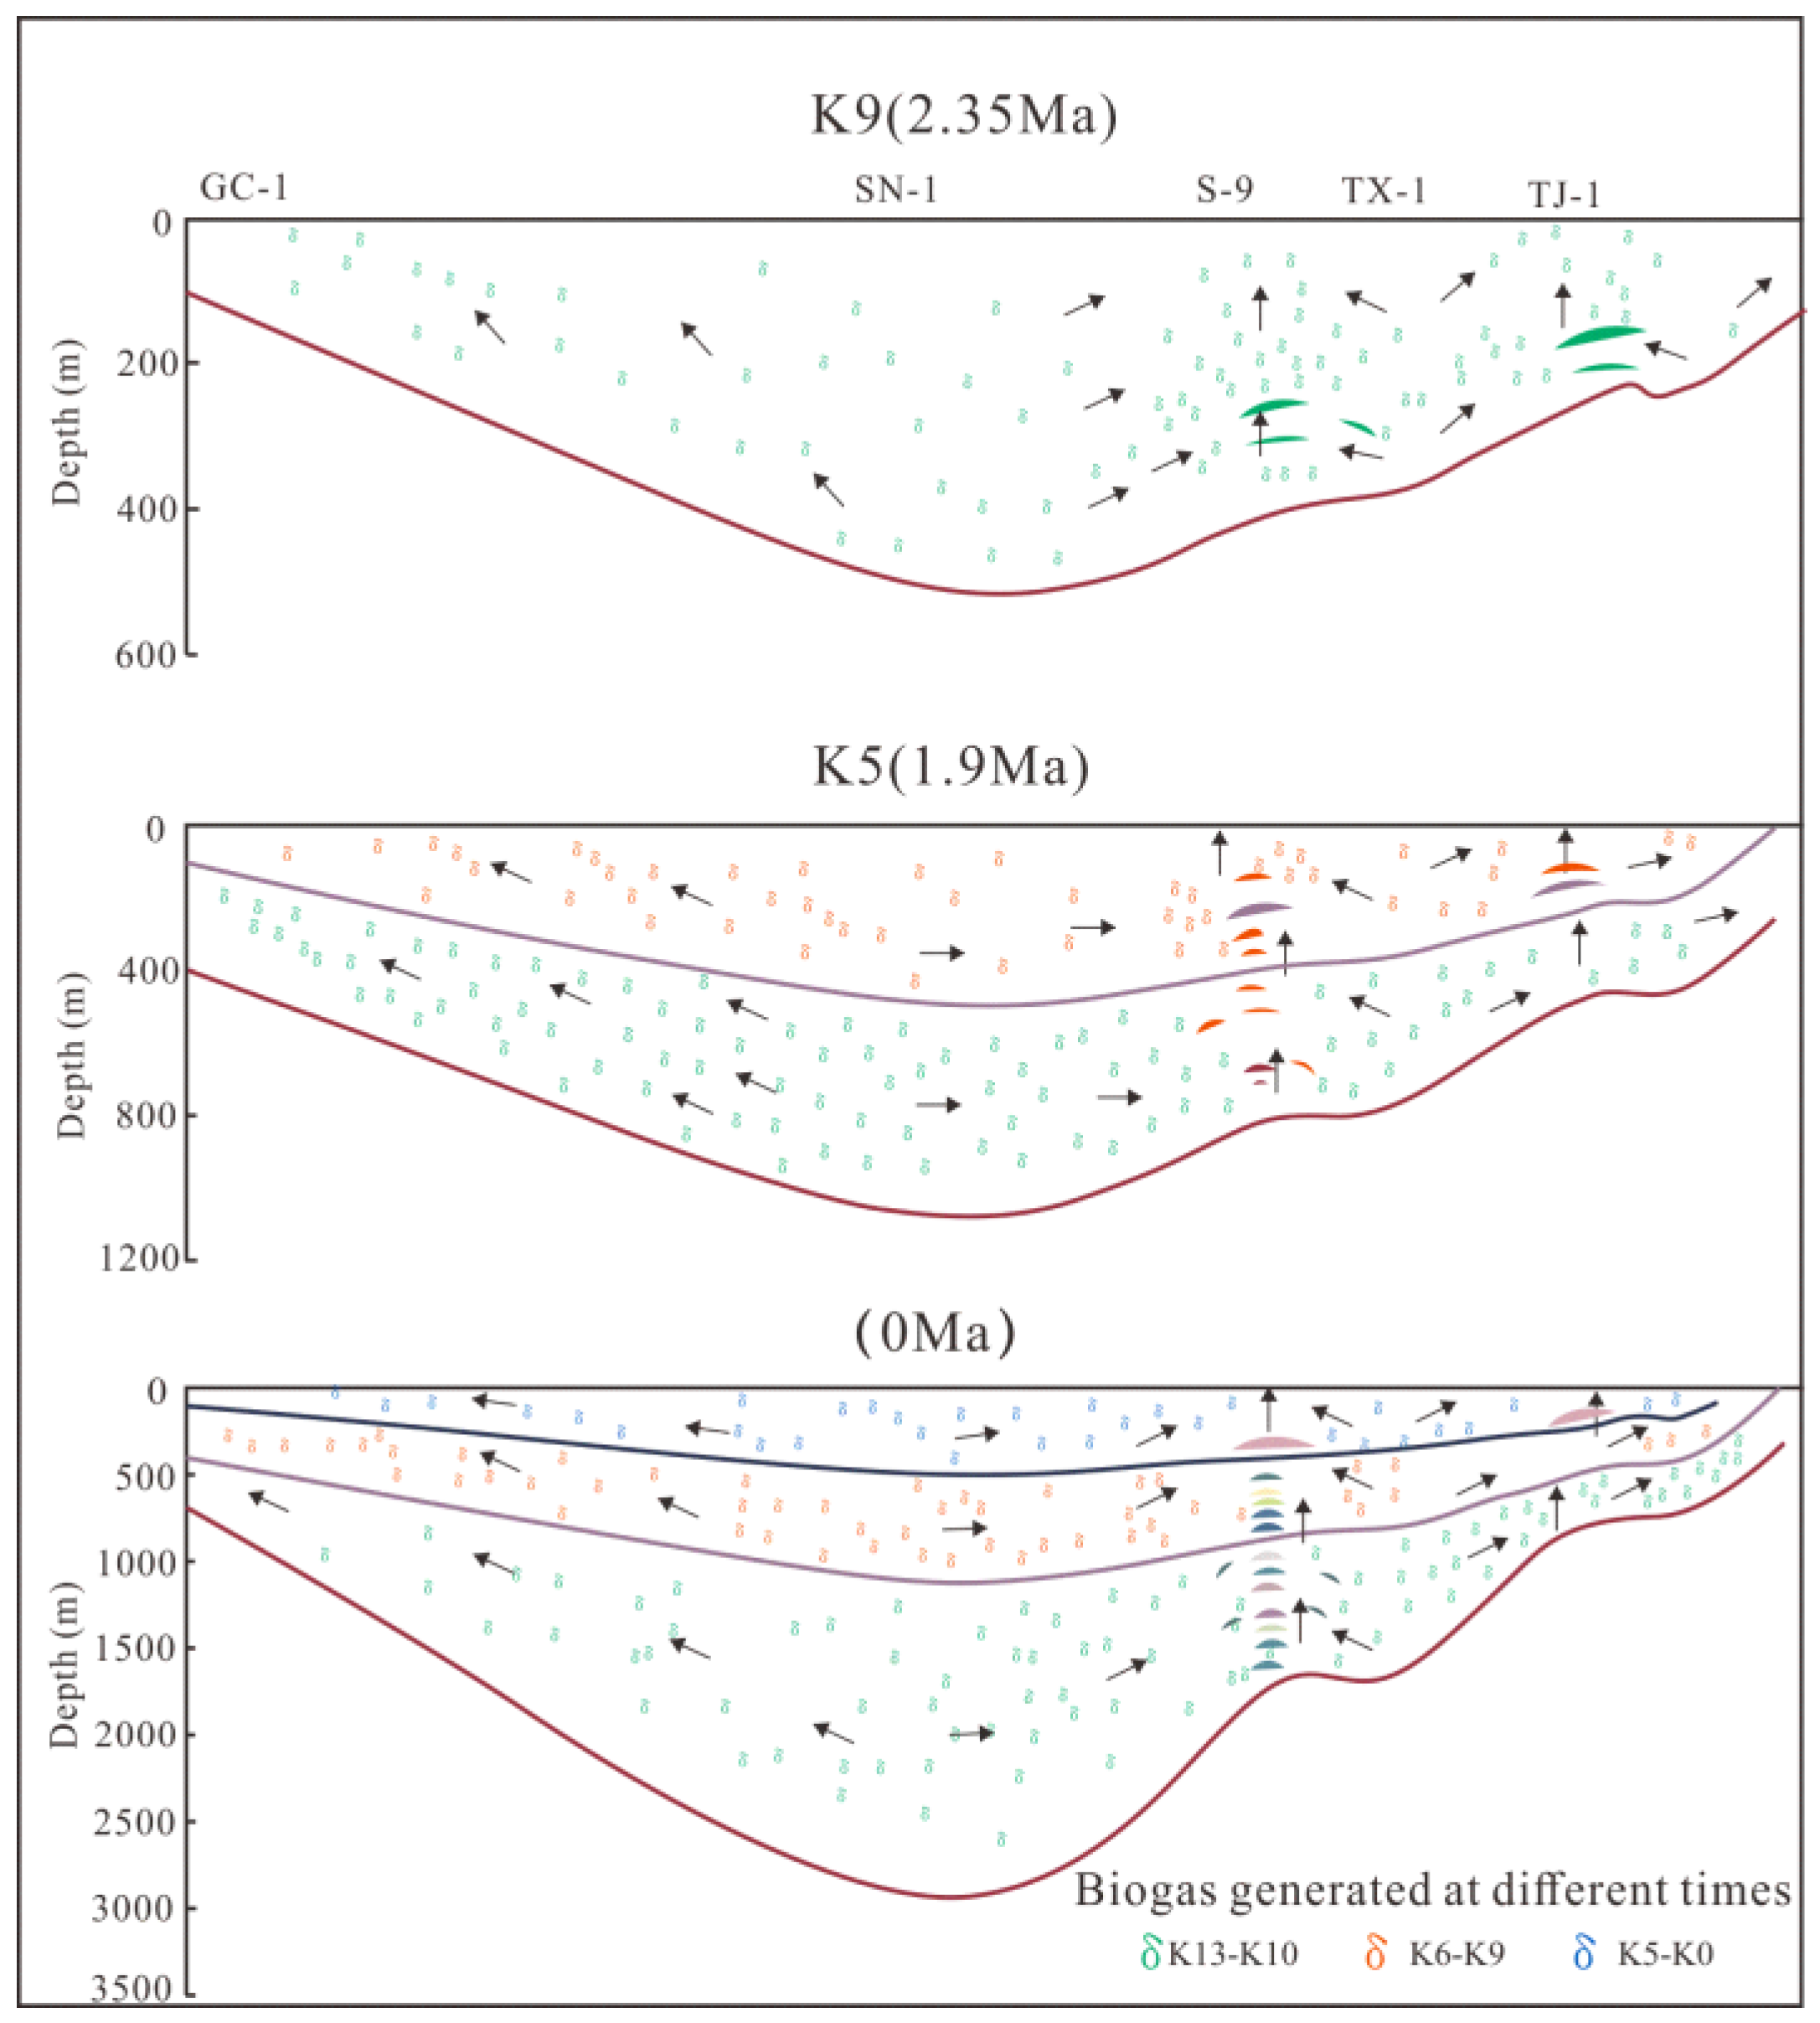
5.4. Dynamic Accumulation Model

The shale in the Sanhu area has the characteristics of continuous gas generation, which is of great significance to the maintenance of gas reservoirs. It is mainly manifested in two aspects. First, in terms of time, from receiving sedimentation the organic matter of the shale in the Sanhu area is distributed in each depth in the vertical direction. As long as other anaerobic bacteria, such as methanogens reach the adaptive living environment at temperature and salinity, they begin to produce methane by acting on the organic matter component. Therefore, the shale has the ability to continuously generate biogas from shallow to deep layers and still to produce methane and supplement the gas reservoir. Second, in space, multi-layer shales developed from shallow to deep in the Sanhu region have good hydrocarbon generation potential. So, they constitute continuity in space and provide an important material basis for the maintenance of biogas reservoirs.
Diffusion loss is a phenomenon easily encountered in natural gas preservation, especially for biogas with relatively shallow burials. Throughout the biogas accumulation in the weak diagenesis stage in the Sanhu area, on the one hand, the important mechanism lies in the objective conditions and reasons, such as the rapid burial geological background, the high proportion of shale, the high salinity formation water in the sedimentary strata and the micro-sealing mechanism. On the other hand, it depends on the continuous generation of biogas, which maintains the dynamic accumulation. The continuous accumulation is determined by the special sedimentary tectonic background in this area. On the one hand, although the sediments are in the early diagenetic stage, biogas can still be preserved and accumulated due to rapid deposition and burial. On the other hand, the continuous generation of biogas can maintain the accumulation of biogas by continuously filling the reservoir. The continuous filling is an important reason for the high-efficiency production capacity of biogas in the Sanhu area. There are mainly two meanings. The diffusion and migration of natural gas in the lower part of the reservoir continuously recharges the shallow reservoirs and also includes the continuous generation of natural gas (Figure 17).

6. Conclusions

In this paper, the quaternary shale in the Sanhu area of the Qaidam Basin was taken as the research object. Through soluble organic carbon analysis, porosity and permeability analysis and other experiments, the conditions of quaternary biogas accumulation in the Sanhu area were analyzed and studied. The following conclusions are drawn:
(1)
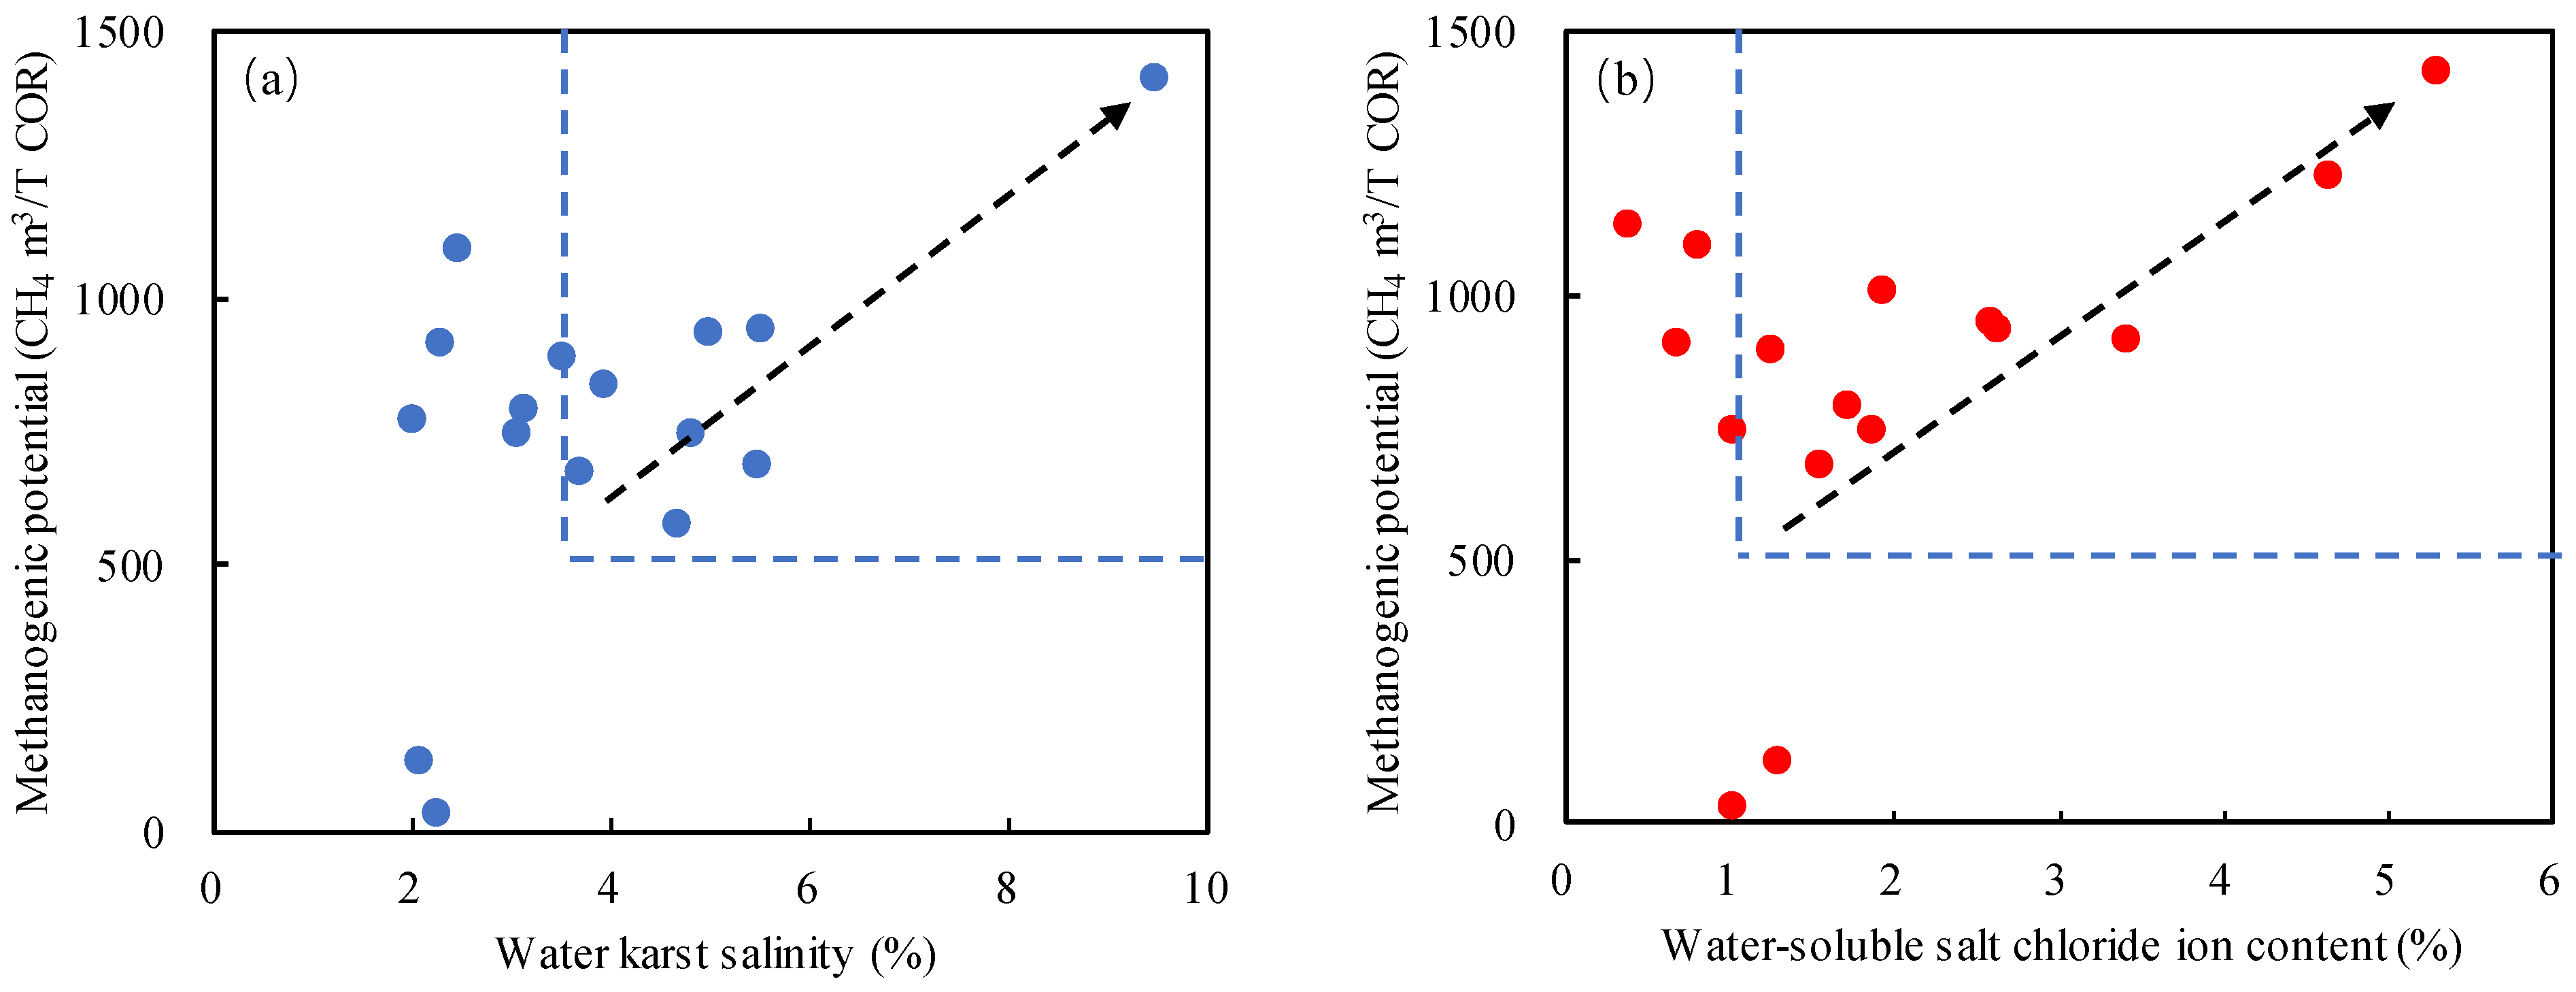
Quaternary shale has the characteristics of high soluble organic carbon and high salinity of formation water, which is conducive to the late methane biochemical generation.
(2)
Quaternary shale has the characteristics of high porosity and low permeability, mainly developing intergranular pores and intragranular pores. The large pore volume and specific surface area provide a lot of storage space for free gas and adsorbed gas, and the reservoir conditions are good.
(3)
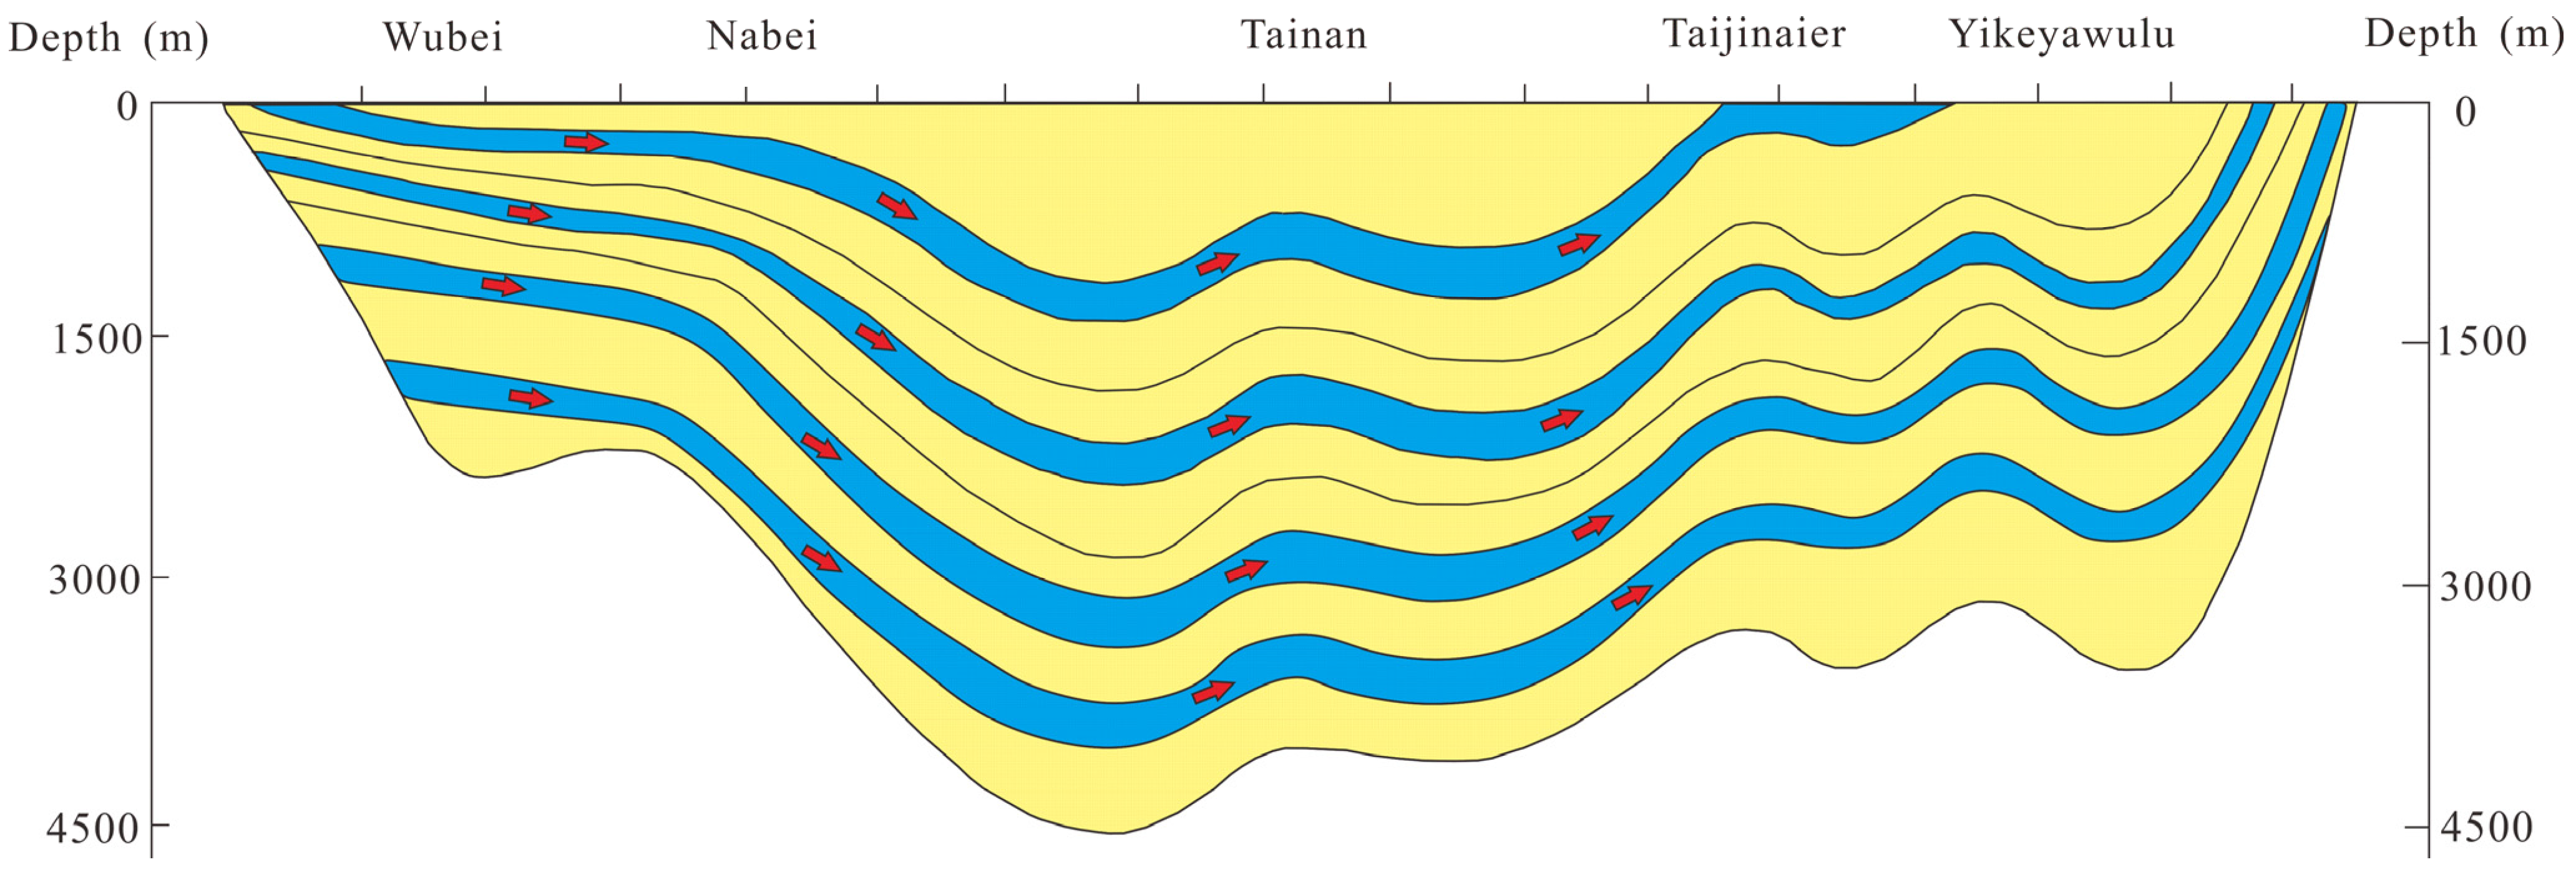
Biogas migrates from the southern and deep parts of the basin to the northern part of the basin due to the structural characteristics of the high in the south and the low in the north and the formation hydrodynamics; the northern slope is the main biogas enrichment zone.
(4)
Multiple sets of source rocks are developed from shallow to deep. The deep gas diffusion and migration process continuously charges the shallow gas reservoir after dispersion, while the deep gas continuously charges the gas reservoir, which is an important factor to maintain the gas reservoir.

Author Contributions

Conceptualization, Z.S. and S.H.; methodology, Y.W.; software, X.L.; validation, Z.S., L.H. and C.T.; formal analysis, X.L.; investigation, Y.Z.; resources, Z.S.; data curation, Z.S.; writing—original draft preparation, Z.S.; writing—review and editing, S.H.; visualization, M.H.; supervision, C.L.; project administration, S.H.; funding acquisition, Z.S. All authors have read and agreed to the published version of the manuscript.

Funding

This research was funded by the National Natural Science Foundation of China (No. 41802153 and No. 41872135). And The APC was funded by China University of Petroleum-Beijing.

Acknowledgments

The authors would like to acknowledge the support of the National Natural Science Foundation of China (No. 41802153 and No. 41872135). Thank China Petroleum Exploration and Development Research Institute for supporting some experimental data.

Conflicts of Interest

The authors declare that they have no known competing financial interest or personal relationships that could have appeared to influence the work reported in this paper.

References

  1. Cao, Z.; Sun, X.; Wu, W.; Tian, G.; Zhang, S.; Li, H.; Sun, Z.; Xu, L.; Wang, R. Formation and evolution of thrusted paleo-uplift at the margin of Qaidam Basin and its influences on hydrocarbon accumulation. Acta Pet. Sin. 2018, 39, 980. [Google Scholar]
  2. He, B.; Xu, Z.; Jiao, C.; Cui, J.; Wang, S.; Wang, G.; Li, C.; Qiu, Z. Structural architecture and evolution of Kumkuli basin, north Tibet. J. Earth Sci. 2009, 20, 464–476. [Google Scholar] [CrossRef]
  3. Xu, Y.; Zhang, K.; Yang, Y.; Wang, G.; Luo, M.; Ji, J.; Song, B. Neogene evolution of the north-eastern Tibetan Plateau based on sedimentary, paleoclimatic and tectonic evidence. Palaeogeogr. Palaeoclimatol. Palaeoecol. 2018, 512, 33–45. [Google Scholar] [CrossRef]
  4. Dang, Y.; Zhao, W.; Su, A.; Zhang, S.; Li, M.; Guan, Z.; Ma, D.; Chen, X.; Shuai, Y.; Wang, H.; et al. Biogenic gas systems in eastern Qaidam Basin. Mar. Pet. Geol. 2008, 25, 344–356. [Google Scholar] [CrossRef]
  5. Zhang, D. Accumulation conditions and key technologies for exploration and development in Sebei gas field in Qaidam Basin, NW China. Pet. Res. 2019, 4, 191–211. [Google Scholar] [CrossRef]
  6. Shao, P.; Wang, A.; Wang, W. Effect of chemical structure of lignite and high-volatile bituminous coal on the generation of biogenic coalbed methane. Fuel 2019, 245, 212–225. [Google Scholar] [CrossRef]
  7. Wang, Y.; Dong, D.; Li, X.; Wu, W. Stratigraphic sequence and sedimentary characteristics of Lower Silurian Longmaxi Formation in Sichuan Basin and its peripheral areas. Nat. Gas Ind. B 2015, 2, 222–232. [Google Scholar] [CrossRef] [Green Version]
  8. Ma, X. Enrichment laws and scale effective development of shale gas in the southern Sichuan Basin. Nat. Gas Ind. B 2019, 6, 240–249. [Google Scholar] [CrossRef]
  9. Boyer, C.; Kieschnick, J.; Suarez-Rivera, R.; Lewis, R.E.; Waters, G. Producing gas from its source. Oilfield Rev. 2006, 18, 36–49. [Google Scholar]
  10. Wildschut, J.; Iqbal, M.; Mahfud, F.; Cabrera, I.; Venderbosch, R.; Heeres, H. Insights in the hydrotreatment of fast pyrolysis oil using a ruthenium on carbon catalyst. Energy Environ. Sci. 2010, 3, 962–970. [Google Scholar] [CrossRef]
  11. Liu, H.; Zhang, S.; Song, G.; Teng, J.; Wang, M.; Bao, Y.; Yao, S.; Wang, W.; Zhang, S. Effect of shale diagenesis on pores and storage capacity in the Paleogene Shahejie Formation, Dongying Depression, Bohai Bay Basin, east China. Mar. Pet. Geol. 2019, 103, 738–752. [Google Scholar] [CrossRef]
  12. Martini, A.; Walter, L.; Ku, T.; Budai, J.; Mcintosh, J.; Schoell, M. Microbial production and modification of gases in sedimentary basins: A geochemical case study from a Devonian shale gas play, Michigan basin. AAPG Bull. 2003, 87, 1355–1375. [Google Scholar] [CrossRef]
  13. Goraya, N.; Rajpoot, N.; Marriyappan, S. Coal bed methane enhancement techniques: A review. ChemistrySelect 2019, 4, 3585–3601. [Google Scholar] [CrossRef]
  14. Kulongoski, J.; McMahon, P.; Land, M.; Wright, M.; Johnson, T.; Landon, M. Origin of methane and sources of high concentrations in Los Angeles groundwater. J. Geophys. Res. Biogeosci. 2018, 123, 818–831. [Google Scholar] [CrossRef]
  15. Hou, Z.; Chen, S.; Zhang, S.; Yang, H. Sedimentary deformation features as evidence for paleoseismic events in the middle Eocene in the Dongying Depression of the southern Bohai Bay Basin, eastern China. Can. J. Earth Sci. 2020, 57, 954–970. [Google Scholar] [CrossRef]
  16. Tang, L.; Song, Y.; Jiang, S.; Yang, Y. Sealing mechanism of the roof and floor for the Wufeng-Longmaxi shale gas in the southern Sichuan Basin. Energy Fuels 2020, 34, 6999–7018. [Google Scholar] [CrossRef]
  17. Zhu, H.; Ju, Y.; Huang, C.; Qi, Y.; Qiao, P. Petrophysical properties of the major marine shales in the Upper Yangtze Block, south China: A function of structural deformation. Mar. Pet. Geol. 2019, 110, 768–786. [Google Scholar] [CrossRef]
  18. Zou, C.; Yang, Z.; Sun, S.; Zhao, Q.; Bai, W.; Liu, H.; Pan, S.; Wu, S.; Yuan, Y. “Exploring petroleum inside source kitchen”: Shale oil and gas in Sichuan Basin. Sci. China Earth Sci. 2020, 63, 934–953. [Google Scholar] [CrossRef]
  19. Pang, X.; Shao, X.; Li, M.; Wang, W. Correlation and difference between conventional and unconventional reservoirs and their unified genetic classification. Gondwana Res. 2021, 97, 73–100. [Google Scholar] [CrossRef]
  20. Li, S.; Zhou, Z.; Nie, H.; Zhang, L.; Song, T.; Liu, W.; Li, H.; Xu, Q.; Wei, S.; Tao, S. Distribution characteristics, exploration and development, geological theories research progress and exploration directions of shale gas in China. China Geol. 2022, 5, 110–135. [Google Scholar] [CrossRef]
  21. Nie, J.; Ren, X.; Saylor, J.; Su, Q.; Horton, B.; Bush, M.; Chen, W.; Pfaff, K. Magnetic polarity stratigraphy, provenance, and paleoclimate analysis of Cenozoic strata in the Qaidam Basin, NE Tibetan Plateau. GSA Bull. 2020, 132, 310–320. [Google Scholar] [CrossRef]
  22. Liu, W.; Liu, K.; Liu, J.; Zhang, Y. Geomorphologic evolution of the northern Tibetan Plateau in the Quaternary: Tectonic and climatic controls. Interpretation 2022, 10, T57–T72. [Google Scholar] [CrossRef]
  23. Pang, X.; Zhao, W.; Su, A.; Zhang, S.; Li, M.; Dang, Y.; Xu, F.; Zhou, R.; Zhang, D.; Xu, Z.; et al. Geochemistry and origin of the giant Quaternary shallow gas accumulations in the eastern Qaidam Basin, NW China. Org. Geochem. 2005, 36, 1636–1649. [Google Scholar] [CrossRef]
  24. Su, A.; Zhao, W.; Dang, Y.; Zhang, S.; Li, M.; Pang, X.; Zhou, R.; Guan, Z.; Xu, Z.; Zhang, D. Generation and accumulation of Quaternary shallow gas in eastern Qaidam Basin, NW China. Chin. J. Geochem. 2006, 25, 43–55. [Google Scholar] [CrossRef]
  25. Li, R.; Liu, C.; Jiao, P.C.; Wang, J.Y. The tempo-spatial characteristics and forming mechanism of Lithium-rich brines in China. China Geol. 2018, 1, 72–83. [Google Scholar] [CrossRef]
  26. Xie, H.; Zhou, D.; Li, Y.; Pang, X.; Li, P.; Chen, G.; Li, F.; Cao, J. Cenozoic tectonic subsidence in deepwater sags in the Pearl River Mouth Basin, northern South China Sea. Tectonophysics 2014, 615, 182–198. [Google Scholar] [CrossRef]
  27. Tian, J.; Li, J.; Pan, C.; Tan, Z.; Zeng, X.; Guo, Z.; Wang, B.; Zhou, F. Geochemical characteristics and factors controlling natural gas accumulation in the northern margin of the Qaidam Basin. J. Pet. Sci. Eng. 2018, 160, 219–228. [Google Scholar] [CrossRef]
  28. Chen, H.; Xie, X.; Mao, K.; He, Y.; Su, M.; Zhang, W. Depositional characteristics and formation mechanisms of deep-water canyon systems along the Northern South China Sea Margin. J. Earth Sci. 2020, 31, 808–819. [Google Scholar] [CrossRef]
  29. Wu, S.; Liu, J.; Chen, J.; Wu, H. Characteristics of Milankovitch cycles recorded in Eocene strata in the eastern depression of North Yellow Sea Basin, North China. China Geol. 2021, 4, 274–287. [Google Scholar] [CrossRef]
  30. Cokar, M.; Ford, B.; Gieg, M.; Kallos, M.; Gates, I. Reactive reservoir simulation of biogenic shallow shale gas systems enabled by experimentally determined methane generation rates. Energy Fuels 2013, 27, 2413–2421. [Google Scholar] [CrossRef]
  31. Wang, F.; Guan, J.; Feng, W.; Bao, L. Evolution of overmature marine shale porosity and implication to the free gas volume. Pet. Explor. Dev. 2013, 40, 819–824. [Google Scholar] [CrossRef]
  32. Zheng, D.; Wu, S.; Hou, M. Fully connected deep network: An improved method to predict toc of shale reservoirs from well logs. Mar. Pet. Geol. 2021, 132, 105205–105214. [Google Scholar] [CrossRef]
  33. Huang, Z.; Chen, J.; Xue, H.; Wang, Y.; Wang, M.; Deng, C. Microstructural characteristics of the cretaceous Qingshankou formation shale, Songliao basin. Pet. Explor. Dev. 2013, 40, 61–68. [Google Scholar] [CrossRef]
  34. Esmaeilzadeh, S.; Afshari, A.; Motafakkerfard, R. Integrating artificial neural networks technique and geostatistical approaches for 3d geological reservoir porosity modeling with an example from one of iran’s oil fields. Liq. Fuels Technol. 2013, 31, 1175–1187. [Google Scholar] [CrossRef]
  35. Gao, Z.; Yang, X.; Hu, C.; Wei, L.; Jiang, Z.; Yang, S.; Fan, Y.; Xue, Z.; Yu, H. Characterizing the pore structure of low permeability eocene liushagang formation reservoir rocks from beibuwan basin in northern south china sea—Sciencedirect. Mar. Pet. Geol. 2019, 99, 107–121. [Google Scholar] [CrossRef]
  36. Zhang, F.; Jiang, Z.; Sun, W.; Li, Y.; Zhang, X.; Zhu, L.; Wen, M. A multiscale comprehensive study on pore structure of tight sandstone reservoir realized by nuclear magnetic resonance, high pressure mercury injection and constant-rate mercury injection penetration test. Mar. Pet. Geol. 2019, 109, 208–222. [Google Scholar] [CrossRef]
  37. Li, Z.; Oyediran, A.; Huang, R.; Hu, F.; Du, T.; Hu, R.; Li, X. Study on pore structure characteristics of marine and continental shale in China. J. Nat. Gas Sci. Eng. 2016, 33, 143–152. [Google Scholar] [CrossRef]
  38. Yang, W.; Wang, Q.; Wang, Y.; Jiang, Z.; Song, Y.; Li, Y.; Liu, D.; Zuo, R.; Gu, X.; Zhang, F. Pore characteristic responses to categories of depositional microfacies of delta-lacustrine tight reservoirs in the upper triassic yanchang formation, ordos basin, nw china. Mar. Pet. Geol. 2020, 118, 104–423. [Google Scholar] [CrossRef]
Figure 1. Structural division map and gas field distribution in Sanhu area.
Energies 15 04593 g001
Figure 2. Statistical distribution of TOC in shale of Quaternary Qigequan Formation in Sanhu area.
Energies 15 04593 g002
Figure 3. Different organic carbon contents in TN-18 and C-8 wells in Sanhu area.
Energies 15 04593 g003
Figure 4. Vertical distribution map of organic matter components and microorganisms in Quaternary shale. (a) microorganisms; (b) organic matter components.
Energies 15 04593 g004
Figure 5. Statistical Figure of porosity of Qigequan Formation shale in Sanhu area.
Energies 15 04593 g005
Figure 6. Comparison of permeability between shale and sandstone in Sanhu area.
Energies 15 04593 g006
Figure 7. Mineral composition statistics of TN-18 well. (a) Whole rock composition percentage of TN-18 well; (b) The percentage of clay components in TN-18 well.
Energies 15 04593 g007
Figure 8. Statistics of brittleness index of shale in Quaternary Qigequan Formation in Sanhu area.
Energies 15 04593 g008
Figure 9. Shale slices and SEM images of Qigequan Formation. (a) Brittle mineral intergranular pores, 2 μm, TN-18; (b) Brittle mineral intergranular pores, 2 μm, ST-1; (c) Brittle mineral intergranular pores, 2 μm, TN-18; (d) Clay mineral intergranular pores, 1 μm, TN-18; (e) Clay mineral intergranular pores, 200 nm, TN-18; (f) Feldspar grain intragranular pores, 2 μm, TN-18; (g) Feldspar grain intragranular pores, 2 μm, TN-18; (h) Organic matter, 10 μm, ST-1; (i) Organic pores, 30 μm, ST-1.
Energies 15 04593 g009
Figure 10. N2 adsorption and desorption isotherms of Qigequan Formation shale samples.
Energies 15 04593 g010
Figure 11. The pore size distributions obtained from N2 adsorption isotherms of Qigequan Formation shale samples.
Energies 15 04593 g011
Figure 12. The pore size distributions obtained from HMIP of Qigequan Formation shale samples.
Energies 15 04593 g012
Figure 13. Relationship between methane production rate and formation water salinity. (a) Water karst salinity; (b) Water-soluble salt chloride ion content.
Energies 15 04593 g013
Figure 14. The pore size distribution and statistical characteristics of the Qigequan Formation shale in the Sanhu area. (a) Pore volume distribution; (b) Pore volume ratio; (c) Pore specific surface area distribution; (d) Pore specific surface area ratio.
Energies 15 04593 g014
Figure 15. Relationship between microbial activity index and formation water characteristics. (The yellow area indicates the peak period of methane production).
Energies 15 04593 g015
Figure 16. Characteristics of present structure and formation water transport in Sanhu area.
Energies 15 04593 g016
Figure 17. Model diagram of continuous gas generation and dynamic accumulation of mud shale in Sanhu area.
Energies 15 04593 g017
Table 1. Comparison table of geological characteristics of global typical shale gas reservoirs.
NameCharacteristicsMichigan Antrim Shale, USAQuaternary Shale in Qaidam Basin Shale Gas of Wufeng–Longmaxi Formation in Sichuan BasinYangxin Bioshale Gas in Jiyang Depression, Shandong Province
Geological conditionEraDevonianQuaternarySilurianPalaeogene
Sedimentary typeMarine beacon faciesLimnetic faciesMarine beacon faciesSemi-deep lake facies
Rate of sedimentationSlow, hunger basin depositionFastSlow, hunger basin depositionFast
Genetic typeLate-formed biogenic gasEarly forming biogenic gasOil-cracking gasBiogenetic gas
Gas-generating conditionLithologyPyrite-bearing thin silty mudstone and organic-rich shaleMud shale, silty shale, and siltstone interlayers, lithology changes greatlyUpper silty shale, lower massive shale rich in organic matterLimestone-shale
Depth of
embedment (m)
183~730300~18003500~45001200~1800
Thickness (m)4910~800100~7002~116
TOC (%)0.5~240.17~0.520.5~3.50.11~11.80
RO (%)0.4~0.6<0.52.2~3.06<0.4
Organic matter typeI, II, IIIII, IIIII, IIII
Gas storage conditionMatrix porosity (%)5~9, locally up to 1515~353.4~8.515~20
Matrix permeability (×10−3 μm2)Average 0.119~180<10.1~1.0
Formation pressure factor0.811.0~1.10.92~2.030.9~1.10
Reservoir space typeNatural cracksPores and cracksMainly poresMainly natural cracks
Total gas content (m3/t)1.1~2.82.7~6.90.77~4.630.7
Publisher’s Note: MDPI stays neutral with regard to jurisdictional claims in published maps and institutional affiliations.

