Article

Impact of Solar Inverter Dynamics during Grid Restoration Period on Protection Schemes Based on Negative-Sequence Components

1
Department of Electrical and Computer Engineering, North Dakota State University, Fargo, ND 58105, USA
2
School of Electrical and Computer Engineering, University of Oklahoma, Norman, OK 73019, USA
*
Authors to whom correspondence should be addressed.
Energies 2022, 15(12), 4360; https://doi.org/10.3390/en15124360
Submission received: 4 May 2022 / Revised: 10 June 2022 / Accepted: 13 June 2022 / Published: 15 June 2022
(This article belongs to the Collection Renewable Energy and Energy Storage Systems)

Abstract

:
The growing penetration of renewable resources such as wind and solar into the electric power grid through power electronic inverters is challenging grid protection. Due to the advanced inverter control algorithms, the inverter-based resources present fault responses different from conventional generators, which can fundamentally affect the way that the power grid is protected. This paper studied solar inverter dynamics focused on negative-sequence quantities during the restoration period following a grid disturbance by using a real-time digital simulator. It was found that solar inverters can act as negative-sequence sources to inject negative-sequence currents into the grid during the restoration period. The negative-sequence current can be affected by different operating conditions such as the number of inverters in service, grid strength, and grid fault types. Such negative-sequence responses can adversely impact the performance of protection schemes based on negative-sequence components and potentially cause relay maloperations during the grid restoration period, thus making system protection less secure and reliable.

1. Introduction

The electric power grid is undergoing a rapid change driven by the high penetration of renewable resources such as solar and wind via power electronic inverters. While these inverter-based resources (IBRs) can use power electronic controls to respond to grid disturbances nearly instantaneously and thus support grid reliability, they are challenging grid protection [1,2]. IBRs feature distinct fault responses compared with conventional generators. The response of a synchronous generator to a fault in the power system is determined by the physics of the rotating machine, which is well understood by grid protection engineers. However, the fault response of an IBR is determined by how the inverter control system has been programmed to respond to its terminal conditions. The manner in which the fast-acting controls within the inverter respond to rapidly changing terminal conditions is an engineered feature but not well understood by grid protection engineers [3]. Such IBR fault characteristics fundamentally impact the current practices for applying and setting protective relays to maintain the reliable operation of the power grid dynamically dominated by synchronous generators. For example, solar inverters induce a low magnitude of fault current with insufficient levels of negative- and zero-sequence currents [1,4]. The negative-sequence fault current contribution of the wind generators can be very small depending on its type and control [5,6]. Thus, protection schemes based on negative-sequence components can be affected and experience malfunctions due to the changes in fault characteristics [3,7]. It is crucial to understand how IBRs react to fault conditions so that proper protection settings can be set to avoid a protection maloperation or a failure in grid operation.
Recently, the North American Electric Reliability Corporation (NERC) has reported a series of events of the unintended loss of solar generation following the grid faults in the Southern California region of the Western Electricity Coordinating Council footprint [8,9,10,11]. These events highlight the importance of understanding the fault responses of solar PVs and their impact on protection schemes during the system restoration period after grid faults are cleared. In the literature, these events have been recently investigated by studying the impact of IBR fault responses on the grid operation using generic positive-sequence dynamic stability simulations [12,13,14,15,16,17,18,19,20,21,22]. However, the existing works do not investigate the solar PV responses and their impacts on protection schemes when the grid is recovering after the disturbances are cleared. Moreover, these existing works usually use positive-sequence stability models and simple inverter modeling for simulation analysis. Such models may not be used in electromagnetic transient simulations for modeling intricate details for different inverter controls and accurately evaluating the IBRs’ response during abnormal events. For example, the inverter dynamics during the restoration period can be affected by blocking and de-blocking functions in response to the low-voltage dynamics during fault conditions [9,10].
In this paper, we investigated the solar inverter dynamics with a focus on negative-sequence quantities during the grid restoration period and their impact on protection schemes based on a real-time digital simulator (RTDS), which is developed by RTDS Technologies Inc. to solve the power system equation fast enough to realistically represent conditions in actual power grids [23]. To this end, we first construct the modeling of two solar PV test systems with detailed inverter models including inverter switching dynamics as well as inverter blocking and deblocking functions for the RTDS simulation. Then, we identify the key differences in negative-sequence quantities between solar farms and synchronous generators during the restoration period following a grid disturbance. On this basis, we further analyze negative-sequence current characteristics of the solar inverter during the grid restoration period and discuss the negative impact of the negative-sequence current of solar inverters on the performance of typical protection schemes based on negative sequence quantities. The major contributions of this paper include:
  • Identifying the key differences in negative-sequence quantities between solar inverters and synchronous generators during the restoration period following a grid disturbance;
  • Investigating the negative-sequence current characteristics of solar inverters during the grid restoration period; and
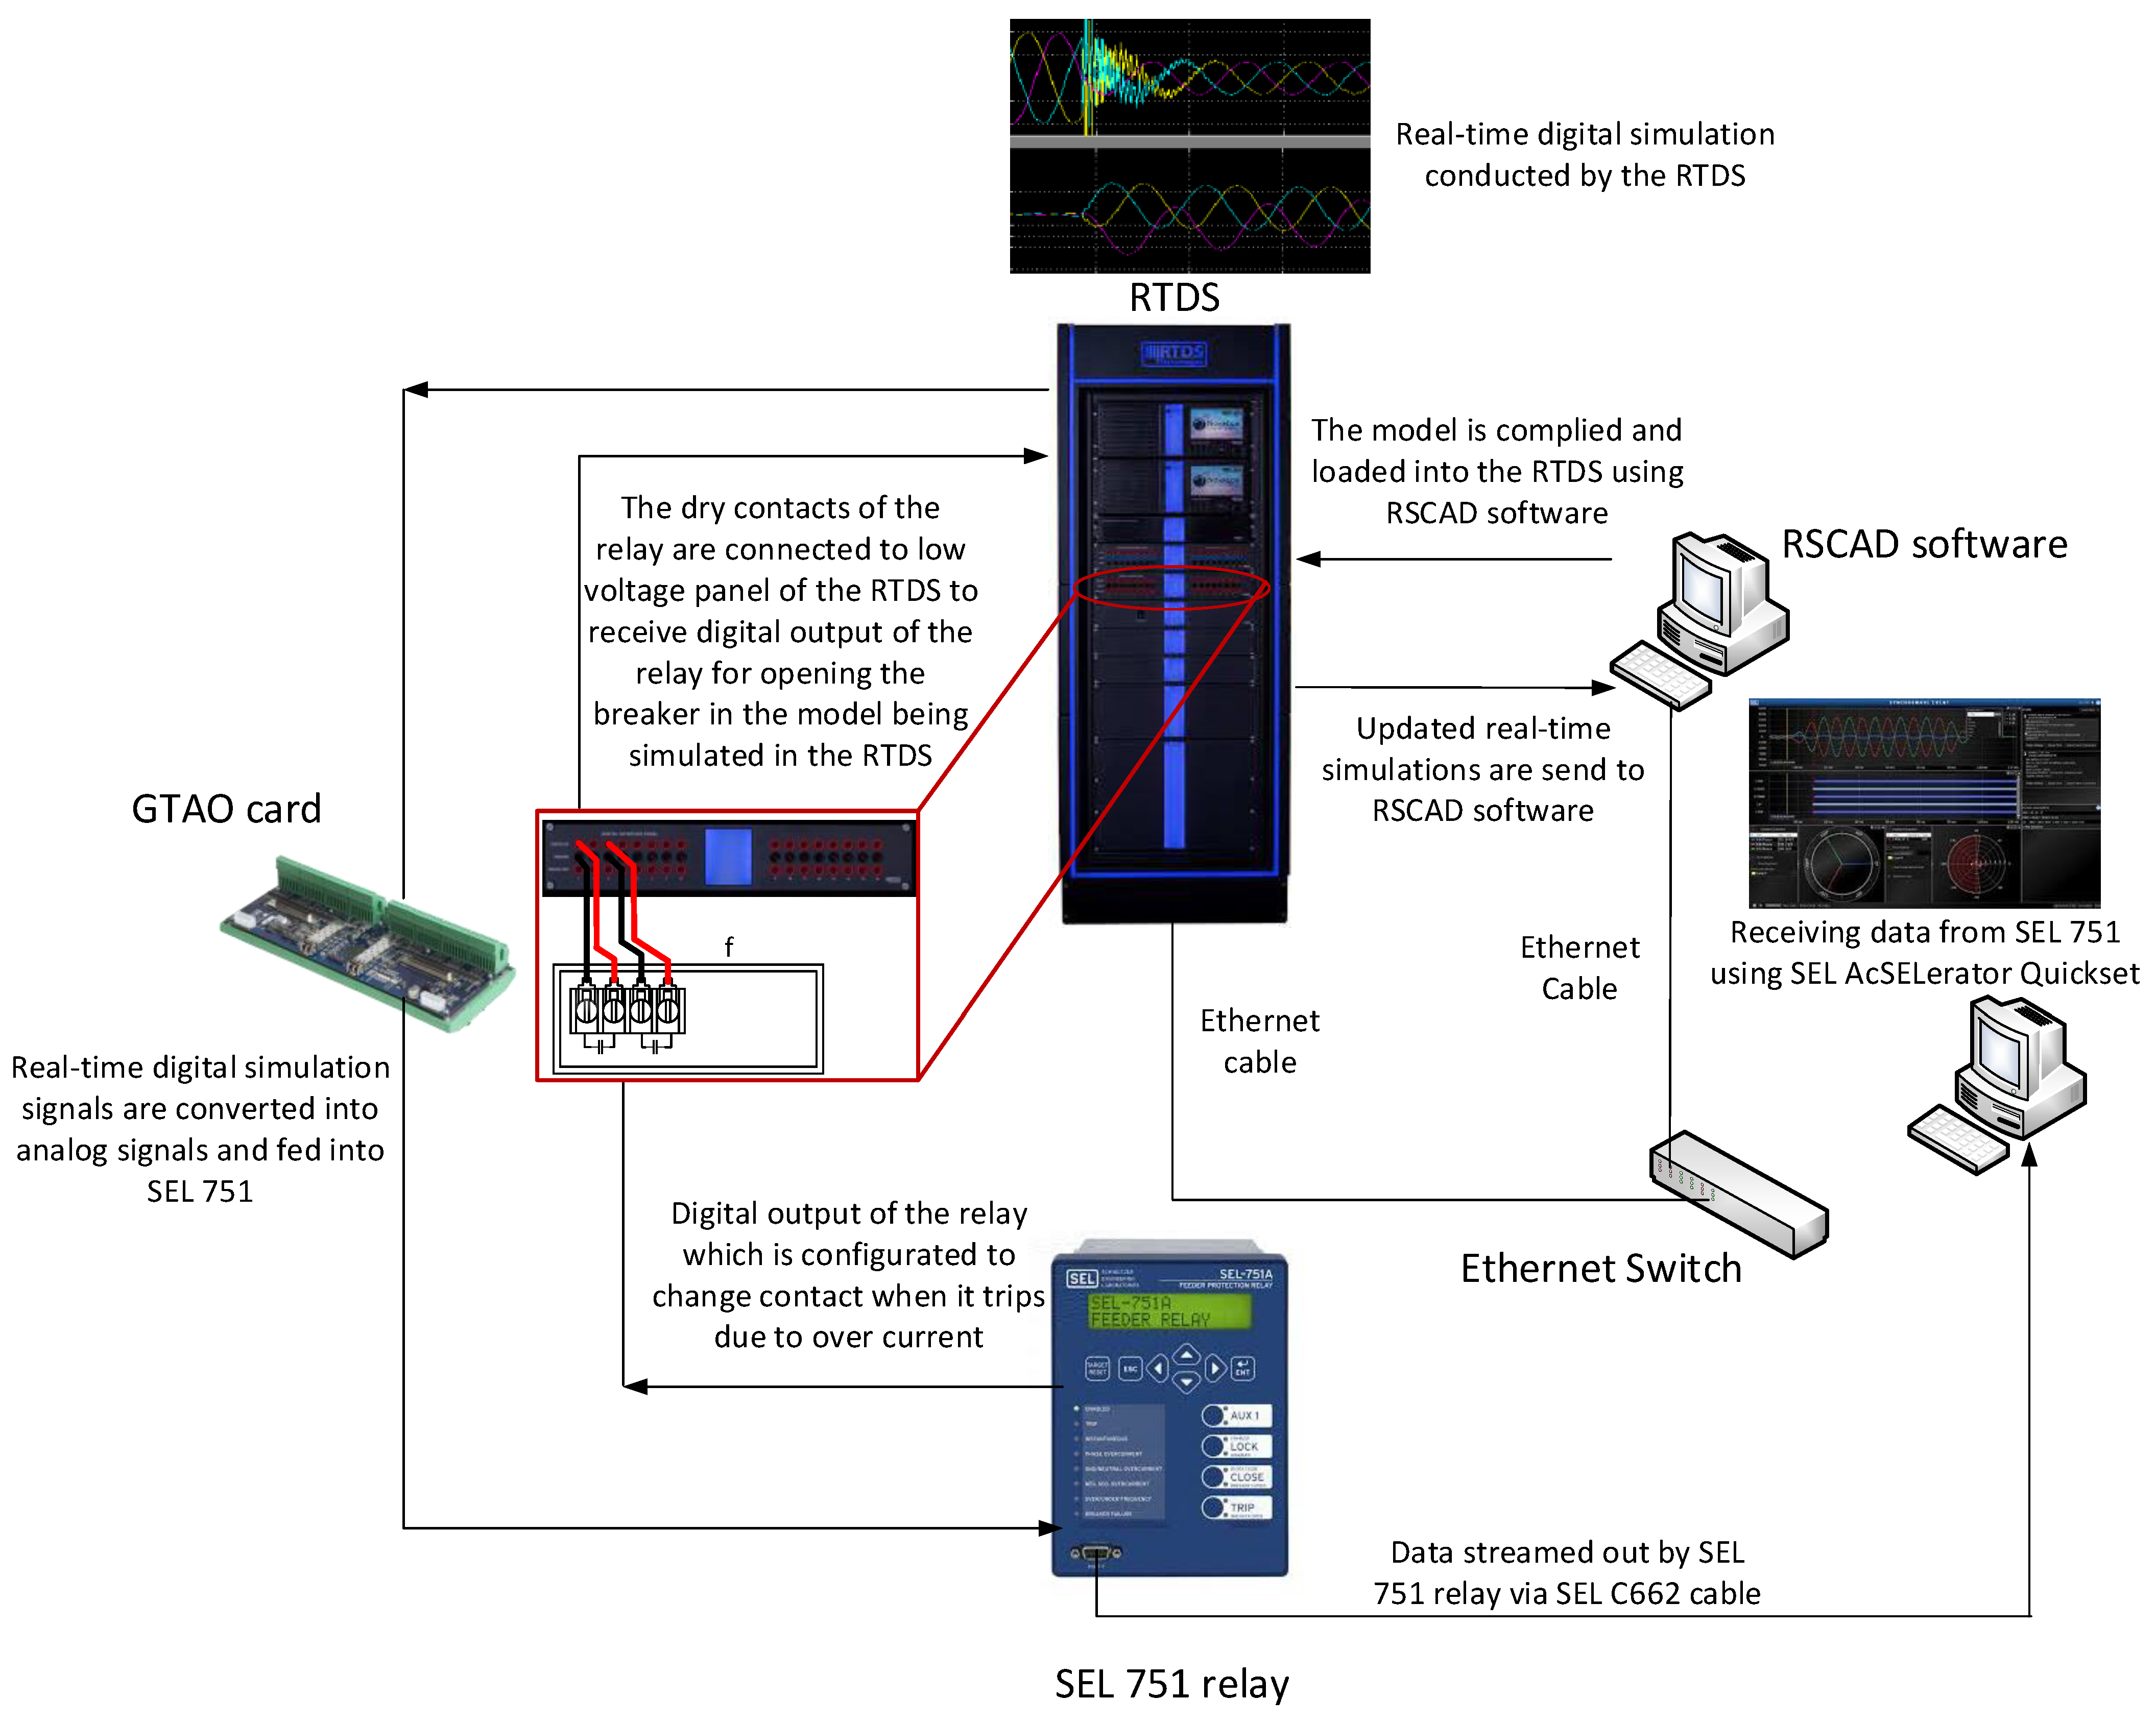
  • Analyzing the negative impact of the negative-sequence current of solar inverters during the restoration period on the performance of typical protection schemes using a hardware-in-loop simulation based on the RTDS.
The rest of this paper is organized as follows. Section 2 presents the methodology that serves as the groundwork for the paper. Section 3 presents the solar PV test systems created for RTDS simulation. Section 4 identifies the key differences in negative-sequence quantities between solar inverters and synchronous generators during the grid restoration period. Section 5 analyzes the negative-sequence current characteristics of the solar inverters during the grid restoration period. Section 6 investigates the interaction between the negative-sequence current of solar inverters and protection schemes based on negative-sequence components. This paper is concluded in Section 7.

2. Methodology

To understand the solar inverter dynamics with a focus on negative-sequence quantities during the grid restoration period and their impact on protection schemes, we developed a hardware-in-loop simulation platform based on a real-time digital simulator (RTDS). The simulator is developed by RTDS Technologies Inc. to solve the power system equation fast enough to realistically rep-resent conditions in actual power grids [23]. With this simulator, we developed the hardware-in-loop simulation platform as illustrated in Figure 1, where the RTDS is linked to a physical relay from the Schweitzer Engineering Laboratories (SEL). The relay has a negative-sequence overcurrent element and can use built-in metering functions to analyze event reports for rapid commissioning, testing, and post-fault diagnostics. The simulation model of a solar PV power system was created on a guest computer using the RSCAD software. Then, this software compiled and loaded this model into the RTDS for real-time simulations. The digital output signals of the current and voltage simulated by the RTDS were converted into analog signals by the Giga-Transceiver Analog Output (GTAO) card and were then fed into the relay. The relay has a low-level interface, which allows it to directly receive the converted analog signals without the need for the voltage/current amplifier. The dry contacts of the relay were connected to the low-voltage panel of the RTDS to send the digital tripping signals from the relays to the RTDS via the input channels on its front lower voltage panel. As soon as the relay trips, it is detected by the digital input of the RTDS, which opens the breaker in the model being simulated in real time and sends the updated signals to the RTDS for real-time simulation. The updated simulation results can be monitored by RSCAD software.

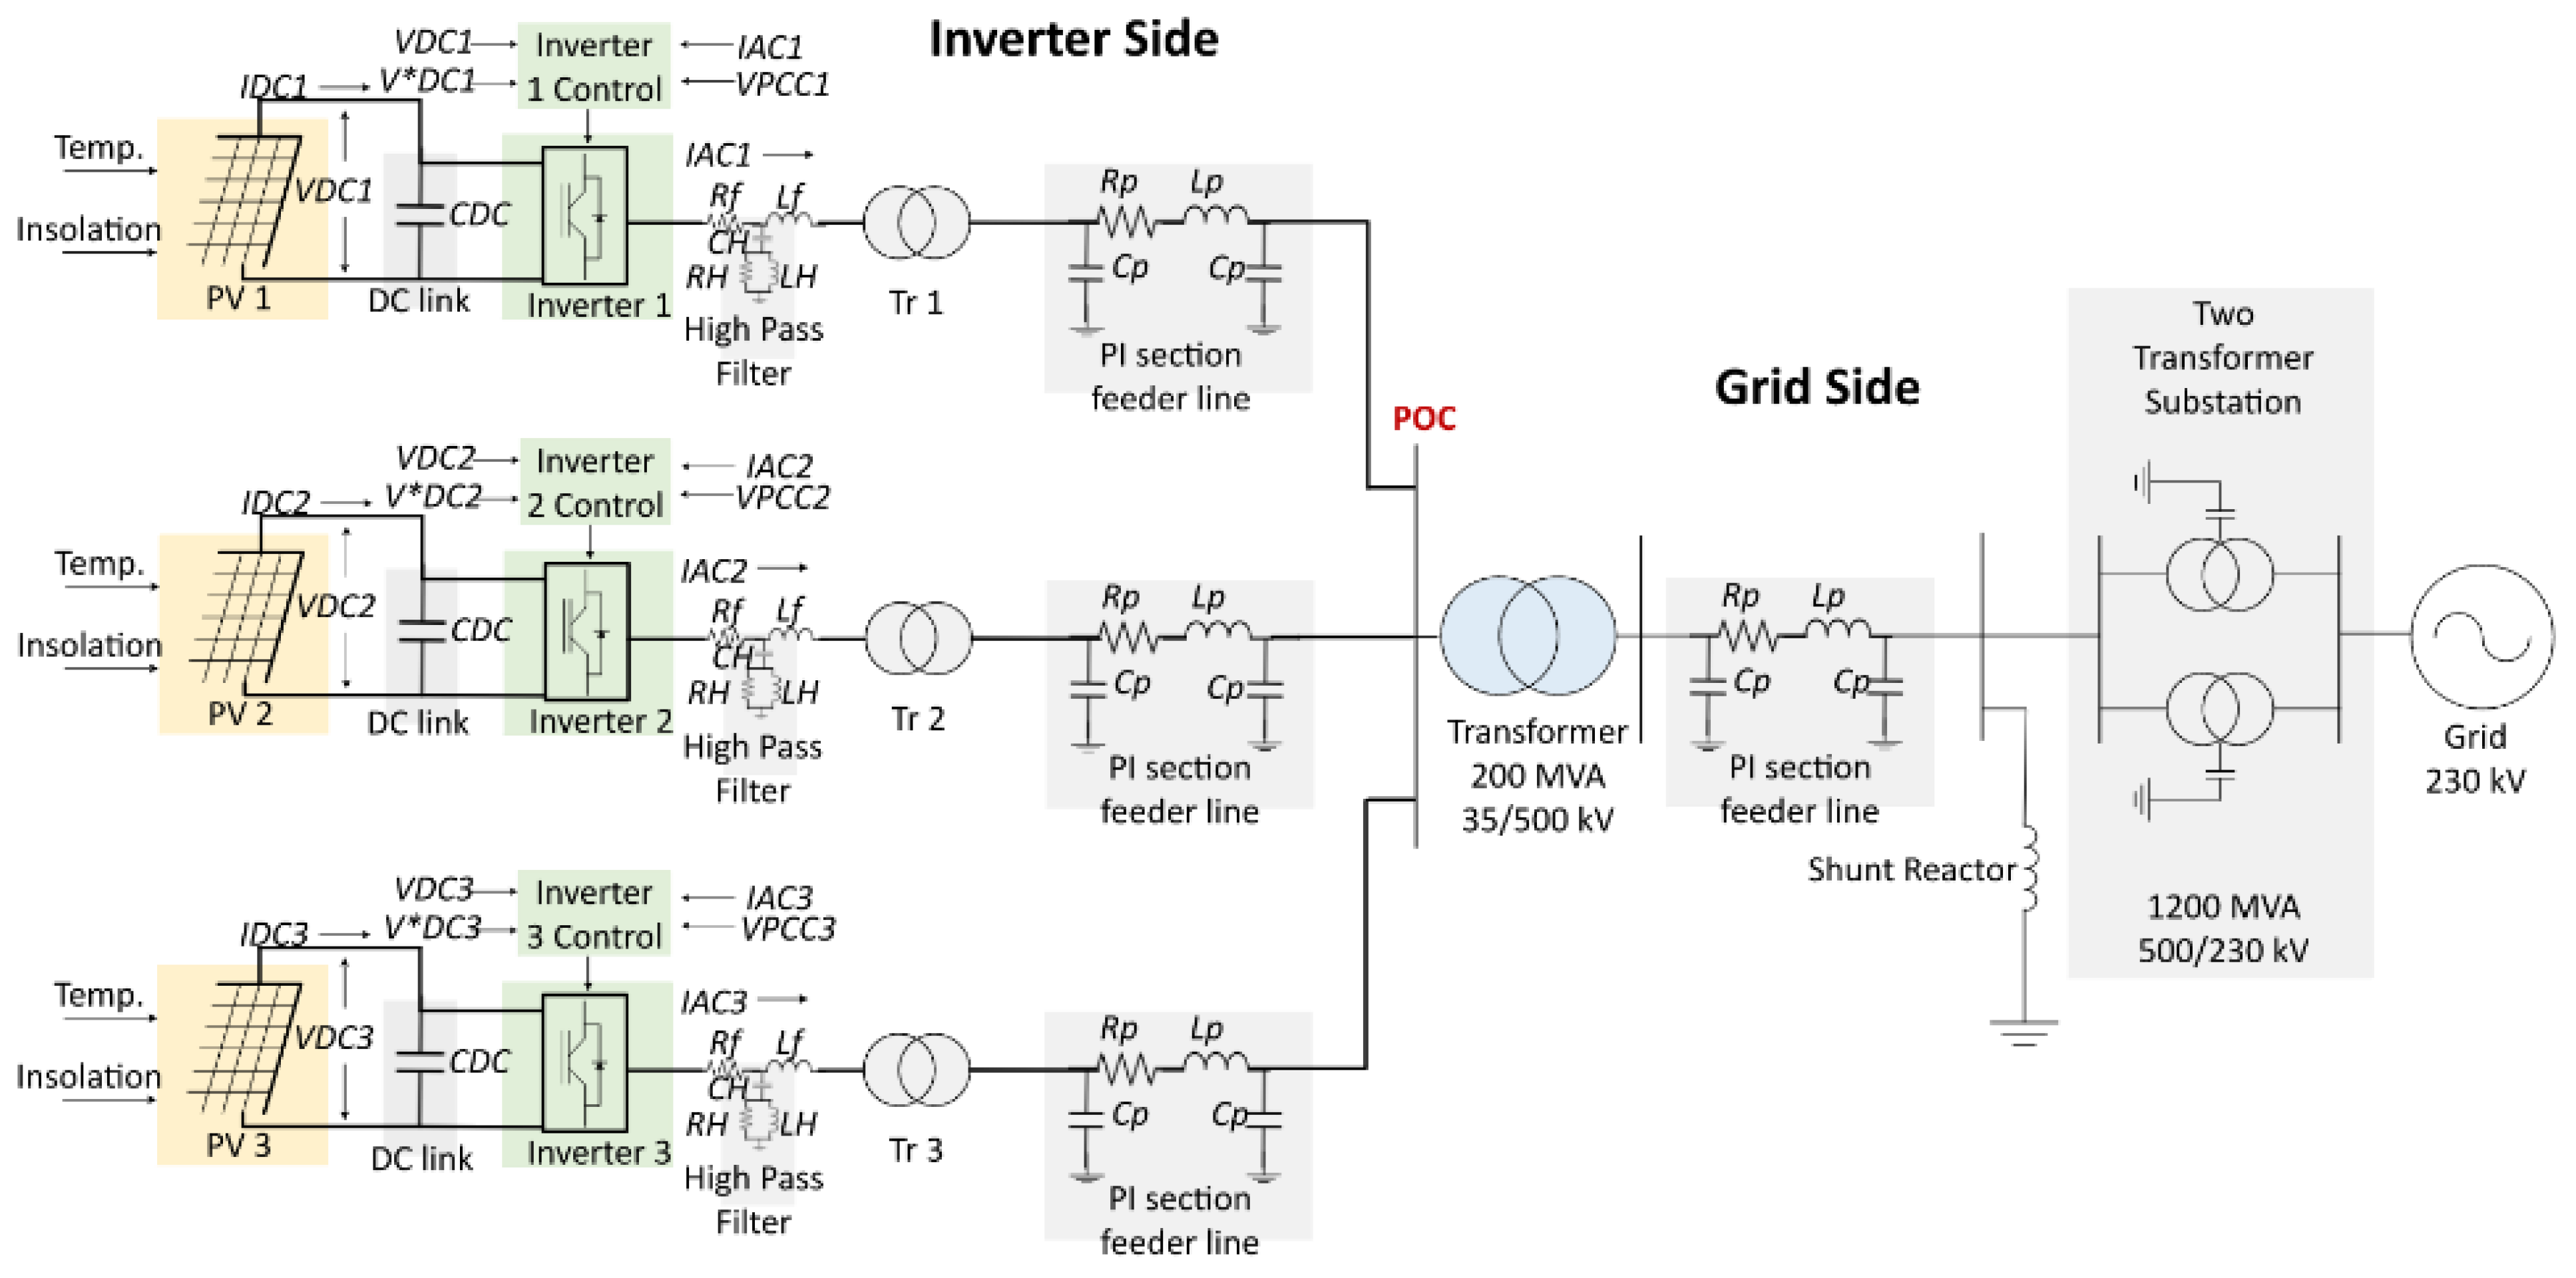
3. Modeling of Solar PV Test Systems

To investigate the impact of solar inverter dynamics during the grid restoration period on protection schemes, we used the library components of RSCAD software [24] to construct two grid-connected solar PV systems with detailed inverter models considering inverter switching dynamics and complicated inverter control functions required for the grid connection. RSCAD is a real-time simulation environment used with the RTDS.

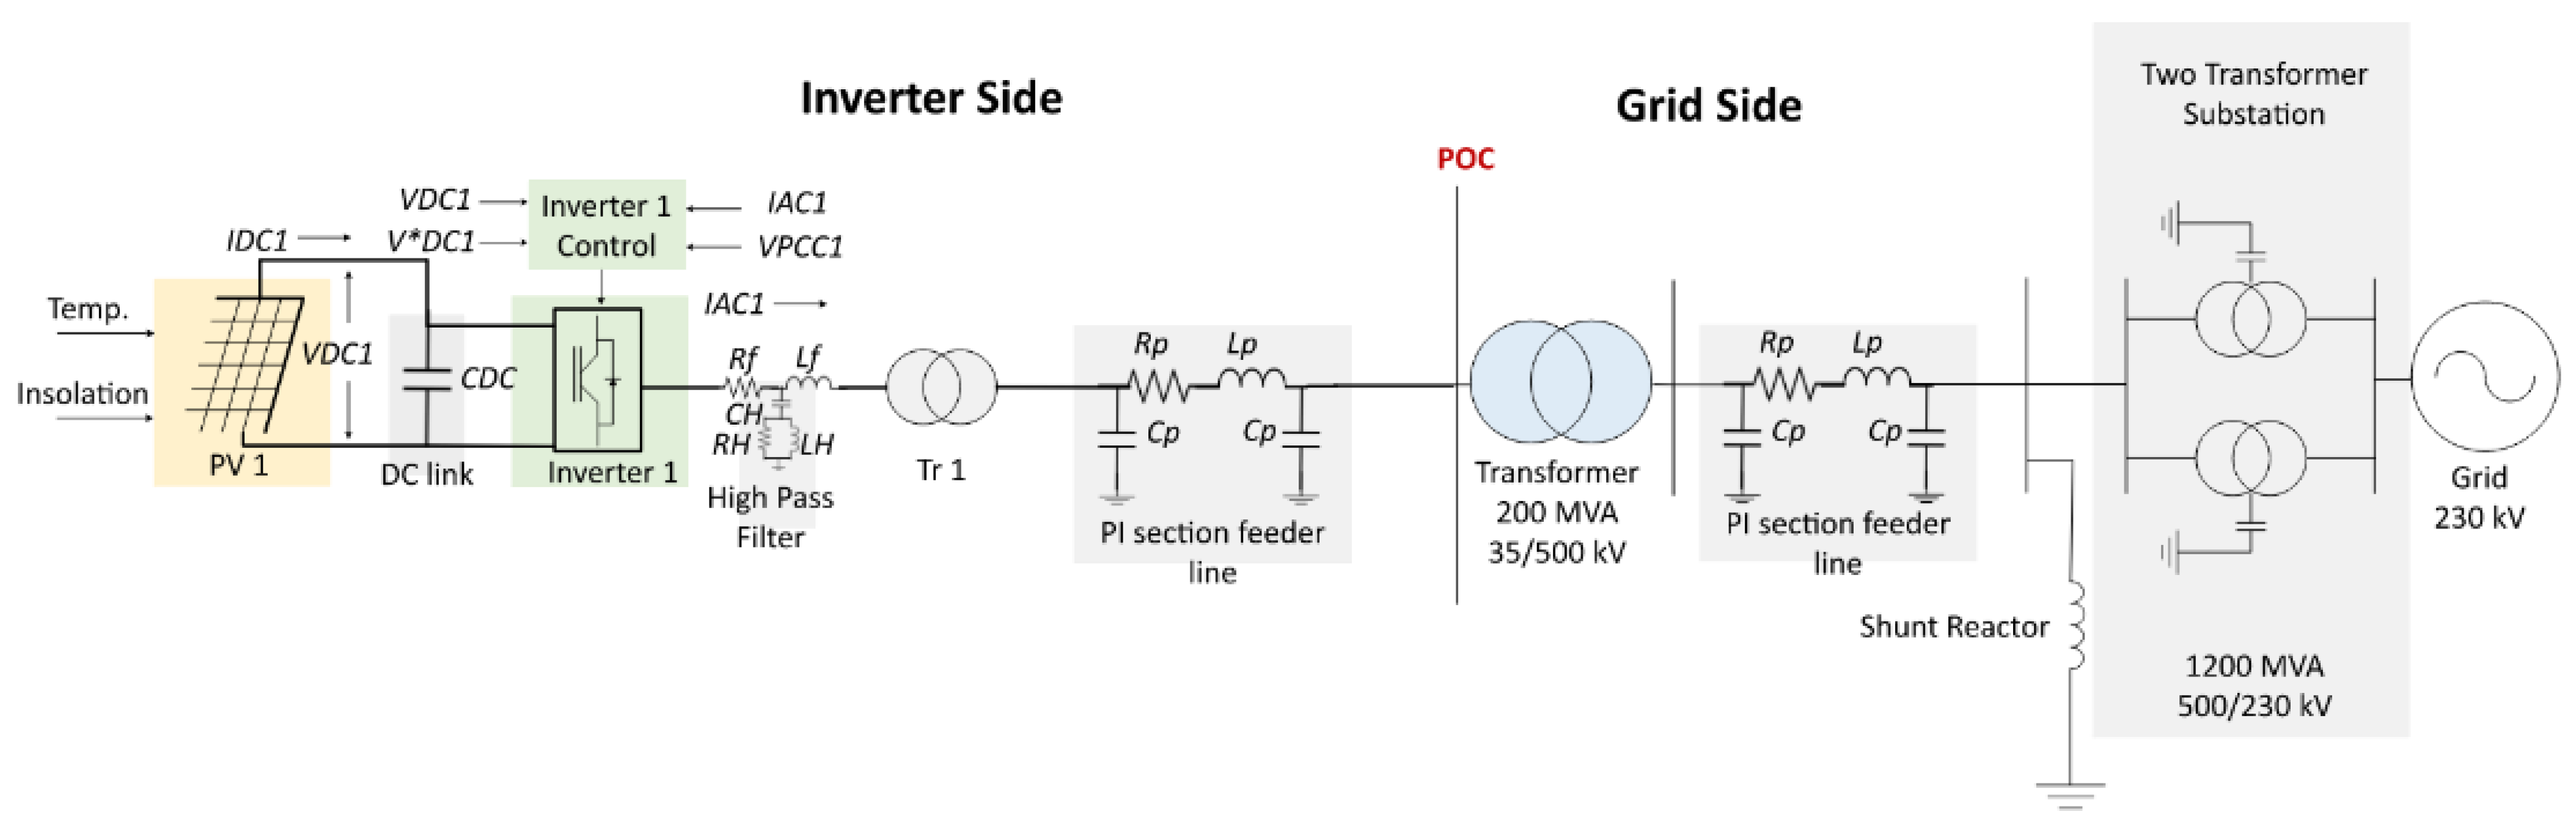
3.1. Solar PV Test System I

As illustrated in Figure 2, the grid-connected solar PV system I includes the grid side and solar inverter side. At the grid side, the 35 kV point of connection (POC) is connected to the 200 MVA main power transformer interfacing with the grid through the transmission line and step-up substation. The system transformer steps down the transmission voltage (i.e., 500 kV) to a medium voltage level (i.e., 35 kV). The transmission line also features a 225 MVAR shunt reactor acting as a reactive compensation device. The substation consists of two 1200 MVA main power transformers. The reactive compensation device and parameters for the transmission line and transformers were modeled to simulate a realistic environment that matches a system seen in the real-world to provide convincing and credible results. The grid was modeled as a standard voltage source with an impedance to account for a synchronous generator. Table 1 presents the component parameters for the grid side in this solar PV test system.
At inverter side, a single solar PV inverter was connected to the transmission POC bus through a 3 MVA step-up transformer (Tr 1 shown in Figure 2) and a PI-section feeder line. This transformer has a scaling function that scales the current as it steps up the voltage to increase the power output of the solar farm from 1.75 MW to 70 MW. As illustrated in Figure 3, the solar PV consists of a PV array that generates 1.75 MW peak power, a DC-link capacitor to stabilize the voltage, and a DC/AC inverter with control functions. Figure 3 also shows the solar PV inverter, which was modeled by a two-level voltage source converter (VSC) and a DC-link capacitor. Each of the six switches in the VSC connects one of the three phases to one of the DC terminals. The switches in each leg are switched alternatively using the sinusoidal pulse width modulation technique, where the sinusoidal reference signal is compared with a fixed frequency triangular waveform to create this switching pattern. The detailed inverter model also houses an AC reactor used to filter any undesired harmonics in the system. A snubber circuit was modeled inside of the inverter model, which limits the switching voltage amplitude and its rise rate and reduces power dissipation from the inverter. The snubber circuit consists of a series capacitor and a series resistor connected with a thyristor in parallel. On the AC side terminals of the inverter, there is a high-pass RC filter capable of filtering out transients from both the grid and the inverter AC side terminals. The parameters for the solar PV array and the inverter are shown in Table 2.
As shown in Figure 4, the solar PV inverter has generic control schemes as well as blocking and de-blocking functions. For the outer loop control, the reference value for the DC bus voltage control (V*DC) was generated through incremental conductance-based maximum power point tracking (MPPT) algorithm, and phase-locked loop (PLL)-based measurements from the grid were used as input for the AC bus voltage control. These outer-loop voltage controls generate d-axis and q-axis reference currents for the inner-current loop. The inner-current loop outputs the modulation index, which is later converted into abc form using dq0 to abc conversion to input into the firing pulse generators. The generators provide gate signals to the inverter with a switching frequency of 2 kHz. In addition, the detailed inverter model includes blocking and de-blocking functions in response to the low-voltage dynamics during fault conditions. Inverter blocking is the function that the inverter is connected to the grid but ceases to output any current when the inverter terminal voltage at the point of common coupling falls below a certain level; inverter de-blocking is the function that inverter reinjects current after a reset delay time when the terminal voltage returns to a nominal value. The fixed time delay was set so that when the current starts to reinject into the system, the system should mostly be back to stability [25].

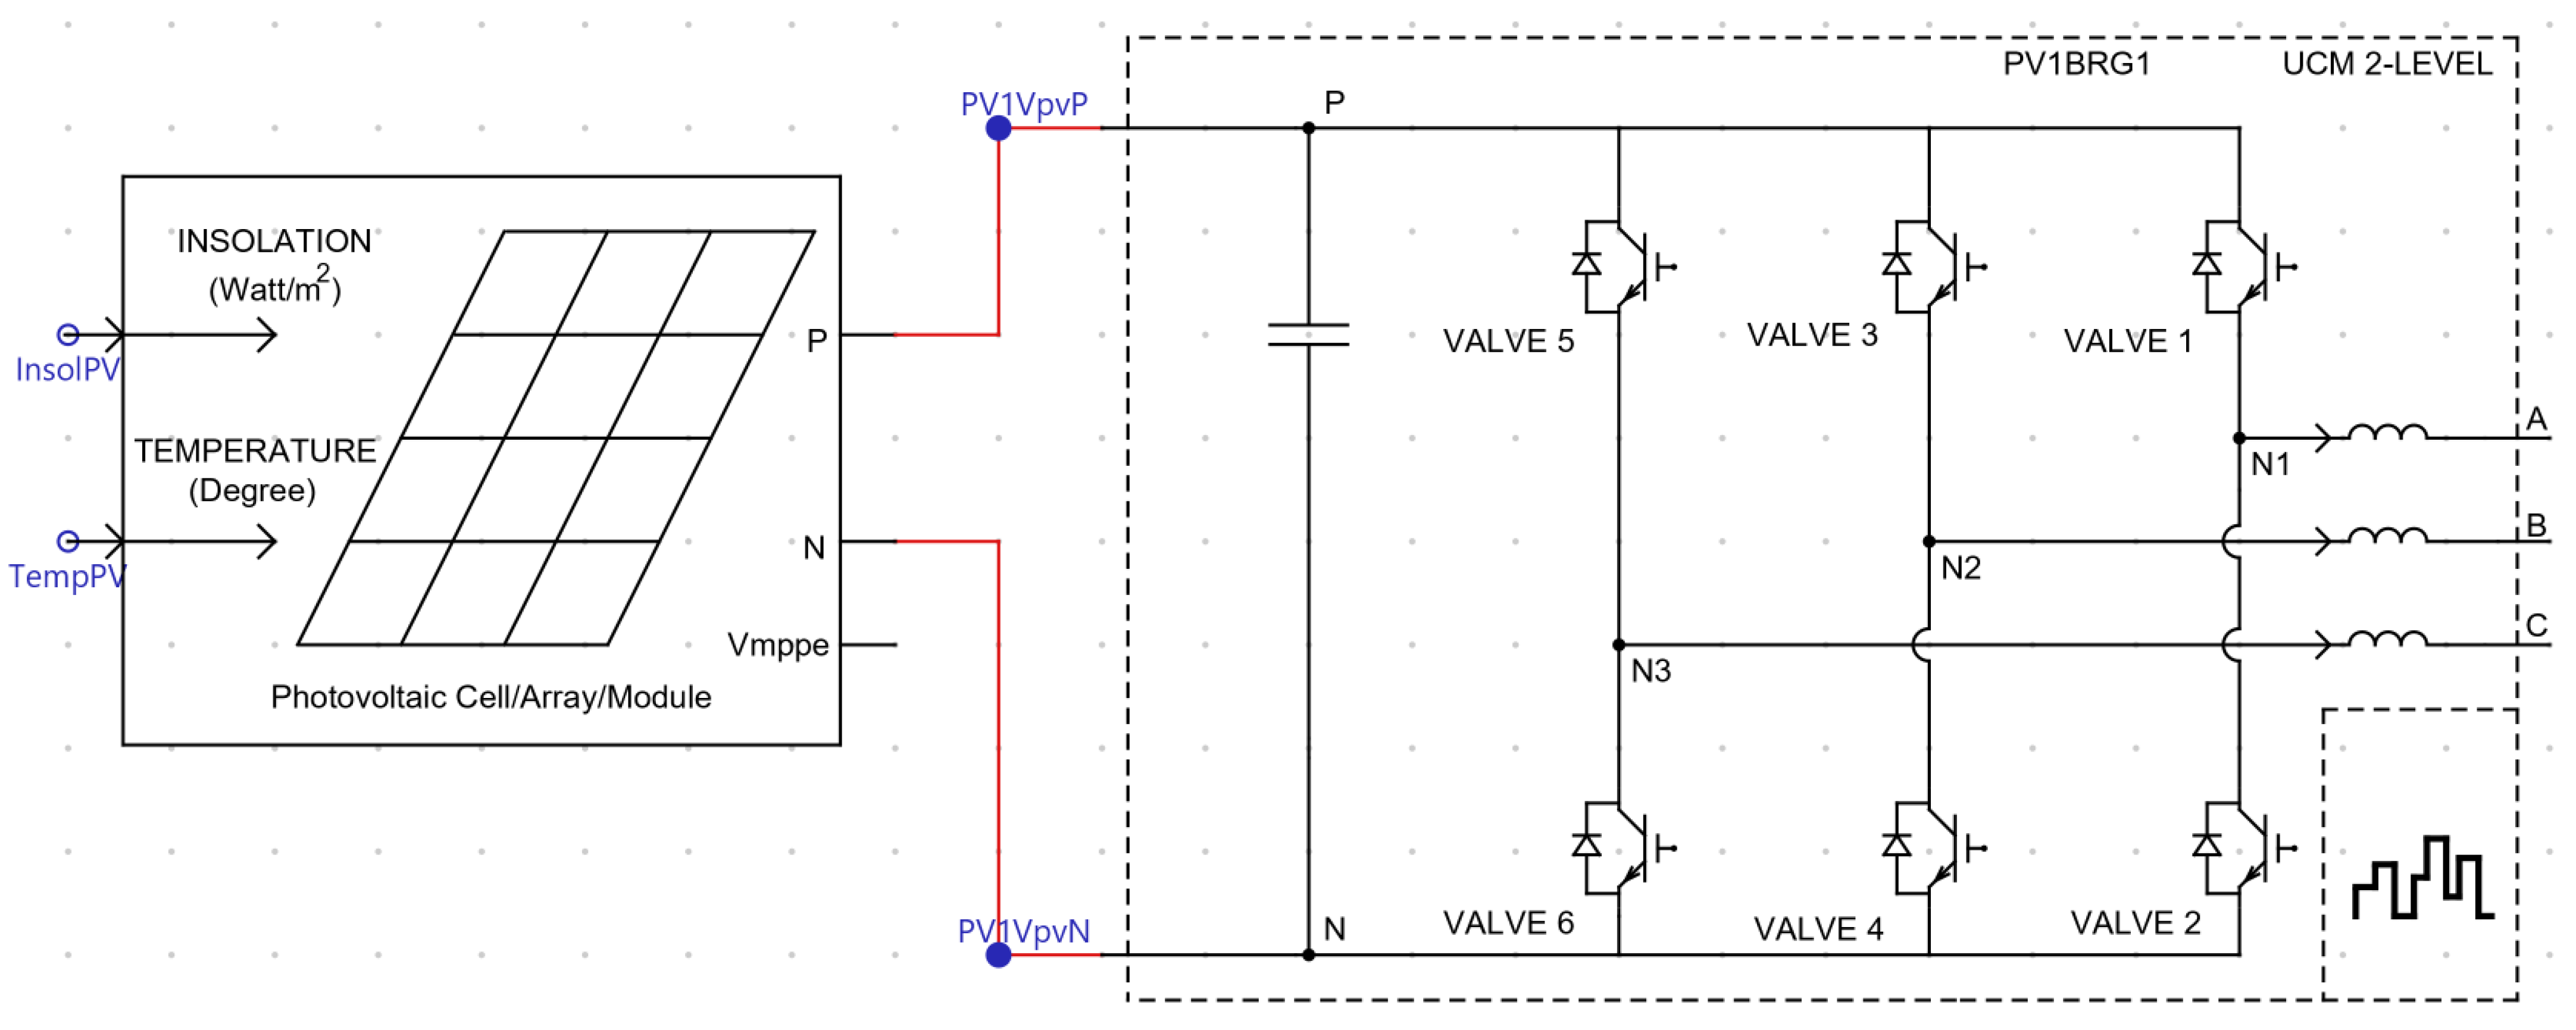
3.2. Solar PV Test System II

Based on the solar PV test system I, solar PV system II was further created to investigate the impact of solar inverter dynamics during the grid restoration period on protection schemes when increasing the number of solar PV inverters. As shown in Figure 5, solar PV test system II has three solar PV inverters connected to the grid. In this solar PV system, each of these three solar PVs and their inverters have the same PV system parameters and inverter control system and gain values as those used in the solar PV system I. Each solar facility has its own step-up transformer as well as its own PI section feeder line to characterize the feeder cables and transformers in a real-world solar farm. The feeder cables were then connected together at the low side of the step-up substation, which feeds solar power into the grid via the 35 kV point of connection (POC) connected to the 200 MVA main power transformer, the transmission line, and step-up substation. The 200 MVA main power transformer, the transmission line, and step-up substation have the same parameters as those used in the solar PV test system I. It is worth noting that the maximum power output of the solar generation facility is three times larger than that in the solar PV system I.

4. Negative-Sequence Current of Solar Inverters versus Synchronous Generators during Grid Restoration Period

To illustrate the difference in the negative-sequence current characteristics between solar inverters and synchronous generators during the restoration period following a grid disturbance, let us consider the solar PV test system I as shown in Figure 2. In this test system, a balanced three-phase fault was applied to the grid side at t = 6.12 s and then cleared after three cycles. This fault causes the voltage to drop to 0.5 p.u. at the grid bus and immediately triggers the solar PV inverter blocking function to cease the current injection from the inverter. After the fault is cleared, 2 cycles are delayed to restart the current injection from the solar inverter. Figure 6 shows the magnitude of the negative-sequence voltage and current magnitudes measured at POC bus in the time domain. To show the negative-sequence current characteristics of synchronous generators under the same fault, we replaced the solar inverter in the test system I with a synchronous generator. Figure 7 shows the magnitude of the negative-sequence voltage and current magnitudes measured at POC bus in the time domain. The data of negative-sequence voltage and current are fundamental frequency values, which are resistant to harmonic content, and are used for relay operation. Figure 8 shows the angular differences between the negative-sequence current and voltage for the solar inverter and the synchronous generator.
Comparison of Figure 6 and Figure 7, as well as looking at Figure 8, reveals key differences between the negative-sequence current characteristics of the solar inverter and synchronous generator during the grid restoration period:
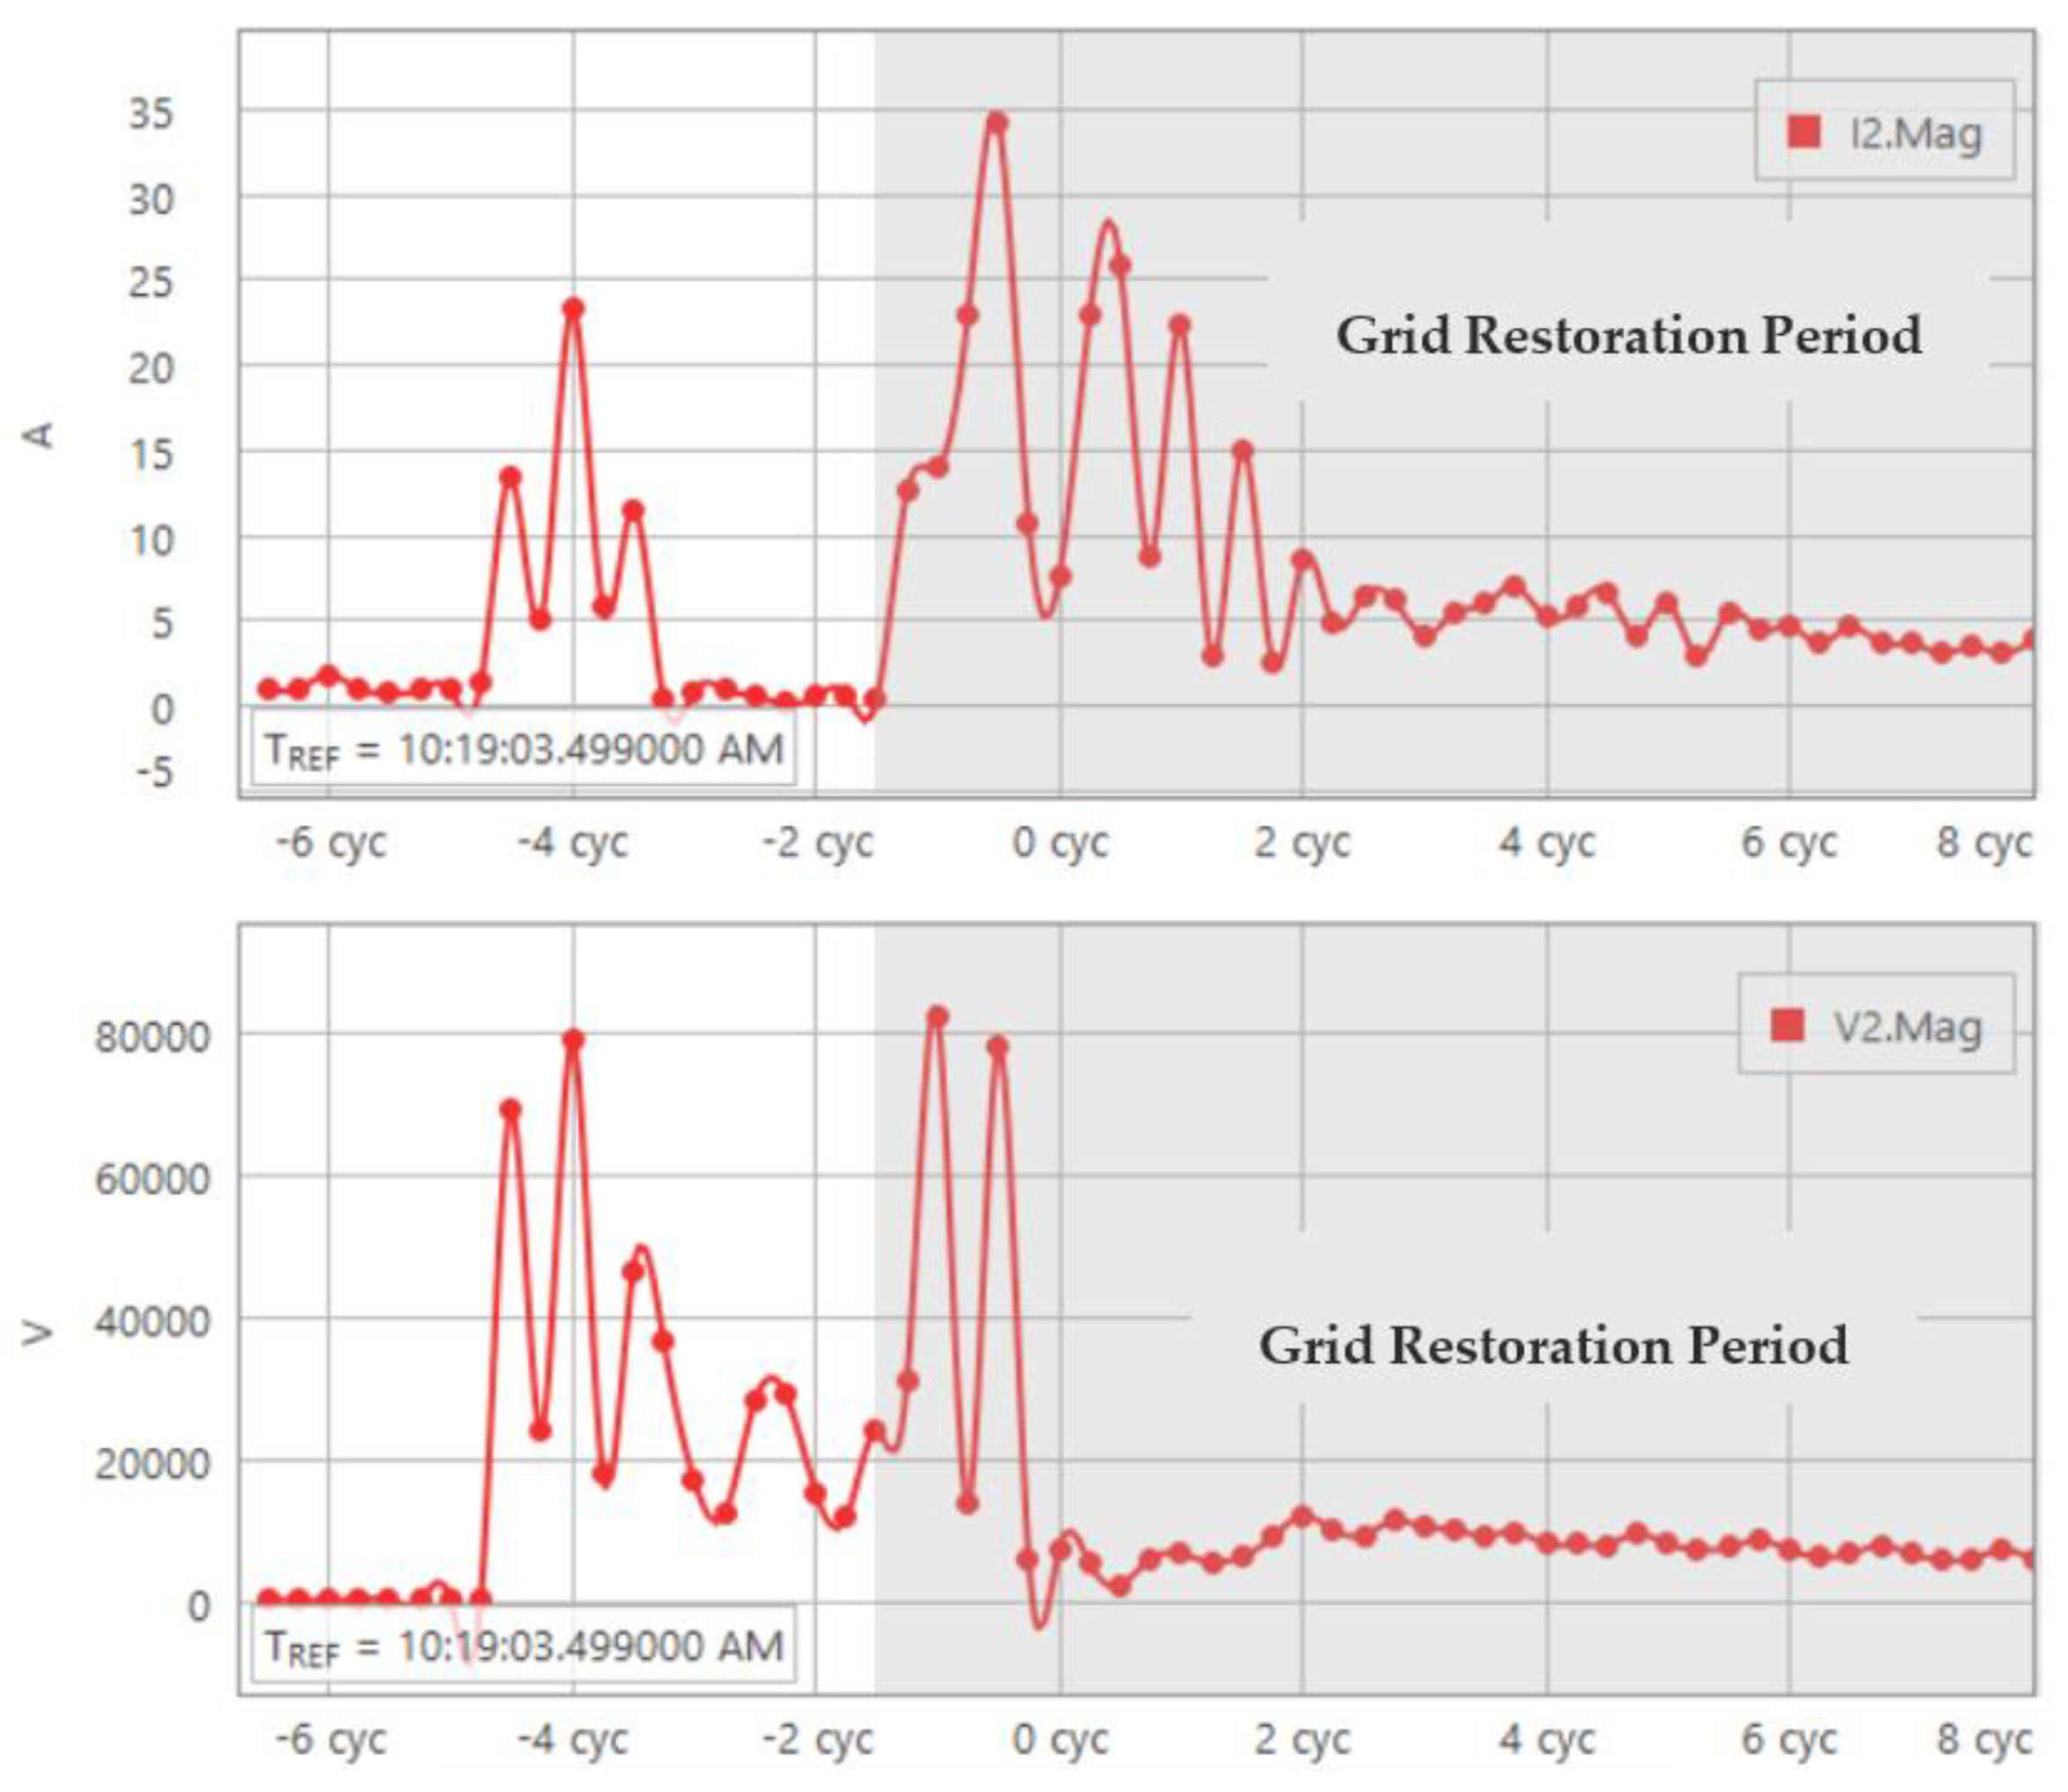
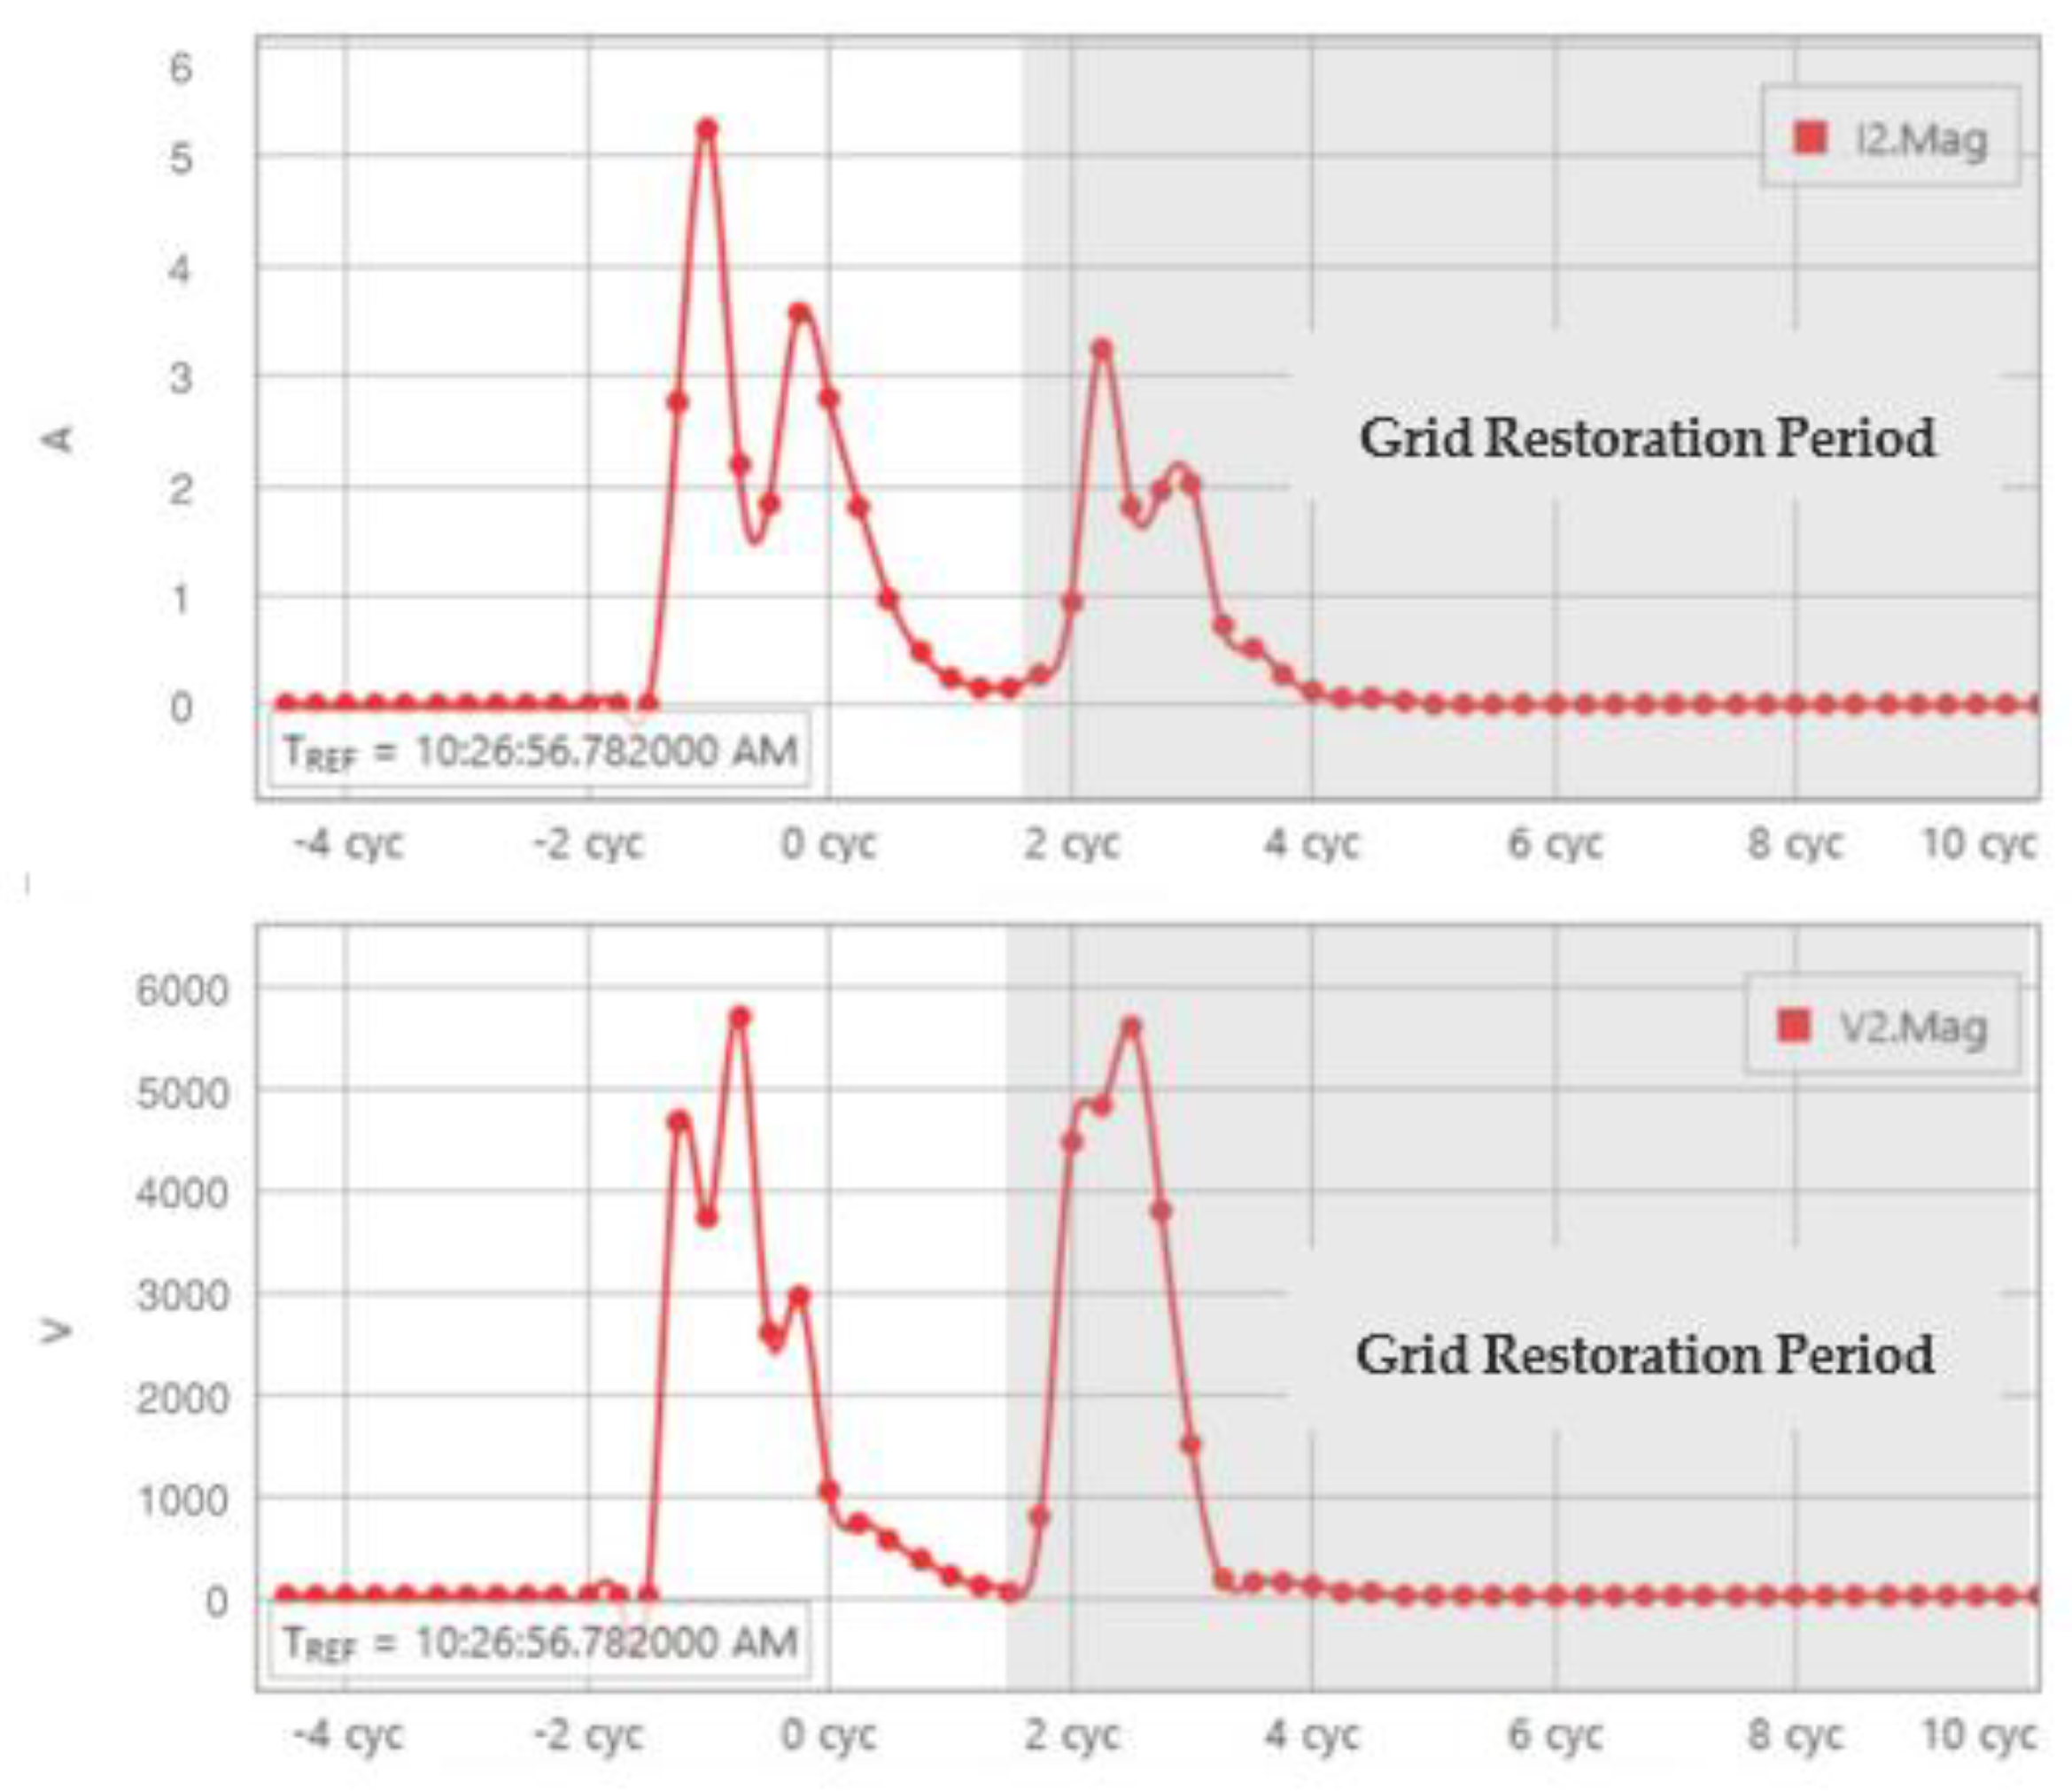
  • Unlike the conventional synchronous generator, the solar inverter has a relatively high magnitude of negative-sequence current during the grid restoration period after the fault is cleared. More specifically, during the grid restoration period, the peak value of the negative-sequence current magnitude from the solar inverter was approximately 35 amps and maintained for about 3.5 cycles; on the other hand, the peak value of the negative-sequence current magnitude from the synchronous generator was just close to 3 amps.
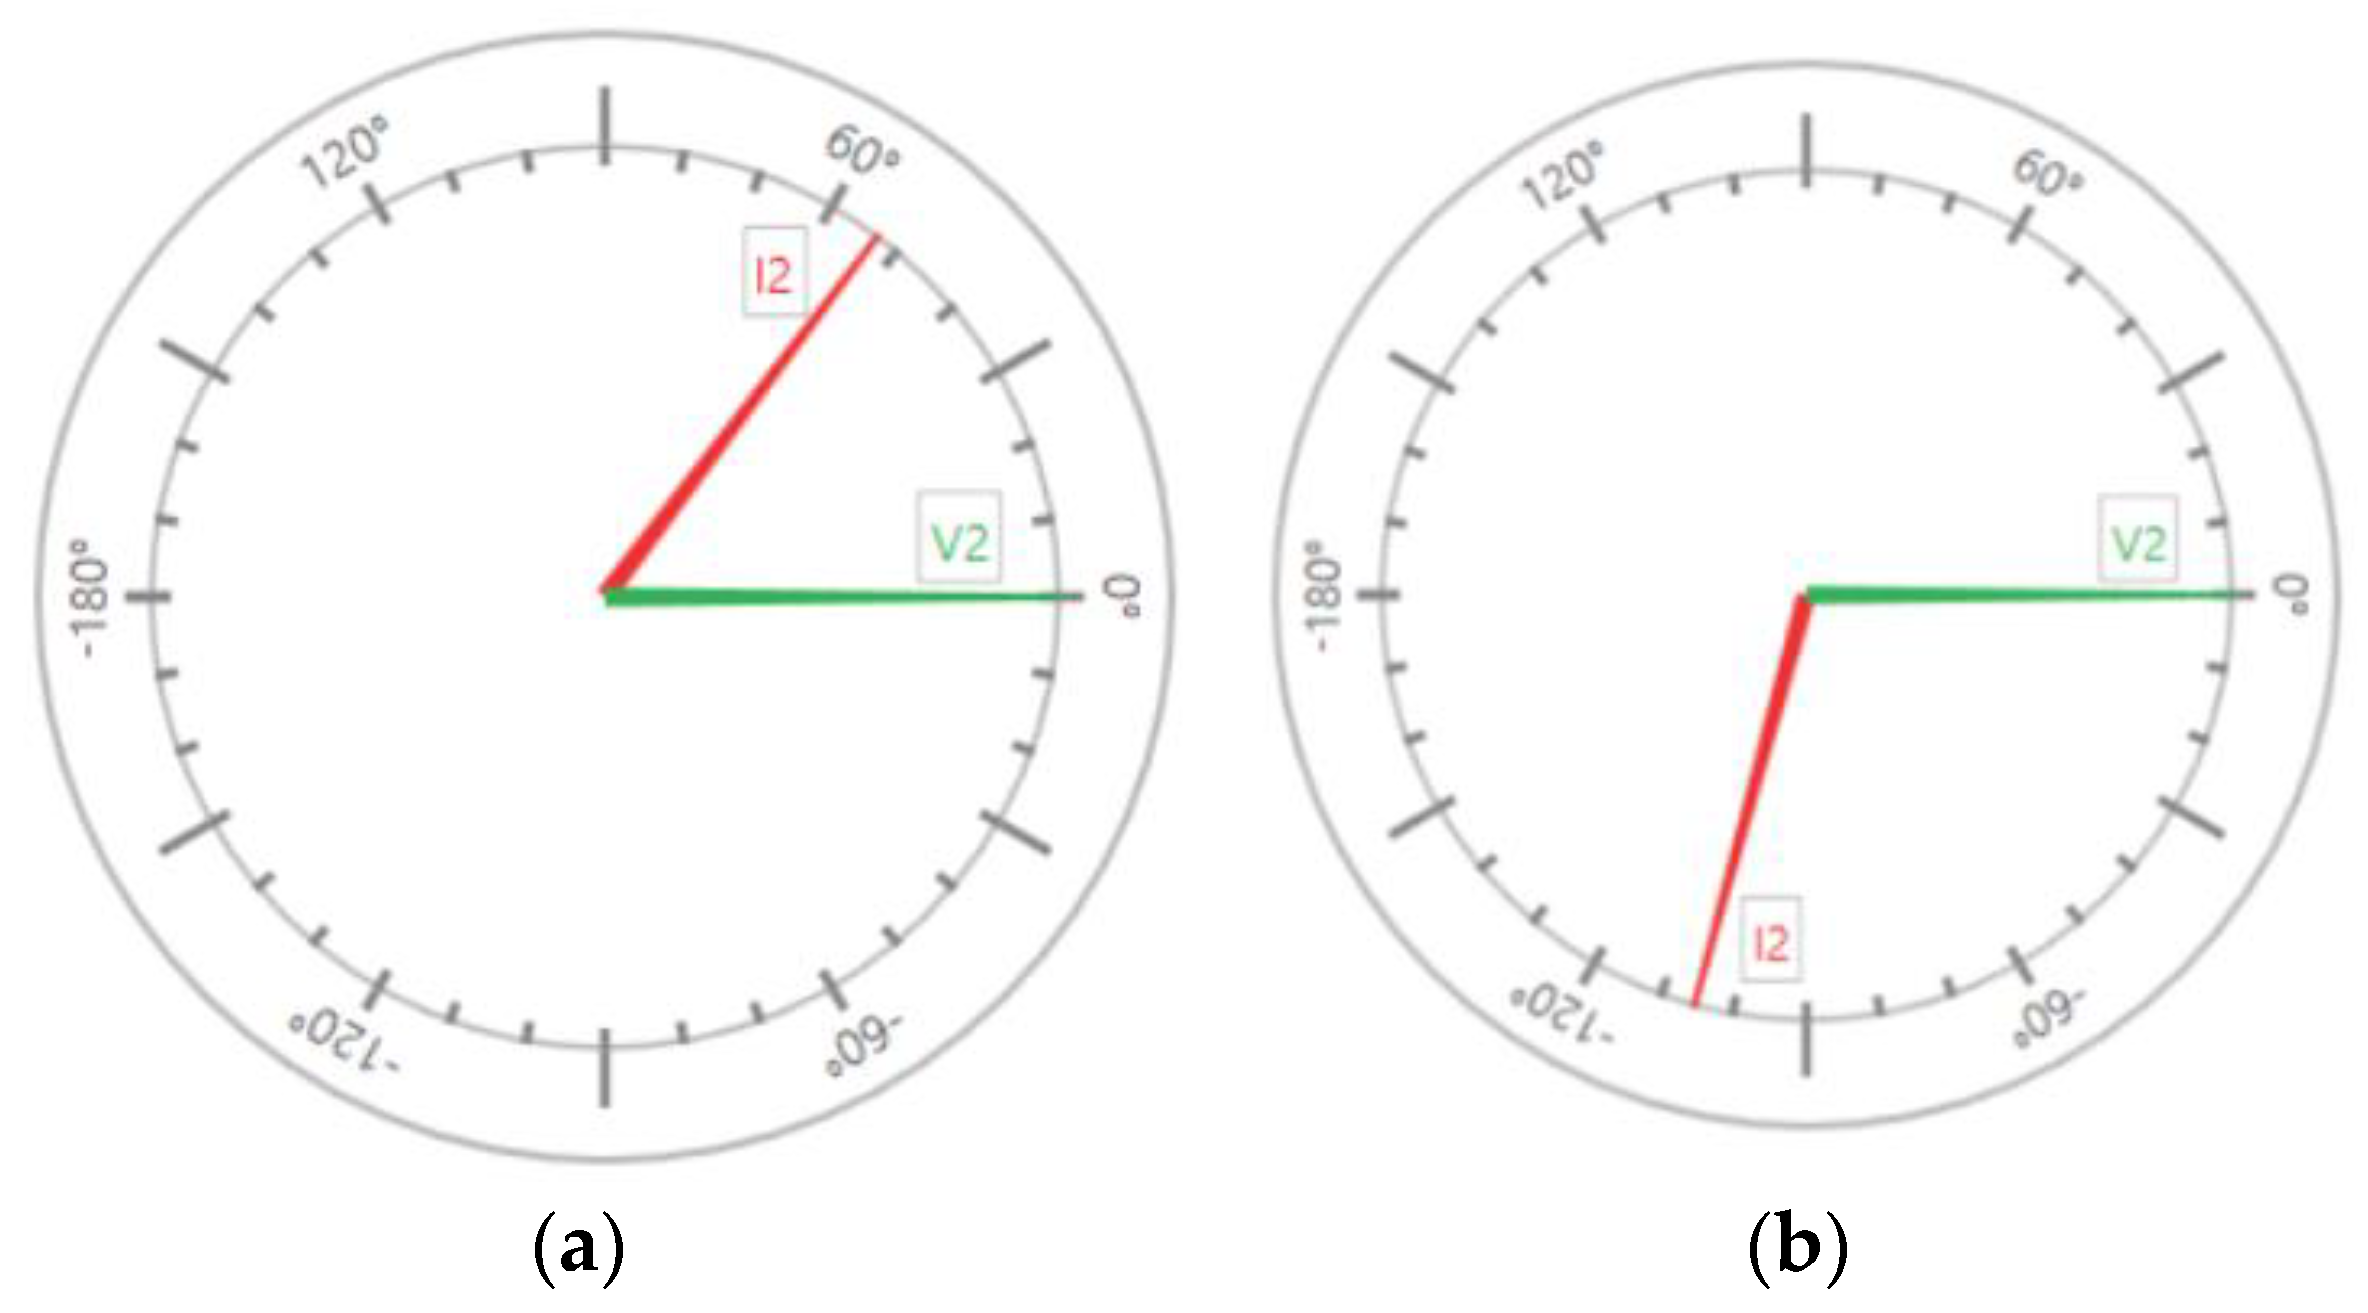
  • The difference between the phase angle of negative-sequence voltage and current phasors from the solar inverter was −53 degrees with the voltage lagging the current. This means the solar inverter acted as a source during the grid restoration period to inject negative-sequence current into the grid. By contrast, the synchronous generator had a phase angle difference between the negative-sequence voltage and current of 105 degrees with the voltage leading the current, which means the synchronous generator behaves as a load during the grid restoration period to absorb the negative-sequence current from the grid.
It should be noted that the three-phase fault at the grid bus caused a very high negative-sequence current from the solar inverter during the grid restoration period after the fault is cleared. This was different than what was anticipated since a three-phase fault is a balanced fault type and would not be expected to produce negative-sequence currents or unbalanced currents. Moreover, the high negative-sequence current was induced after the fault is cleared. The negative-sequence current is of particular importance for negative-sequence-based protection elements. Traditionally, these protection schemes have been designed assuming that negative-sequence quantities are present at significant levels during unbalanced fault conditions. We discuss the impact of the negative-sequence current of solar inverters on the negative-sequence-based protection schemes in Section 6.

5. Characteristic Analysis of Negative-Sequence Current Injected from Solar Inverters during Grid Restoration Period

The previous section discusses the key differences in the negative-sequence current characteristics between solar inverters and synchronous generators during the restoration period following a grid disturbance. In this section, we further investigate the characteristics of the negative-sequence current of solar inverters using the RTDS simulator with the two solar PV test systems described in Section 3.

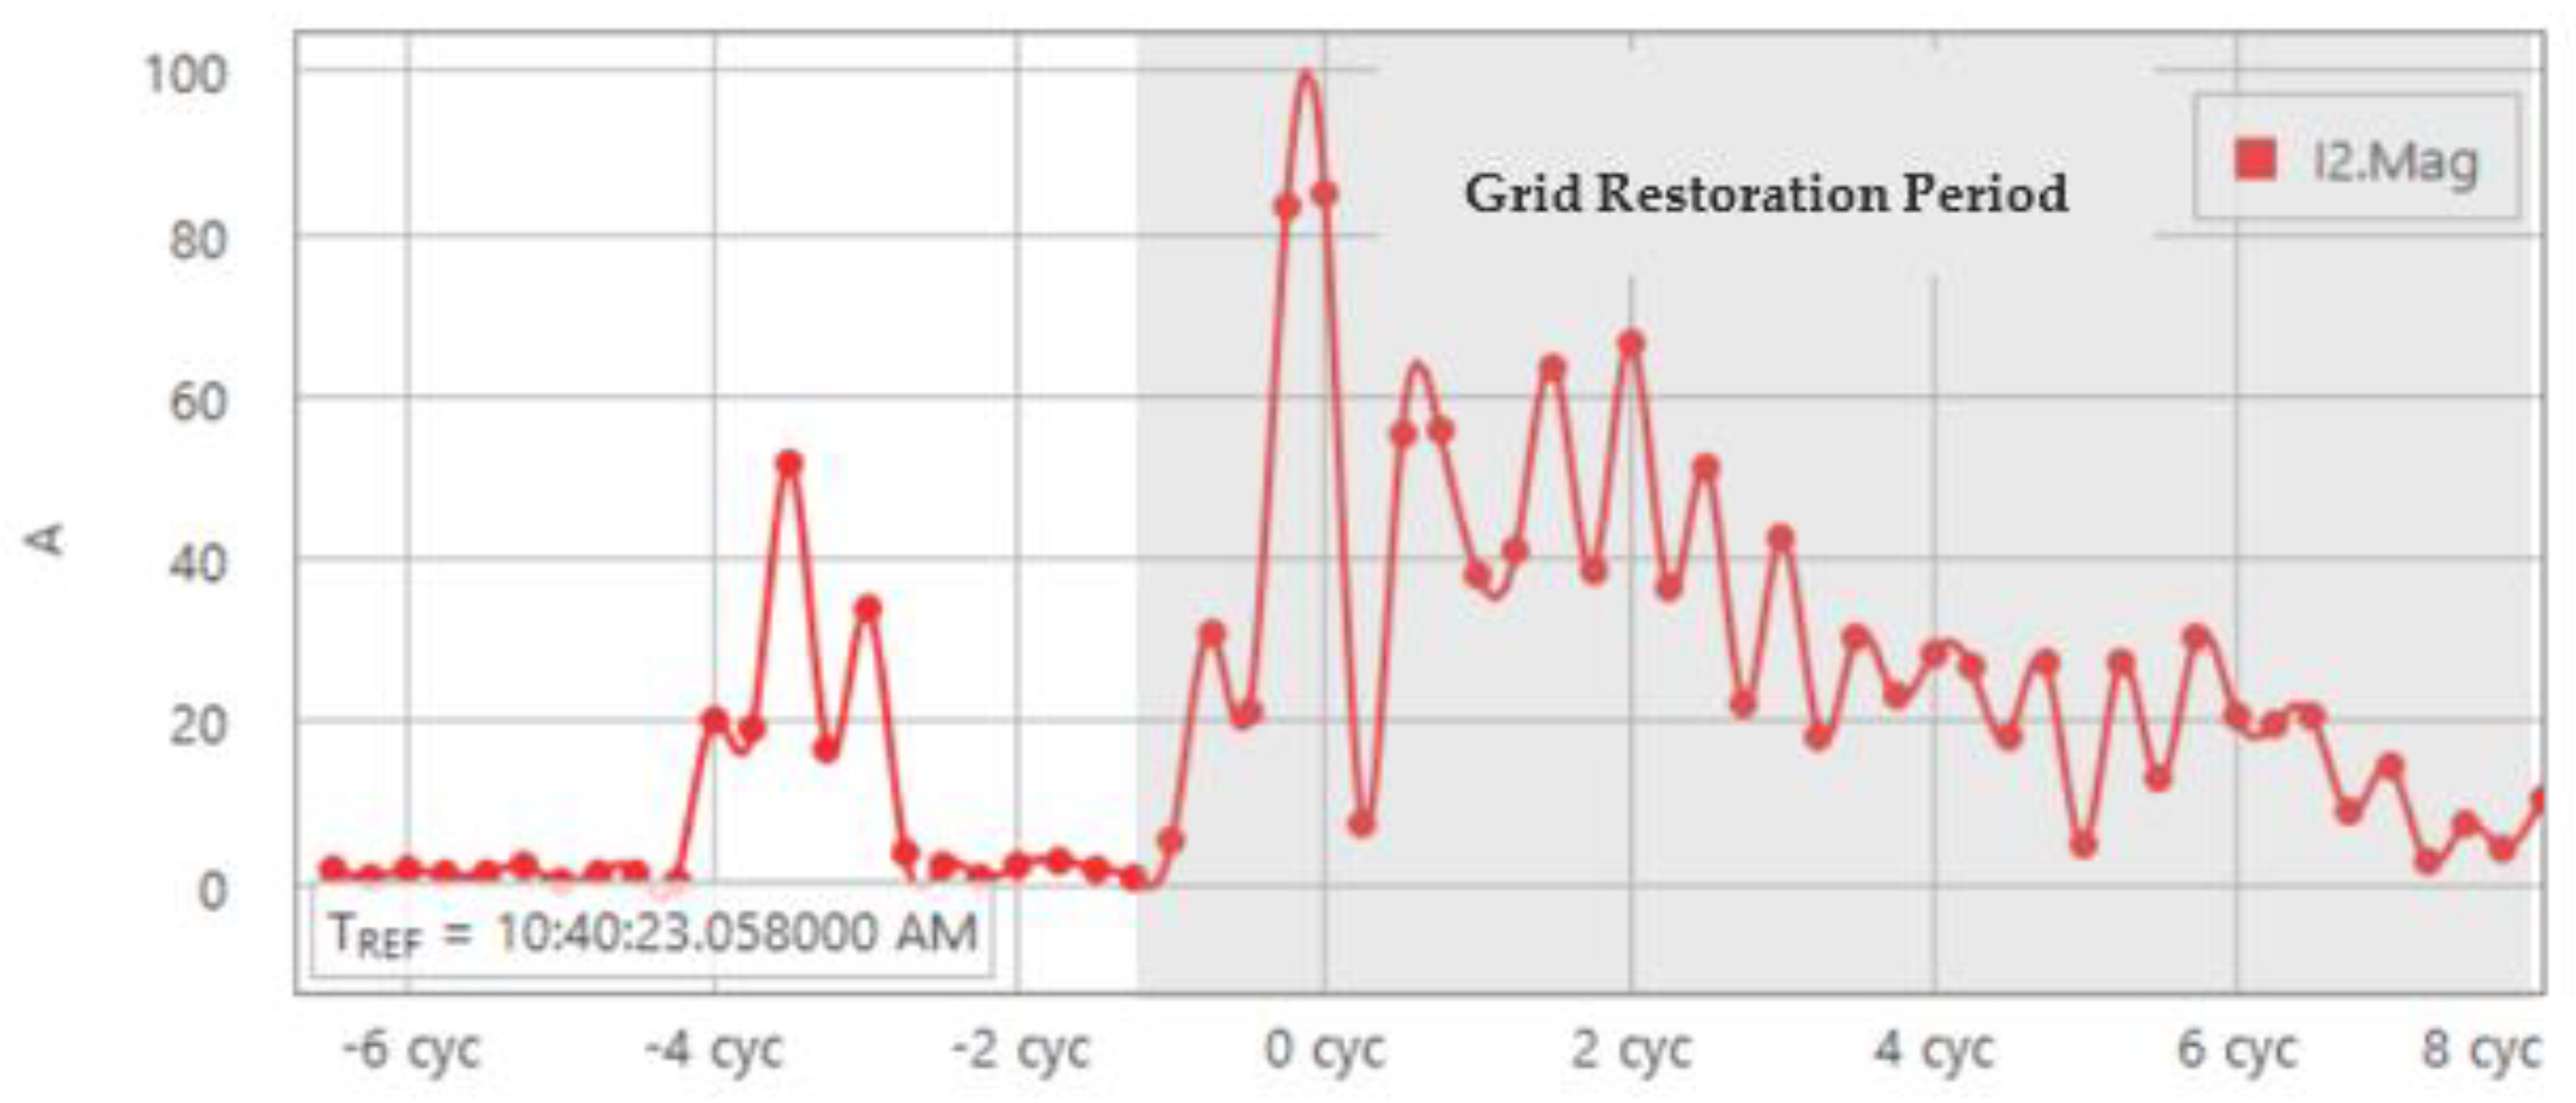
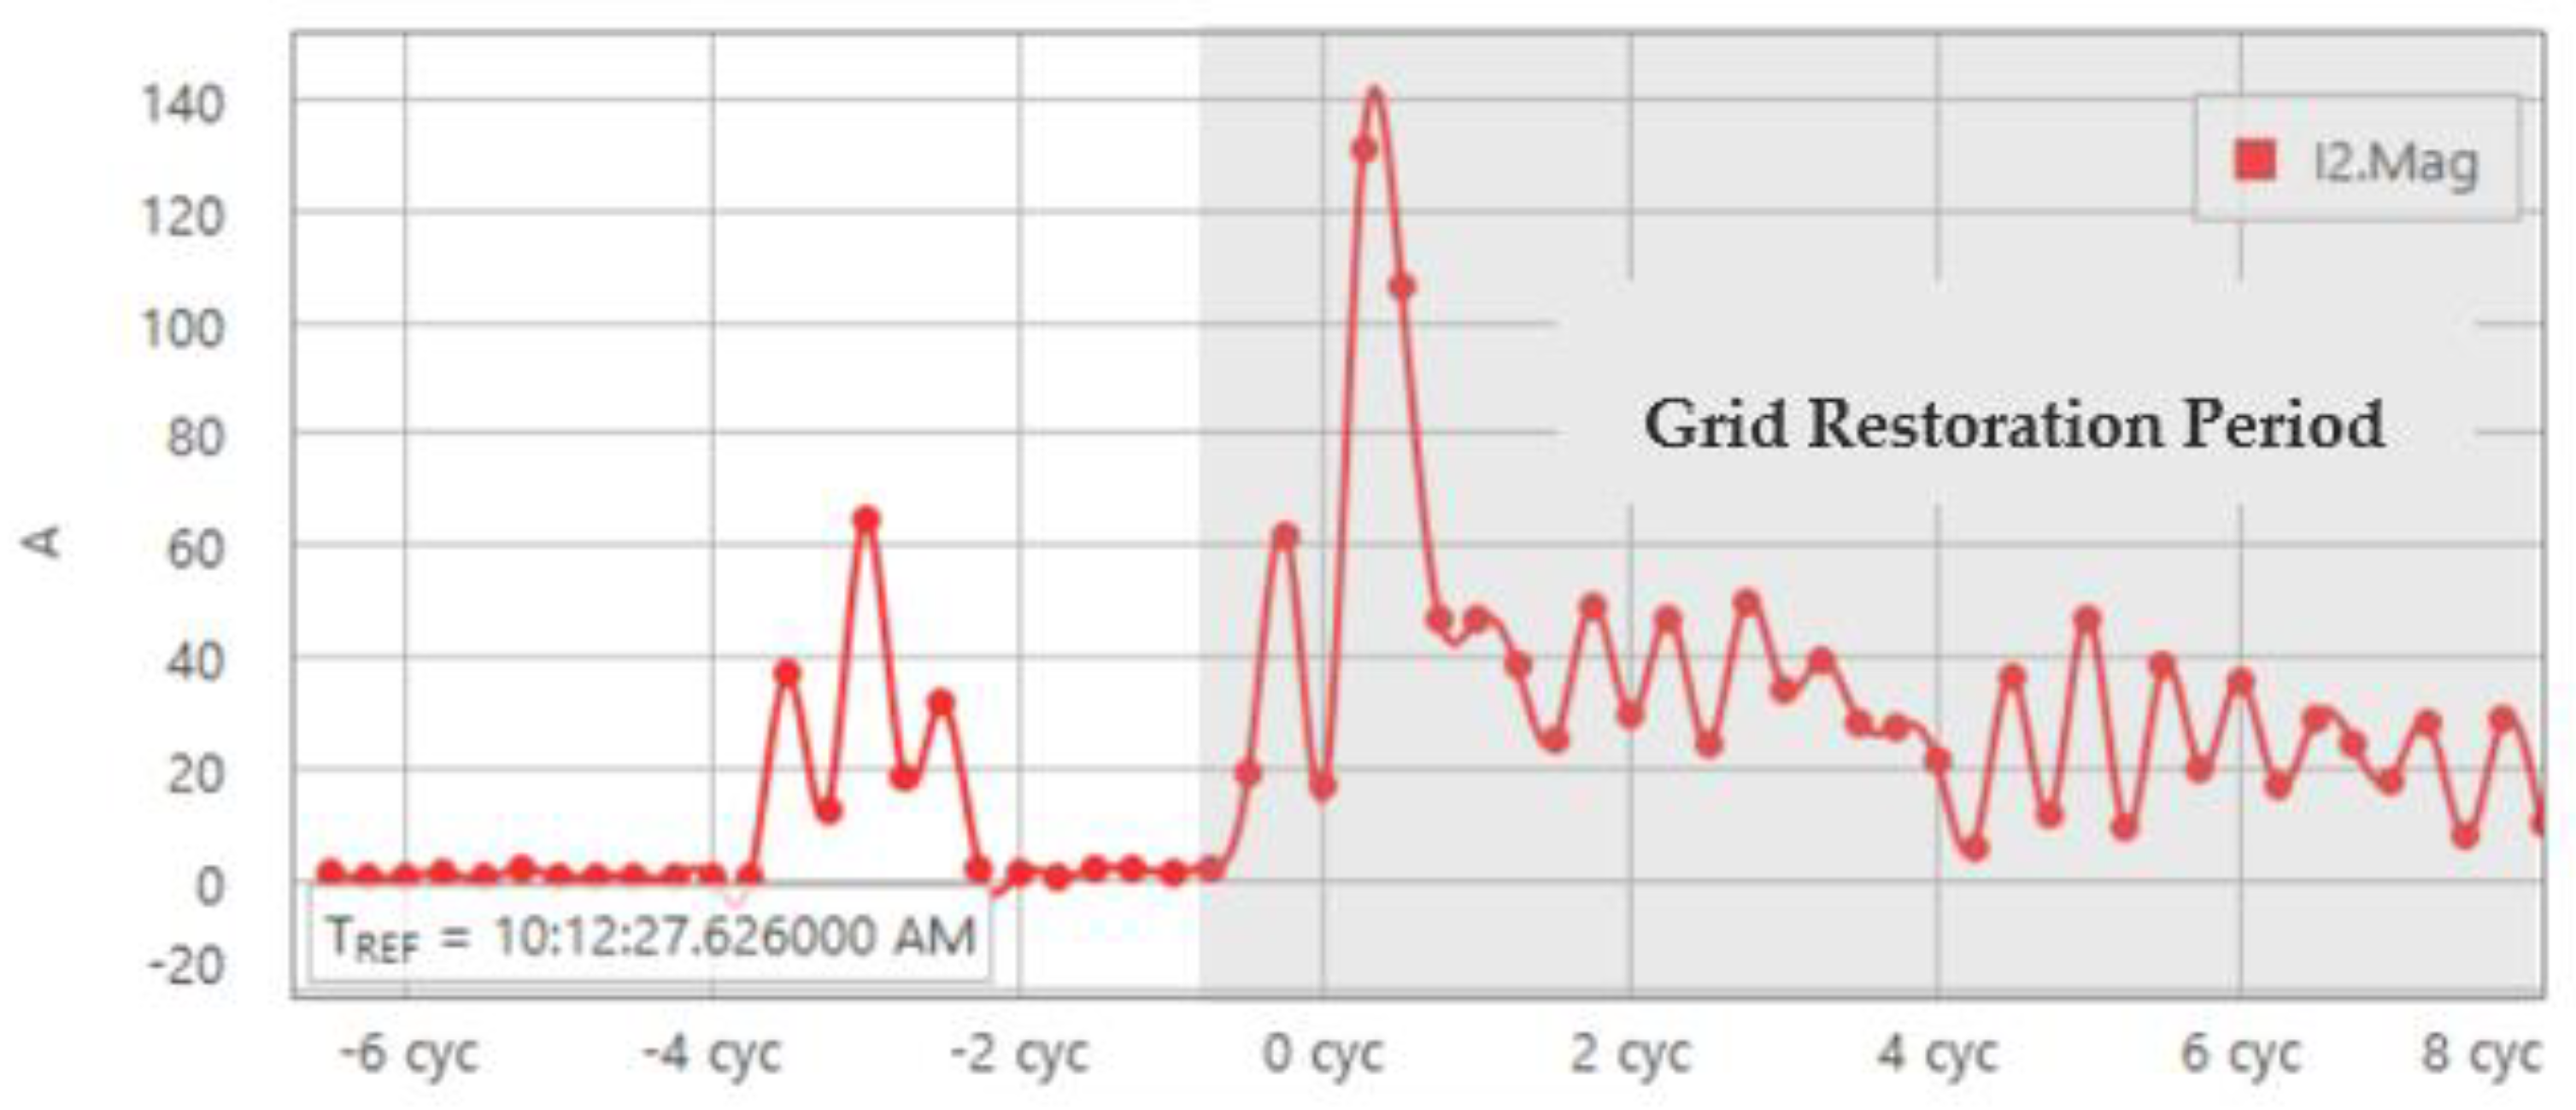
5.1. Impact of Solar Inverter Number

To investigate the impact of solar inverter number on the negative-sequence current of solar inverters, solar PV test system II constructed in Section 3 was used for RTDS simulation. The same three-phase fault used in Section 4 was applied to the grid side in this test system. Figure 9 shows the negative-sequence current measured at POC bus in solar PV system II following a three-phase fault.
By comparing Figure 6 with Figure 9, it can be observed that the magnitude of the negative-sequence current during the restoration period increased with the number of solar PV inverters. As shown in Figure 6, the peak value of the negative-sequence magnitude during the restoration period was 35 amps, but Figure 9 shows that the peak value of the negative-sequence current magnitude reached 100 amps, which is almost 3 times higher than 35 amps as shown in Figure 6. The interaction between additional inverters and the power network in solar PV test system II causes the increasing peak value of the negative-sequence current magnitude during the restoration period following a grid disturbance.

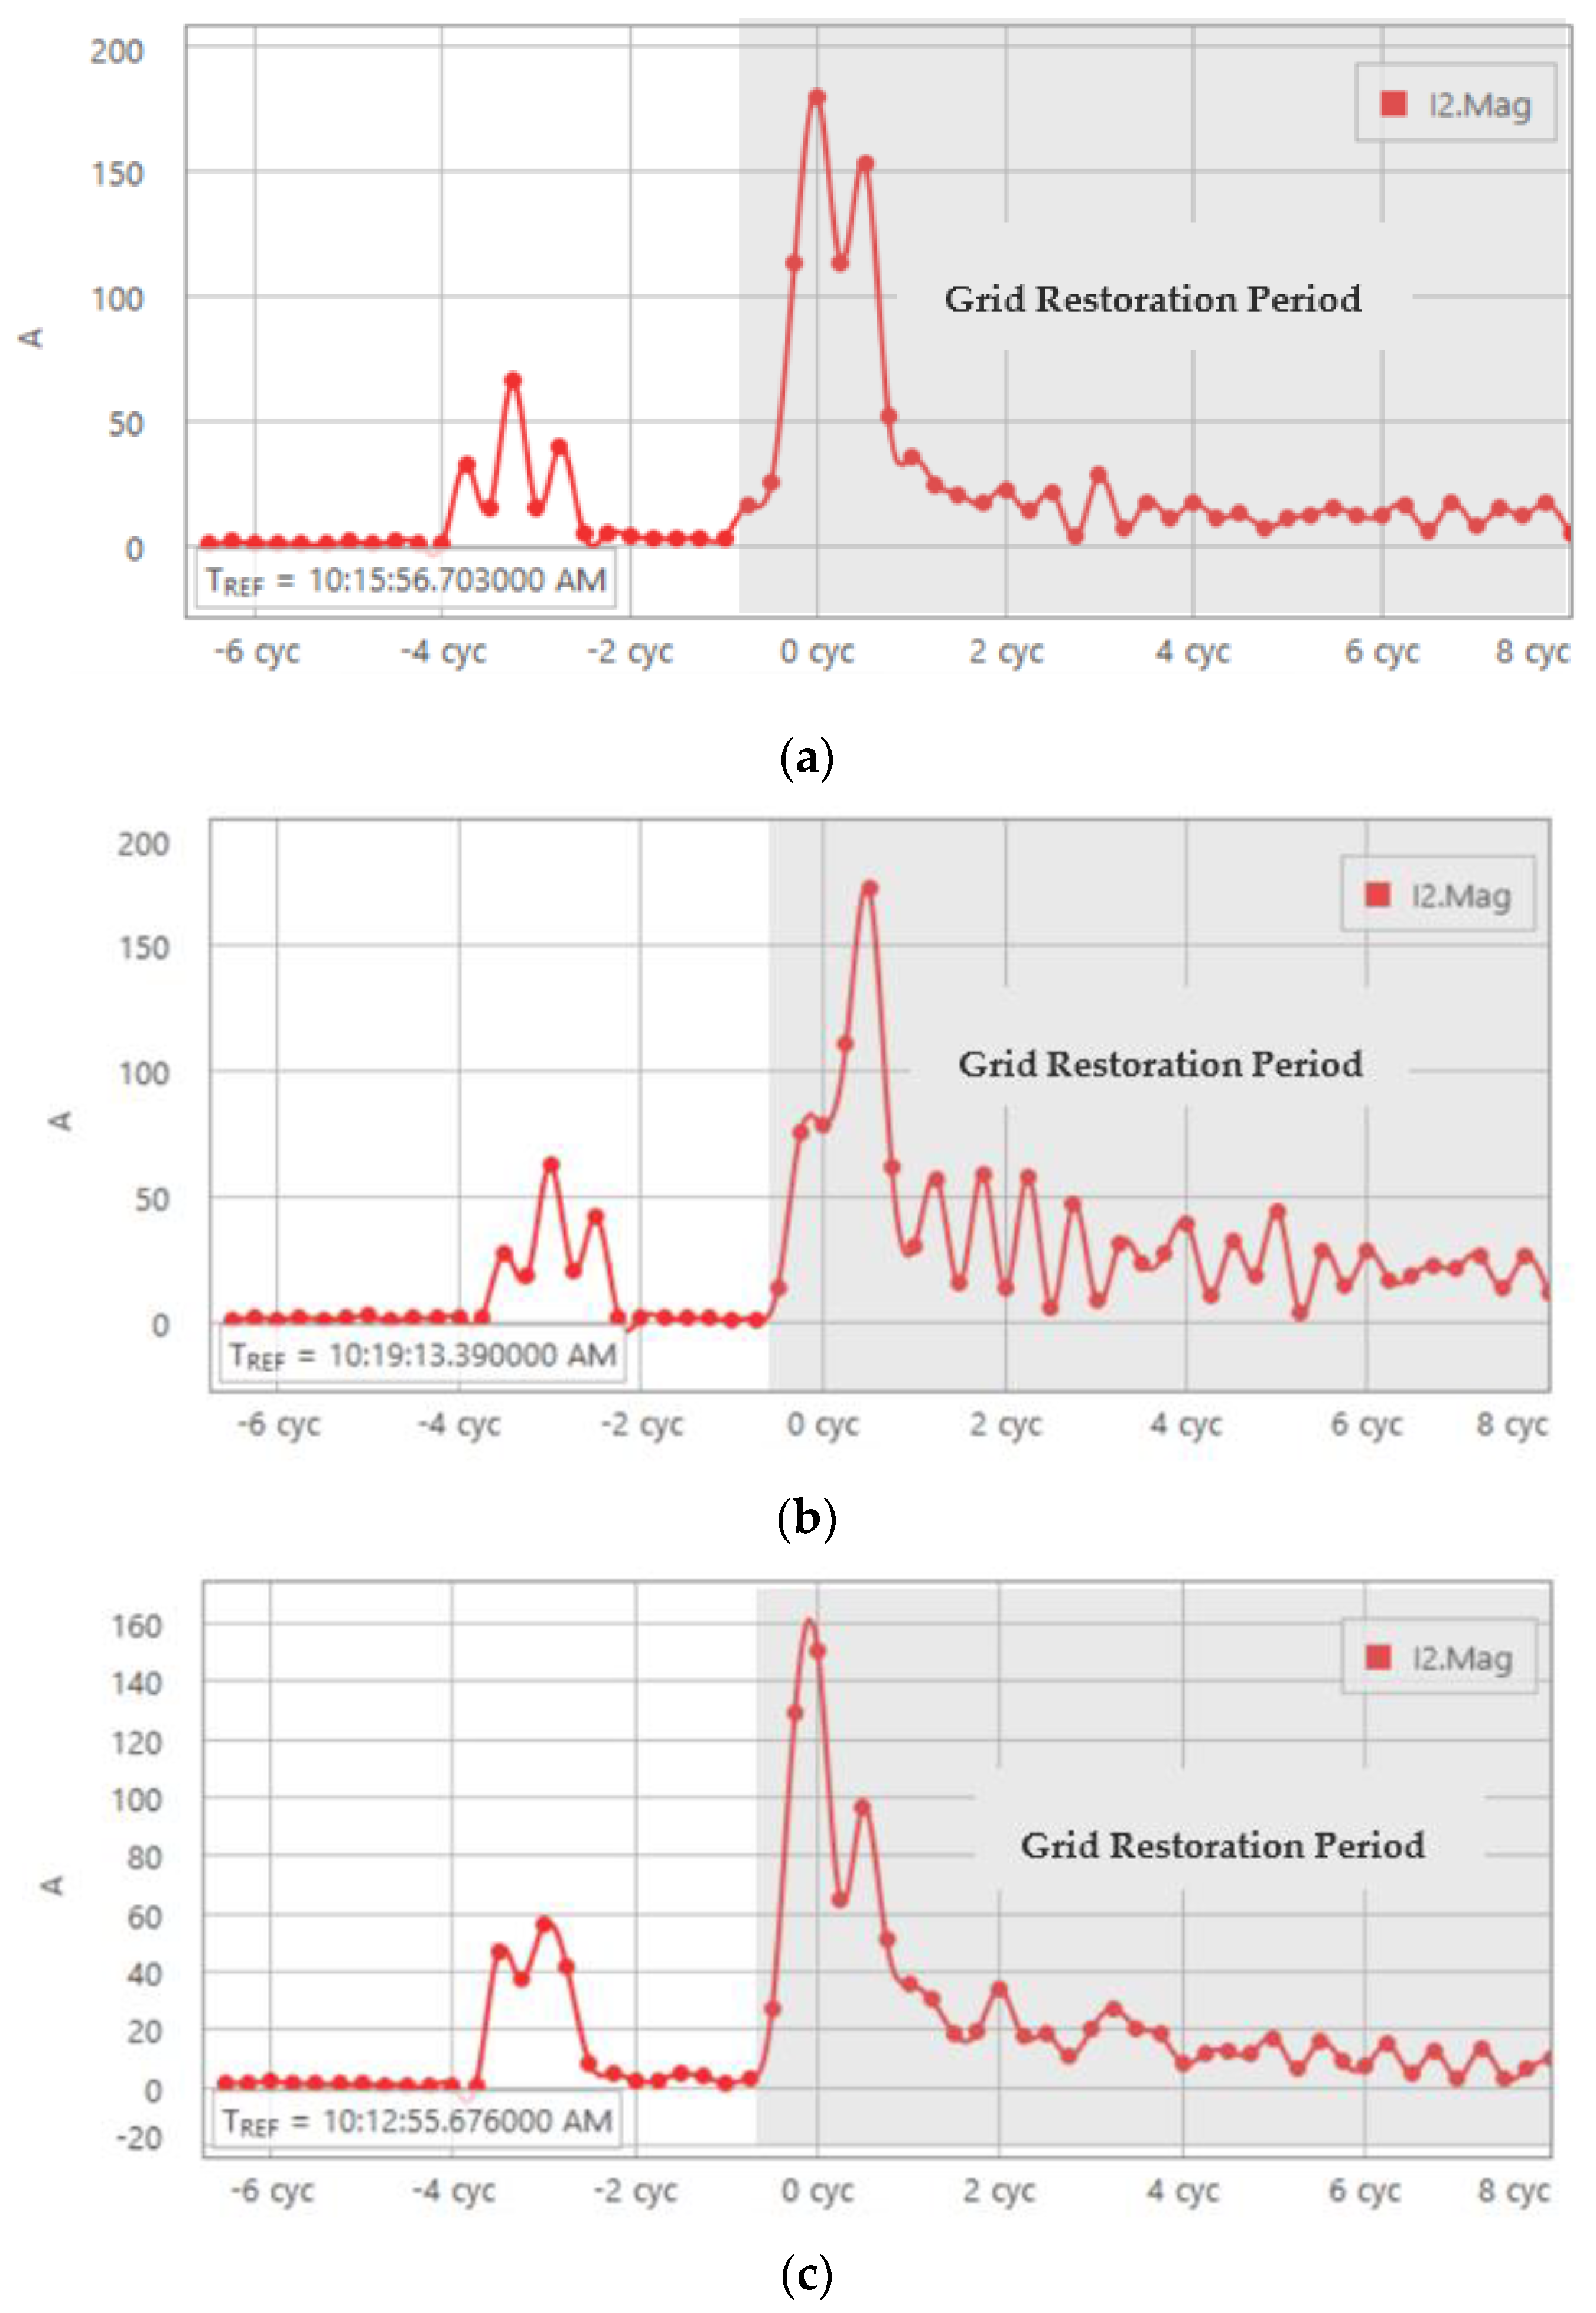
5.2. Impact of Grid Strength

To understand the impact of grid strength on negative-sequence current of solar inverters during the restoration period, we considered a weak grid operating condition in solar PV test system II by increasing the impedance of the transmission line between POC and grid bus to three times larger than the original value. In solar PV test system II under the weak grid condition, the same three-phase fault used in Section 4 was applied to the grid side. Figure 10 shows negative-sequence current measured at POC bus in solar PV system II under the weak grid condition following a three-phase fault.
By comparing Figure 9 with Figure 10, it can be observed that when the grid becomes weak, the peak value of the negative-sequence current magnitude increases during the grid recovery period after reinjecting the current from the solar inverters. As shown in Figure 9, the peak value of the negative-sequence current magnitude stayed at 100 amps, while in Figure 10 the negative-sequence current magnitude peaked at 140 amps. The comparison results imply that an improved grid strength may reduce the severity of the negative-sequence current during the recovery period.

5.3. Impact of Fault Types

Finally, we investigate how different types of faults at the grid side affect the negative-sequence current of solar inverters during the grid restoration period in solar PV test system II under weak grid conditions. To this end, we compared the negative-sequence current induced by the three-phase fault at the grid side (as shown in Figure 10) with those induced by different unbalanced faults, including the single line-to-ground fault, the double line-to-ground fault, and the line-to-line fault. Similar to the implementation of the three-phase fault at the grid side in previous subsections, each of these unbalanced faults was applied to the grid side at t = 6.12 s and was cleared after three cycles. In addition, each of these unbalanced faults will trigger the inverter blocking function to cease the current injection from the inverter; after the fault is cleared, two cycles are delayed to restart the current injection from all inverters. Figure 11a–c show negative-sequence current measured at POC bus in solar PV system II under weak grid condition following different types of unbalanced faults: Figure 11a presents the case where a single line-to-ground fault is applied; Figure 11b presents the case where a double line-to-ground fault is applied; and Figure 11c presents the case where a line-to-line fault is applied. These figures are then compared to Figure 10, which presents the case where a three-phase fault is applied under weak grid conditions.
By comparing Figure 10 with Figure 11a–c, it can be observed that the single line-to-ground fault causes the most severe negative-sequence current during the grid restoration period relative to the other types of faults. As shown in Figure 11a, the single line-to-ground fault caused the negative-sequence current magnitude during the grid restoration period to peak around 180 amps, which is higher than 140 amps induced by the three-phase fault as shown in Figure 10. In Figure 11b, the double line-to-ground fault caused the negative-sequence current magnitude during the grid restoration period to peak around 170 amps while in Figure 11c, 160 amps induced by the line-to-line fault, which are both larger than the three-phase fault as well. The unbalanced faults presented in Figure 11 will naturally have a higher magnitude of negative-sequence current due to their unbalanced nature, especially when compared with balanced fault types like the three-phase fault in Figure 10.

6. Impact of Negative-Sequence Current from Solar Inverters during Grid Restoration Period on Negative-Sequence Quantities-Based Protection Schemes

Section 5 showed the negative-sequence current contribution from solar inverters during the restoration period following grid disturbances. This negative-sequence current is dependent on different operating conditions such as the number of inverters in service, grid strength, and fault types. This section discusses how the negative-sequence current negatively affect the performance of the protective relaying functions that are based on negative-sequence quantities, including instantaneous negative-sequence overcurrent (50Q) [26] and directional negative-sequence overcurrent (67Q) [27]. In addition, this section demonstrates such relay maloperations using a hardware-in-loop simulation platform.

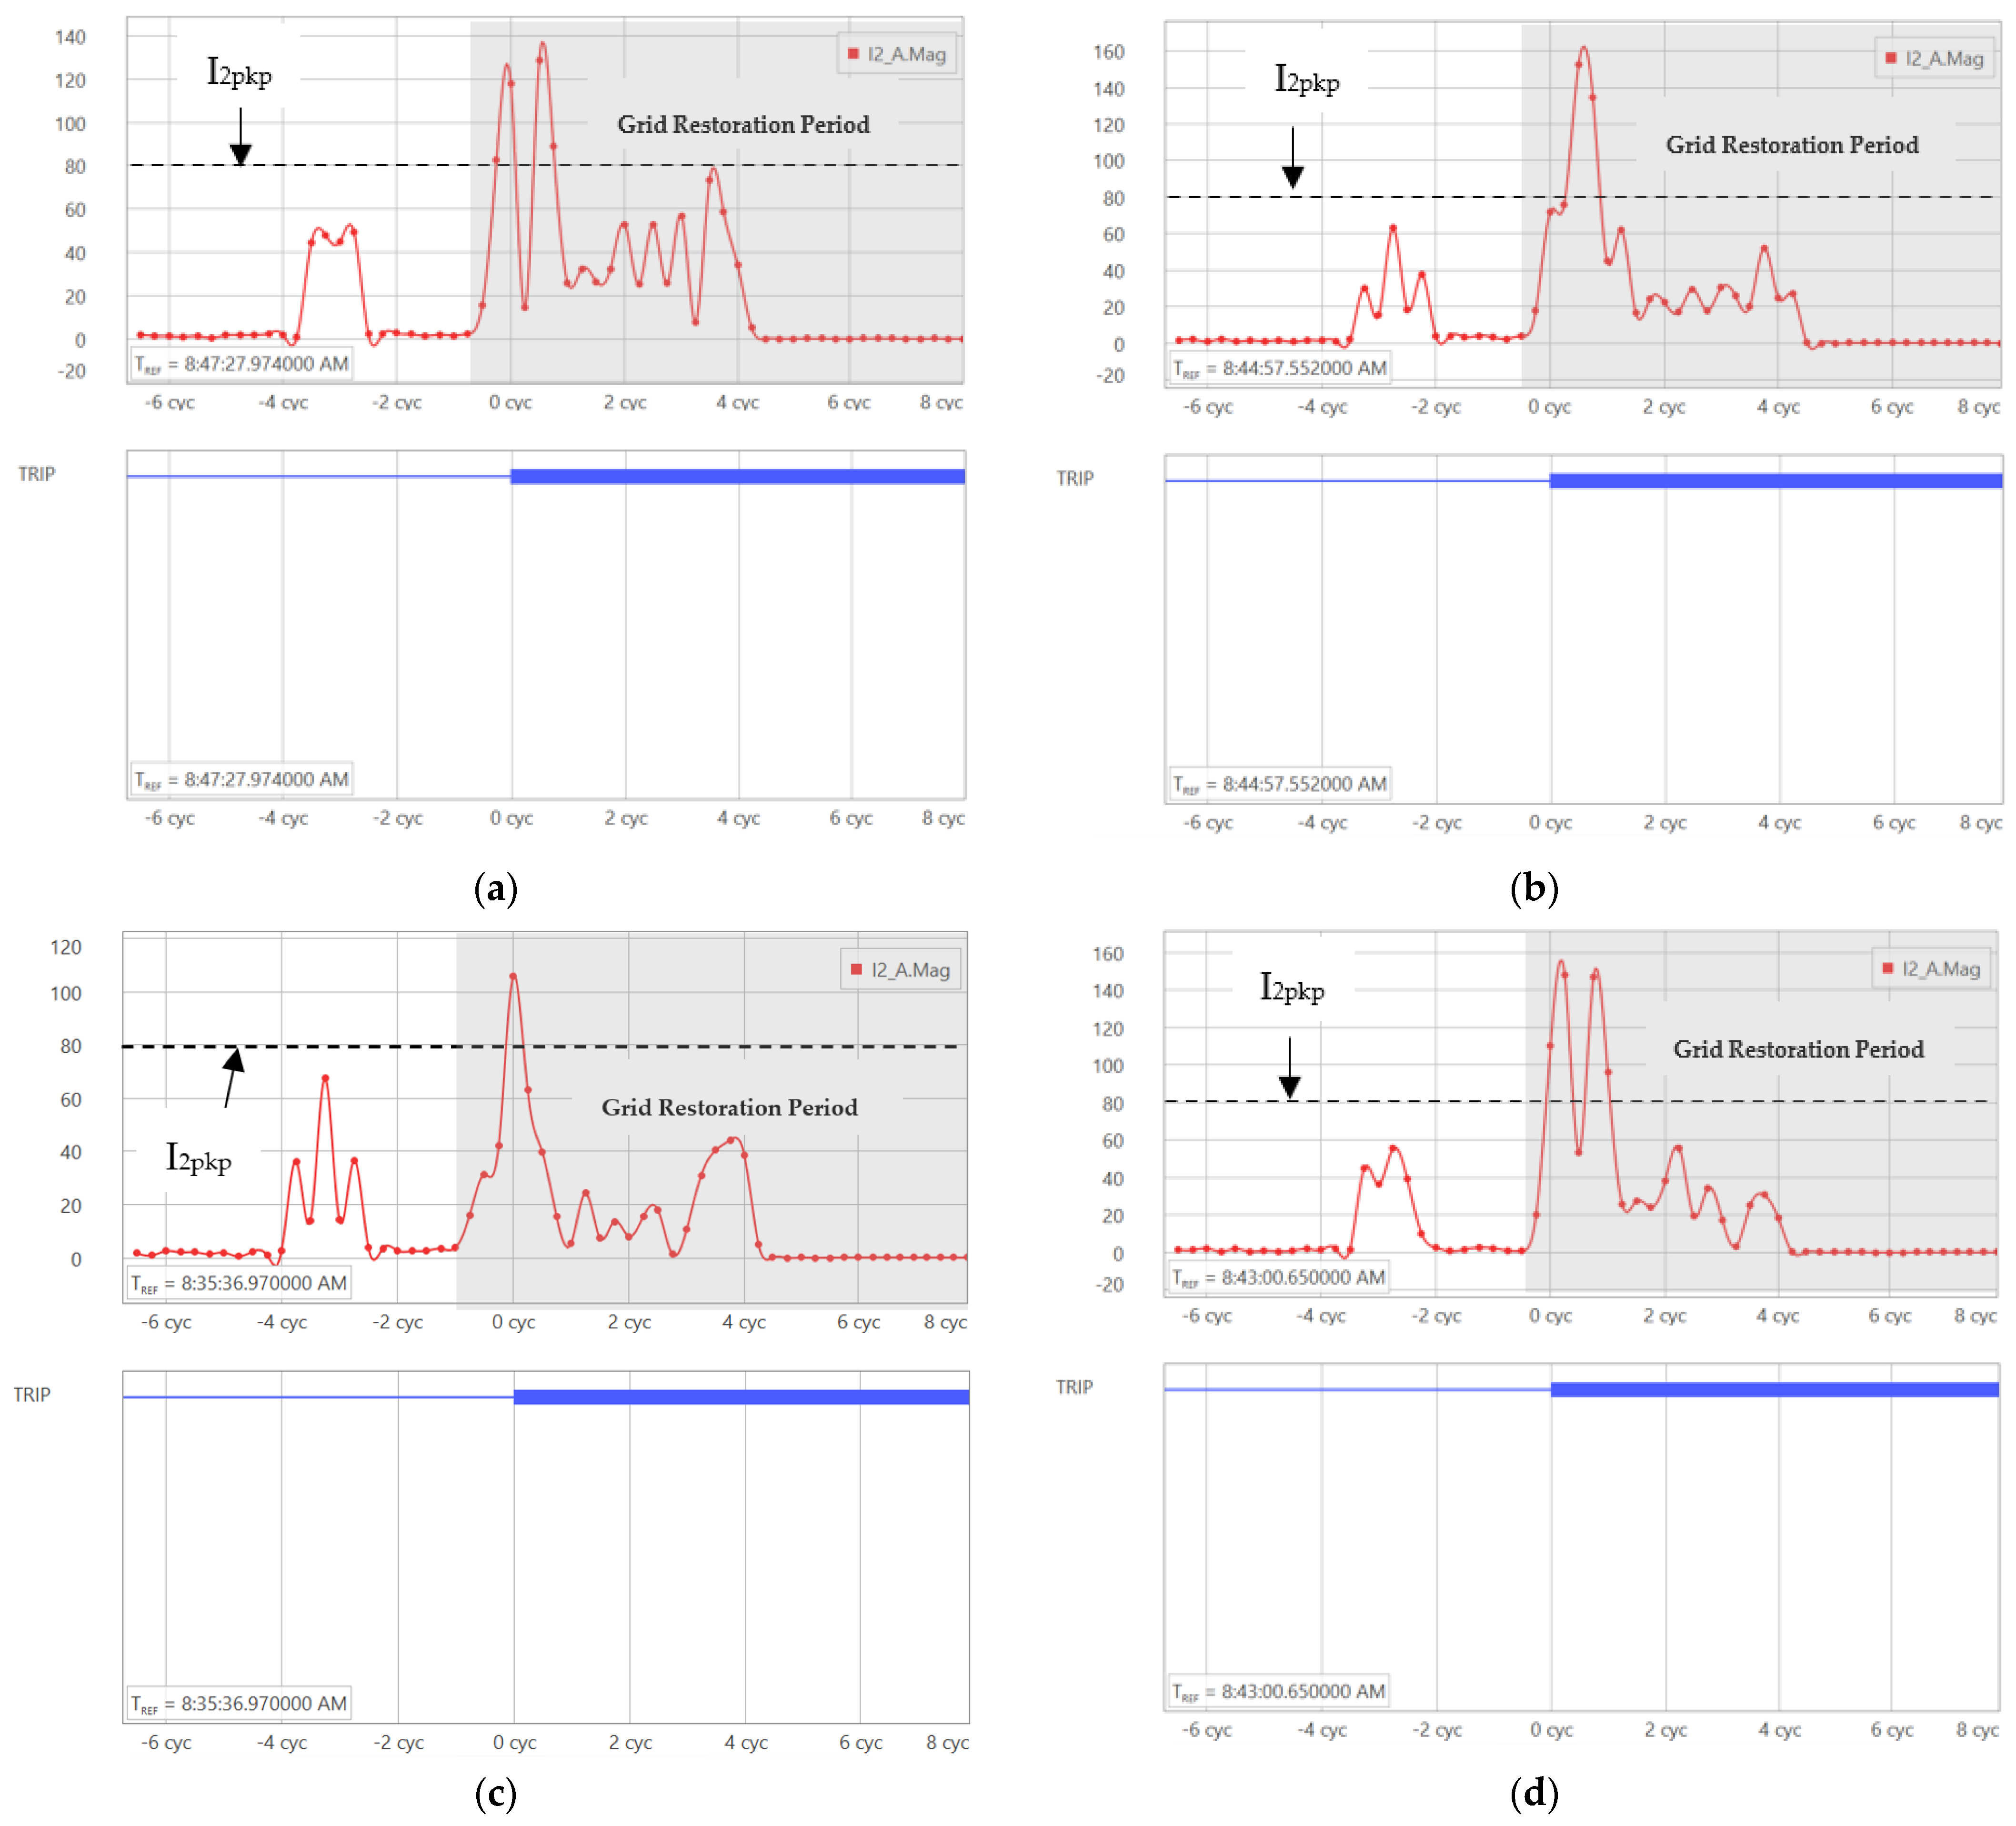
6.1. Maloperation of Instantaneous Negative-Sequence Overcurrent (50Q)

The 50Q element operates when the magnitude of the negative-sequence current exceeds a pre-specified threshold. This threshold is commonly referred to as the pickup setting and specified by the protection engineer based on protection studies. The successful operation of 50Q element relies on the assumption of negative-sequence current being present in substantial levels during a non-symmetrical fault. When the source behind the 50Q element is a synchronous generator, the magnitude of the negative-sequence current is typically large enough to exceed the pickup setting of 50Q element. Therefore, these elements should assert. Nevertheless, due to the high magnitude of the negative-sequence current injection from solar inverters during the grid restoration period, the negative-sequence current may be also larger than the 50Q pickup threshold, and the element may mistakenly operate during the grid restoration period, even after the grid disturbance is cleared.
To illustrate this maloperation, let us consider the response of the 50Q element of the SEL relay on POC bus to different types of faults applied to the grid side in solar PV test system II, as described in Section 3. The faults include the three-phase fault, the single line-to-ground fault, the double line-to-ground fault, and the line-to-line fault. Each of these faults is applied to the grid side at t = 6.12 s and is cleared after three cycles in this test system. Each of these faults will trigger the inverter blocking function to cease the current injection from the inverter; after the fault is cleared, two cycles are delayed to restart the current injection from all inverters. Table A1 in Appendix A presents the settings of 50Q. The negative-sequence pick-up current I2pkp was set at 80 amps, which is roughly 40% of the nominal current. This is a worst-case setting since the industry typically recommends 4–40% of the rated current. The element picks up when it sees a negative-sequence fault current with an amplitude more than the pickup setting of 80 amps.
Figure 12a–d show the amplitude of the negative-sequence current measured by the SEL relay and the 50Q trip signals measured at POC bus in solar PV system II under weak grid conditions following the different types of faults. Figure 12a presents the case where a three-phase fault is applied to the grid, Figure 12b presents the case where a single line-to-ground fault is applied to the grid, Figure 12c presents the case where a double line-to-ground fault is applied to the grid, and Figure 12d presents the case where a line-to-line fault is applied to the grid. As shown in the figures, during the grid restoration period, the peak values of the measured negative-sequence fault currents were 135 amps under the three-phase fault, 165 amps under the single line-to-ground fault, 110 amps under the double line-to-ground fault, and 155 amps under the line-to-line fault, respectively. Under each type of fault, the amplitude of the peak negative-sequence current injected from the solar inverters during the grid restoration period is larger than the negative-sequence pickup current I2pkp, and 50Q element picks up successfully. After the 50Q element picks up, it sends the trip signal from the relay, which is why the negative-sequence current suddenly becomes zero in each of the cases. This example suggests that solar inverters adversely impact the operation of the 50Q element during the grid restoration period, after the fault is cleared at the grid side. Given that 50Q element is commonly used in conjunction with other protective elements such as a fault detector scheme supervising directional negative-sequence elements [26], time overcurrent relays, and distance relays which use negative-sequence current for remote backup protection [28], maloperation of these elements may pose a risk to the reliability of the power system.

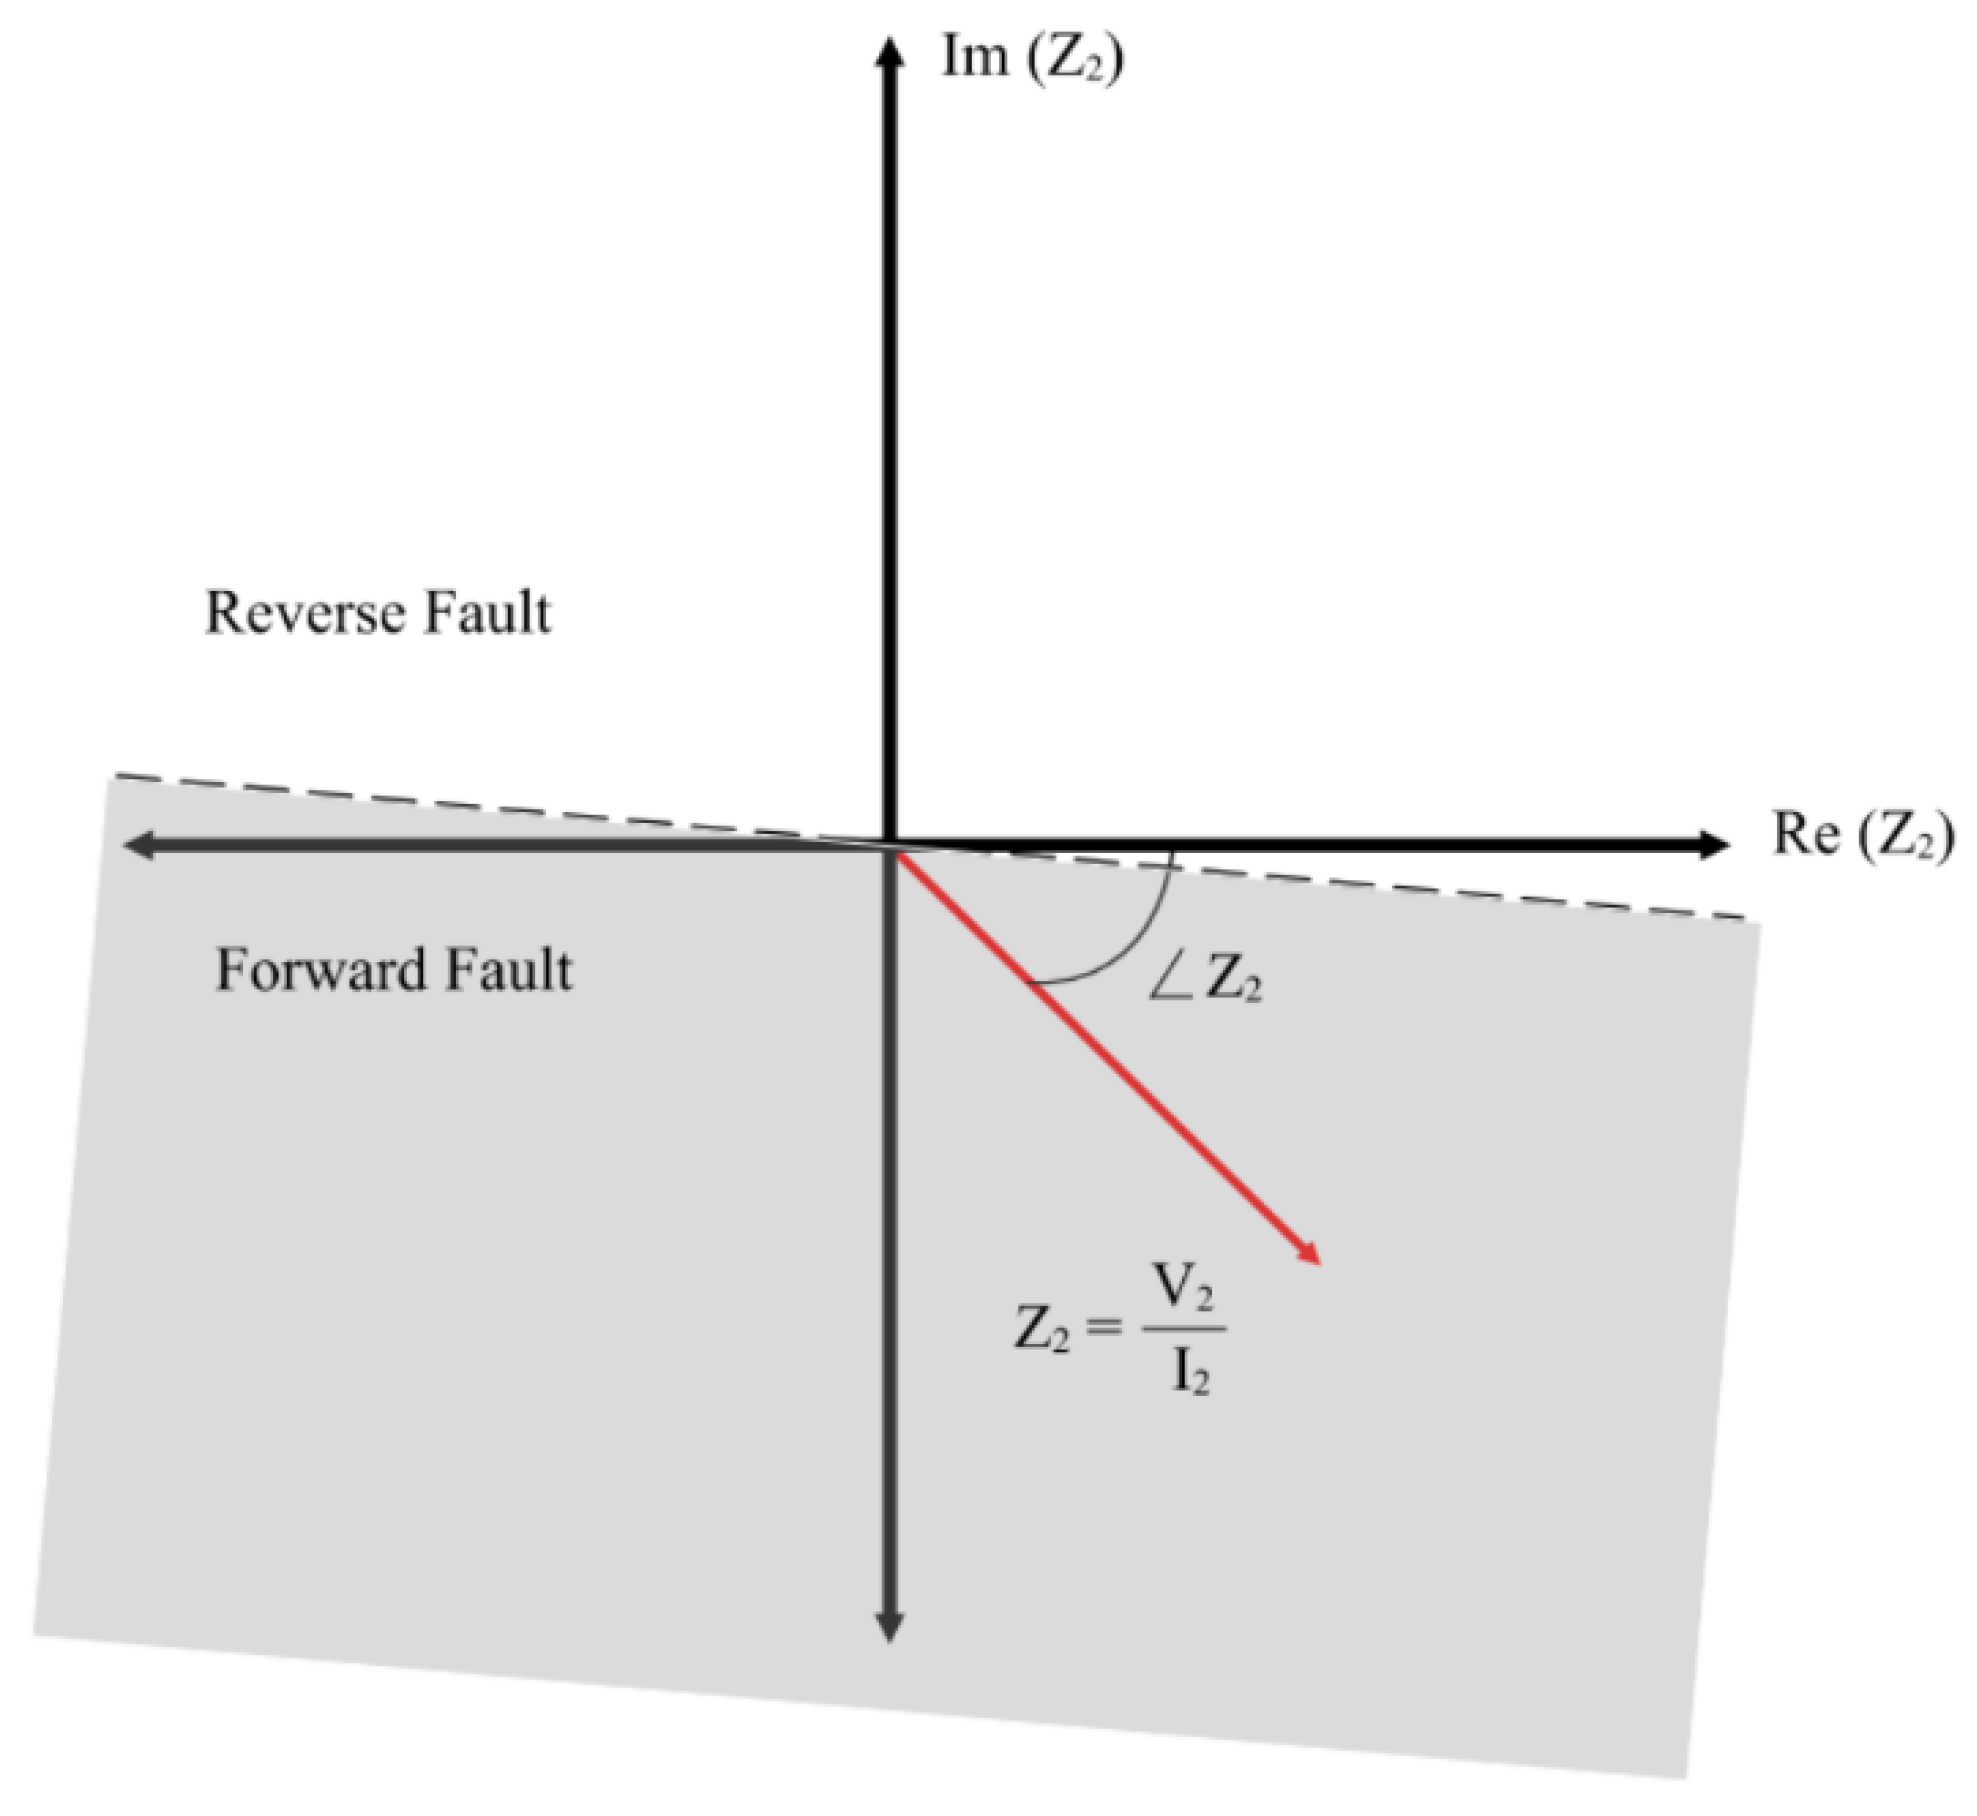
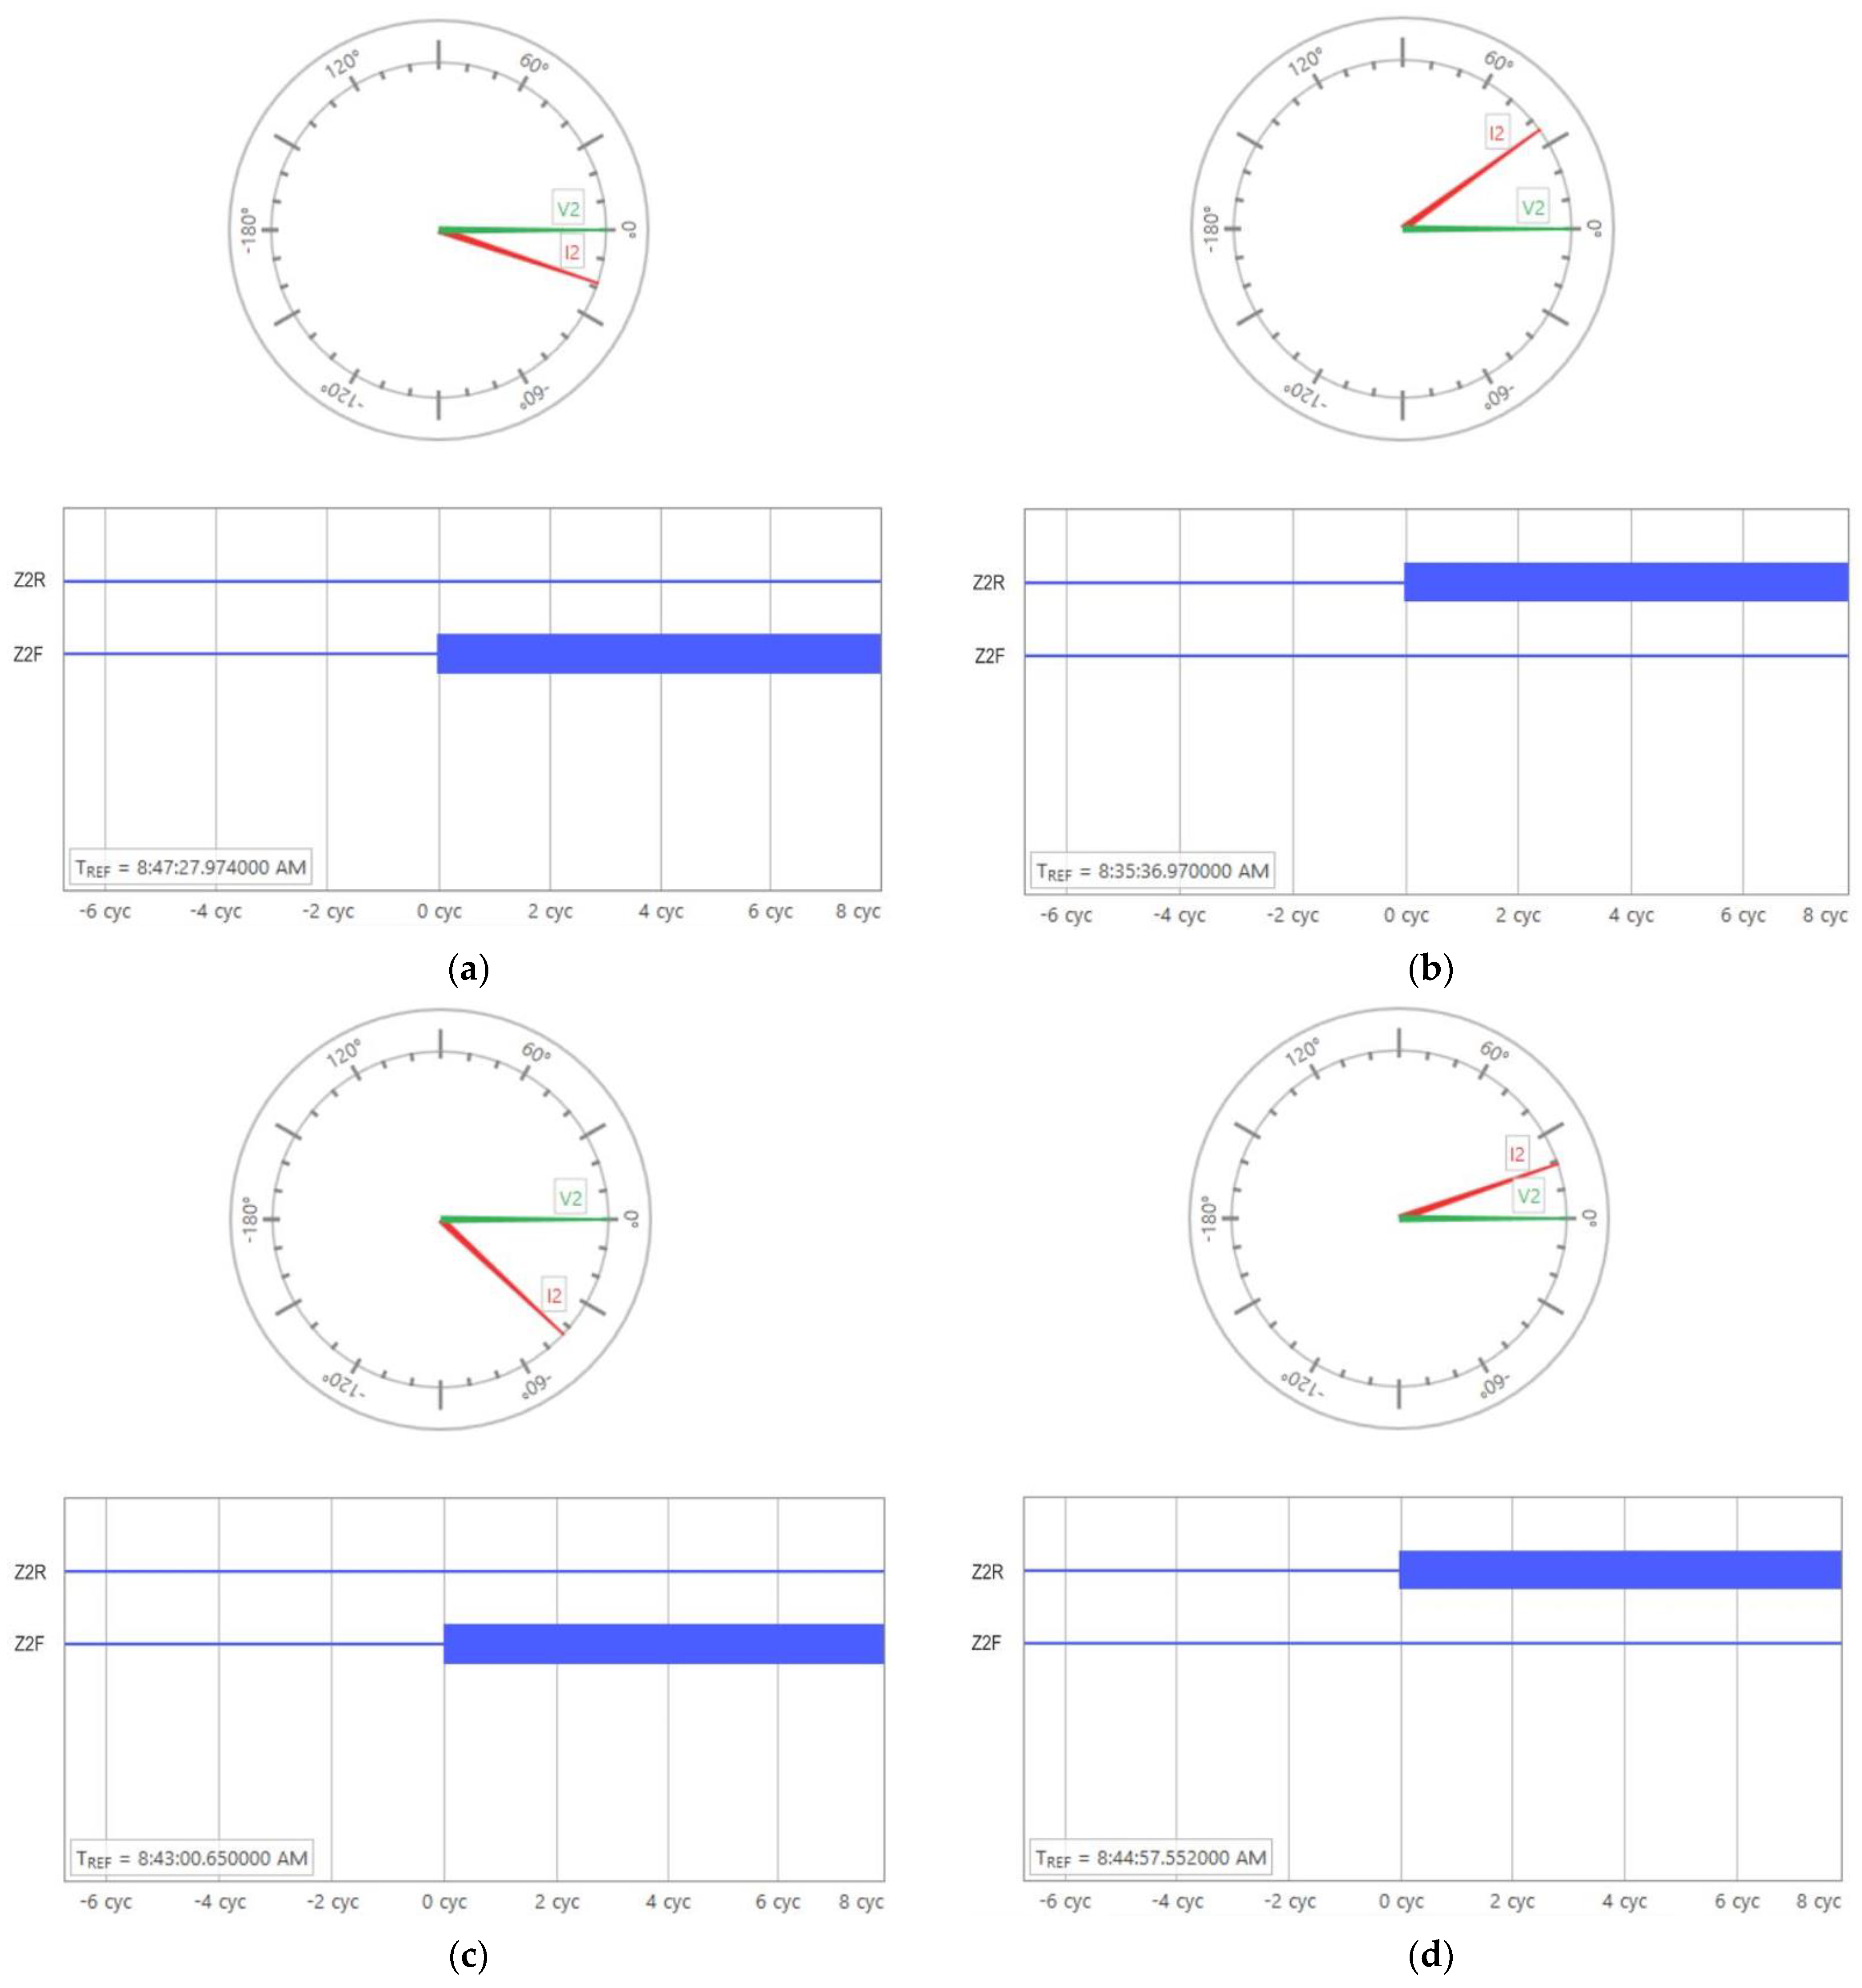
6.2. Maloperation of Directional Negative-Sequence Overcurrent (67Q)

The 67Q element determines the direction of a fault (forward or reverse to the relay) by measuring the phase angle difference between the negative-sequence voltage and current phasors. Figure 13 shows a typical implementation and operating principle of the 67Q element [7]. The concept is that a forward or reverse fault causes a phase angle difference of −90°/90° between the negative-sequence voltage and current phasors. This assumption is based on the highly inductive nature of the negative-sequence network in a synchronous generator-dominated grid. The 67Q element classifies a fault as forward if the measured phase angle of negative-sequence current lags the polarizing negative-sequence voltage between 0 and 180 degrees. The 67Q element classifies a fault as reverse otherwise. This assumption potentially causes the maloperation of the 67Q element under solar inverters during the grid restoration period.
To show this maloperation, let us consider the response of the 67Q element of the relay on POC bus to different types of faults applied to the grid side in solar PV test system II, as described in Section 3. Similar to the previous case, the faults include the three-phase fault, the single line-to-ground fault, the double line-to-ground fault, and the line-to-line fault; each of these faults is applied to the grid side at t = 6.12 s and is cleared after three cycles in the test system. The faults can be considered to be in the reverse direction since they are coming from the grid. Each of these faults will trigger the inverter blocking function to cease the current injection from the inverter; after the fault is cleared, two cycles are delayed to restart the current injection from all inverters. The 67Q element supervises both the phase and the negative-sequence overcurrent elements. There are five settings required to fully implement the negative-sequence impedance directional element. The first two settings are Z2F and Z2R, which are the forward and reverse negative-sequence impedance settings, and they determine the direction of the fault. The next two settings are the forward and reverse fault detectors, which are 50QF and 50QR, and they determine whether a fault has occurred. The final setting is a2, which is the positive-sequence restraint factor, and it supervises the directional element so that it trips only in instances of a fault. Table A1 in Appendix A presents the settings of 67Q.
Figure 14a–d shows the oscillography data of negative-sequence current and voltage phasors and relay trip signal for 67Q element measured at POC bus in solar PV system II under weak-grid conditions following different types of faults at the grid. More specifically, Figure 14a presents the case where a three-phase fault is applied, Figure 14b presents the case where a single line-to-ground fault is applied, Figure 14c presents the case where a double line-to-ground fault is applied, and Figure 14d presents the case where a line-to-line fault is applied. The phase angle is measured after the fault has cleared during the grid restoration period, I2 and V2 stand for the amplitudes of the negative-sequence current and voltage, and Z2F and Z2R represent the forward and reverse direction trip signals, respectively. If the forward and reverse direction signals are activated, the relay detects a fault, sends a trip signal, and thus provides a direction for that fault. For example, as shown in Figure 14a, under the three-phase fault, the relay sees a phase angle difference of approximately 19 degrees with V2 leading I2 and subsequently the relay sends the forward direction trip command. The trip operation is also successful under the other three types of faults as shown in Figure 14b–d, where the apparent V2 lags I2 by about −35 degrees for the single line-to-ground fault, the apparent V2 leads I2 by about 44 degrees for the double line-to-ground fault, and the apparent V2 lags I2 by about −20 degrees for the line-to-line fault. Under each type of these faults, the element mistakenly declares there is a fault, provides a fault direction, and operates this relay during the restoration period, even after the fault at the grid side is cleared.

7. Conclusions

The paper investigated the solar inverter dynamics with a focus on the negative-sequence current during the grid restoration period and their impact on protection schemes by using RTDS-based electromagnetic transient simulations with detailed inverter models that consider switching dynamics and inverter blocking and deblocking modes. It is found that solar inverters can act as negative-sequence sources after the inverter is deblocked to reinject energy into the power grid during the restoration period following a grid disturbance. The amplitude of the negative-sequence current can be affected by different operating conditions such as the number of inverters in service, grid strength, and grid fault types. Such negative-sequence responses can negatively impact the performance of protection schemes based on negative-sequence components and potentially cause relay maloperations in the power grid during the restoration period. Thus, the grid protection will become less secure and reliable. A thorough review of negative-sequence-based protection schemes may be important for the relays with exposure to IBRs to account for their impact during the grid restoration period and ensure dependable and secure protection in the presence of IBRs. In addition, in our future research, we will explore solutions at the grid level and inverter level to reduce the amplitude of the negative-sequence current during the restoration period and thus reduce the risk of relay maloperations in the power grid with high penetration of solar inverters.

Author Contributions

Conceptualization, A.E. and D.W.; methodology, A.E. and D.W.; software, A.E.; validation, A.E.; formal analysis, A.E. and D.W.; investigation, A.E.; resources, D.W.; data curation, A.E.; writing—original draft preparation, A.E. and D.W.; writing—review and editing, A.E., D.W. and J.N.J.; visualization, A.E.; supervision, D.W.; project administration, D.W.; funding acquisition, D.W. All authors have read and agreed to the published version of the manuscript.

Funding

This work is partially supported from National Science Foundation (NSF) EPSCoR RII Track-4 Program under the grant number OIA-2033355. The findings and opinions expressed in this article are those of the authors only and do not necessarily reflect the views of the sponsors.

Institutional Review Board Statement

Not applicable.

Informed Consent Statement

Not applicable.

Data Availability Statement

The data presented in this study are available on request from the corresponding author.

Acknowledgments

We greatly acknowledge the support from John Aultman at SEL, Inc. and Sumek Elimban at RTDS Technologies Inc.

Conflicts of Interest

The authors declare no conflict of interest.

Appendix A

Table A1 presents the settings used for both the 50Q relay element and the 67Q relay element.
Table A1. Relay Settings.
ANSI ElementSettingValue
50Q50Q1P—Instantaneous Negative-sequence pickup current I2pkp80 A
67QZ2F—Forward negative-sequence impedance threshold38 Ω
Z2R—Reverse negative-sequence impedance threshold38.1 Ω
50QF—Forward negative-sequence current threshold0.5 A
50QR—Reverse negative-sequence current threshold0.25 A
a2—Positive-sequence current restraint factor0.07

References

  1. IEEE PES Industry Technical Support Task Force. Impact of Inverter Based Generation on Bulk Power System Dynamics and Short-Circuit Performance; Institute of Electrical and Electronics Engineers: Piscataway, NJ, USA, 2018. [Google Scholar]
  2. UL 1741-SA; Standard for Inverters, Converters, Controllers and Interconnection System Equipment for Use with Distributed Energy Resources. UL: Northbrook, IL, USA, 2016.
  3. Behnke, M.R.; Custer, G.; Farantatos, E.; Fischer, N.; Guttromson, R.; Isaacs, A.; Majumder, R.; Pant, S.; Patel, M.; Reddy-Konala, V.; et al. Impact of Inverter-Based Resource Negative-Sequence Current Injection on Transmission System Protection; Sandia National Laboratories: Albuquerque, NW, USA, 2020.
  4. Kou, G.; Chen, L.; VanSant, P.; Velez-Cedeno, F.; Liu, Y. Fault characteristics of distributed solar generation. IEEE Trans. Power Deliv. 2020, 35, 1062–1064. [Google Scholar] [CrossRef]
  5. Erlich, I.; Neumann, T.; Shewarega, F.; Schegner, P.; Meyer, J. Wind turbine negative sequence current control and its effect on power system protection. In Proceedings of the 2013 IEEE Power & Energy Society General Meeting, Vancouver, BC, Canada, 21–25 July 2013; pp. 1–5. [Google Scholar]
  6. Haddadi, A.; Kocar, I.; Karaagac, U.; Mahseredjian, J. Impact of Renewables on System Protection: Wind/PV Short-Circuit Phasor Model Library and Guidelines for System Protection Studies; EPRI: Palo Alto, CA, USA, 2016. [Google Scholar]
  7. Haddadi, A.; Kocar, I.; Farantatos, E. Impact of Inverter-Based Resources on Protection Schemes Based on Negative Sequence Components; Electric Power Research Institute: Palo Alto, CA, USA, 2019; Available online: https://www.epri.com/research/products/000000003002016197 (accessed on 12 June 2022).
  8. 1200 MW Fault Induced Solar Photovoltaic Resource Interruption Disturbance Report; North American Electric Reliability Corporation: Atlanta, GA, USA, 2016; p. 2.
  9. North American Electric Reliability Corporation. 900 MW Fault Induced Solar Photovoltaic Resource Interruption Disturbance Report: Southern California Event: October 9, 2017 Joint NERC and WECC Staff Report; NERC: Atlanta, GA, USA, 2018. [Google Scholar]
  10. North American Electric Reliability Corporation. April and May 2018 Fault Induced Solar Photovoltaic Resource Interruption Disturbances Report: Southern California Events: 20 April 2018 and 11 May 2018, Joint NERC and WECC Staff Report; NERC: Atlanta, GA, USA, 2019. [Google Scholar]
  11. San Fernando Disturbance Southern California Event: 7 July 2020 Joint NERC and WECC Staff Report; North American Electric Reliability Corporation: Atlanta, GA, USA, 2020.
  12. Kang, S.; Shin, H.; Jang, G.; Lee, B. Impact Analysis of Recovery Ramp Rate After Momentary Cessation in Inverter-based Distributed Generators on Power System Transient Stability. IET Gener. Transm. Distrib. 2020, 15, 24–33. [Google Scholar] [CrossRef]
  13. Pierre, B.J.; Elkhatib, M.E.; Hoke, A. Photovoltaic Inverter Momentary Cessation: Recovery Process is Key. In Proceedings of the 2019 IEEE 46th Photovoltaic Specialists Conference (PVSC), Chicago, IL, USA, 16–21 June 2019. [Google Scholar]
  14. Choi, N.; Park, B.; Cho, H.; Lee, B. Impact of Momentary Cessation Voltage Level in Inverter-Based Resources on Increasing the Short Circuit Current. Sustainability 2019, 11, 1153. [Google Scholar] [CrossRef] [Green Version]
  15. Zhu, S.; Piper, D.; Ramasubramanian, D.; Quint, R.; Isaacs, A.; Bauer, R. Modeling Inverter-Based Resources in Stability Studies. In Proceedings of the 2018 IEEE Power & Energy Society General Meeting (PESGM), Portland, OR, USA, 5–10 August 2018. [Google Scholar]
  16. Shin, H.; Jung, J.; Lee, B. Determining the Capacity Limit of Inverter-Based Distributed Generators in High-Generation Areas Considering Transient and Frequency Stability. IEEE Access 2020, 8, 34071–34079. [Google Scholar] [CrossRef]
  17. Mather, B.; Ding, F. Distribution-connected PV’s response to voltage sags at transmission-scale. In Proceedings of the 2016 IEEE 43rd Photovoltaic Specialists Conference (PVSC), Portland, OR, USA, 5–10 June 2016; pp. 2030–2035. [Google Scholar]
  18. Mather, B.; Aworo, O.; Bravo, R.; Piper, P.E.D. Laboratory Testing of a Utility-Scale PV Inverter’s Operational Response to Grid Disturbances. In Proceedings of the 2018 IEEE Power & Energy Society General Meeting (PESGM), Portland, OR, USA, 5–10 August 2018; pp. 1–5. [Google Scholar]
  19. Kenyon, R.W.; Mather, B.; Hodge, B.-M. Coupled Transmission and Distribution Simulations to Assess Distributed Generation Response to Power System Faults. Electr. Power Syst. Res. 2020, 189, 106746. [Google Scholar] [CrossRef]
  20. Shin, H.; Jung, J.; Oh, S.; Hur, K.; Iba, K.; Lee, B. Evaluating the Influence of Momentary Cessation Mode in Inverter-Based Distributed Generators on Power System Transient Stability. IEEE Trans. Power Syst. 2020, 35, 1618–1626. [Google Scholar] [CrossRef]
  21. Li, C.; Reinmuller, R. Fault Responses of Inverter-based Renewable Generation: On Fault Ride-Through and Momentary Ces-sation. In Proceedings of the 2018 IEEE Power & Energy Society General Meeting (PESGM), Portland, OR, USA, 5–10 August 2018. [Google Scholar]
  22. Pierre, B.J.; Elkhatib, M.E.; Hoke, A. PV Inverter Fault Response Including Momentary Cessation, Frequency-Watt, and Virtual Inertia. In Proceedings of the 2018 IEEE 7th World Conference on Photovoltaic Energy Conversion (WCPEC) (A Joint Conference of 45th IEEE PVSC, 28th PVSEC & 34th EU PVSEC), Waikoloa, HI, USA, 10–15 June 2018. [Google Scholar]
  23. RTDS Technologies Inc. Available online: https://www.rtds.com (accessed on 12 June 2022).
  24. RSCAD—Power System Simulation Software in RTDS; Technologies Inc.: Winnipeg, MB, Canada, 2018.
  25. Elserougi, A.A.; Massoud, A.M.; Abdel-Khalik, A.S.; Ahmed, S. Bidirectional Buck-Boost Inverter-Based HVDC Transmission System With AC-Side Contribution Blocking Capability During DC-Side Faults. IEEE Trans. Power Deliv. 2014, 29, 1249–1261. [Google Scholar] [CrossRef]
  26. Calero, F. Rebirth of Negative-Sequence Quantities in Protective Relaying with Microprocessor-Based Relays; Schweitzer Eng. Labs. Inc.: Delhi, India, 2003. [Google Scholar]
  27. Horak, J. Directional overcurrent relaying (67) concepts. In Proceedings of the 59th Annual Conference Protective Relay Engineers, College Station, TX, USA, 4–6 April 2006; pp. 164–176. [Google Scholar]
  28. Ohura, Y.; Matsuda, T.; Suzuki, M.; Andow, F.; Kurosawa, Y.; Takeuchi, A. A digital distance relay using negative sequence current. IEEE Trans. Power Deliv. 1990, 5, 79–84. [Google Scholar]
Figure 1. Illustration of the hardware-in-loop simulation platform used for testing the relay performance under solar generation.
Energies 15 04360 g001
Figure 2. Solar PV test system I.
Energies 15 04360 g002
Figure 3. Solar PV array with inverter switches.
Energies 15 04360 g003
Figure 4. Inverter control system.
Energies 15 04360 g004
Figure 5. Solar PV test system II.
Energies 15 04360 g005
Figure 6. Negative-sequence current and voltage magnitudes measured at POC bus in the solar PV system I following a three-phase fault.
Energies 15 04360 g006
Figure 7. Negative-sequence current and voltage magnitudes measured at POC bus in the solar PV system I following a three-phase fault when the solar inverter is replaced with a synchronous generator.
Energies 15 04360 g007
Figure 8. (a) Angular difference between the negative-sequence current and voltage for the solar inverter; (b) angular difference between the negative-sequence current and voltage for the synchronous generator.
Energies 15 04360 g008
Figure 9. Negative-sequence current magnitude measured at POC bus in solar PV system II following a three-phase fault.
Energies 15 04360 g009
Figure 10. Negative-sequence current magnitude measured at POC bus in solar PV system II under weak-grid conditions following a three-phase fault.
Energies 15 04360 g010
Figure 11. Negative-sequence current magnitude measured at POC bus in solar PV system II under weak-grid conditions following different types of faults at the grid: (a) single line-to-ground fault; (b) double line-to-ground fault; (c) line-to-line fault.
Energies 15 04360 g011
Figure 12. Negative-sequence current magnitude and relay trip signal for 50Q element measured at the POC bus in solar PV test system II under weak-grid conditions following different types of faults at the grid side: (a) three-phase fault; (b) single line-to-ground fault; (c) double line-to-ground fault; and (d) line-to-line fault.
Energies 15 04360 g012
Figure 13. Basic operating principle of 67Q element.
Energies 15 04360 g013
Figure 14. The oscillography data of negative-sequence current and voltage phasors and relay trip signal for 67Q element measured at the POC bus in solar PV system II under weak grid conditions following different types of faults at the grid: (a) three-phase fault; (b) single line-to-ground fault; (c) double line-to-ground fault; and (d) line-to-line fault.
Energies 15 04360 g014
Table 1. Grid-side parameters under normal conditions.
ComponentsParametersValues
Step-up TransformerHigh Voltage
Low Voltage
Transformer Rating
500 kV
35 kV
200 MVA
Transmission lineShunt reactor rating498 MVAR
Resistance
Inductance
Capacitance
Line Length
3.80 Ω
0.202 H
2.92 µF
226 km
Step-up SubstationTertiary Cap Bank Capacitance138 μF
High Voltage
Low Voltage
Tertiary Voltage
Transformer Rating
500 kV
230 kV
48 kV
1200 MVA
Grid sourceSeries Resistance
Parallel Resistance
Parallel Inductance
0.84 Ω
120.14 Ω
0.0322 H
Voltage (L-L, RMS)
Real Power
Reactive Power
230 kV
1600 MW
73 MVAR
Table 2. Solar PV and inverter parameters.
ComponentsParametersValues
PVNumber of series cells
Number of parallel strings
Open circuit voltage
Short circuit current
Number of modules in series
Number of modules in parallel
Voltage at Pmax
Current at Pmax
36
1
21.7 V
3.35 A
115
285
17.4 V
3.05 A
DC link capacitorCapacitance0.01925 F
InverterSnubber series capacitance
Snubber series resistance
0.01 μF
800 Ω
AC reactor resistance
AC reactor inductance
1 μΩ
80 μH
High pass filterResistance
Capacitance
0.039 Ω
7.874 μF
Publisher’s Note: MDPI stays neutral with regard to jurisdictional claims in published maps and institutional affiliations.

