Article

Effects of Different Exhaust Gas Recirculation (EGR) Rates on Combustion and Emission Characteristics of Biodiesel–Diesel Blended Fuel Based on an Improved Chemical Mechanism

1
School of Mechanical and Automotive Engineering, Guangxi University of Science and Technology, Liuzhou 545006, China
2
Guangxi Key Laboratory of Automobile Components and Vehicle Technology, Liuzhou 545006, China
*
Author to whom correspondence should be addressed.
Energies 2022, 15(11), 4153; https://doi.org/10.3390/en15114153
Submission received: 20 April 2022 / Revised: 14 May 2022 / Accepted: 2 June 2022 / Published: 5 June 2022
(This article belongs to the Special Issue Controlling of Combustion Process in Energy and Power Systems)

Abstract

:
This paper studies the effects of different exhaust gas recirculation (EGR) rates (0%, 5%, 10%, and 15%) on the combustion, performance, and emission characteristics of a biodiesel–diesel (20% biodiesel + 80% diesel) blended fuel engine. This paper mainly analyzes the effects on engine cylinder temperature, cylinder pressure, brake thermal efficiency (BTE), brake-specific fuel consumption (BSFC), NOx emissions, carbon monoxide (CO) emissions, hydrocarbon (HC) emissions, and soot emissions. Firstly, a 3D-CFD model was established by using CONVERGE software, combined with an improved chemical kinetic mechanism including 98 species and 314 reactions, and the accuracy of the simulation model was verified by experimental results. Secondly, the effects of different EGR rates on the combustion, performance, and emission characteristics of biodiesel–diesel blended fuel were studied. The results showed that with the increase in the EGR rate, the cylinder pressure and cylinder temperature in the cylinder decreased. When the EGR rate was 15%, the maximum cylinder temperature decreased by 4.33%. In addition, BSFC increased and BTE decreased. Moreover, with the increase in the EGR rate, NOx decreased significantly, and the higher the EGR rate, the more obvious the reduction in NOx emissions. When the EGR rate was 15%, NOx was reduced by 78.89%. However, with the increase in the EGR rate, the emissions of soot, HC, and CO increased. The optimal EGR rate for the engine is 10%.

1. Introduction

As the main power mechanism of the automobile, agricultural machinery, and engineering machinery, the diesel engine consumes a lot of oil resources. Nitrogen oxides (NOx), particulate matter (PM), and other pollutants emitted from diesel engines are one of the main causes of haze formation [1]. Therefore, in order to improve resource shortage and environmental degradation, specified emission regulations at home and abroad are becoming more and more strict, and it is increasingly important to find a clean and efficient alternative engine fuel [2]. Biomass fuels such as biodiesel and alcohols can effectively reduce pollutant emissions and have excellent renewability, and they have become the focus of scholars.
Biodiesel is a fuel extracted from vegetable oil, waste animal fat, and waste restaurant fat. It has become a cleaner alternative fuel to fill the demand gap caused by the depletion of petrochemical diesel fuel [3]. Compared with traditional diesel fuel, biodiesel can reach complete combustion due to oxygen enrichment so as to effectively reduce the particulate matter, carbon monoxide (CO), and unburned hydrocarbon (HC) emissions of diesel engines [4]. In addition, biodiesel has attracted extensive attention due to its low sulfur content, high cetane number, good lubricity, low-temperature start-up, lack of aromatic hydrocarbons, and renewable characteristics [5,6]. Moreover, in practical application, the diesel engine can be blended with diesel without modification, and the high lightning is also conducive to safe storage and transportation [7]. Zhang et al. [8] studied the effect of biodiesel–diesel fuel on engine combustion and emission characteristics. The results showed that compared with diesel, biodiesel could significantly reduce the emissions of CO, HC, and soot. However, with the increase in the biodiesel blending ratio, NOx emissions increased. Díaz Domínguez et al. [9] studied the engine combustion, performance, and emission characteristics of a direct injection four-stroke single-cylinder diesel engine fueled with Moringa oleifera biodiesel blend (B10). The experimental results showed that compared with diesel, the combustion of B10 started earlier and the ignition delay was shorter. Biswas et al. [10] investigated the effect of biodiesel–ethanol fuel at different injection angles on engine friction performance, stability, and emissions. The results demonstrated that the maximum exergy efficiency using biodiesel–ethanol blends at different injection angles was 48.79% and 45.19% higher than that of biodiesel and diesel, respectively. In addition, the soot, NOx, and HC emissions were reduced by 12.1%, 12.15, and 12.90% compared with biodiesel. In addition, compared with diesel, the soot, NOx, and HC emissions were reduced by 256.70%, 87%, and 9.67%, respectively. Yan et al. [11] studied the combustion, emission, and performance characteristics of diesel engine fueled with different percentages of waste frying oil biodiesel (20%, 50%, and 100%) blended with diesel. The test results showed that BSFC was improved by 12.98%. In terms of emissions, CO2, HC, and NOx increased slightly with pure waste frying oil biodiesel. However, when waste frying oil biodiesel accounted for 20%, almost all emissions were reduced, especially NOx and soot emissions.
However, there is a trade-off between soot and NOx in diesel engine emissions, and it is very difficult to reduce these two emissions at the same time [12]. Although some progress has been made in diesel engine after-treatment technology, it will take some time for this technology to be put into practice. Burning a biodiesel–diesel mixture can reduce soot emissions, but NOx emissions will increase [13]. Compared with pure diesel, a biodiesel–diesel engine has some defects. A special technical method is needed to improve thermal efficiency and significantly reduce emissions to meet the current strict regulations. Exhaust gas recirculation (EGR) technology is a commonly used method at present. It is a simple and effective method in the NOx emission reduction scheme [14]. Mourad et al. [15] studied the effect of heating biodiesel as fuel combined with EGR on the performance and emissions of a diesel engine. The results showed that the performance of the engine was slightly improved, and the pollutants emitted by the engine fueled with biodiesel were significantly less, especially NOx emissions. The reduction rate at 25% EGR was 22.2%. Li et al. [16] studied the performance and emission characteristics of biodiesel and polyoxyethylene dimethyl ether mixture in a single-cylinder diesel engine at different loads. The experimental results showed that the use of EGR rates of 20% and 40% and the addition of 15% polyoxymethylene dimethyl ether could significantly reduce the NOx and soot emissions of the engine. Can et al. [17] studied the effects of the EGR rate (5%, 10%, and 15%) on engine performance and emissions using 20% soybean biodiesel mixed with diesel. The results showed that the combination of biodiesel and EGR could increase the maximum heat release rate and cylinder pressure. In addition, under high engine load and 15% EGR conditions, the reasonable increase in brake specific fuel consumption (BSFC) and the maximum reduction in brake thermal efficiency (BTE) were 6% and 3%, respectively, and the NOx and soot emissions were significantly improved by 55% and 15%, respectively. Shi et al. [18] studied the comprehensive effects of the combustion and emissions of a four-cylinder direct injection diesel engine at different loads and EGR rates. The results showed that with the increase in the EGR rate, the engine emissions, especially NOx and soot emissions, could be significantly reduced. Mat Yasin et al. [19] studied the application effect of palm biodiesel and different EGRs on the combustion and emission characteristics of a direct injection diesel engine. They found that when palm biodiesel and EGR increased, engine torque, engine power, and NOx emissions decreased, while fuel consumption, CO, PM, and carbon dioxide (CO2) emissions increased.
Computational fluid dynamics (CFD) combined with chemical kinetics can accurately simulate the spray and combustion in engine cylinders and predict the emissions, thus shortening the development cycle of the engine. Compared with traditional technology, CFD simulation technology can save costs and shorten the cycle. It can accurately simulate the actual working state of the product in the virtual environment based on the data in the whole product life cycle and modify the product parameters to optimize the product. At present, commonly used 3D-CFD software mainly includes CONVERGE, Fluent, AVL-Fire, etc. Zhang et al. studied the effects of diesel/methanol/n-butanol blended fuel and diesel/ethanol/n-butanol blended fuel on engine combustion, performance, and emission characteristics using CONVERGE software [20] and AVL-Fire software [21], respectively, and combined them with a detailed chemical kinetic model. Sathyamurty et al. [22] studied the performance and emission characteristics when mixing different proportions of corn oil methyl ester with pure diesel in the engine. The results showed that the mixed combustion of 10% corn oil methyl ester and pure diesel had the least effect on the thermal efficiency and BSFC of the engine, but it could greatly reduce the emissions of CO and HC. Yang et al. [23] studied the combustion and emission characteristics of rapeseed oil and petrochemical diesel using a CFD model and analyzed the effect of reducing NOx emissions when introducing 20%-30% EGR. CONVERGE software can automatically generate regular hexahedral mesh and provide various mesh control strategies, such as adaptive encryption. Thus, CONVERGE software was selected for in-cylinder analysis in this study.
As mentioned above, biodiesel–diesel blended fuel has a significant effect on improving engine emissions. It is very interesting to investigate the effect of different EGR rates on engine combustion and emission characteristics with the CONVERGE software combined with an improved kinetic mechanism. Therefore, a 3D-CFD model was established by coupling the CONVERGE software with the detailed chemical kinetic mechanism of biodiesel and was verified with experimental results. Therefore, this paper has significant advantages for optimizing the engine combustion process and reducing pollutant emissions. In addition, this study can provide a reference and data basis for the follow-up engine EGR control strategy and provides a certain theoretical reference for the realization of pollutant emissions.

2. Numerical Approaches

2.1. D-CFD Calculation

The primary conservation equations are mainly composed of the mass conservation equation, the energy conservation equation, and the gas state equation, which are the most important equations in engine modeling.

2.1.1. Mass Conservation Equation

Mass conservation means that the change in mass of the control body is equal to the difference between the inflow mass and the outflow mass, and the equation is as follows:
d m c d θ = d m i d θ d m a d θ d m b d θ + d m e d t
where mc is the total mass of the material in the cylinder, kg; θ is the crankshaft angle, deg; mi and me are the mass of the gas and fuel flowing into th+++e cylinder, kg; ma and mb are the mass of the gas flowing into and out of the cylinder, kg; and t is the time, s.

2.1.2. Energy Conservation Equation

The conservation of energy equation is as follows:
d ( m c u ) d θ = p c d V d θ + d Q F d θ d Q w d θ h c d m b d θ + d m i d θ h i d m a d θ h a q e f d m e d t
where u is the specific internal energy in the cylinder, J/kg; pc is the pressure in the cylinder, Pa; V is the working volume, cm3; QF is the fuel heat release, J; Qw is the heat loss, J; ha is the specific enthalpy of outflow gas, J/kg; hb is the specific enthalpy of leakage gas, J/kg; hi is the specific enthalpy of inflow gas, J/kg; qe is the latent heat of evaporation of fuel, J; and f is the mass fraction of evaporated fuel, %.

2.1.3. Ideal Gas Equation of State

The gas state is calculated using the ideal gas equation of state when performing 3D simulations [24], and the gas equation of state is as follows:
p c = 1 v m c R c T c
where Rc is the gas constant, J/(K⋅kg); Tc is the cylinder body temperature, K.

2.1.4. Component Transport Equation

The engine operation process is accompanied by the exchange of gases, consumption of fuel components, and production of combustion products. For the whole system, the component transport equation is as follows:
ρ m t + p m u i x i = x i ( ρ D Y i x i ) + S m
Y m = N m N t t = ρ m ρ t t
where ρ is the fluid density, kg/m3; u is the velocity vector, m/s; D is the mass diffusion coefficient, m2/s; Yi is the mass fraction of m components, %; and Sm represents the generation rate of the component m per unit time, kg/s. Nm is the mass of the micro-element control body component m, kg; Ntt is the total mass of the micro-element control body component, kg.

2.2. Spraying Model

Parameters such as injection pattern, orifice parameters, and injection ambient pressure all affect the fuel injection [25]. Fuel injection is a complex process, for which the Frossling model was chosen as the evaporation model, the dynamic drop drag model was chosen as the gas drag model, and the KH-RT model [26] was chosen as the crushing model. The computational equations of KH-RT are as follows:
R A = C a Λ
τ = 3.7 C 1 r A Λ Ω
Λ = 9.02 r A ( 1 + 0.45 O H 0.5 ) ( 1 + 0.4 T K H 0.7 ) ( 1 + 0.865 W e 1.67 ) 0.6
Ω = 0.34 + 0.38 W e 1.5 ( 1 + O a ) ( 1 + 0.4 T K H 0.6 ) σ ρ l r A 3
where RA is the initial radius, m; Ca and C1 are the injector constants; Λ is the wavelength, m; Ω is the wave height index; τ is the oil beam presence time, s; rA is the droplet radius, m; We is the Weber number of the continuous phase; Oa is the Anseger number of the droplet; σ is the surface tension, dynes⋅cm−2; TKH is the Taylor number; and ρl is the density of the liquid, kg/m3.

2.3. Turbulence Model

There is a complex gas flow in a marine engine cylinder with high turbulence intensity. In this paper, the in-cylinder flow field was simulated by the RNG k-ε turbulence model [27]. The following equations calculate the turbulent kinetic energy k and turbulent dissipation rate ε.
ρ k t + ( ρ u i k ) x i = τ i j u i x i + x j ( μ e Pr k k x j ) ρ ε + S a
ρ ε t + ( ρ u i ε ) x i = x j ( μ e Pr ε k x j ) C ε a ρ ε u i x i        + ( C ε b u i x j τ i j C S a ρ ε + ε C s S a ) ε k + S ρ R
where µe is the effective viscosity, Pa⋅s; Prk is the Prandtl number in the k equation; Prε is the Prandtl number in the ε equation; τij is Reynolds stress, Pa; Sa represents the source item; and Cεa, Cεb, Sa, and Cs are empirical constants.

2.4. Combustion Model

The combustion model in CONVERGE software contains many physical models of specific combustion conditions. In terms of chemical coupling kinetics, the SAGE model is more accurate. In this paper, the SAGE model was employed to simulate the combustion process of biodiesel [28]. The specific multi-step reaction is shown as follows:
n = 1 N v n , r x n n = 1 N v n , r x n ( r = 1 , 2 , R )
ω · = r = 1 R v n , r q r ( n = 1 , 2 , N )
v n , r v n , r = v n , r
q r = k f r Π n = 1 N [ X n ] v n , r k r r Π n = 1 N [ X n ] v n , r
where N is the total number of substances; v n , r and v n , r are the stoichiometric coefficients of the reactants and products of component n and reaction r, respectively; R is the total number of reactions; xn is the chemical symbol of component n; kfr and krr are the forward and reverse reaction rate coefficients for reaction r; and [Xn] is the molar concentration of substance n.

2.5. Heat Transfer Models

Heat transfer occurs at every moment during the engine operation [29]. The O’Rourke and Amsden model [30] can better simulate the engine heat transfer process in CONVERGE software and is employed to calculate the heat transfer. The calculation formula of the heat exchange model is as follows:
k d T d x i = { μ c p ( T b T a ) n i y Pr t     y + < 11.05 ρ c p μ τ T b I n ( T b T a ) n i 2.1 I n ( y + ) + 2.513    y + > 11.05
where Prt is the molecular Prandtl number; k is the molecular conductivity coefficient; Ta is the fluid temperature, K; Tb is the wall temperature, K; μτ is the shear velocity, μm/s; and y+ is the dimensionless distance.

2.6. Emission Calculation Model

Diesel fuel is mechanically affected by the combustion process to generate NOx, which is mainly divided into high-temperature NOx, fuel NOx, and transient NOx [31]. In the combustion process, nitrogen molecules are oxidized to NOx. Since there are many atoms involved in the reaction and the reaction equation is complex, the Extended Zeldovich NOx model [32] model was chosen for this paper.
O 2 2 O
O 2 + N O + NO
N 2 + O N + NO
N + OH NO + H

2.7. Boundary Conditions

The boundary conditions in the CONVERGE model were based on a four-cylinder, four-stroke marine medium-speed diesel engine. The initial cylinder temperature, piston head temperature, cylinder wall temperature, cylinder head temperature, and initial cylinder pressure were 335.15 K, 625.15 K, 403.15 K, 553.15 K, and 1.93 MPa, respectively. The main boundary conditions and specifications are shown in Table 1.

2.8. Computational Grid

The dynamic grid of the 3D combustion chamber model was based on the symmetrical distribution of the engine’s cylinders through eight injector holes, and one injector hole was selected to generate a 45° fan-shaped dynamic mesh. Generally, finer grids in CONVERGE are more accurate in predicting droplet fragmentation and evaporation [33]. Figure 1 shows the cylinder pressure profiles with grid numbers of 1 mm, 2 mm, and 4 mm at 100% load. When the piston runs to the upper stop, the grid numbers of three grids are 463,250, 375,500, and 286,300. In this paper, grid encryption was performed near the injector nozzle, piston gap area, and cylinder wall to ensure the accuracy of the precision model. It can be found from the figure that there is no obvious difference between the cylinder pressure curves of the 2 mm grid and 1 mm grid. Because the 2 mm grid could ensure accuracy and save about 50% of the calculation time, the 2 mm grid was selected for the model simulation in this paper.

2.9. Feasibility Test

This paper studies the effects of diesel/RME blended fuel on engine combustion, performance, and emission characteristics under different loads and EGR conditions. The schematic diagram of the experimental device is shown in Figure 2. The engine power was measured by a Xiang Yi eddy current dynamometer [34,35]. In addition, the corresponding sensors were also used to measure pressure, temperature, and flow. The measurement range and error range of each instrument are shown in Table 2.

2.10. Fuel Properties

In this study, 20% RME and 80% diesel fuel were selected to study the effects of different proportions of EGR on a marine engine, where R20 represents 20% RME blended with 80% diesel fuel. E0, E5, E10, E15, and E20 represent EGR proportions of 0%, 5%, 10%, 15%, and 20%, respectively. RME was obtained by the transesterification reaction of rapeseed oil with methanol. Specifically, the molar ratio of methanol to oil is 6:1, and 1% wt/wt KOH was added as the basic catalyst. Then, rapeseed oil was transesterified in the reactor for about 1 h under the catalysis of alkali to obtain RME [36]. As shown in Table 3, the kinematic viscosity and low calorific value of the fuel were measured according to ASTM D445 and ASTMD240. The latent heat of the blended fuels was calculated by the following equation.
H = W a H a + W b H b
where H, Ha, and Hb are the latent heat of vaporization of the blended fuels, rapeseed oil, and diesel fuel, KJ/kg; Wa and Wb represent the proportion of biodiesel and diesel in the fuel blend.

2.11. Model Validation

The model’s accuracy should be verified before the 3D-CFD model is simulated. As shown in Figure 3 and Figure 4, the cylinder pressure and HRR comparisons between experimental and simulation results were performed at 100%, 50%, and 25% load. It can be found that the experimental and predicted in-cylinder pressure and ignition process are within 5% error, and the model is consistent. In addition, Figure 5 shows the experimental and simulated NOx emission trend under 100%, 50%, and 25% load conditions. It can be found that the trend of the simulation is similar to that of the experiment. Therefore, the fuel combustion process and 3D-CFD model can be well predicted.

3. Results and Discussion

3.1. Combustion Characteristics

3.1.1. Cylinder Pressure

Figure 6a–c shows the cylinder pressure curves at different EGR rates. The peak cylinder pressure of pure diesel fuel was higher than that of biodiesel–diesel blends at all loads. When the diesel engine was running on biodiesel–diesel blends, cylinder pressure decreased continuously with increasing EGR rate. For example, the cylinder pressure was highest when the EGR rate was 0%, followed by 5%, 10%, and 15% EGR. This is because the increase in the EGR rate makes the exhaust gas in the cylinder increase. When the oxygen concentration decreases, the combustion in the cylinder of the diesel engine deteriorates. Thus, the cylinder temperature in the cylinder increases, and the stall period and combustion duration increase. For example, at 100% load, the cylinder pressure was the highest at EGR = 0%, and when the EGR rate was increased to 5%, 10%, and 15%, the cylinder pressure was reduced by 2.3%, 2.65%, and 4.33%, respectively. Similarly, the cylinder pressure was the highest when the diesel engine was fueled with pure diesel. This is due to the high low calorific value. In addition, the lower cylinder temperature and oxygen concentration are not conducive to fuel evaporation atomization and combustion, resulting in a decrease in peak cylinder pressure with an increase in EGR. Can et al. [17] found a similar trend.

3.1.2. Cylinder Temperature

Figure 7a–c shows the cylinder temperature curves at different EGR rates. It can be seen that pure diesel fuel had a higher peak cylinder temperature compared to biodiesel–diesel blends. When the diesel engine was fueled with a biodiesel–diesel blend, the cylinder temperature continued to decrease as the EGR rate increased. For example, at 50% load, the cylinder temperature was highest at EGR = 0%, and when the EGR rate was increased to 5%, 10%, and 15%, the cylinder temperature was reduced by 2.0%, 2.45%, and 4.33%, respectively. This is because with increasing EGR rates, more exhaust gas is introduced into the cylinder, and the specific heat capacity of the gas increases, which in turn leads to a decrease in cylinder temperature. Similarly, the cylinder temperature is the highest when the diesel engine is fueled with pure diesel. This is due to the high low calorific value. Furthermore, the increase in the EGR rate reduces the oxygen concentration in the cylinder, leading to deterioration in combustion and thus decreasing cylinder temperature. Duan et al. [37] found a similar trend.
Figure 8 shows the temperature field distribution of the cylinder. As the EGR rate continued to increase, the localized high-temperature areas in the cylinder gradually decreased. This is due to the increasing EGR rates. The total specific heat capacity of the fuel increased with increased EGR rates in the cylinder. In addition, the oxygen concentration in the cylinder decreased, which is not conducive to fuel combustion, resulting in a lower combustion temperature in the cylinder.

3.2. Performance Characteristics

3.2.1. Brake-Specific Fuel Consumption

Figure 9 shows the effect of the EGR rate on engine BSFC at different loads. It can be found that the BSFC of pure diesel fuel was lower than that of the biodiesel–diesel blends. In addition, when burning biodiesel–diesel blends, the BSFC of the diesel engines grew with increasing EGR rates. For example, at 100% load, when the EGR rate was increased to 5%, 10%, and 15%, the fuel consumption of the engine was improved by 0.74%, 1.49%, and 2.23%, respectively, compared with EGR = 0%. This is because as the EGR rate increases, the oxygen concentration in the cylinder decreases, and local oxygen deficiency increases. The fresh air is not sufficient to support the effective combustion of fuel in the cylinder, resulting in increased fuel consumption. A similar trend was found in a study by Sun et al. [38].

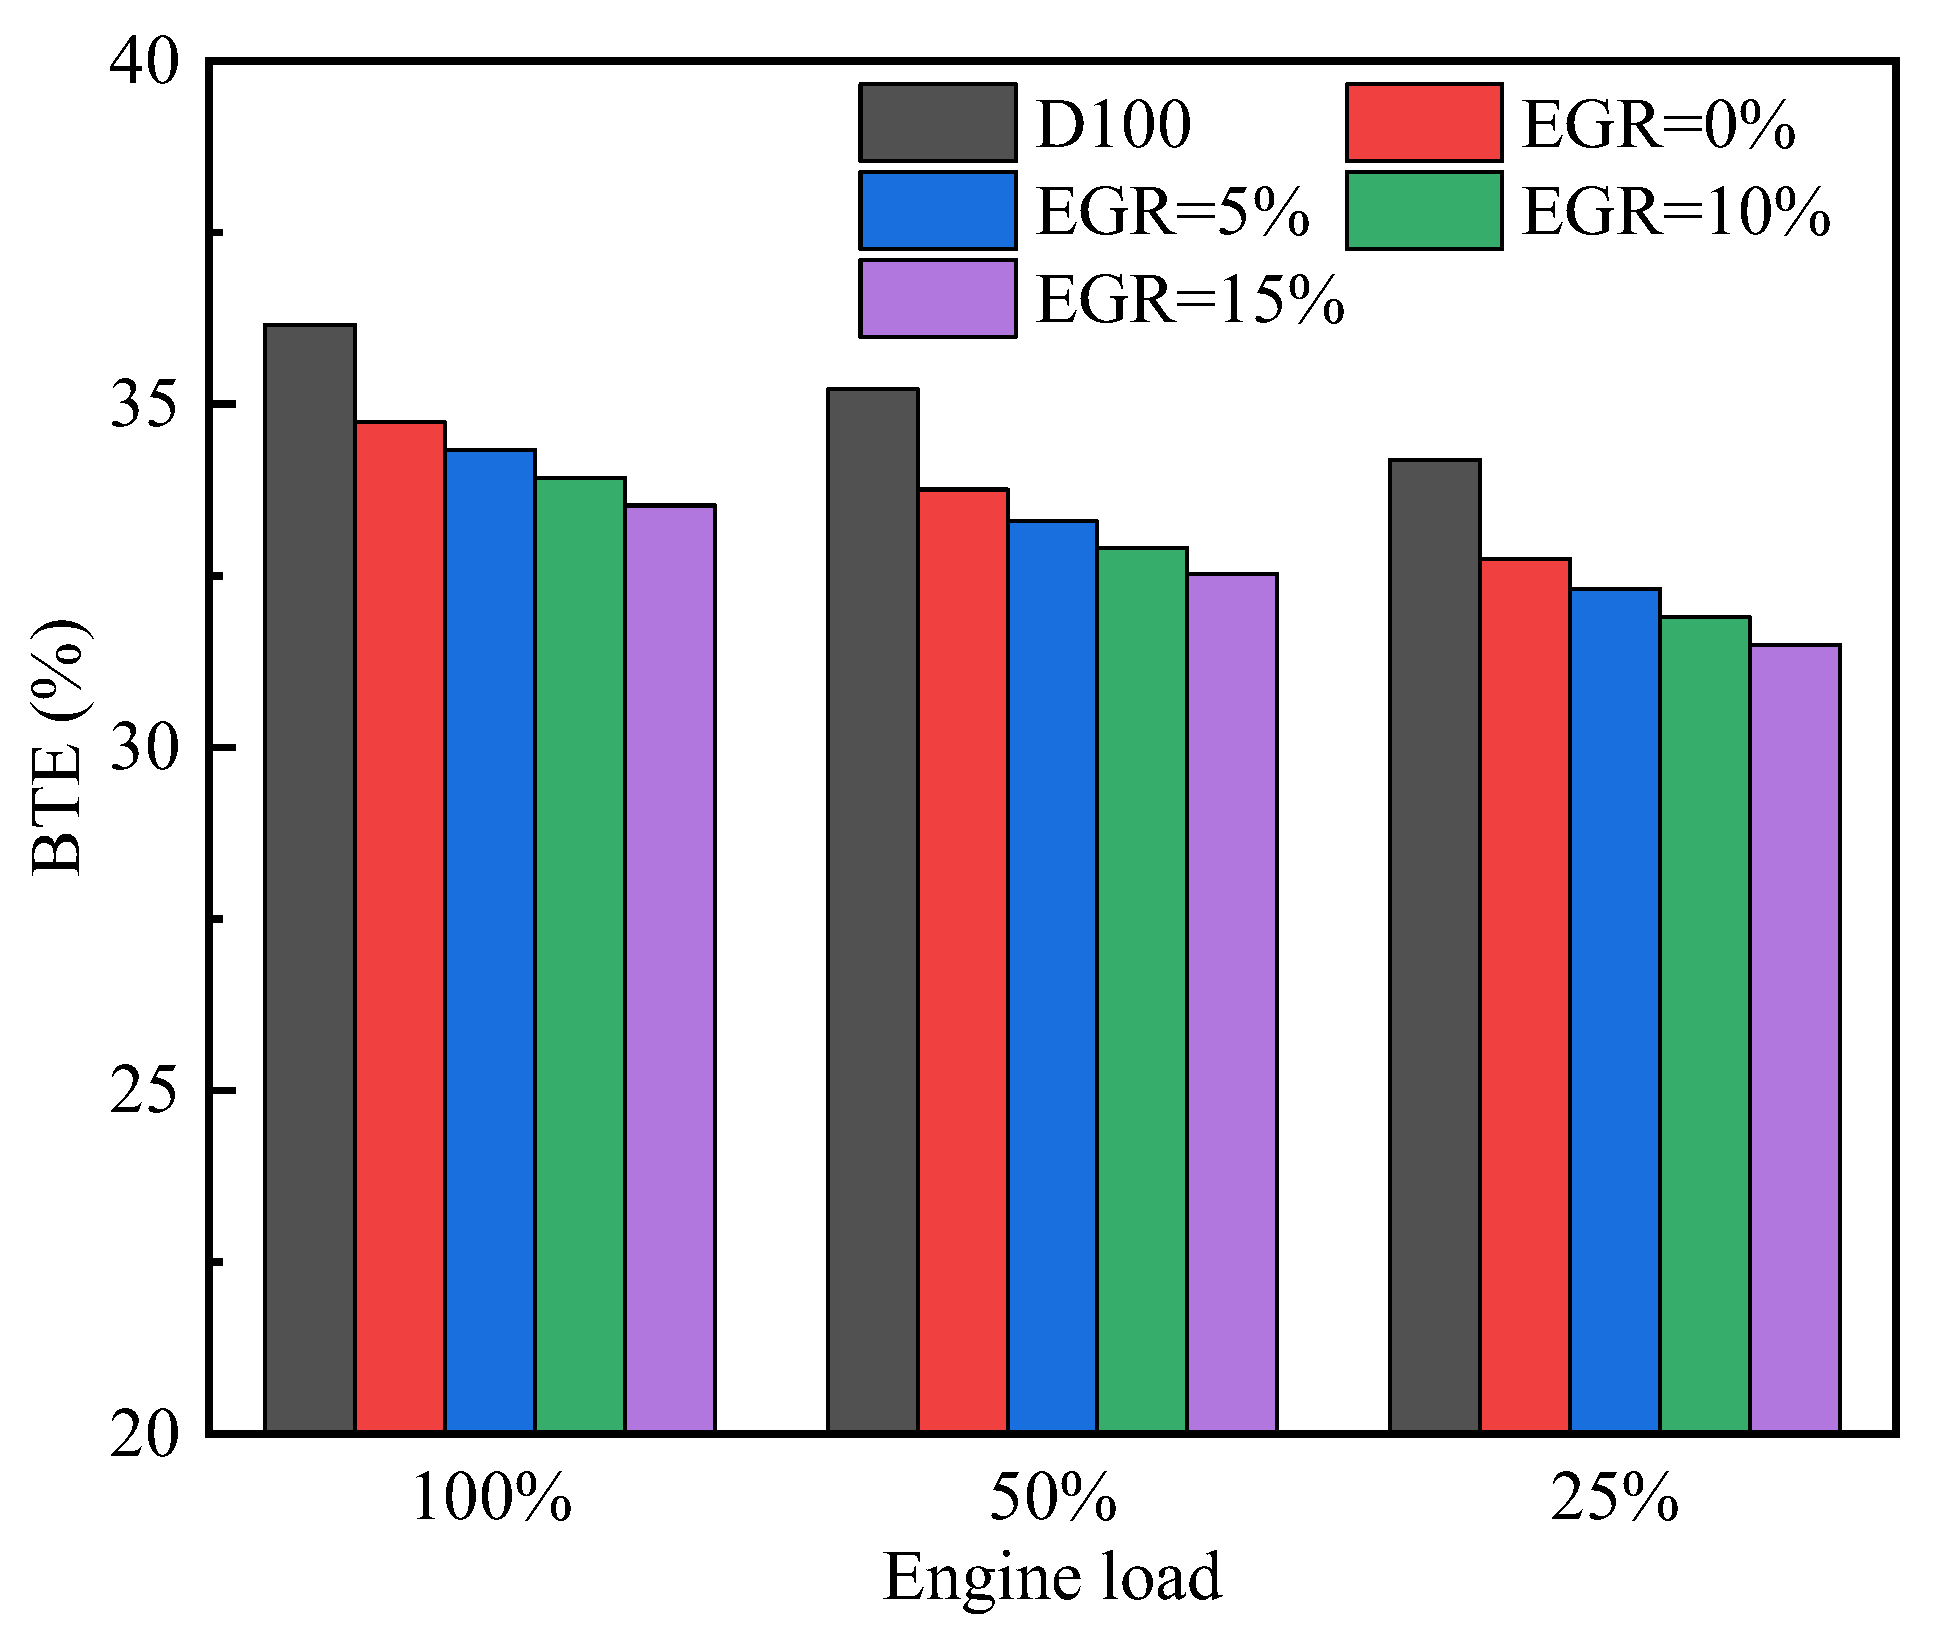
3.2.2. Brake Thermal Efficiency

The brake thermal efficiency (BTE) is the key index to measure the economy index of the engine. The lower the BSFC, the better the economy. Figure 10 shows the effect of the EGR rate on engine BTE. The BTE was highest when the diesel engine was fueled with pure diesel fuel. In addition, the BTE decreased continuously as the EGR rate increased. More specifically, the BTE was the highest at a 0% EGR rate, followed by 5%, 10%, and 15%. For example, at 100% load, when the EGR rate was increased to 5%, 10%, and 15%, the BTE of the engine was improved by 0.76%, 1.54%, and 2.43%, respectively, compared with EGR = 0%. This is because the cylinder temperature and O2 concentration decrease as the EGR rate increases. Thus, it results in the deterioration of combustion. In addition, the increase in the EGR rate increases the combustion duration and reduces the combustion reaction rate, thus reducing the thermal efficiency. A similar trend was found in a study by Devarajan et al. [39].

3.3. Emission Characteristics

3.3.1. NOx Emissions
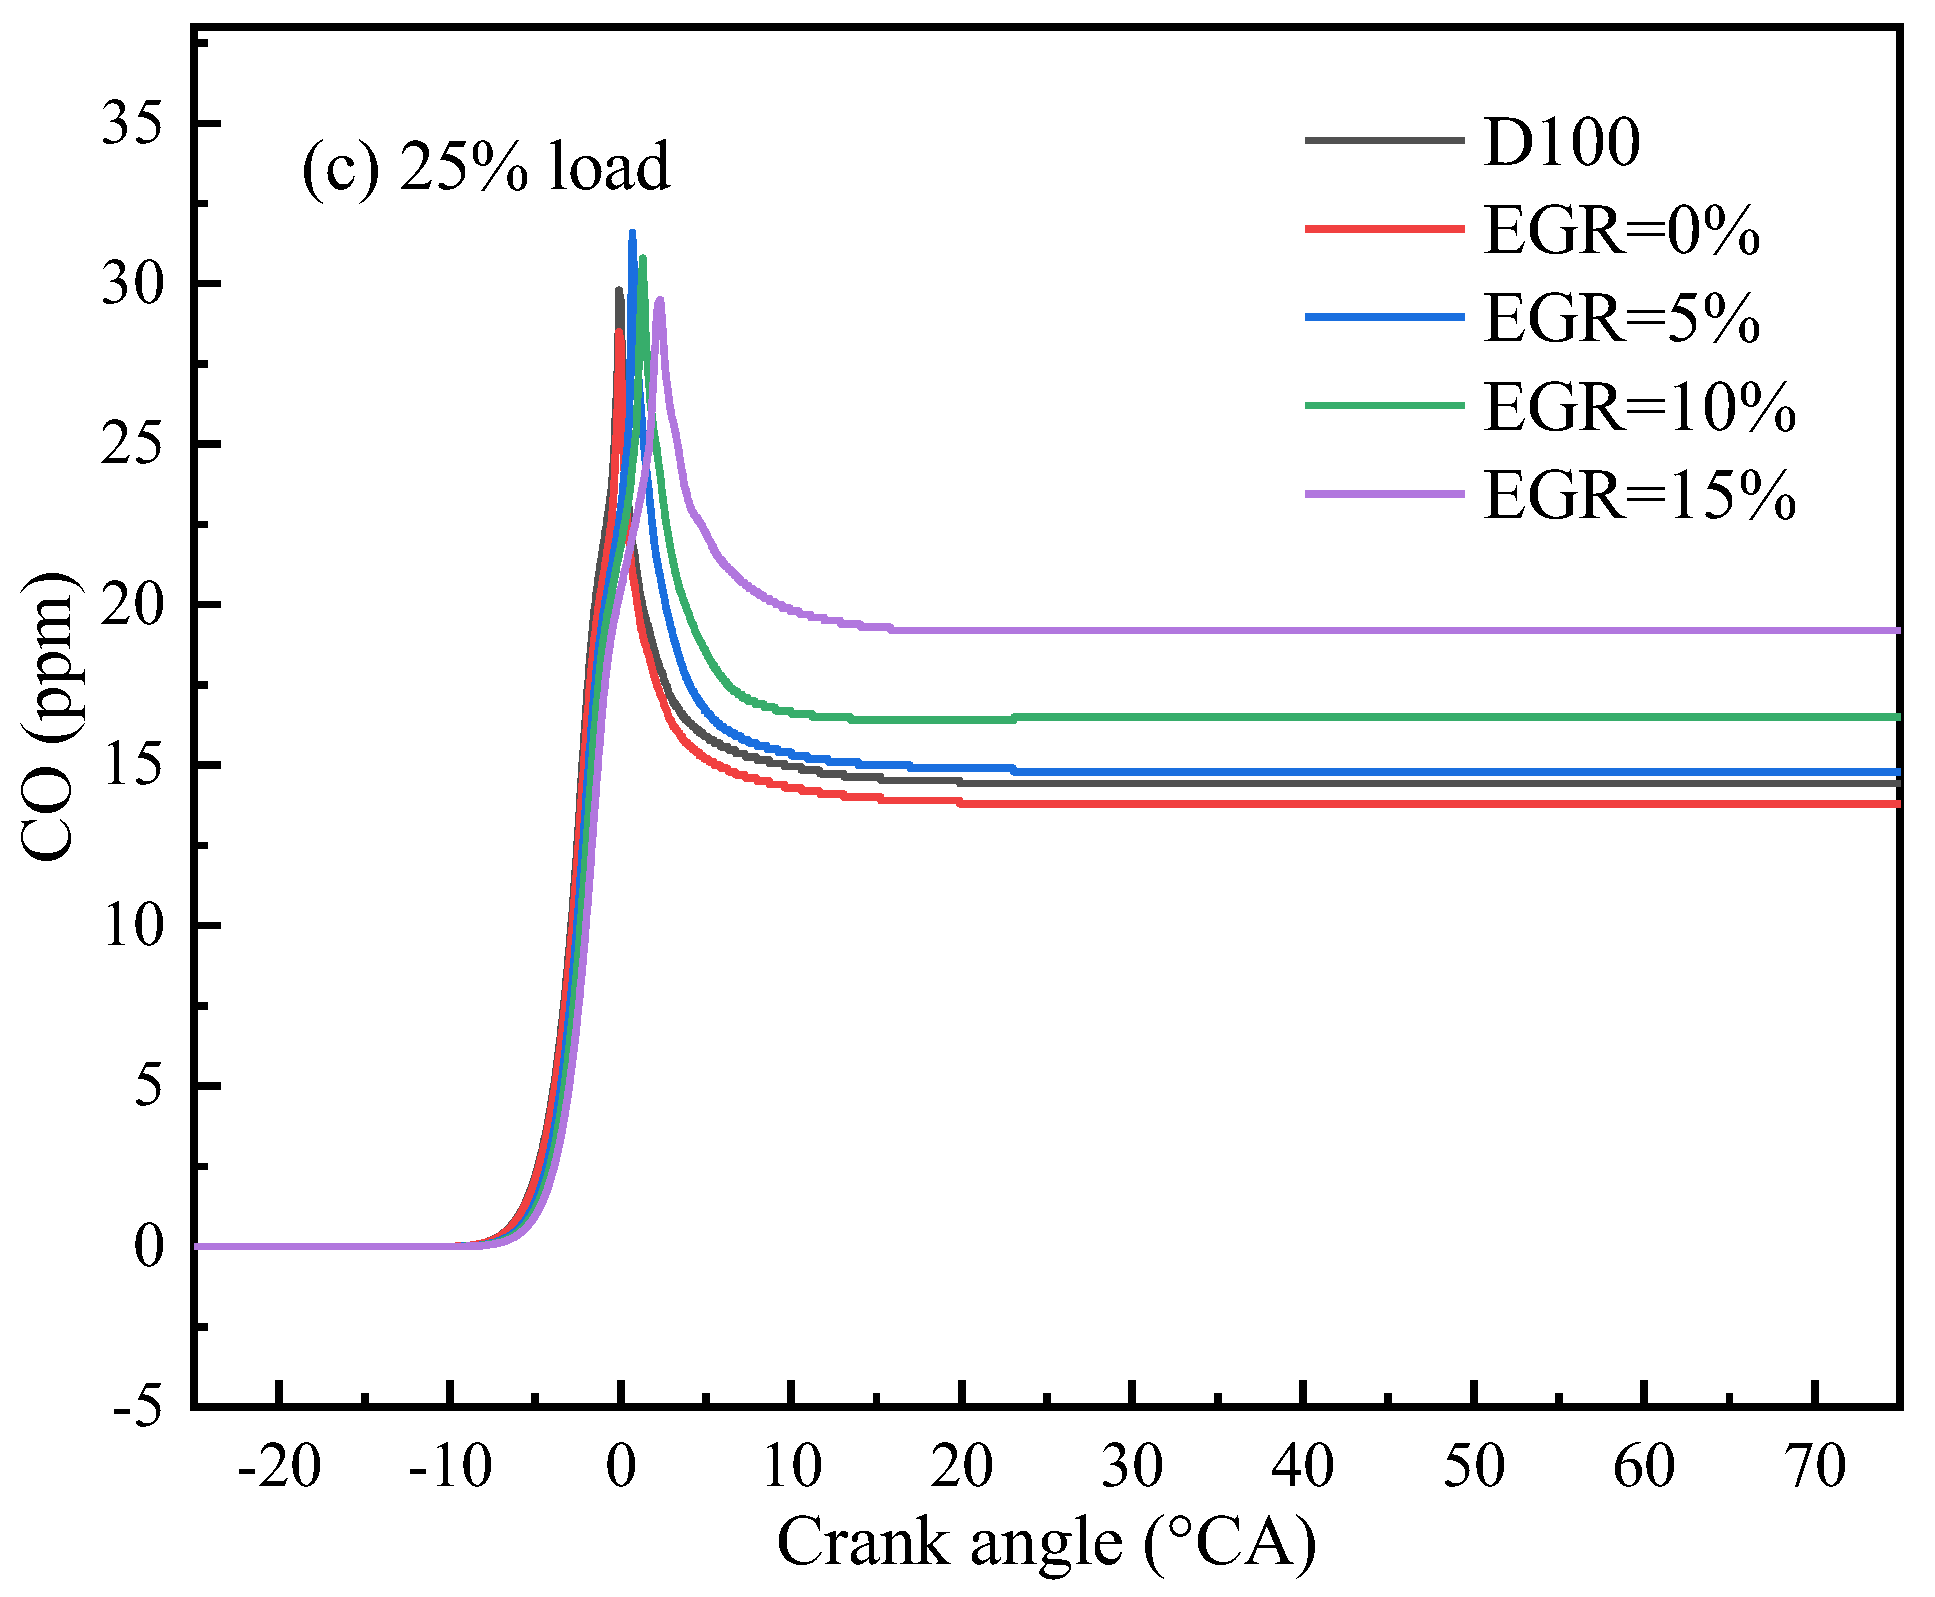
For biodiesel- and diesel-fueled engines, EGR is commonly used as an effective method to reduce NOx emissions. Figure 11a-c shows the NOx emissions at different EGR rates.
Compared to pure diesel, biodiesel–diesel blends had higher NOx emissions. In addition, the NOx emissions decreased continuously with the increase in the EGR rate. At 100% load, when the EGR rate was 5%, 10%, and 15%, NOx emissions were reduced by 49.9%, 64.3%, and 73.9%, respectively, compared with EGR = 0%. NOx emissions depend on the cylinder temperature, oxygen content, and reaction time. With increasing EGR rates, the oxygen concentration in the intake air decreases, and the cylinder temperature decreases; this significantly inhibits NOx formation and results in lower NOx emissions. A similar trend was found in a study by Jiang et al. [40].
The NOx distribution field in the cylinder is shown in Figure 12. The NOx distribution decreased gradually with the increase in the EGR rate. Combined with the cylinder temperature distribution field in Figure 12, it can be found that the NOx distribution is influenced by the cylinder temperature distribution, and NOx is easily generated in the high-temperature gathering area. In addition, the reduction in oxygen concentration in the cylinder is also the main reason for inhibiting NOx formation.

3.3.2. CO Emissions

Figure 13a–c shows the CO emissions at different EGR rates. It can be seen that the CO emissions of the biodiesel–diesel blend were lower than that of pure diesel fuel, and CO emissions increased with the EGR rate. For example, at 100% load, when the EGR rate increased to 5%, 10%, and 15%, the CO emissions increased by 7.28%, 8.7%, and 9.58%, respectively. This is due to the low temperature and lack of oxygen. Thus, CO generation increases with increasing EGR rates. In addition, when the oxygen content and temperature in the cylinder continue to decrease, the production of incomplete combustion products increases, which in turn leads to increased CO emissions. A similar trend was found in a study by Sun et al. [37].

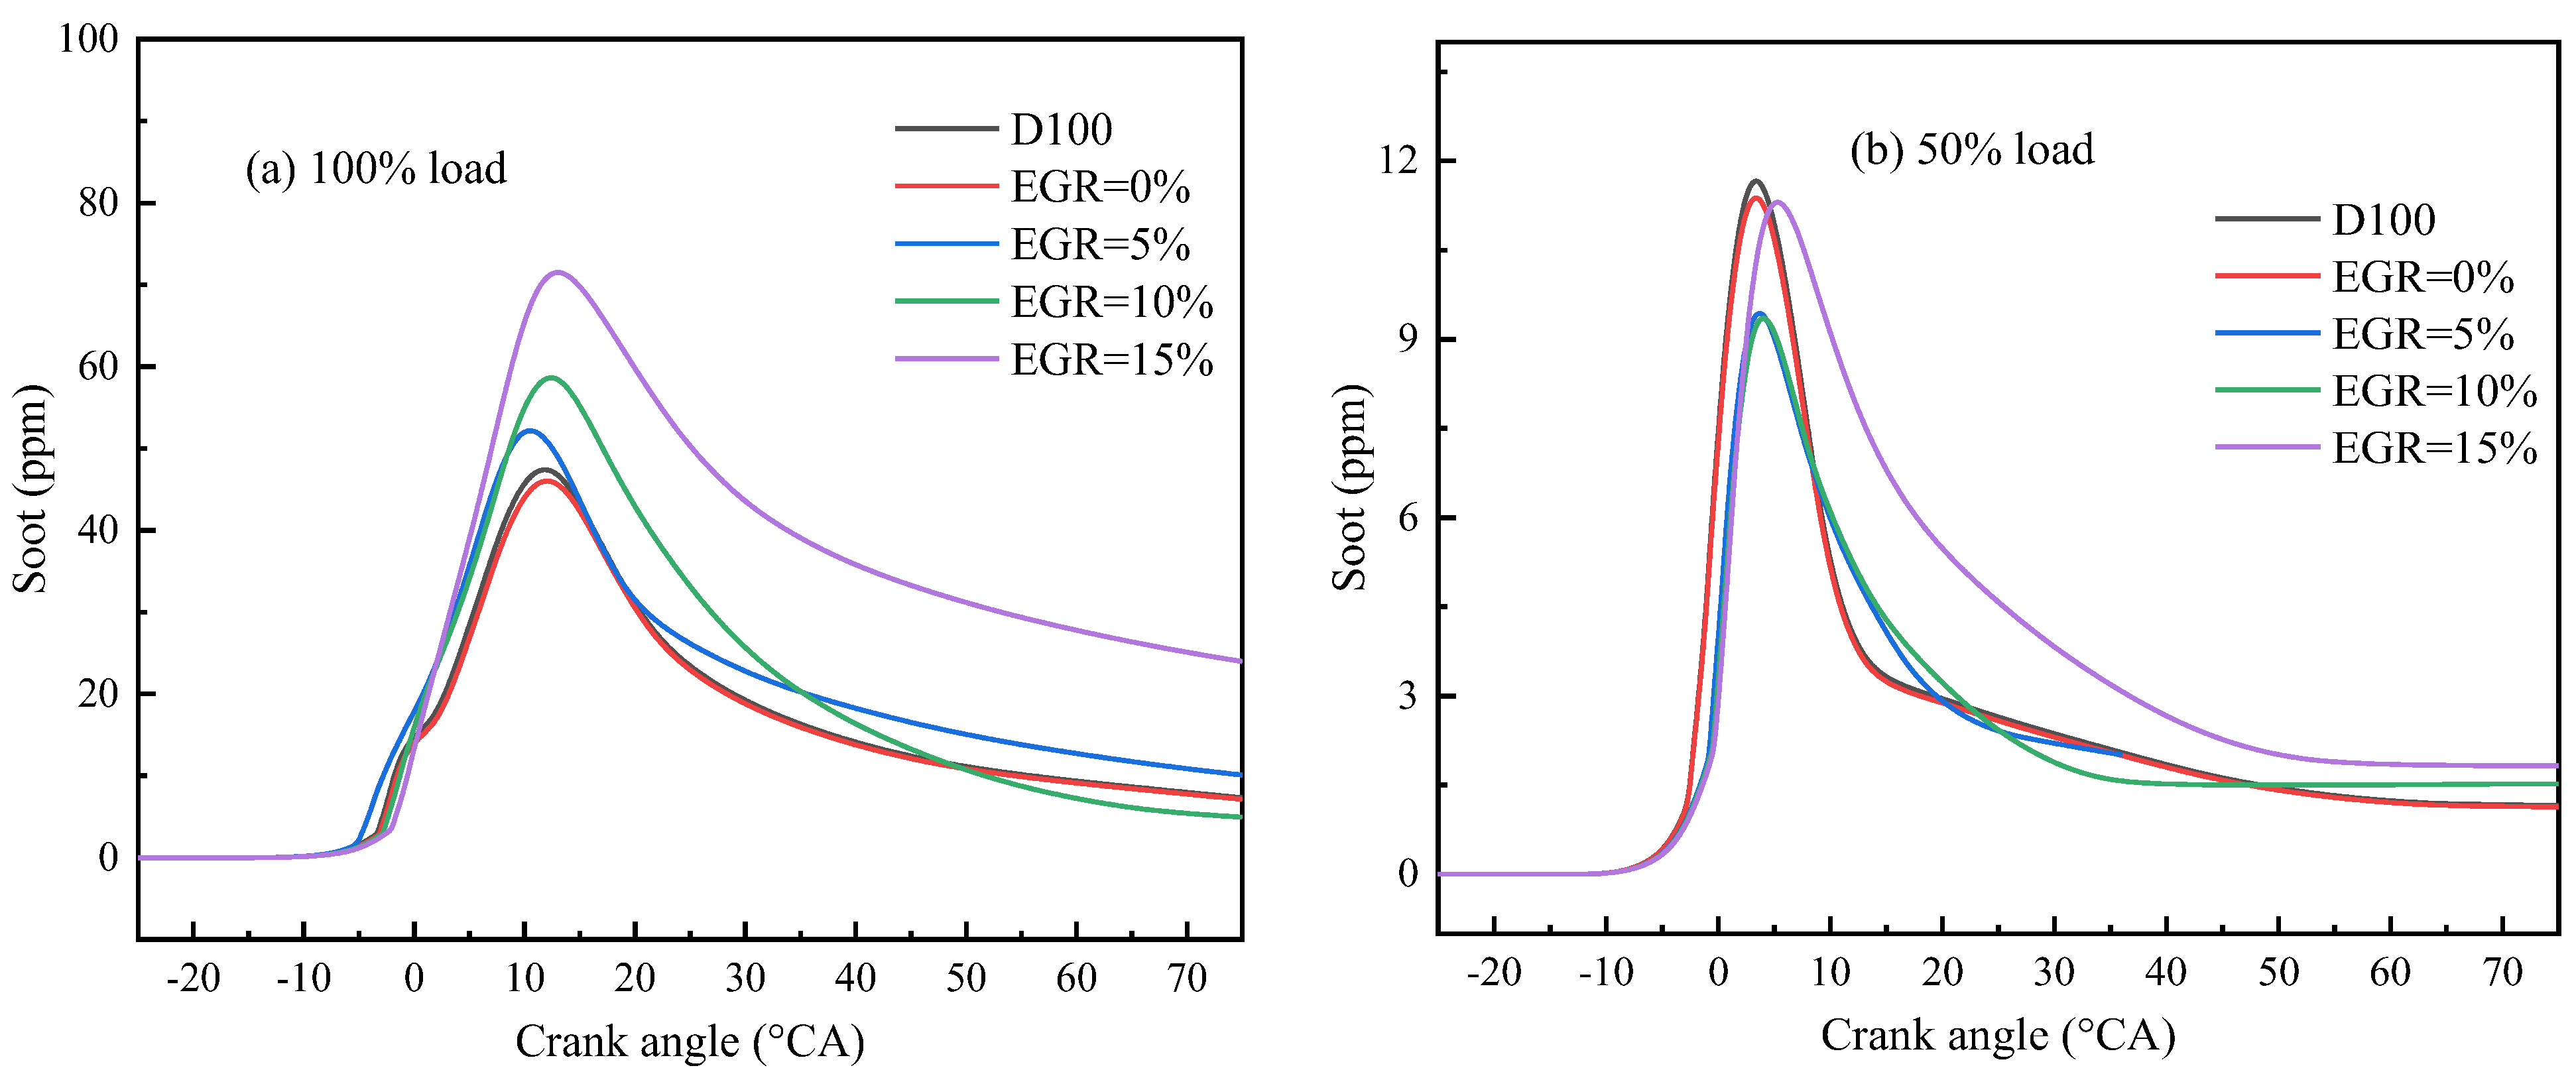
3.3.3. Soot Emissions
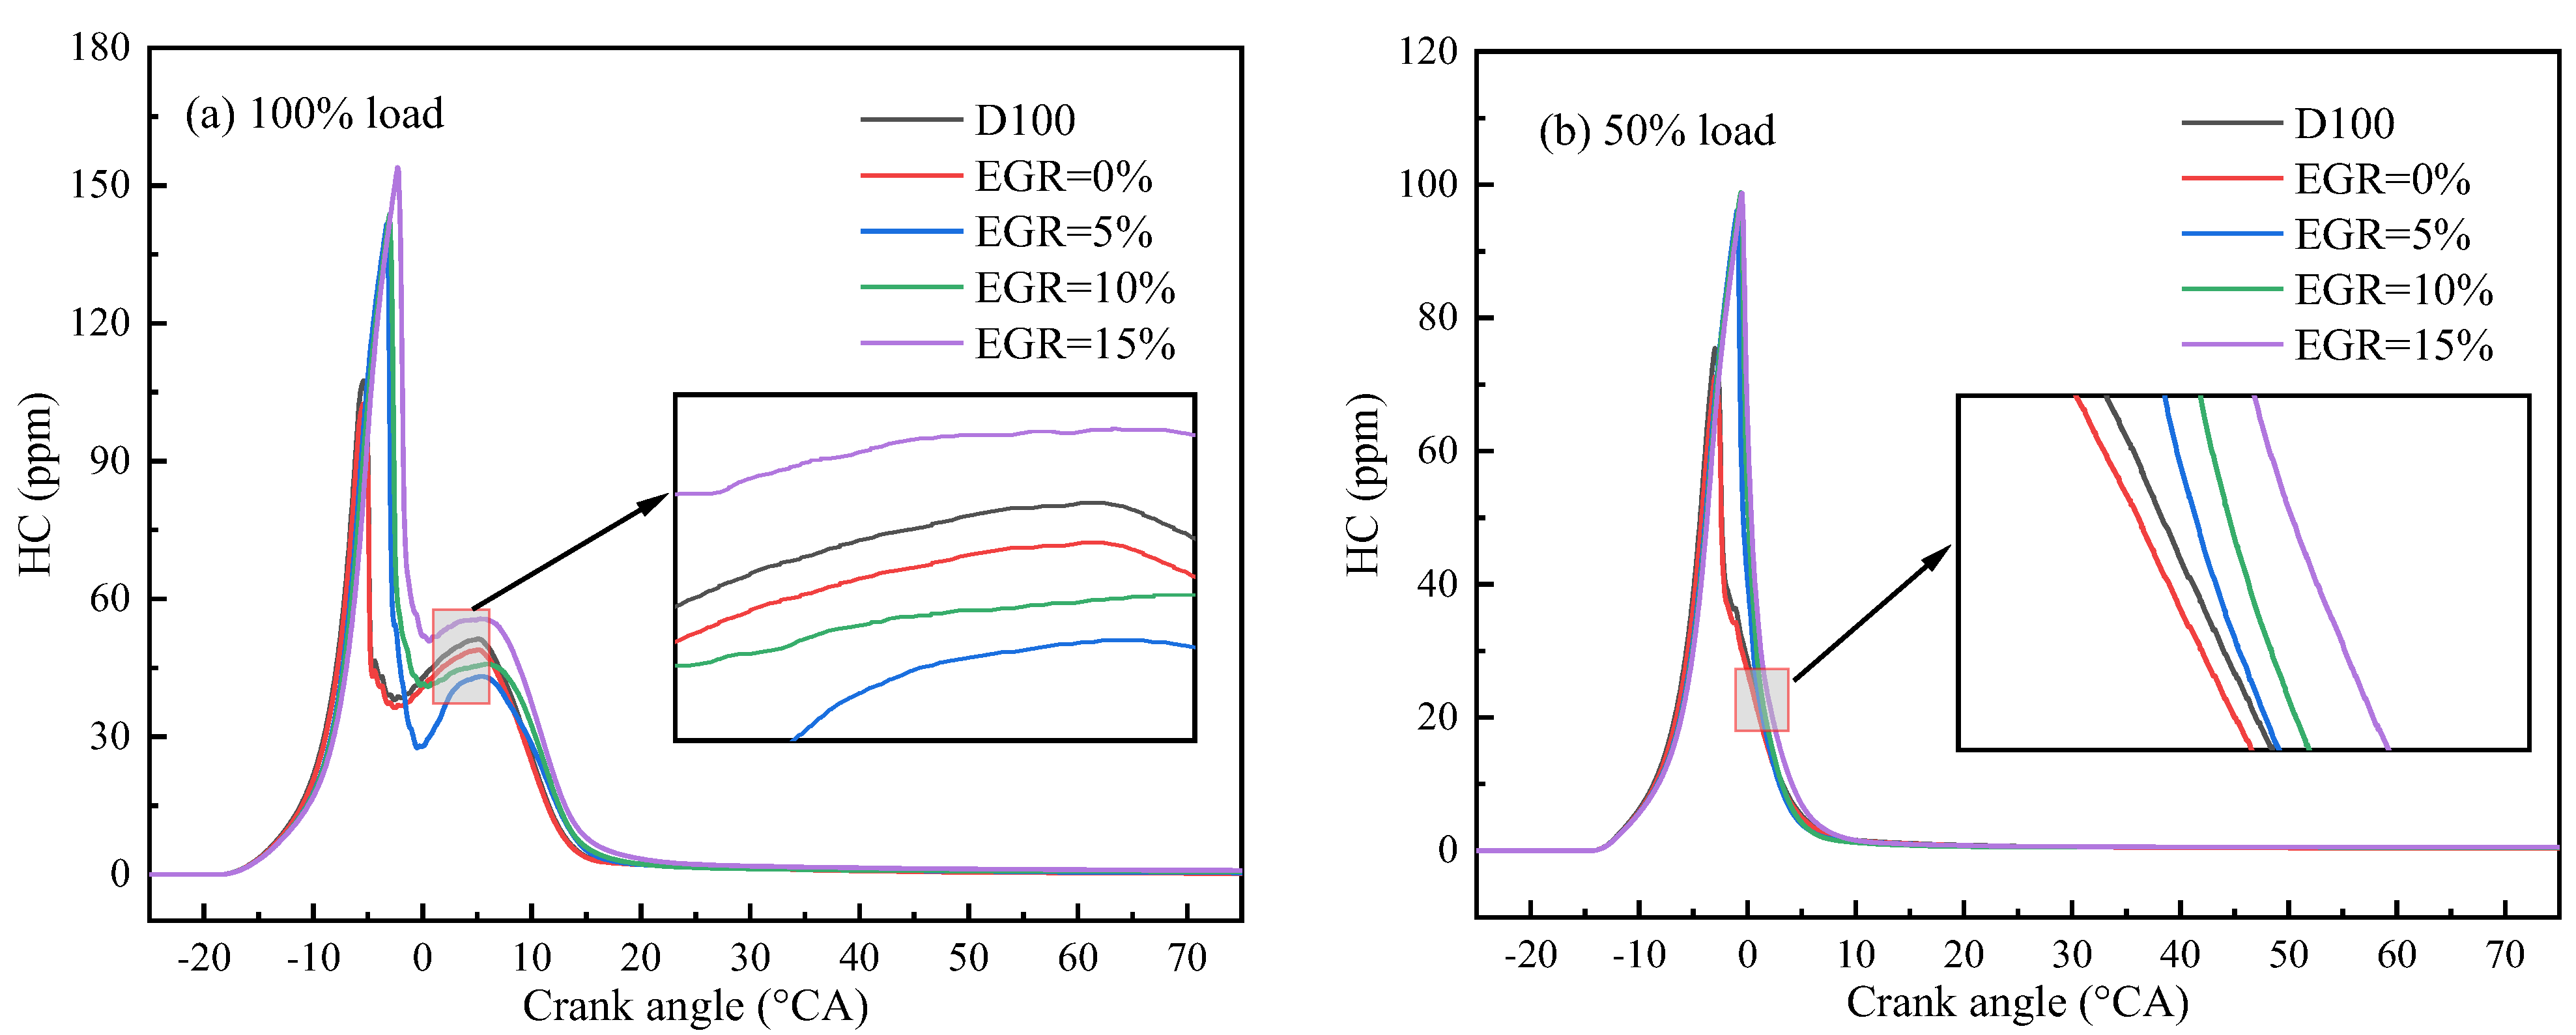
Figure 14a–c shows soot emissions at different EGR rates. It can be seen that the soot emissions of biodiesel–diesel blends were lower than those of pure diesel. The soot generation gradually increased with the increase in the EGR rate. For example, at 100% load, soot generation was greatest at an EGR rate of 15%, followed by 10%, 5%, and 0%. In particular, the soot generation at an EGR rate of 15% was 41.7% higher than that at an EGR rate of 0%. This is due to the increasing EGR rate. When the oxygen content in the combustion chamber continues to decrease, the EGR rate inhibits the oxidation of soot and leads to soot production. Biodiesel fuel can improve combustion due to the oxygen in the biodiesel. Thus, biodiesel can reduce CO emissions. In addition, as the EGR rate continues to rise, the cylinder combustion temperature decreases, which is not conducive to complete combustion of the fuel and generates a greater amount of soot. A similar trend was found in a study by Liu et al. [41].

3.3.4. HC Emissions

Figure 15a–c shows the HC emissions at different EGR rates. It can be seen that the HC emissions of the biodiesel–diesel blend were lower than those of pure diesel fuel. When biodiesel–diesel blends were burned, HC emissions continued to increase as the EGR rate increased. More specifically, the HC emission was the highest at an EGR rate of 15%, followed by 10%, 5%, and 0%. This is due to the increasing EGR rates. When the oxygen content in the combustion chamber continues to decrease, the EGR rate inhibits the oxidation of CO and leads to CO production. Biodiesel fuel can improve combustion due to the oxygen in biodiesel. Thus, biodiesel can reduce CO emissions. In addition, with increasing EGR rates, the oxygen concentration in the cylinder decreases, and the temperature decreases, weakening the oxidation of HC and leading to an increase in HC emissions. A similar trend was found in a study by Labecki et al. [42].

4. Conclusions

Nowadays, with the rapid development of the economy and industrial automation, the shortage of resources [43] and environmental pollution [44] are becoming more and more serious. In this study, a 3D-CFD model was developed by using CONVERGE software and combined with detailed kinetic mechanisms to study the effects of different EGR rates on the combustion and emission characteristics of a diesel engine fueled with biodiesel–diesel blended fuel. The effects of different EGR rates on the in-cylinder pressure, in-cylinder temperature, BSFC, BTE, NOx emissions, HC emissions, CO emissions, and soot emissions of the biodiesel/diesel blended fuel engine were simulated and analyzed by adjusting the EGR rates. The main conclusions are as follows.
(1)
With the increase in the EGR rate, the engine cylinder pressure and cylinder temperature decrease. This is mainly due to the increase in the EGR rate. The increased EGR increases the exhaust gas in the cylinder and reduces the oxygen concentration.
(2)
With the increase in the EGR rate, NOx emissions decrease. In particular, when the EGR rate is 15%, NOx emissions are reduced by 78.89%. This is because the increase in the EGR rate reduces the oxygen concentration and cylinder temperature, which inhibits the generation of NOx. Moreover, the greater the EGR rate, the more obvious the reduction in NOx.
(3)
However, with the increase in the EGR rate, HC, CO, and soot emissions increase. Too high an EGR rate will be unfavorable to the power performance and economy of the engine, so the EGR rate should not be too high.
In short, while reducing NOx emissions, the optimal EGR rate that has a positive impact on engine power characteristics and emissions is 10.

Author Contributions

Data curation, H.H., J.T. and J.L.; formal analysis, D.T.; investigation, J.T. and D.T.; methodology, J.L.; project administration, J.T.; software, J.T.; writing—original draft, H.H., J.L. and D.T.; writing—review and editing, H.H. and J.L. All authors have read and agreed to the published version of the manuscript.

Funding

This research is supported by the Guangxi University of Science and Technology Doctoral Fund under the research grants of 20Z22, 20S04 and 21Z34; This research is supported by the Natural Science Foundation of Guangxi under research grants 2018GXNSFAA281267 and 2018GXNSFAA294072.

Institutional Review Board Statement

Not applicable.

Informed Consent Statement

Not applicable.

Data Availability Statement

All data used to support the findings of this study are included within the article.

Acknowledgments

This work is supported by the Natural Science Foundation of Guangxi under research grants 2018GXNSFAA281267 and 2018GXNSFAA294072. This research is supported by the Guangxi University of Science and Technology Doctoral Fund under research grants 20Z22, 20S04, and 21Z34.

Conflicts of Interest

The authors declare no conflict of interest.

Nomenclature

BSFCBrake-specific fuel consumption
BTEBrake thermal efficiency
CFDComputational fluid dynamics
COCarbon monoxide
CO2Carbon dioxide
EGRExhaust gas recirculation
NOxNitrogen oxides
PMParticulate matter
UHCUnburned hydrocarbon
hiSpecific enthalpy of inflow gas, J/kg
maMass of the gas flowing into the cylinder, kg
pcPressure in the cylinder, Pa
PrePrandtl number in the ε equation
PrtMolecular Prandtl number
RTotal number of reactions
rADroplet radius, m
tTime, s
ρlDensity of the liquid, kg/m3
[Xn]Molar concentration of substance n
µeEffective viscosity, Pa·s
Ca, C1Injector constants
cεa, cεb, Sa, CsEmpirical constants
DMass diffusion coefficient, m2/s
fMass fraction of evaporated fuel,%
HLatent heat of vaporization of the blended fuels, KJ/kg
haSpecific enthalpy of outflow gas, J/kg
HaLatent heat of vaporization of the rapeseed oil, KJ/kg
HbLatent heat of vaporization of the diesel fuel, KJ/kg
hbSpecific enthalpy of leakage gas, J/kg
kMolecular conductivity coefficient
mbMass of the gas flowing out of the cylinder, kg
mcTotal mass of the material in the cylinder, kg
meMass of the fuel flowing into the cylinder, kg
miMass of the gas into the cylinder, kg
NTotal number of substances
NmMass of the micro-element control body component m, kg
NttTotal mass of the micro-element control body component, kg
OaAnseger number of the droplet
PrkPrandtl number in the k equation
qeLatent heat of evaporation of fuel, J
QFFuel heat release, J
QwHeat loss, J
RAInitial radius, m
RcGas constant, J/(K·kg)
SaSource item
SmGeneration rate of the component m per unit time kg/s
TaFluid temperature, K
TbWall temperature, K
TcCylinder body temperature, K
TKHTaylor number
usSpecific internal energy in the cylinder, J/kg
uVelocity vector, m/s
VWorking volume, cm3
WaProportion of diesel in the blended fuel
WbProportion of biodiesel in the blended fuel
WeWeber number of the continuous phase
xnChemical symbol of component n
y+Dimensionless distance
YiMass fraction of m components, %
μτShear velocity, μm/s
τijReynolds stress, Pa
θCrankshaft angle, deg
σSurface tension, dynes·cm−2
τOil beam presence time, s
ΩWave height index
ΛWavelength, m
ρFluid density, kg/m3

References

  1. Tan, D.; Chen, Z.; Li, J.; Luo, J.; Yang, D.; Cui, S.; Zhang, Z. Effects of Swirl and Boiling Heat Transfer on the Performance Enhancement and Emission Reduction for a Medium Diesel Engine Fueled with Biodiesel. Processes 2021, 9, 568. [Google Scholar] [CrossRef]
  2. Cai, T.; Zhao, D.; Sun, Y.; Ni, S.; Li, W.; Guan, D.; Wang, B. Evaluation of NOx emissions characteristics in a CO2-Free micro-power system by implementing a perforated plate. Renew. Sustain. Energy Rev. 2021, 145, 111150. [Google Scholar] [CrossRef]
  3. Jiaqiang, E.; Zhang, Z.Q.; Chen, J.W.; Pham, M.; Zhao, X.H.; Peng, Q.G.; Zhang, B.; Yin, Z.B. Performance and emission evaluation of a marine diesel engine fueled by water biodiesel-diesel emulsion blends with a fuel additive of a cerium oxide nanoparticle. Energy Convers. Manag. 2018, 169, 194–205. [Google Scholar]
  4. Zhang, Z.; Tian, J.; Li, J.; Lv, J.; Wang, S.; Zhong, Y.; Dong, R.; Gao, S.; Cao, C.; Tan, D. Investigation on combustion, performance and emission characteristics of a diesel engine fueled with diesel/alcohol/n-butanol blended fuels. Fuel 2022, 320, 123975. [Google Scholar] [CrossRef]
  5. Jiaqiang, E.; Pham, M.; Zhao, D.; Deng, Y.; Duc Hieu, L.; Wei, Z.; Zhu, H.; Liu, T.; Peng, Q.; Zhang, Z. Effect of different technologies on combustion and emissions of the diesel engine fueled with biodiesel: A review. Renew. Sustain. Energy Rev. 2017, 80, 620–647. [Google Scholar]
  6. Cai, T.; Becker, S.M.; Cao, F.; Wang, B.; Tang, A.; Fu, J.; Han, L.; Sun, Y.; Zhao, D. NOx emission performance assessment on a perforated plate-implemented premixed ammonia-oxygen micro-combustion system. Chem. Eng. J. 2021, 417, 128033. [Google Scholar] [CrossRef]
  7. Öztürk, E.; Can, Ö. Effects of EGR, injection retardation and ethanol addition on combustion, performance and emissions of a DI diesel engine fueled with canola biodiesel/diesel fuel blend. Energy 2022, 244, 123129. [Google Scholar] [CrossRef]
  8. Fan, L.; Cheng, F.; Zhang, T.; Liu, G.; Yuan, J.; Mao, P. Visible-light photoredox-promoted desilylative allylation of α-silylamines: An efficient route to synthesis of homoallylic amines. Tetrahedron Lett. 2021, 81, 153357. [Google Scholar] [CrossRef]
  9. Díaz Domínguez, Y.; Rondón Macias, M.; Tabio García, D.; Melo-Espinosa, E.A.; Fernández Santana, E.; Piloto-Rodríguez, R. Influence of Moringa oleifera biodieseldiesel blend on combustion, performance and emissions in a diesel engine. Afinidad 2021, 78, 45–55. [Google Scholar]
  10. Zhang, Z.; Ye, J.; Tan, D.; Feng, Z.; Luo, J.; Tan, Y.; Huang, Y. The effects of Fe2O3 based DOC and SCR catalyst on the combustion and emission characteristics of a diesel engine fueled with biodiesel. Fuel 2021, 290, 120039. [Google Scholar] [CrossRef]
  11. Yan, Z.; Gainey, B.; Lawler, B. A parametric modeling study of thermal barrier coatings in low-temperature combustion engines. Appl. Therm. Eng. 2022, 200, 117687. [Google Scholar] [CrossRef]
  12. Gainey, B.; Yan, Z.; Lawler, B. Autoignition characterization of methanol, ethanol, propanol, and butanol over a wide range of operating conditions in LTC/HCCI. Fuel 2021, 287, 119495. [Google Scholar] [CrossRef]
  13. Reddy, E.; Keerthana, B.V.S.; Raju, V.D.; Sai, M.; Dhanush, B. Mitigation of NOx emissions with application of exhaust gas recirculation on diesel engine fuelled with diesel-corn seed oil biodiesel blend. Int. J. Ambient Energy 2020, 1–34. [Google Scholar] [CrossRef]
  14. Mourad, M.; Mahmoud, K.; Mohamed, S. Improving diesel engine performance and emissions characteristics fuelled with biodiesel. Fuel 2021, 302, 121097. [Google Scholar] [CrossRef]
  15. Cai, T.; Zhao, D. Enhancing and assessing ammonia-air combustion performance by blending with dimethyl ether. Renew. Sustain. Energy Rev. 2022, 156, 112003. [Google Scholar] [CrossRef]
  16. Can, Ö.; Öztürk, E.; Solmaz, H.; Aksoy, F.; ÇInar, C.; Yücesu, H. Combined effects of soybean biodiesel fuel addition and EGR application on the combustion and exhaust emissions in a diesel engine. Appl. Therm. Eng. 2015, 95, 115–124. [Google Scholar] [CrossRef]
  17. Shi, X.; Liu, B.; Chao, Z.; Hu, J.; Zeng, Q. A study on combined effect of high EGR rate and biodiesel on combustion and emission performance of a diesel engine. Appl. Therm. Eng. 2017, 125, 1272–1279. [Google Scholar] [CrossRef]
  18. Mat Yasin, M.H.; Mamat, R.; Yusop, A.; Paruka, P.; Yusaf, T.F.; Najafi, G. Effects of Exhaust Gas Recirculation (EGR) on a Diesel Engine fuelled with Palm-biodiesel. Energy Procedia 2015, 75, 30–36. [Google Scholar] [CrossRef] [Green Version]
  19. Zhang, Z.; Tian, J.; Xie, G.; Li, J.; Xu, W.; Jiang, F.; Huang, Y.; Tan, D. Investigation on the combustion and emission characteristics of diesel engine fueled with diesel/methanol/n-butanol blends. Fuel 2022, 314, 123088. [Google Scholar] [CrossRef]
  20. Zhang, Z.; Li, J.; Tian, J.; Dong, R.; Zou, Z.; Gao, S.; Tan, D. Performance, combustion and emission characteristics investigations on a diesel engine fueled with diesel/ethanol/n-butanol blends. Energy 2022, 249, 123733. [Google Scholar] [CrossRef]
  21. Sathyamurthy, R.; Balaji, D.; Gorjian, S.; Muthiya, S.J.; Bharathwaaj, R.; Vasanthaseelan, S.; Essa, F.A. Performance, combustion and emission characteristics of a DI-CI diesel engine fueled with corn oil methyl ester biodiesel blends. Sustain. Energy Technol. Assess. 2021, 43, 100981. [Google Scholar] [CrossRef]
  22. Zhang, Z.; Lv, J.; Xie, G.; Wang, S.; Ye, Y.; Huang, G.; Tan, D. Effect of assisted hydrogen on combustion and emission characteristics of a diesel engine fueled with biodiesel. Energy 2022, 254, 124269. [Google Scholar] [CrossRef]
  23. Boyd, Z.M.; Ramsey, S.D.; Baty, R.S. On the existence of self-similar converging shocks for arbitrary equation of state. arXiv 2017, arXiv:1707.03792. [Google Scholar]
  24. Beale, J.; Reitz, R. Modeling spray atomization with the Kelvin-Helmholtz/Rayleigh-Taylor hybrid model. At. Spray 1999, 9, 623–650. [Google Scholar]
  25. Sim, J.; Badra, J.; Elwardani, A.E.; Im, H.G. Spray Modeling for Outwardly-Opening Hollow-Cone Injector; SAE Technical Paper 2016-01-0844; SAE International: Warrendale, PA, USA, 2016. [Google Scholar]
  26. Koutsourakis, N.; Bartzis, J.G.; Markatos, N.C. Evaluation of Reynolds stress, k-ε and RNG k-ε turbulence models in street canyon flows using various experimental datasets. Environ. Fluid Mech. 2012, 12, 379–403. [Google Scholar] [CrossRef]
  27. Senecal, P.; Pomraning, E.; Richards, K.; Briggs, T.; Choi, C.; McDavid, R.; Patterson, M. Multi-Dimensional Modeling of Direct-Injection Diesel Spray Liquid Length and Flame Lift-off Length Using CFD and Parallel Detailed Chemistry; SAE Technical Paper 2003-01-1043; SAE International: Warrendale, PA, USA, 2003. [Google Scholar] [CrossRef]
  28. Yeckel, A.; Pandy, A.; Derby, J.J. Fixed-point convergence of modular, steady-state heat transfer models coupling multiple scales and phenomena for melt–crystal growth. Int. J. Numer. Methods Eng. 2006, 67, 1768–1789. [Google Scholar] [CrossRef]
  29. O’Rourke, P.J.; Amsden, A.A. A Particle Numerical Model for Wall Film Dynamics in Port-Injected Engines; SAE Technical Paper 961961; SAE International Fall Fuels and Lubricants Meeting and Exhibition; SAE International: Warrendale, PA, USA, 1996. [Google Scholar]
  30. Duan, J.; Yang, Z.; Sun, B.; Chen, W.; Wang, L. Study on the NOx emissions mechanism of an HICE under high load. Int. J. Hydrogen Energy 2017, 42, 22027–22035. [Google Scholar] [CrossRef]
  31. Heywood, J. Internal Combustion Engine Fundamentals; McGraw-Hill: New York, NY, USA, 1988. [Google Scholar]
  32. Yousefi, A.; Guo, H.; Birouk, M. Effect of swirl ratio on NG/diesel dual-fuel combustion at low to high engine load conditions. Appl. Energy 2018, 229, 375–388. [Google Scholar] [CrossRef]
  33. Jiaqiang, E.; Pham, M.; Deng, Y.; Nguyen, T.; Duy, V.; Le, D.; Zuo, W.; Peng, Q.; Zhang, Z. Effects of injection timing and injection pressure on performance and exhaust emissions of a common rail diesel engine fueled by various concentrations of fish-oil biodiesel blends. Energy 2018, 149, 979–989. [Google Scholar]
  34. Zhang, Z.; Li, J.; Tian, J.; Zhong, Y.; Zou, Z.; Dong, R.; Gao, S.; Xu, W.; Tan, D. The effects of Mn-based catalysts on the selective catalytic reduction of NOx with NH3 at low temperature: A review. Fuel Process. Technol. 2022, 230, 107213. [Google Scholar] [CrossRef]
  35. Zhang, Z.; Jiaqiang, E.; Deng, Y.; Pham, M.; Zuo, W.; Peng, Q.; Yin, Z. Effects of fatty acid methyl esters proportion on combustion and emission characteristics of a biodiesel fueled marine diesel engine. Energy Convers. Manag. 2018, 159, 244–253. [Google Scholar] [CrossRef]
  36. Duan, X.; Xu, Z.; Sun, X.; Deng, B.; Liu, J. Effects of injection timing and EGR on combustion and emissions characteristics of the diesel engine fuelled with acetone–butanol–ethanol/diesel blend fuels. Energy 2021, 231, 121069. [Google Scholar] [CrossRef]
  37. Sun, C.; Liu, Y.; Qiao, X.; Ju, D.; Tang, Q.; Fang, X.; Zhou, F. Experimental study of effects of exhaust gas recirculation on combustion, performance, and emissions of DME-biodiesel fueled engine. Energy 2020, 197, 117233. [Google Scholar] [CrossRef]
  38. Devarajan, Y.; Jayabal, R.K.; Ragupathy, D.; Venu, H. Emissions analysis on second generation biodiesel. Front. Environ. Sci. Eng. 2016, 11, 3. [Google Scholar] [CrossRef]
  39. Jiang, X.; Wei, H.; Zhou, L.; Chen, R. Numerical Study on the Effects of Multiple-Injection Coupled with EGR on Combustion and NOx Emissions in a Marine Diesel Engine. Energy Procedia 2019, 158, 4429–4434. [Google Scholar] [CrossRef]
  40. Liu, J.; Wang, F.; Li, S. The effects of EGR and injection timing on the engine combustion and particulate matter emission performances fueled with diesel-ethanol blends. Therm. Sci. 2018, 22, 1457–1467. [Google Scholar] [CrossRef] [Green Version]
  41. Labecki, L.; Ganippa, L.C. Effects of injection parameters and EGR on combustion and emission characteristics of rapeseed oil and its blends in diesel engines. Fuel 2012, 98, 15–28. [Google Scholar] [CrossRef]
  42. Zhang, Z.; Ye, J.; Lv, J.; Xu, W.; Tan, D.; Jiang, F.; Huang, H. Investigation on the effects of non-uniform porosity catalyst on SCR characteristic based on the field synergy analysis. J. Environ. Chem. Eng. 2022, 10, 107056. [Google Scholar] [CrossRef]
  43. Hu, Y.; Sun, Y.; He, J.; Fang, D.; Zhu, J.; Meng, X. Effect of friction stir processing parameters on the microstructure and properties of ZK60 magnesium alloy. Mater. Res. Express 2022, 9, 016508. [Google Scholar] [CrossRef]
  44. Gainey, B.; O’Donnell, P.; Yan, Z.; Moser, S.; Lawler, B. LTC performance of C1–C4 water-alcohol blends with the same cooling potential. Fuel 2021, 293, 120480. [Google Scholar] [CrossRef]
Figure 1. Comparison of cylinder pressures for different grids.
Energies 15 04153 g001
Figure 2. Flow chart of the experimental setup.
Energies 15 04153 g002
Figure 3. Cylinder pressure between experiment results and simulation results at different loads.
Energies 15 04153 g003
Figure 4. HRR between experimental results and simulation results under different load conditions.
Energies 15 04153 g004
Figure 5. NOx emissions in experiments and simulations under different load conditions.
Energies 15 04153 g005
Figure 6. The cylinder pressure curves at different EGR rates: (a) 100% load; (b) 50% load; (c) 25% load.
Energies 15 04153 g006
Figure 7. The cylinder temperature profiles at different EGR rates: (a) 100% load; (b) 50% load; (c) 25% load.
Energies 15 04153 g007
Figure 8. The temperature field distribution in the engine cylinder.
Energies 15 04153 g008
Figure 9. The effect of EGR rate on engine BSFC at different loads.
Energies 15 04153 g009
Figure 10. The effect of EGR rate on engine brake thermal efficiency at different loads.
Energies 15 04153 g010
Figure 11. NOx emissions at different EGR rates: (a) 100% load; (b) 50% load; (c) 25% load.
Energies 15 04153 g011
Figure 12. The NOx distribution field in the cylinder.
Energies 15 04153 g012
Figure 13. The effects of different EGR rates on CO emission: (a) 100% load; (b) 50% load; (c) 25% load.
Energies 15 04153 g013aEnergies 15 04153 g013b
Figure 14. The effect of different EGR rates on soot emissions: (a) 100% load; (b) 50% load; (c) 25% load.
Energies 15 04153 g014aEnergies 15 04153 g014b
Figure 15. The effect of different EGR rates on HC emissions: (a) 100% load; (b) 50% load; (c) 25% load.
Energies 15 04153 g015aEnergies 15 04153 g015b
Table 1. Engine specifications and boundary conditions.
TypeValueTypeValue
Bore × stroke (mm)190 × 210Initial cylinder turbulentkinetic energy (m2/s2)18.375
Connecting rod (mm)410Compression ratio14
Rated speed (r/min)1000Initial pressure in the inlet (MPa)0.192
Fuel injection holes8Effective power (kW)220
Nozzle radius (mm)0.28Spray Angle (°)150
Table 2. Measurement range, uncertainty, and accuracy of relevant parameters.
ParametersMeasuring RangeAccuracyUncertainty
Pressure0–25 MPa±10 kPa±0.55%
Engine speed1–2000 rpm±40 rpm± 0.24%
Crank angle encoder0–720 °CA±0.5 °CA±0.30
BTE-±0.5%±1.70%
BSFC-±5.10 g/(kW·h)±1.50%
NOx emissions0–6000 ppm±10 ppm±0.54%
CO emissions0–12% vol±0.04%±0.33%
Table 3. Performance index of blended fuels.
ItemDieselRME
Cetane number (−)5053.88
Viscosity (cPs/40 °C)2.754.556
Lower calorific value (MJ/kg)42.739.73
Oxygen content (% m/m)0.310.7
Density at 15 °C (kg/m3)837882
Saturation (%)4.45
Publisher’s Note: MDPI stays neutral with regard to jurisdictional claims in published maps and institutional affiliations.

