
Experimental Investigation of Engine Performance for 2nd Generation Biodiesel Derived from Mg2Zr5O12 Catalyst


Abstract
:
1. Introduction
2. Materials and Methods
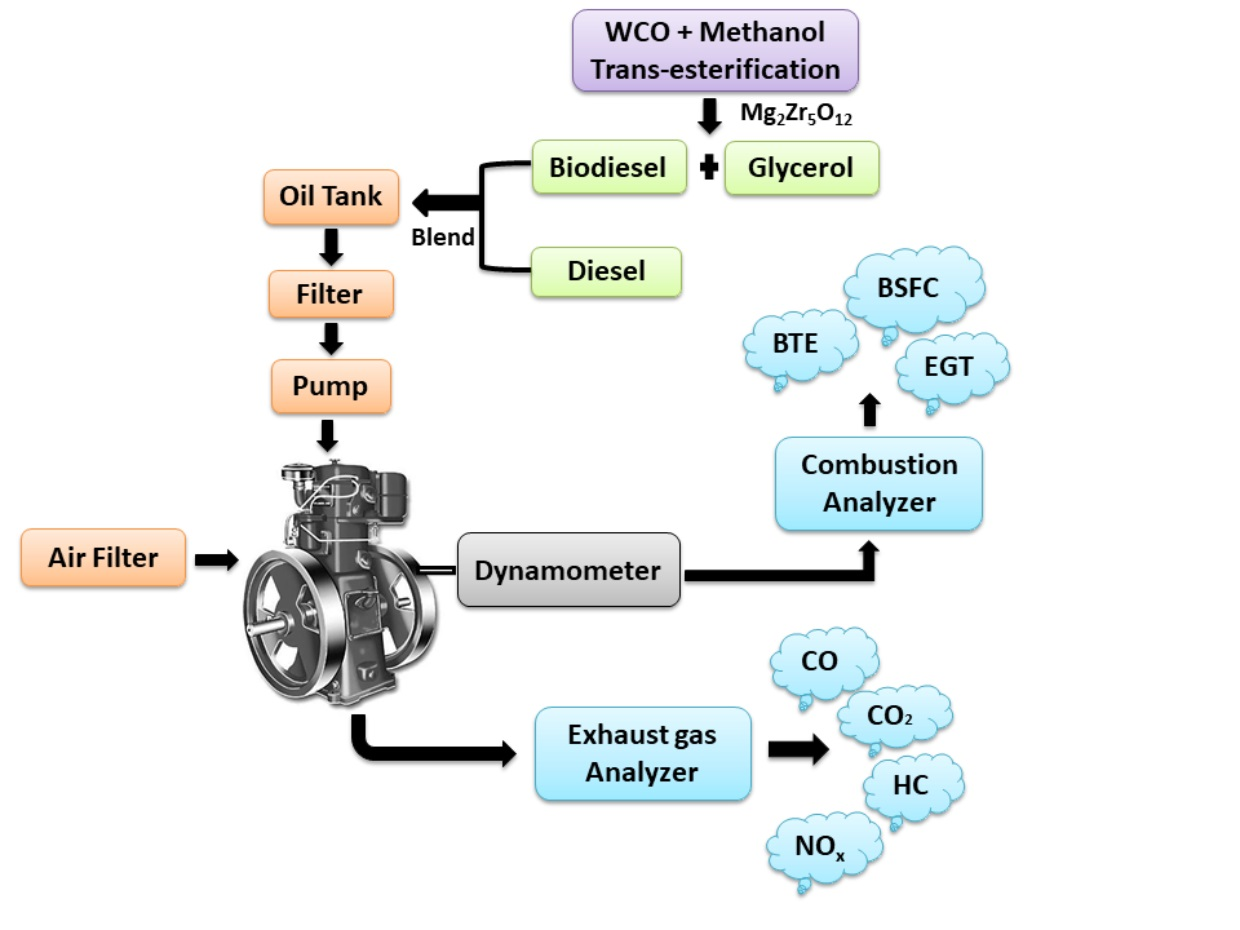
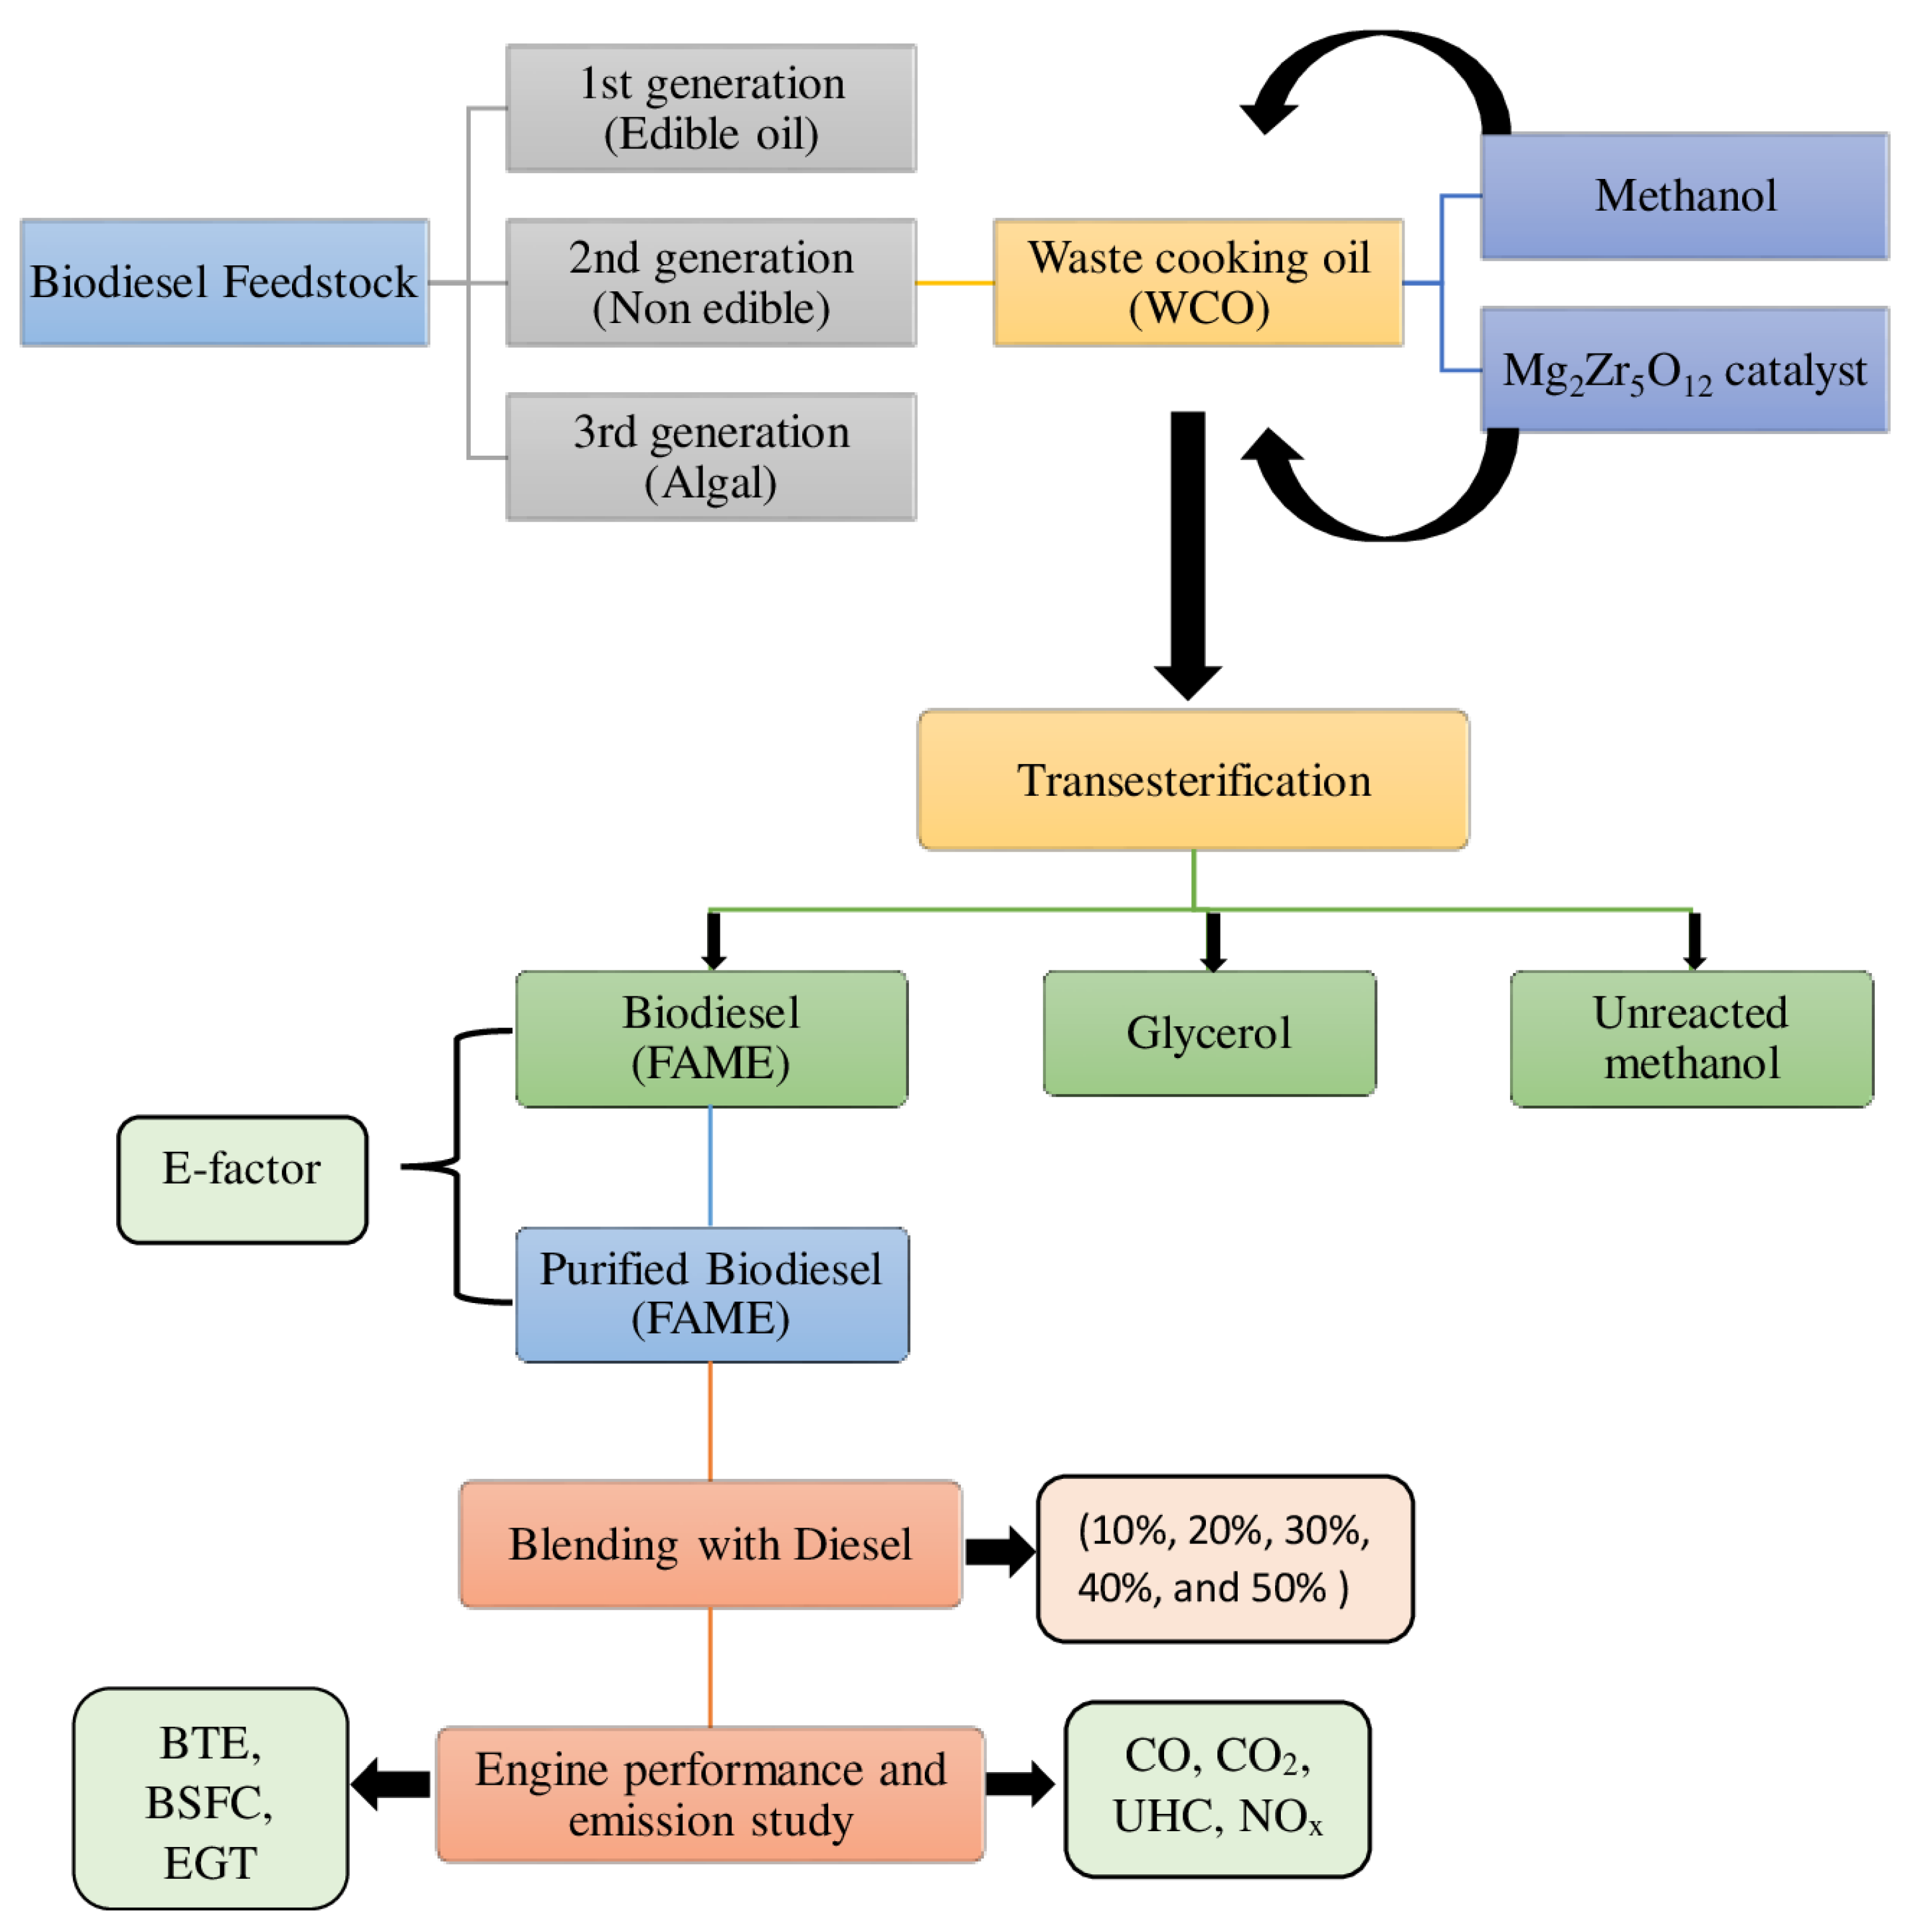
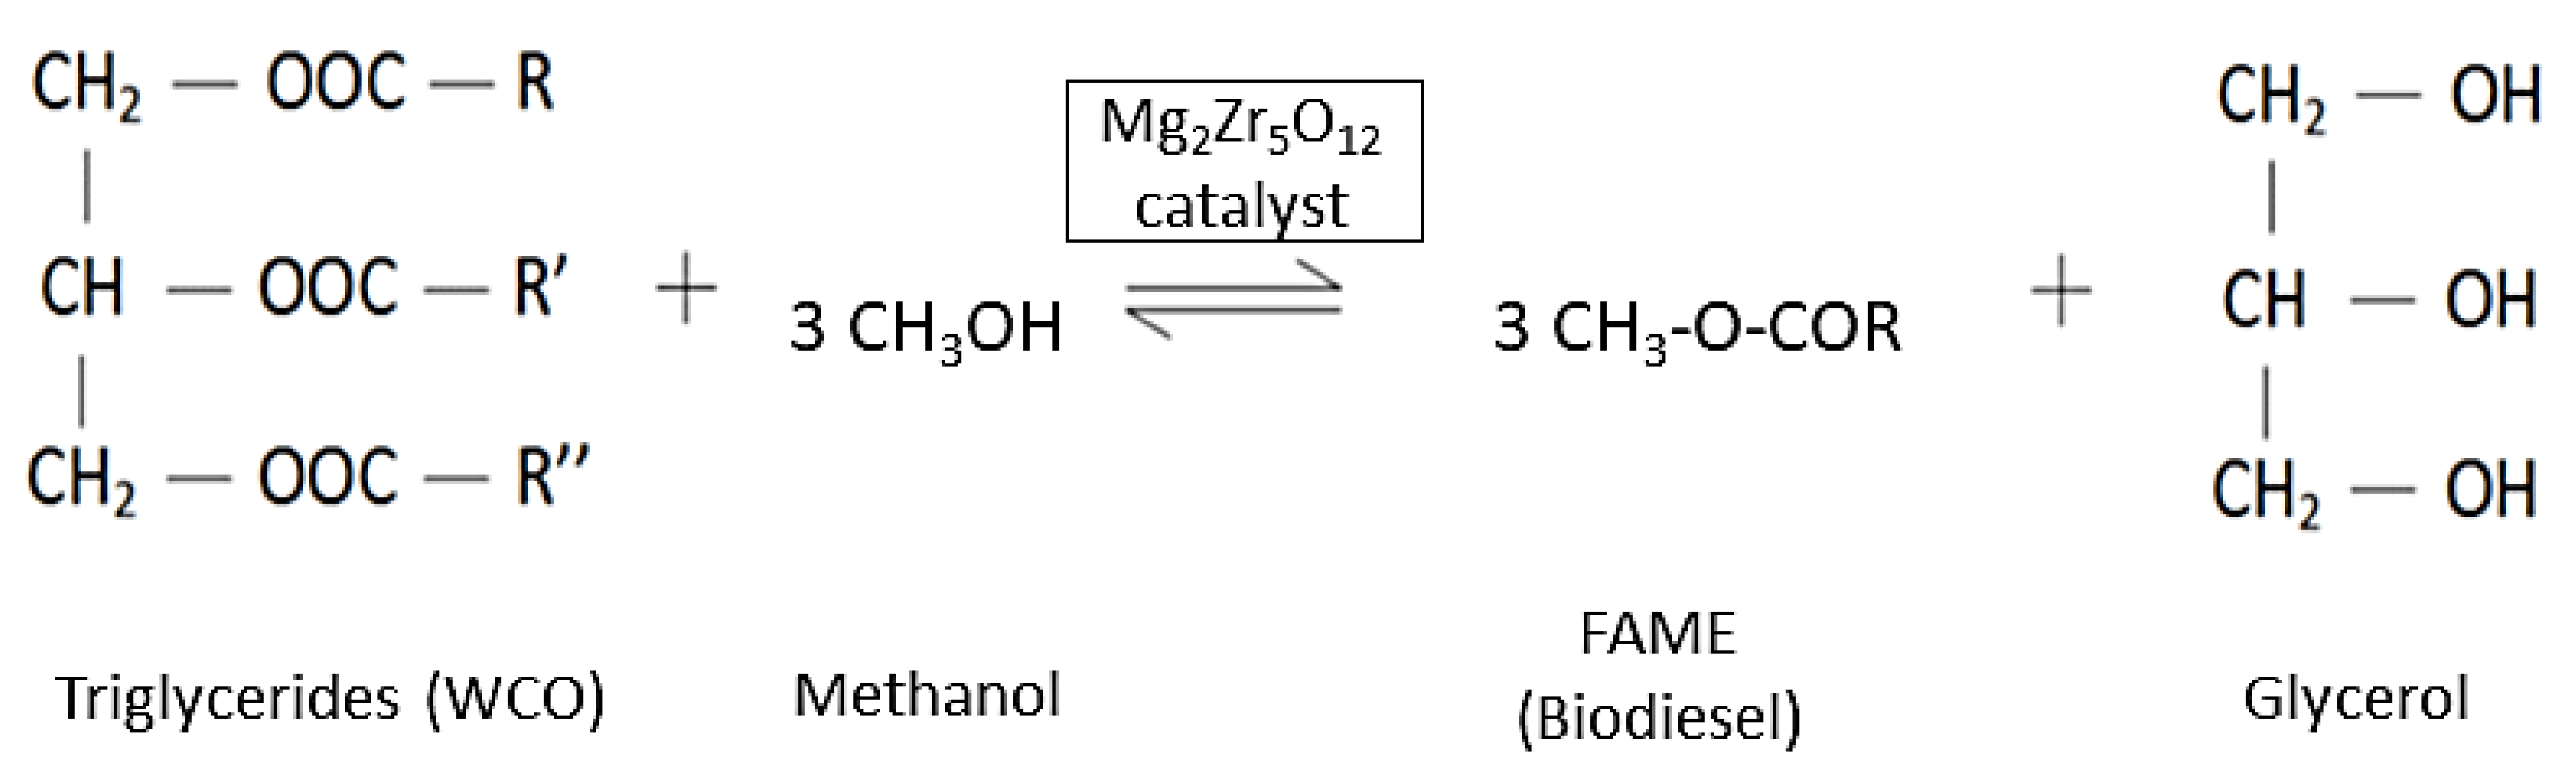
2.1. Biodiesel Production
2.2. Blending of Biodiesel and Fuel Properties
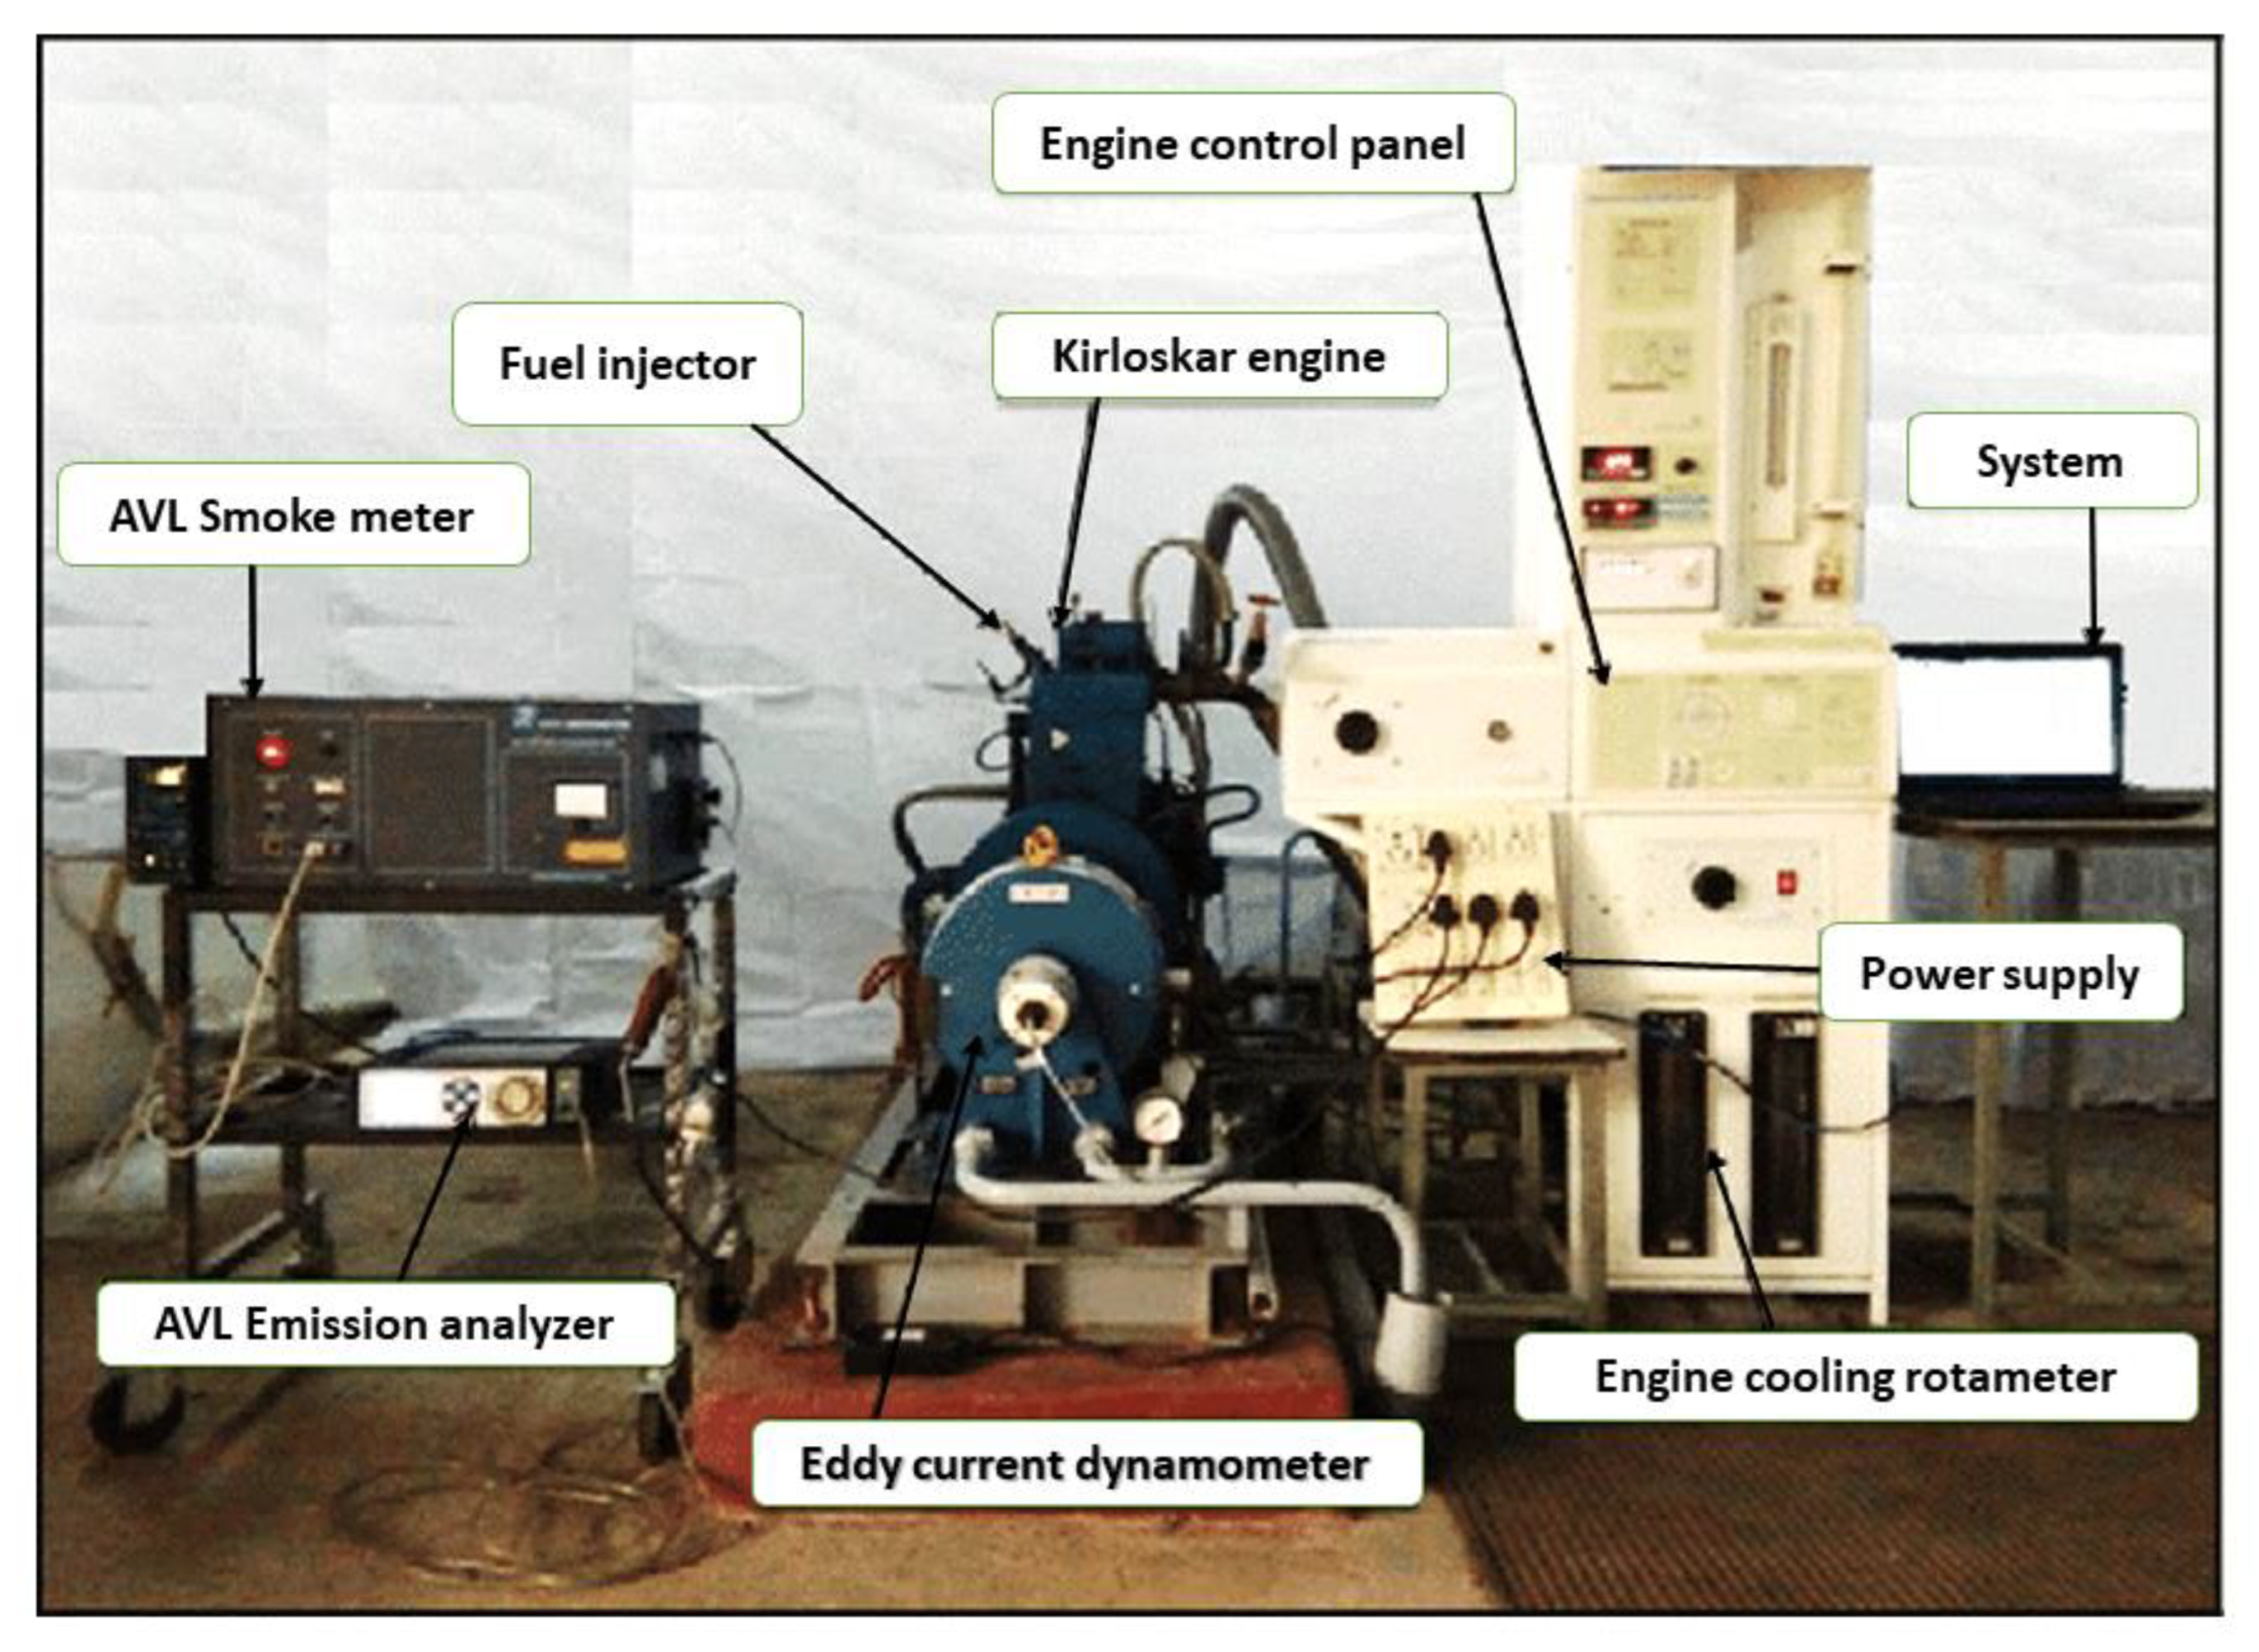
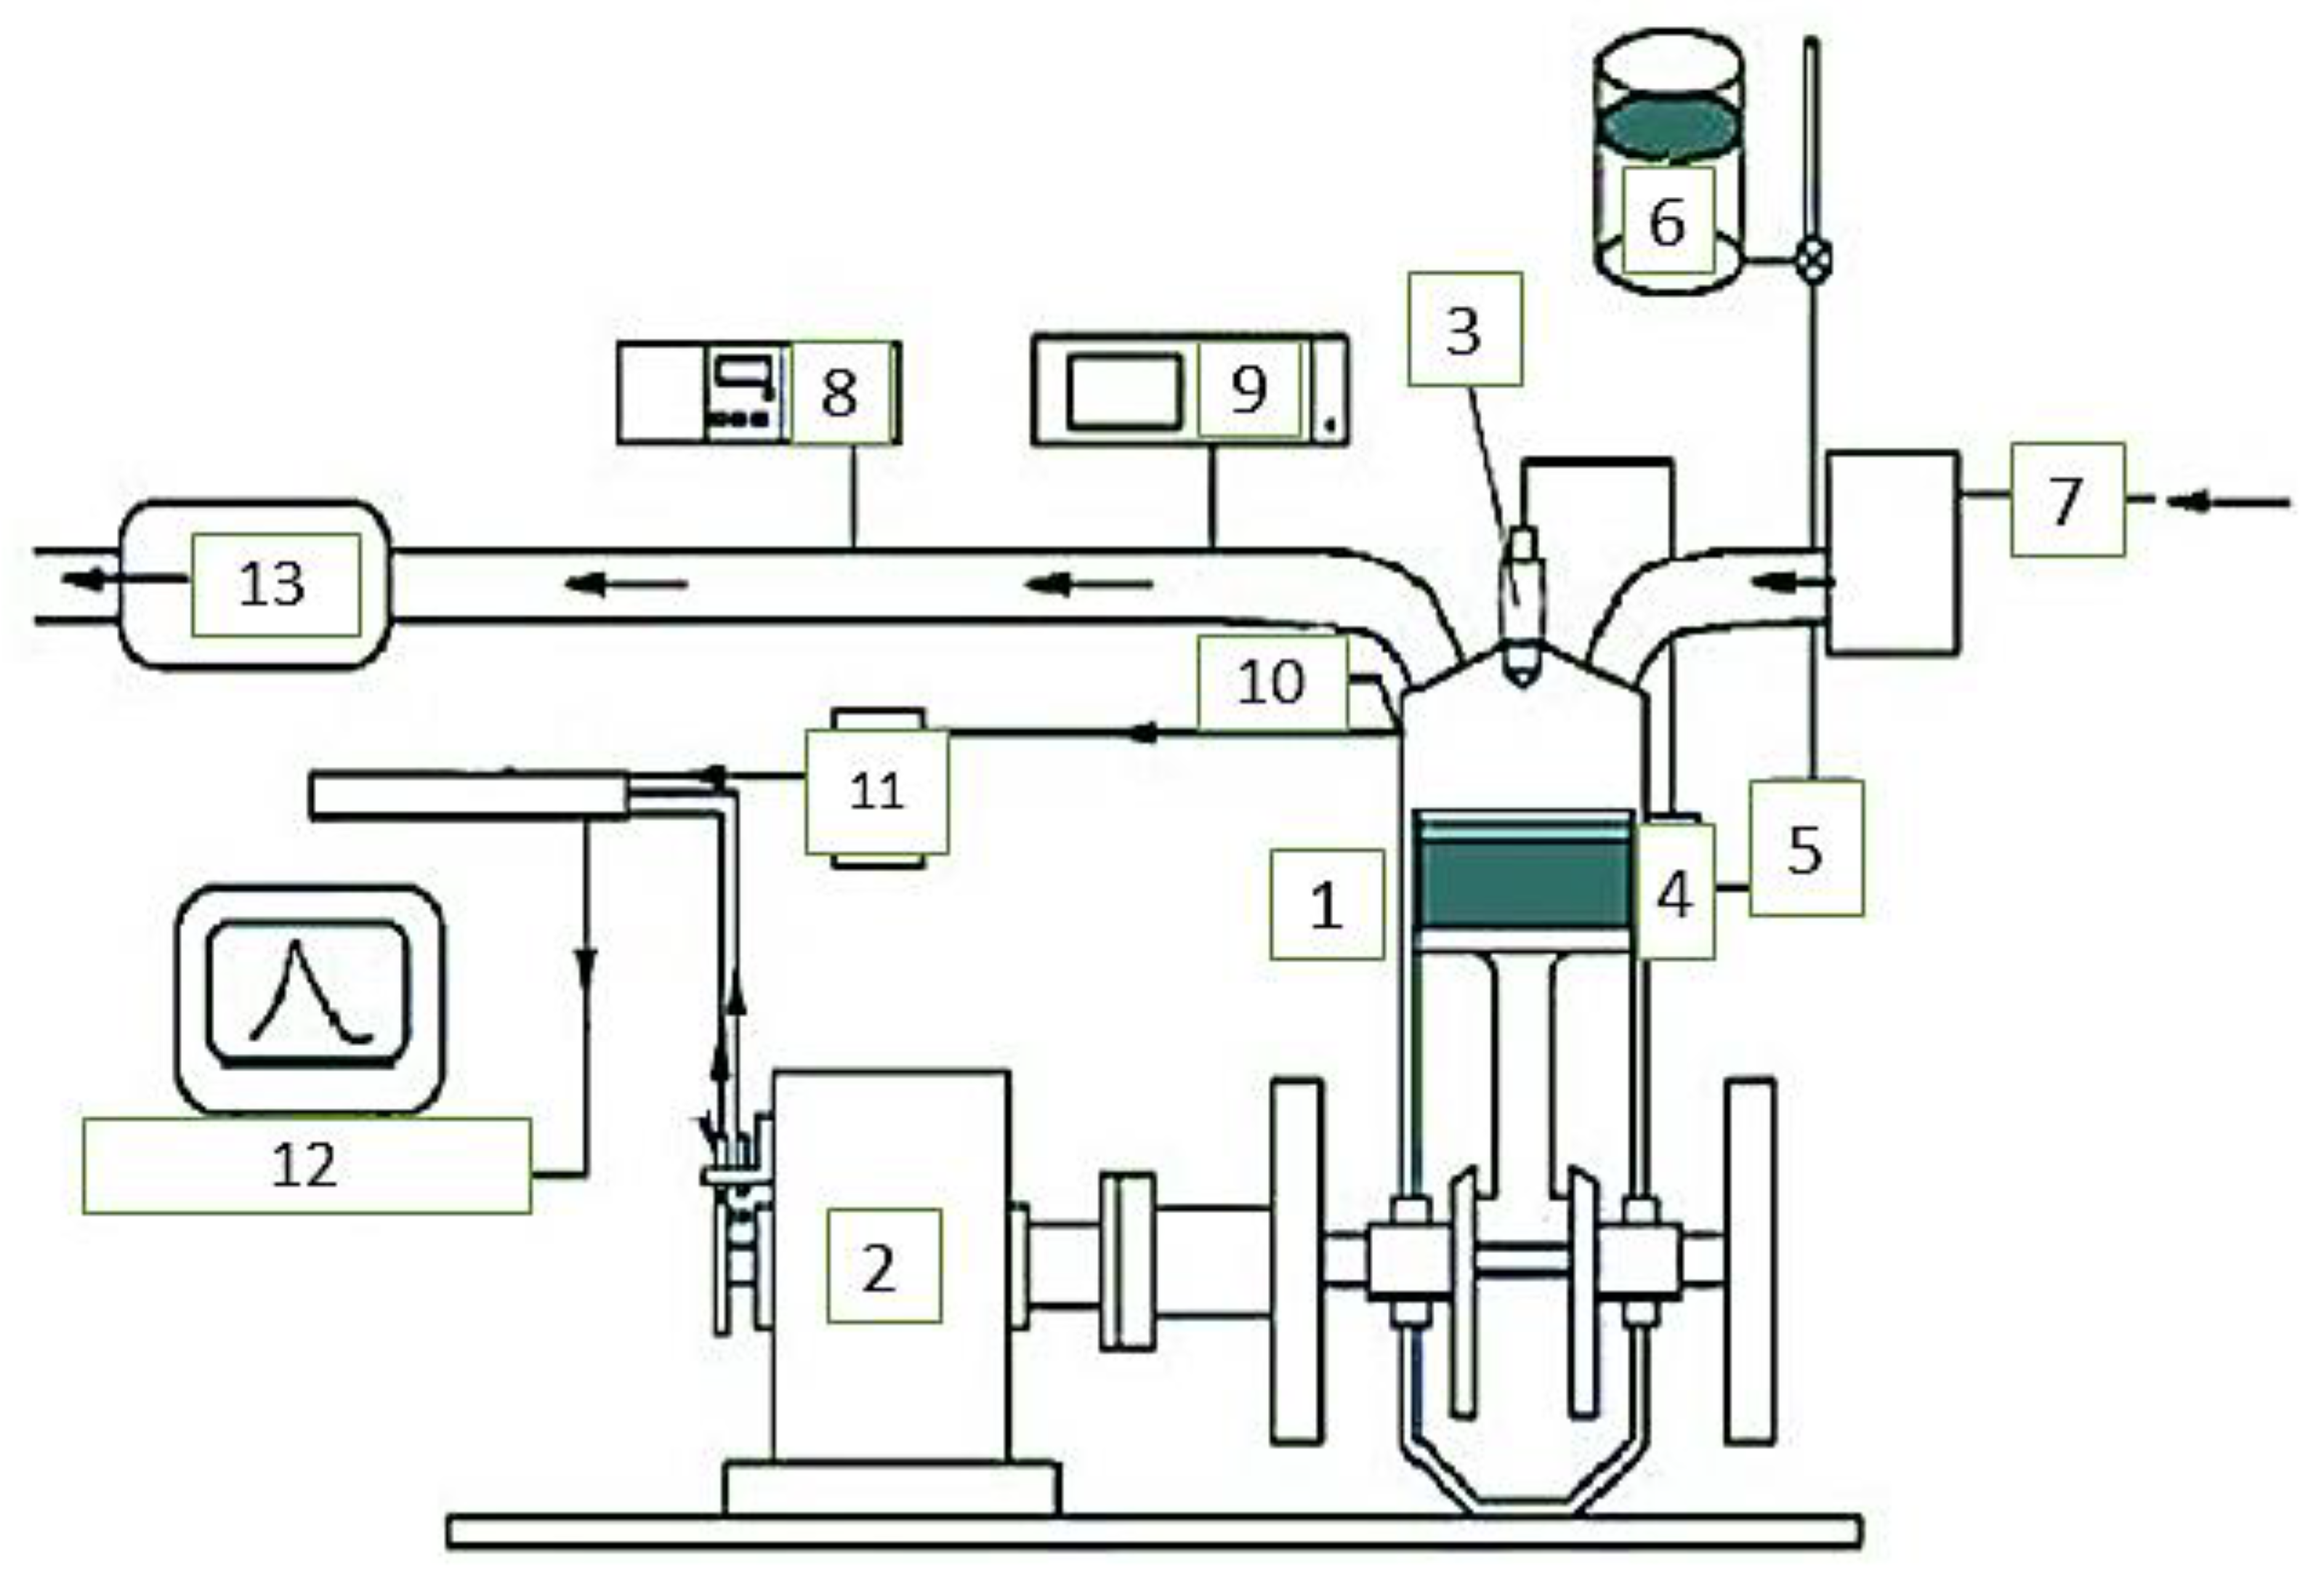
2.3. Engine Performance and Exhaust Emission
2.4. Uncertainty Analysis
3. Results and Discussion
3.1. Engine Performance
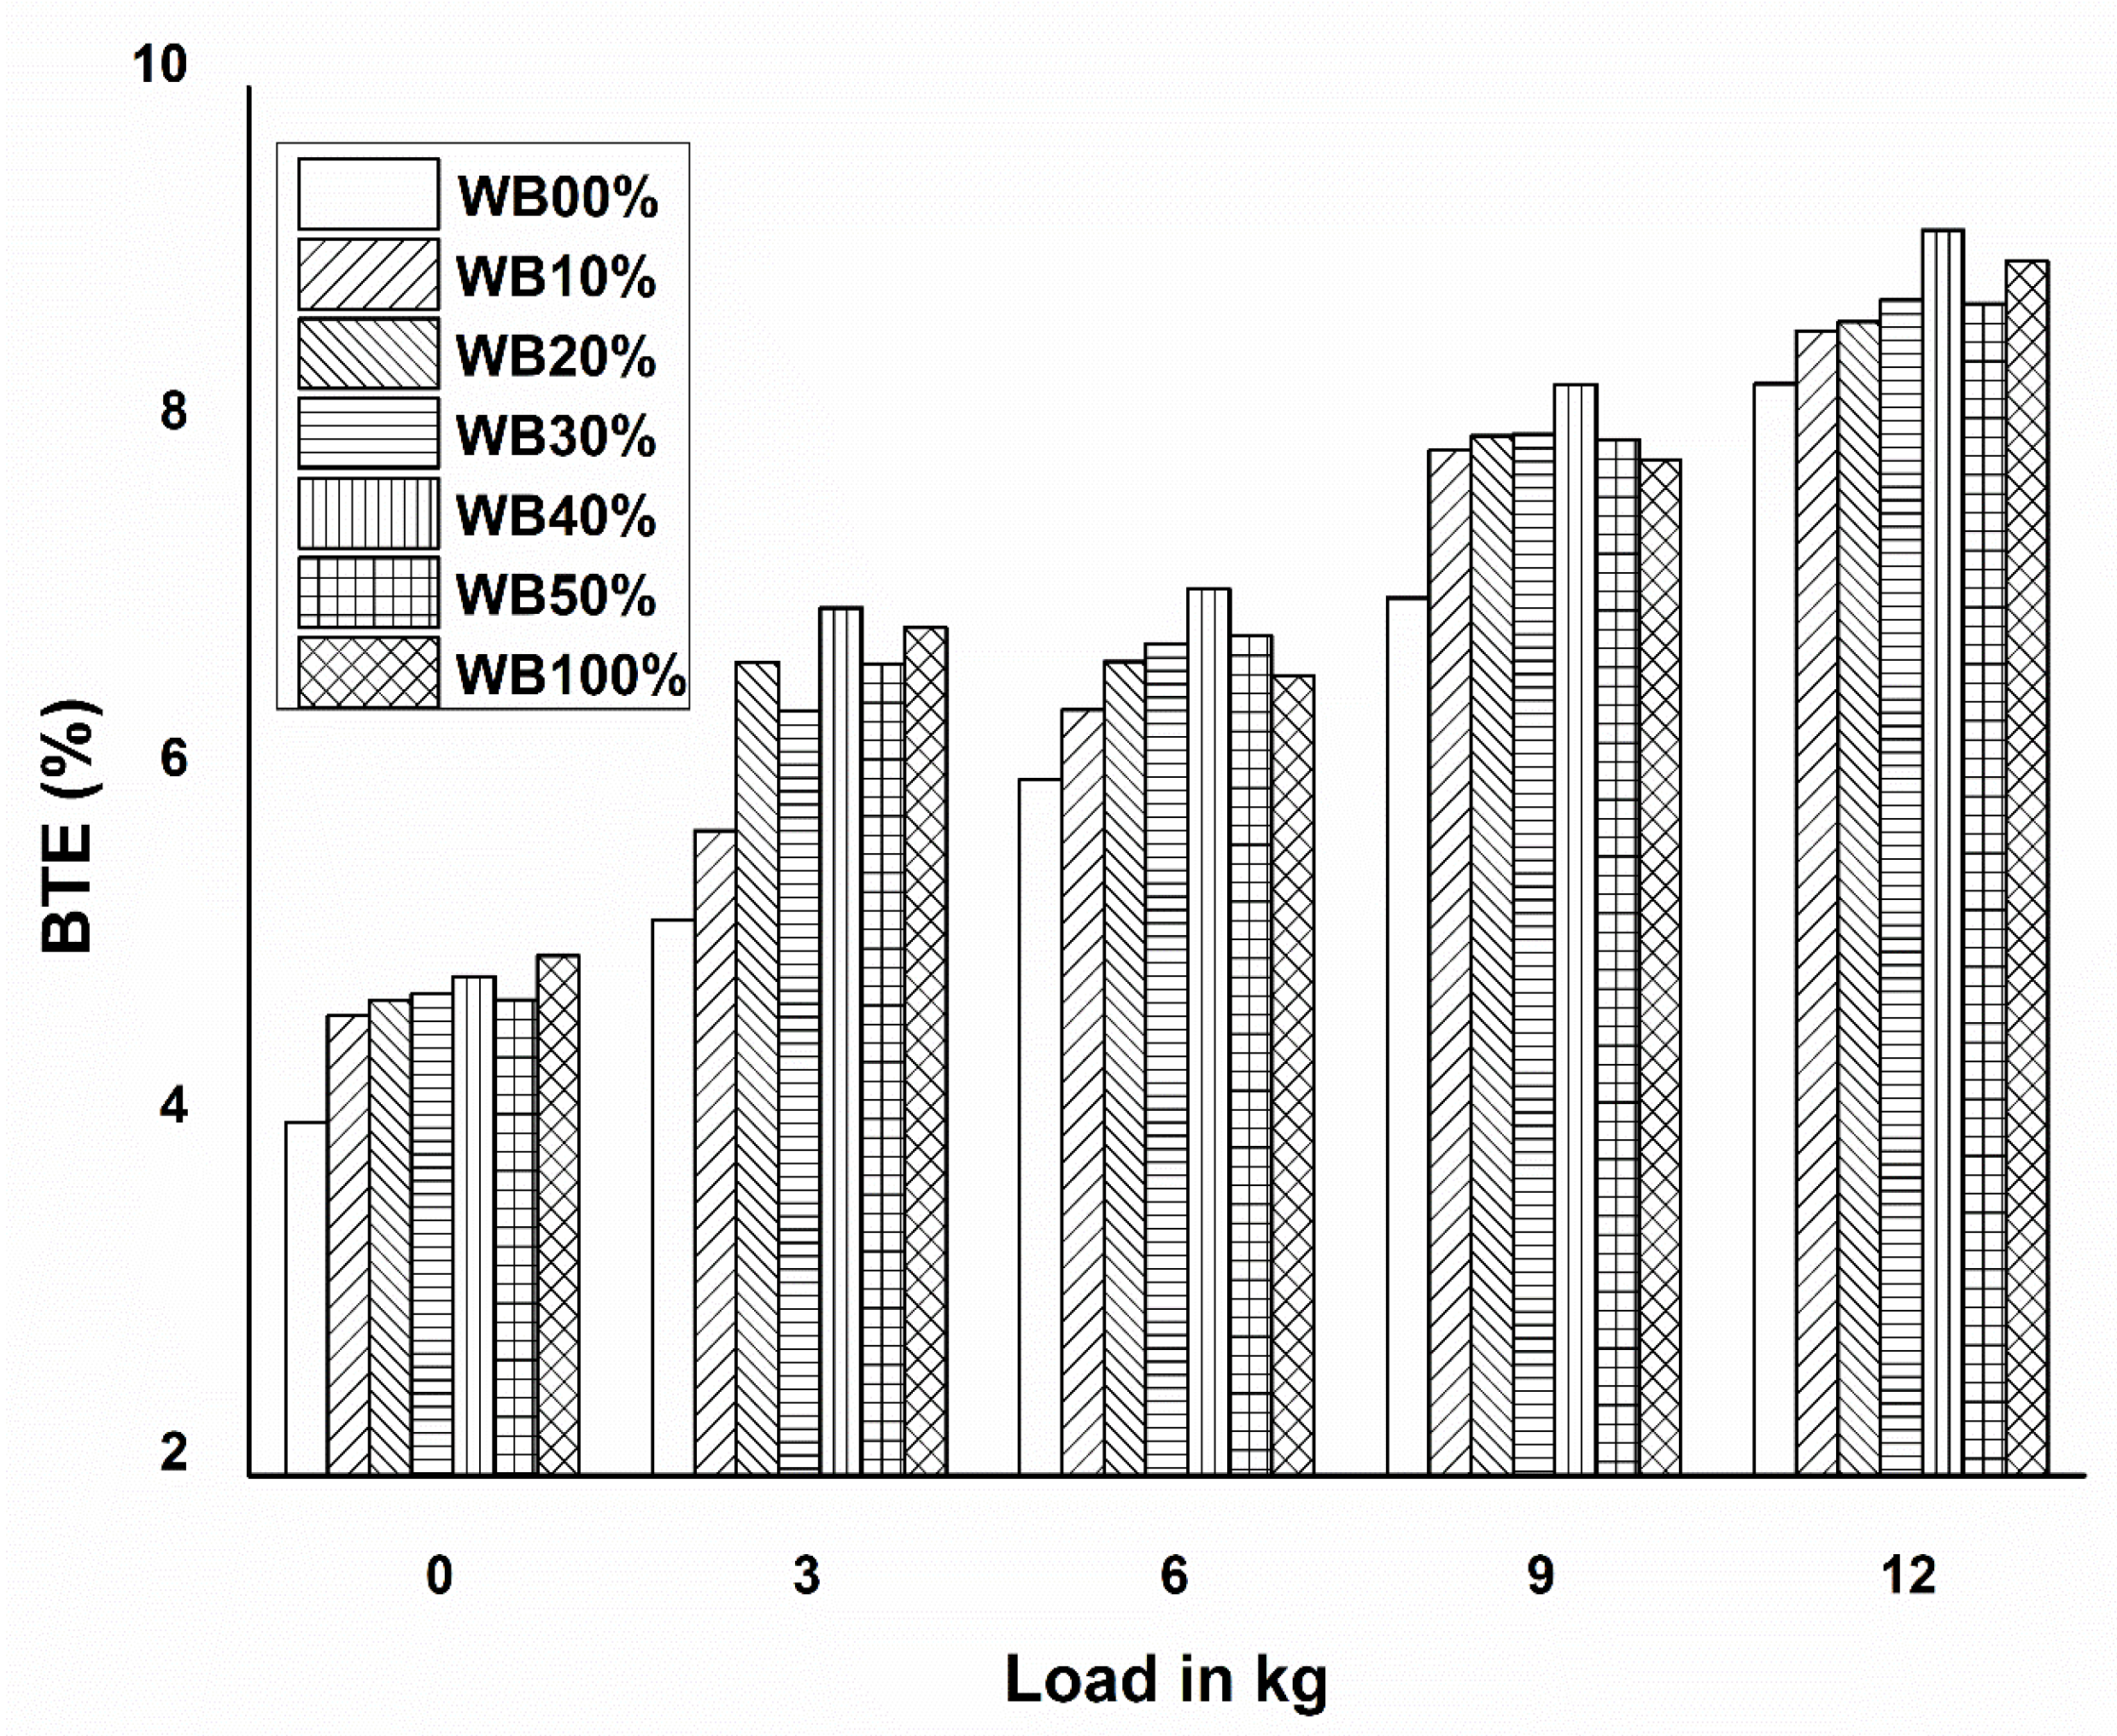
3.1.1. Effect on BTE
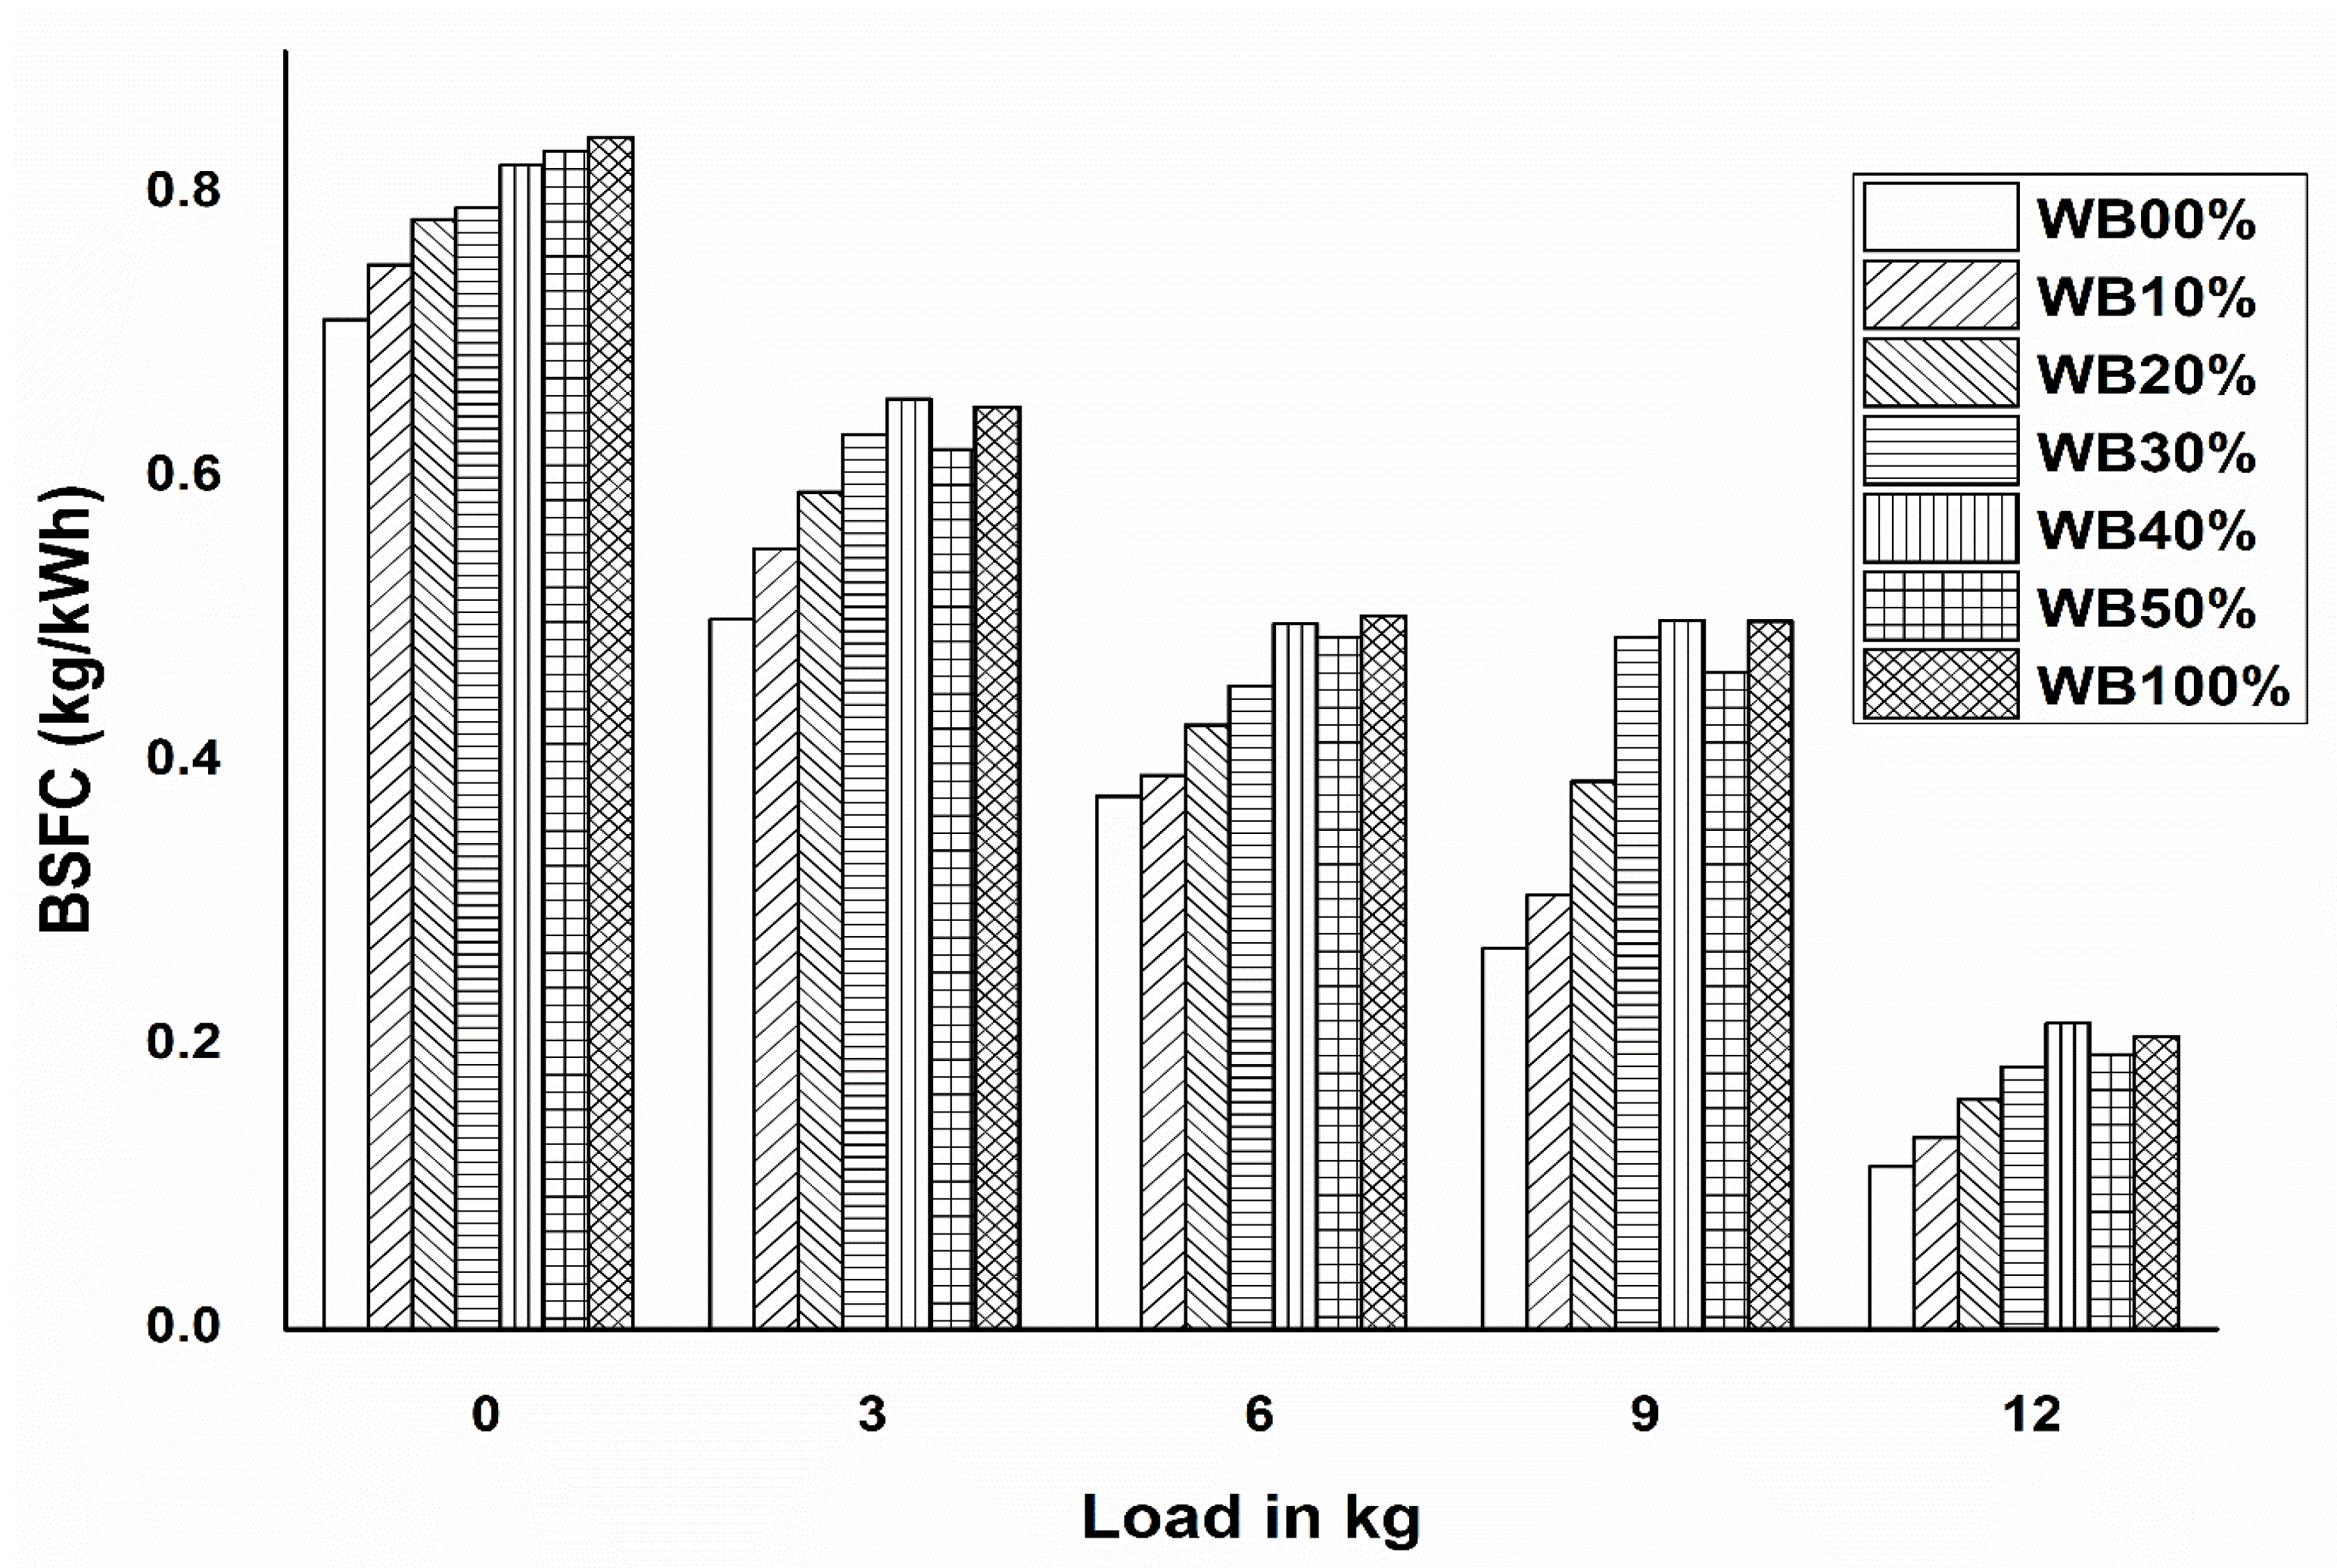
3.1.2. Effect on BSFC
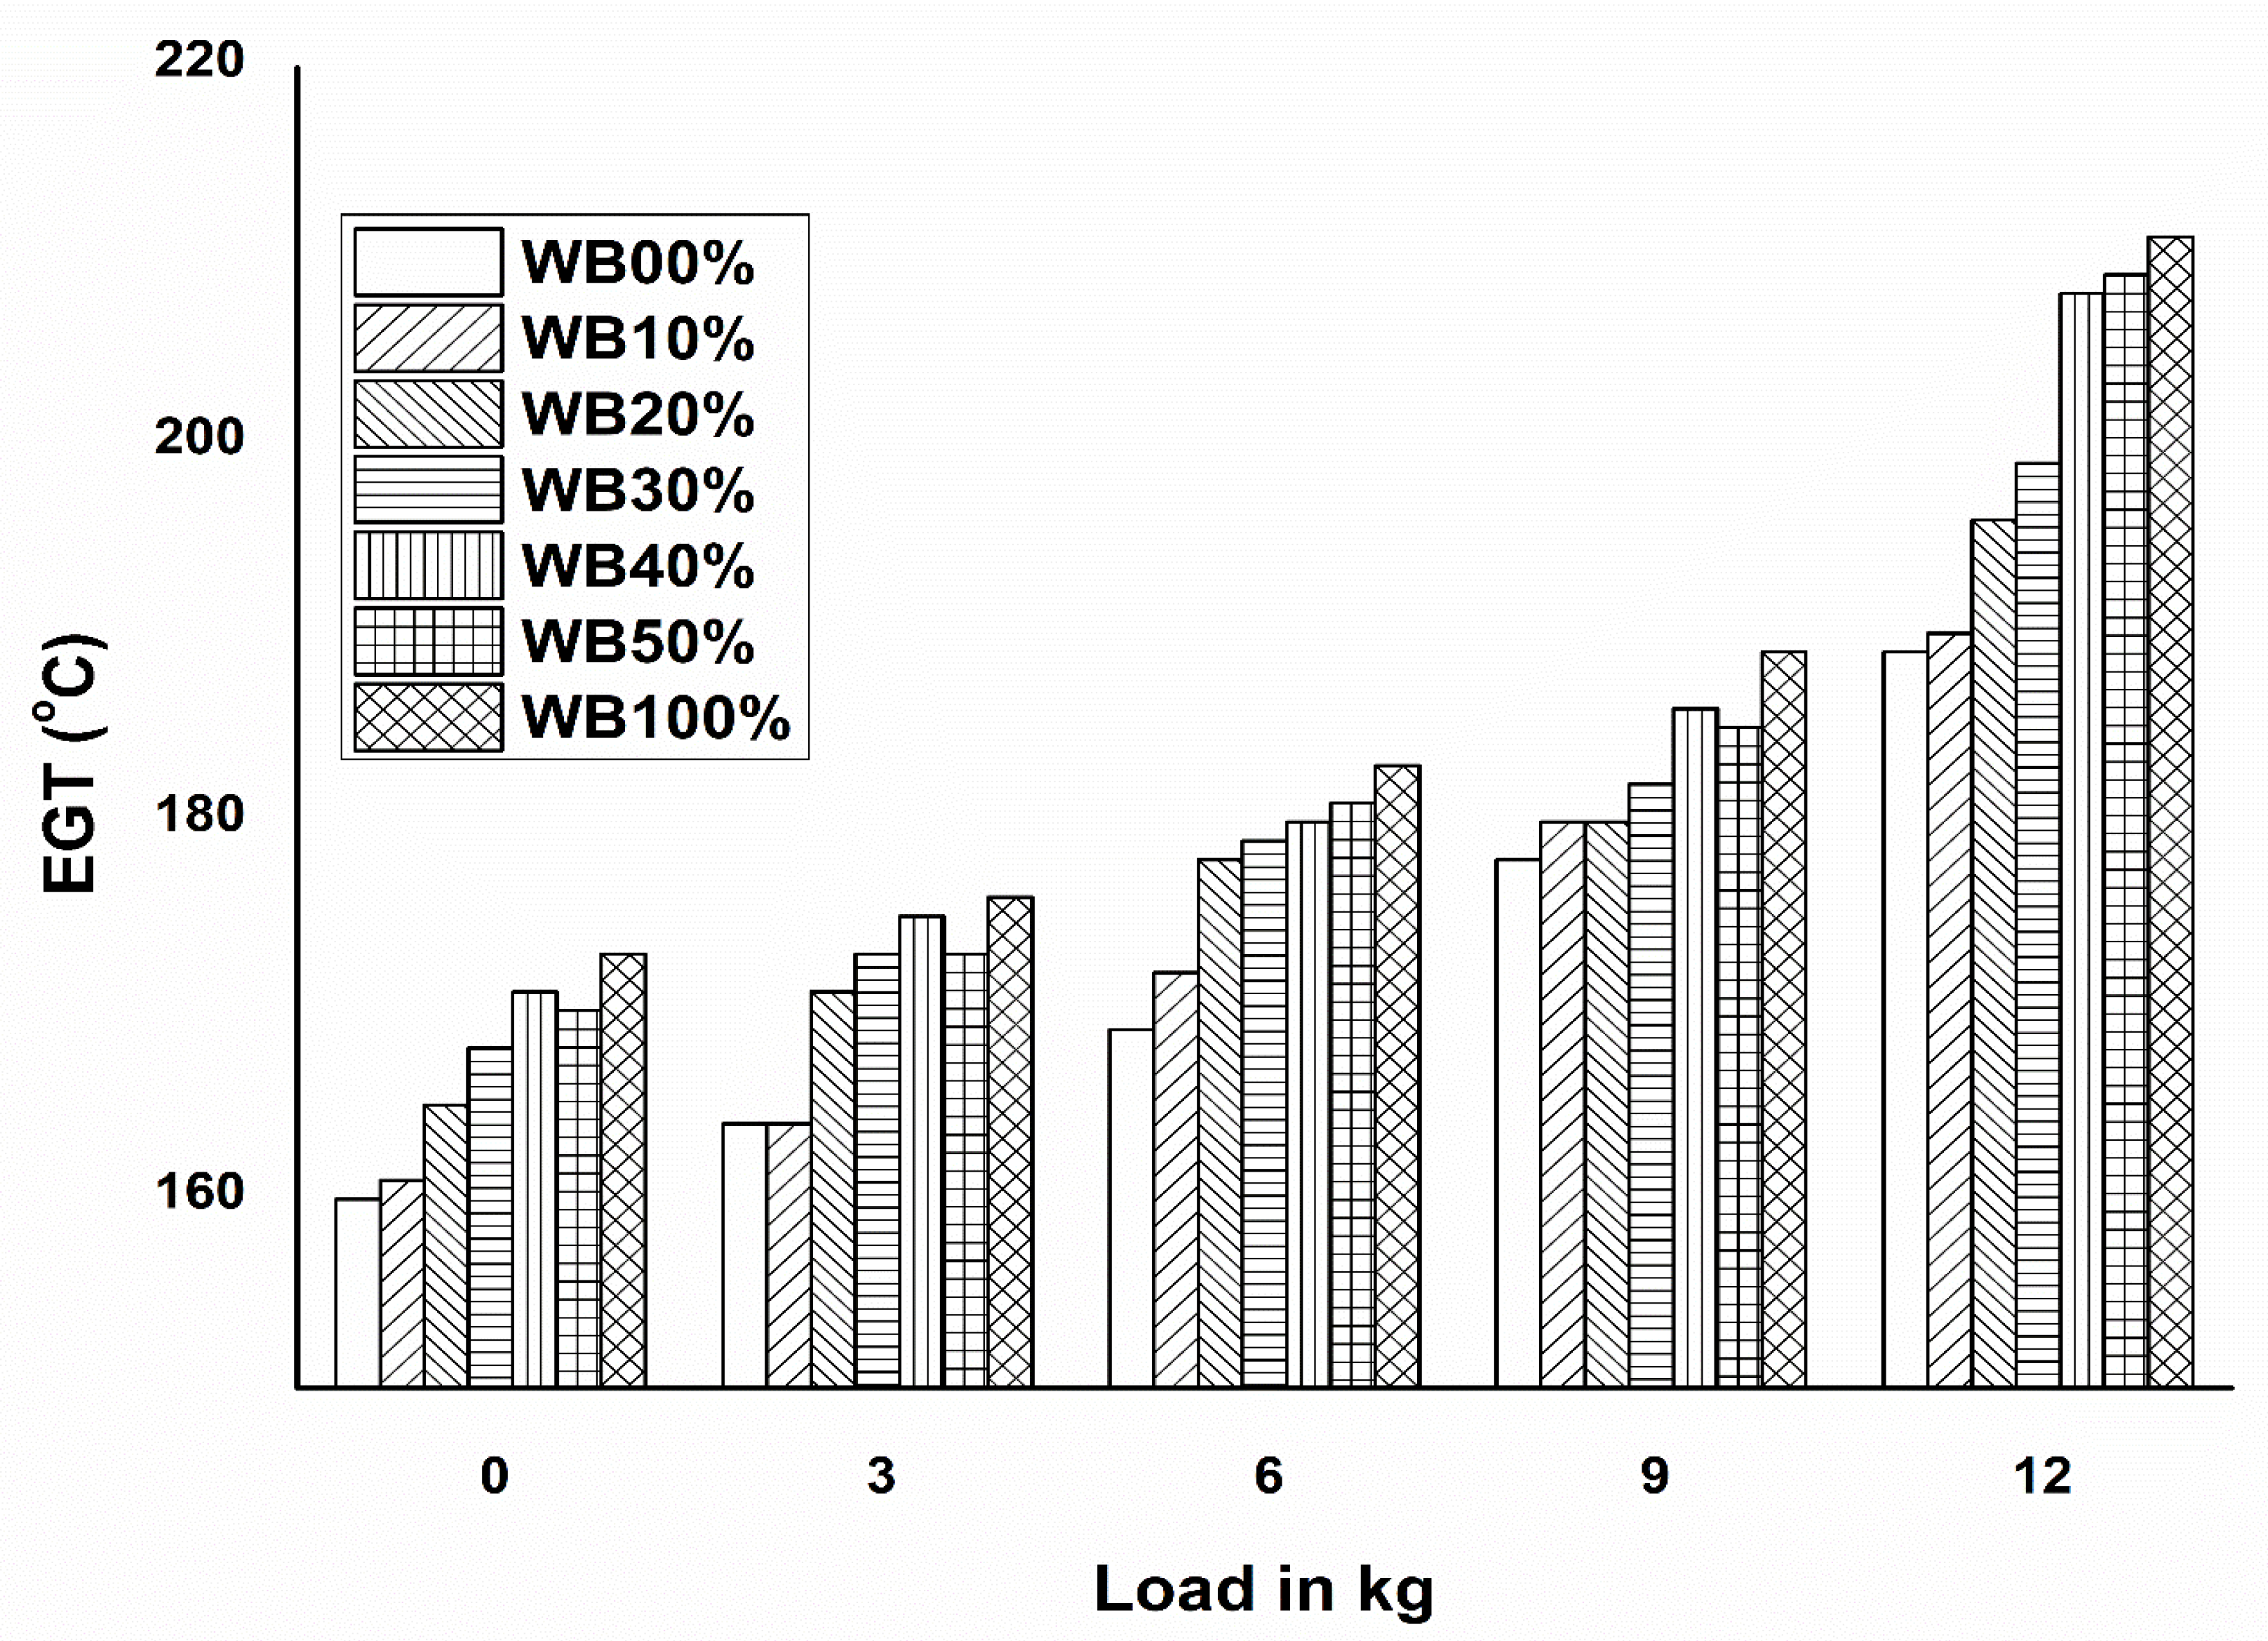
3.1.3. Effect on EGT
3.1.4. Comparison of Engine Performance
3.2. Exhaust Emission
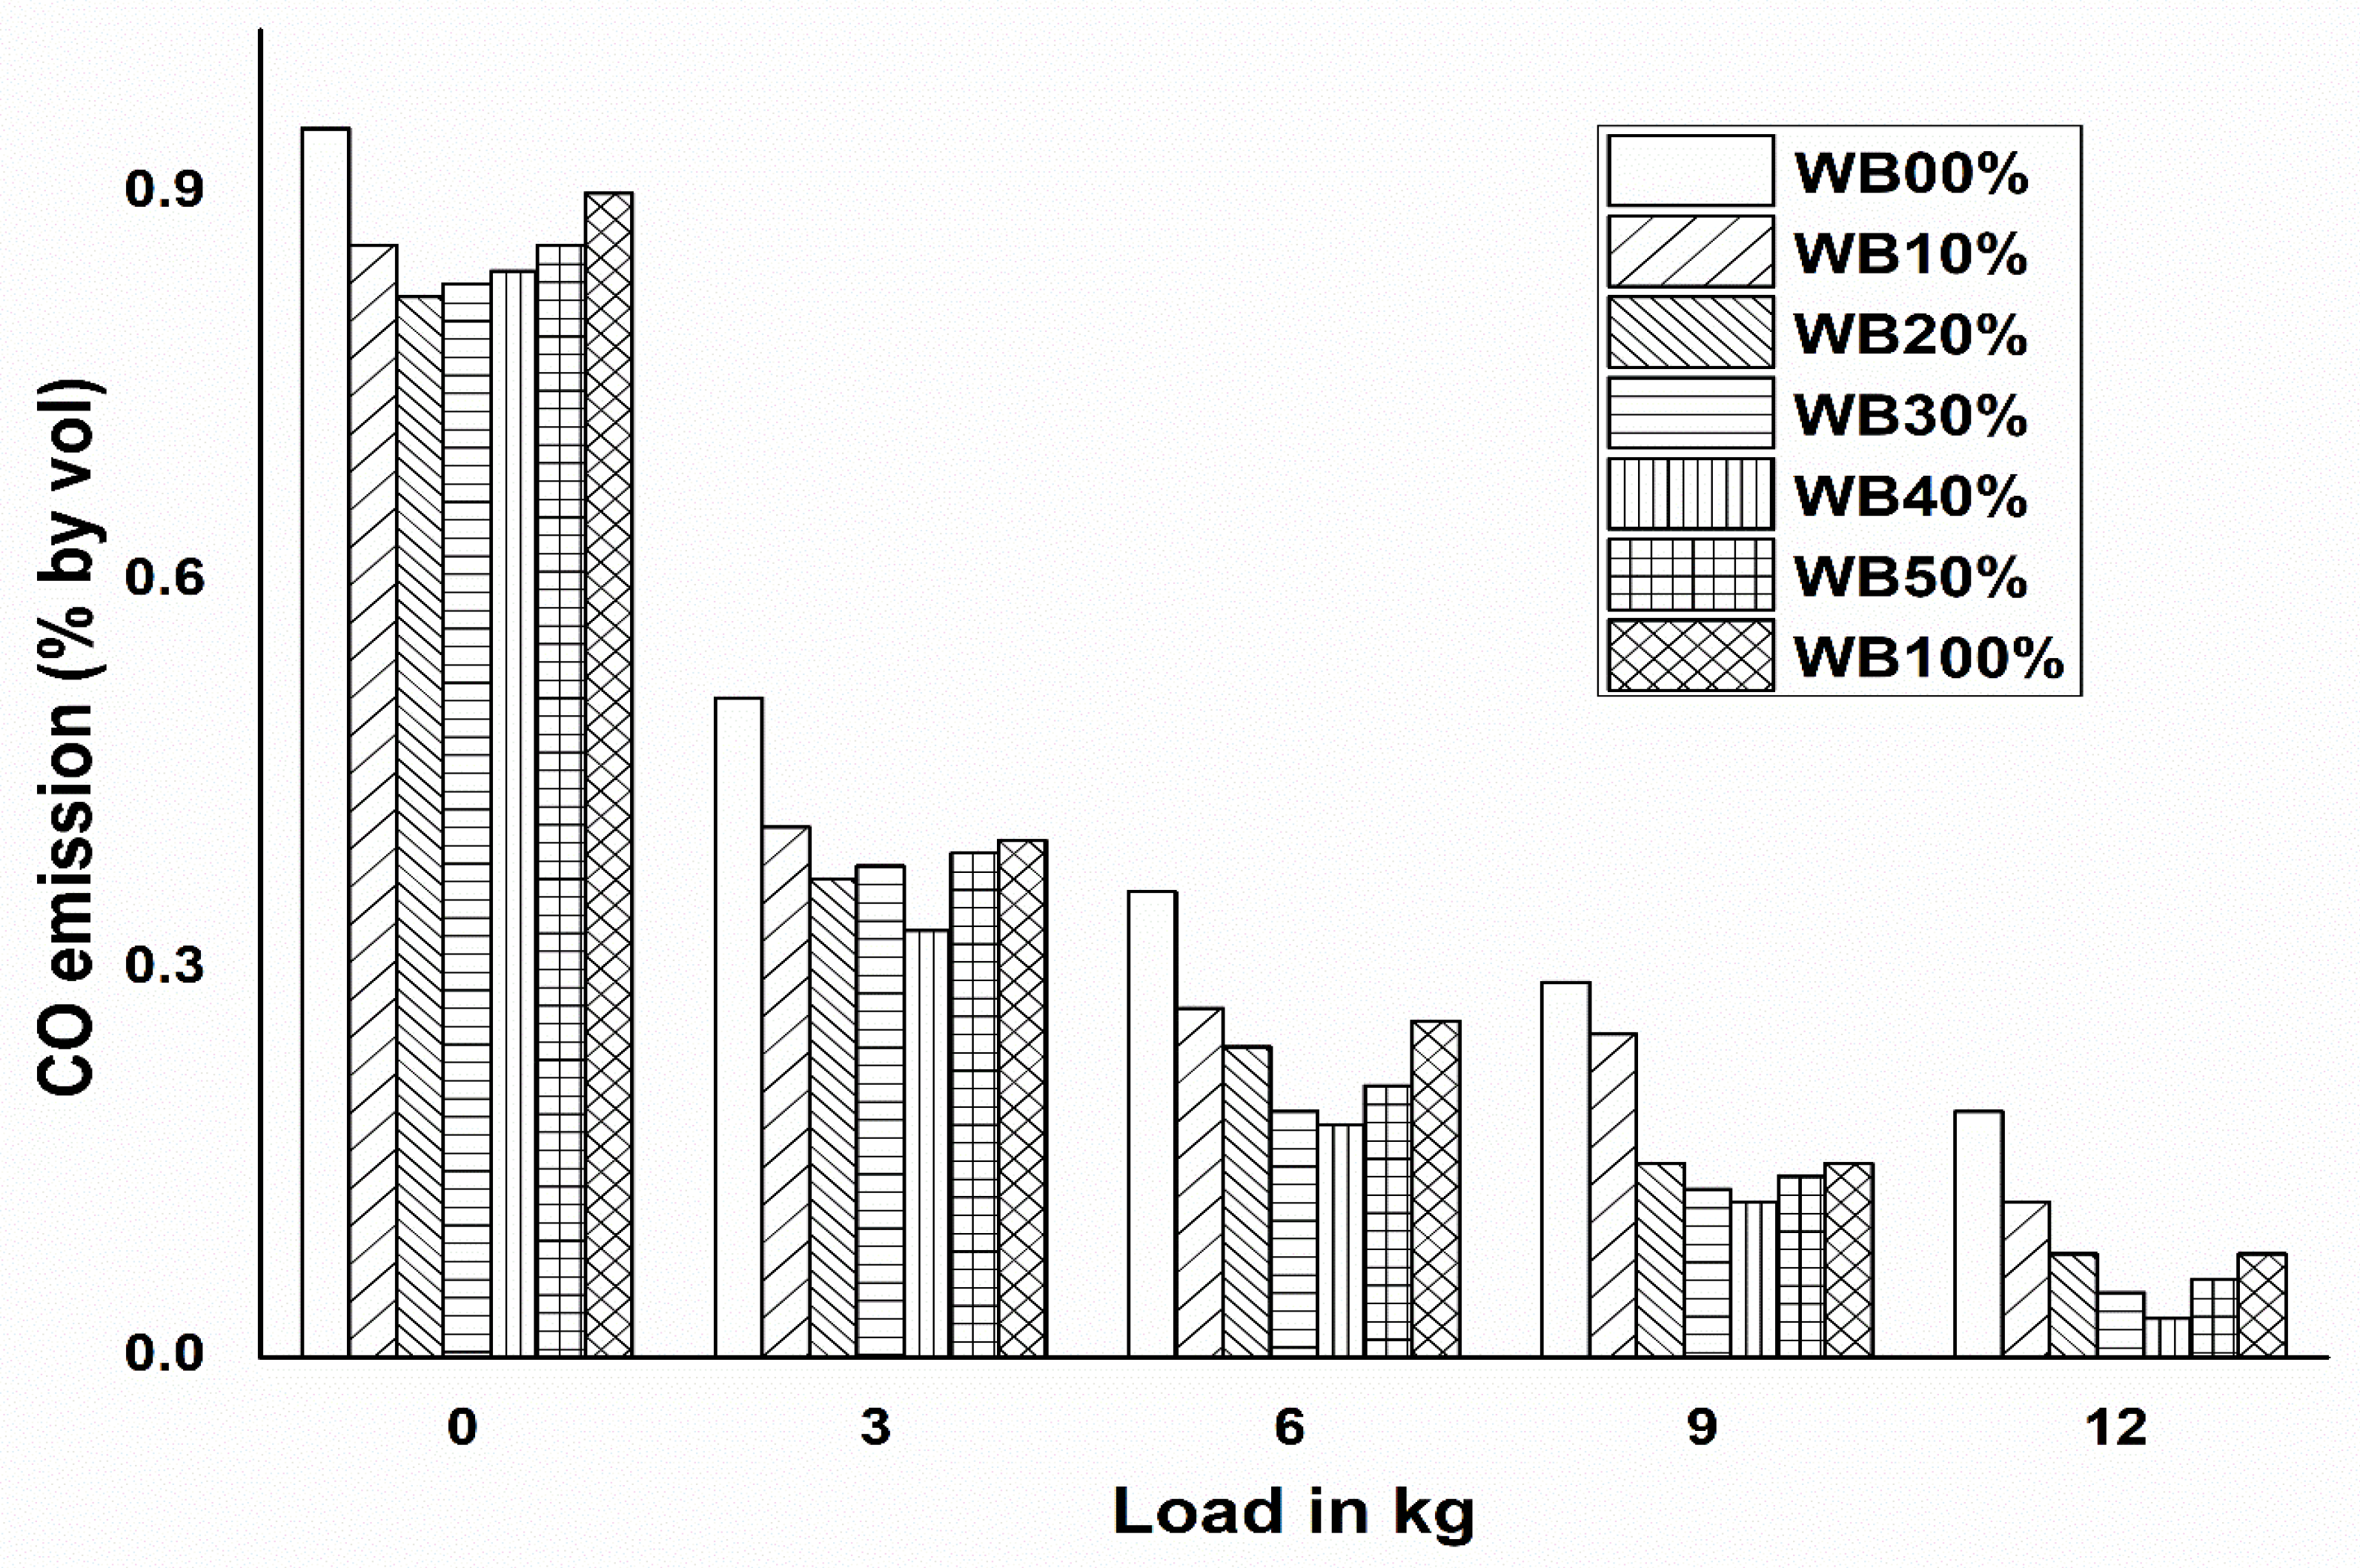
3.2.1. CO Emission
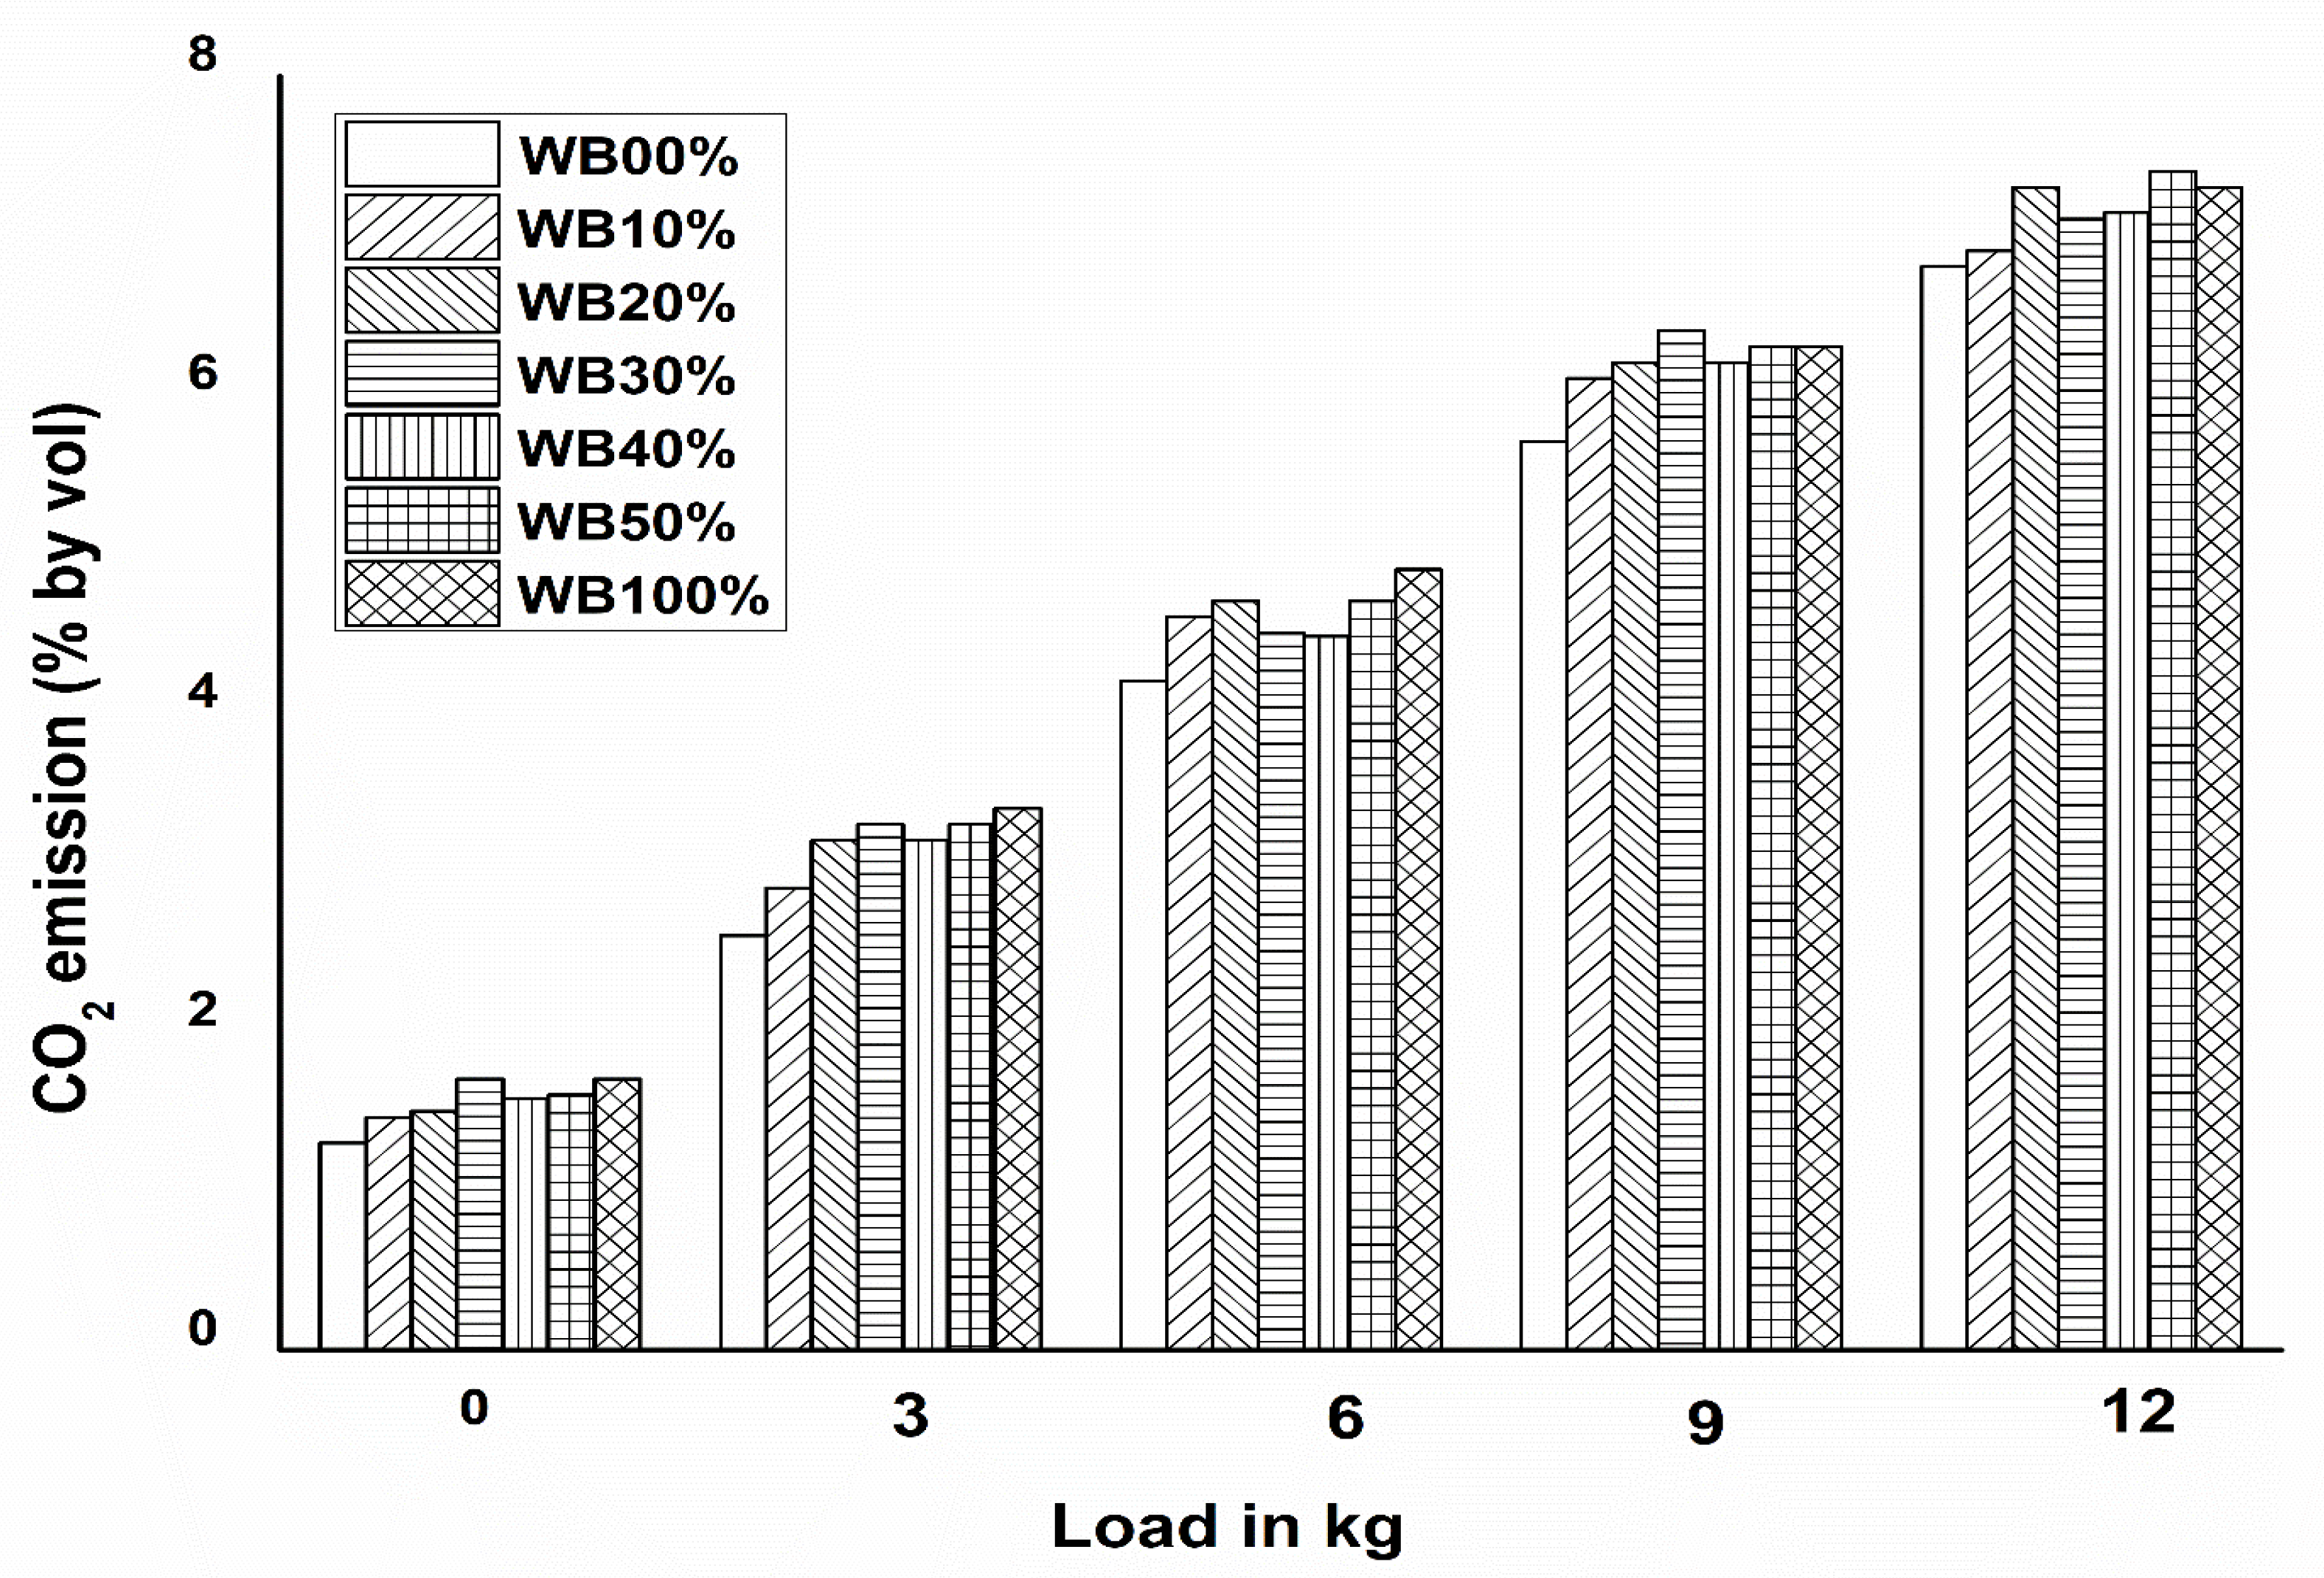
3.2.2. CO2 Emission
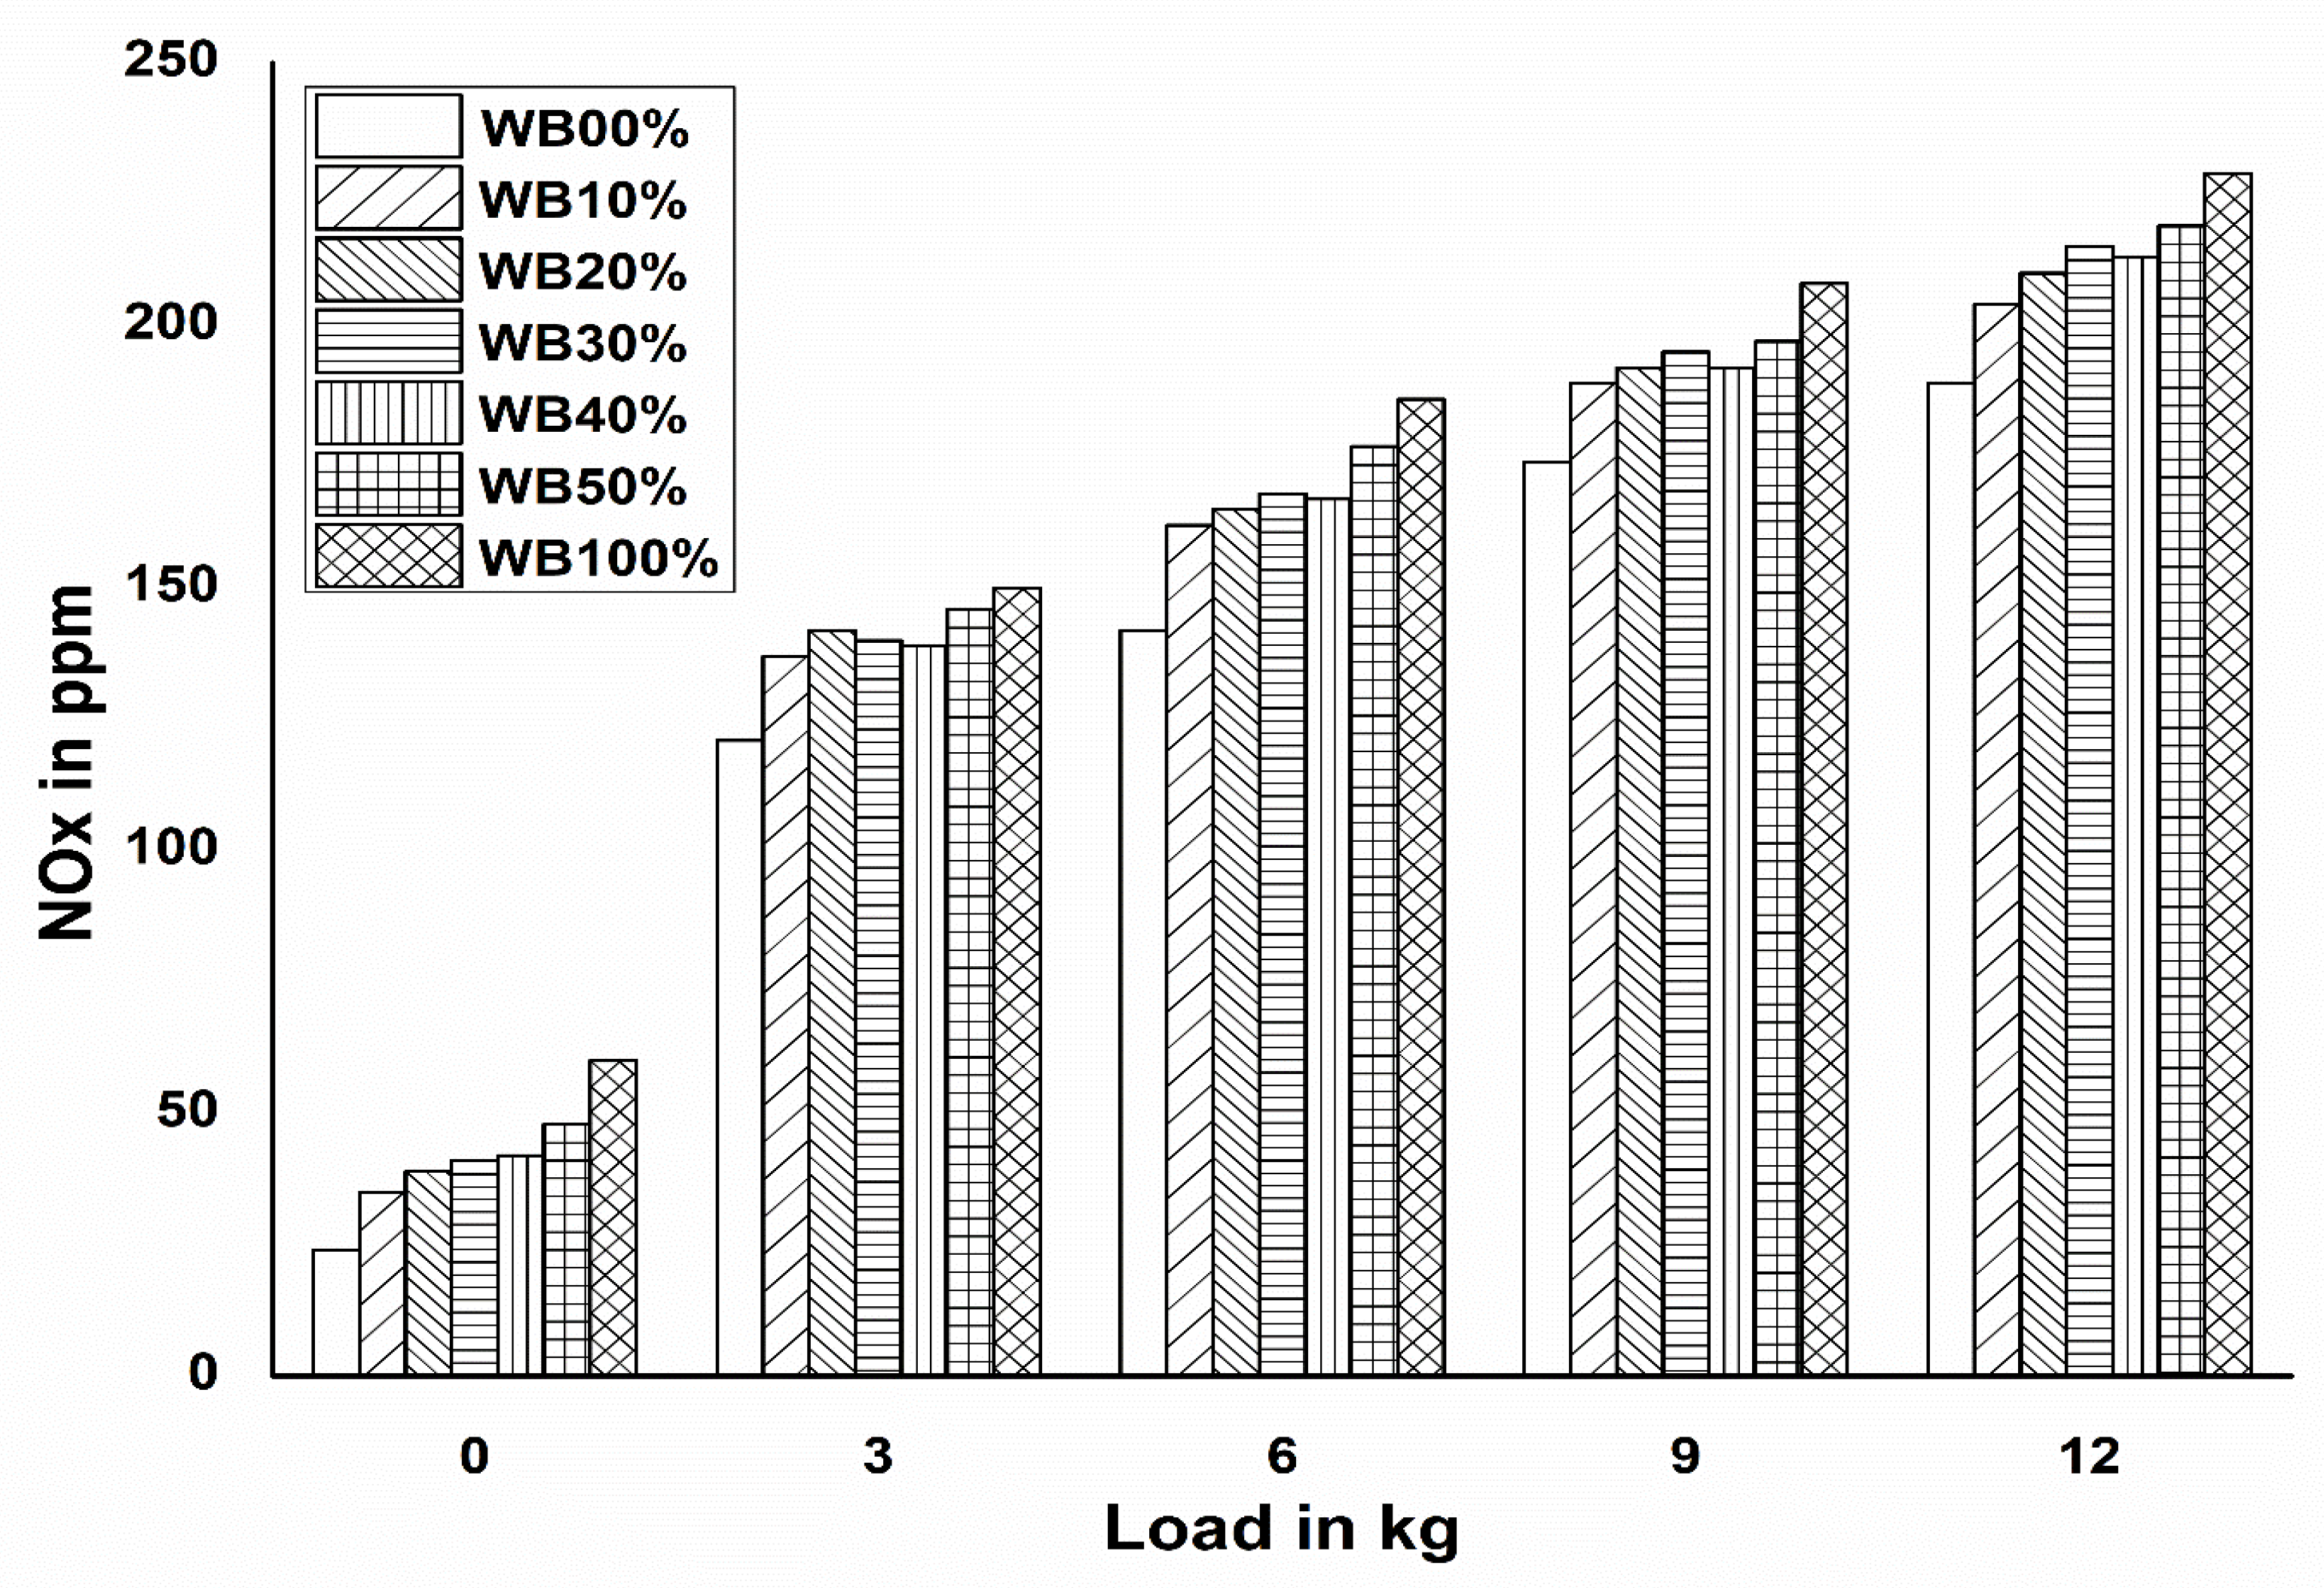
3.2.3. NOx Emission
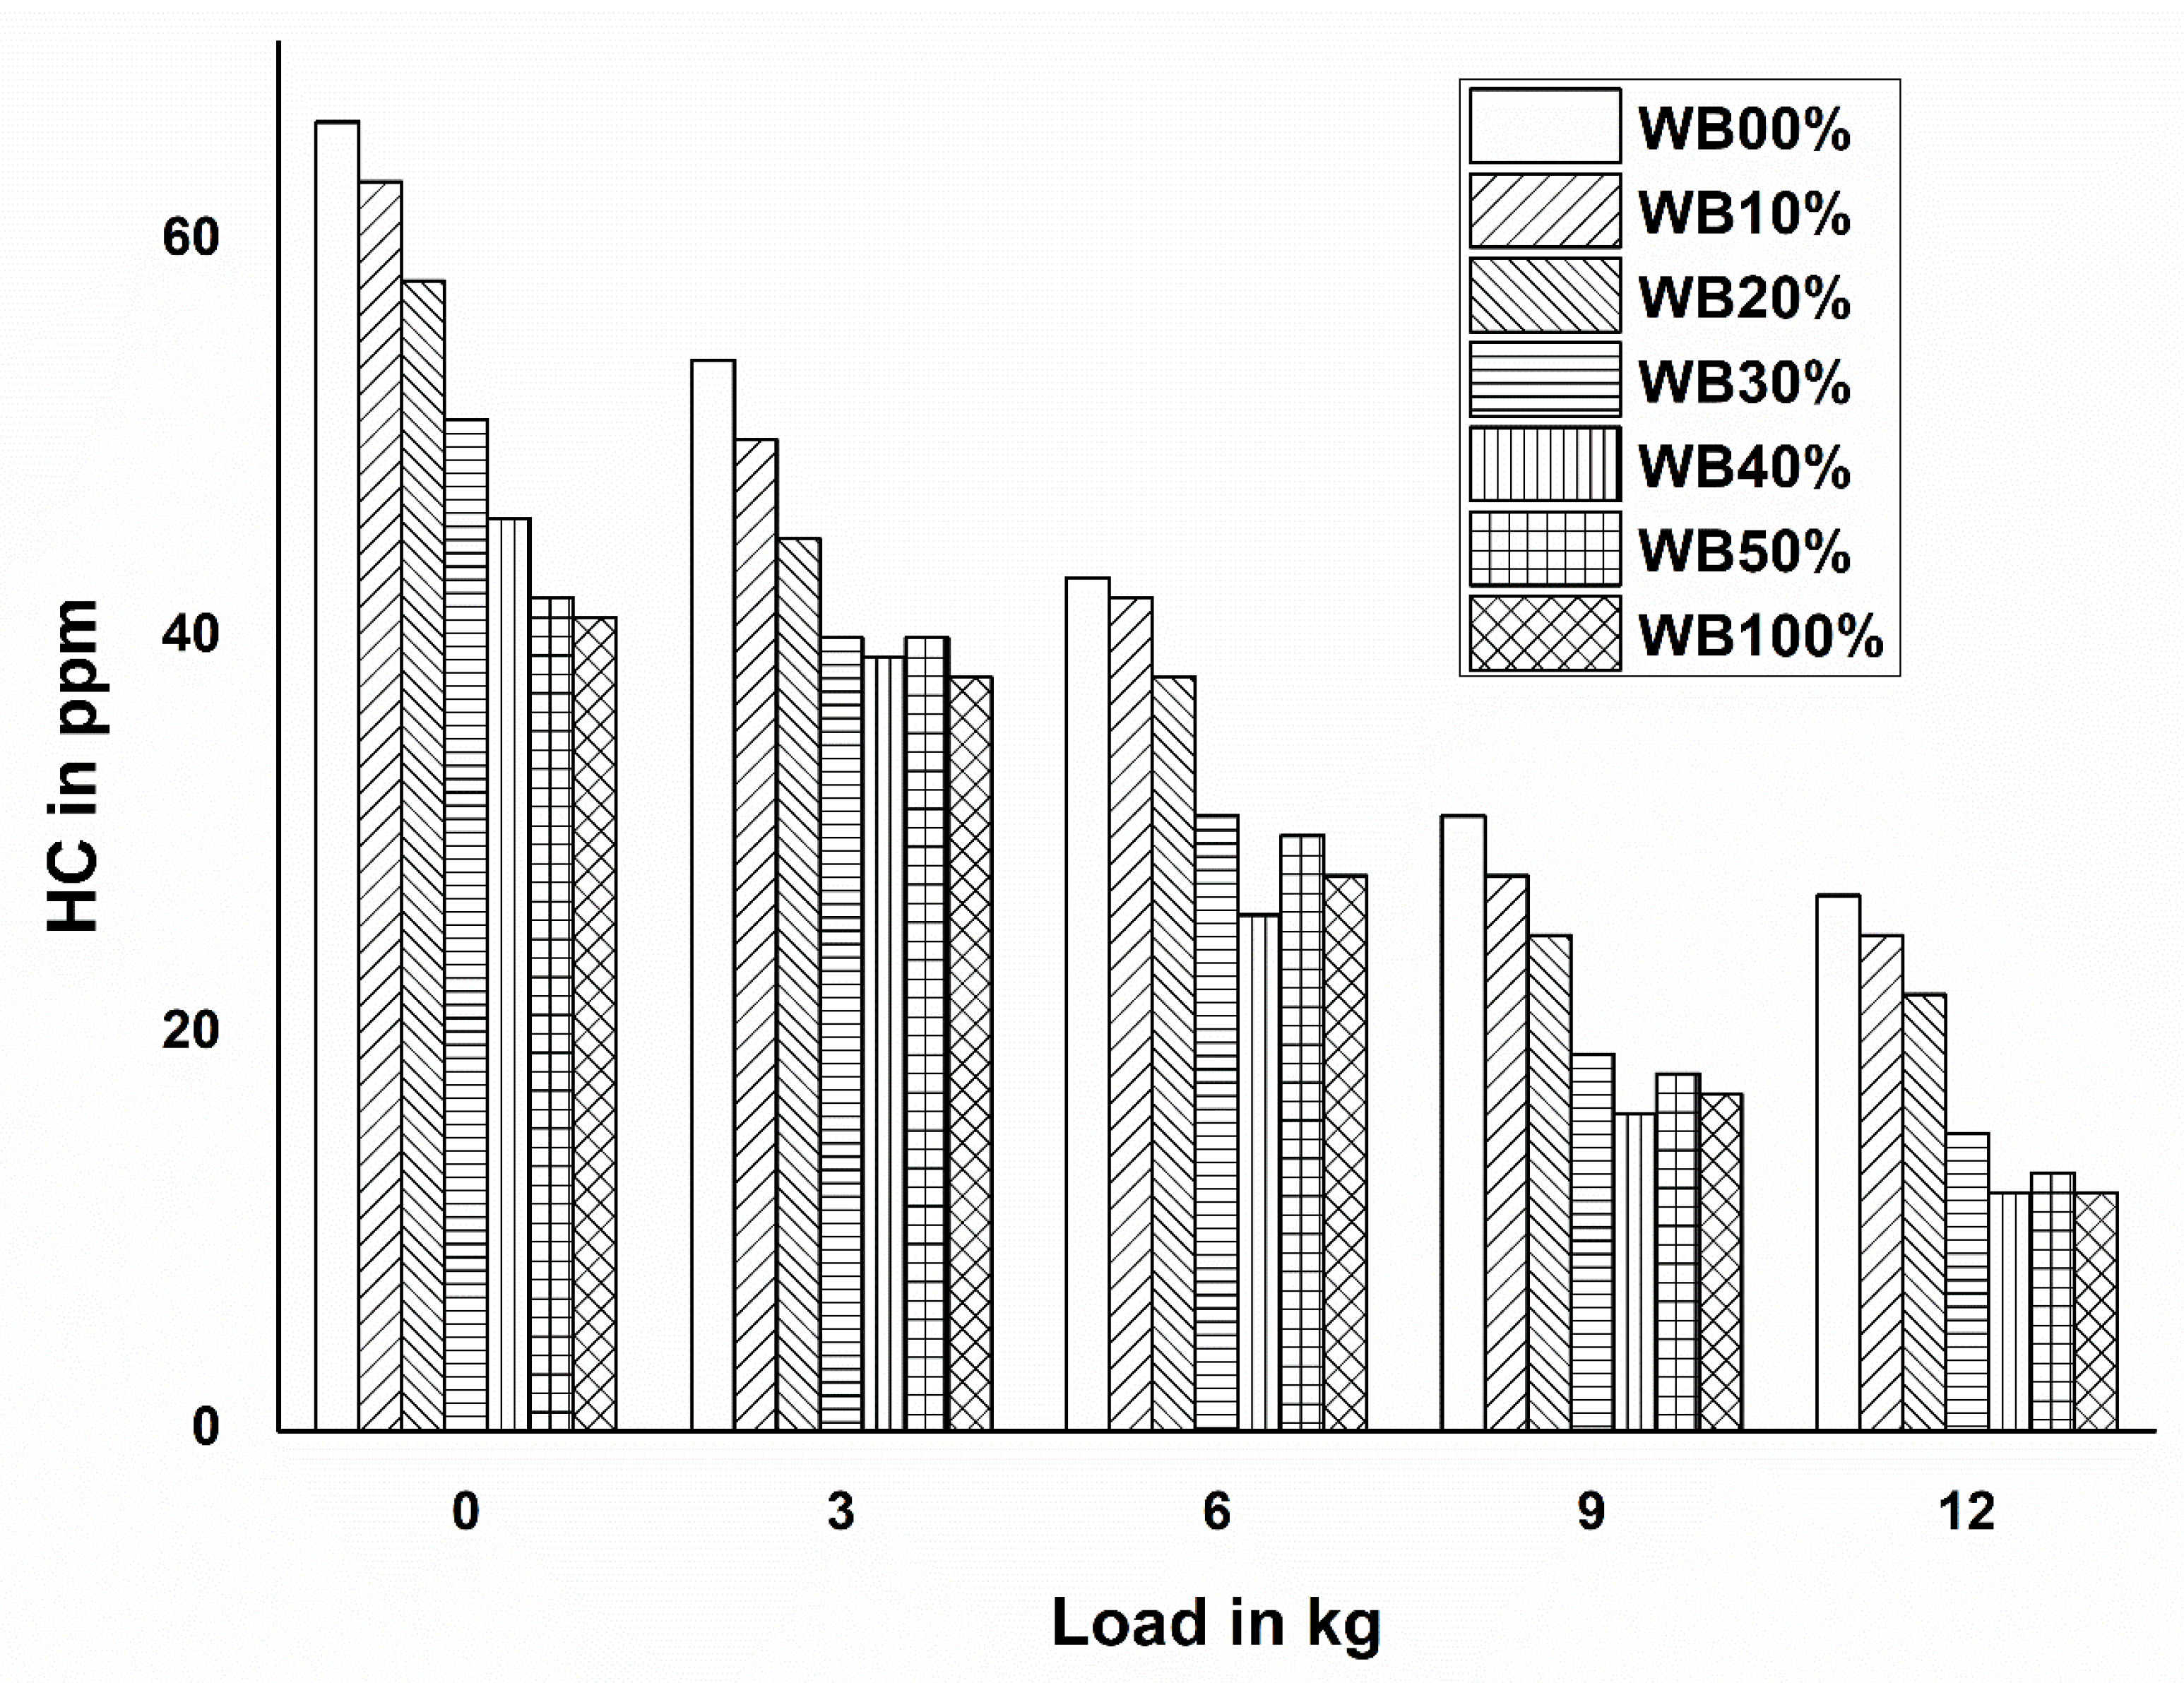
3.2.4. HC Emission
3.2.5. Comparison of Exhaust Gas Emission
3.3. Mass Balance and E-Factor
3.4. Sustainability Perspective for Biodiesel Production
4. Conclusions
Supplementary Materials
Author Contributions
Funding
Informed Consent Statement
Data Availability Statement
Acknowledgments
Conflicts of Interest
Abbreviations
| WCO | waste cooking oil |
| GJ | gigajoule |
| kW | kilowatt |
| MJ/kg | mega joules per kilogram |
| Rpm | revolutions per minute |
| bTDC | before top dead center |
| FAME | Fatty acid methyl ester |
| Mg2Zr5O12 | magnesium zirconate |
| BTE | brake thermal efficiency |
| BSFC | brake specific fuel consumption |
| EGT | exhaust gas temperature |
| CO | carbon monoxide |
| CO2 | carbon dioxide |
| NOx | nitrogen oxide |
| UHC | unburned hydrocarbon |
| IC engine | internal combustion engine |
| GHG | greenhouse gases |
| WB | waste-cooking-oil biodiesel blend |
| ppm | parts per million |
| WB00% | diesel fuel |
| WB10% | biodiesel 10%+diesel 90% |
| WB20% | biodiesel 20%+diesel 80% |
| WB30% | biodiesel 30%+diesel 70% |
| WB40% | biodiesel 40%+diesel 60% |
| WB50% | biodiesel 50%+diesel 50% |
| WB100% | biodiesel |
References
- FuturEnergy. Available online: https://futurenergyweb.es/en/the-dual-challenge-more-energy-less-carbon-is-the-biggest-challenge-facing-the-global-energy-system-over-the-next-20-years/ (accessed on 18 January 2022).
- Biodiesel Market Reports. Available online: https://www.marketsandmarkets.com/Market-Reports/Global-Biodiesel-Market-190.html (accessed on 18 January 2022).
- Biodiesel: 2020 World Market Outlook and Forecast. Available online: https://mcgroup.co.uk/researches/biodiesel (accessed on 18 January 2022).
- He, C.; Ge, Y.S.; Tan, J.W.; You, K.W.; Han, X.K.; Wang, J.F. Characteristics of polycyclic aromatic hydrocarbons emissions of diesel engine fuelled with biodiesel and diesel. Fuel 2010, 89, 2040–2046. [Google Scholar] [CrossRef]
- Atabani, A.E. A comprehensive review on biodiesel as an alternative energy resource and its characteristics. Renew. Sustain. Energy Rev. 2012, 16, 2070–2093. [Google Scholar] [CrossRef]
- Bari, S. Performance, combustion and emission tests of a metro-bus running on biodiesel-ULSD blended (B20) fuel. Appl. Energy 2014, 124, 35–43. [Google Scholar] [CrossRef]
- Teja, K.M.V.R.; Prasad, P.I.; Reddy, K.V.K.; Banapurmath, N.R.; Soudagar, M.E.M.; Hossain, N.; Afzal, A.; Saleel, C.A. Comparative Analysis of Performance, Emission, and Combustion Characteristics of a Common Rail Direct Injection Diesel Engine Powered with Three Different Biodiesel Blends. Energies 2021, 14, 5597. [Google Scholar] [CrossRef]
- Nguyen, T.N.; Khoa, N.X.; Tuan, L.A. The Correlation of Biodiesel Blends with the Common Rail Diesel Engine’s Performance and Emission Characteristics. Energies 2021, 14, 2986. [Google Scholar] [CrossRef]
- Sharma, V.; Hossain, A.K.; Duraisamy, G. Experimental Investigation of Neat Biodiesels’ Saturation Level on Combustion and Emission Characteristics in a CI Engine. Energies 2021, 14, 5203. [Google Scholar] [CrossRef]
- Can, O. Combustion characteristics, performance and exhaust emissions of a diesel engine fueled with a waste cooking oil biodiesel mixture. Energy Convers. Manag. 2014, 87, 676–686. [Google Scholar] [CrossRef]
- Behcet, R.; Aydin, H.; Llkilic, C.; Iscan, B.; Aydin, S. Diesel engine applications for evaluation of performance and emission behavior of biodiesel from different oil stocks. Environ. Prog. Sustain. Energy 2014, 34, 890–896. [Google Scholar] [CrossRef]
- Ashrafur Rahman, S.M.; Masjuki, H.H.; Kalam, M.A.; Abedin, M.J.; Sanjid, A.; Mofijur Rahman, M.D. Assessing idling effects on a compression ignition engine fueled with Jatropha and Palm biodiesel blends. Renew. Energy 2014, 68, 644–650. [Google Scholar] [CrossRef]
- Hassan, N.M.S.; Rasul, M.G.; Harch, C.A. Modelling and experimental investigation of engine performance and emissions fuelled with biodiesel produced from Australian Beauty Leaf Tree. Fuel 2015, 150, 625–635. [Google Scholar] [CrossRef]
- Banapurmath, N.R.; Tewari, P.G.; Hosmath, R.S. Combustion and emission characteristics of a direct injection, compression-ignition engine when operated on honge oil, HOME and blends of HOME and diesel. Int. J. Sustain. Eng. 2009, 2, 192–200. [Google Scholar] [CrossRef]
- Mandal, A.; Cho, H.; Chauhan, B.S. Experimental Investigation of Multiple Fry Waste Soya Bean Oil in an Agricultural CI Engine. Energies 2022, 15, 3209. [Google Scholar] [CrossRef]
- Ali, N.; Sebzali, M.; Safar, A.; Al-Khatib, F. A feasibility study of using waste cooking oil as a form of energy in Kuwait. International Conference on Sustainable Mobility Applications. In Proceedings of the 2015 International Conference on Sustainable Mobility Applications, Renewables and Technology (SMART), Kuwait City, Kuwait, 23–25 November 2015; pp. 1–5. [Google Scholar] [CrossRef]
- Li, H.L.; Yu, P.H. Conversion of waste cooking oils into environmentally friendly biodiesel. Springer Plus 2015, 4, P7. [Google Scholar] [CrossRef] [Green Version]
- Singh, V.; Belova, L.; Singh, B.; Sharma, Y.C. Biodiesel production using a novel heterogeneous catalyst, magnesium zirconate (Mg2Zr5O12): Process optimization through response surface methodology (RSM). Energy Convers. Manag. 2018, 174, 198–207. [Google Scholar] [CrossRef]
- Kline, S.J. The Purposes of Uncertainty Analysis. J. Fluids Eng. Jun. 1985, 107, 153–160. [Google Scholar] [CrossRef]
- An, H.; Yang, W.M.; Maghbouli, A.; Li, J.; Chou, S.K.; Chua, K.J. Performance, combustion and emission characteristics of biodiesel derived from waste cooking oils. Appl. Energy 2013, 112, 493–499. [Google Scholar] [CrossRef]
- Utlua, Z.; Kocak, M.S. The effect of biodiesel fuel obtained from waste frying oil on direct injection diesel engine performance and exhaust emissions. Renew. Energy 2008, 33, 1936–1941. [Google Scholar] [CrossRef]
- Zhu, L.; Cheung, C.S.; Zhang, W.G.; Huang, Z. Combustion, performance and emission characteristics of a DI diesel engine fuelled with ethanol–biodiesel blends. Fuel 2011, 90, 1743–1750. [Google Scholar] [CrossRef]
- Anand, R.; Kannan, G.R.; Nagarajan, S.; Velmathi, S. Performance Emission and Combustion Characteristics of a Diesel Engine Fueled with Biodiesel Produced from Waste Cooking Oil; SAE Technical Paper; SAE International: Warrendale, PA, USA, 2010. [Google Scholar] [CrossRef]
- Aksoy, F. Analyzing the effects of methyl esters produced from raw soybean and waste frying oil on engine performance and NOx emission. Energy Sources Part A 2012, 34, 143–151. [Google Scholar] [CrossRef]
- Macor, A.; Avella, F.; Faedo, D. Effects of 30% v/v biodiesel/diesel fuel blend on regulated and unregulated pollutant emissions from diesel engines. Appl. Energy 2011, 88, 4989–5001. [Google Scholar] [CrossRef]
- Raheman, H.; Phadatare, A.G. Diesel engine emissions and performance from blends of karanja methyl ester and diesel. Biomass Bioenergy 2004, 27, 393–397. [Google Scholar] [CrossRef]
- Lin, B.; Huang, J.H.; Huang, D.Y. Experimental study of the effects of vegetable oil methyl ester on DI diesel engine performance characteristics and pollutant emissions. Fuel 2009, 88, 1779–1785. [Google Scholar] [CrossRef]
- Nagaraja, S.; Rufuss, D.D.W. Performance optimization of preheated palm oil-diesel blends using integrated response surface methodology and analysis of variance. Biocatal. Agric. Biotechnol. 2022, 40, 102278–102295. [Google Scholar] [CrossRef]
- Yasina, M.H.M.; Mamata, R.; Yusopa, A.F.; Idrisa, D.M.N.D.; Yusafb, T.; Najafid, G.; Rasulc, M. Study of a diesel engine performance with exhaust gas recirculation (EGR) system fuelled with palm biodiesel. Energy Procedia 2017, 110, 26–31. [Google Scholar] [CrossRef] [Green Version]
- Lin, Y.C.; Hsu, K.H.; Chen, C.B. Experimental investigation of the performance and emissions of a heavy-duty diesel engine fuelled with waste cooking oil bio- diesel/ultra-low sulfur diesel blends. Energy 2011, 36, 241–248. [Google Scholar] [CrossRef]
- Shirneshan, A. HC, CO, CO2 and NOx emission evaluation of a diesel engine fueled with waste frying oil methyl ester. Procedia Soc. Behav. Sci. 2013, 75, 292–297. [Google Scholar] [CrossRef] [Green Version]
- Pugazhvadivu, M.; Jeyachandran, K. Investigations on the performance and exhaust emissions of a diesel engine using preheated waste frying oil as fuel. Renew. Energy 2005, 30, 2189–2202. [Google Scholar] [CrossRef]
- Yoon, S.H.; Lee, C.S. Experimental investigation on the combustion and exhaust emission characteristics of biogas—Biodiesel dual-fuel combustion in a CI engine. Fuel Process. Technol. 2011, 92, 992–1000. [Google Scholar] [CrossRef]
- Hansen, A.C.; Gratton, M.R.; Yuan, W. Diesel engine performance and NOx emissions from oxygenated biofuels and blends with diesel fuel. Trans. Am. Soc. Agric. Biol. Eng. 2006, 49, 589–595. [Google Scholar] [CrossRef]
- Lapuerta, M.; Herreros, J.M.; Lyons, L.L.; García-Contreras, R.; Briceno, Y. Effect of the alcohol type used in the production of waste cooking oil biodiesel on diesel performance and emissions. Fuel 2008, 87, 3161–3179. [Google Scholar] [CrossRef]
- Koçak, M.S.; Ileri, E.; Utlu, Z. Experimental study of emission parameters of biodiesel fuels obtained from canola, hazelnut, and waste cooking oils. Energy Fuels 2007, 21, 3622–3626. [Google Scholar] [CrossRef]
- Ozsezen, A.N.; Canakci, M. The emission analysis of an IDI diesel engine fuelled with methyl ester of waste frying palm oil and its blends. Biomass Bioenergy 2010, 34, 1870–1878. [Google Scholar] [CrossRef]
- Wu, F.; Wang, J.; Chen, W.; Shuai, S. A study on emission performance of a diesel engine fueled with five typical methyl ester biodiesels. Atmos. Environ. 2009, 45, 1481–1485. [Google Scholar] [CrossRef]
- Attia, A.M.A.; Hassaneen, A.E. Influence of diesel fuel blended with biodiesel produced from waste cooking oil on diesel engine performance. Fuel 2016, 167, 316–328. [Google Scholar] [CrossRef]
- Elkelawy, M.; Etaiw, S.E.-D.H.; Bastawissi, H.A.-E.; Marie, H.; Radwan, A.M.; Dawood, M.M.; Panchal, H. WCO biodiesel production by heterogeneous catalyst and using cadmium (II) based supramolecular coordination polymer additives to improve diesel/biodiesel fueled engine performance and emissions. J. Therm. Anal. Calorim. 2021, 147, 6375–6391. [Google Scholar] [CrossRef]
- EU: Heavy Duty Truck and Bus Engines Emission Standards. Available online: https://dieselnet.com/standards/eu/hd.php (accessed on 25 January 2022).
- Kongjao, S.; Damronglerd, S.; Hunsom, M. Purification of crude glycerol derived from waste used-oil methyl ester plant. Korean J. Chem. Eng. 2010, 27, 944–949. [Google Scholar] [CrossRef]
- Sheldon, R.A. The E factor 25 years on: The rise of green chemistry and sustainability. Green Chem. 2017, 19, 18–43. [Google Scholar] [CrossRef]
- Sharma, Y.C.; Singh, V. Microalgal biodiesel: A possible solution for India’s energy security. Renew. Sustain. Energy Rev. 2017, 67, 72–88. [Google Scholar] [CrossRef]
- Živković, S.; Veljković, M. Environmental impacts the of production and use of biodiesel. Environ. Sci. Pollut. Res. Int. 2018, 25, 191–199. [Google Scholar] [CrossRef]


| Analysis | Purpose | Result |
|---|---|---|
| Thermogravimetric analysis (TGA) | To study decomposition behavior of material | Calcination temperature 900 °C |
| X-ray diffraction (XRD) | To detect crystallinity of a catalyst | The XRD peaks corresponding to standard JCPDS data No: 80-0967 indicates rhombohedral Mg2Zr5O12 phase |
| Attenuated total reflectance–Fourier-infrared spectra (ATR–FTIR) | To detect the presence functional group in catalyst | The intense absorption peaks at 835, 620, 530, and 490 cm−1 due to Zr-O, Zr-O-Zr, and Mg-O stretching frequency |
| Scanning electron microscopy (SEM) | To explore surface morphology of catalyst | Agglomeration and non-uniform particles |
| Energy dispersive X-ray spectroscopy (EDS) | To analyze elements in catalyst | Catalyst contains 10.5 wt.% Mg, 63.25 wt.% Zr, and 26.25 wt.% O content |
| Surface area | To measure the surface area of catalyst | Single point surface area of catalyst at P/Po 0.310432720 was 6.7842 m2/g; Langmuir surface area was 10.1937 m2/g and BET surface area was 6.7976 m2/g |
| Basicity (Hammett indicator benzene carboxylic acid titration method) | To calculate basicity of catalyst | Total basicity of catalyst was 1.05 mmol/g |
| Optimization reaction for FAME conversion | To detect the optimum reaction parameters | Optimum operating reaction conditions was 18:1 methanol:oil molar ratio, 2.5 wt.% of catalyst and 150 min of reaction time |
| Reusability of catalyst | To calculate reusability of the catalyst | FAME conversions was 75.78% after 7th run |
| Properties | ASTM Test Method | WB00% | WB10% | WB20% | WB30% | WB40% | WB50% | WB100% |
|---|---|---|---|---|---|---|---|---|
| Flash point (°C) | D 93 | 58 | 65 | 70 | 77 | 85 | 91 | 142 |
| Density (g/cm3) at room temperature | D 1298 | 0.840 | 0.842 | 0.845 | 0.847 | 0.850 | 0.853 | 0.880 |
| Kinematic viscosity (cSt at 40 °C) | D 445 | 2.30 | 2.44 | 2.69 | 2.86 | 3.08 | 3.19 | 4.02 |
| Lower heating value (MJ/kg) | D 4809 | 43.45 | 42.87 | 42 | 41.54 | 40.87 | 40.31 | 38.81 |
| Parameter | Uncertainty (%) | Accuracy |
|---|---|---|
| BTE | 0.89 | ±0.2% |
| BSFC | 0.9 | ±0.01 kg/kWh |
| EGT | 1.0 | ±1 °C |
| CO | 0.5 | ±0.06% |
| CO2 | 0.45 | ±0.5% |
| NOx | 0.6 | ±3 ppm |
| UHC | 0.5 | ±12 ppm |
| Sr. No. | Biodiesel and Blending | Catalyst | BTE | BSFC | EGT | References |
|---|---|---|---|---|---|---|
| 1. | WCO (B10, B50, B100) | * | Increase | - | - | [20] |
| 2. | WFO (B100) | NaOH | - | 14.34% increase | 6.35% decrease | [21] |
| 3. | WCO (B100) | * | Increase | 13% increase | - | [22] |
| 4. | WCO (B10, B20, B40, B80, B100) | KOH | Decrease | 17% increase for B100 | - | [23] |
| 5. | WFO (B100) | NaOH | - | Increase | Decrease | [24] |
| 6. | WFO (B100) | CH3NaO | - | 18.5% increase | - | [27] |
| 7. | WFO (WB10, WB20, WB30, WB40, WB50, WB100) | Mg2Zr5O12 | Increase of 8.98%, 13.61%, 13.59%, 19.13%, 14.34%, 15.52% | Increase of 8.23%, 19.09%, 29.27%, 36.48%, 31.73%, 39.08% | Increase of 0.81%, 3.49%, 4.77%, 6.98%, 6.74%, 8.37% | Present work |
| Sr. No. | Biodiesel and Blending | Catalyst (Reusability Times) | CO | CO2 | NOx | HC | Reference |
|---|---|---|---|---|---|---|---|
| 1. | WFO (B0, B100) | NaOH (0) | 17% decrement | - | 1.5% decrement | - | [21] |
| 2. | WFO (B100) | NaOH (0) | - | - | 5.58–25.97% increment | 22.47–33.15% decrement | [24] |
| 3. | WCO (B5, B10, B20, B30) | * | 6.75%, 7.33%, 8.32%, 13.1% decrement | - | - | 10.5%, 19.9%, 27.7%, 36.0% decrement | [30] |
| 4. | WFO (B20, B40, B60, B80, B100) | * | decrement | decrement | increment | decrement | [31] |
| 5. | WFO (B100) | - | Significant increment | - | 44% decrement | - | [32] |
| 6. | WCO (B0, B30, B70, B100) | KOH (0) | - | Slight difference | Sharp reduction | [35] | |
| 7. | WCO (B0, B100) | NaOH (0) | 17–19% decrement | - | 3–5% decrement | - | [36] |
| 8. | WCO (B0, B20, B40, B80) | KOH (0) | 57% decrement | - | 14.7% increment | 40.3% decrement | [37] |
| 9. | WCO (B0, B100) | * | 4–16% decrement | 10–23% increment | 45–67% decrement | [38] | |
| 10. | WCO (B0, B5, B10, B20, B30, B50, B70, B100) | KOH (0) | 25% decrement | - | 6% increment | 20% decrement | [39] |
| 11. | WCO (D60B40N00 D60B40N30, D60B40N50, and D60B40N70) | TiO2 nano-catalyst and NaOH (NA) | Decrement | increment | increment | decrement | [40] |
| 12. | WFO (WB10, WB20, WB30, WB40, WB50, WB100) | Mg2Zr5O12 (7) | Decrement 16.96%, 27.83%, 31.3%, 34.78%, 27.83%, 22.17% | Increment 6.6%, 11.71%, 11.65%, 11.58%, 13.11%, 14.57% | Increment 11.84%, 15.08%, 16.77%, 15.85%, 21.08%, 27.85% | Decrement 5.88%, 14.93%, 29.41%, 38.1%, 35.29%, 38.69% | Present work |
| Reactant | Waste cooking oil | 1000 gm |
| Methanol | 660.89 gm | |
| Mg2Zr5O12 catalyst | 25 gm | |
| Products | Crude biodiesel | 800.35 gm |
| Crude glycerol | 150.09 gm | |
| Unreacted methanol | 40.45 gm | |
| Mg2Zr5O12 catalyst | 24 gm | |
| Purified product | Biodiesel | 780.12 gm |
Publisher’s Note: MDPI stays neutral with regard to jurisdictional claims in published maps and institutional affiliations. |
© 2022 by the authors. Licensee MDPI, Basel, Switzerland. This article is an open access article distributed under the terms and conditions of the Creative Commons Attribution (CC BY) license (https://creativecommons.org/licenses/by/4.0/).
Share and Cite
Singh, V.; Chavan, S.B.; Sharma, Y.C. Experimental Investigation of Engine Performance for 2nd Generation Biodiesel Derived from Mg2Zr5O12 Catalyst. Energies 2022, 15, 4044. https://doi.org/10.3390/en15114044
Singh V, Chavan SB, Sharma YC. Experimental Investigation of Engine Performance for 2nd Generation Biodiesel Derived from Mg2Zr5O12 Catalyst. Energies. 2022; 15(11):4044. https://doi.org/10.3390/en15114044
Chicago/Turabian StyleSingh, Veena, Supriya B. Chavan, and Yogesh C. Sharma. 2022. "Experimental Investigation of Engine Performance for 2nd Generation Biodiesel Derived from Mg2Zr5O12 Catalyst" Energies 15, no. 11: 4044. https://doi.org/10.3390/en15114044