
Algorithm for Rapid Estimation of the Performance of Small Rooftop Solar PV Use by Households


Abstract
:1. Introduction
- 176,768 MW/18.35%—wind farms;
- 138,935 MW/14.42%—solar power plants;
- 128,943 MW/13.38%—hydro/sea power plants;
- 34,393 MW/3.75%—biofuel energy recovery power plants;
- 896 MW of installed capacity, of which only 0.09% are geothermal power plants [5].
- Sweden (50.11% hydropower, 29.46% wind energy and 16.11% bioenergy, while the installed capacity using solar energy recovery technology is 4.31%);
- Finland (37.24% hydropower, 29.84% bioenergy and 28.43 wind energy, while the installed capacity using solar energy recovery technology is 4.49%);
- Other countries where the share of installed solar capacity is less than 5% include Croatia (2.36%), Ireland (0.86%), and Latvia (0.38%). It is worth noting that in these countries the structure of renewable energy is dominated by hydropower and wind energy.
- Building location according to the southern direction;
- Roof angle of inclination;
- Shape of the roof (monopitch, pitched equal, pitched unequal, hipped);
- Transmission losses of electricity in the installed photovoltaic system based on consumer preferences;
- Selection of optimal photovoltaic panels from the point of view of technology based on customer preference between price and quality;
- Technical data of photovoltaic panels selected for analysis, made in 17 different technologies;
- Monthly and hourly insolation level, kWh/m2 for the city of Opole Province (Poland);
- Performance of photovoltaic panels on sunny days, on days with partial cloud cover and on days with heavy cloud cover, estimated based on the adjustment factor developed by the authors;
- Photovoltaic panel performance by month based on average air temperature, estimated on the basis of an adjustment factor developed by the authors;
- The maximum roof area remaining after subtracting the necessary technical clearances between separate rows of PV panels and the clearances from the edge of the roof at the perimeter.
2. Logic of the Developed Author’s Algorithm for Rapid Estimation of the Performance of the Use of Photovoltaic Installations by Households
- First, given that the NOCT parameter is almost always reported for selected photovoltaic panels with a tolerance of plus or minus 20 °C, and NOCT values are in the range of 43 °C to 45 °C, the NOCT factorconst—45 °C was considered standard;
- Second, the insolation level E wastaken as the average insolation level in a specific i-th month (Ei);
- Third, Tambient based on statistical data was determined at the level of T1 = 25, T2 = 30 oraz T3 = 35 (ambient temperature values below 20 °C were eliminated by determining the proportion of days in the i-th month within specific temperature ranges Uti).
3. Case Study
3.1. Simulation of Photovoltaic Panel Technology Selection Based on Different Customer (Prosumer) Preferences
3.2. Gathering Technical Data about the Property Necessary to Estimate the Maximum Possible Electricity Generation from the Photovoltaic System
- Necessary technical data of the property (Table 5);
- Data regarding the location of the front wall of the property in relation to the southern direction;
- Annual electricity demand in kWh.
3.3. Main Computations of the Algorithm
- 20 cm on each side along the side edges of the roof;
- 35 cm from the bottom and 35 cm from the top edge of the roof;
- 1 cm of mandatory technical distance between individual rows of photovoltaic panels vertically and horizontally as the necessary ventilation space.
3.4. Analysis of the Performance of Photovoltaic Installation for Single-Family House Construction in Opole Province, Poland
4. Results of the Analyses and Discussion
- The hours when the refrigerator could work are shown in Table 15;
- The hours when the water heater could work are shown in Table 16;
- The hours when the iron could be turned on are shown in Table 17;
- the hours when the kettle will most likely be able to be turned on are shown in Table 18;
- The hours when the power generated by the designed photovoltaic system will be sufficient to efficiently use simultaneously a refrigerator, a TV in SDR mode, and a water heater (without taking into account system degradation) are shown in Table 19.
- In the case of the analyzed property, the photovoltaic system cannot function autonomously and needs a connection to the power grid, but it can become an additional source of electricity and secure a certain level of independence from external energy sources for the property owners;
- Only a comprehensive analysis of the energy potential of photovoltaic panels, taking into account technical, climatic and weather factors, as well as personal preferences of consumers, will make it possible to take a correct decision on the installation of PV systems in households. Such an analysis is made possible by the algorithm developed by the authors for the rapid estimation of the effectiveness of small rooftop PV systems;
- The proposed algorithm gives the probable amount of covering the own demand for electricity over a period of 25 years (most manufacturers predict a linear degradation of photovoltaic panels for this period), which in turn can approximate the estimated savings. However, due to the fact that the price of 1 KW/h of electricity supplied and the subscription price depends on the specific electricity supplier, connection capacity, photovoltaic system power, tariff chosen by the investor, according to which the amount due for the electricity consumed is calculated, the issue of state subsidies for this type of investment project, the possibility of disconnecting a specific installation in the event of a load on the supplier’s energy system, as well as various variants and technical issues, it is impossible in one article to estimate the profitability of such an undertaking that would take into account all the above-mentioned conditions. Due to the fact that the decision to install a solar panel system should not be imposed on the investor, the proposed system leaves the final decision in the hands of the investor (household). Therefore, the investor must conduct simulations of various technical variants of photovoltaic installations before making the final decision.
5. Conclusions
Author Contributions
Funding
Institutional Review Board Statement
Informed Consent Statement
Data Availability Statement
Conflicts of Interest
References
- IEA. Electricity Market Report—January 2022, Paris. 2022. Available online: https://www.iea.org/reports/electricity-market-report-january-2022 (accessed on 10 March 2022).
- IEA. Net Zero by 2050, Paris. 2021. Available online: https://www.iea.org/reports/net-zero-by-2050 (accessed on 22 January 2022).
- Communication from the Commission to the European Parliament, the Council, the European Economic and Social Committee and the Committee of the Regions ‘Fit for 55’: Delivering the EU’s 2030 Climate Target on the Way to Climate Neutrality, Brussels. 2021. Available online: https://eur-lex.europa.eu/legal-content/EN/TXT/?uri=CELEX%3A52021DC0550 (accessed on 22 January 2022).
- Polityka Energetyczna Polski do 2040. Uchwała nr 22/2021 Rady Ministrów Polski z dnia 2 Lutego 2021 r., Warsaw, Poland. 2021. Available online: https://bip.mos.gov.pl/strategie-plany-programy/polityka-energetyczna-polski-do-2040-r/ (accessed on 22 January 2022).
- IRENA, International Renewable Energy Agency. 2022. Available online: https://irena.org/ (accessed on 15 February 2022).
- Bugeja, R.; Stagno, L.M.; Branche, N. The effect of wave response motion on the insolation on offshore photovoltaic installations. Sol. Energy Adv. 2021, 1, 100008. [Google Scholar] [CrossRef]
- Marchwiński, J.; Kurtz-Orecka, K. Influence of photovoltaic installation on energy performance of a nursery building in Warsaw (Central European conditions). J. Build. Eng. 2020, 32, 101630. [Google Scholar] [CrossRef]
- Wu, P.; Ma, X.; Ji, J.; Ma, Y. Review on Life Cycle Assessment of Energy Payback of Solar Photovoltaic Systems and a Case Study. Energy Procedia 2017, 105, 68–74. [Google Scholar] [CrossRef]
- Boland, J.; Farah, S.; Bai, L. Forecasting of Wind and Solar Farm Output in the Australian National Electricity Market: A Review. Energies 2022, 15, 370. [Google Scholar] [CrossRef]
- Kodeks Cywilny. Dz. U. z 2020 r. poz. 1740, 2320, z 2021 r. poz. 1509, 2459. Available online: https://isap.sejm.gov.pl/isap.nsf/download.xsp/WDU19640160093/U/D19640093Lj.pdf (accessed on 20 October 2021).
- Adaramola, M.S.; Vågnes, E.E.T. Preliminary assessment of a small-scale rooftop PV-grid tied in Norwegian climatic conditions. Energy Convers. Manag. 2015, 90, 458. [Google Scholar] [CrossRef]
- Khatri, R. Design and assessment of solar PV plant for girls hostel (GARGI) of MNIT University, Jaipur city: A case study. Energy Rep. 2016, 2, 89. [Google Scholar] [CrossRef] [Green Version]
- Ibrik, I.H.; Cruz, S. Techno-economic assessment of on-grid solar PV system in Palestine. Cogent Eng. 2020, 7, 1727131. [Google Scholar] [CrossRef]
- Buonomano, A.; Calise, F.; Vicidomini, M. Design, Simulation and Experimental Investigation of a Solar System Based on PV Panels and PVT Collectors. Energies 2016, 9, 497. [Google Scholar] [CrossRef]
- Al-Aboosi, F.Y.; Al-Aboosi, A.F. Preliminary Evaluation of a Rooftop Grid-Connected Photovoltaic System Installation under the Climatic Conditions of Texas (USA). Energies 2021, 14, 586. [Google Scholar] [CrossRef]
- Shukla, A.K.; Sudhakar, K.; Baredar, P. Simulation and performance analysis of 110 kWp grid-connected photovoltaic system for residential building in India: A comparative analysis of various PV technology. Energy Rep. 2016, 2, 82. [Google Scholar] [CrossRef] [Green Version]
- Odeh, S.; Nguyen, T.H. Assessment Method to Identify the Potential of Rooftop PV Systems in the Residential Districts. Energies 2021, 14, 4240. [Google Scholar] [CrossRef]
- Imam, A.A.; Al-Turki, Y.A. Techno-Economic Feasibility Assessment of Grid-Connected PV Systems for Residential Buildings in Saudi Arabia—A Case Study. Sustainability 2020, 12, 262. [Google Scholar] [CrossRef] [Green Version]
- Rodríguez-Martinez, Á.; Rodríguez-Monroy, C. Economic Analysis and Modelling of Rooftop Photovoltaic Systems in Spain for Industrial Self-Consumption. Energies 2021, 14, 7307. [Google Scholar] [CrossRef]
- Sreenath, S.; Sudhakar, K.; Yusop, A.F.; Solomin, E.; Kirpichnikova, I.M. Solar PV energy system in Malaysian airport: Glare analysis, general design and performance assessment. Energy Rep. 2020, 6, 698. [Google Scholar] [CrossRef]
- Nguyen, D.P.N.; Lauwaert, J. Calculating the Energy Yield of Si-Based Solar Cells for Belgium and Vietnam Regions at Arbitrary Tilt and Orientation under Actual Weather Conditions. Energies 2020, 13, 3180. [Google Scholar] [CrossRef]
- Bazrafshan, M.; Yalamanchili, L.; Gatsis, N.; Gomez, J. Stochastic Planning of Distributed PV Generation. Energies 2019, 12, 459. [Google Scholar] [CrossRef] [Green Version]
- Awan, A.B.; Alghassab, M.; Zubair, M.; Bhatti, A.R.; Uzair, M.; Abbas, G. Comparative Analysis of Ground-Mounted vs. Rooftop Photovoltaic Systems Optimized for Interrow Distance between Parallel Arrays. Energies 2020, 13, 3639. [Google Scholar] [CrossRef]
- Nfaoui, M.; El-Hami, K. Optimal tilt angle and orientation for solar photovoltaic arrays: Case of Settat city in Morocco. Int. J. Ambient Energy 2020, 41, 214–223. [Google Scholar] [CrossRef]
- Nnamchi, S.N.; Sanya, O.D.; Zaina, K.; Gabriel, V. Development of dynamic thermal input models for simulation of photovoltaic generators. Int. J. Ambient Energy 2020, 41, 1454–1466. [Google Scholar] [CrossRef]
- Rehman, N.; Uzair, M. Comparison of North/South- and East–West-Facing Solar Collector Pairs with or Without Reflectors. J. Sol. Energy Eng. 2022, 144, 024501. [Google Scholar] [CrossRef]
- Abed, F.; Al-Salami, Q.H. Calculate the best slope angle of photovoltaic panels theoretically in all cities in Turkey. Int. J. Environ. Sci. Technol. 2021. [Google Scholar] [CrossRef]
- Makbul, A.M.; Houssem, R.; Bouchekara, R.E.H.; Shahriar, M.S.; Milyani, A.H.; Rawa, M. Maximization of Solar Radiation on PV Panels with Optimal Intervals and Tilt Angle: Case Study of Yanbu, Saudi Arabia. Front. Energy Res. 2021, 9, 753998. [Google Scholar] [CrossRef]
- Liu, T.; Liu, L.; He, Y.; Sun, M.; Liu, J.; Xu, G. A Theoretical Optimum Tilt Angle Model for Solar Collectors from Keplerian Orbit. Energies 2021, 14, 4454. [Google Scholar] [CrossRef]
- Sharma, M.K.; Deepak, K.; Dhundhara, S.; Gaur, D.; Verma, Y.P. Optimal Tilt Angle Determination for PV Panels Using Real Time Data Acquisition. Glob. Chall. 2020, 4, 1900109. [Google Scholar] [CrossRef] [PubMed] [Green Version]
- Hailu, G.; Fung, A.S. Optimum Tilt Angle and Orientation of Photovoltaic Thermal System for Application in Greater Toronto Area, Canada. Sustainability 2019, 11, 6443. [Google Scholar] [CrossRef] [Green Version]
- Yu, C.; Khoo, Y.S.; Chai, J.; Han, S.; Yao, J. Optimal Orientation and Tilt Angle for Maximizing in-Plane Solar Irradiation for PV Applications in Japan. Sustainability 2019, 11, 2016. [Google Scholar] [CrossRef] [Green Version]
- Bitirgen, K.; Filik, Ü.B. A comprehensive study on modeling of photovoltaic arrays and calculation of photovoltaic potential using digital elevation model. Energy Sources Part A Recovery Util. Environ. Eff. 2020, 43, 2609–2633. [Google Scholar] [CrossRef]
- Szymański, B. Instalacje Fotowoltaiczne: Teoria i Praktyka; Globenergia: Kraków, Polska, 2018; p. 47. [Google Scholar]
- SKLEP RTV EURO AGD. Lodówka Samsung RB38T603CS9. Available online: https://www.euro.com.pl/lodowki/samsung-rb38t603cs9.bhtml (accessed on 15 March 2022).
- SKLEP RTV EURO AGD. Pralka Amica WA2S612BKISJD. Available online: https://www.euro.com.pl/pralki/amica-wa2s612bkisjd.bhtml (accessed on 15 March 2022).
- SKLEP RTV EURO AGD. Piekarnik Whirlpool W6 OM4 4S1 P BSS W. Available online: https://www.euro.com.pl/piekarniki-do-zabudowy/whirlpool-w6-om4-4s1-p-bss-w-collection.bhtml#opis (accessed on 15 March 2022).
- SKLEP RTV EURO AGD. Płyta Indukcyjna Whirlpool WL S3160 BF. Available online: https://www.euro.com.pl/plyty-do-zabudowy/whirlpool-wl-s3160-bf.bhtml (accessed on 15 March 2022).
- SKLEP RTV EURO AGD. Płyta Indukcyjna Samsung NZ64T3707A1. Available online: https://www.euro.com.pl/plyty-do-zabudowy/samsung-nz64t3707a1.bhtml (accessed on 15 March 2022).
- SKLEP RTV EURO AGD. Płyta Indukcyjna Electrolux Slim-Fit CIV654. Available online: https://www.euro.com.pl/plyty-do-zabudowy/electrolux-slim-fit-civ654.bhtml (accessed on 15 March 2022).
- SKLEP RTV EURO AGD. Czajnik Elektryczny Tefal DISPLAY KO851. Available online: https://www.euro.com.pl/czajniki/tefal-czajnik-display-1-7l-kolor-czarny-ko851830.bhtml (accessed on 15 March 2022).
- SKLEP RTV EURO AGD. Żelazko Tefal Smart Protect Plus FV6870. Available online: https://www.euro.com.pl/zelazka/tefal-smart-protect-plus-fv6870.bhtml (accessed on 15 March 2022).
- SKLEP RTV EURO AGD. Telewizor Samsung QLED QE65Q80AAT DVB-T2/HEVC. Available online: https://www.euro.com.pl/telewizory-led-lcd-plazmowe/samsung-qe65q80a-smart-tv-uhd-4k.bhtml#opis (accessed on 15 March 2022).
- MediaEkspert, Grzejnik Konwektorowy NEO 90-090. Available online: https://www.mediaexpert.pl/agd-male/do-domu/grzejniki-i-konwektory/grzejnik-konwektorowy-elektryczny-1000w-ip24?snrai_campaign=aQk23kOzUW9Z&snrai_source=&snrai_content=&snrai_id=49e34939-f3c8-482b-8524-1bfbb973c743 (accessed on 15 March 2022).
- MediaEkspert, Podgrzewacz Elektryczny ZELMECH ZL-DV80. Available online: https://www.mediaexpert.pl/dom-i-ogrod/do-domu/elektryczne-podgrzewacze-wody/podgrzewacz-wody-elektryczny-zelmech-zl-dv80-80l (accessed on 15 March 2022).


| Type of Photovoltaic Panel Manufacturing Technology | Photovoltaic Panel Performance Indicators | Estimated Net Price Per Wp, (Polish Zloty) | Dimensions, m | ||||
|---|---|---|---|---|---|---|---|
| Typical Power, Wp | Typical Efficiency, % | Coefficient of Average Power Change Per 1 °C, % | a | b | |||
| Wp/m2 | Wp/Panel | ||||||
| Amorphous | 83.33 | 100 | 8.30 | 0.25 | 1.6 | 1 | 1.2 |
| CIGS | 134.25 | 140 | 13.40 | 0.38 | 2.1 | 0.66 | 1.58 |
| CdTe | 138.89 | 100 | 13.90 | 0.34 | 2 | 0.6 | 1.2 |
| Poly-glass-glass | 169.38 | 275 | 16.90 | 0.44 | 2.2 | 0.99 | 1.64 |
| Poly-(classic) | 172.46 | 280 | 17.20 | 0.41 | 1.5 | 0.99 | 1.64 |
| Poly-Smart (Solar Edge) | 172.46 | 280 | 17.20 | 0.43 | 2.1 | 0.99 | 1.64 |
| Poly-half-cut | 176.46 | 290 | 17.60 | 0.38 | 1.6 | 0.99 | 1.66 |
| Mono-(classic) | 181.69 | 295 | 18.20 | 0.43 | 1.8 | 0.99 | 1.64 |
| Mono-Smart (Solar Edge) | 181.69 | 295 | 18.20 | 0.44 | 2.2 | 0.99 | 1.64 |
| Mono-bifacial | 182.93 | 300 | 18.30 | 0.38 | 3.2 | 1 | 1.64 |
| Poly-MWT | 184.77 | 300 | 18.50 | 0.36 | 1.7 | 0.99 | 1.64 |
| Mono-glass-glass | 184.77 | 300 | 18.50 | 0.45 | 2.4 | 0.99 | 1.64 |
| Mono-PERC | 197.09 | 320 | 19.70 | 0.45 | 1.9 | 0.99 | 1.64 |
| Mono-HIT | 197.66 | 330 | 20.10 | 0.29 | 2.8 | 1.05 | 1.59 |
| Mono-half-cut | 197.76 | 325 | 19.80 | 0.37 | 1.9 | 0.99 | 1.66 |
| Mono-MWT | 200.17 | 325 | 20.00 | 0.36 | 2.1 | 0.99 | 1.64 |
| Mono-all back contact | 205.25 | 333 | 20.50 | 0.33 | 3.3 | 1.04 | 1.56 |
| Average value | 174.18 | 269.88 | 17.43 | 0.38 | 2.14 | ||
| Minimum value | 83.33 | 100 | 8.30 | 0.25 | 1.50 | ||
| Maximum value | 205.25 | 333 | 20.50 | 0.45 | 3.30 | ||
| Month | Proportion of Days in Specific Temperature Ranges, % | Average Level of Insolation (Ei), W/m2 | Proportion of Days in Specific Temperature Ranges, % | ||
|---|---|---|---|---|---|
| U1 (Ambient Temperature above 35 °C) | U2 (Ambient Temperature from 30 °C to 35 °C) | U3 (Ambient Temperature from 25 °C to 30 °C) | |||
| January | 0.000 | 0.000 | 0.000 | 190.6 | 1.00000 |
| February | 0.000 | 0.000 | 0.000 | 304.9 | 1.00000 |
| March | 0.000 | 0.000 | 0.645 | 374.4 | 0.99893 |
| April | 0.000 | 1.667 | 13.667 | 536.6 | 0.97080 |
| May | 0.323 | 11.935 | 33.871 | 539.3 | 0.91029 |
| June | 4.333 | 21.333 | 40.333 | 548.7 | 0.86808 |
| July | 11.401 | 34.853 | 36.482 | 558.3 | 0.82899 |
| August | 12.052 | 35.505 | 37.459 | 511.6 | 0.82978 |
| September | 0.333 | 15.000 | 32.667 | 440.0 | 0.91278 |
| October | 0.000 | 1.929 | 18.328 | 338.4 | 0.96714 |
| November | 0.000 | 0.000 | 0.333 | 250.8 | 0.99951 |
| December | 0.000 | 0.000 | 0.000 | 192.8 | 1.00000 |
| Month | Proportion of Days in Specific Temperature Ranges, % | Average Level of Insolation, W/m2 | Adjustment Factor | ||
|---|---|---|---|---|---|
| U1 (Ambient Temperature above 35 °C) | U2 (Ambient Temperature from 30 °C to 35 °C) | U3 (Ambient Temperature from 25 °C to 30 °C) | |||
| January | 0.000 | 0.000 | 0.000 | 190.6 | 1.00000 |
| February | 0.000 | 0.000 | 0.000 | 304.9 | 1.00000 |
| March | 0.000 | 0.000 | 0.645 | 374.4 | 0.99941 |
| April | 0.000 | 1.667 | 13.667 | 536.6 | 0.98378 |
| May | 0.323 | 11.935 | 33.871 | 539.3 | 0.95016 |
| June | 4.333 | 21.333 | 40.333 | 548.7 | 0.92671 |
| July | 11.401 | 34.853 | 36.482 | 558.3 | 0.90499 |
| August | 12.052 | 35.505 | 37.459 | 511.6 | 0.90543 |
| September | 0.333 | 15.000 | 32.667 | 440.0 | 0.95154 |
| October | 0.000 | 1.929 | 18.328 | 338.4 | 0.98174 |
| November | 0.000 | 0.000 | 0.333 | 250.8 | 0.99973 |
| December | 0.000 | 0.000 | 0.000 | 192.8 | 1.00000 |
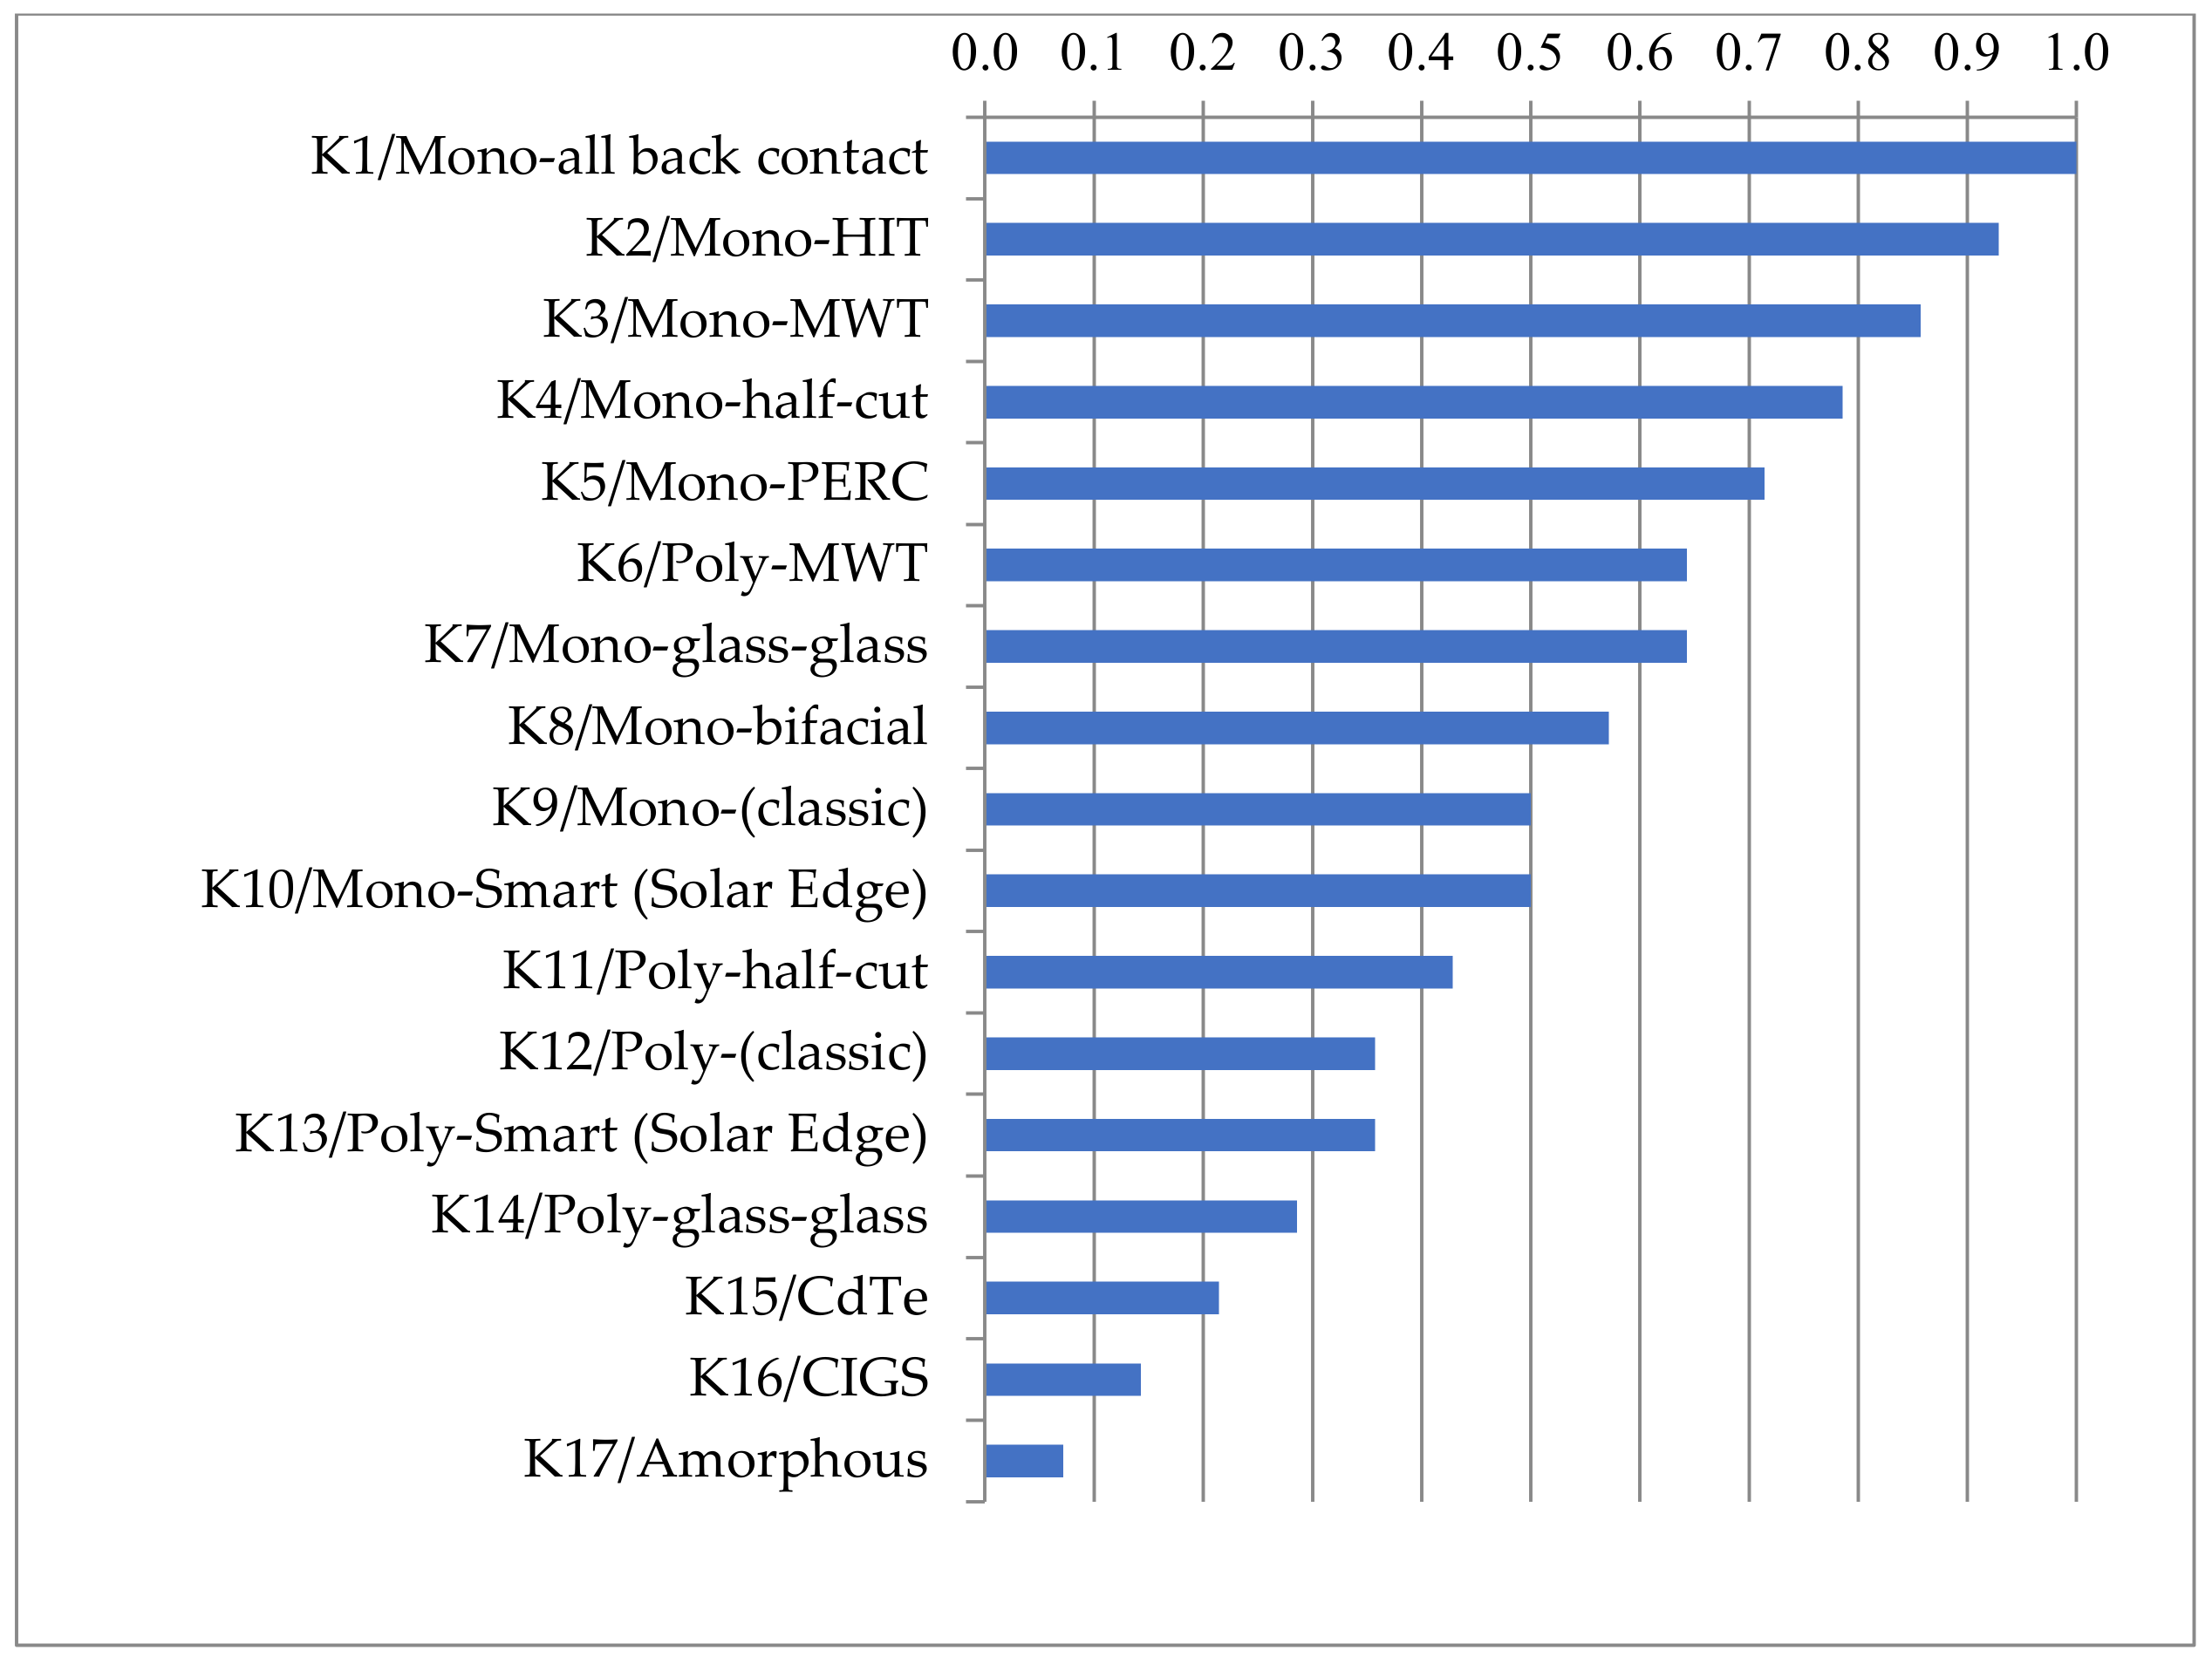
| Abbreviation | Type of Photovoltaic Panel Manufacturing Technology |
|---|---|
| K1 | Mono-all back contact |
| K2 | Mono-HIT |
| K3 | Mono-MWT |
| K4 | Mono-half-cut |
| K5 | Mono-PERC |
| K6 | Poly-MWT |
| K7 | Mono-glass-glass |
| K8 | Mono-bifacial |
| K9 | Mono-(classic) |
| K10 | Mono-Smart (Solar Edge) |
| K11 | Poly-half-cut |
| K12 | Poly-(classic) |
| K13 | Poly-Smart (Solar Edge) |
| K14 | Poly-glass-glass |
| K15 | CdTe |
| K16 | CIGS |
| K17 | Amorphous |
| Roof: Monopitch * | |||
| Length, m | Roof slope | ||
| Does the roof slope in this direction? (Yes/No) | Provide the angle of inclination? | ||
| Front of the construction | |||
| Right side of the construction | |||
| Left side of the construction | |||
| Rear wall | |||
| Roof: pitched equal * | |||
| Length, m | Roof slope | ||
| Does the roof slope in this direction? | Provide the angle of inclination? | ||
| Front of the construction | |||
| Right side of the construction | |||
| Left side of the construction | |||
| Rear wall | |||
| Roof: pitched unequal * | |||
| Does the roof slope in this direction? (Yes/No) | Provide the angle of inclination? | Indicate the length of the wall to which the roof is sloped, m | |
| Front of the construction | |||
| Right side of the construction | |||
| Left side of the construction | |||
| Rear wall | |||
| Indicate the corresponding lengths on the left or front wall of the building, m | |||
| from the right corner of the wall to the ridge | from the left corner to the ridge | ||
| Roof: hipped | |||
| Indicate the length, m | Provide the angle of inclination? | ||
| Front of the construction | |||
| Right side of the construction | |||
| Left side of the construction | |||
| Rear wall | |||
| Months | Time | |||||||||||||||
|---|---|---|---|---|---|---|---|---|---|---|---|---|---|---|---|---|
| 0–5 | 6 | 7 | 8 | 9 | 10 | 11 | 12 | 13 | 14 | 15 | 16 | 17 | 18 | 19 | 20–24 | |
| January | 141 | 165 | 165 | 139 | ||||||||||||
| February | 170 | 225 | 255 | 257 | 230 | 178 | 108 | |||||||||
| March | 110 | 199 | 277 | 335 | 335 | 334 | 333 | 274 | 194 | 105 | ||||||
| April | 123 | 220 | 313 | 391 | 446 | 472 | 736 | 430 | 336 | 282 | 186 | |||||
| May | 104 | 197 | 294 | 385 | 460 | 511 | 534 | 527 | 490 | 427 | 344 | 249 | 152 | |||
| June | 129 | 222 | 317 | 406 | 480 | 531 | 556 | 551 | 517 | 458 | 378 | 286 | 190 | 100 | ||
| July | 108 | 199 | 295 | 385 | 461 | 515 | 542 | 540 | 508 | 451 | 372 | 280 | 183 | |||
| August | 145 | 242 | 333 | 411 | 466 | 493 | 490 | 457 | 396 | 315 | 221 | 124 | ||||
| September | 169 | 258 | 332 | 383 | 406 | 398 | 360 | 295 | 212 | 120 | ||||||
| October | 168 | 235 | 279 | 297 | 284 | 243 | 197 | 102 | ||||||||
| November | 139 | 178 | 193 | 181 | 145 | |||||||||||
| December | 126 | 144 | 137 | 107 | ||||||||||||
| Month | Sunny (xi), Days | Partly Cloudy (vi), Days | Highly Cloudy (zi), Days |
|---|---|---|---|
| January | 3.2 | 10.3 | 17.5 |
| February | 2.4 | 10.7 | 15.2 |
| March | 4.0 | 14.5 | 12.5 |
| April | 6.4 | 15.1 | 8.5 |
| May | 6.8 | 16.7 | 7.5 |
| June | 5.4 | 17.9 | 6.7 |
| July | 8.4 | 17.5 | 5.1 |
| August | 8.8 | 16.5 | 5.6 |
| September | 7.6 | 13.9 | 8.5 |
| October | 7.9 | 13.7 | 9.4 |
| November | 4.8 | 11.6 | 13.5 |
| December | 3.3 | 10.6 | 17.0 |
| Range, °C | 30 ≤ T | 25 ≤ T < 30 | 20 ≤ T < 25 | 15 ≤ T < 20 | 10 ≤ T < 15 | 5 ≤ T < 10 | 0 ≤ T < 5 | −5 ≤ T < 0 | T < −5 | |
|---|---|---|---|---|---|---|---|---|---|---|
| Months | ||||||||||
| January | 1.2 | 7.1 | 12.8 | 7.8 | 1.8 | |||||
| February | 0.2 | 2.8 | 7.7 | 10.3 | 5.8 | 1.2 | ||||
| March | 0.2 | 2.9 | 8.6 | 10.7 | 6.5 | 2.0 | 0.1 | |||
| April | 0.5 | 4.1 | 10.2 | 9.7 | 4.5 | 1.0 | ||||
| May | 0.1 | 3.7 | 10.5 | 11.6 | 4.7 | 0.4 | ||||
| June | 1.3 | 6.4 | 12.1 | 8.7 | 1.5 | |||||
| July | 3.5 | 10.7 | 11.2 | 5.2 | 0.1 | |||||
| August | 3.7 | 10.9 | 11.5 | 4.3 | 0.3 | |||||
| September | 0.1 | 4.5 | 9.8 | 11.1 | 4.2 | 0.3 | ||||
| October | 0.6 | 5.7 | 9.2 | 10.6 | 4.6 | 0.4 | ||||
| November | 0.1 | 2.3 | 8.5 | 11.2 | 6.9 | 0.9 | 0.1 | |||
| December | 1.4 | 8.8 | 14.4 | 5.6 | 0.7 | |||||
| Total, days | 8.7 | 37.3 | 65.2 | 65.7 | 53.6 | 55.3 | 52.3 | 22.1 | 3.9 | |
| Share of days per year, % | 2.39% | 10.24% | 17.91% | 18.04% | 14.72% | 15.19% | 14.36% | 6.07% | 1.07% | |
| Months | Type of Photovoltaic Panel Manufacturing Technology | ||||
|---|---|---|---|---|---|
| K1 “Mono-All Back Contact” | K3 “Mono-MWT” | K6 “Poly-MWT” | K4 “Mono-Half-Cut” | K12 “Poly-(Classic)” | |
| January | 0.743 | 0.720 | 0.720 | 0.712 | 0.681 |
| February | 0.779 | 0.759 | 0.759 | 0.753 | 0.726 |
| March | 0.809 | 0.791 | 0.791 | 0.786 | 0.762 |
| April | 0.887 | 0.877 | 0.877 | 0.873 | 0.860 |
| May | 0.938 | 0.932 | 0.932 | 0.931 | 0.923 |
| June | 0.968 | 0.965 | 0.965 | 0.964 | 0.960 |
| July | 0.995 | 0.995 | 0.995 | 0.994 | 0.994 |
| August | 0.997 | 0.997 | 0.997 | 0.997 | 0.996 |
| September | 0.944 | 0.939 | 0.939 | 0.937 | 0.930 |
| October | 0.889 | 0.879 | 0.879 | 0.875 | 0.862 |
| November | 0.816 | 0.799 | 0.799 | 0.793 | 0.771 |
| December | 0.754 | 0.731 | 0.731 | 0.724 | 0.694 |
| Monthly average | 0.876 | 0.865 | 0.865 | 0.862 | 0.847 |
| Degrees | Angle of Inflection from the South | |||||||||||||||||||
|---|---|---|---|---|---|---|---|---|---|---|---|---|---|---|---|---|---|---|---|---|
| 90 | 85 | 80 | 75 | 70 | 65 | 60 | 55 | 50 | 45 | 40 | 35 | 30 | 25 | 20 | 15 | 10 | 5 | 0 | ||
| Angle of inclination | 0 | 1 | 1 | 1 | 1 | 1 | 1 | 1 | 1 | 1 | 1 | 1 | 1 | 1 | 1 | 1 | 1 | 1 | 1 | 1 |
| 5 | 1 | 1 | 1 | 1.01 | 1.01 | 1.01 | 1.02 | 1.02 | 1.02 | 1.03 | 1.03 | 1.03 | 1.03 | 1.03 | 1.03 | 1.03 | 1.04 | 1.04 | 1.04 | |
| 10 | 0.99 | 1 | 1.01 | 1.01 | 1.02 | 1.02 | 1.03 | 1.04 | 1.04 | 1.05 | 1.05 | 1.05 | 1.06 | 1.06 | 1.06 | 1.06 | 1.07 | 1.07 | 1.07 | |
| 15 | 0.98 | 0.99 | 1 | 1.01 | 1.02 | 1.03 | 1.04 | 1.05 | 1.05 | 1.06 | 1.07 | 1.07 | 1.08 | 1.08 | 1.09 | 1.09 | 1.09 | 1.09 | 1.1 | |
| 20 | 0.97 | 0.98 | 1 | 1.01 | 1.02 | 1.03 | 1.04 | 1.05 | 1.06 | 1.07 | 1.08 | 1.09 | 1.09 | 1.1 | 1.1 | 1.11 | 1.1 | 1.11 | 1.11 | |
| 25 | 0.96 | 0.97 | 0.99 | 1 | 1.02 | 1.03 | 1.05 | 1.06 | 1.07 | 1.08 | 1.09 | 1.1 | 1.1 | 1.11 | 1.12 | 1.12 | 1.12 | 1.12 | 1.13 | |
| 30 | 0.94 | 0.96 | 0.98 | 1 | 1.01 | 1.03 | 1.04 | 1.06 | 1.07 | 1.08 | 1.09 | 1.1 | 1.11 | 1.12 | 1.12 | 1.13 | 1.13 | 1.13 | 1.14 | |
| 35 | 0.93 | 0.95 | 0.97 | 0.99 | 1 | 1.02 | 1.04 | 1.05 | 1.07 | 1.08 | 1.09 | 1.1 | 1.11 | 1.12 | 1.12 | 1.13 | 1.13 | 1.14 | 1.15 | |
| 40 | 0.91 | 0.93 | 0.95 | 0.97 | 0.99 | 1.01 | 1.03 | 1.04 | 1.06 | 1.07 | 1.09 | 1.1 | 1.1 | 1.11 | 1.12 | 1.12 | 1.13 | 1.13 | 1.14 | |
| 45 | 0.88 | 0.91 | 0.93 | 0.96 | 0.98 | 1 | 1.01 | 1.03 | 1.05 | 1.06 | 1.07 | 1.09 | 1.1 | 1.1 | 1.11 | 1.11 | 1.12 | 1.12 | 1.12 | |
| 50 | 0.87 | 0.89 | 0.92 | 0.94 | 0.96 | 0.98 | 1 | 1.01 | 1.03 | 1.04 | 1.06 | 1.07 | 1.08 | 1.09 | 1.09 | 1.1 | 1.1 | 1.1 | 1.11 | |
| 55 | 0.85 | 0.87 | 0.89 | 0.92 | 0.94 | 0.96 | 0.97 | 0.99 | 1.01 | 1.02 | 1.04 | 1.05 | 1.06 | 1.07 | 1.07 | 1.08 | 1.08 | 1.08 | 1.08 | |
| 60 | 0.82 | 0.85 | 0.87 | 0.89 | 0.91 | 0.93 | 0.95 | 1 | 0.98 | 1 | 1.01 | 1.02 | 1.03 | 1.04 | 1.05 | 1.05 | 1.05 | 1.06 | 1.06 | |
| 65 | 0.8 | 0.82 | 0.84 | 0.86 | 0.88 | 0.9 | 0.92 | 0.94 | 0.95 | 0.97 | 0.98 | 0.99 | 1 | 1.01 | 1.02 | 1.02 | 1.02 | 1.02 | 1.02 | |
| 70 | 0.77 | 0.79 | 0.81 | 0.83 | 0.85 | 0.87 | 0.89 | 0.91 | 0.92 | 0.93 | 0.95 | 0.96 | 0.97 | 0.97 | 0.98 | 0.98 | 0.99 | 0.99 | 0.99 | |
| 75 | 0.74 | 0.76 | 0.78 | 0.8 | 0.82 | 0.84 | 0.86 | 0.87 | 0.89 | 0.9 | 0.91 | 0.92 | 0.93 | 0.93 | 0.94 | 0.94 | 0.94 | 0.95 | 0.95 | |
| 80 | 0.71 | 0.73 | 0.75 | 0.77 | 0.79 | 0.8 | 0.82 | 0.83 | 0.85 | 0.86 | 0.87 | 0.88 | 0.89 | 0.89 | 0.89 | 0.9 | 0.9 | 0.9 | 0.9 | |
| 85 | 0.67 | 0.69 | 0.71 | 0.73 | 0.75 | 0.77 | 0.78 | 0.79 | 0.81 | 0.82 | 0.83 | 0.83 | 0.84 | 0.84 | 0.85 | 0.85 | 0.85 | 0.85 | 0.85 | |
| 90 | 0.64 | 0.66 | 0.68 | 0.69 | 0.71 | 0.72 | 0.74 | 0.75 | 0.76 | 0.77 | 0.78 | 0.79 | 0.79 | 0.79 | 0.8 | 0.8 | 0.8 | 0.8 | 0.8 | |
| Length, m | Roof Slope | ||
|---|---|---|---|
| Does the Roof Slope in This Direction? | Provide the Angle of Inclination? | ||
| Front of the construction | 10 | No | 0 |
| Right side of the construction | 8 | Yes | 35 |
| Left side of the construction | 8 | Yes | 35 |
| Rear wall | 10 | No | 0 |
| Photovoltaic Panel Technology Selected | K2-Mono-HIT |
|---|---|
| Maximum number of panels installed | 20 |
| including: | |
| front wall of the building | 0 |
| right wall of the building | 20 |
| left wall of the building | 0 |
| rear wall of the building | 0 |
| Typical power, Wp | 330 |
| Typical efficiency, % | 20.1 |
| Installed power, kWp | 6.6 |
| Energy demand, kWh | 4000 |
| Energy production, first year, kWh | 4802 |
| Year of PV System Use | Electricity Production Projection, kW | Projection of Percent Recovered Energy from Demand, % | ||||||
|---|---|---|---|---|---|---|---|---|
| Building Wall | ||||||||
| Front of the Construction | Right Side of the Construction | Left of the Construction | Rear Wall | Front of the Construction | Right Side of the Construction | Left Side of the Construction | Rear Wall | |
| 1 | 4763.3 | 119.1 | ||||||
| 2 | 4724.9 | 118.1 | ||||||
| 3 | 4686.4 | 117.2 | ||||||
| 4 | 4648 | 116.2 | ||||||
| 5 | 4609.6 | 115.2 | ||||||
| 6 | 4571.2 | 114.3 | ||||||
| 7 | 4532.8 | 113.3 | ||||||
| 8 | 4494.4 | 112.4 | ||||||
| 9 | 4456 | 111.4 | ||||||
| 10 | 4417.5 | 110.4 | ||||||
| 11 | 4379.1 | 109.5 | ||||||
| 12 | 4340.7 | 108.5 | ||||||
| 13 | 4302.3 | 107.6 | ||||||
| 14 | 4263.9 | 106.6 | ||||||
| 15 | 4225.5 | 105.6 | ||||||
| 16 | 4187.1 | 104.7 | ||||||
| 17 | 4148.7 | 103.7 | ||||||
| 18 | 4110.2 | 102.8 | ||||||
| 19 | 4071.8 | 101.8 | ||||||
| 20 | 4033.4 | 100.8 | ||||||
| 21 | 3995 | 99.9 | ||||||
| 22 | 3956.6 | 98.9 | ||||||
| 23 | 3918.2 | 98.0 | ||||||
| 24 | 3879.8 | 97.0 | ||||||
| 25 | 3841.3 | 96.0 | ||||||
| # | Appliance | Connection Power, kW | Is It Theoretically Possible to Turn on the Device? | To Include into Analysis? | Demand for Energy, kWh |
|---|---|---|---|---|---|
| 1 | Refrigerator | 0.0193 | Yes | Yes | 0.02 |
| 2 | Washing Machine | 0.48 | Yes | Yes | 0.48 |
| 3 | Oven | 0.91 | Yes | Yes | 3.00 |
| 4 | Induction cooktop | 7.2 | No | Yes | 7.20 |
| 5 | Kettle | 1.8 | Yes | Yes | 1.80 |
| 6 | Iron | 2.8 | Yes | Yes | 2.80 |
| 7 | TV, SDR mode | 0.135 | Yes | Yes | 0.14 |
| 8 | Radiator | 5.33 | No | Yes | 5.33 |
| 9 | Water heater | 2 | Yes | Yes | 2.00 |
| 10 | Reserve–XXX | 2.5 | Yes | Yes | 2.50 |
| Total, kWh | 25.27 | ||||
| Months | Daily Production, kWh by Hour | |||||||||||||||
|---|---|---|---|---|---|---|---|---|---|---|---|---|---|---|---|---|
| Hours | ||||||||||||||||
| 0–5 | 6 | 7 | 8 | 9 | 10 | 11 | 12 | 13 | 14 | 15 | 16 | 17 | 18 | 19 | 20–24 | |
| January | 0.83 | 0.97 | 0.97 | 0.82 | ||||||||||||
| February | 1.00 | 1.32 | 1.50 | 1.51 | 1.35 | 1.05 | 0.64 | |||||||||
| March | 0.65 | 1.17 | 1.63 | 1.97 | 1.97 | 1.96 | 1.96 | 1.61 | 1.14 | 0.62 | ||||||
| April | 0.71 | 1.27 | 1.81 | 2.26 | 2.58 | 2.73 | 4.25 | 2.48 | 1.94 | 1.63 | 1.07 | |||||
| May | 0.58 | 1.09 | 1.63 | 2.14 | 2.55 | 2.83 | 2.96 | 2.92 | 2.72 | 2.37 | 1.91 | 1.38 | 0.84 | |||
| June | 0.69 | 1.20 | 1.71 | 2.19 | 2.59 | 2.86 | 3.00 | 2.97 | 2.78 | 2.47 | 2.04 | 1.54 | 1.02 | 0.54 | ||
| July | 0.57 | 1.04 | 1.55 | 2.02 | 2.41 | 2.70 | 2.84 | 2.83 | 2.66 | 2.36 | 1.95 | 1.47 | 0.96 | |||
| August | 0.76 | 1.27 | 1.75 | 2.15 | 2.44 | 2.58 | 2.57 | 2.40 | 2.08 | 1.65 | 1.16 | 0.65 | ||||
| September | 0.94 | 1.43 | 1.84 | 2.13 | 2.26 | 2.21 | 2.00 | 1.64 | 1.18 | 0.67 | ||||||
| October | 0.97 | 1.35 | 1.61 | 1.71 | 1.64 | 1.40 | 1.14 | 0.59 | ||||||||
| November | 0.82 | 1.05 | 1.14 | 1.07 | 0.85 | |||||||||||
| December | 0.74 | 0.85 | 0.81 | 0.63 | ||||||||||||
| Months | Daily Production, kWh by Hour | |||||||||||||||
|---|---|---|---|---|---|---|---|---|---|---|---|---|---|---|---|---|
| Hours | ||||||||||||||||
| 0–5 | 6 | 7 | 8 | 9 | 10 | 11 | 12 | 13 | 14 | 15 | 16 | 17 | 18 | 19 | 20–24 | |
| January | 0.00 | 0.00 | 0.00 | 0.00 | 0.83 | 0.97 | 0.97 | 0.82 | 0.00 | 0.00 | 0.00 | 0.00 | 0.00 | 0.00 | ||
| February | 0.00 | 0.00 | 0.00 | 1.00 | 1.32 | 1.50 | 1.51 | 1.35 | 1.05 | 0.64 | 0.00 | 0.00 | 0.00 | 0.00 | ||
| March | 0.00 | 0.65 | 1.17 | 1.63 | 1.97 | 1.97 | 1.96 | 1.96 | 1.61 | 1.14 | 0.62 | 0.00 | 0.00 | 0.00 | ||
| April | 0.00 | 0.71 | 1.27 | 1.81 | 2.26 | 2.58 | 2.73 | 4.25 | 2.48 | 1.94 | 1.63 | 1.07 | 0.00 | 0.00 | ||
| May | 0.58 | 1.09 | 1.63 | 2.14 | 2.55 | 2.83 | 2.96 | 2.92 | 2.72 | 2.37 | 1.91 | 1.38 | 0.84 | 0.00 | ||
| June | 0.69 | 1.20 | 1.71 | 2.19 | 2.59 | 2.86 | 3.00 | 2.97 | 2.78 | 2.47 | 2.04 | 1.54 | 1.02 | 0.54 | ||
| July | 0.57 | 1.04 | 1.55 | 2.02 | 2.41 | 2.70 | 2.84 | 2.83 | 2.66 | 2.36 | 1.95 | 1.47 | 0.96 | 0.00 | ||
| August | 0.00 | 0.76 | 1.27 | 1.75 | 2.15 | 2.44 | 2.58 | 2.57 | 2.40 | 2.08 | 1.65 | 1.16 | 0.65 | 0.00 | ||
| September | 0.00 | 0.00 | 0.94 | 1.43 | 1.84 | 2.13 | 2.26 | 2.21 | 2.00 | 1.64 | 1.18 | 0.67 | 0.00 | 0.00 | ||
| October | 0.00 | 0.00 | 0.00 | 0.97 | 1.35 | 1.61 | 1.71 | 1.64 | 1.40 | 1.14 | 0.59 | 0.00 | 0.00 | 0.00 | ||
| November | 0.00 | 0.00 | 0.00 | 0.82 | 1.05 | 1.14 | 1.07 | 0.85 | 0.00 | 0.00 | 0.00 | 0.00 | 0.00 | 0.00 | ||
| December | 0.00 | 0.00 | 0.00 | 0.00 | 0.74 | 0.85 | 0.81 | 0.63 | 0.00 | 0.00 | 0.00 | 0.00 | 0.00 | 0.00 | ||
Publisher’s Note: MDPI stays neutral with regard to jurisdictional claims in published maps and institutional affiliations. |
© 2022 by the authors. Licensee MDPI, Basel, Switzerland. This article is an open access article distributed under the terms and conditions of the Creative Commons Attribution (CC BY) license (https://creativecommons.org/licenses/by/4.0/).
Share and Cite
Stopochkin, A.; Sytnik, I. Algorithm for Rapid Estimation of the Performance of Small Rooftop Solar PV Use by Households. Energies 2022, 15, 3910. https://doi.org/10.3390/en15113910
Stopochkin A, Sytnik I. Algorithm for Rapid Estimation of the Performance of Small Rooftop Solar PV Use by Households. Energies. 2022; 15(11):3910. https://doi.org/10.3390/en15113910
Chicago/Turabian StyleStopochkin, Artem, and Inessa Sytnik. 2022. "Algorithm for Rapid Estimation of the Performance of Small Rooftop Solar PV Use by Households" Energies 15, no. 11: 3910. https://doi.org/10.3390/en15113910