Article

Study on the Variation in Heating Energy Based on Energy Consumption from the District Heating System, Simulations and Pattern Analysis

1
Department of Architecture, Korea University, Seoul 02841, Korea
2
Energy Division, Korea Conformity Laboratories (KCL), Seoul 06711, Korea
*
Author to whom correspondence should be addressed.
Energies 2022, 15(11), 3909; https://doi.org/10.3390/en15113909
Submission received: 19 April 2022 / Revised: 23 May 2022 / Accepted: 23 May 2022 / Published: 25 May 2022
(This article belongs to the Topic Building Energy and Environment)

Abstract

:
This study aims to analyze the actual heating energy consumption according to the location and size of apartment houses. The study shows the variation in heating energy consumption in accordance with the living pattern of residents in such apartments. By calculating the average annual heating energy consumption and distribution of the measured heating energy of two years, it was found that the outdoor temperature was inversely proportional to the average heating energy consumption. Moreover, the lowest/highest floors and corner houses were the most vulnerable since they had a lot of area exposed to the outside air and, thus, consume a huge amount of heating energy. According to this study, the heating load had relevance to the factors such as wall loss, window loss, ventilation loss, and solar radiation gain that were analyzed in accordance with the growth in house size. Based on the survey outcome on the living pattern and number of residents, a simulation was conducted to analyze the variation in heating energy consumption. Households consumed the average heating energy for 15.8 h/day and occupied for 16.4 h/day. Households consumed more than the average heating energy for 22.2 h/day and occupied for 21.2 h/day, meaning 6.4 extra hours than those consuming the average heating energy. Households consumed less than the average heating energy for 5.2 h/day and occupied for 10.9 h/day, meaning 10.6 less hours/day than those consuming the average heating energy and 17 less hours/day than those consuming more than the average heating energy.

1. Introduction

Building energy takes up the largest portion of greenhouse gas emission and energy consumption by 36%. As environmentally friendly low-energy building technology has come to the fore, the goal is to ensure every new apartment building that will be built from 2025 to be a zero-energy house, which is a 100% energy-independent building generating zero carbon emission. The government also intends to save building energy and cut down greenhouse emissions by enforcing the Green Building Creation Support Act. Although existing research examines energy reduction studies and application plans supported by changes in the building planning factors such as direction and floor of houses as well as the enhancement in building materials, they have not been realized due to economic feasibility [1,2]. In a recent study, an annual simulation and economic analysis on orientation of office buildings were conducted for four cities with different Iranian climates [3]. As a result of the analysis, in the east–west orientation, energy saving was up to 13.6%, and the value of the simple payback period was also evaluated to be lower than in the north–south orientation. However, analysis of residents’ behavior was not included. According to the existing study, the behavior of residents is the main influence on the total energy consumption and the behavior of building dwellers is attributable to a twofold energy consumption deviation [4,5]. The study also revealed that the variation in energy consumption within the same building was caused by the difference in living pattern of residents, density of occupation, and building environment system [6,7]. In particular, Shin [8,9] developed an algorithm for occupant-based heating control and conducted a study applying it. The accuracy of the algorithm developed based on indoor CO2 concentration and passive infrared (PIR) signals was evaluated as 83.5–98.9%. In addition, it was analyzed that the optimal heating start and stop time was found through simulation and the heating energy consumption was reduced by up to 3.1%. In addition, it was found that the thermal discomfort time was reduced from 62.5 to 8.3 h. The limitations of existing studies include that results were derived only by simulation and comparative verification with measured data, and the behavior of residents, a major influencing factor of heating energy, was not considered, and there is no comprehensive research.
The novelty of this study is divided into three. First, while most of the existing studies were simulated, this study aims to analyze the measured heating energy of the selected flat-type apartment, the most common type of apartment in Korea, and verify the results through simulation reflecting the resident survey. Second, the actual heating energy consumption of apartment houses is analyzed by location and size of the house, and the heating load factors are classified into ventilation loss, window loss, wall loss, solar heat increase, human heat generation, and facility heat generation. Finally, this study has novelty that was not present in previous studies by investigating patterns of residents and analyzing variation in heating energy. This study looked into a total of two years of measured heating energy in the winter season between November 2010 and March 2011 (hereinafter referred to as ‘2010 measured data’) as well as November 2011 to March 2012 (hereinafter referred to as ‘2011 measured data’), and categorized the consumption by different house sizes (35, 84, and 164 m2). The study also calculated the annual heating energy by accumulating the heating energy from November to March and compared between the measured average monthly heating energy and monthly outside air temperature measured by KMA (Korea Meteorological Administration). The measured heating energy from each household was identified by house size and location. Lastly, the study analyzed the variation in heating energy consumption according to the residents’ living patterns to determine how the behavior of residents affects their energy consumption. Figure 1 shows the study flow chart.

2. Materials and Methods

2.1. Subject and Method of Evaluation

Apartment Houses Subjected to Evaluation

This study analyzes the apartment houses located in Seongnam city, Gyeonggi Province, where the actual heating energy consumption in the winter season through district heating was obtained. For the study, three buildings with different exclusive private areas within the housing complex were selected. They were all flat-type apartment houses. The subjects are shown in Table 1 and were modeled and simulated by placing nearby buildings according to the apartment-housing layout in order to consider the impact of solar shading from those nearby buildings. A total 240 households composed of 120 households sized 35 m2, 70 households sized 84 m2, and 50 households sized 164 m2, were evaluated

2.2. Simulation

This study compared between the simulation inputting the envelope composition materials of apartment houses and the measured heating energy. It examined the influence of loss or gain of heating load elements on the increasing heating energy consumption as the size of exclusive private area of households grew (Refer to Section 3.5). In addition, to verify that the residents’ living patterns (reflecting the density of occupancy and hours of heating use) and the number of residents were the reasons behind the differences in heating energy consumption from the same building (Refer to Section 4.5), the study conducted a resident survey on living patterns and reflected such outcome into the simulation.

2.2.1. Evaluation Tools for Simulation

The heating energy analysis program used in this study is EnergyPlus, which enables text-based input and selection, and uses the same engine as the DOE-2 and BLAST programs. In addition, it can be linked with Google SketchUp and is a program that calculates the building energy using numeric analysis based on heat balance algorithms. Additionally, LBNL Window 7 program was used for calculating the g-value and visible transmittance value of windows that met the criteria of heat transmission coefficient being inputted.

2.2.2. Input Criteria for Simulation

In this study, regarding the outer wall, floor, roof, and outside window components, the heat transmission coefficient by each region constructed on the apartment house was applied as a material property. The below Table 2 shows the set value of material property for envelope composition.
Regarding the material property from Table 2, the set temperature of heating, air change per hour, electric power heating value, and heat from people referred to the Operational Regulation on the Certification of Building Energy Efficiency [10]. The weather data for simulation utilized the KMA’s data regarding Seoul region, which is the nearest to the studied apartment house. Additionally, the mid-floor houses were simulated as a benchmark. Since the mid-floors had both upper and lower neighbors to their border of roofs and floors, adiabatic process was set up.

3. Analysis of the Measured Heating Energy Data

The measured values of actual heating energy consumption targeting 240 households sized 35, 84, and 164 m2 were analyzed. During the data analysis, households that consumed zero energy from November to March were excluded from the calculation of average consumption of heating energy.

3.1. Analysis of the Measured Heating Energy by Household Size

3.1.1. Measured Annual Average Heating Energy Consumption from Households Sized 35 m2

The below Figure 2 shows the distribution of measured annual average heating energy consumption from 120 households sized 35 m2.
The average heating energy consumption per unit area of 120 households sized 35 m2 was measured at 69.7 kWh/m2·a in 2010 and 58.6 kWh/m2·a in 2011. The average heating energy consumption that was revised by excluding the households with zero consumption from November to March was measured at 83.0 kWh/m2·a in 2010 and 70.8 kWh/m2·a in 2011.

3.1.2. Measured Annual Average Heating Energy Consumption from Households Sized 84 m2

The below Figure 3 shows the distribution of annual average heating energy consumption from 70 households sized 84 m2 in 2010 and 2011.
The average heating energy consumption per unit area of 70 households sized 84 m2 was measured at 51.0 kWh/m2·a in 2010 and 39.6 kWh/m2·a in 2011. The average heating energy consumption that excluded the households with zero consumption during November and March was measured at 53.9 kWh/m2·a in 2010 and 43.4 kWh/m2·a in 2011.

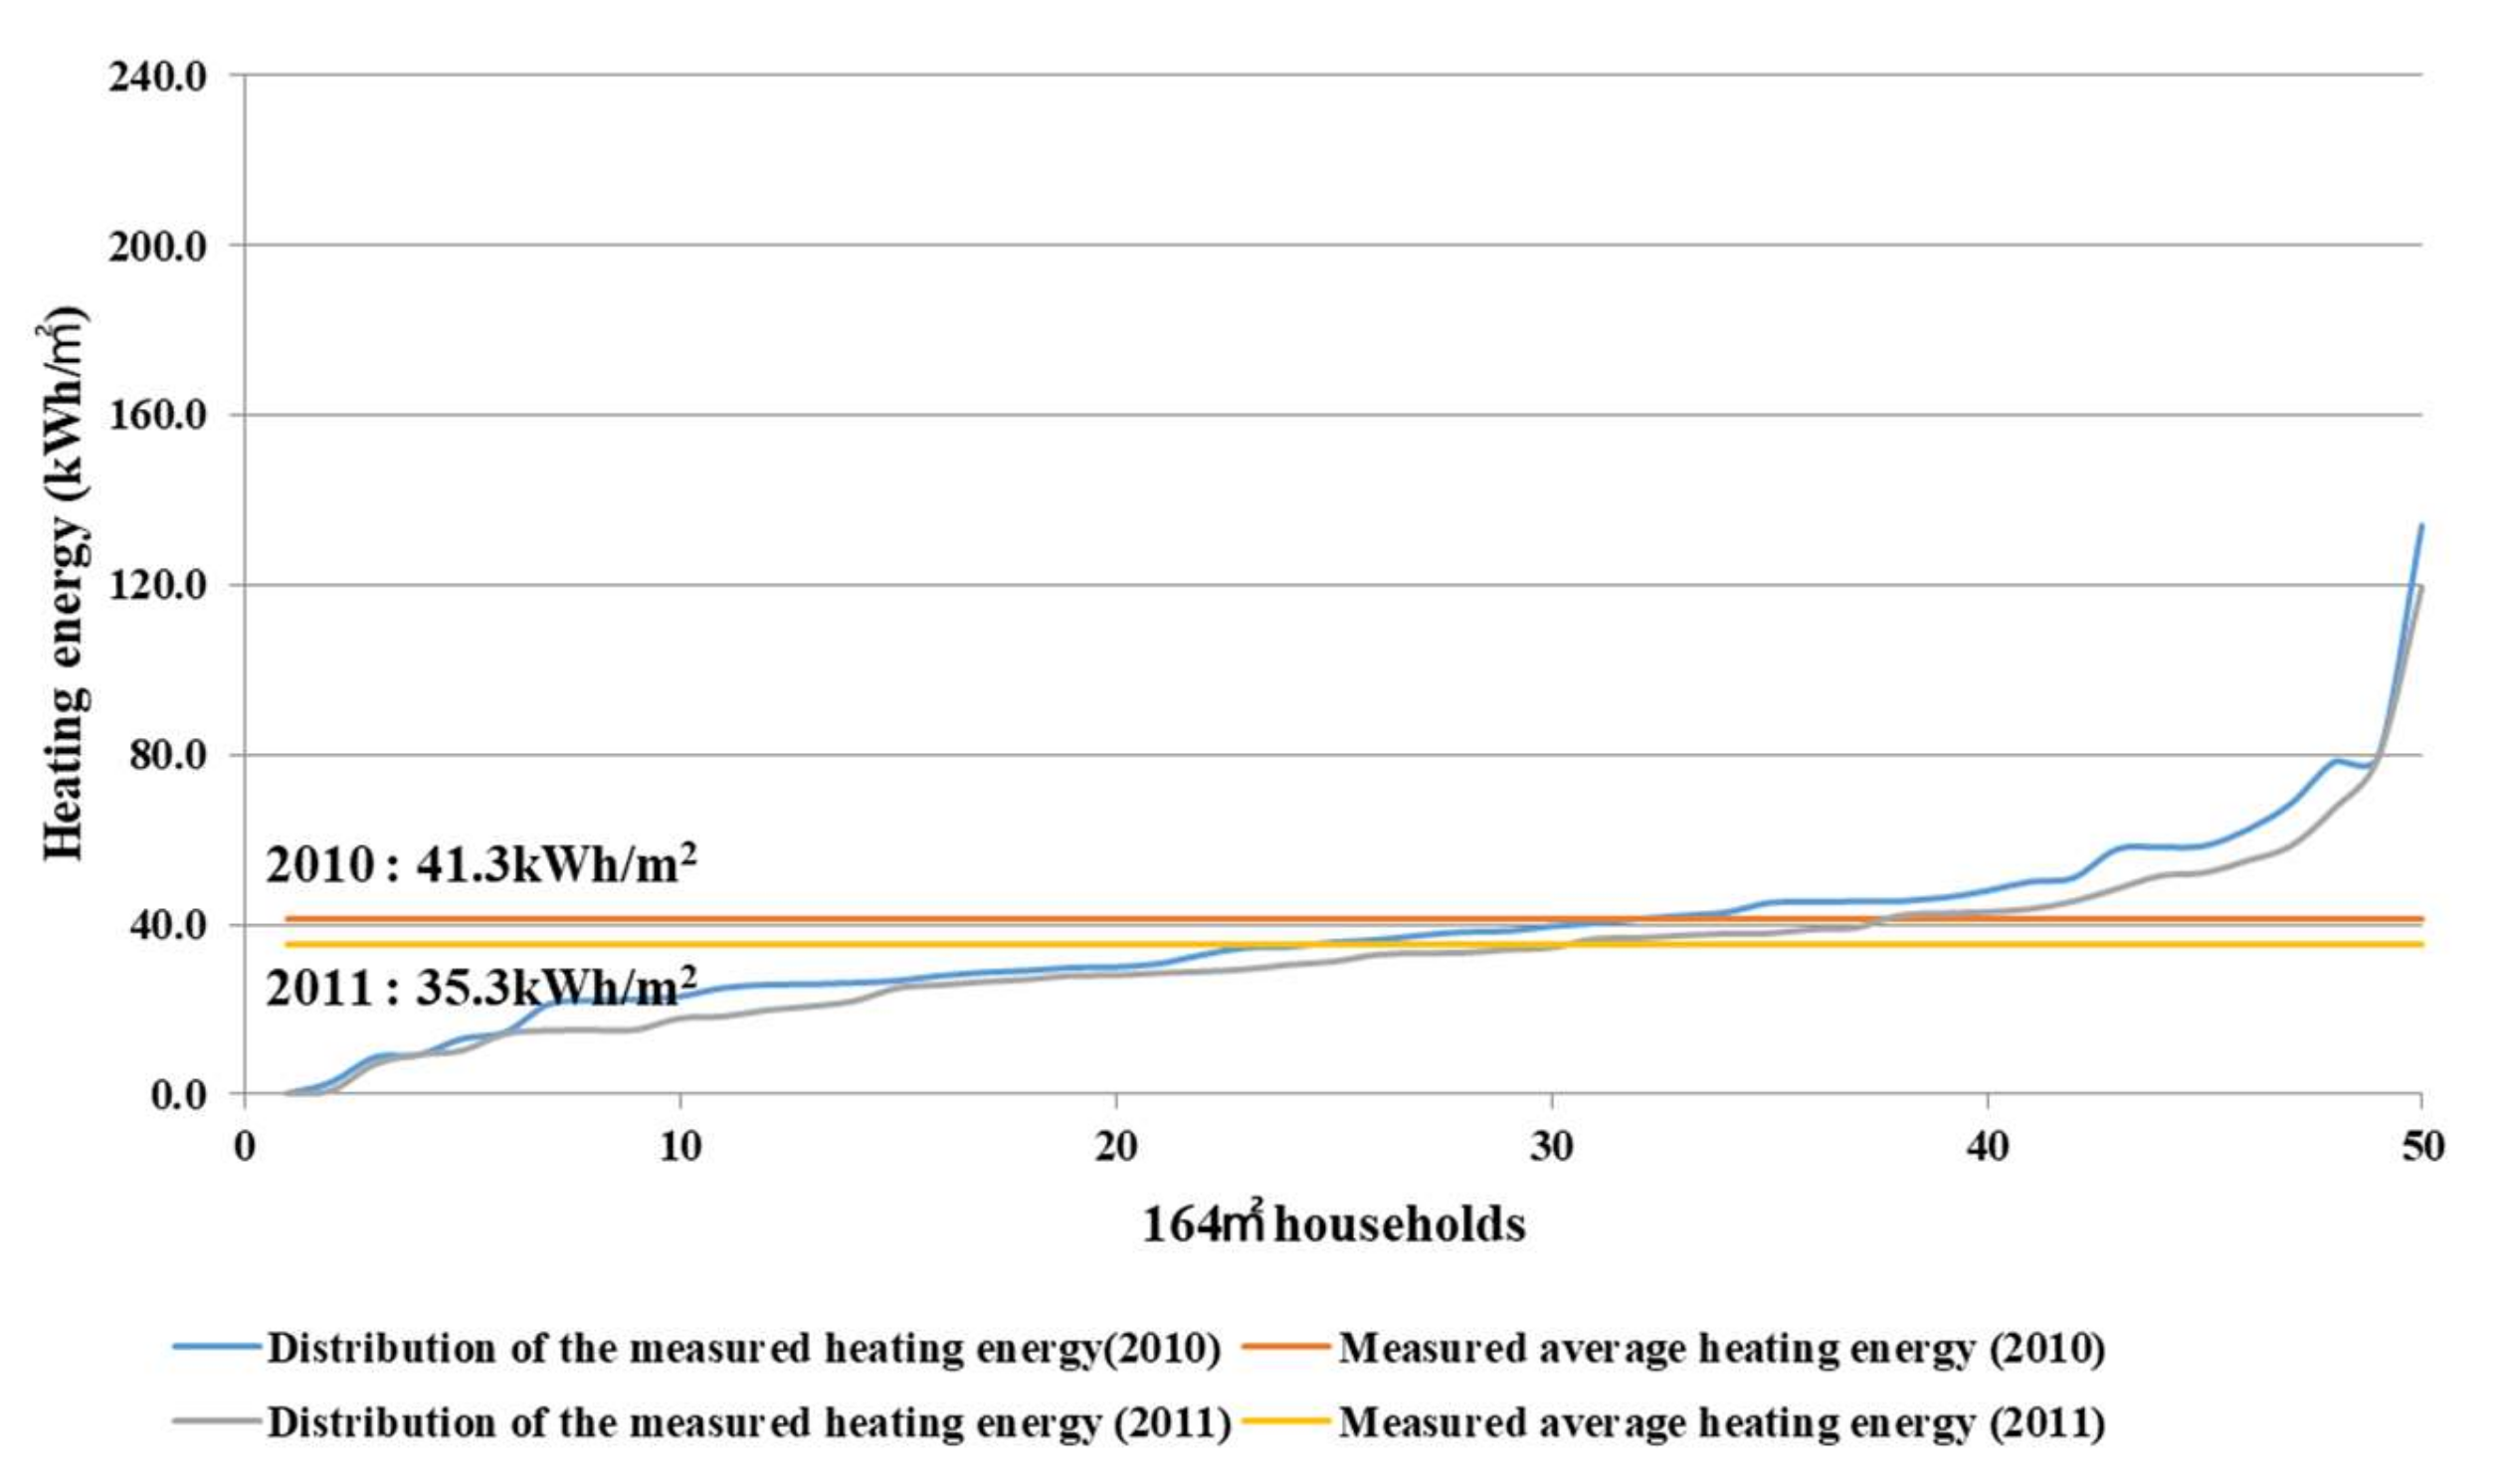
3.1.3. Annual Average Heating Energy Consumption by Households Sized 164 m2

The below Figure 4 shows the distribution of annual average heating energy consumption from 50 households sized 164 m2 in 2010 and 2011.
The average heating energy consumption per unit area of 50 households sized 164 m2 was measured at 38.1 kWh/m2·a in 2010 and 33.4 kWh/m2·a in 2011. The average heating energy consumption that excluded the households with zero consumption during November and March was measured at 41.3 kWh/m2·a in 2010 and 35.3 kWh/m2·a in 2011.

3.2. Comparison between the Measured Monthly Heating Energy Consumption by Household Size and the Outside Temperature

Figure 5 classified the measured monthly average heating energy consumption from 2010 to 2011 by house size. Figure 5 shows a graph comparing the monthly outside temperature data of 2010 with that of 2011 provided by KMA.
The lowest outside temperature during the winter season of 2010 and 2011 was in January. From Figure 5, when the outside temperature of January 2010 was −7.2 °C, the measured average heating energy consumption was the highest of the year, recording 18.3 kWh/m2·a from 35 m2 houses, 11.7 kWh/m2·a from 84 m2 houses, and 9.8 kWh/m2·a from 164 m2 houses. From Figure 5, given that the lowest temperature of January 2011 was −2.8 °C, the measured average heating energy consumption was the highest of the year, recording 17.2 kWh/m2·a from 35 m2 houses, 10.9 kWh/m2·a from 84 m2 houses, and 9.4 kWh/m2·a from 164 m2 houses. Additionally, the highest outside temperature during the winter season was in November. From Figure 5, when the outside temperature of November 2010 was 6.5 °C, the measured average heating energy consumption was the lowest of the year, recording 14.4 kWh/m2·a from 35 m2 houses, 8.7 kWh/m2·a from 84 m2 houses, and 6.6 kWh/m2·a from 164 m2 houses. From Figure 5, given that the highest temperature of November 2011 was 10.7 °C, the measured average heating energy consumption was the lowest of the year, recording 9.9 kWh/m2·a from 35m2 houses, 5.3 kWh/m2·a from 84 m2 houses, and 4.3 kWh/m2·a from 164 m2 houses.
Since the monthly outside temperature of 2010 was lower than that of 2011, the monthly average heating energy consumption of 2010 was larger accordingly. The average heating energy consumption from 35 m2 houses recorded 83.0 kWh/m2·a in 2010, larger than 70.8 kWh/m2·a recorded in 2011. A similar trend was witnessed from 84 and 164 m2 houses, respectively. The graph in Figure 5 indicates that the average heating energy consumption is inversely proportional to the outside temperature.

3.3. Maximum and Minimum Values of Measured Monthly Heating Energy Consumption by Household Size

3.3.1. Maximum and Minimum Values of Measured Monthly Heating Energy Consumption from Households Sized 35 m2

The below Figure 6 shows the maximum and minimum values of measured monthly heating energy consumption from 35 m2 houses in 2010 and 2011.
The measured monthly average heating energy consumption in 2010 and 2011 reached the maximum in January when the temperature was the lowest and the minimum in November when the temperature was the highest during the winter season. Such findings imply that the outside temperature and the measured monthly average heating energy consumption are inversely proportional. Still, as shown in Figure 6, the maximum heating energy consumption in January 2010 from 35 m2 houses was 50.5 kWh/m2·a, failing to be the highest of the year. Meanwhile, the maximum heating energy consumption in January 2011 was 67.3 kWh/m2·a, being the highest of the year.

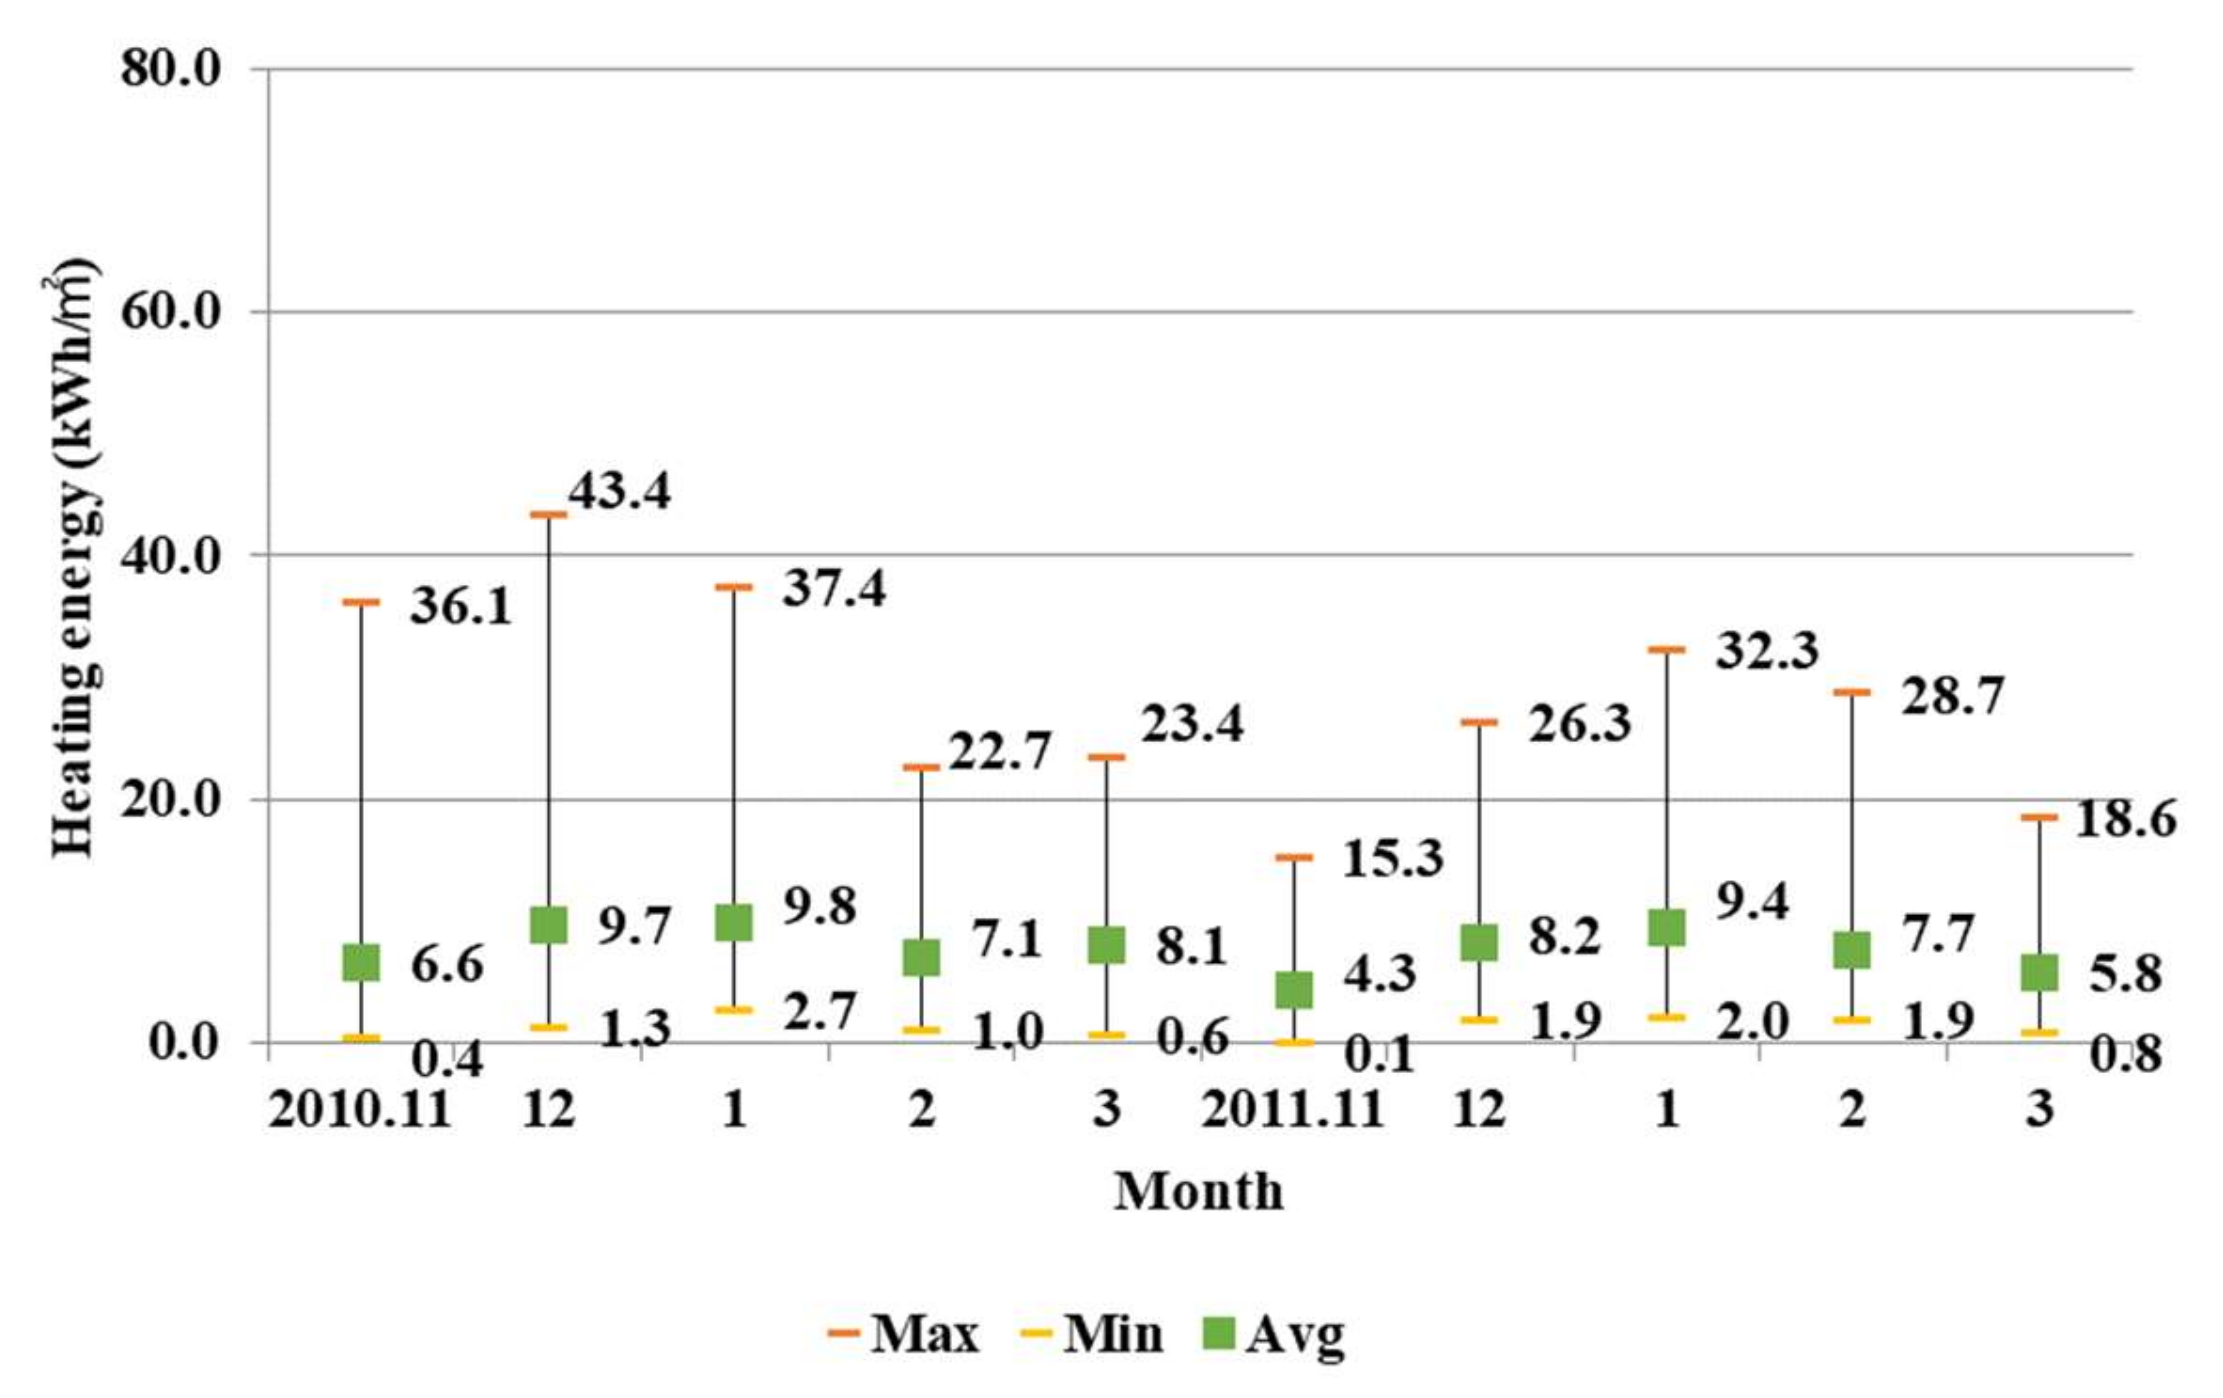
3.3.2. Maximum and Minimum Values of Measured Monthly Heating Energy Consumption from Households Sized 84 m2

The below Figure 7 shows the maximum and minimum values of measured monthly heating energy consumption from 84 m2 houses in 2010 and 2011.
From Figure 7, the measured average heating energy consumption in November 2010 and 2011 from 84 m2 houses reached the lowest by 8.7 and 5.3 kWh/m2·a, respectively, in reverse proportion to the highest outside temperature during the winter season. However, the measured minimum heating energy consumption was 1.1 kWh/m2·a in November 2010, failing to be the lowest of the year, and 0.1 kWh/m2·a in 2011, posting the lowest.

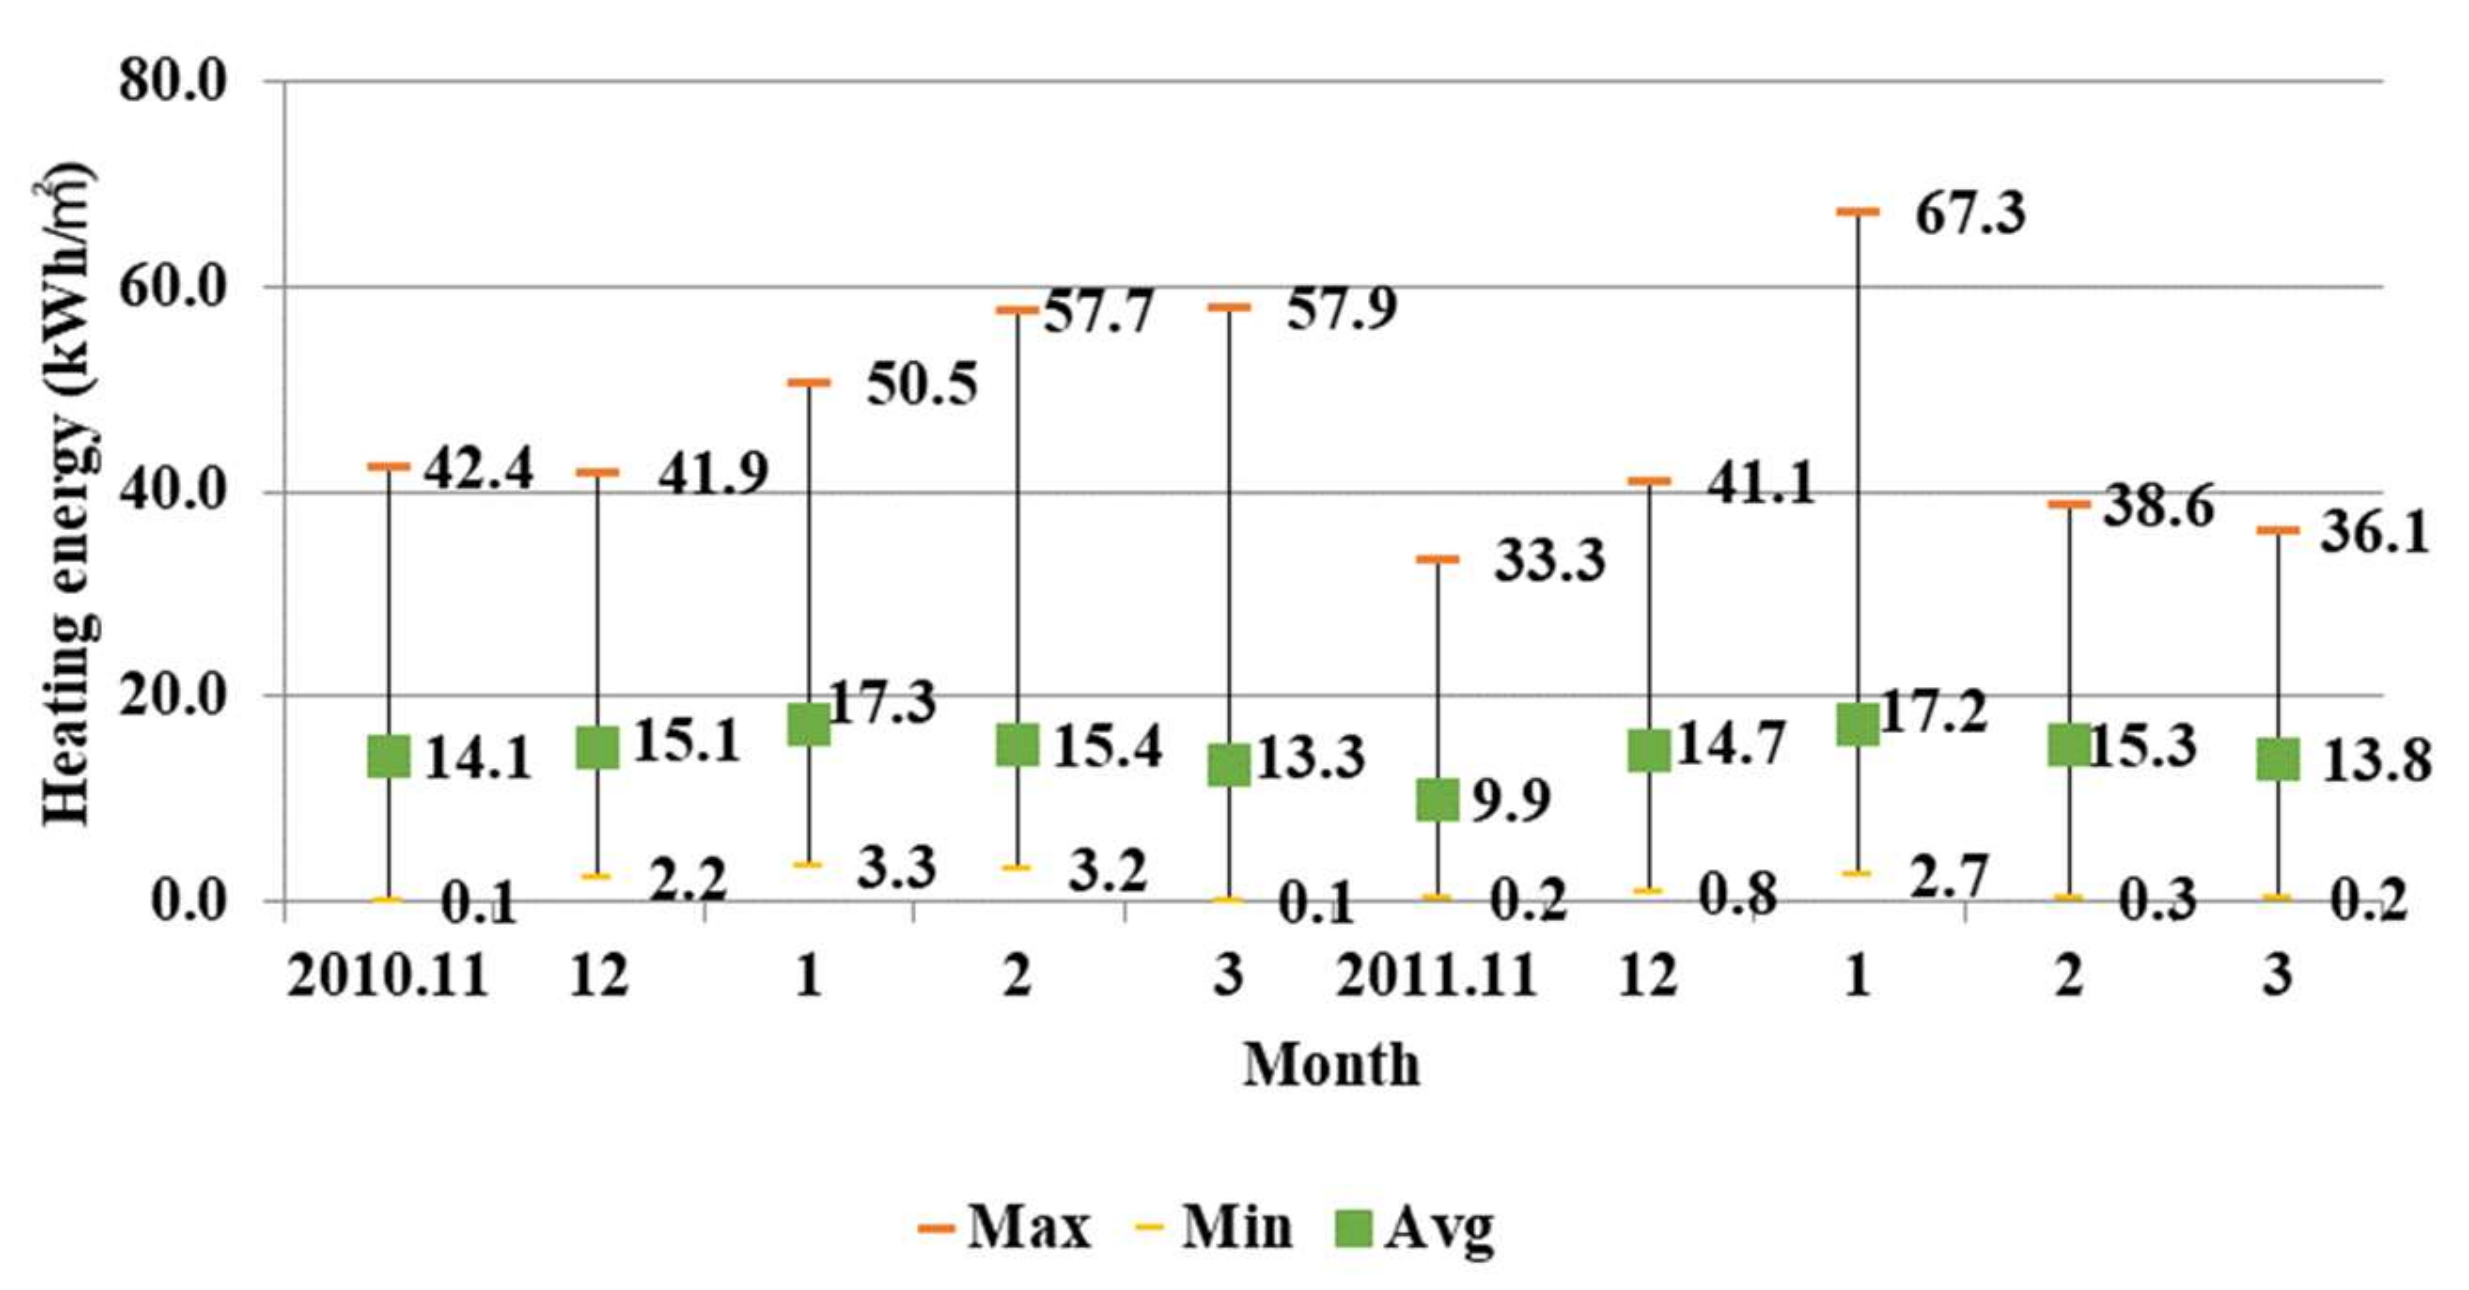
3.3.3. Maximum and Minimum Values of Measured Monthly Heating Energy Consumption from Households Sized 164 m2

The below Figure 8 shows the maximum and minimum values of measured monthly heating energy consumption from 164 m2 houses in 2010 and 2011.
From Figure 8, the measured maximum heating energy consumption from 164 m2 houses recorded 43.4 kWh/m2·a in December 2010, meaning that January was not the highest. However, in January 2011, the measured maximum heating energy consumption recorded 32.3 kWh/m2·a, which was the highest of the year.
As shown in the graphs in Figure 6, Figure 7 and Figure 8, it was found that the maximum and minimum values of measured heating energy consumption by household size were uniformly in reverse proportion to the outside temperature. Such analysis indicates that despite the same household size and outside condition, the energy consumption of households can differ by going above or below the average usage level depending on the residents’ living patterns and number of residents.

3.4. Analysis of the Measured Heating Energy Consumption According to Household Location

Below the measured heating energy consumption from 84 m2 houses as well as the variation in heating energy by floor location and room number is analyzed.

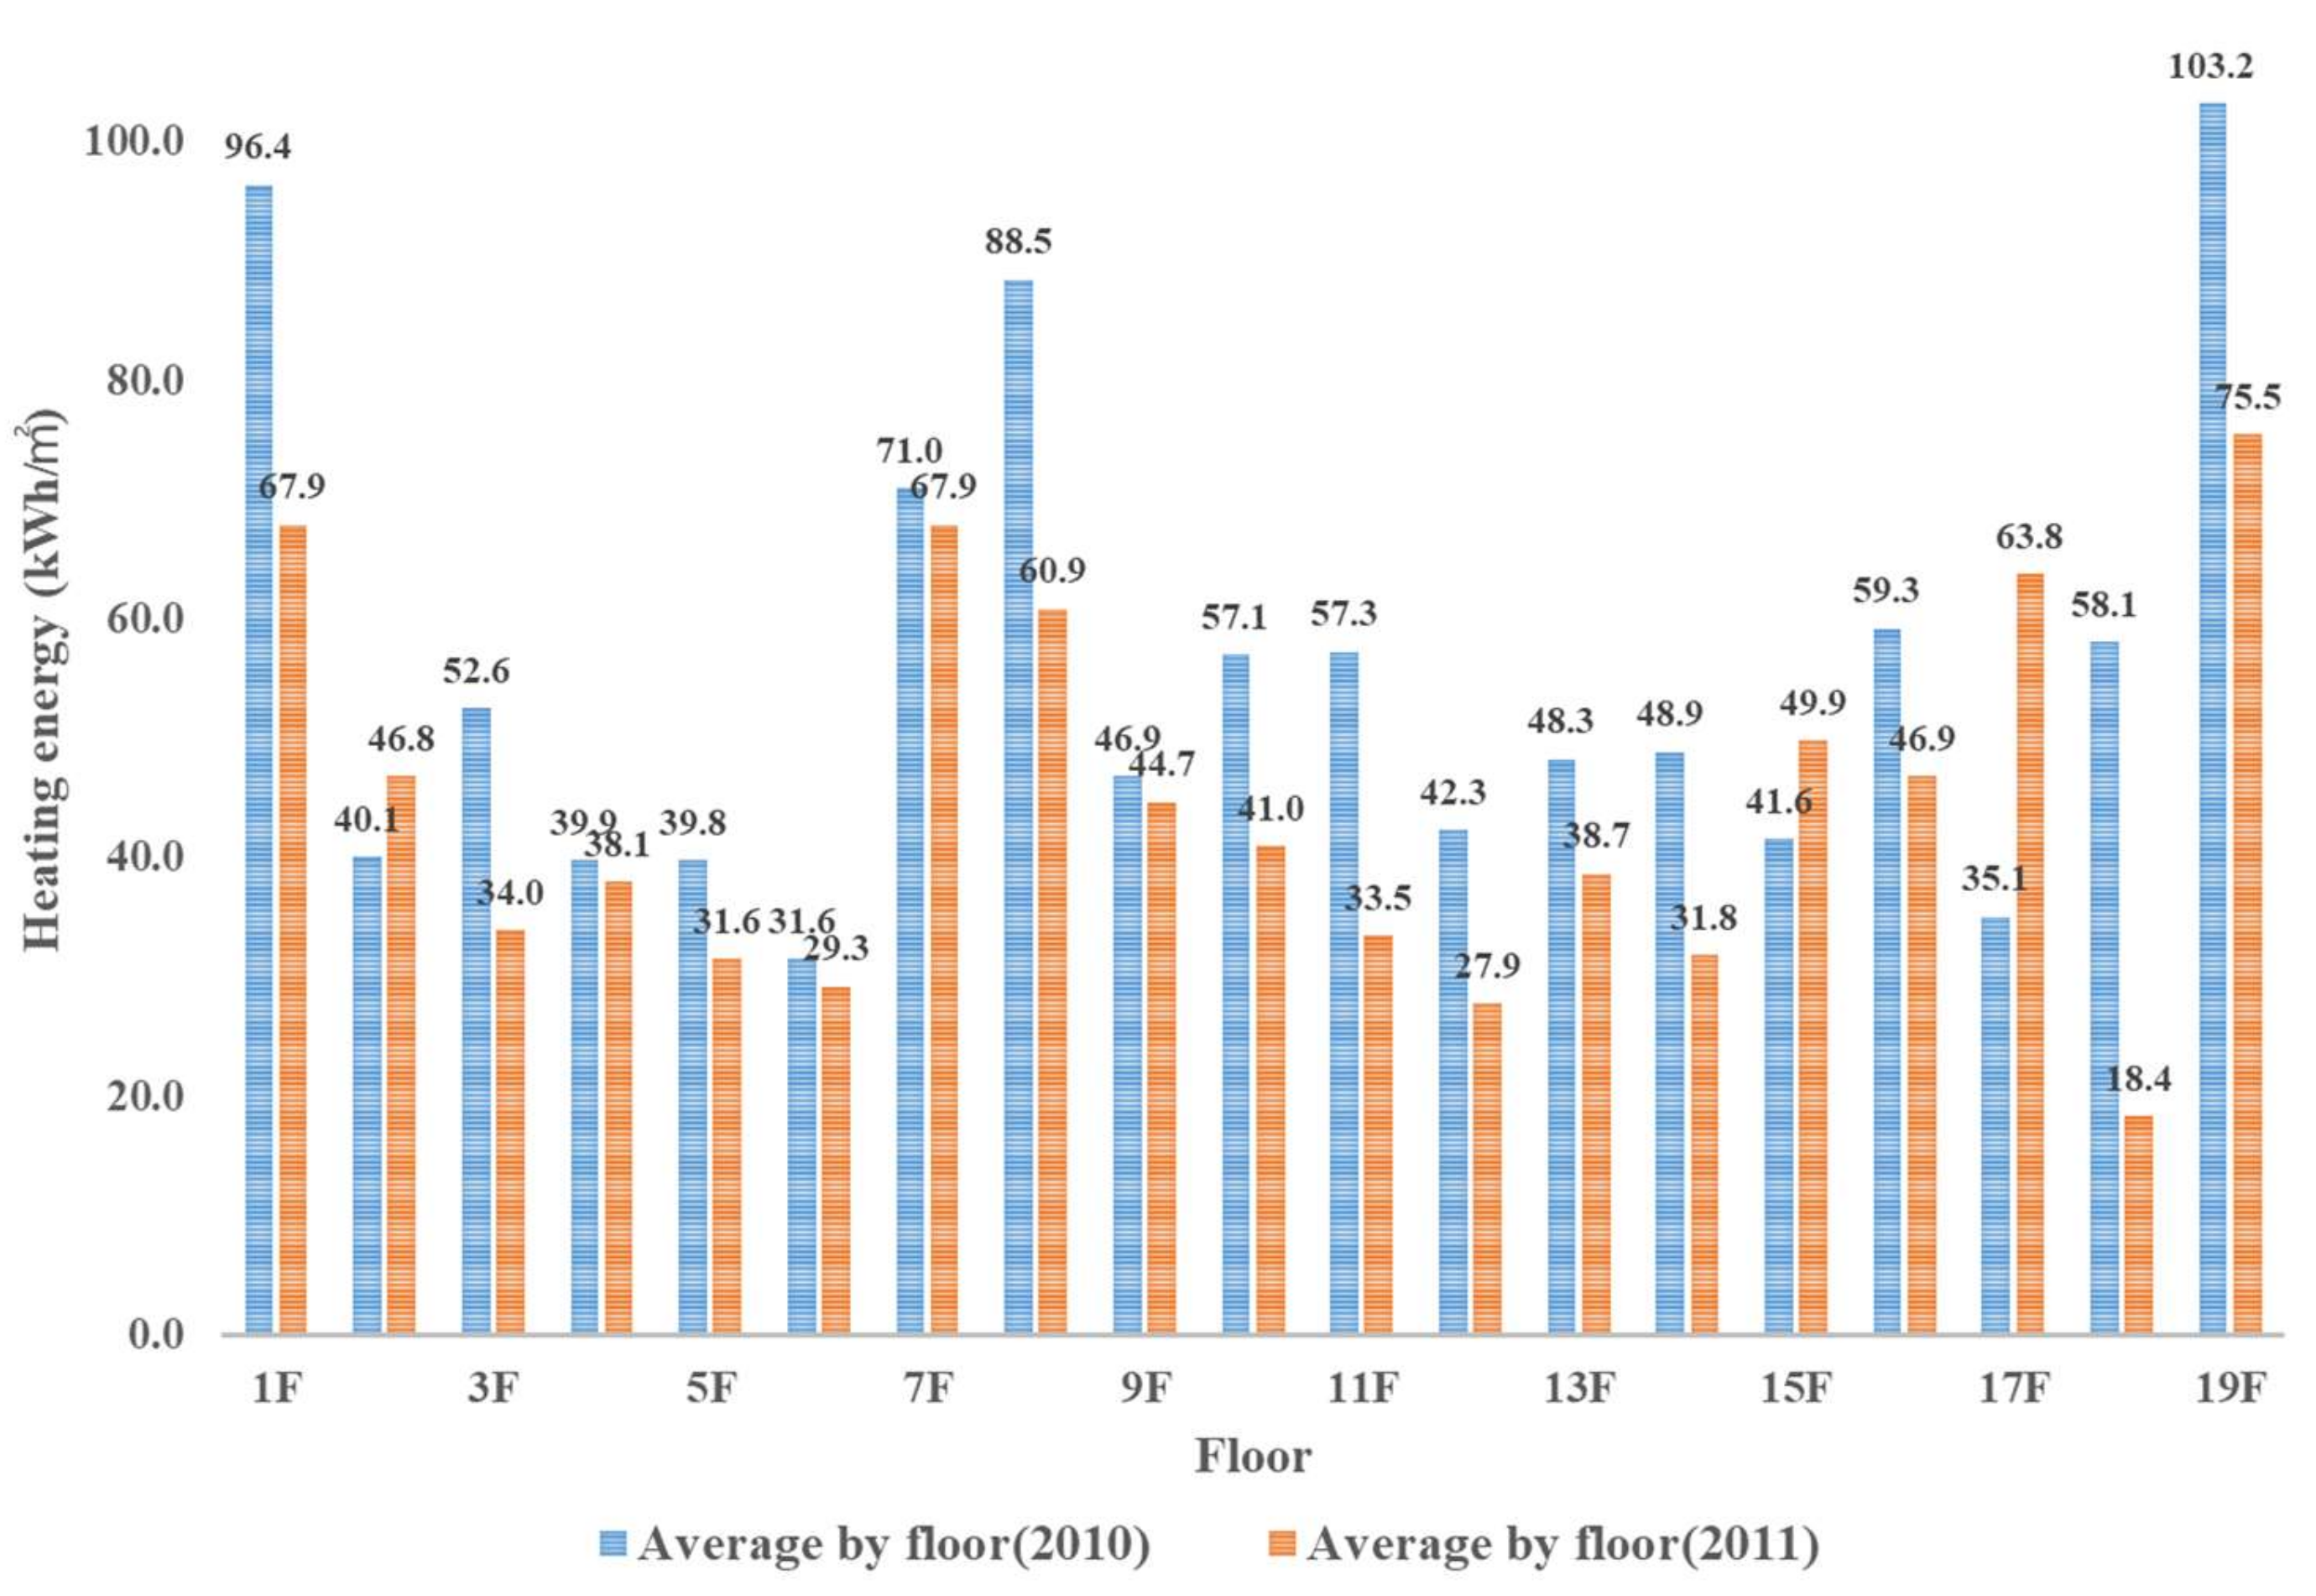
3.4.1. Comparison of the Measured Heating Energy Consumption from the Households Sized 84 m2 by Floor Location

Figure 9 shows the distribution graph of measured heating energy consumption from all floors (by the height of household) in 2010 and 2011.
Table 3 comparatively analyzes the measured heating energy consumption by each floor including the lowest, middle, and highest floors. The 1st floor was evaluated as the lowest floor since its surface bordered to the outside air. As for the mid-floors, the measured heating energy consumption from the 2nd to 18th floors was averaged. As for the highest floor, the measured heating energy consumption of the 19th floor whose roof touched the outside air was measured.
As a result of comparing the measured heating energy consumption of 2010 and 2011 by floor location, the mid-floors were measured at 50 and 41 kWh/m2·a whereas the lowest floor recorded 96 and 68 kWh/m2·a and the highest floors posted 103 and 75 kWh/m2·a. The reason why the lowest and highest floors showed larger heating energy consumption than the mid-floors was assumed to be due to the heat loss occurring through the roof and floor.

3.4.2. Comparison of the Measured Heating Energy from the Households Sized 84 m2 by Room Number

Figure 10 shows the distribution graph of measured heating energy consumption of all floors by room number in 2010 whereas Figure 11 shows that in 2011.
When averaging out the distribution of measured heating energy in 2010 by room number, house no. 1 and no. 4 on the corner showed higher average heating energy consumption (70.6 and 52.1 kWh/m2) than those from mid-floors (41.9 and 50.3 kWh/m2·a). The reason why households on the corner-side showed higher heating energy consumption than those from mid-floors was because they had more space bordering the outside air and, thereby, leading to the rise in wall loss. The average heating energy consumption of house no. 1 and no. 4 on the corner in 2011 were 57.4 and 47.1 kWh/m2·a, being larger than 32.9 and 35.6 kWh/m2·a from mid-floors (household no. 2 and no. 3). Since the outside temperature was lower in 2010 than in 2011 (see Figure 5), the measured average heating energy consumption by room number was higher in 2010 than in 2011.

3.5. Analysis of the Measured Annual Heating Energy Consumption According to the Growth in Household Size

Table 4 classified the monthly heating energy consumption in 2010 from the households sized 35, 84, and 164 m2 whereas Table 5 shows that in 2011.
As shown in Table 4 and Table 5, when the household size becomes larger, the measured annual heating energy consumption increases to 3.2, 5.4, and 7.7 MWh in 2010 as well as 2.7, 4.2, and 6.7 MWh in 2011.

3.6. Analysis of the Measured Annual Heating Energy Consumption According to the Growth in Household Size

Table 6 shows the annual heating energy consumption per unit area of 2010 and 2011 as well as the flat surface of each household and building.
Figure 11 shows the measured heating consumption and the heating energy per unit area.
As shown in Figure 11, when the household size becomes larger, the measured annual heating energy consumption increases whereas the heating energy per unit area decreases. To analyze such, a simulation was conducted.

4. Comparison between the Measured Average Energy Consumption and the EnergyPlus Simulation

4.1. Simulation for Analyzing the Heating Load and Heating Load Elements According to Household Size

EnergyPlus was operated for the simulation to analyze the cause of decreasing heating energy consumption per unit area according to the growth in house size. The material property of envelop composition in Table 2 was entered as an input for simulation while the KMA’s 2010 Seoul region data were used to create weather data. Figure 12 shows the simulation results of heating energy consumption and heating load per unit area.
According to the simulation results of Figure 12, as the house size grew, the annual heating energy consumption increased while the heating load per unit area decreased. Table 7 and Table 8 examined the impact of heating load elements on the heating load as the house size grew. In the process of such analysis, the annual heating energy consumption and heating load were sorted by ventilation loss, wall loss, window loss, solar heat gain, heat from people, and heat from equipment.
When splitting up the annual heating energy consumption per unit area, the heating load usage per unit area also saw equal values or increase in window loss, solar heat gain, heat from people, and heat from equipment as the house size grew. According to Table 8, as the house size grow by about 2.4 times from 35 to 84 m2, the heating load decreases due to the declining wall loss and the rising solar heat gain. According to Table 9, the households sized 35 and 84 m2 both show equal heating load usage (1.9 MWh) for wall loss regardless of the growth in house size. Therefore, when splitting up such households per unit area, Table 8 shows that the wall loss per unit area greatly decreases from 41.2 kWh/m2·a for the 35 m2 house to 18.4 kWh/m2·a for the 84 m2 house. If referring to the floor plan of different house sizes in Table 8, the 35 m2 house is vertically long with a relatively large wall area whereas the 84 m2 house is horizontally long with a large window area. Although the wall area is similar between two different house sizes, the window area greatly increases in case of the 84 m2 house. Therefore, although the households sized 35 and 84 m2 both show 1.9 MWh for wall loss, the solar heat gain jumps about fivefold from 0.8 MWh for the 35 m2 house to 4.2 MWh for the 84 m2 house, reducing the heating load from that of the 35 m2 house. According to Table 7, as the house size doubles from 84 to 164 m2, the increased rate of ventilation loss falls short of twofold from 7.5 to 11.8 MWh. Therefore, when splitting up such households per unit area, Table 8 shows that the ventilation loss per unit area reduces from 71.8 kWh/m2·a for the 35 m2 house to 58.6 kWh/m2·a for the 84 m2 house. In summary, as the house size grows, the ventilation loss and wall loss among the elements of annual heating load usage will remain the same or increase but to a lesser extent than the growth rate of house size. Such factors lead to a decline in heating load per unit area.

4.2. Ratio between Volume and Elevation Area (AV Value) According to the Growth in Household Size

Although the shape of the building is the same, the amount of load varies according to the W/D ratio while the length, width, and height of the building have an impact on the solar heat gain and the amount of external heat loss [11]. For this reason, the index for building volume ratio is used to design in a way to reduce the heat loss from the external building environment. Figure 13 shows the calculation of the ratio between volume and elevation area based on the following Equation (1).
Ratio between volume and floor area (AV value) = Ratio between floor area(A)/volume(v)
According to Figure 13, as the house size grows, the AV values decreases to 0.7, 0.39, and 0.29. The lower the ratio between volume and elevation area (AV value) is, the lesser the impact from the heat gain or heat loss from radiation and convection [11]. In summary, as the house size grows in Figure 12, the annual heating load per unit area decreases because the impact of heat gain or heat loss from convection becomes smaller.

4.3. EnergyPlus Simulation

For the overview of simulation, refer to Section 2 while the schedule for people and equipment is set up as follows.

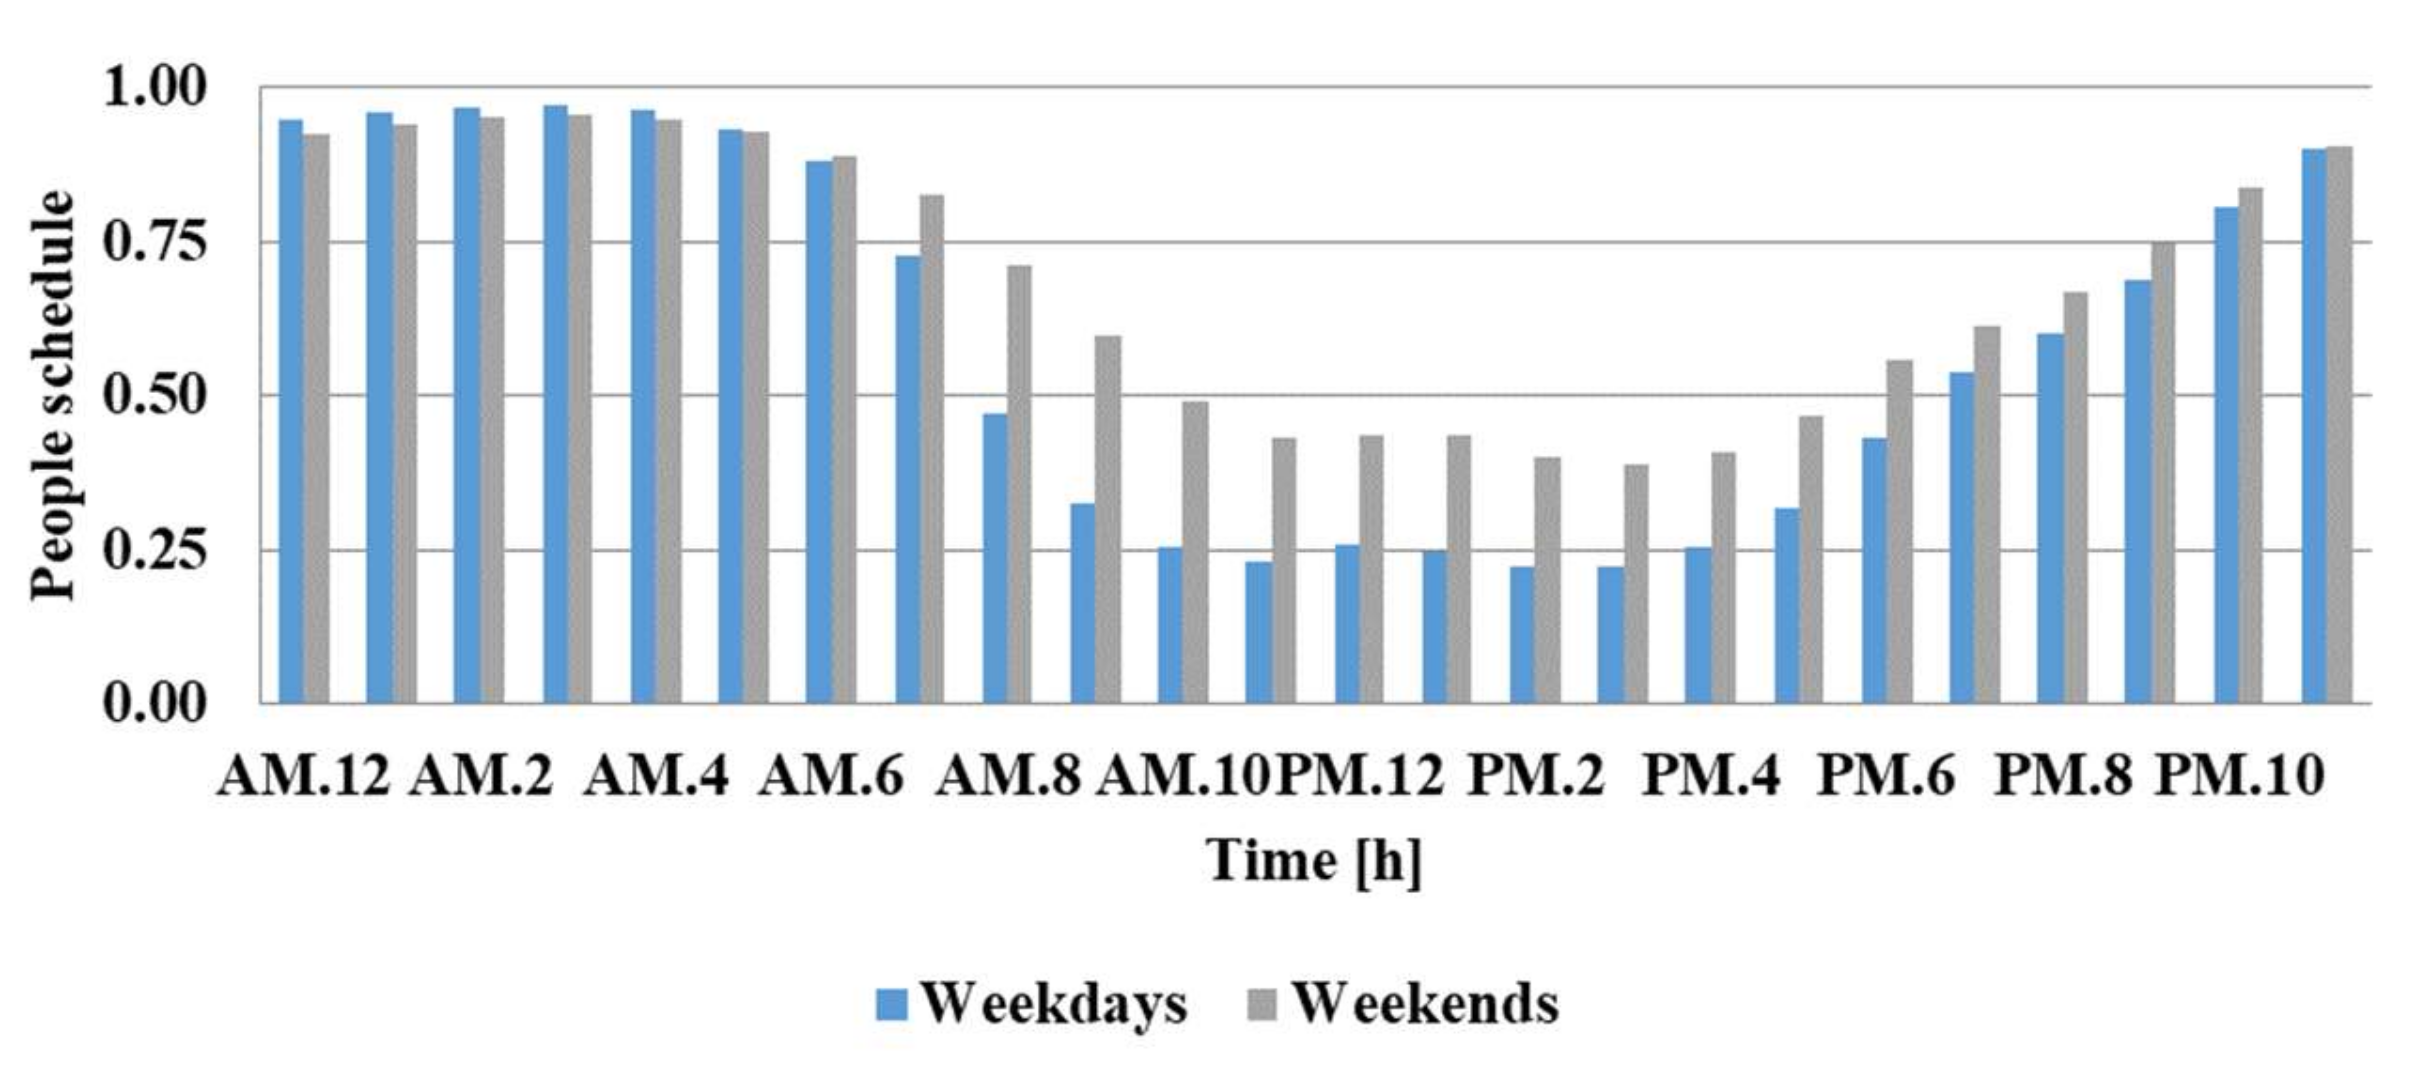
4.3.1. People Schedule Setup

As shown in Figure 14, the ratios of occupancy by residents during weekdays and weekends were entered in EnergyPlus as an hourly schedule by using the 2009 time use survey data from Statistics Korea for simulation [12].

4.3.2. Indoor Equipment Schedule Setup

The schedule of using indoor equipment from Figure 15 referred to the estimation method of housing sector electricity consumption using the time for living activities [13,14]. By referring to the estimation method of electricity consumption based on statistical data such as the population and housing survey and people’s time use survey, this schedule of using indoor equipment was entered into EnergyPlus for simulation.

4.4. Comparison between the Measured Average Energy Consumption and the Simulation

Figure 16 shows the comparison of heating energy simulation results from mid-floor houses and 84 m2 houses using the measured average heating energy consumption of 84 m2 houses in 2010 and Seoul region’s weather data in 2010.
When comparing between the measured average heating energy consumption by room and the simulation results, 50.3 kWh/m2·a from room No. 3 was similar to the simulation result of 52.4 kWh/m2·a. Additionally, room No. 1 and 4 of corner houses that border to outside air showed larger heating energy consumption than mid-floor houses in terms of both simulation and actual measured results.

4.5. Analysis of the Variation in Heating Energy Consumption According to Residents’ Living Patterns

Through the survey on measured heating energy, it was found that the heating energy consumption by each household differed despite the same size and envelope performance [15,16,17,18]. This was due to the residents’ living patterns, occupancy patterns, usage of home appliances, and number of residents. The following Table 9 indicates the survey items and details used to analyze the impact on the heating energy consumption.
Table 9. Survey details and simulation overview.
ItemsSurvey Details
No. of residentsSurvey
Occupancy scheduleSurvey on weekdays and weekends
Heating on/off scheduleSurvey of heating on/off per hour during weekdays/weekends
on a monthly basis (November, December, January, February, March)
Heating setpoint temperature23 °C (References [19,20,21,22])
Equipment and lighting scheduleSurvey from Statistics Korea (References [13,14])—Figure 16
Air change per hour (ACH)Heating0.7 ACHRefer to the Operational Regulation on the Certification of Building Energy Efficiency [10]
Non-heating2.0 ACH
Occupancy density1.44 W/m2
Equipment density3.24 W/m2
Among the 84-m2-sized mid-floor houses of room No. 2 and 3, a total of 12 households (6 households showing average energy consumption, 3 households showing more than the average, and 3 households showing less than the average) were selected for the survey. The simulation reflecting such survey results was compared with the measured heating energy consumption.

4.6. Comparison between the Simulation and the Actually Measured Value from the Households Consuming the Average

Table 10 shows the survey results of 6 households consuming the average heating energy of 41.9~50.3 kWh/m2·a among the 84-m2-sized mid-floor houses of room No. 2 and 3 from Figure 16.
Table 11 and Figure 17 indicate the survey results of heating hour and occupancy hour of 6 households consuming a heating energy of 43.6~51.5 kWh/m2·a as well as the simulation and actual measured values.
According to Figure 17, the simulation reflecting the survey results of households consuming the average heating energy amount showed similar results to the measured heating energy consumption. Except for case 1, cases 2~5 showed slightly higher simulation results than the measured heating energy consumption. Among the 6 cases in Table 11, the households consumed the average heating energy for 15.8 h/day and for 16.4 h/day. The households from cases 1, 5, and 6 occupied an average of 14.6, 13.3, and 12.9 h/day and had similar numbers of residents (4 people) as shown in Table 12. According to Table 13, the households from case 1 consumed the average heating for 14.4 h/day at 47.4 kWh/m2·a of heating energy whereas the households from cases 5 and 6 consumed the average heating for 15 and 16 h/day at 50.4 and 53.5 kWh/m2·a, respectively.

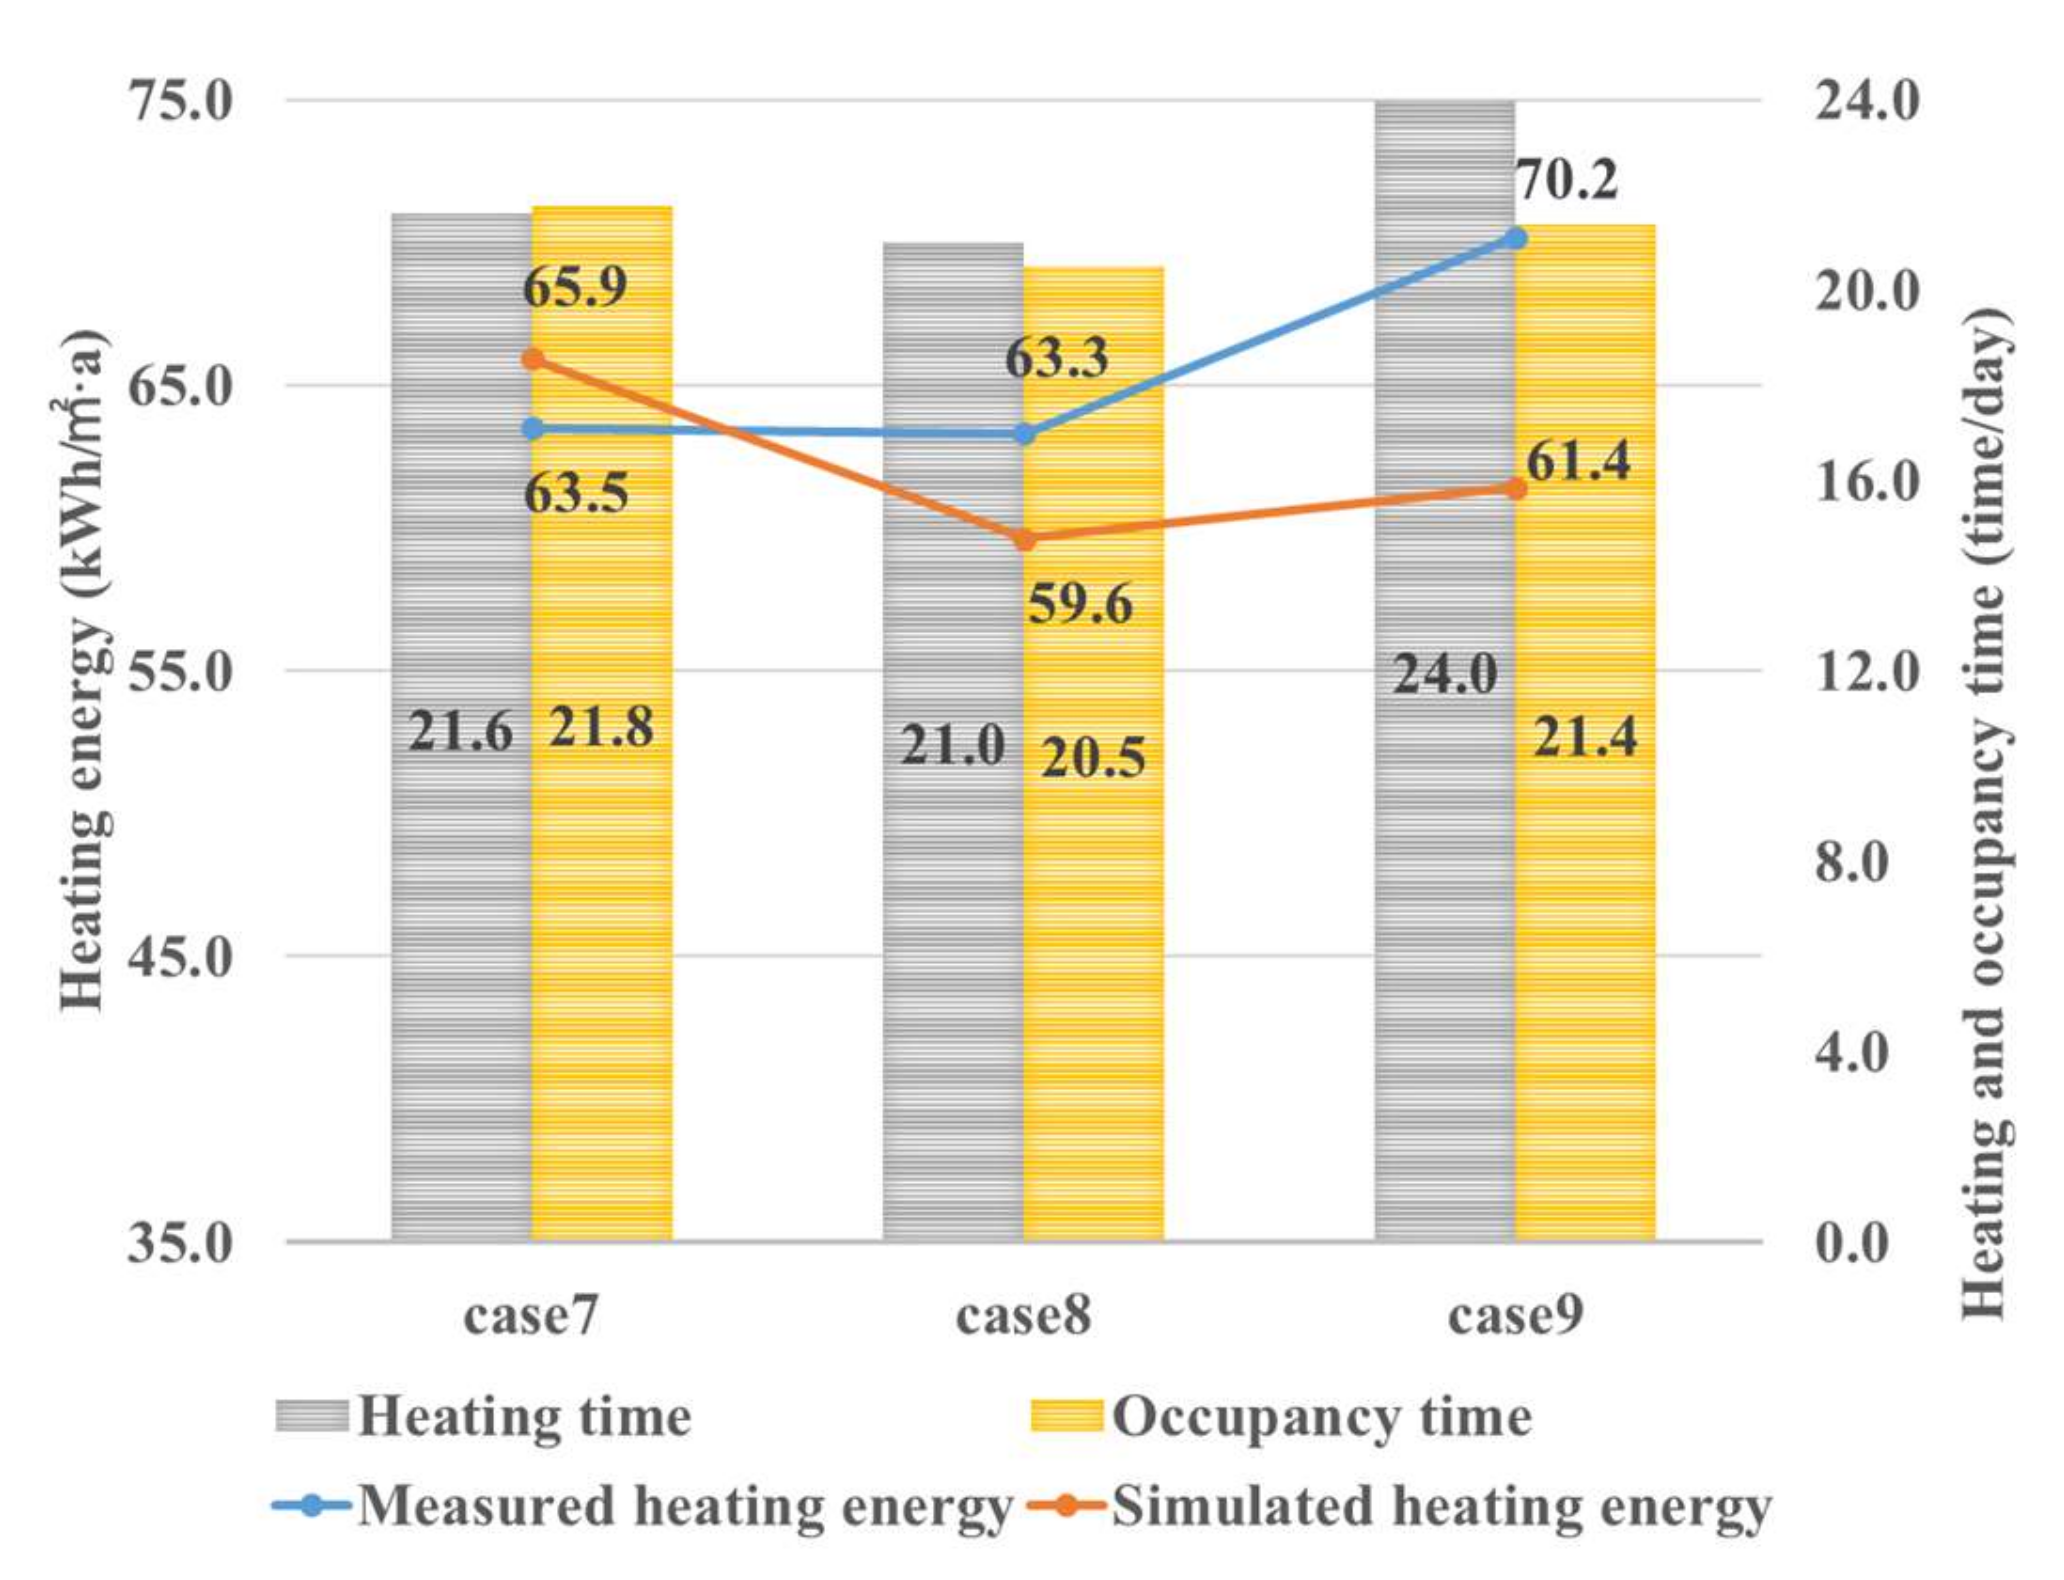
4.7. Comparison between the Simulation and the Actually Measured Value from the Households Consuming More Than the Average

Table 12 shows the survey results of 3 households consuming more than the average heating energy of 41.9~50.3 kWh/m2·a among the 84-m2-sized mid-floor houses from Figure 16.
Table 13 and Figure 18 indicate the survey results of heating hour and occupancy hour of 3 households consuming a heating energy of 63.3~70.2 kWh/m2·a as well as the simulation and actual measured values.
According to Figure 18, except for case 7, cases 8 and 9 showed slightly lower simulation results than the measured heating energy consumption. From Table 13, the households consumed more than the average heating energy for 22.2 h/day and occupied for 21.2 h/day. Accordingly, the heating hour and occupancy hour increased compared to the households from cases 1~6 from Table 11 that consumed the average heating energy. From Table 13, the households from cases 7 and 8 consumed the average heating energy for 21.6 and 21.0 h/day and occupied for 21.8 and 20.5 h/day. Although the heating hour and occupancy hour of the two households were similar, the heating energy recorded differently by 65.9 and 59.6 kWh/m2·a, respectively. Such difference was because the household from case 7 had 1 resident whereas the household from case 8 had 3 residents showing higher heat from people and thereby consumed less heating energy.

4.8. Comparison between the Simulation and the Actually Measured Value from the Households Consuming Less Than the Average

Table 14 shows the survey results of 3 households consuming less than the average heating energy of 41.9~50.3 kWh/m2·a among the 84-m2-sized mid-floor houses from Figure 16.
Table 15 and Figure 19 indicate the survey results of heating hour and occupancy hour of 3 households consuming a heating energy of 16.2~24.6 kWh/m2·a as well as the simulation and actual measured values.
From Figure 19, the 3 households consuming less than the average heating energy showed a slightly higher simulation than the measured heating energy consumption. The households consumed less than the average heating energy for 5.2 h/day and occupied for 10.9 h/day. Accordingly, their heating hours and occupancy hours declined compared to the households from cases 1~6 that consumed the average heating energy for 15.8 h/day and occupied for 16.4 h/day and greatly differed from the households from cases 7~9 that consumed more than the average heating energy for 22.2 h/day and occupied for 21.2 h/day.
According to Table 14, the households from cases 11 and 12 had 4 and 5 residents, respectively, and their occupancy hours were similar by showing 10.6 and 9.4 h/day from Table 15. Meanwhile, the average heating hour declined from 6.9 h/day for case 11 to 4.2 h/day for case 12. Accordingly, as a result of simulation in Table 15, the heating energy declined from 28.4 kWh/m2·a for case 11 to 19.0 kWh/m2·a for case 12. The measured heating energy consumption also dropped from case 11 to case 12. According to the households from cases 10 and 12 from Table 15, the average heating hour was similar by showing 4.6 and 4.2 h/day. However, the occupancy hour of 12.6 h/day for case 10 was higher than 9.4 h/day for case 12. Still, the simulation results showed similar level of heating energy by posting 20.7 and 19.0 kWh/m2·a, respectively. This implied that the impact from occupancy hour was small. If the heating hour was similar, the heating energy showed a similar level as well.

5. Conclusions

The results of this study are outlined as follows:
(1)
Since the outside temperature in the winter season of 2010 was lower than that of 2011, the annual heating energy consumption was higher in 2010 than in 2011. As the average heating energy of 84 m2 houses was the lowest in November (showing the highest outside temperature amid the winter season) by recording 8.7 kWh/m2·a in 2010 and 5.3 kWh/m2·a in 2011 whereas it was the highest in January (showing the lowest outside temperature amid the winter season) by recording 11.7 kWh/m2·a in 2010 and 10.9 kWh/m2·a in 2011, it was found that the outside temperature was inversely proportional to the heating energy consumption. Meanwhile, the maximum and minimum heating energy values were not uniformly in reverse proportion to the outside temperature. That was because the heating energy consumption of the households of the same size and condition could be more than or less than the average due to the residents’ living pattern and number of residents.
(2)
The average heating energy consumption of mid-floors was 50 kWh/m2·a in 2010 and 41 kWh/m2·a in 2011. However, the average heating energy consumption of the lowest floor was 96 kWh/m2·a in 2010 and 68 kWh/m2·a in 2011 while the highest floor was 103 and 75 kWh/m2·a, respectively. The reason behind higher energy consumption of highest/lowest floors was that those floors suffered more heat loss through the roof and floor than mid-floors. Additionally, when analyzing the measured heating energy consumption of 2010 by room number, household room no. 1 and no. 4 from the corner-side having larger area exposed to the outside air showed higher average heating energy consumption (57.4 and 47.1 kWh/m2·a) than mid-floors. (32.9 and 35.6 kWh/m2·a) Research will be needed to reduce the difference by applying phase change materials, etc., in the future to the part where the heating load of the lowest and highest floor is larger than that of the mid-floors.
(3)
As the house size grows, the measured annual heating energy of 2010 and 2011 increases whereas the heating energy per unit area decreases. As a result of analyzing the heating load elements per unit area through simulation, when the house size expands from 35 to 84 m2 by about 2.4 times, the wall loss per unit area decreases and the solar heat gain increases and, thereby, reducing the heating load. When the unit area doubles from 84 to 164 m2, the ventilation loss jumps from 7.5 to 11.8 MWh by not more than twofold. Accordingly, the ventilation loss per unit area of 84 m2 houses declines. Among each element of annual heating load usage, the ventilation loss and wall loss remained the same or increased as the house size grew but at a lesser rate than the house size growth rate. Therefore, the heating load per unit area declined.
(4)
As the house size increased, the ratio between volume and elevation area (AV value) dropped to 0.7, 0.39, and 0.29. The lower the ratio between volume and elevation area (AV value) is, the lesser the impact from the heat gain or heat loss from radiation and convection. In conclusion, as the house size grows, the annual heating load per unit area decreases.
(5)
The following is the outcome of the simulation reflecting the survey on the living pattern of households that consumed the average, more than the average, and less than the measured average heating energy. Households consumed the average heating energy for 15.8 h/day and occupied for 16.4 h/day. Households consumed more than the average heating energy for 22.2 h/day and occupied for 21.2 h/day, meaning 6.4 extra hours than those consuming the average heating energy. Households consumed less than the average heating energy for 5.2 h/day and occupied for 10.9 h/day, meaning 10.6 less hours/day than those consuming the average heating energy and 17 less hours/day than those consuming more than the average heating energy.
This study conducted a comparative analysis on the variation in heating energy consumption according to the residents’ living pattern and behavior of usage as a method of energy savings. The outcome will serve as basis data in efficiently managing actual energy users in consideration of their behavior of energy usage as well as establishing policies and educational directions. For in-depth analysis in future studies, verification through long-term measured data for more than two years, performing various climate-specific analyses for universal application, and an increase in the number of samples when investigating resident patterns are necessary.

Author Contributions

Conceptualization, S.-J.K.; methodology, D.-Y.P.; formal analysis, S.-J.K.; data curation, D.-Y.P.; writing—original draft preparation, S.-J.K.; writing—review and editing, D.-Y.P.; supervision, D.-Y.P. All authors have read and agreed to the published version of the manuscript.

Funding

This work was supported by Korea Institute of Planning and Evaluation for Technology in Food, Agriculture and Forestry (IPET) through Agri-Food Export Business Model Development Program, funded by Ministry of Agriculture, Food and Rural Affairs (MAFRA) (grant number: 321073-02).

Institutional Review Board Statement

Not applicable.

Informed Consent Statement

Not applicable.

Data Availability Statement

The data presented in this study are available on request from the corresponding author. The data are not publicly available due to the supporting project involving a confidentiality agreement.

Acknowledgments

This paper is based on the author’s master’s thesis.

Conflicts of Interest

The authors declare no conflict of interest.

References

  1. Carlier, R.; Dabbagh, M.; Krarti, M. Energy Performance of Integrated Wall and Window Switchable Insulated Systems for Residential Buildings. Energies 2022, 15, 1056. [Google Scholar] [CrossRef]
  2. Yarramsetty, S.; Rohullah, M.S.; Sivakumar, M.V.N. An investigation on energy consumption in residential building with different orientation: A BIM approach. Asian J. Civ. Eng. 2020, 21, 253266. [Google Scholar] [CrossRef]
  3. Spanodimitriou, Y.; Ciampi, G.; Scorpio, M.; Mokhtari, N.; Teimoorzadeh, A.; Laffi, R.; Sibilio, S. Passive Strategies for Building Retrofitting: Performances Analysis and Incentive Policies for the Iranian Scenario. Energies 2022, 15, 1628. [Google Scholar] [CrossRef]
  4. Gillott, M.; Hall, M. Domestic energy and occupancy: A novel post-occupancy evaluation study. Int. J. Low-Carbon Technol. 2010, 5, 148157. [Google Scholar]
  5. Banker, N.; Steemers, K. Energy and Environment in Architecture; Taylor & Francis: London, UK, 2005. [Google Scholar] [CrossRef]
  6. Yun, G.Y.; Kong, H.J.; Kim, J.T. A Field Survey of Occupancy and Air-Conditioner Use Patterns in Open Plan Offices. Indoor Built Environ. 2011, 20, 137147. [Google Scholar]
  7. Buttitta, G.; Finn, D. A high-temporal resolution residential building occupancy model to generate high-temporal resolution heating load profiles of occupancy-integrated archetypes. Energy Build. 2020, 206, 109577. [Google Scholar] [CrossRef]
  8. Shin, M.S.; Rhee, K.N.; Jung, G.J. Optimal heating start and stop control based on the inferred occupancy schedule in a household with radiant floor heating system. Energy Build. 2020, 209, 109737. [Google Scholar] [CrossRef]
  9. Shin, M.S.; Rhee, K.N.; Lee, E.T.; Jung, G.J. Performance evaluation of CO2-based ventilation control to reduce CO2 concentration and condensation risk in residential buildings. Build. Environ. 2018, 142, 451–463. [Google Scholar] [CrossRef]
  10. Korea Energy Agency. Regulations for the Operation of Building Energy Efficiency Certification System; Korea Energy Agengy: Seoul, Korea, 2011. [Google Scholar]
  11. Korea Presidential Commission on Architecture Policy. Guidelines for Passive Design of Buildings; Korea Presidential Commission on Architecture Policy: Seoul, Korea, 2012. [Google Scholar]
  12. Statistics Korea (KOSTAT). Life Time Statics; Statistics Korea (KOSTAT): Daejeon, Korea, 2009.
  13. Yoo, S.Y.; Kim, J.Y. Analysis of Internal Heat Gain and System Operation Patterns in Residential buildings. In Proceedings of the Society of Air-Conditioning and Refrigerating Engineers of Korea, Kangwon, Korea, 8 July 2011; pp. 683–686. [Google Scholar]
  14. Yoo, J.H. Method for Estimating Electricity Consumption of Residential Sectors by National Time Use Survey. In Proceedings of the Journal of the Korean Architectural Association, Chungbuk, Korea, 23 October 2010; Volume 30, p. 501502. [Google Scholar]
  15. ASHRAE. ASHRAE Handbook: Fundamentals; American Society of Heating, Refrigerating and Air-Conditioning Engineers, Inc.: Peachtree Corners, GA, USA, 2009. [Google Scholar]
  16. United States Department of Energy. Energy Plus Manual Engineering Reference, Version 3.0. USA. Available online: https://bigladdersoftware.com/epx/docs/8-9/engineering-reference/ (accessed on 18 April 2022).
  17. Wolfgang Feist, Passive House Planning Package, Passiv Haus Institut. 2007. Available online: https://www.google.com.hk/url?sa=t&rct=j&q=&esrc=s&source=web&cd=&cad=rja&uact=8&ved=2ahUKEwjGvvPDvfr3AhXOxosBHWsTCswQFnoECAMQAQ&url=http%3A%2F%2Fwookware.org%2Ffiles%2FPHPP.pdf&usg=AOvVaw0EASMx-Qz8TPqH3H0Jk_DR (accessed on 18 April 2022).
  18. Cheung, C.K.; Fuller, R.J.; Luther, M.B. Energy-efficient envelope design for high-rise apartments. Energy Build. 2005, 37, 37–48. [Google Scholar] [CrossRef] [Green Version]
  19. Bae, N.R.; Chun, C.Y. Changes of Residents’ Indoor Environment Control Behavior as a Result of Provided Education and Environmental Information. J. Korean Archit. Assoc. 2008, 24, 285293. [Google Scholar]
  20. Chun, C.Y.; Kim, H.J.; Bae, N.R. Research on Thermal Environment in Apartments’ Living rooms and Residents’ Control Behaviors of a Thermostat. J. Archit. Inst. Korea Struct. Constr. 2005, 21, 209216. [Google Scholar]
  21. Choi, W.K.; Kim, H.J.; Lee, H.G.; Suh, S.J. Theoretical Study on the Patterns of Temperature Variation and Thermal Load According to Each Household Heating and Cooling in Apartment. J. Korean Archit. Assoc. 2007, 23, 279288. [Google Scholar]
  22. Yu, J.; Yang, C.; Tian, L. Low-energy envelope design of residential building in hot summer and cold winter zone in China. Energy Build. 2008, 40, 15361546. [Google Scholar] [CrossRef]
Figure 1. Study flow chart.
Energies 15 03909 g001
Figure 2. Analysis of the measured heating energy consumption from households sized 35 m2.
Energies 15 03909 g002
Figure 3. Analysis of the measured heating energy consumption of households sized 84 m2 in 2010 and 2011.
Energies 15 03909 g003
Figure 4. Analysis of the measured heating energy consumption of households sized 164 m2 in 2010 and 2011.
Energies 15 03909 g004
Figure 5. Comparison between the measured monthly average heating energy consumption by house size and the outside temperature.
Energies 15 03909 g005
Figure 6. Maximum and minimum values of monthly heating energy from households sized 35 m2.
Energies 15 03909 g006
Figure 7. Maximum and minimum values of monthly heating energy from households sized 84 m2.
Energies 15 03909 g007
Figure 8. Maximum and minimum values of monthly heating energy from households sized 164 m2.
Energies 15 03909 g008
Figure 9. Distribution of measured heating energy consumption by the height of households.
Energies 15 03909 g009
Figure 10. Distribution and measured average heating energy in 2010 and 2011 by room number.
Energies 15 03909 g010
Figure 11. Measured heating consumption and heating energy per unit area.
Energies 15 03909 g011
Figure 12. Simulated heating energy consumption and heating load per unit area (EnergyPlus).
Energies 15 03909 g012
Figure 13. Ratio between volume and elevation area (AV value).
Energies 15 03909 g013
Figure 14. People schedule from Statistics Korea’s survey.
Energies 15 03909 g014
Figure 15. Equipment schedule from Statistics Korea’s survey.
Energies 15 03909 g015
Figure 16. Comparison between the measured average heating energy consumption and the EnergyPlus simulation.
Energies 15 03909 g016
Figure 17. Comparison between the measured heating energy consumption and simulation as well as living pattern (case 1–6).
Energies 15 03909 g017
Figure 18. Comparison between the measured heating energy consumption and simulation as well as living pattern (case 7–9).
Energies 15 03909 g018
Figure 19. Comparison between the measured heating energy consumption and simulation as well as living pattern (case 10–12).
Energies 15 03909 g019
Table 1. Selection by type of apartment for evaluation.
Exclusive
Private Area
Modeled HouseholdsModeled Nearby Buildings
35 m2
(120 households)
Energies 15 03909 i001 Energies 15 03909 i002
84 m2
(70 households)
Energies 15 03909 i003 Energies 15 03909 i004
164 m2
(50 households)
Energies 15 03909 i005 Energies 15 03909 i006
Table 2. Set up value of material property for envelope composition of apartment houses subjected to evaluation.
DivisionInput DataSet Value of Material Property
Setpoint
temperature
Heating20 °C
Internal heatEquipment3.24 W/m2
People1.44 W/m2
Number of residents0.03 person/m2
Air change per Hour (ACH)Heating space0.7 ACH
Non-heating space2.0 ACH
Wall
U-Value
Exterior wall0.58 W/m2·K
Interior wall0.64 W/m2·K
Roof/floorAdiabatic (insulation)
Windows
U-Value
Exterior window3.84 W/m2·K
Interior window5.47 W/m2·K
Windows
properties
SHGC
(Solar Heat Gain Coefficient)
0.613
Visible transmittance0.56
Table 3. Analysis of measured heating energy consumption by the height of households.
(Unit: kWh/m2·a)20102011
Lowest floor (1st floor)9668
Mid-floors (average between 2nd and 18th)5041
Highest floor (19th floor)10375
Table 4. Measured annual heating energy consumption according to the growth in household size in 2010.
Size2010~2011 (Unit: kWh)Measured Heating Energy (Unit: MWh)
NovemberDecemberJanuaryFebruaryMarch
35 m25696477037065873.2
84 m284510951182109911325.4
164 m2115217911875134414917.7
Table 5. Measured annual heating energy consumption according to the growth in household size in 2011.
Size2011~2012 (Unit: kWh)Measured Heating Energy (Unit: MWh)
NovemberDecemberJanuaryFebruaryMarch
35 m23655606605915182.7
84 m248793910689157444.2
164 m279215891782145410996.7
Table 6. Heating energy per unit area as well as flat surface of each household and building according to household size.
Household
Size
Year of MeasurementHeating Energy
(kWh/m2·a)
Flat Surface of
Each Building
Flat Surface of
Each Household
35 m2201083.0 Energies 15 03909 i007 Energies 15 03909 i008
201170.8
84 m2201053.9 Energies 15 03909 i009 Energies 15 03909 i010
201143.4
164 m2201041.3 Energies 15 03909 i011 Energies 15 03909 i012
201135.3
Table 7. Annual heating load usage according to the growth in house size (EnergyPlus).
Simulation of Annual Heating Load Usage (Unit: MWh)
Household SizeVentilation LossWall LossWindow LossSolar Heat GainHeat from PeopleHeat from EquipmentHeating Energy Consumption
35 m22.31.90.40.80.30.33.2
84 m27.51.91.64.20.60.75.5
164 m211.84.12.88.01.21.38.1
Table 8. Annual heating load per unit area according to the growth in house size (EnergyPlus).
Simulation of Heating Load and Elements per Unit Area (Unit: kWh/m2·a)
Household SizeVentilation LossWall LossWindow LossSolar Heat GainHeat from PeopleHeat from EquipmentHeating Load
35 m250.541.29.018.26.06.070.6
84 m271.818.414.840.25.96.352.6
164 m258.620.213.839.75.96.440.5
Table 10. Survey results of residents consuming the average heating energy.
CaseSelected HouseholdNo. of ResidentsSurvey Results
1Room No. 2024Salary worker, housewife, high school senior, high school junior
2Room No. 3033Salary worker, salary worker, high school graduate
3Room No. 5034Salary worker, housewife, elementary 1st grade, kindergartener
4Room No. 6033Elderly couple, elementary 3rd grade
5Room No. 11024Salary worker, housewife, high school graduate, university student
6Room No. 13034Salary worker, salary worker, elementary 3rd grade and 6th grade
Table 11. Survey results of heating energy, heating hour and occupancy hour (Case 1–6).
CaseHeating Energy [kWh/m2·a]Heating Hour [Hours/Day]Occupancy Hour [Hours/Day]
Actually Measured ValueEnergyPlusWeekdayWeekendAverageWeekdayWeekendAverage
149.947.414.414.414.414.016.014.6
251.556.9 18.418.418.417.818.518.0
343.647.912.024.015.416.719.717.5
449.350.315.415.415.421.024.021.9
547.350.415.015.015.012.814.813.3
650.253.515.218.016.012.514.012.9
Survey average15.117.515.815.817.816.4
Table 12. Survey results of residents consuming more than the average heating energy.
CaseSelected HouseholdNo. of ResidentsSurvey Results
7Room No. 7031Freelancer
8Room No. 9023Elderly couple, salary worker
9Room No. 16034Salary worker, housewife, baby 1 and 2
Table 13. Survey results of heating energy, heating hour, and occupancy hour (Case 7-9).
CaseHeating Energy [kWh/m2·a]Heating Hour [Hours/Day]Occupancy Hour [Hours/Day]
Actually Measured ValueEnergyPlusWeekdayWeekendAverageWeekdayWeekendAverage
763.565.921.621.621.622.121.021.8
863.359.6 21.021.021.020.021.720.5
970.261.424.024.024.021.022.321.4
Survey average22.222.222.221.021.621.2
Table 14. Survey results of residents consuming less than the average heating energy.
CaseSelected HouseholdNo. of ResidentsSurvey Results
10Room No. 4022Salary worker, salary worker
11Room No. 10024Salary worker, salary worker, university student 1 and 2
12Room No. 14035Salary worker, salary worker, university student 1, 2, and 3
Table 15. Survey results of heating energy, heating hour, and occupancy hour (Case 10-12).
CaseHeating Energy [kWh/m2·a]Heating Hour [Hours/Day]Occupancy Hour [Hours/Day]
Actually Measured ValueEnergyPlusWeekdayWeekendAverageWeekdayWeekendAverage
101820.74.45.04.610.518.012.6
1124.628.46.87.26.99.314.010.6
1216.219.04.24.24.28.411.89.4
Survey average5.15.55.29.414.610.9
Publisher’s Note: MDPI stays neutral with regard to jurisdictional claims in published maps and institutional affiliations.

