Article

Experimental Investigation and RSM Modeling of the Effects of Injection Timing on the Performance and NOx Emissions of a Micro-Cogeneration Unit Fueled with Biodiesel Blends

1
Faculty of Science and Technologies, Free University of Bozen-Bolzano, 39100 Bolzano, Italy
2
Department of Mechanical, Energy and Management Engineering, University of Calabria, 87036 Arcavacata di Rende, Italy
*
Author to whom correspondence should be addressed.
Energies 2022, 15(10), 3586; https://doi.org/10.3390/en15103586
Submission received: 13 April 2022 / Revised: 10 May 2022 / Accepted: 11 May 2022 / Published: 13 May 2022

Abstract

:
The (partial or total) substitution of petro-diesel with biodiesel in internal combustion engines (ICEs) could represent a crucial path towards the decarbonization of the energy sector. However, critical aspects are related to the controversial issue of the possible increase in Nitrogen Oxides (NOx) emissions. In such a framework, the proposed study aims at investigating the effects of biodiesel share and injection timing on the performance and NOx emissions of a diesel micro combined heat and power (CHP) system. An experimental campaign has been conducted considering the following operating conditions: (i) a reference standard injection timing (17.2° BTDC), an early injection timing (20.8° BTDC), and a late injection timing (12.2° BTDC); (ii) low (0.90 kW), partial (2.45 kW), and full (3.90 kW) output power load; and (iii) four fuel blends with different biodiesel (B) shares (B0, B15, B30, and B100). Experimental data were also elaborated on thanks to the response surface modelling (RSM) technique, aiming at (i) quantifying the influences of the above-listed variables and their trends on the responses, and (ii) obtaining a set of predictive numerical models that represent the basis for model-based design and optimization procedures. The results show: (i) an overall improvement of the engine performance due to the biodiesel presence in the fuel blend —in particular, B30 and B100 blends have shown peak values in both electrical (29%) and thermal efficiency (42%); (ii) the effective benefits of late SOI strategies on NOx emissions, quantified in an overall average NOx reduction of 27% for the early-to-late injection, and of 16% for the standard-to-late injection strategy. Moreover, it has emerged that the NOx-reduction capabilities of the late injection strategy decrease with higher biodiesel substitution rates; through the discussion of high-prediction-capable, parametric, data-driven models, an extensive RSM analysis has shown how the biodiesel share promotes an increase of NOx whenever it overcomes a calculated threshold that is proportional to the engine load (from about 66.5% to 85.7% of the biodiesel share).

Graphical Abstract

1. Introduction

The constantly-growing energy demand and the crucial environmental issues related to the use of fossil fuels are pushing researchers and technicians to explore the use of alternative fuels both for transportation and stationary applications [1], where distributed generation and cogeneration technologies are leading the present and future energy transitions. Traditional and reliable energy-conversion systems, such as internal combustion engines (ICEs), will still play a relevant role as energy-generation units in the future due to their flexibility, availability, and technological maturity [2,3,4]. Hence, close future challenges are the development of a fossil fuel substitution strategy and the concurrent implementation of pollutant-emission-reduction techniques.
The (partial or total) substitution of fossil fuels with biofuels could represent a path towards (i) the promotion of a diversification of the primary energy sources; (ii) the consequent possible increase in energy security, in terms of continuity of supply, as long as biofuels are produced according to sustainable paths; (iii) the slowdown of the dependence on fossil feedstocks; and (iv) the reduction in harmful greenhouse-gas emissions owing to the renewable origin of the primary sources. Among the different biofuels, biodiesel is the most widespread and preferred because of its physiochemical properties, which are similar to petro-diesel fuel [5,6,7]. Due to its benefits such as renewability, easy producibility, availability, high resulting combustion efficiency, and low pollutants emission, the interest behind the use of biodiesel in traditional compression-ignition engines has grown in the last 20 years [8]. The assessment of its potentiality as a petro-diesel substitute, especially in terms of environmental impact, still represents a research focus for the scientific community [9,10,11,12,13,14]. Critical aspects are related to the controversial issue related to the possible increase in Nitrogen Oxides (NOx) emissions [15], which are dangerous to humans, causing breathing problems, chronically reduced lung function, and eye irritation and may, in the long run, cause cancers and premature death [16]. NOx emissions in compression-ignition ICEs depend on several technical and physical parameters such as: in-cylinder pressure, maximum combustion temperature, air-fuel ratio, combustion duration, air humidity, and the possible oxygen content of the fuel [9,17,18]. The well-known NOx mechanisms of formation clearly indicate that NOx emissions increase with a higher combustion temperature, higher oxygen content in the blend, and lower air humidity [8,19,20]. Moreover, other fuel properties such as cetane number, fuel aromatic content, viscosity [21], and bulk modulus [22,23] can affect NOx emissions directly and indirectly. As stated in a recent review paper by Mirhashemi et al. [9], the NOx behavior of oxygenated fuel blends is complex and current knowledge is not conclusive. Misleading and controversial results are usually easy to find in the scientific literature. With the term NOx-penalty [15], researchers and technicians usually refer to the NOx emissions increase related to the use of oxygenated fuels (such as biodiesel), primarily due to a higher flame temperature and to the presence of fuel-bound oxygen, which is characteristic of biodiesel fuels in particular [15,24,25]. Other main issues related to the biodiesel NOx-penalty are: (i) the changes in spray characteristics due to differences in viscosity, surface tension, and fuel boiling point [15,26]; (ii) the absence of soot particles, due to leaner combustion thanks to the fuel-bound oxygen [15,26]; (iii) the influence of fuel and spray properties on the ignition delay, independently of fuel cetane number [15,26]; and (iv) the fuel chemical effects on the formation of the so-called prompt NOx [15,26]. However, a significant number of scientific studies [27,28,29,30,31] show opposite trends, underlining how biodiesel, both used as a pure fuel and blended in petro-diesel blends, can promote a reduction in NOx emissions. Such results are usually connected to the combustion enhancements caused by the use of oxygenated fuels under specific engine speed and torque conditions [30,32]. The controversial trends existing in the current scientific literature have led scientists to conclude that, in order to state the impact of biodiesel on NOx emissions, the engine operating conditions have to be strongly considered, even more than the physical-chemical characteristics of the fuel [9,33].
Given the relevance of the engine operating conditions, the use of different injection timings—expressed as start-of-injection (SOI) for compression ignition (CI) engines—has become an easy-to-implement investigation technique for optimizing and reducing engine NOx emissions. According to the different technologies of the considered engine, injection time can be set and varied in different ways: (i) shifting the coupling flange, in the case of a combined pump-and-drive side unit, [34]; (ii) acting on the pump roller guide [34]; (iii) regulating the setup screw provided in the fuel injection pump assembly [34,35]; and (iv) adjusting the number of shims between the pump plunger and the driving camshaft [34]. Advanced injection timing leads to enhancements in the turbulence of the air-fuel blend, anticipated and rapid combustion, a longer ignition delay time, and higher combustion chamber pressures and temperatures [34,36]. On the other hand, a retarded injection timing results in lower combustion chamber pressures and temperatures, as well as in a shorter delay of ignition time [34]. Several experimental investigations [9,34,36,37] revealed that advancing the injection timing results in the reduction of carbon monoxide (CO), unburned hydrocarbons (HC), and particulate matter (PM) emissions; at the same time, it increases the overall NOx (i.e., NO and NO2) emissions.
The proposed study fits in the framework of biodiesel emissions assessment and optimization. Given the controversial results in terms of the effects of methyl esters on NOx emissions, this study aims at experimentally evaluating the effect of biodiesel on a micro-cogeneration unit, further enriching the current scientific literature with data on performance and emissions characterization. In particular, a pollutant emissions reduction strategy based on the modification of the injection timing has been experimentally implemented and analyzed in terms of concrete advantages and possible disadvantages.

2. Materials and Methods

2.1. Engine Test Bench and Measurement System

The tests have been performed using a micro-CHP experimental test rig developed in the Bioenergy&Biofuels Lab of the Free University of Bolzano. The experimental set-up includes a cogeneration unit consisting of an internal combustion engine (ICE) directly coupled with a thermal-energy recovery system (Figure 1). The ICE is a single-cylinder, water-cooled compression-ignition engine (a “Farymann 15W430” by Baumo Motoren GmbH, Hilden, Germany; Table 1), and it is coupled with a synchronous, brushless, water-cooled AC-generator, where the mechanical energy delivered from the engine is converted into electricity. The whole genset is commercially known as “Paguro 4000” (by VTE, Trieste, Italy), and it is usually employed as a power generator unit on small marine vessels thanks to an integrated noise-adsorbing external shell (removed in the presented installation, due to the need to access to the engine). The thermal energy, recovered by the engine cooling water circuit, is exchanged and quantified in a properly designed external water circuit. Electrical power output is dissipated through an absorption system (0.1–4.0 kW) based on multiple halogen lamps.
The measuring system is designed to allow the online low-frequency monitoring of several physical variables. The thermal and electrical characterization is carried out through the direct measurement of: (i) the cooling water mass flow rate, (ii) the hot- and cold-water temperatures, (iii) the fuel mass flow rate, and (iv) the output power absorbed by the loads. Hence, the thermal efficiency η t and the electric efficiency η e are measured indirectly as follows:
η e = P e Q f ˙
η t = Q w ˙ Q f ˙
where: P e is the electrical power output, Q f ˙ is the heat rate input of the used fuel, and Q w ˙ is the recovered thermal power from the engine cooling water. While P e is directly measured, Q f ˙ and Q w ˙ are instead calculated as it follows:
Q f ˙ = m f ˙ · L H V f
Q w ˙ = m w ˙ · c p , w T i n , w T o u t , w
The NOx emissions in the exhaust gases are estimated as the algebraic sum of absolute NO and NO2 emissions, which are measured directly through proper instrumentation. A summary of the measurement system characteristics is proposed in Table 2, while a scheme of the whole test-rig is shown in Figure 2.

2.2. Fuels

Four different fuels, based on commercial petro-diesel and palm oil methyl-ester as biodiesel (Table 3), have been tested. The used biodiesel has been produced by the Italian Ecofox [34].
According to their composition, they have been named as: B0 (0% biodiesel, 100% diesel oil), B15 (15% biodiesel, 85% diesel oil), B30 (30% biodiesel, 70% diesel oil), and B100 (100% biodiesel, 0% diesel oil). The Low Heating Values calculated on a mass base (m-LHVs) for the four fuels are, respectively, 42.60 MJ kg−1 (B0), 41.84 MJ kg−1 (B15), 41.08 MJ kg−1 (B30), and 37.53 MJ kg−1 (B100). Given the well-known lower comparative heating values [3] of biodiesel, as the biodiesel share in the mixture increases, the LHV decreases. The fuel blend properties are shown in Table 4.

2.3. Tests Methodology

Experiments were carried out at a constant engine rotational speed of 3000 rpm, i.e., the nominal speed suggested by the genset manufacturer to operate the system. Three different numerical experimental factors (i.e., independent variables) were considered:
  • The biodiesel percentage in the blends (four cases): 0, 15, 30, and 100% (i.e., the values are corresponding to the tested fuel types: B0, B15, B30, and B100).
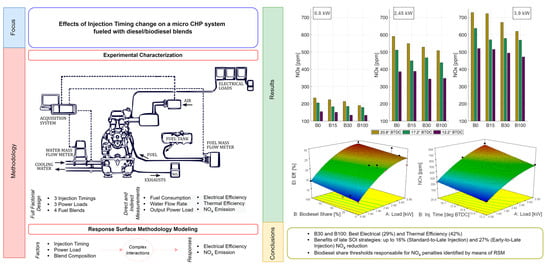
  • The power load (the three load conditions in terms of connected electric power): based on the generator output maximum power, the full load (3.90 kW), the partial load (2.45 kW), and the low load (0.90 kW) were set as reference test conditions by connecting different sets of resistors (used as power-dissipation units) to the electrical generator of the genset.
  • Injection timing/SOI (three cases): based on the manufacturer’s technical indications, the standard injection timing has been defined as beginning at 17.2° before the top dead center (BTDC). Two other configurations were set by properly adjusting the number of shims in the injection pump: a late injection (timing), starting at 12.2° BTDC, and an early injection (timing), starting at 20.8° BTDC.
A full-factorial experimental campaign (with 4 × 3 × 3 = 36 operating conditions) was designed. Hence, each of the tested operating conditions was a point in the 3-D domain of operation of the system, and it was characterized by its three coordinates, i.e., a specific fuel type, power load, and injection timing. Each test had a standard duration of 10 min and has been replicated three times. Measurements have been continuously acquired with a frequency of 1 s. Hence, each presented result is the outcome of an averaging process involving 1800 (600 × 3) samples. Thermal efficiency was calculated only at full load, after reaching the adequate stabilization of all controlled parameters (corresponding to a 30-min run, approximately).
Uncertainties in the measured quantities can arise from environmental conditions, from instrument accuracy and calibration, and from the reading operation. Given the set-up characteristics for the used instrumentation (Table 2), using the definition of the calculated quantities and thanks to the error-propagation methodology, the main percentage uncertainties values were calculated and are shown in Table 5.

2.4. Response Surface Modeling

Experimental data were statistically analyzed to individuate the parameters of influence and to quantify their respective contributions to the measured values. Indeed, after a preliminary analysis of variance (ANOVA) of the parameters (factors) influencing the performance and emissions characteristics (responses), a subsequent application of the response surface methodology (RSM) helped the experimenters to mathematically describe the effects of the statistically significant independent variables on the responses, through explicit regression-functions [19,33,39,40,41,42] (Figure 3). Although each of these functions is completely independent from the physics of the represented process, it numerically approximates the real behavior of the system in a limited validity domain (i.e., the hyperspace delimitated by the extreme values of the factors) in the same way Taylor series do for real functions and can be used to reliably predict the value of each response [43]. For all the cases presented in this article, the used software program, Design-Expert 7.0.0 (by Stat-Ease, Minneapolis, MN, USA [44]), suggested a full-quadratic model as starting point to fit the data. If y and xi are, respectively, a generic response and a generic numerical factor, which are non-coded (i = 1 to m, with m the total number of investigated variables; m ≥ 1); a0 is the interception coefficient; and ai, aii, and aij (ij) are, respectively, the coefficients of the linear, quadratic, 2nd-order interaction terms. The regression model, as proposed by the software, is therefore:
y x i ;   i = 1   to   m = f x i = a 0 + i = 1 m a i x i + 1 i j m a i j x i x j

3. Results

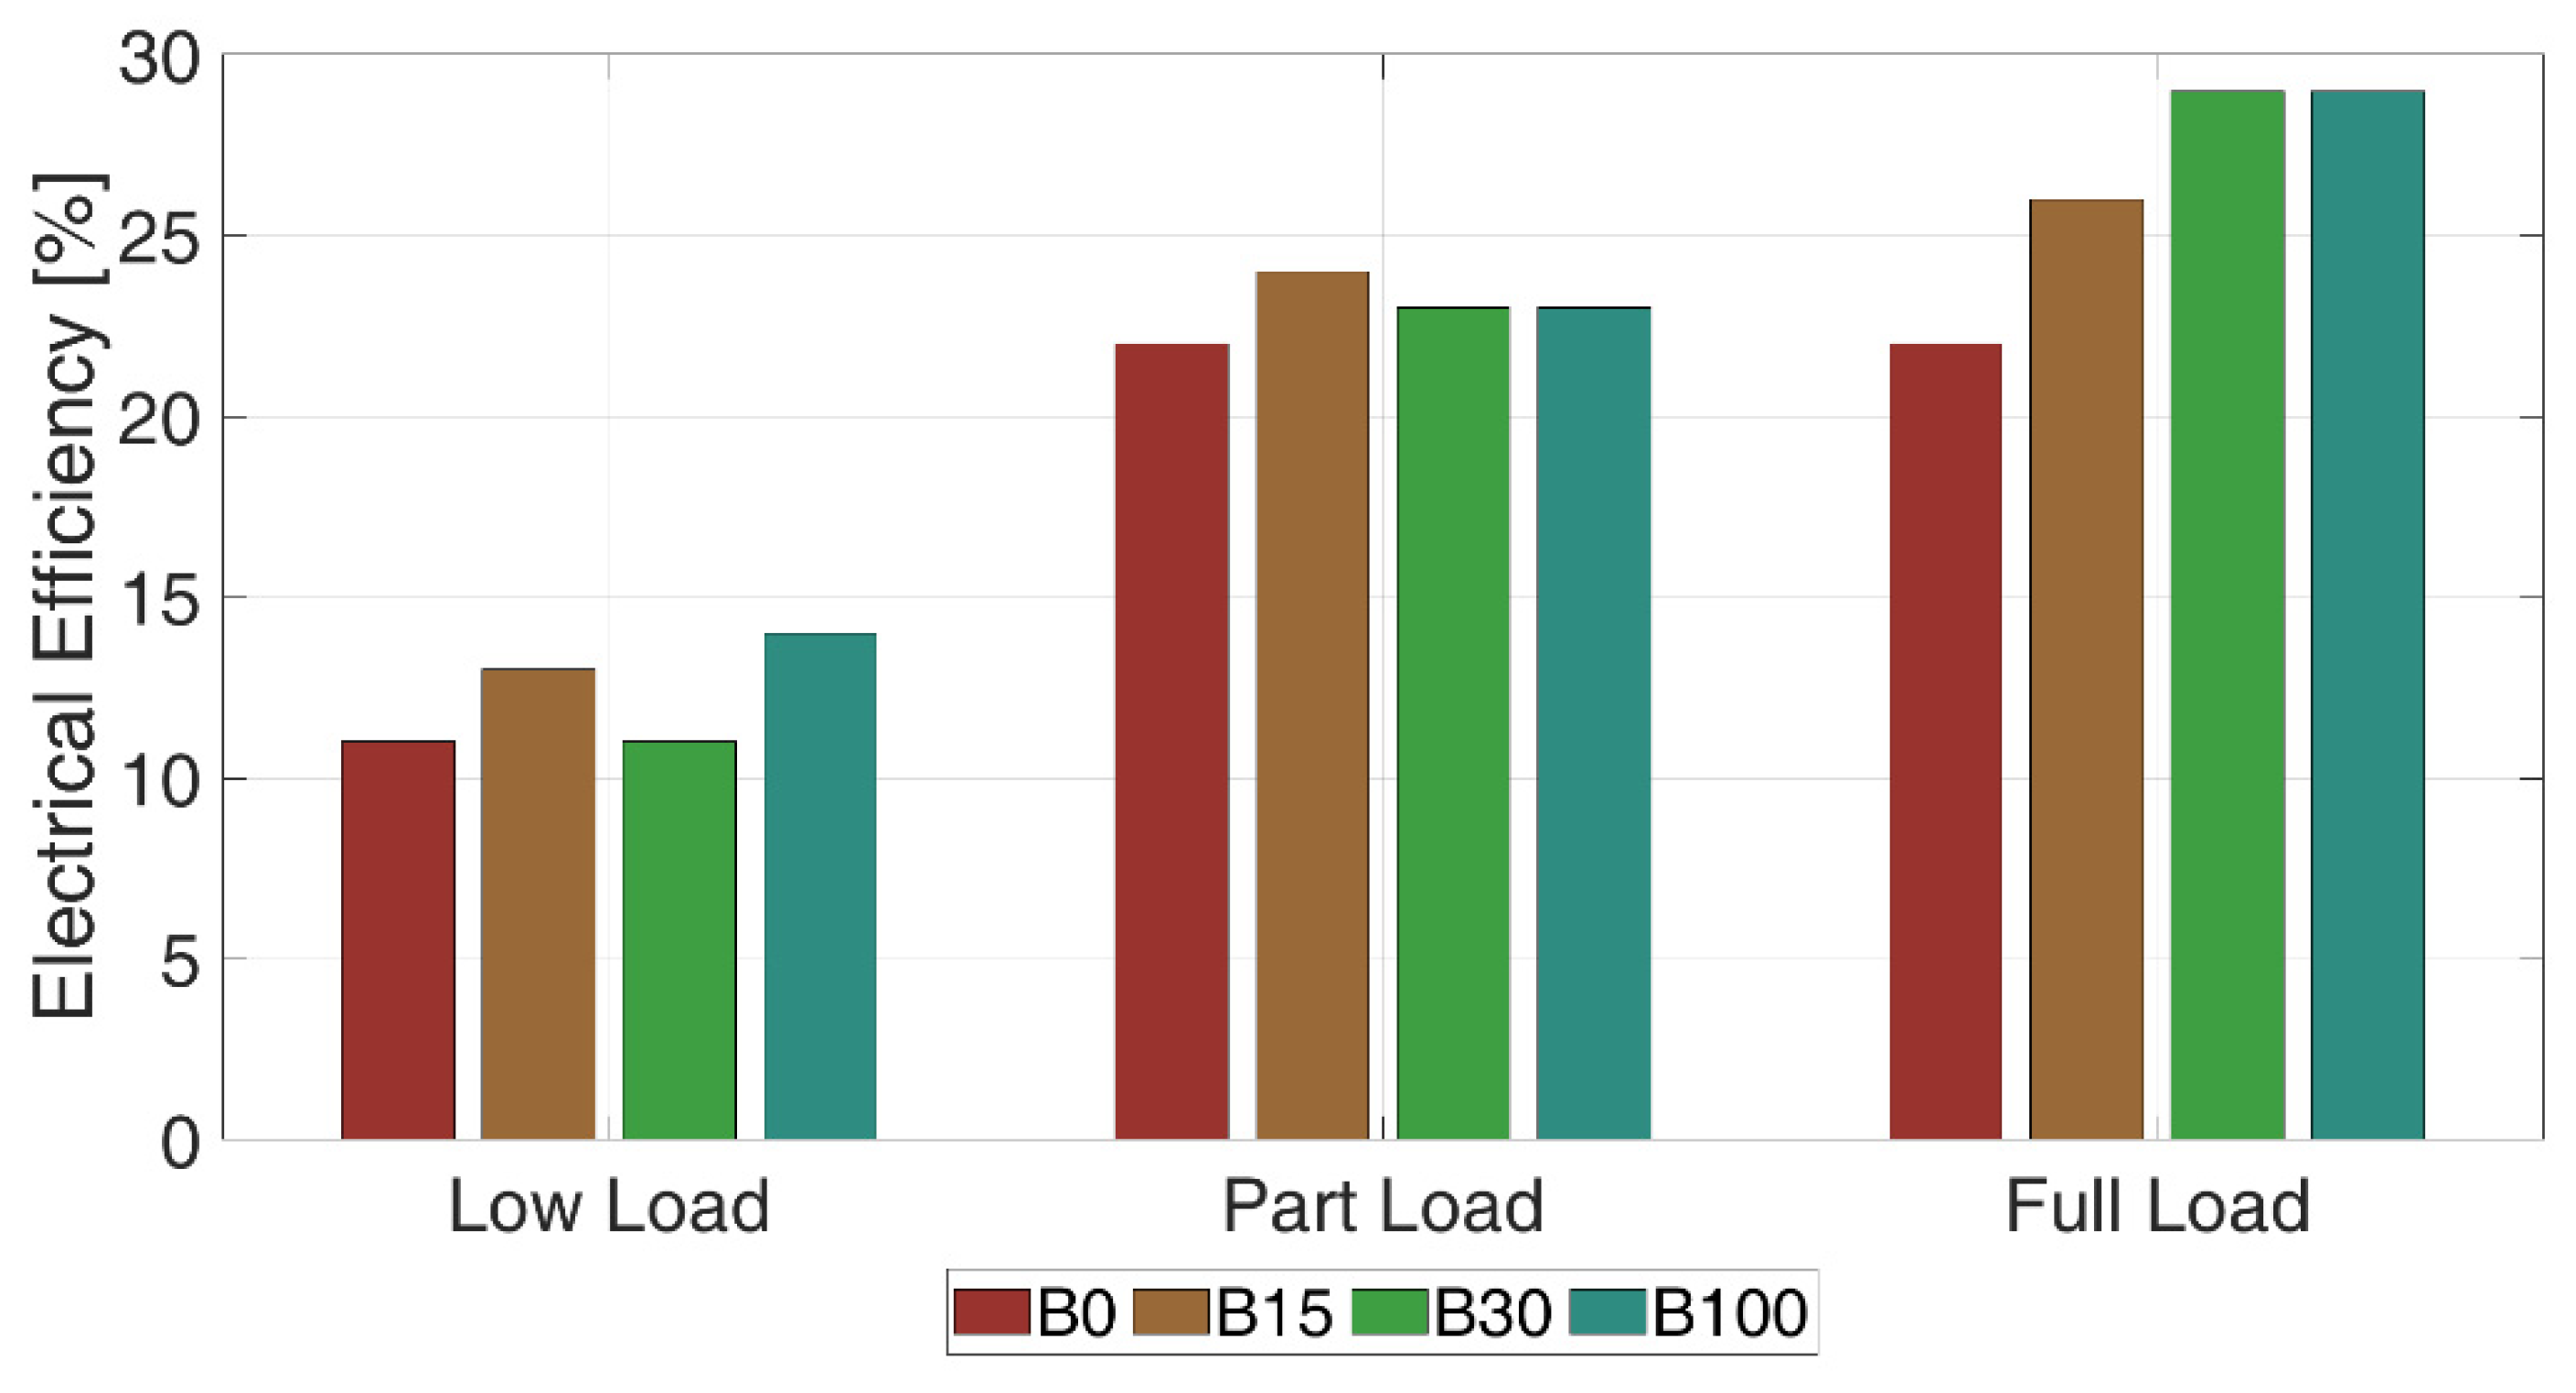
3.1. Electrical Efficiency
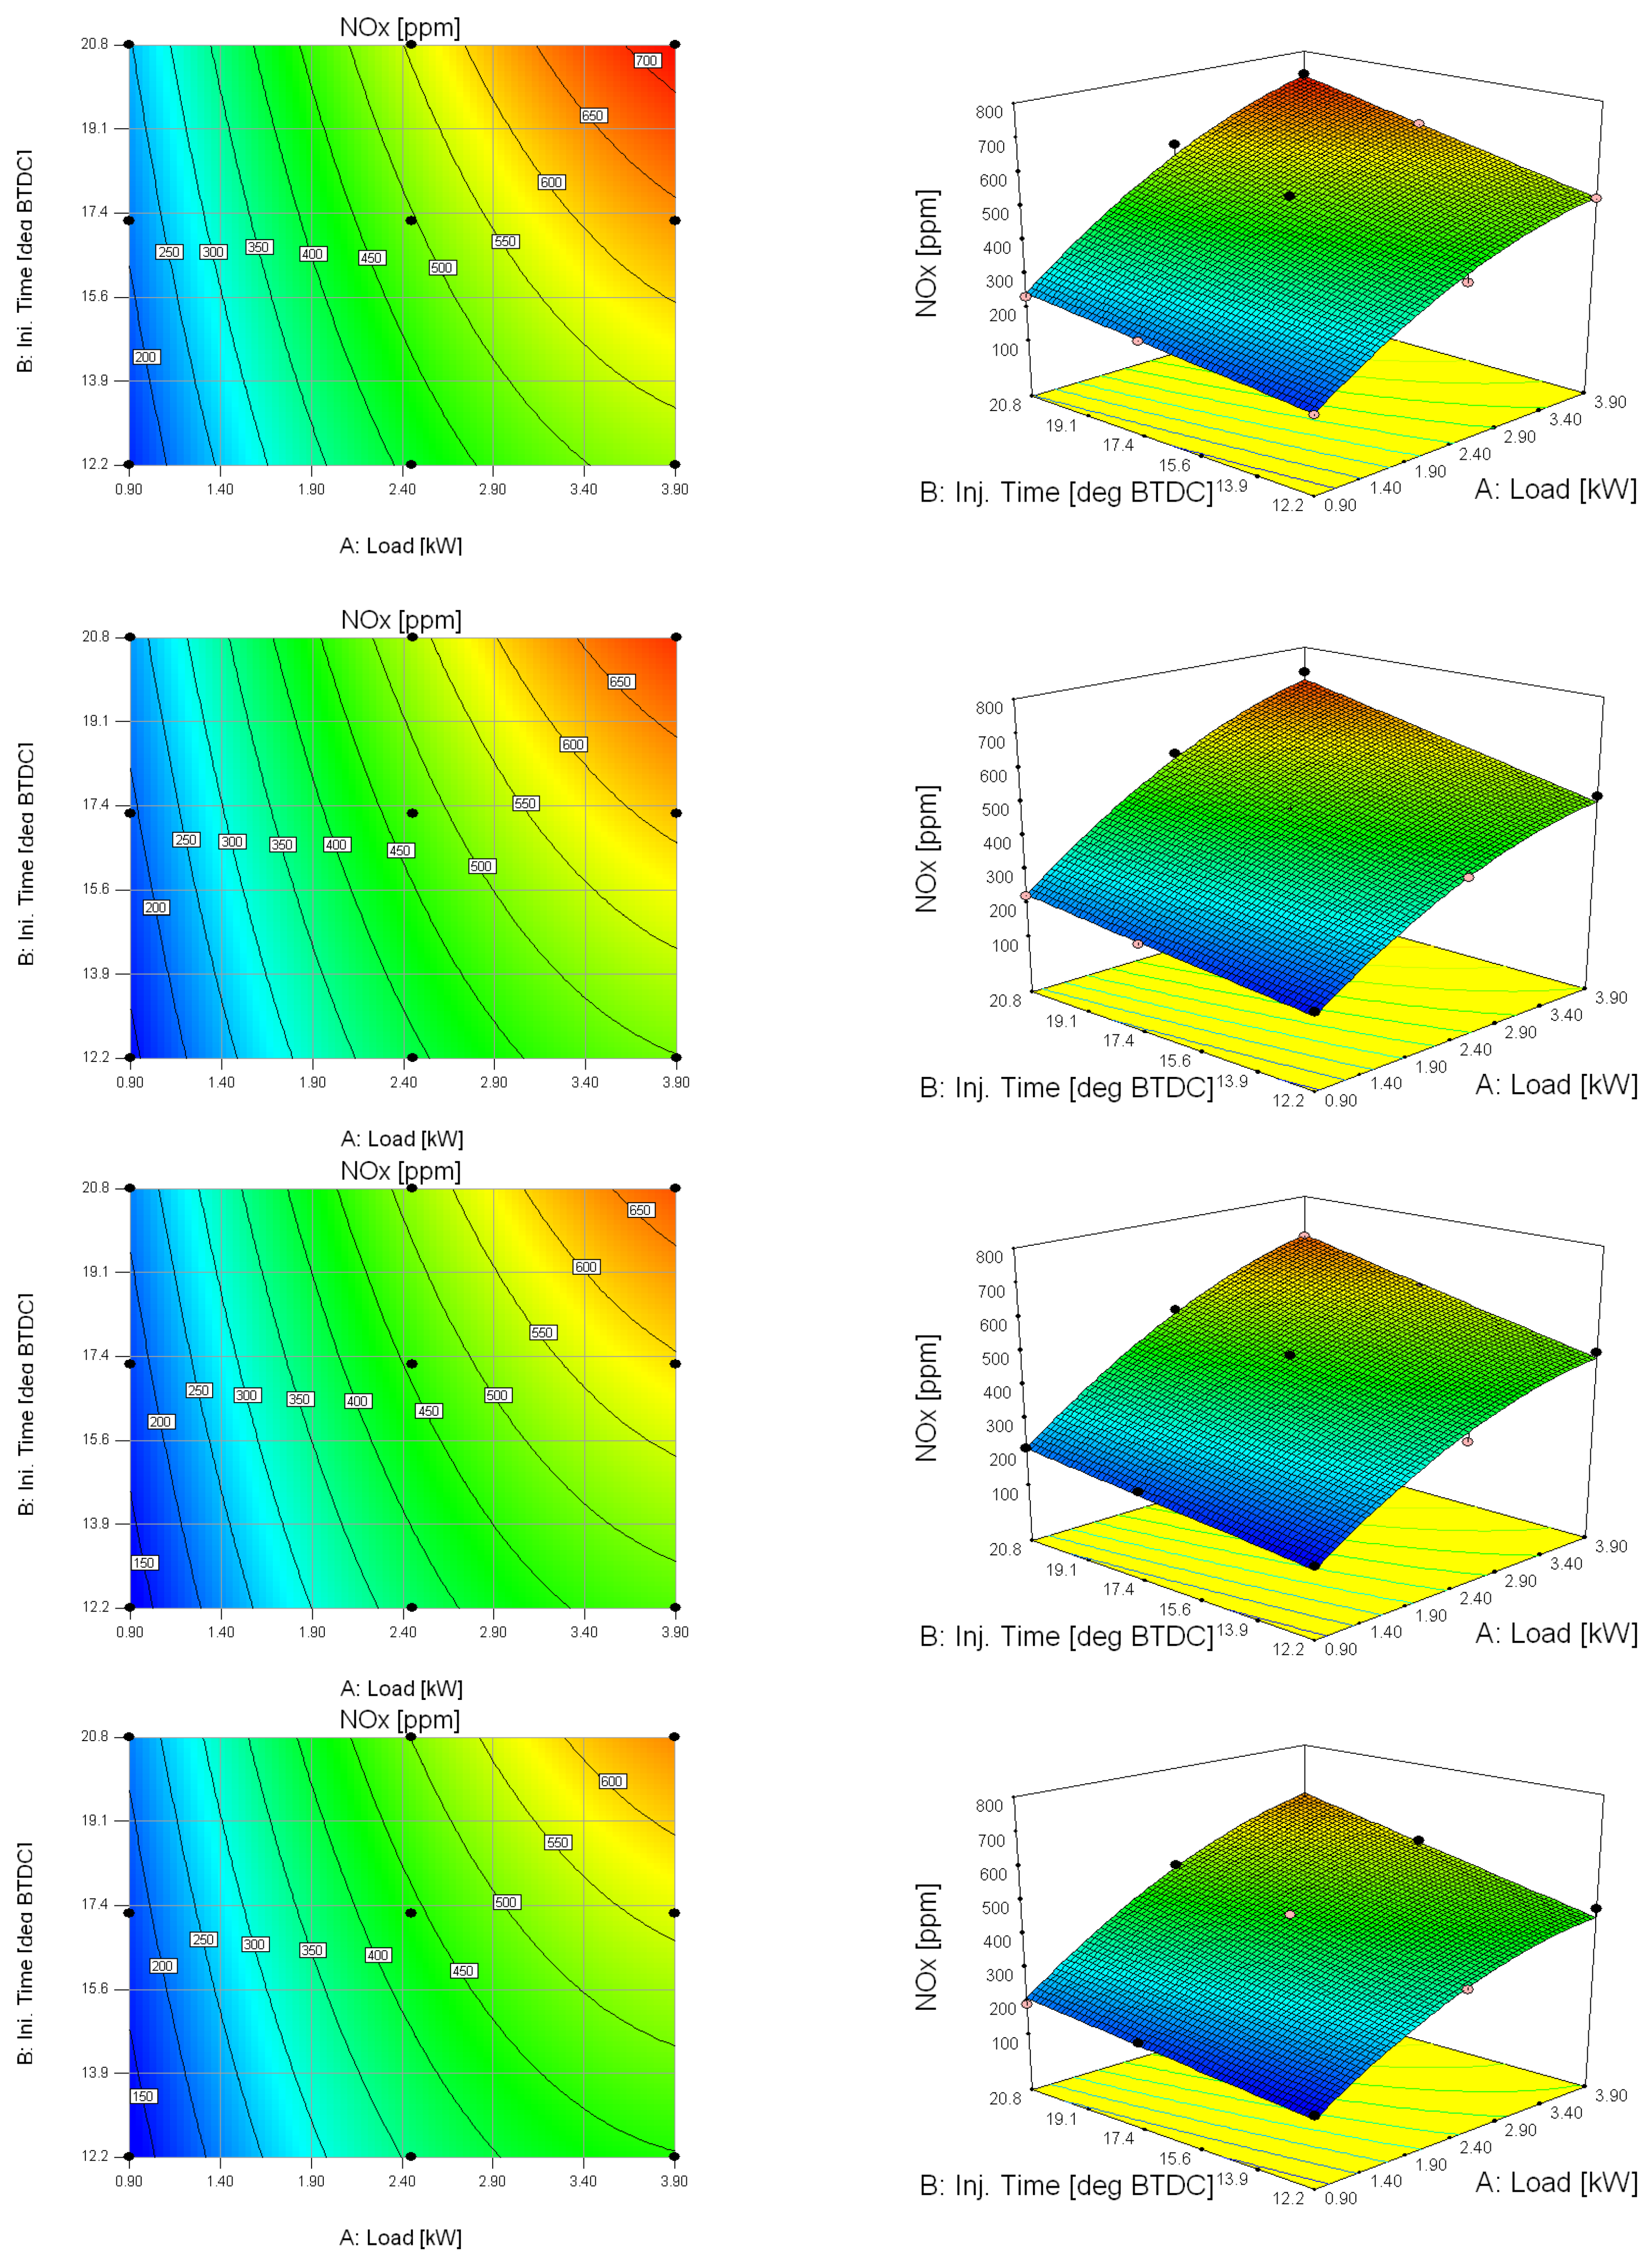
As a preliminary analysis, it was decided to investigate the possible correlation between electrical efficiency and fuel switching, in order to possibly give an energy-based and economic justification for the fuel switching, in addition to other evidence. Figure 4 shows the values of electrical efficiency as a function of the engine load for the four tested binary blends with the standard injection timing settings. As can be easily observed, the electrical efficiency increases for higher loads, reaching a visible plateau for B30 and B100, where the efficiency reaches its maximum value of 29%.
The results presented in Figure 4 clearly show how an increasing share of biodiesel produces performance enhancements, especially at full load. Similar trends [45,46] can be found in recent scientific literature and are usually linked to high volatility and higher oxygen content, which create improved fuel blend preparation, causing better and complete combustion of the fuel. Further discussions are carried out, taking advantage of a polynomial model that has been developed on the basis of this results. The ANOVA on a first possible full-quadratic model revealed many non-significant terms on the basis of the p-values associated with each numerical coefficient of that regression model (Table 6): p-values greater than 0.10 indicate non-significant model terms, meaning that such a regression model can be rightfully simplified by removing a few terms. Therefore, a backward elimination process led automatically by the used software program and based on the p-values, recalculated after each single elimination, allows one to keep the statistically significant terms only (Table 7) and arrive at a very compact but representative (R2 = 0.941; Adj-R2 = 0.919) “reduced” quadratic model (L: engine load in kW; B: biodiesel volumetric percentage in the fuel):
η e % = + 1.69 + 11.98 · L + 0.03 · B 1.51 · L 2
The proposed polynomial model is represented graphically in Figure 5.
Because it is visible, the increase in biodiesel share promotes an increase in the electrical efficiency of the engine, precisely at the rate of 0.03% of electrical efficiency per percentage point of biodiesel in the fuel (i.e., the modification in charge of the biodiesel content can arrive at a maximum of 2.70%). This can be explained by considering that biodiesel is an oxygen-rich fuel, which enhances the combustion process, leading to more complete combustion [8]. According to Thaiyasuit et al. [47], such biodiesel benefits, which are strictly linked to the particular engine operating condition (load, speed, and torque), may be quantified in a nearly 8% increase of combustion efficiency. As also evidenced in other studies, the combustion-related benefits manage to overcome the drawbacks related to the lower LHV and to the physical properties (density, viscosity) changes in the blend that may affect the correct operation of engine auxiliary systems originally set-up/designed for diesel fuel, resulting in an overall higher electrical efficiency [30,41]. Furthermore, the same engine at full load and fueled with B30 and B100 also showed the best performance in terms of cogeneration. As shown in Table 8, the thermal efficiency of the cogeneration unit at full load increases by about 10 % as the biodiesel share rises, up to a maximum value of 42% with B30 and B100. Input fuel power, recovered thermal power, exhaust gas temperature, and cooling water mass flow rate, are also reported in Table 8.
To sum up, the electrical and thermal characterization of the micro-cogeneration system has demonstrated an overall improvement of the engine performance due to the biodiesel presence in the fuel blend. In particular, at full load, the peak value in electrical efficiency (29%) was observed with B30 and B100. Similar results have been obtained in terms of thermal efficiency, where B30 and B100 showed the best performance (42% of thermal efficiency). As a result of the experimental campaign, it can be affirmed that such beneficial behaviors have shown a sort saturation threshold for biodiesel share above 30%. All this evidence was also confirmed numerically by discussing the trend of the regression function set-up thanks to the RSM, which shows how the electrical efficiency is affected more by the variation of the electrical load (about +15%) than the biodiesel share (about +2.7%). In particular, the effect of an increase of the electrical load is always an increase of the electrical efficiency, although it is progressively less incisive (from 9.27% per kW at 0.90 kW to 0.23% per kW at 3.90 kW). Biodiesel also promotes an increase in electrical efficiency but with a significantly smaller quantitative effect (0.027% of electrical efficiency per percentage point of biodiesel).

3.2. NOx Emissions

The results for each chosen fuel have been compared by adopting different injection timings at low load (Figure 6a), part load (Figure 6b), and full load (Figure 6c).
As it emerges clearly from the data visualized in Figure 6, the more the injection timing is retarded (i.e., the angle of SOI is reduced), the more the NOx emissions are reduced. This trend is verified for all the load conditions: a roughly 27% NOx emissions decrease is generally observed when the late injection time is compared to the early one. Values close to 16% of NOx emissions reduction are instead reached when late injection is compared to standard injection. By retarding the fuel injection, a shorter amount of time is available for the development of the flame and, as a consequence, lower in-cylinder temperatures are reached [48]. The thermal NOx-formation mechanism is hindered. These results confirm the need to adopt a suitable injection timing strategy when dealing with compression-ignition engines fueled with diesel-biodiesel blends. Indeed, according to Mirhashemi et al. [9], among the various possible set of engine operating parameters (such as lower injection pressure, split injection, and exhaust gas recirculation), the retarted injection timing is one of the most used strategies to mitigate NOx emissions. The experimental evidence of the positive effect of retarded SOI timing on NOx emissions is stated by How et al. [49], Machacon [50], Rajesh et al. [51], Hulwan and Joshi [52], and Fang et al. [53].
Another interesting effect is the saturation that can be observed in correspondence with high biodiesel content in the blend used to fuel the engine. In fact, the beneficial influence of biodiesel, in addition to NOx emissions, seems to decrease for higher biodiesel shares. As already noticed for the electrical efficiency, biodiesel contents higher than 30% seem to induce no additional benefits in the NOx reduction. For this reason, blending diesel oil with very high biodiesel shares could be unnecessary. From the experimental tests, no detrimental effect was evidenced due to the so-called “NOx penalty”. The quicker reaction of the injection system and, thus, the higher expected combustion temperature is offset by the higher engine efficiency and, therefore, the lower heat input. The assessment of the NOx emissions characteristics has been also carried out using the semi-empirical parametric modelling offered by the Response Surface Modelling [40,54]. A first ANOVA on all the terms (9 in total) of a possible full-quadratic model with three variables highlighted many terms as statistically non-significant (Table 9). A first backward elimination process managed to define a reduced set of terms (7 in total; Table 10) through which it was possible to have a highly-representative (R2 = 0.992; Adj-R2 = 0.990) quadratic model (L: engine load in kW; IT: injection time in degrees BTDC; B: biodiesel volumetric percenta.ge in the fuel):
N O x p p m = 129.13 + 207.24 · L + 6.29 · I T 1.29 · B + 4.33 · L · I T 0.14 · L · B 28.86 · L 2 + 0.01 · B 2
The proposed polynomial model is represented graphically in Figure 7.
The partial derivative of this model, made with respect to the biodiesel share, is:
N O x B = 1.29 0.14 L + 0.02 · B
This partial derivative is positive if the following inequality, whose second member is related to the electric load applied to the engine, is satisfied:
B > + 60.76 + 6.41 · L L = 0.90 : B > + 66.52 L = 3.90 : B > + 85.74
Hence, the biodiesel share promotes an increase of NOx whenever it overcomes a set threshold (spanning from about 66.5% to 85.7%), which is proportional to the engine load; in any other cases, the observed effect is the opposite. The partial derivative of this model, calculated with respect to the injection timing (IT), is:
N O x I T = + 6.29 + 4.33 · L L = 0.90 : N O x I T = 10.19 L = 3.90 : N O x I T = 23.17
As the applied electric load is always a positive quantity, the reported partial derivative of the model is positive as well, meaning that a reduction in the parameter related to the injection timing (i.e., of the SOI) has the effect of reducing the NOx emissions from about 10 ppm to 23 ppm per degree of advance of the SOI. This is a very interesting result, considering that the experimental emissions span from 134 ppm to 234 ppm (at 0.90 kW) and from 472 ppm to 728 ppm (at 3.90 kW). Indeed, in relative terms, a decrease of 10 ppm corresponds to 4.3→7.5% and 23 ppm to 3.2→4.9%. This result clearly shows the NOx emissions reduction capability of the early-to-late injection strategy.
Proceeding further in the mathematical modelling of the system response, it is also possible to make a remark about a possible pre-processing of the data before the application of the RSM and, thus, the definition of a regression equation. The NOx data span from 134 ppm to 728 ppm, therefore, has a maximum-to-minimum ratio of 5.4. Such a value is lower than the threshold of 10, which is usually considered as a key numerical quantity representing the value above which a mathematical pre-transformation (e.g., square root, logarithm, and power) of the data becomes necessary [8]. However, thanks to the software’s internal diagnostic tools (in particular, the “Box-Cox” diagram), the possibility of having a better predictive capacity of the final regression model by using a “natural logarithm” transformation of the data has been investigated. The resulting regression model would therefore predict the natural logarithm of the NOx concentration while still allowing for NOx emissions to be estimated using the inverse operation (i.e., the natural exponential function). Therefore, starting again from a full-quadratic model (Table 11) and operating a backward elimination, a second model with only 6 statistically significant terms (Table 12) and characterized by a higher predictive capacity than the previous one (R2 = 0.997; Adj_R2 = 0.996) has been obtained:
l n N O x p p m = + 3.55 + 1.12 · L + 0.05 · I T 4.04 · 10 3 B 3.78 · 10 3 · L · I T 0.14 · L 2 + 2.64 · 10 5 · B 2
The proposed polynomial model of the natural logarithm of NOx is represented graphically in Figure 8. Any consideration that can be drawn on the NOx emission trend, although not directly visible from these graphs (as for the previous regression model), is based on the increasing/decreasing trend of this logarithmic regression-function and necessarily leads to the same conclusions previously discussed.
To conclude, it can be affirmed that the beneficial effect of a late injection strategy on NOx emissions appears to be homogeneously distributed among all output power conditions. Moreover, an interesting finding observable from the experimental data is that the NOx-reduction capabilities of this late injection strategy decrease with higher biodiesel substitution rates, suggesting a further investigation on a biodiesel share saturation threshold. To better explore the details, an extensive RSM analysis was performed, leading to the formulation of two different regression models. The first one was a second-grade polynomial of the NOx concentration; it allowed for the immediate visualization of the complex effects of all the experimental factors on the emissions and for the quantification of the effects of each factor on the response (through the related partial derivatives). The second model, instead, possessed a slightly more complex formulation (it was a second-grade polynomial of the natural logarithm of the NOx concentration), which ensured a relatively higher predictive capability (1st model: R2 = 0.992; Adj-R2 = 0.990; second model: R2 = 0.997; Adj_R2 = 0.996). This analysis evidenced: (i) the presence of a numerical threshold, proportional to the engine load, beyond which biodiesel has the effect to raise the NOx (from about 66.5% to 85.7% of biodiesel in the blend); (ii) the NOx reduction capabilities of the early-to-late injection strategy (reducing the SOI has the effect of reducing the NOx emissions from about 10 ppm to 23 ppm per degree of advance of the SOI, and this effect linearly increases with the engine load). The overall potential NOx emission reduction ranged from 3.2% (higher loads) to 7.5% (lower loads).

4. Conclusions

An experimental assessment of the effects of the injection timing (in terms of the different start of injection (SOI)) on the performance and NOx emissions of a micro-cogeneration unit fueled with palm oil methyl esters blends was carried out. In particular, tests were designed to investigate how NOx emissions and electrical efficiency are affected by the injection timing strategy under the different operating/fuelling conditions of the engine. Experiments were conducted considering the following operating conditions: (i) a reference standard injection timing (17.2° BTDC), an early injection timing (20.8° BTDC), and a late injection timing (12.2° BTDC); (ii) low (0.90 kW), partial (2.45 kW), and full (3.90 kW) output power load; and (iii) four fuel blends with different biodiesel shares (B0, B15, B30, and B100). Experimental data were also elaborated thanks to the response surface modelling (RSM) technique, aimed at (i) quantifying the influences of the above-listed variables and their trends on the responses, and (ii) obtaining a set of predictive numerical models that represent the basis for model-based design and optimization procedures. The main results can be summarized as it follows:
  • The electrical and thermal characterization of the micro-cogeneration system has demonstrated an overall improvement of the engine performance due to the biodiesel presence in the fuel blend. In particular, at full load, the peak value in electrical efficiency (29%) was observed with B30 and B100. Similar results have been obtained in terms of thermal efficiency, where B30 and B100 performed the best (42% of thermal efficiency). The combustion enhancements related to the use of an oxygenated fuel, such as biodiesel, mainly addressed this behavior and are confirmed by the recent scientific literature. A saturation threshold for the biodiesel share above 30% was identified. All this evidence were also confirmed by the RSM analysis, whose results show that the electrical efficiency is affected more by the variation of the electrical load (about +15%) than the biodiesel share (about +2.7%).
  • The effect of the injection timing on NOx emissions was experimentally quantified in an overall emissions reduction of 27% on average when an early-to-late injection strategy was applied, and of 16% for a standard-to-late injection strategy. The beneficial effect of a late injection strategy on NOx emissions appears to have been homogeneously distributed among all output power conditions. Such findings can be explained according to the Thermal-NOx formation mechanism: by delaying the fuel injection, the in-cylinder combustion temperatures are reduced, and so the NOx emissions are lowered.
  • As a result of the experimental campaign, it has emerged how the NOx-reduction capabilities of the late injection strategy decrease with higher biodiesel substitution rates, suggesting the further investigation of the biodiesel share saturation threshold. An extensive RSM analysis led to the formulation of two different regression models, both characterized by high predictive capabilities (R2 > 0.990). The main outcomes show (i) how the biodiesel share promotes an increase of NOx whenever it overcomes a set threshold that is proportional to the engine load (from about 66.5% to 85.7% of biodiesel share) and (ii) how reducing the values of the SOI leads to lower NOx emissions from about 10 ppm to 23 ppm per degree of the advance of the SOI, and this effect linearly increases with the engine load. The overall potential of the early-to-late injection strategy in terms of NOx emission reduction ranges from 3.2% (higher loads) to 7.5% (lower loads).
The main quantitative findings of the article, as well as the experimental methodology, present a practical basis for further optimization procedures. Through the latter, different goals could be simultaneously achieved, such as (i) increasing the overall cogeneration efficiency, (ii) mitigating NOx engine emissions, and (iii) reducing the use of fossil fuels by means of an optimal biodiesel blending strategy. Further steps could be represented by the experimental investigation of the effect of injection timing on other harmful emissions (such as CO and PM) according to the here-presented methodology and according to the development and the application of an experimental data-driven optimization strategy.

Author Contributions

Conceptualization, C.C., M.B. (Marco Bietresato), A.A., M.B. (Marco Baratieri) and M.R.; data curation, C.C. and M.B. (Marco Bietresato); formal analysis, C.C. and M.B. (Marco Bietresato); investigation, C.C., M.B. (Marco Bietresato) and M.R.; methodology, C.C., M.B. (Marco Bietresato), A.A., M.B. (Marco Baratieri) and M.R.; resources, M.B. (Marco Bietresato), A.A., M.B. (Marco Baratieri) and M.R.; software, M.B. (Marco Bietresato); supervision, M.R.; visualization, C.C.; writing—original draft, C.C.; and writing—review and editing, C.C., M.B. (Marco Bietresato), A.A., M.B. (Marco Baratieri) and M.R. All authors have read and agreed to the published version of the manuscript.

Funding

This research received no external funding.

Acknowledgments

The publication of this work was supported by the Open-Access Publishing Fund of the Free University of Bozen/Bolzano. The authors wish to thank the graduate student Marco Poda for the help given during the experimental tests.

Conflicts of Interest

The authors declare no conflict of interest.

References

  1. Dabi, M.; Saha, U.K. Application Potential of Vegetable Oils as Alternative to Diesel Fuels in Compression Ignition Engines: A Review. J. Energy Inst. 2019, 92, 1710–1726. [Google Scholar] [CrossRef]
  2. Mwangi, J.K.; Lee, W.-J.; Chang, Y.-C.; Chen, C.-Y.; Wang, L.-C. An Overview: Energy Saving and Pollution Reduction by Using Green Fuel Blends in Diesel Engines. Appl. Energy 2015, 159, 214–236. [Google Scholar] [CrossRef]
  3. Yaqoob, H.; Teoh, Y.H.; Jamil, M.A.; Gulzar, M. Potential of Tire Pyrolysis Oil as an Alternate Fuel for Diesel Engines: A Review. J. Energy Inst. 2021, 96, 205–221. [Google Scholar] [CrossRef]
  4. Vakalis, S.; Caligiuri, C.; Moustakas, K.; Malamis, D.; Renzi, M.; Baratieri, M. Modeling the Emissions of a Dual Fuel Engine Coupled with a Biomass Gasifier—Supplementing the Wiebe Function. Environ. Sci. Pollut. Res. 2018, 25, 35866–35873. [Google Scholar] [CrossRef]
  5. Mohamed Shameer, P.; Ramesh, K.; Sakthivel, R.; Purnachandran, R. Effects of Fuel Injection Parameters on Emission Characteristics of Diesel Engines Operating on Various Biodiesel: A Review. Sustain. Energy Rev. 2017, 67, 1267–1281. [Google Scholar] [CrossRef]
  6. Tamilselvan, P.; Nallusamy, N.; Rajkumar, S. A Comprehensive Review on Performance, Combustion and Emission Characteristics of Biodiesel Fuelled Diesel Engines. Renew. Sustain. Energy Rev. 2017, 79, 1134–1159. [Google Scholar] [CrossRef]
  7. Dimitriou, P.; Tsujimura, T.; Suzuki, Y. Adopting Biodiesel as an Indirect Way to Reduce the NOx Emission of a Hydrogen Fumigated Dual-Fuel Engine. Fuel 2019, 244, 324–334. [Google Scholar] [CrossRef]
  8. Sakthivel, R.; Ramesh, K.; Purnachandran, R.; Mohamed Shameer, P. A Review on the Properties, Performance and Emission Aspects of the Third Generation Biodiesels. Renew. Sustain. Energy Rev. 2018, 82, 2970–2992. [Google Scholar] [CrossRef]
  9. Mirhashemi, F.S.; Sadrnia, H. NOx Emissions of Compression Ignition Engines Fueled with Various Biodiesel Blends: A Review. J. Energy Inst. 2020, 93, 129–151. [Google Scholar] [CrossRef]
  10. Bär, F.; Hopf, H.; Knorr, M.; Schröder, O.; Krahl, J. Effect of Hydrazides as Fuel Additives for Biodiesel and Biodiesel Blends on NOx Formation. Fuel 2016, 180, 278–283. [Google Scholar] [CrossRef]
  11. Mehregan, M.; Moghiman, M. Experimental Investigation of the Distinct Effects of Nanoparticles Addition and Urea-SCR after-Treatment System on NOx Emissions in a Blended-Biodiesel Fueled Internal Combustion Engine. Fuel 2020, 262, 116609. [Google Scholar] [CrossRef]
  12. Algieri, A.; Morrone, P.; Perrone, D.; Bova, S.; Castiglione, T. Analysis of Multi-Source Energy System for Small-Scale Domestic Applications. Integration of Biodiesel, Solar and Wind Energy. Energy Rep. 2020, 6, 652–659. [Google Scholar] [CrossRef]
  13. Perrone, D.; Algieri, A.; Morrone, P.; Castiglione, T. Energy and Economic Investigation of a Biodiesel-Fired Engine for Micro-Scale Cogeneration. Energies 2021, 14, 496. [Google Scholar] [CrossRef]
  14. Falbo, L.; Perrone, D.; Morrone, P.; Algieri, A. Integration of Biodiesel Internal Combustion Engines and Transcritical Organic Rankine Cycles for Waste-heat Recovery in Small-scale Applications. Int. J. Energy Res. 2022, 46, 5235–5249. [Google Scholar] [CrossRef]
  15. Thangaraja, J.; Anand, K.; Mehta, P.S. Biodiesel NOx Penalty and Control Measures—A Review. Renew. Sustain. Energy Rev. 2016, 61, 1–24. [Google Scholar] [CrossRef]
  16. Speight, J.G.; Loyalka, S.K. Handbook of Alternative Fuel; CRC Press: Boca Raton, FL, USA, 2007. [Google Scholar]
  17. Singh, Y.; Sharma, A.; Tiwari, S.; Singla, A. Optimization of Diesel Engine Performance and Emission Parameters Employing Cassia Tora Methyl Esters-Response Surface Methodology Approach. Energy 2019, 168, 909–918. [Google Scholar] [CrossRef]
  18. Alptekin, E. Emission, Injection and Combustion Characteristics of Biodiesel and Oxygenated Fuel Blends in a Common Rail Diesel Engine. Energy 2017, 119, 44–52. [Google Scholar] [CrossRef]
  19. Bietresato, M.; Caligiuri, C.; Renzi, M.; Mazzetto, F. Use of Diesel-Biodiesel-Bioethanol Blends in Farm Tractors: First Results Obtained with a Mixed Experimental-Numerical Approach. Energy Procedia 2019, 158, 965–971. [Google Scholar] [CrossRef]
  20. Chen, H.; Guo, Q.; Zhao, X.; Xu, M.; Ma, Y. Influence of Fuel Temperature on Combustion and Emission of Biodiesel. J. Energy Inst. 2016, 89, 231–239. [Google Scholar] [CrossRef]
  21. Bietresato, M.; Bolla, A.; Caligiuri, C.; Renzi, M.; Mazzetto, F. The Kinematic Viscosity of Conventional and Bio-Based Fuel Blends as a Key Parameter to Indirectly Estimate the Performance of Compression-Ignition Engines for Agricultural Purposes. Fuel 2021, 298, 120817. [Google Scholar] [CrossRef]
  22. Caresana, F. Impact of Biodiesel Bulk Modulus on Injection Pressure and Injection Timing. The Effect of Residual Pressure. Fuel 2011, 90, 477–485. [Google Scholar] [CrossRef]
  23. Caresana, F.; Bietresato, M.; Renzi, M. Injection and Combustion Analysis of Pure Rapeseed Oil Methyl Ester (RME) in a Pump-Line-Nozzle Fuel Injection System. Energies 2021, 14, 7535. [Google Scholar] [CrossRef]
  24. Adi, G.; Hall, C.; Snyder, D.; Bunce, M.; Satkoski, C.; Kumar, S.; Garimella, P.; Stanton, D.; Shaver, G. Soy-Biodiesel Impact on NO x Emissions and Fuel Economy for Diffusion-Dominated Combustion in a Turbo−Diesel Engine Incorporating Exhaust Gas Recirculation and Common Rail Fuel Injection. Energy Fuels 2009, 23, 5821–5829. [Google Scholar] [CrossRef]
  25. Liu, Z.-W.; Li, F.-S.; Wang, W.; Wang, B. Impact of Different Levels of Biodiesel Oxidation on Its Emission Characteristics. J. Energy Inst. 2019, 92, 861–870. [Google Scholar] [CrossRef]
  26. Graboski, M.S.; McCormick, R.L. Combustion of Fat and Vegetable Oil Derived Fuels in Diesel Engines. Prog. Energy Combust. Sci. 1998, 24, 125–164. [Google Scholar] [CrossRef]
  27. Özçelik, A.E.; Aydoğan, H.; Acaroğlu, M. Determining the Performance, Emission and Combustion Properties of Camelina Biodiesel Blends. Energy Convers. Manag. 2015, 96, 47–57. [Google Scholar] [CrossRef]
  28. Mikulski, M.; Duda, K.; Wierzbicki, S. Performance and Emissions of a CRDI Diesel Engine Fuelled with Swine Lard Methyl Esters-Diesel Mixture. Fuel 2016, 164, 206–219. [Google Scholar] [CrossRef]
  29. Huzayyin, A.S.; Bawady, A.H.; Rady, M.A.; Dawood, A. Experimental Evaluation of Diesel Engine Performance and Emission Using Blends of Jojoba Oil and Diesel Fuel. Energy Convers. Manag. 2004, 45, 2093–2112. [Google Scholar] [CrossRef]
  30. Caligiuri, C.; Renzi, M.; Bietresato, M.; Baratieri, M. Experimental Investigation on the Effects of Bioethanol Addition in Diesel-Biodiesel Blends on Emissions and Performances of a Micro-Cogeneration System. Energy Convers. Manag. 2019, 185, 55–65. [Google Scholar] [CrossRef]
  31. Alloune, R.; Balistrou, M.; Awad, S.; Loubar, K.; Tazerout, M. Performance, Combustion and Exhaust Emissions Characteristics Investigation Using Citrullus Colocynthis L. Biodiesel in DI Diesel Engine. J. Energy Inst. 2018, 91, 434–444. [Google Scholar] [CrossRef]
  32. Khalife, E.; Tabatabaei, M.; Demirbas, A.; Aghbashlo, M. Impacts of Additives on Performance and Emission Characteristics of Diesel Engines during Steady State Operation. Prog. Energy Combust. Sci. 2017, 59, 32–78. [Google Scholar] [CrossRef]
  33. Bietresato, M.; Caligiuri, C.; Bolla, A.; Renzi, M.; Mazzetto, F. Proposal of a Predictive Mixed Experimental-Numerical Approach for Assessing the Performance of Farm Tractor Engines Fuelled with Diesel-Biodiesel-Bioethanol Blends. Energies 2019, 12, 2287. [Google Scholar] [CrossRef] [Green Version]
  34. Shameer, P.M.; Ramesh, K. Assessment on the Consequences of Injection Timing and Injection Pressure on Combustion Characteristics of Sustainable Biodiesel Fuelled Engine. Renew. Sustain. Energy Rev. 2018, 81, 45–61. [Google Scholar] [CrossRef]
  35. Ganapathy, T.; Gakkhar, R.P.; Murugesan, K. Influence of Injection Timing on Performance, Combustion and Emission Characteristics of Jatropha Biodiesel Engine. Appl. Energy 2011, 88, 4376–4386. [Google Scholar] [CrossRef]
  36. Sharma, A.; Murugan, S. Combustion, Performance and Emission Characteristics of a Di Diesel Engine Fuelled with Non-Petroleum Fuel: A Study on the Role of Fuel Injection Timing. J. Energy Inst. 2015, 88, 364–375. [Google Scholar] [CrossRef]
  37. Dwivedi, G.; Sharma, M.P. Experimental Investigation on Thermal Stability of Pongamia Biodiesel by Thermogravimetric Analysis. Egypt. J. Pet. 2016, 25, 33–38. [Google Scholar] [CrossRef] [Green Version]
  38. Ecofox—Advanced Biofuels Producers & Traders (Vasto, CH—Italy). Available online: https://www.ecofox.eu/en/ (accessed on 1 March 2022).
  39. Maheshwari, N.; Balaji, C.; Ramesh, A. A Nonlinear Regression Based Multi-Objective Optimization of Parameters Based on Experimental Data from an IC Engine Fueled with Biodiesel Blends. Biomass Bioenergy 2011, 35, 2171–2183. [Google Scholar] [CrossRef]
  40. Bietresato, M.; Caligiuri, C.; Bolla, A.; Renzi, M.; Mazzetto, F. The Response Surface Methodology as a Tool to Evaluate the Effects of Using Diesel-Biodiesel-Bioethanol Blends as Farm Tractor Fuel. In International Mid-Term Conference of the Italian Association of Agricultural Engineering; Springer: Berlin/Heidelberg, Germany, 2020; pp. 539–549. [Google Scholar]
  41. Caligiuri, C.; Bietresato, M.; Renzi, M. The Effect of Using Diesel-Biodiesel-Bioethanol Blends on the Fuel Feed Pump of a Small-Scale Internal Combustion Engine. Energy Procedia 2019, 158, 953–958. [Google Scholar] [CrossRef]
  42. Nghia, N.T.; Khoa, N.X.; Cho, W.; Lim, O. A Study the Effect of Biodiesel Blends and the Injection Timing on Performance and Emissions of Common Rail Diesel Engines. Energies 2022, 15, 242. [Google Scholar] [CrossRef]
  43. Montgomery, D.C. Design and Analysis of Experiments; John Wiley & Sons, Inc.: Hoboken, NJ, USA, 2013; Volume 2, ISBN 9781118146927. [Google Scholar]
  44. Stat-Ease. StatEase—Statistics Made Easy, Guided Manual; Stat-Ease: Minneapolis, MN, USA, 2021. [Google Scholar]
  45. Arya, M.; Kumar Rout, A.; Samanta, S. A Review on the Effect of Engine Performance and Emission Characteristics of C.I. Engine Using Diesel-Biodiesel-Additives Fuel Blend. Mater. Today Proc. 2022, 51, 2224–2232. [Google Scholar] [CrossRef]
  46. Rai, V.R.; Shringi, D.; Mathur, Y.B. Performance Evaluation of Diesel-Jatropha Biodiesel-Methanol Blends in CI Engine. Mater. Today Proc. 2022, 51, 1561–1567. [Google Scholar] [CrossRef]
  47. Thaiyasuit, P.; Pianthong, K.; Milton, B. Combustion Efficiency and Performance of RSO Biodiesel as Alternative Fuel in a Single Cylinder CI Engine. Energy Explor. Exploit. 2012, 30, 153–166. [Google Scholar] [CrossRef] [Green Version]
  48. Lešnik, L.; Iljaž, J.; Hribernik, A.; Kegl, B. Numerical and Experimental Study of Combustion, Performance and Emission Characteristics of a Heavy-Duty Di Diesel Engine Running on Diesel, Biodiesel and Their Blends. Energy Convers. Manag. 2014, 81, 534–546. [Google Scholar] [CrossRef]
  49. How, H.G.; Masjuki, H.H.; Kalam, M.A.; Teoh, Y.H. Influence of Injection Timing and Split Injection Strategies on Performance, Emissions, and Combustion Characteristics of Diesel Engine Fueled with Biodiesel Blended Fuels. Fuel 2018, 213, 106–114. [Google Scholar] [CrossRef]
  50. Machacon, H. The Effect of Coconut Oil and Diesel Fuel Blends on Diesel Engine Performance and Exhaust Emissions. JSAE Rev. 2001, 22, 349–355. [Google Scholar] [CrossRef]
  51. Rajesh, S.; Kulkarni, B.M.; Banapurmath, N.R.; Kumarappa, S. Effect of Injection Parameters on Performance and Emission Characteristics of a CRDi Diesel Engine Fuelled with Acid Oil Biodiesel–Ethanol Blended Fuels. Biofuels 2018, 9, 353–367. [Google Scholar] [CrossRef]
  52. Hulwan, D.B.; Joshi, S.V. Performance, Emission and Combustion Characteristic of a Multicylinder DI Diesel Engine Running on Diesel–Ethanol–Biodiesel Blends of High Ethanol Content. Appl. Energy 2011, 88, 5042–5055. [Google Scholar] [CrossRef]
  53. Fang, Q.; Fang, J.; Zhuang, J.; Huang, Z. Effects of Ethanol–Diesel–Biodiesel Blends on Combustion and Emissions in Premixed Low Temperature Combustion. Appl. Therm. Eng. 2013, 54, 541–548. [Google Scholar] [CrossRef]
  54. Subramani, S.; Govindasamy, R.; Rao, G.L.N. Predictive Correlations for NOx and Smoke Emission of DI CI Engine Fuelled with Diesel-Biodiesel-Higher Alcohol Blends-Response Surface Methodology Approach. Fuel 2020, 269, 117304. [Google Scholar] [CrossRef]
Figure 1. The test bench with its main components (A): the genset; (B): the heat-recovery system; (C): the fuel tank; (D): the water-circuit mass flow meter; (E): the fuel mass flow meter; and (F): the exhausts line.
Energies 15 03586 g001
Figure 2. A scheme of the test bench: (1) the genset: Paguro 4000; (2) the water-circuit mass flow meter: Sitrans MAG6000/1100; (3) the water-circuit thermocouples; (4) the exhaust-gas analyzers: MRU Vario Plus; (5) the fuel mass flow meter: Sitrans MASS2100/6000; (6) the electrical power loads; (7) the power meter: HT PQA820; (8) and the data acquisition unit: NI cDaq 9189.
Energies 15 03586 g002
Figure 3. The interactions among the principal independent and dependent variables (a subset of which has been selected as factors and responses) characterizing the studied cogeneration system (adapted from [33]).
Energies 15 03586 g003
Figure 4. The electrical efficiency at low, part, and full load for the different tested fuels B0, B15, B30, and B100.
Energies 15 03586 g004
Figure 5. The contour plot (left) and the 3D surface (right) of the electrical efficiency as a function of the load and of the biodiesel percentage in the fuel.
Energies 15 03586 g005
Figure 6. The NOx emissions for each tested fuel and injection timing at low load (a), part load (b), and full load (c).
Energies 15 03586 g006
Figure 7. The contour plots (left) and 3D surfaces (right) of the NOx as a function of the load and of the injection time at different values of biodiesel in the fuel (from top to bottom: 0%, 15%, 30%, and 100%).
Energies 15 03586 g007
Figure 8. The contour plots (left) and the 3D surfaces (right) of the natural logarithm of NOx as a function of the load and of the injection time at different values of biodiesel in the fuel (from top to bottom: 0%, 15%, 30%, and 100%).
Energies 15 03586 g008aEnergies 15 03586 g008b
Table 1. The main Farymann 15W430 technical specifications.
Technical CharacteristicUnitValue
Engine type-Compression-ignition
Fuel injection system-Mechanical, governor-controlled
Nr. of cylinders-1
Valves per cylinder-2
Displacementcm3290
Bore, strokemm, mm75, 55
Connecting rodmm102.96
Compression ratio-20:1
Nominal injection pressurebar200
Nominal electric power (at 3000 rpm)kW3.90
Maximum rotational speedrpm3600
Specific fuel consumption (at 3000 rpm)g·(kW·h)−1305
Table 2. The main features of the acquisition equipment.
Measured
Quantity
Manufacturer, ModelMeasuring
Principle/
Apparatus
Relative
Accuracy
Measuring Range
Water mass flowSiemens,
MAG1100
Electromagnetic flow sensor±0.4% 0…10 m s−1
Fuel mass flowSiemens,
Sitrans MASS2100
Coriolis flow meter±0.1% 0…30 kg h−1
NOx concentrationMRU,
Vario Plus
Electrochemical cells ±5 ppm0…1000 ppm (NO); 0…200 ppm (NO2)
Cooling water temperatureTC Direct,
TCK
K-type thermocouple±1 °C −270…1260 °C
Electrical output powerHT,
PQA820
In-line voltage and current detection±(1% rdg + 6 dgt)0…9.99 kW
Table 3. The main properties of the biodiesel [38].
PropertyValueReference Standard
Ester content (% m m−1)98.5EN 14103
Density @15 °C (kg m−3)883.1EN ISO 3675
Viscosity @40 °C (mm2 s−1)4.1–4.7EN ISO 3104
Flash point (°C)>160EN ISO 3679
Cetane number (-)>51EN ISO 5165
Water content (mg kg−1)210EN ISO 12937
Sulphur content (mg kg−1)<10EN ISO 20846
Iodine number (g(I2) (100 g)−1)105EN 14111
Cloud point (°C)−6EN 23015
Table 4. The main properties of the fuel blends.
Blend LabelBiodiesel Share (%)Measured Density @15 °C (kg/m3)LHV (MJ/kg)
B00832.542.60
B1515840.941.84
B3030847.741.08
B100100883.137.53
Table 5. The percentage uncertainties of the calculated quantities.
Calculated QuantityUnitsPercentage Uncertainty
Q f ˙ m3/s0.54%
Q w ˙ m3/s0.43%
η e -0.68%
η t -0.69%
NO x ppm2.55%
Table 6. ANOVA for a response-surface quadratic model based on electrical efficiency data.
SourceSum of SquaresdfMean SquareF Valuep-Value
Prob > F
Model463.08592.6228.010.0004
A-Load (kW)379.431379.43114.74<0.0001
B-Biodiesel Share (%)17.59117.595.320.0606
AB2.2912.290.690.4374
A230.59130.599.250.0228
B26.4716.471.960.2115
Residual19.8463.31
Cor Total482.9211
Table 7. ANOVA for a response-surface reduced quadratic model based on electrical efficiency data.
SourceSum of SquaresdfMean SquareF Valuep-Value
Prob > F
Model454.323151.4442.37<0.0001
A-Load (kW)406.121406.12113.62<0.0001
B-Biodiesel Share (%)13.15113.153.680.0913
A230.59130.598.560.0191
Residual28.6083.57
Cor Total482.9211
Table 8. The thermal performance of the cogeneration unit at full load.
BlendTex (°C) m ˙ w (kg·s−1)ΔTw (°C)Pt (kW)Pfuel (kW) η t   ( % )
B0197.760.178.105.6017.9031.00
B15201.010.168.005.5015.2036.00
B30192.440.178.005.6013.4042.00
B100203.930.178.005.6013.6042.00
Table 9. ANOVA for a response-surface quadratic model based on NOx data.
SourceSum of SquaresdfMean SquareF Valuep-Value
Prob > F
Model1.200333 × 10691.333 × 105422.09<0.0001
A-Load (kW)8.473333 × 10518.473333 × 1052682.97<0.0001
B-Inj. Time (deg BTDC)1.031333 × 10511.031333 × 105326.45<0.0001
C-Biodiesel Share (%)14,290.03114,290.0345.25<0.0001
AB12,583.78112,583.7839.85<0.0001
AC1466.9211466.924.650.0406
BC1136.0211136.023.600.0690
A233,637.49133,637.49106.52<0.0001
B2308.801308.800.980.3318
C22955.3912955.399.360.0051
Residual8210.7326315.80
Cor Total1.208 × 10635
Table 10. ANOVA for a response-surface reduced quadratic model based on NOx data.
SourceSum of SquaresdfMean SquareF Valuep-Value
Prob > F
Model1.198333 × 10671.712333 × 105496.38<0.0001
A-Load (kW)8.473333 × 10518.473333 × 1052457.00<0.0001
B-Inj. Time (deg BTDC)1.245333 × 10511.245333 × 105361.18<0.0001
C-Biodiesel Share (%)14,862.31114,862.3143.10<0.0001
AB12,583.78112,583.7836.49<0.0001
AC1466.9211466.924.250.0485
A233,637.49133,637.4997.54<0.0001
C22955.3912955.398.570.0067
Residual9655.5528344.84
Cor Total1.208 × 10635
Table 11. ANOVA for a response-surface quadratic model based on the natural logarithm of the NOx data.
SourceSum of SquaresdfMean SquareF Valuep-Value
Prob > F
Model10.1991.131057.48<0.0001
A-Load (kW)7.4717.476974.60<0.0001
B-Inj. Time (deg BTDC)0.7110.71663.53<0.0001
C-Biodiesel Share (%)0.09210.09286.19<0.0001
AB9.581333 × 10−319.581333 × 10−38.950.0060
AC8.461333 × 10−418.461333 × 10−40.790.3821
BC1.800333 × 10−311.800333 × 10−31.680.2061
A2a0.7810.78725.32<0.0001
B28.323333 × 10−418.323333 × 10−40.780.3860
C20.01810.01817.070.0003
Residual0.028261.071333 × 10−3
Cor Total10.2235
Table 12. ANOVA for a response-surface reduced quadratic model based on the natural logarithm of NOx data.
SourceSum of SquaresdfMean SquareF Valuep-Value
Prob > F
Model10.1961.701572.15<0.0001
A-Load (kW)8.3618.367746.07<0.0001
B-Inj. Time (deg BTDC)0.8410.84778.61<0.0001
C-Biodiesel Share (%)0.09410.09487.11<0.0001
AB9.581333 × 10−319.581333 × 10−38.870.0058
A20.7810.78719.13<0.0001
C20.01810.01816.930.0003
Residual0.031291.080333 × 10−3
Cor Total10.2235
Publisher’s Note: MDPI stays neutral with regard to jurisdictional claims in published maps and institutional affiliations.

