
The 3E Optimal Location Assessment of Flat-Plate Solar Collectors for Domestic Applications in Iran


Abstract
:1. Introduction
- Only the return of investment has been taken into account, and the parameters that show the return of energy or greenhouse gas emissions have not been considered in evaluating the system.
- A systematic decision-making approach has not been employed to answer the question of, among a number of candidate locations utilizing flat-plate solar collectors, which one gains the most energy, economic, and environmental (3E) benefits?
- There has been no study in the past in which a systematic approach was employed to determine the optimal installation of flat-plate solar collectors or building-integrated photovoltaic thermal (BIPV/T) systems among a number of cities. In other words, a systematic decision-making approach has never been employed to determine the best city for the installation of flat-plate solar collectors or BIPV/T systems among a number of candidate cities.
- Payback periods of energy and greenhouse gas emissions are considered in addition to the payback period of investment for the evaluation of the system. This leads to having one dimensionless characteristic from each 3E aspect to evaluate the potential of utilizing flat-plate solar collectors.
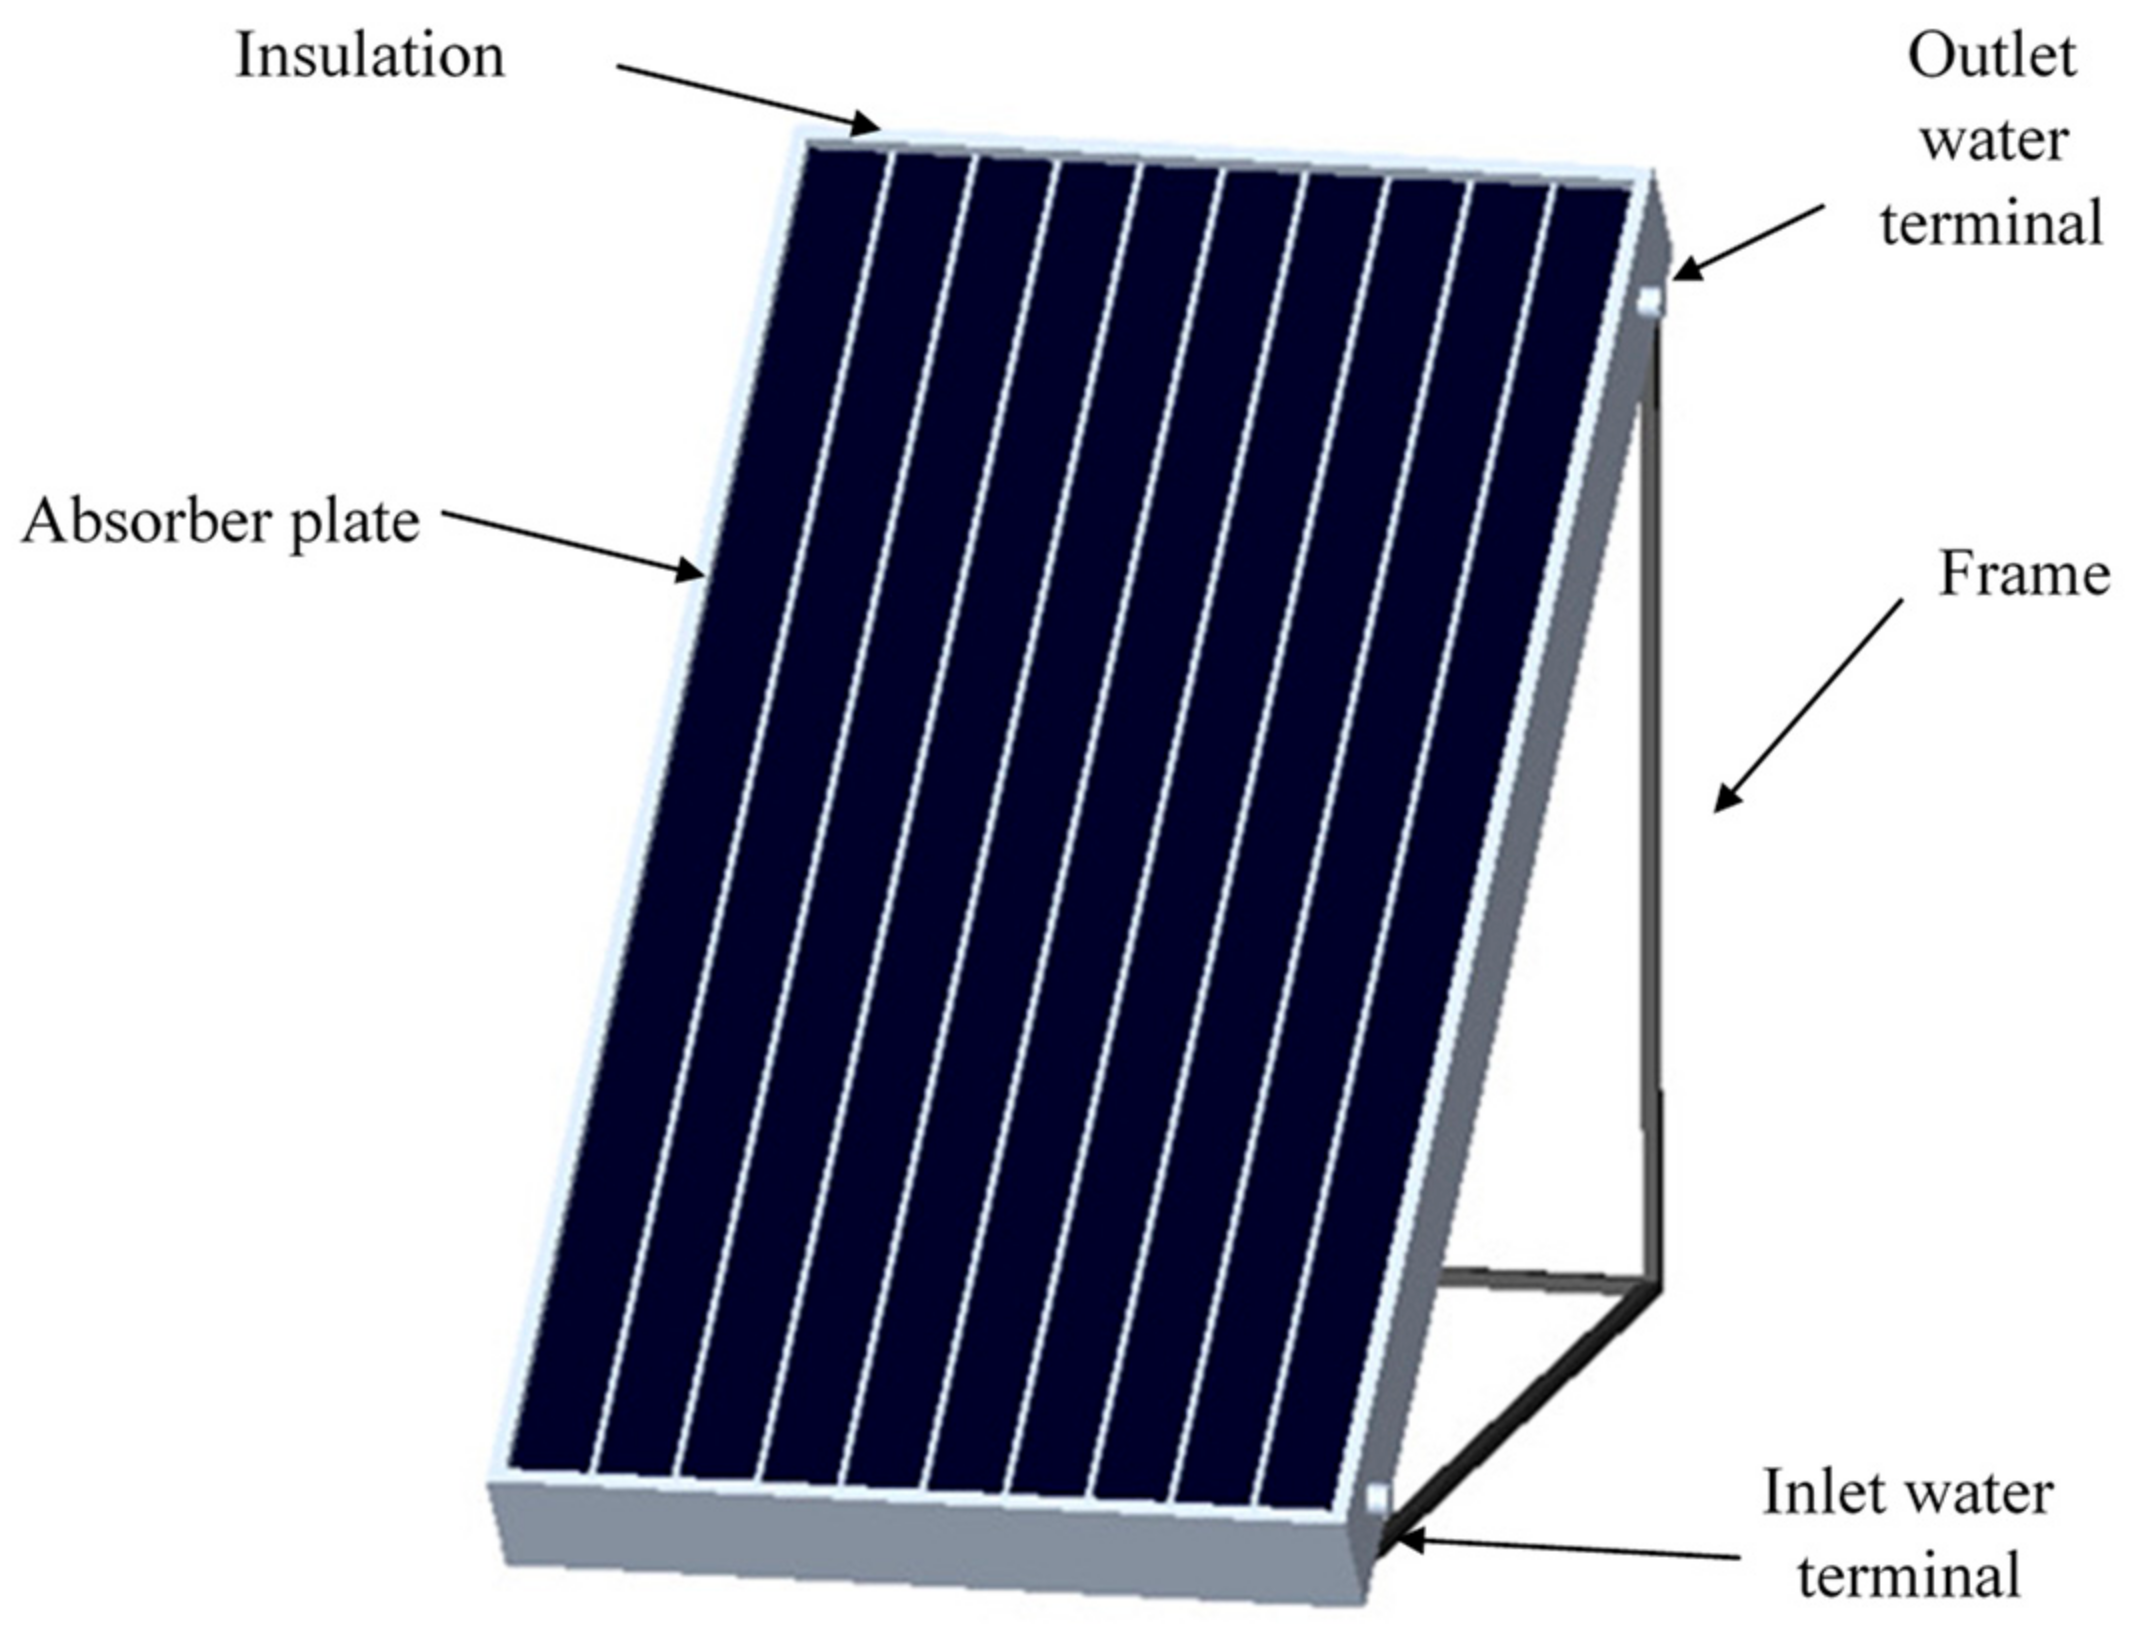
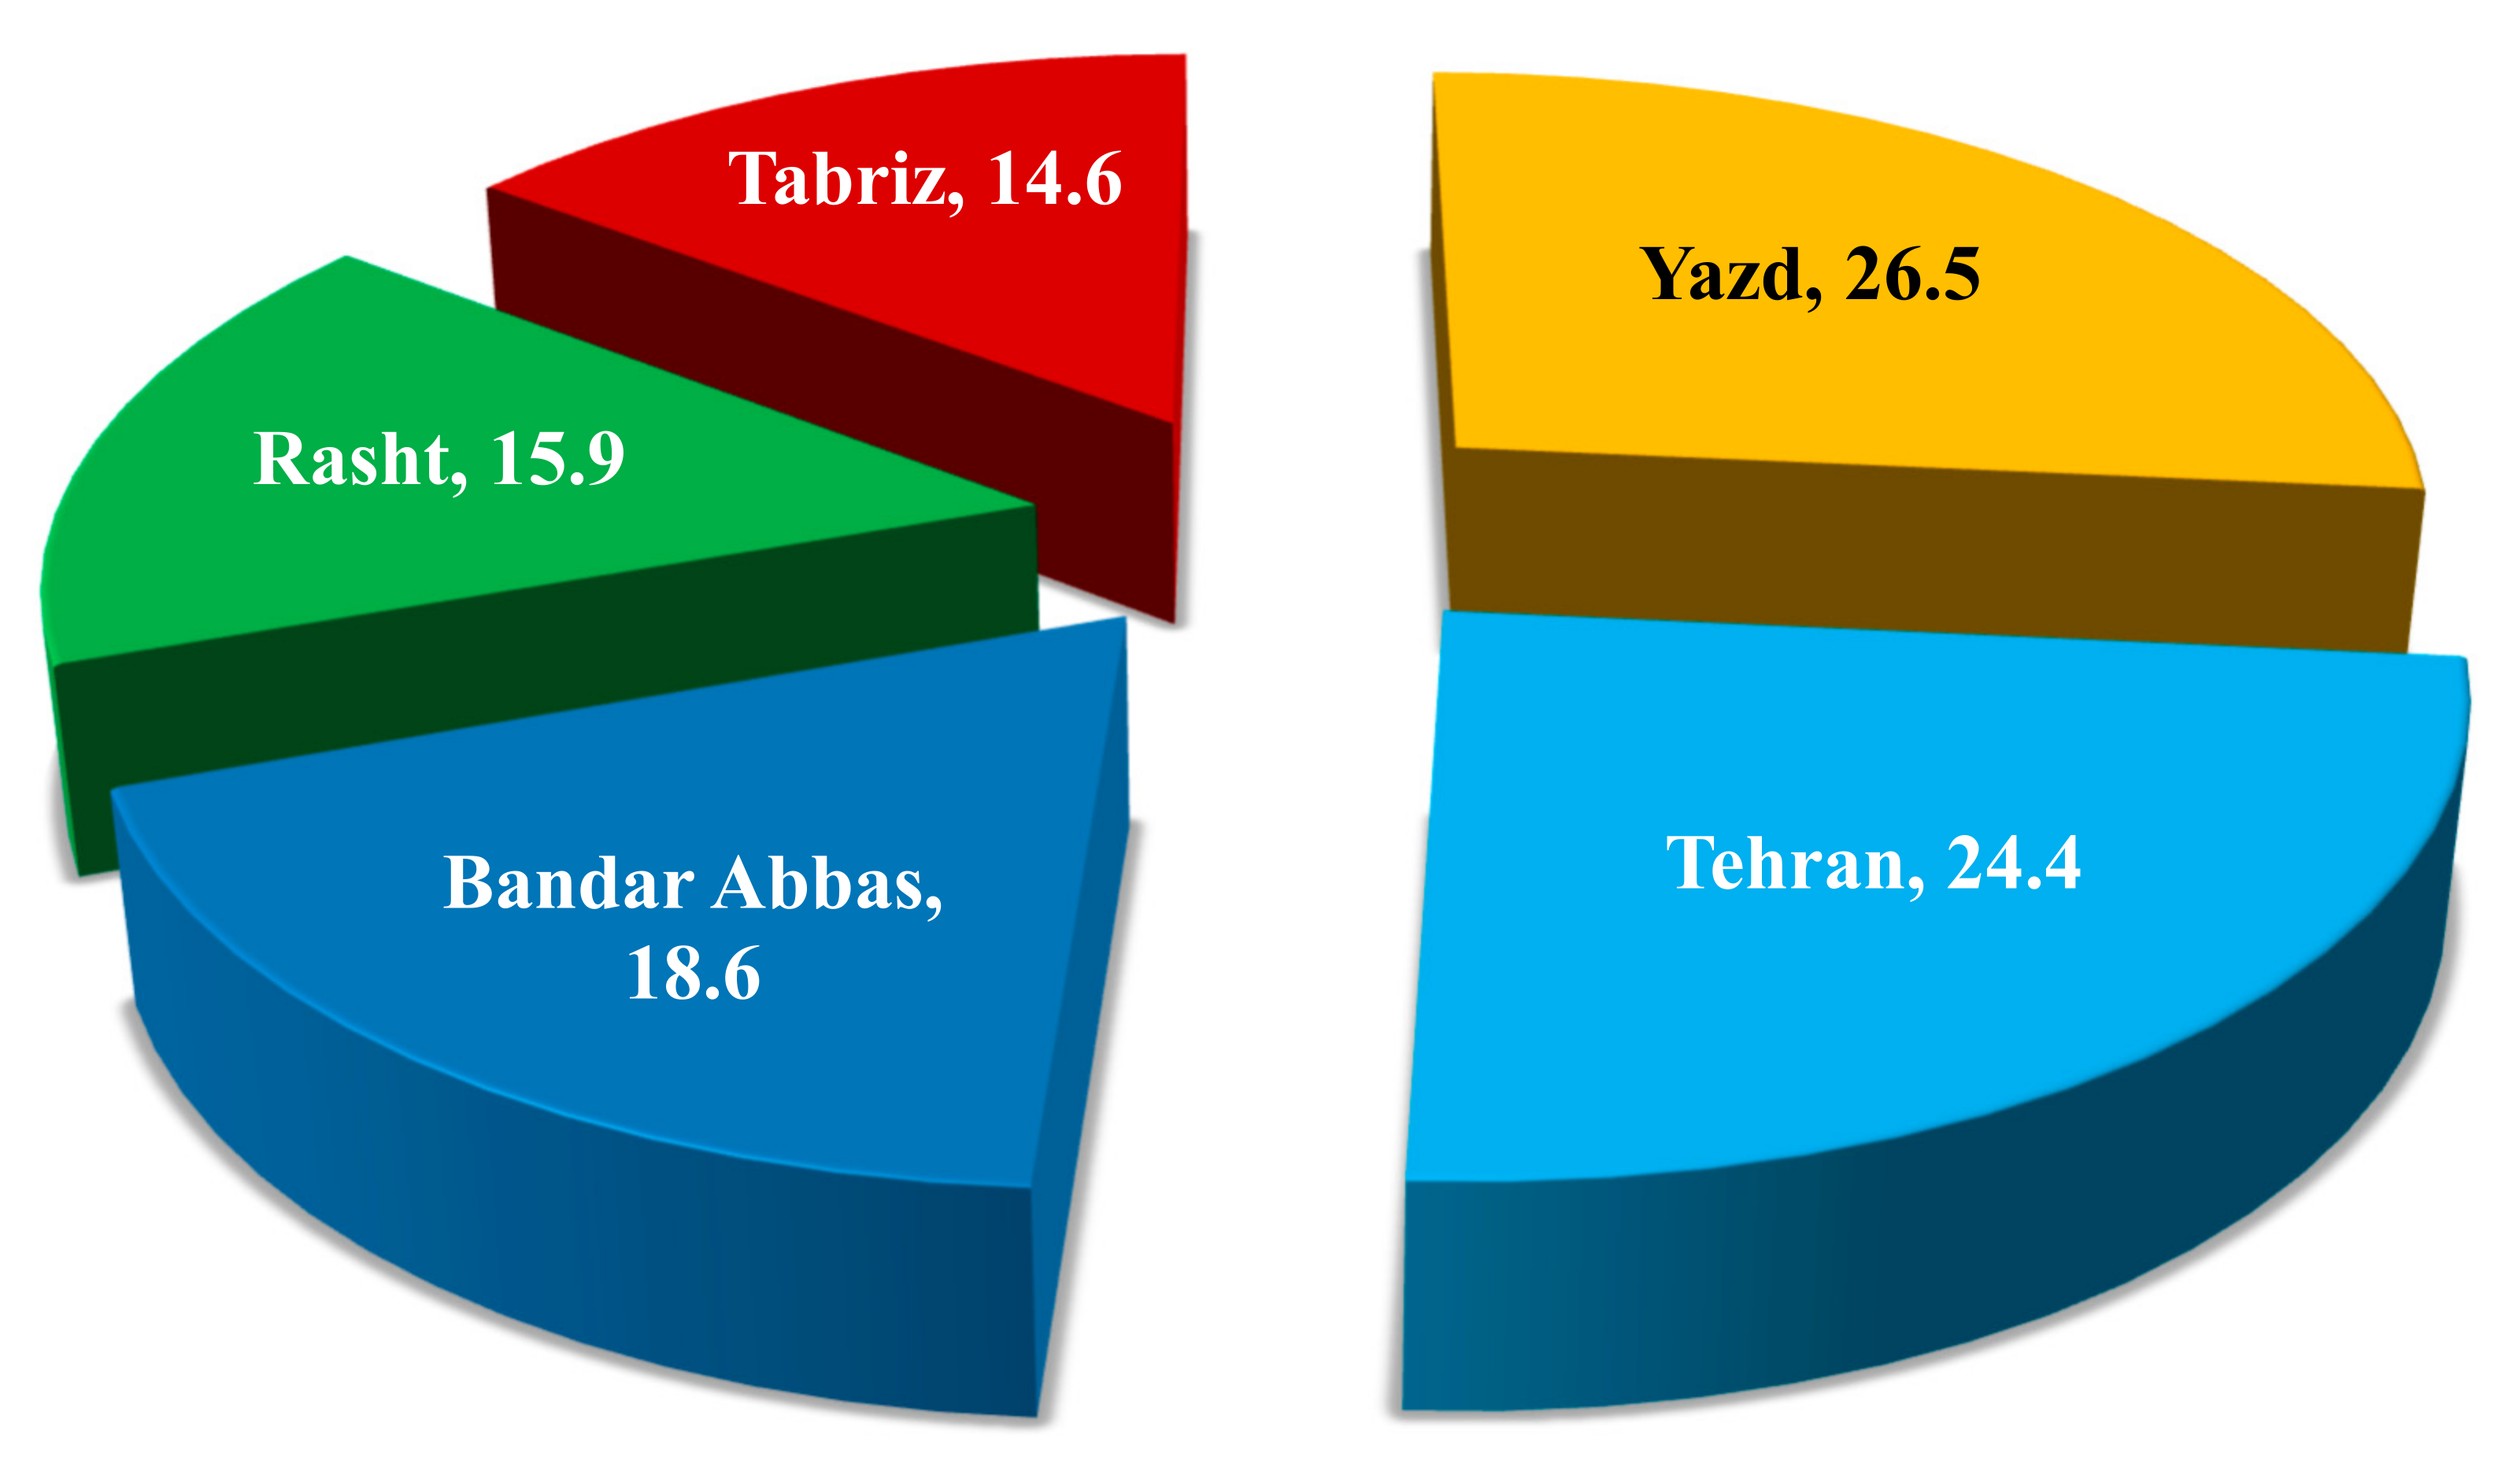
- The analytical hierarchy process (AHP) decision-making approach was employed to determine the best place among a number of candidate cities to utilize flat-plate solar collectors. Tehran, Tabriz, Rasht, Yazd, and Bandar Abbas, as the larger cities in Iran with diverse climatic conditions, were chosen as the candidate cities, and a flat-plate solar collector is assumed to provide a sufficient heating load for them. As shown in Figure 1, a flat-plate collector consists of glass and absorbent and insulating parts. Sunlight passes through the glass and hits the absorber plate, where it converts the solar energy into heat energy, causing fluid to heat up. The gained thermal energy is utilized for providing domestic hot water and space heating purposes.
2. Methodology
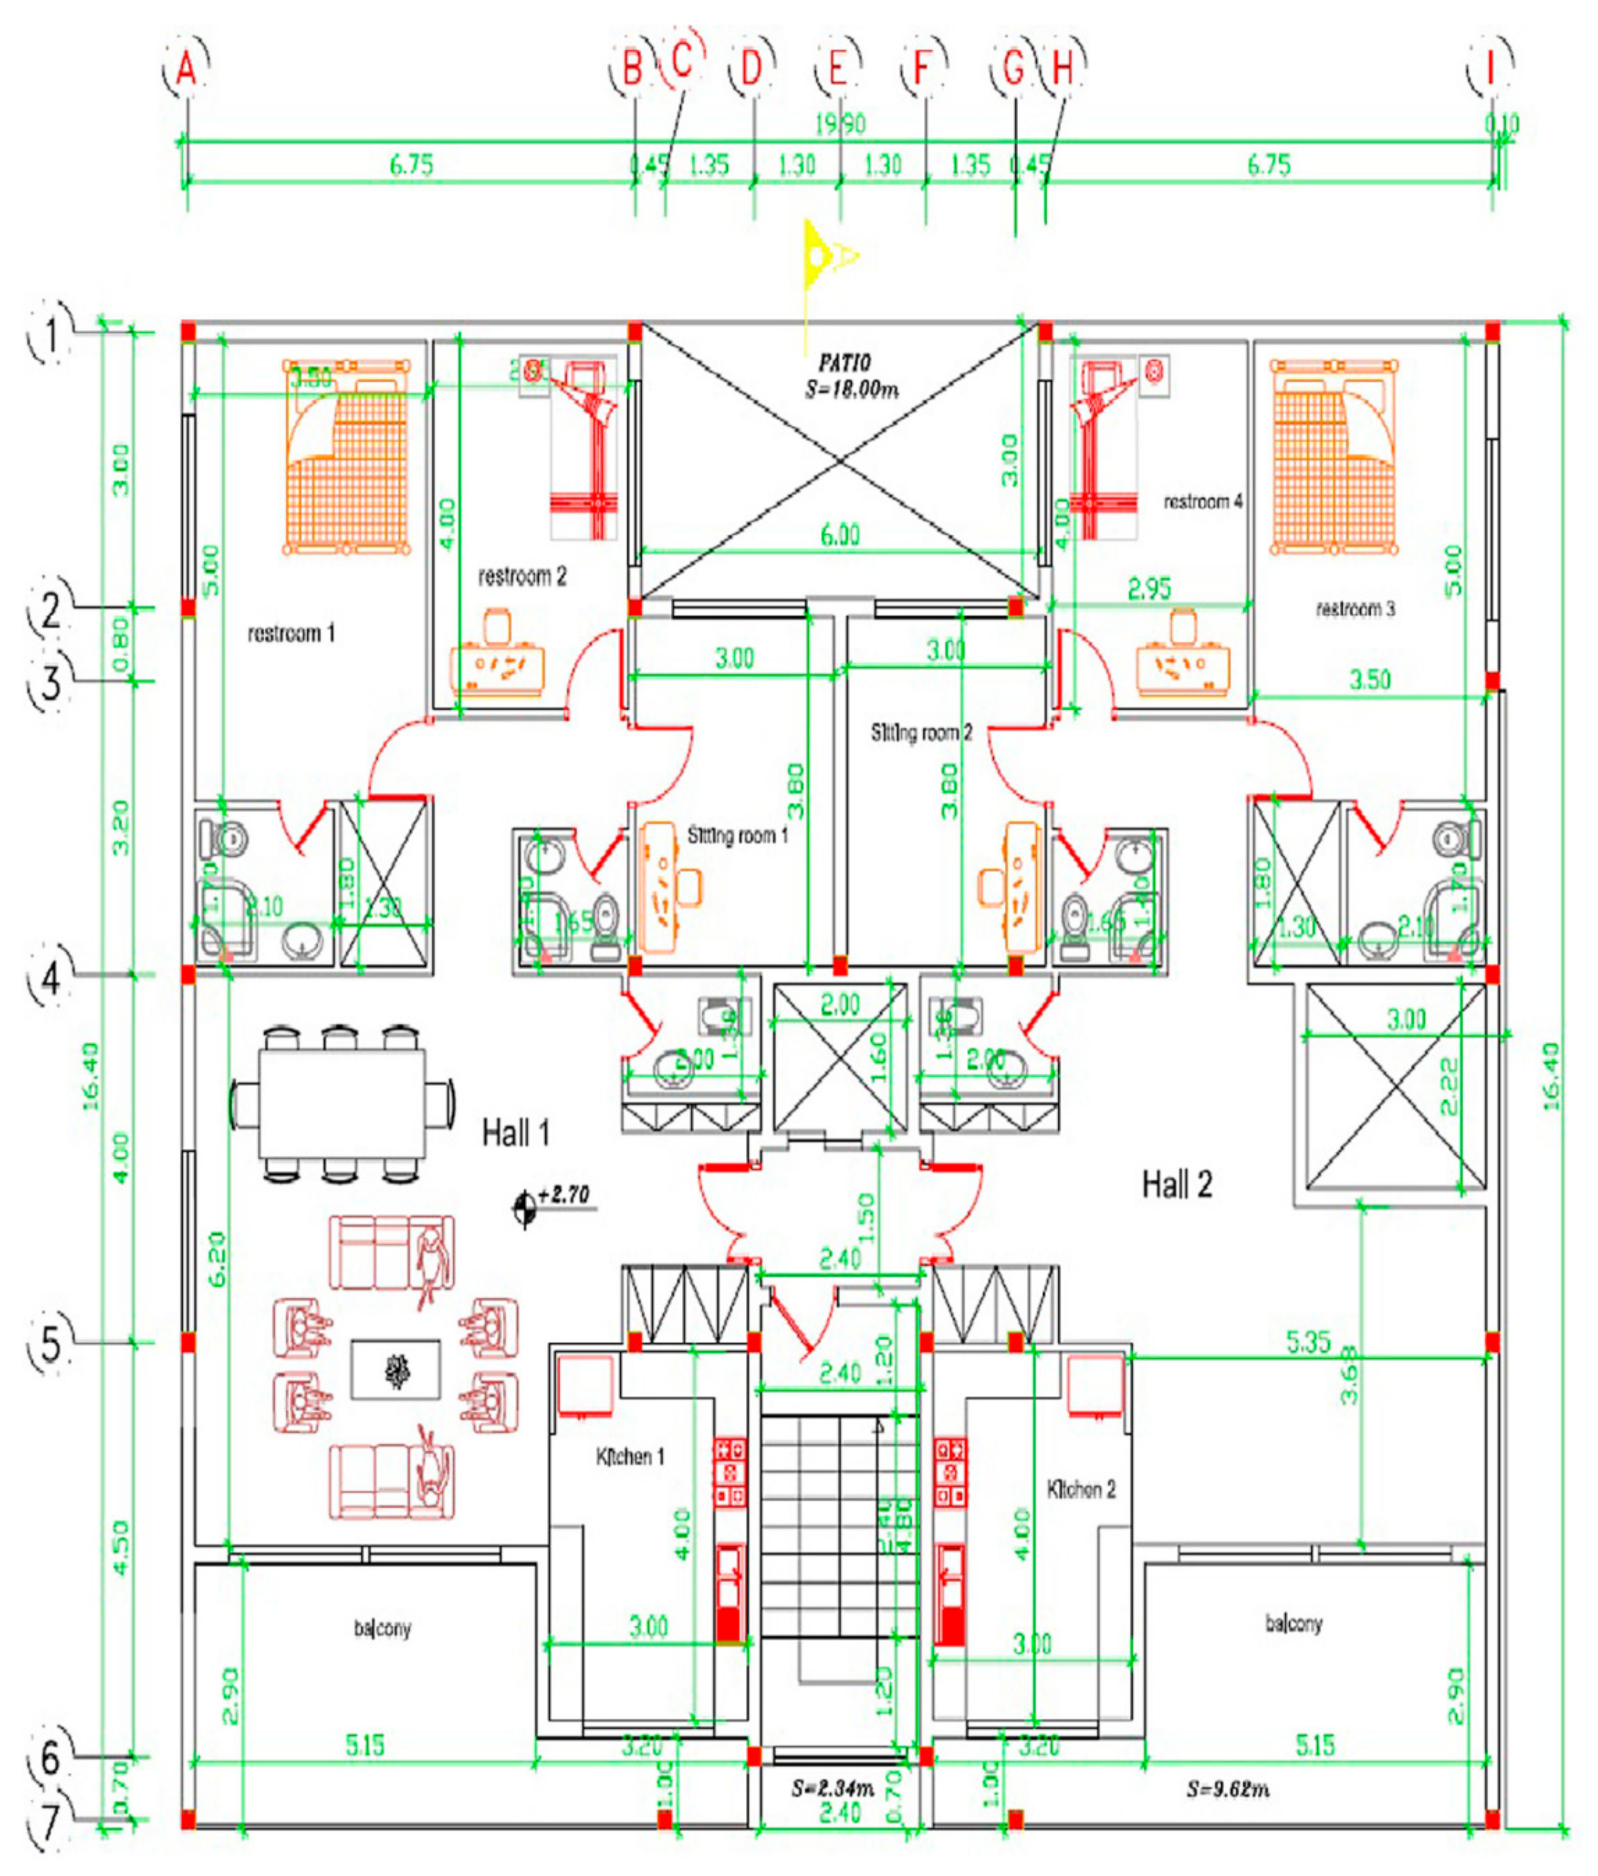
2.1. The Building
2.2. The Cities
3. Methodology
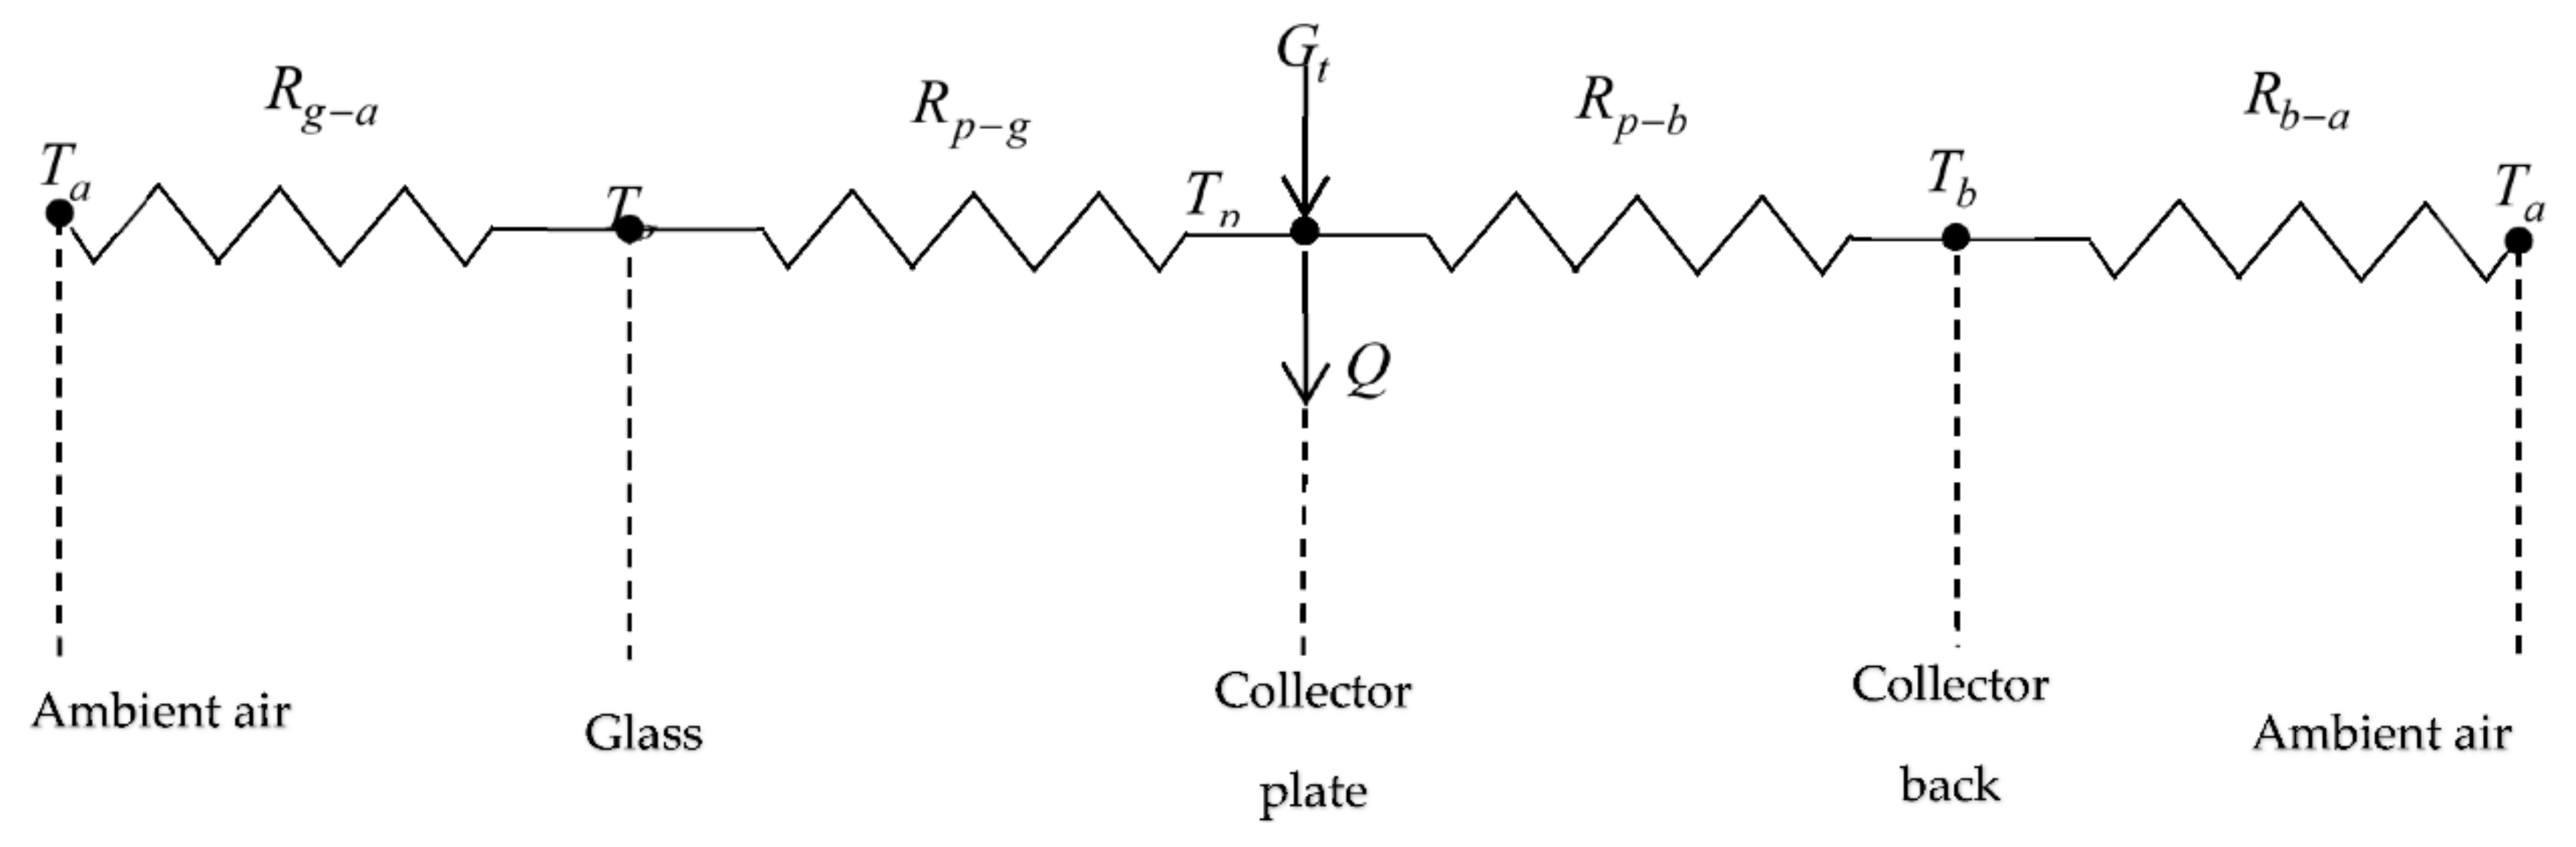
3.1. Mathematical Modeling of Flat Plate Solar Thermal Collector
- Bottom heat loss ,
- Top heat loss ,
- Edge loss .
3.2. Calculation Method of Payback Periods
3.2.1. Payback Period of Energy
3.2.2. Payback Period of Investment
3.2.3. Greenhouse Gas Emissions Payback Period
3.3. Decision-Making Approach
4. Results and Discussion
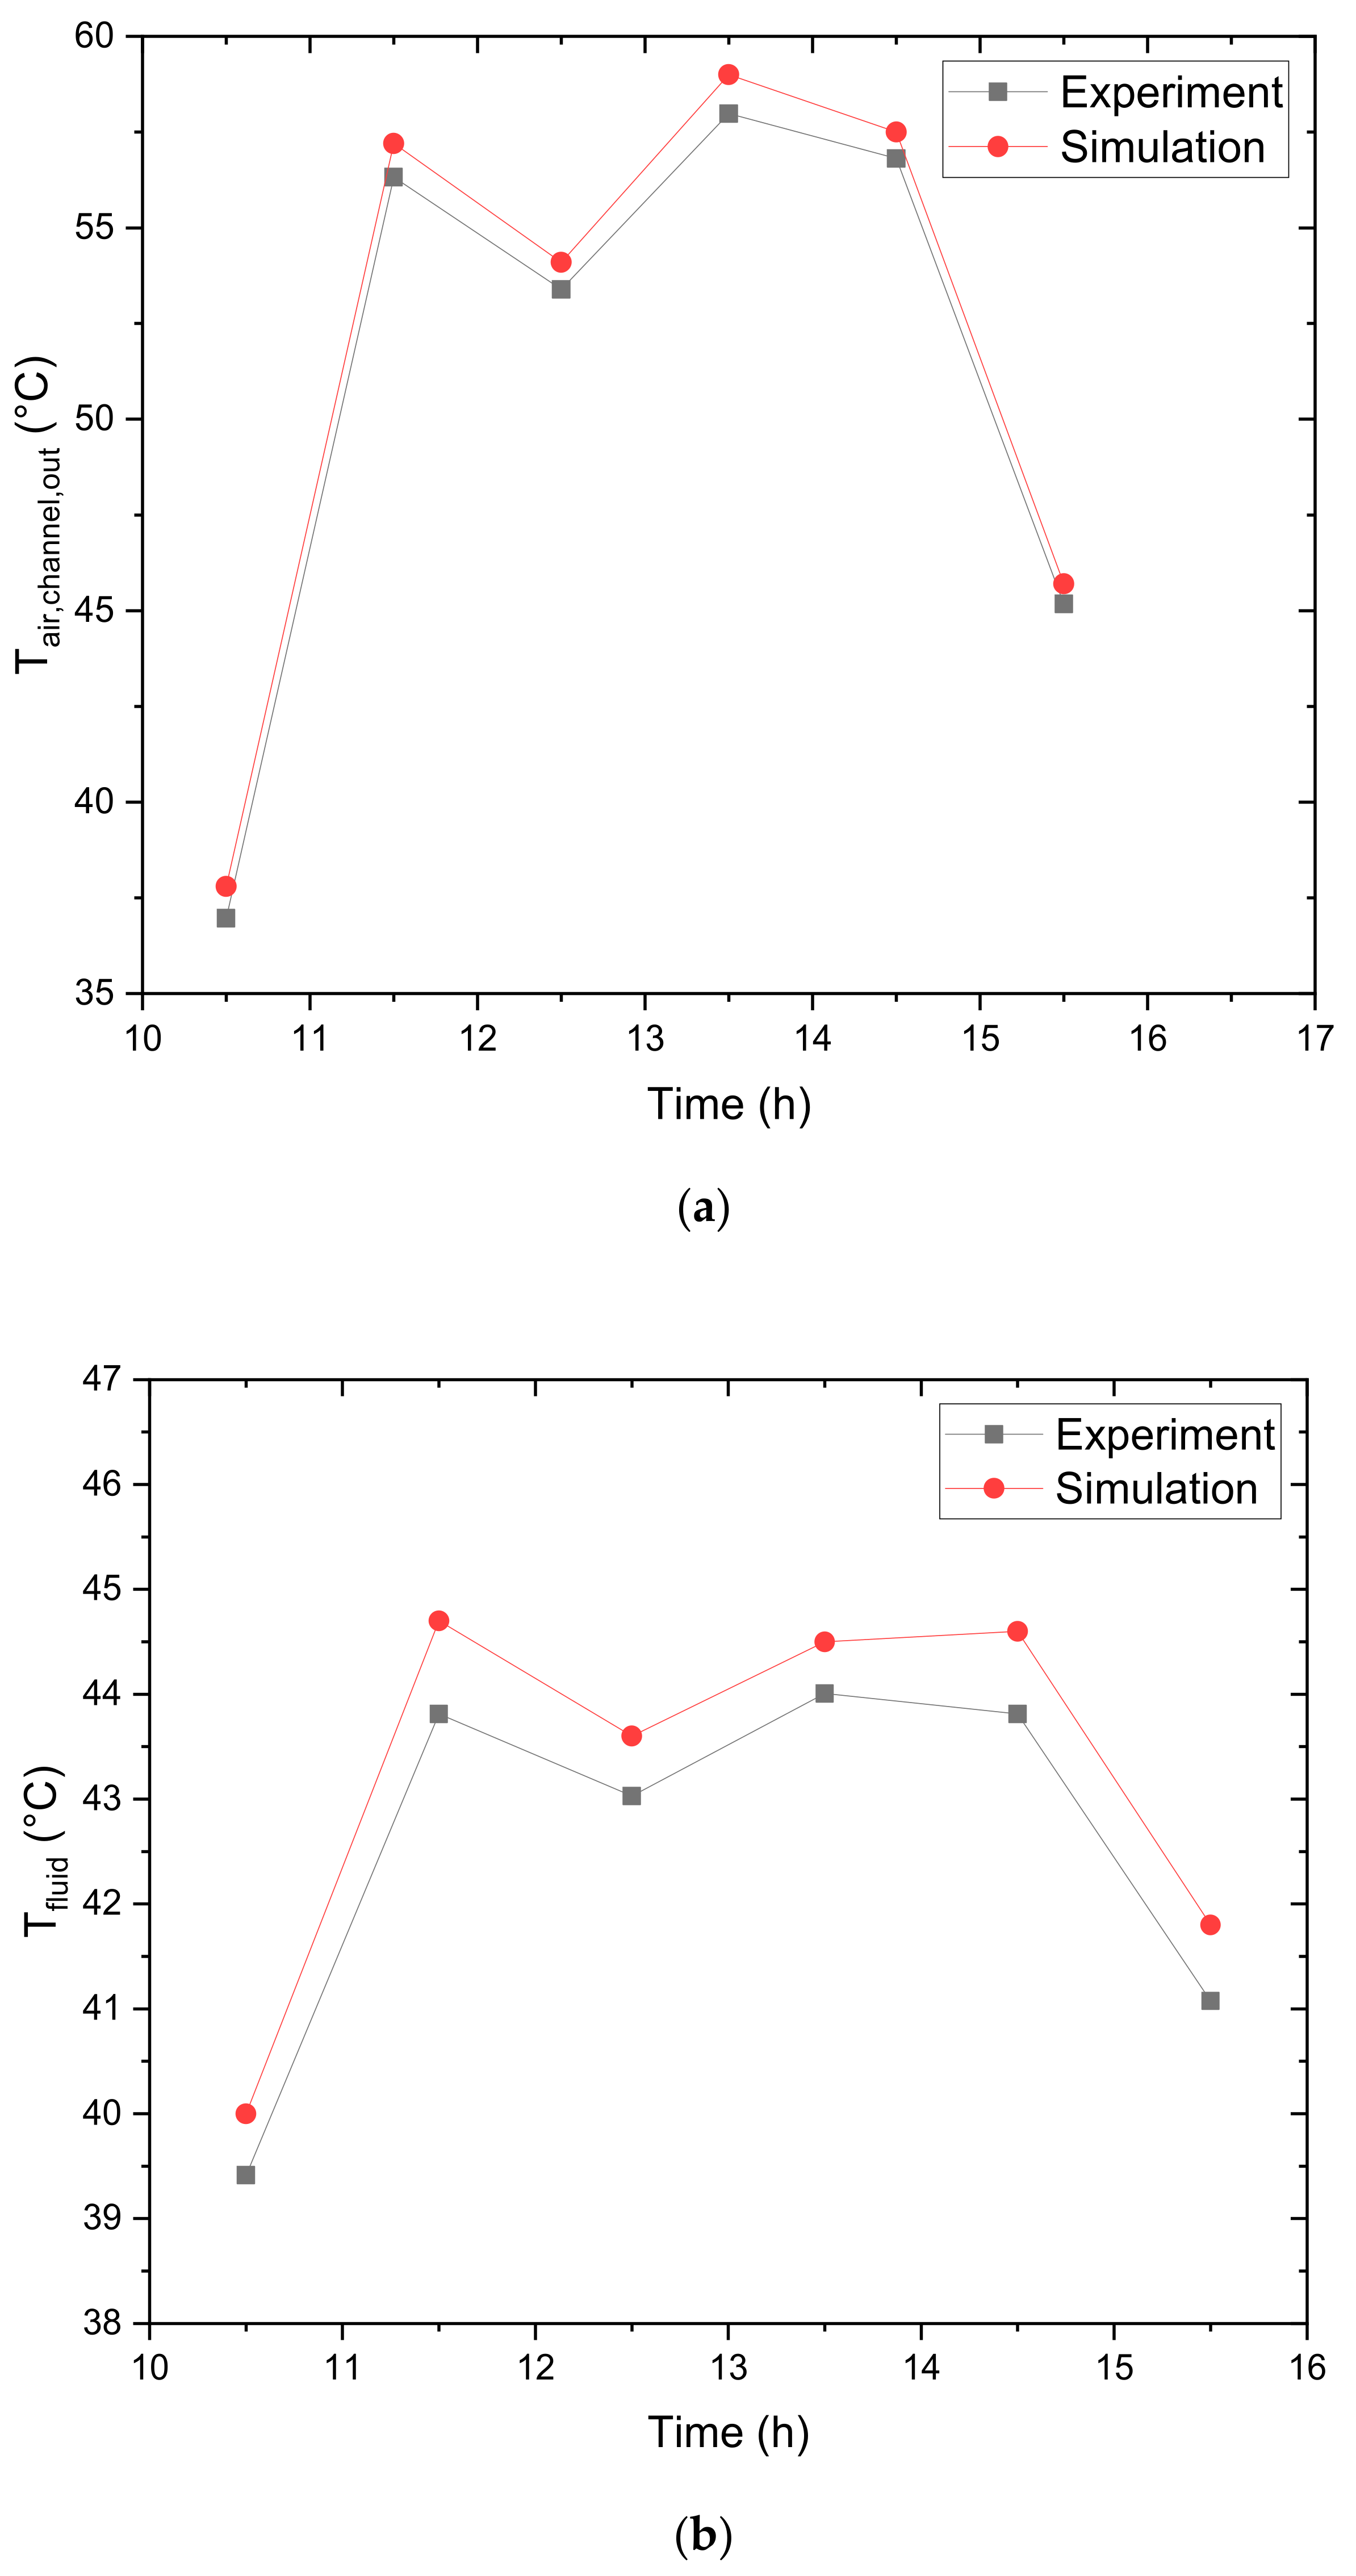
4.1. Model Validation
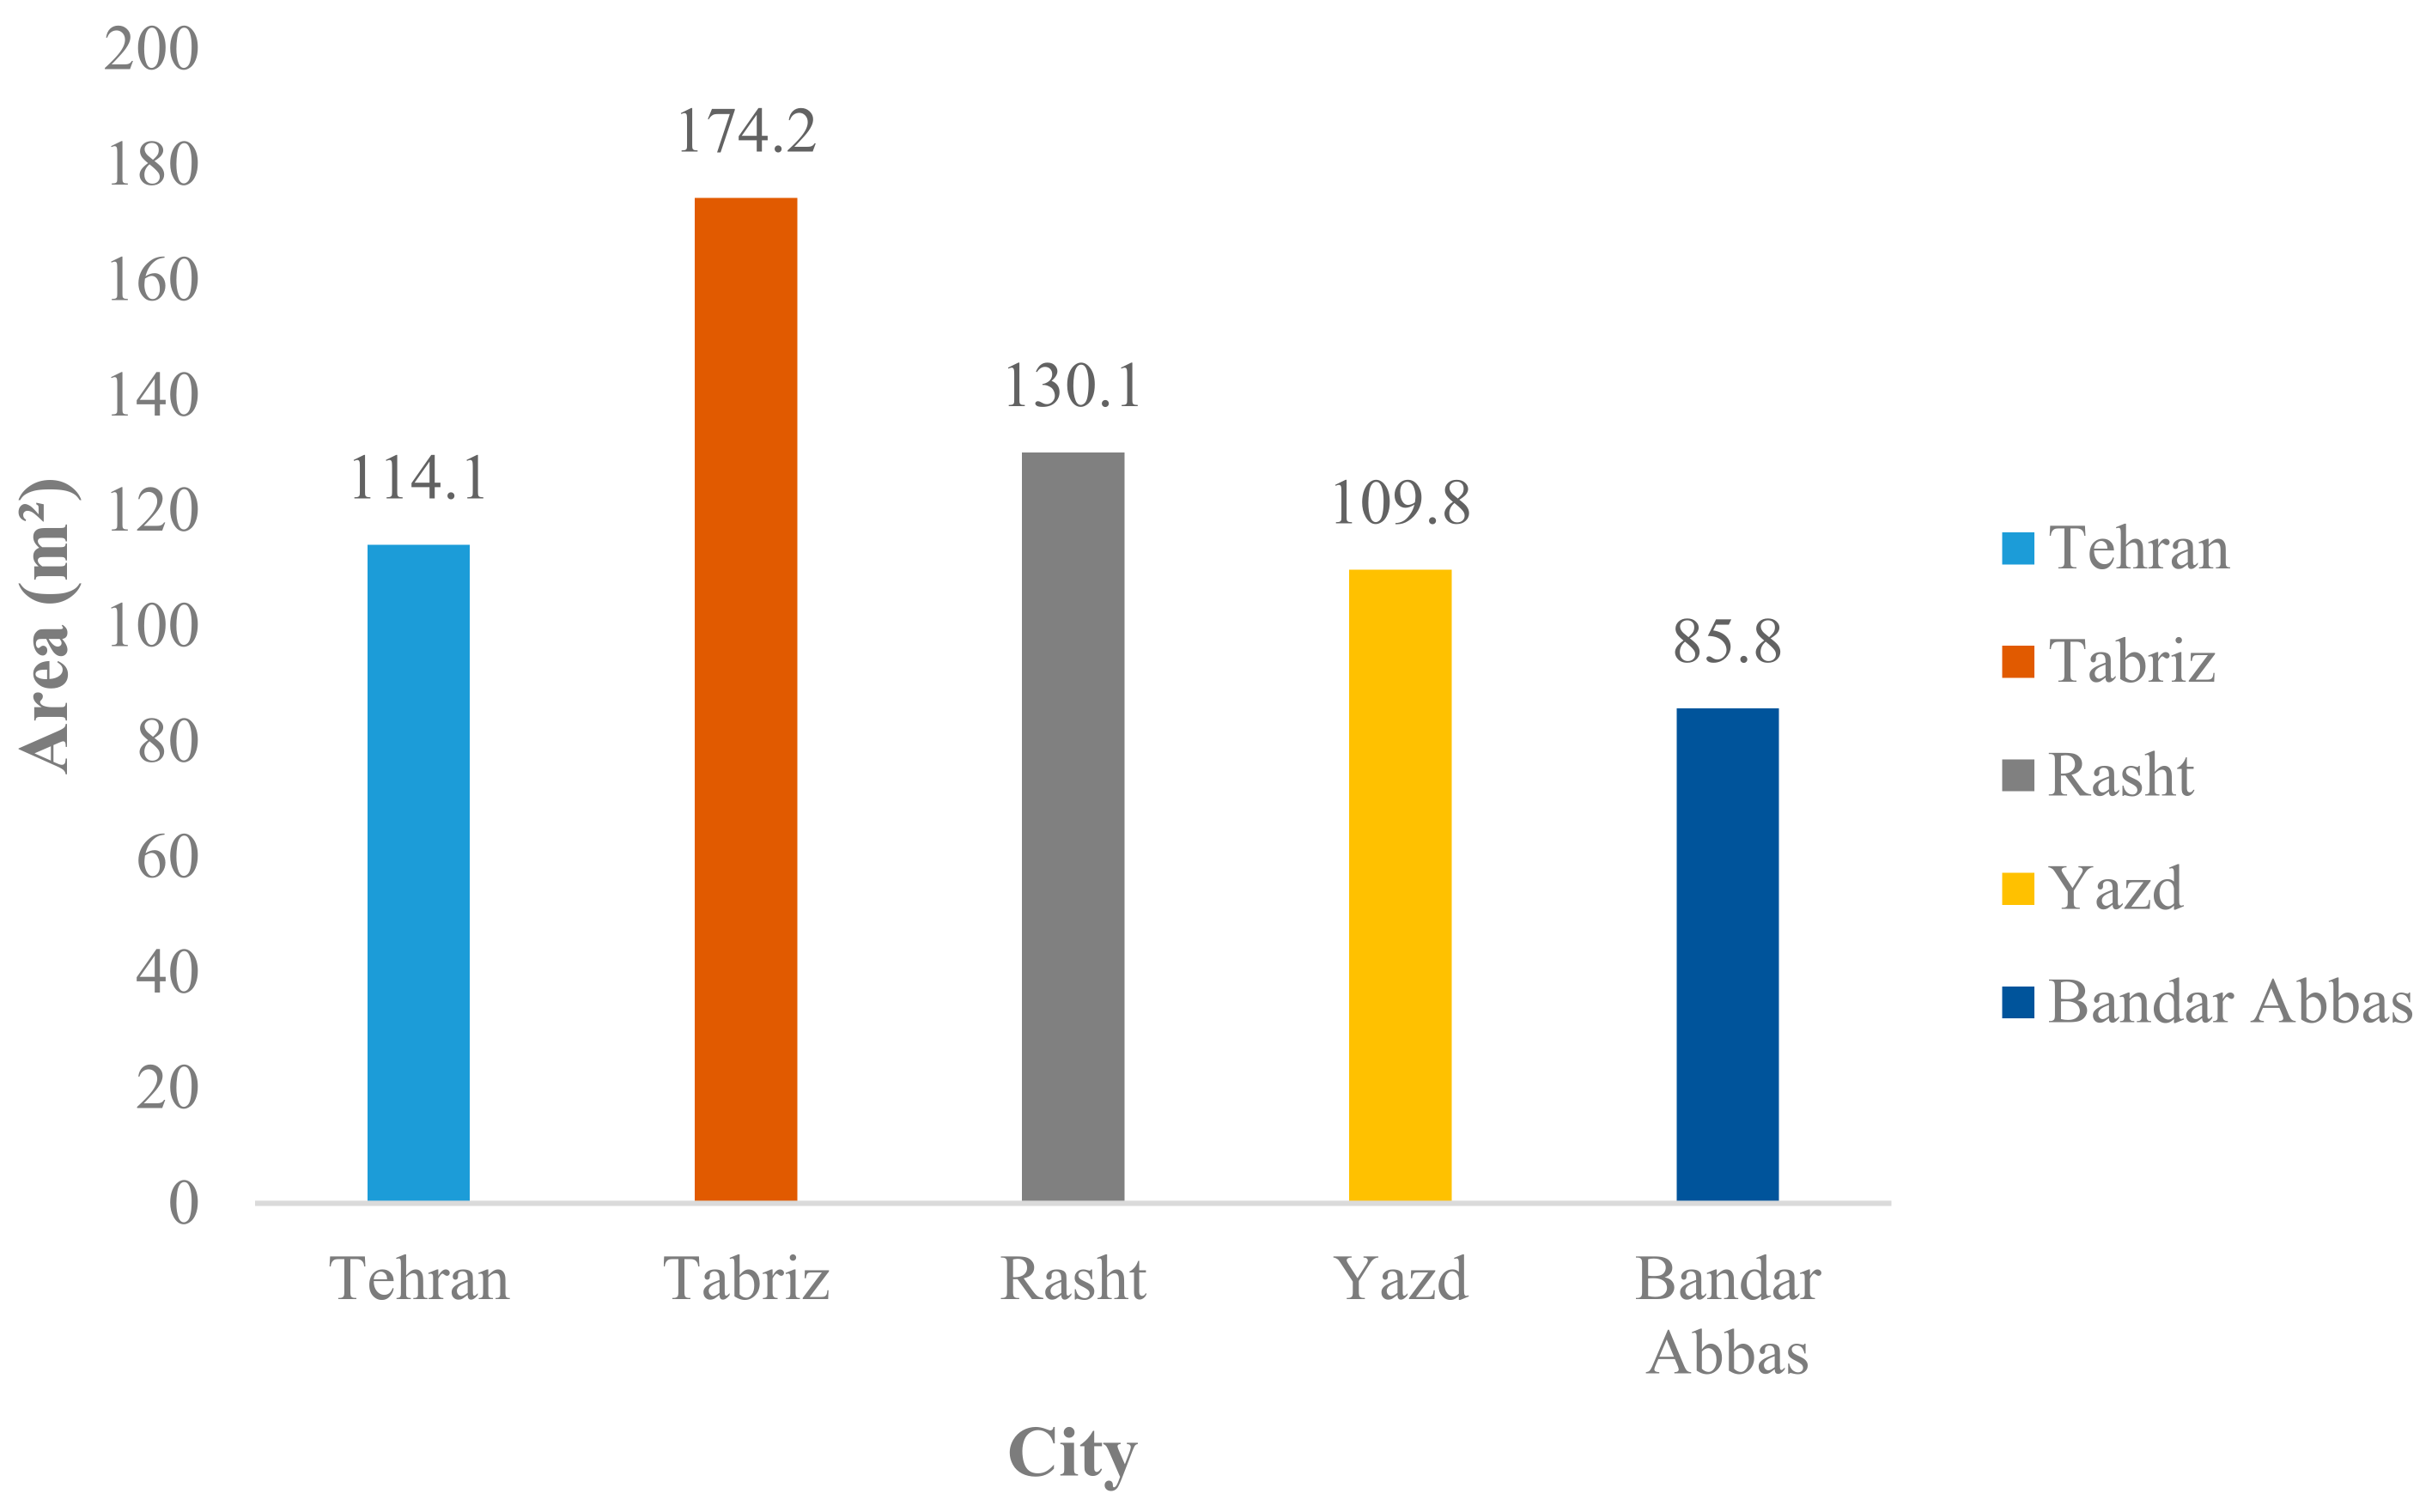
4.2. The Area of Solar Thermal Collectors
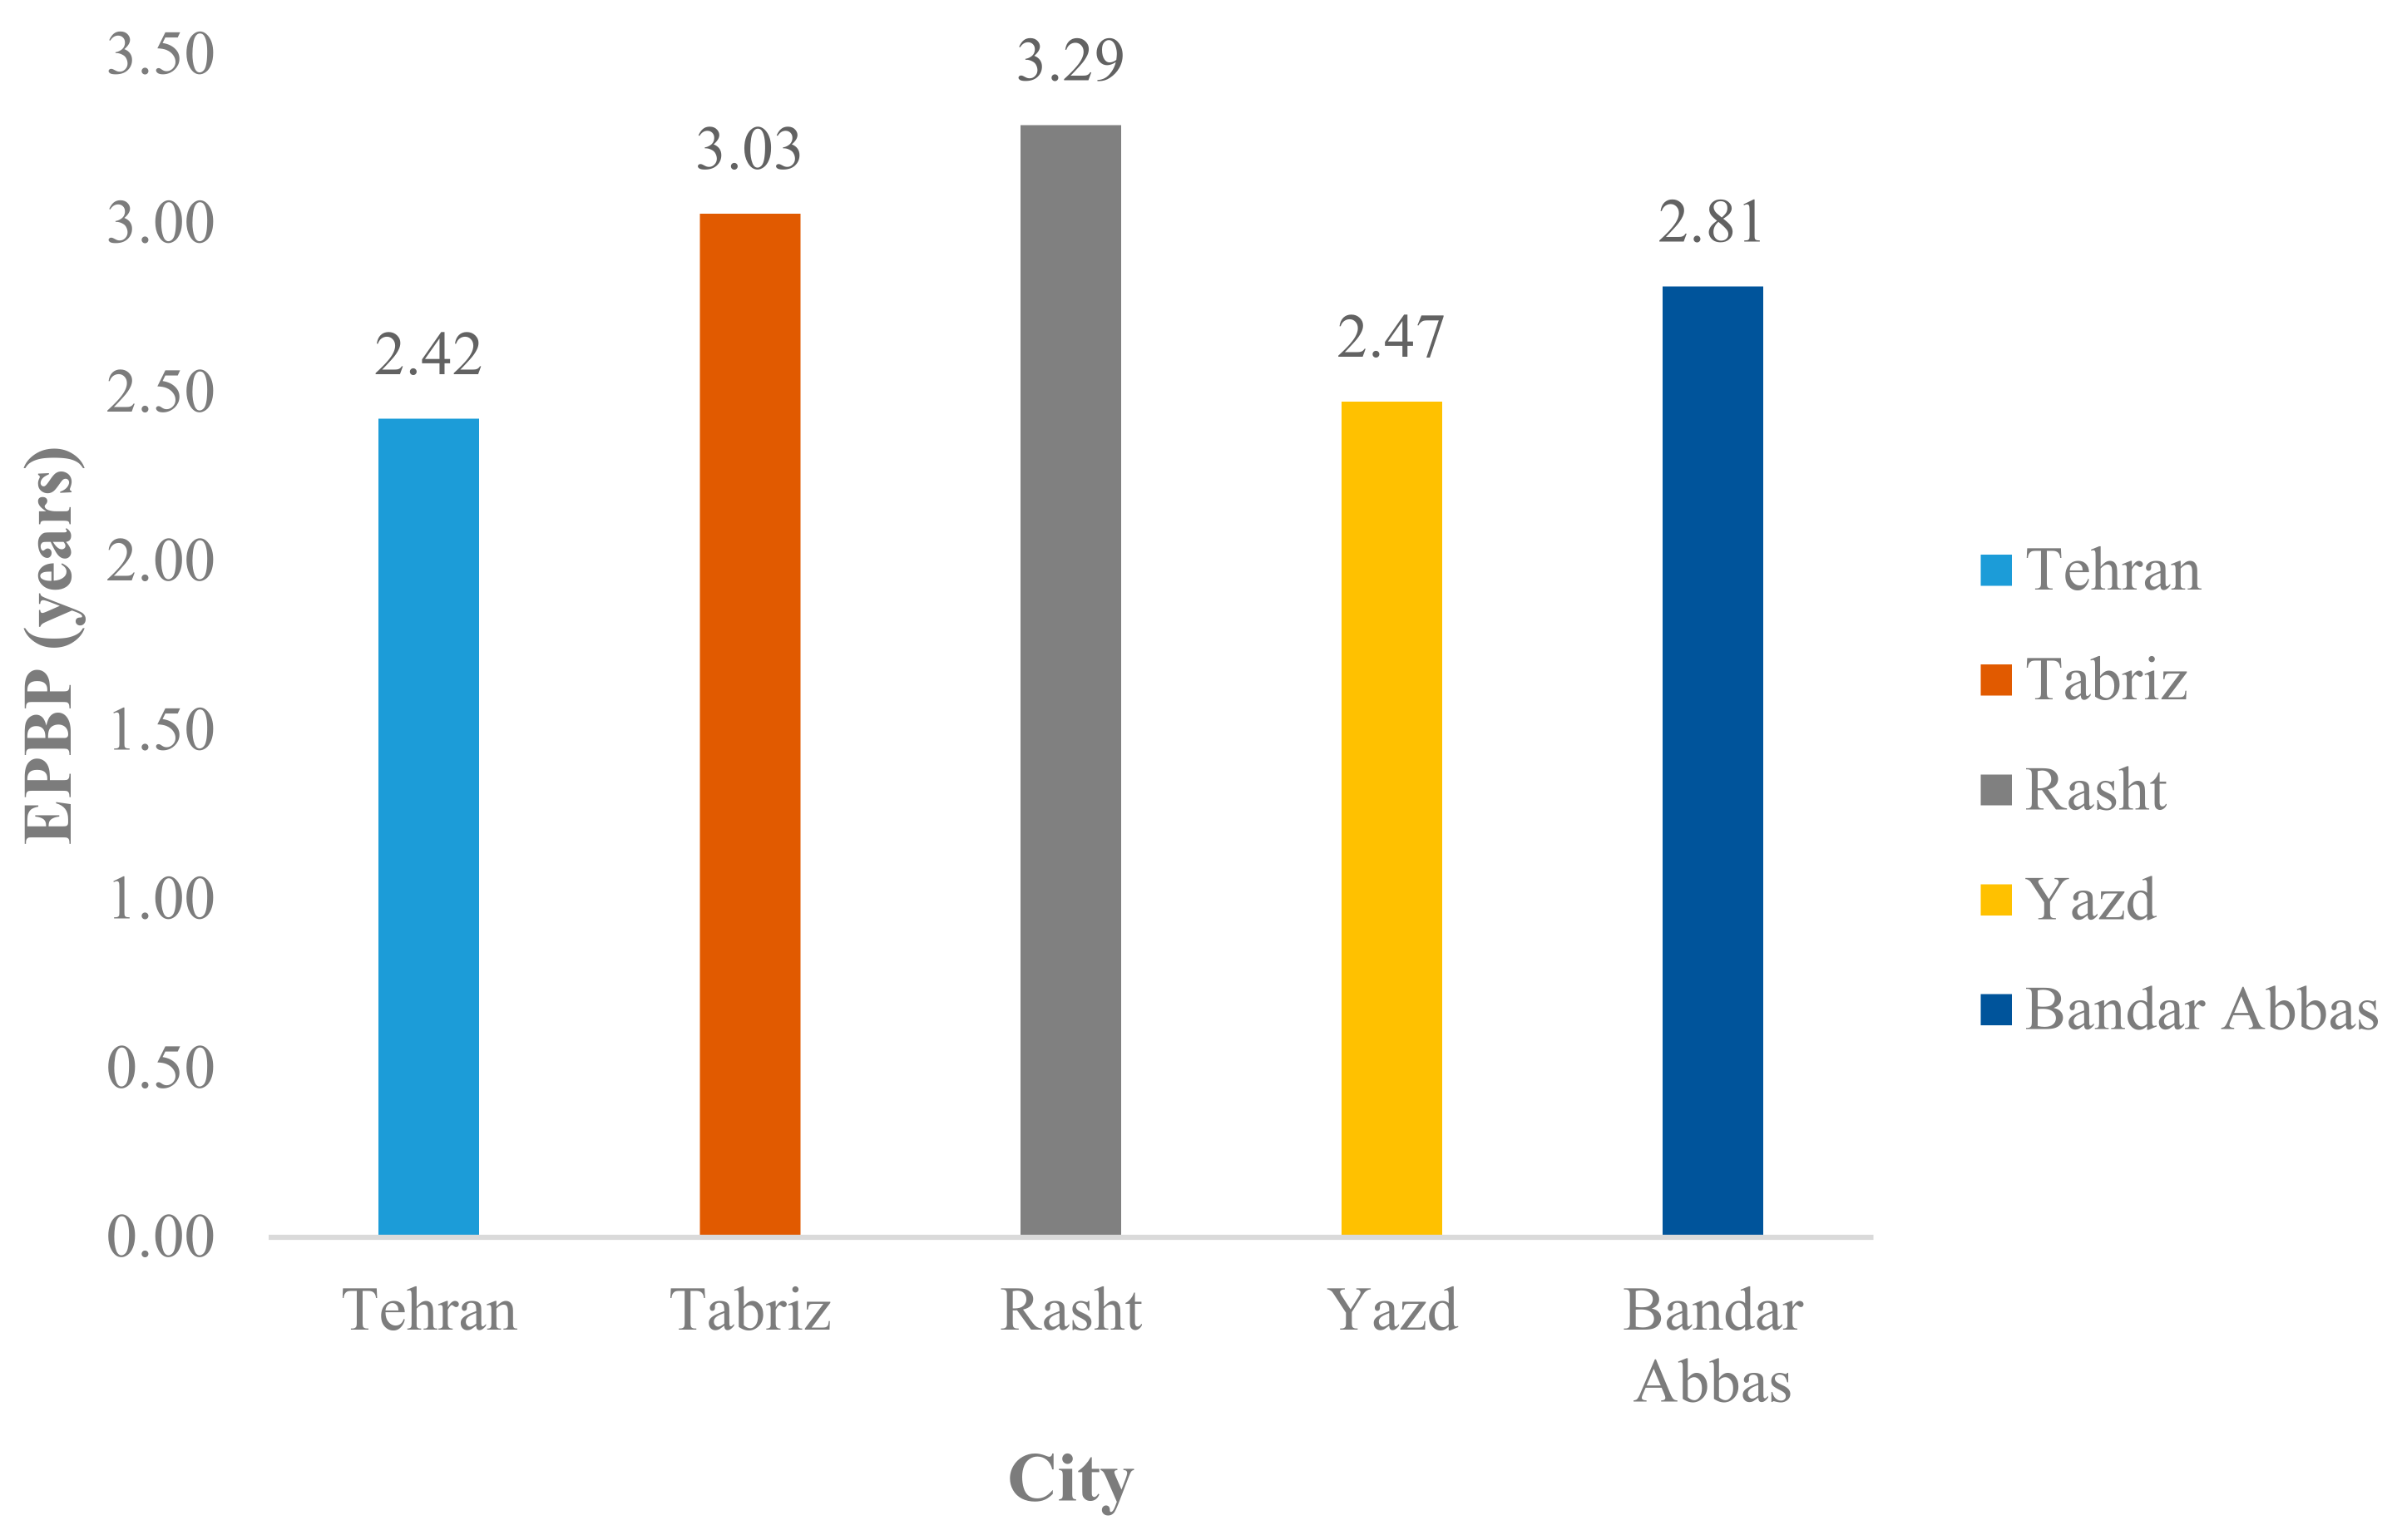
4.3. Payback Period of Energy
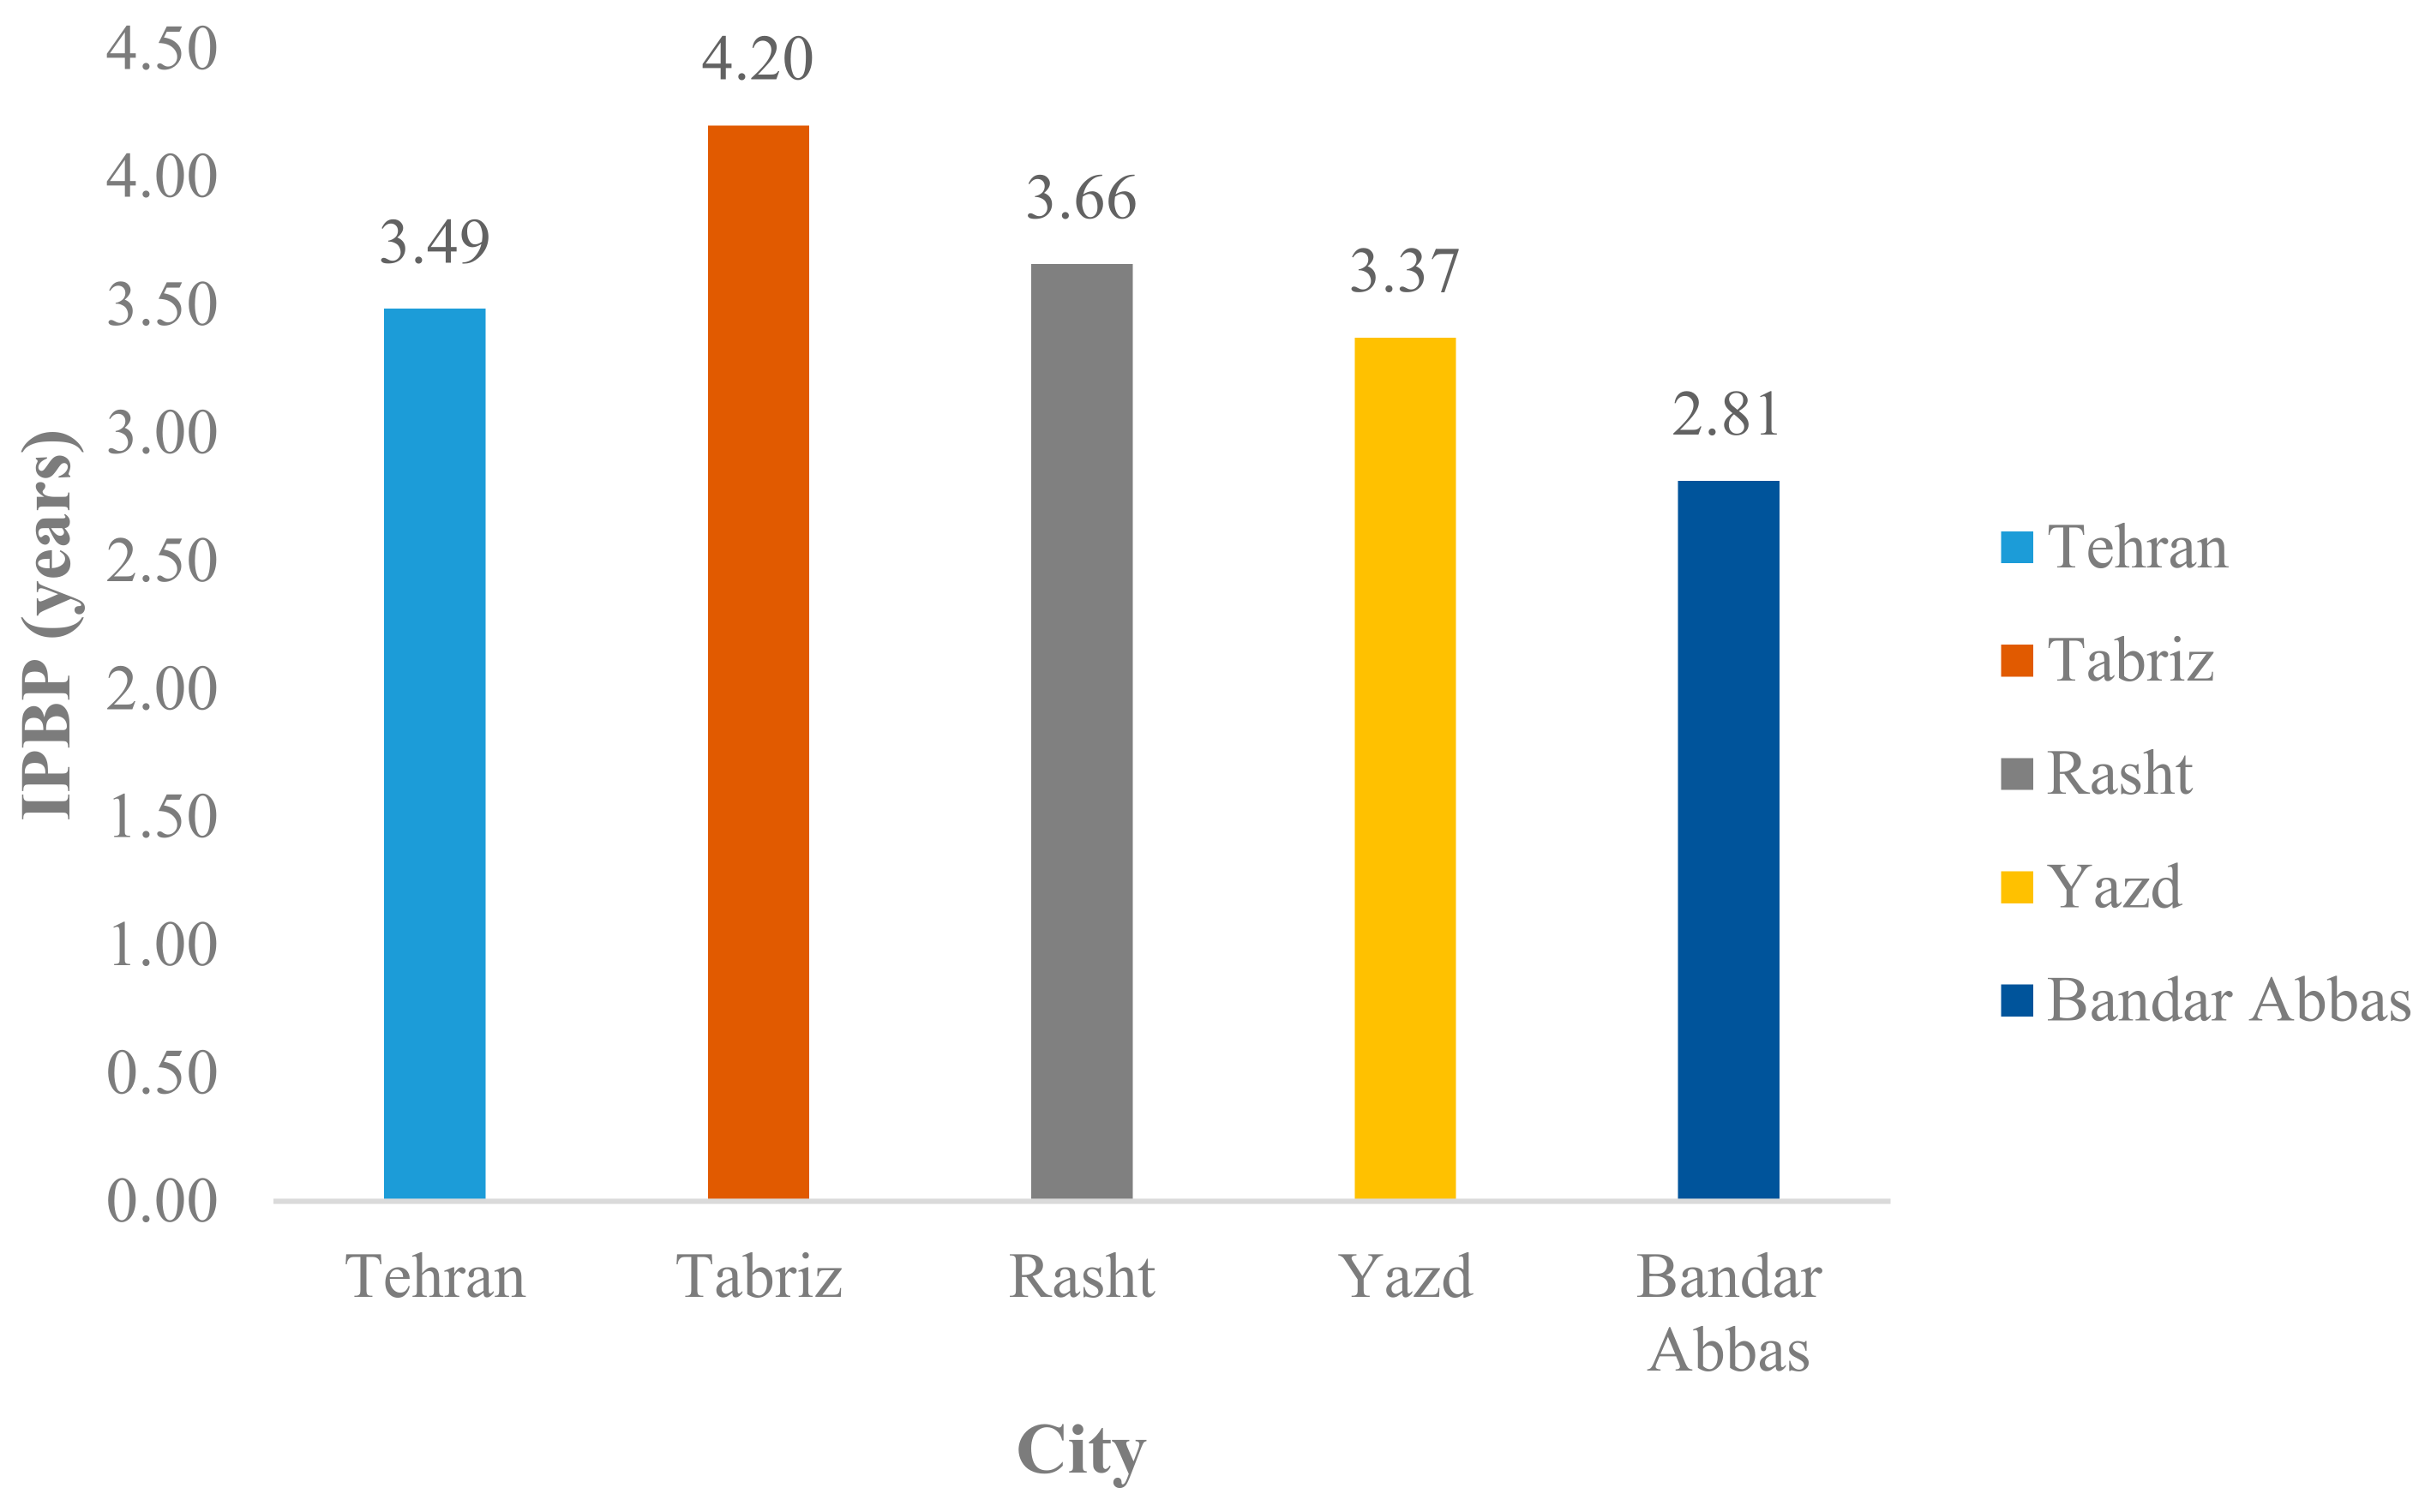
4.4. Payback Period of Investment
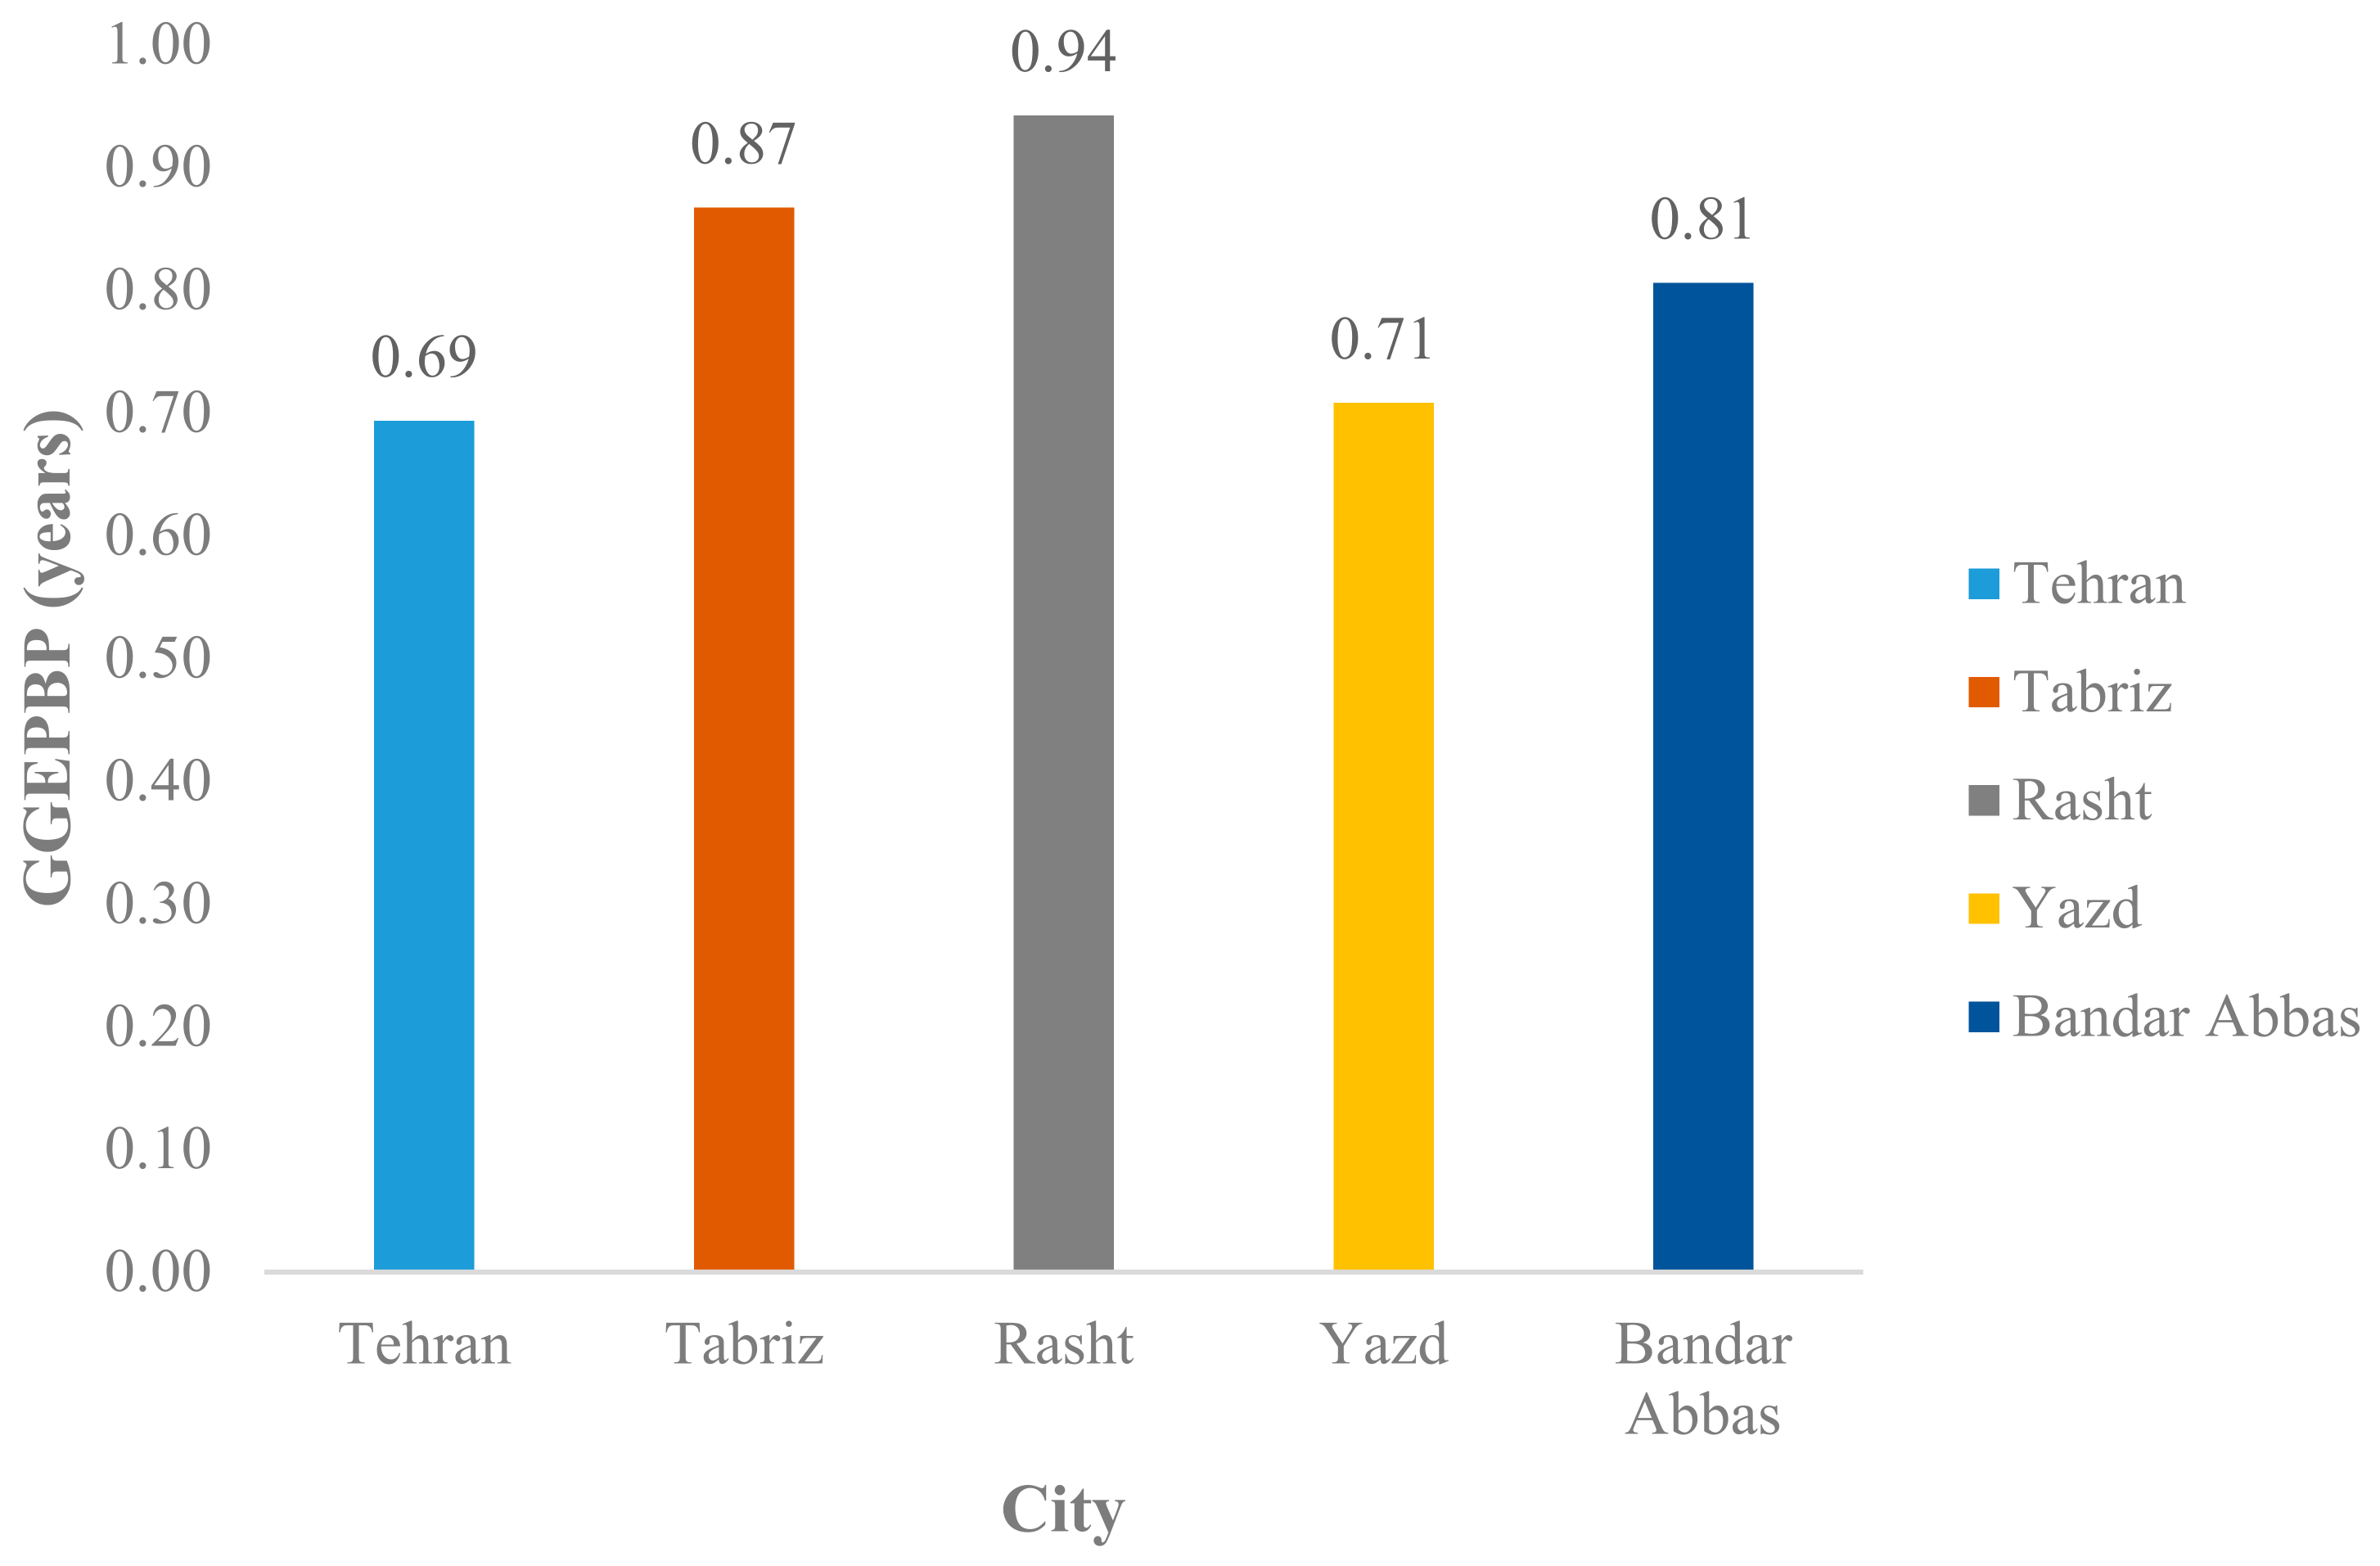
4.5. Payback Period of Greenhouse Gas Emissions
4.6. Optimal Location Analysis to Install the Solar Thermal Collector System
5. Conclusions
Author Contributions
Funding
Institutional Review Board Statement
Informed Consent Statement
Data Availability Statement
Conflicts of Interest
Nomenclature
| List of symbols | |
| Area of the collector (m2) | |
| AHC | Annual heat Covered by the flat plate solar collector (KWh) |
| Cost | |
| CDE | Carbon Dioxide Emission |
| Tube outside diameter | |
| Discount rate (%) | |
| Energy (J) | |
| EPBP | Energy Pay Back Period |
| The factor for efficiency of the collector | |
| Standard efficiency of the fin | |
| Heat removal factor | |
| Flow factor | |
| Gravitational constant | |
| Irradiance (W.m−2) | |
| GGEPBP | Payback period of greenhouse gas emissions |
| The coefficient for heat transfer (W.K−1.m−2) | |
| Inflation rate (%) | |
| IPBP | Payback period of investment (Years) |
| IPP | Initial purchase price ($) |
| Thermal conductivity (W.m−1.K−1) | |
| Absorber to glass cover distance | |
| Nusselt number | |
| Mass flow rate (kg.s−1) | |
| Prandtl number | |
| Present value (worth) | |
| Heat flow (W) | |
| R | Resistance (m2.K.W−1) |
| Ra | Rayleigh number |
| Wind velocity (m.s−1) | |
| Temperature (K) | |
| Overall thermal transmittance (W.m−2.K−1) | |
| Tube spacing (m) | |
| Greek symbol | |
| Absorptivity | |
| Volumetric coefficient of expansion | |
| Collector slope | |
| ) | |
| Emissivity | |
| Kinetic viscosity | |
| Stefan Boltzmann coefficient (W.m−2.K−4) | |
| Transmissivity | |
| Subscripts | |
| Ambient | |
| Bottom | |
| Convection | |
| Edge of the glass | |
| Glass | |
| Inlet | |
| Natural gas | |
| Outlet | |
| Operating and Maintenance | |
| Plate | |
| Radiation | |
| Top | |
| Abbreviations | |
| AHP | Analytical Hierarchy Process |
References
- Álvarez-Sánchez, F.; Flores-Prieto, J.; García-Valladares, O. Annual Thermal Performance of an Industrial Hybrid Direct–Indirect Solar Air Heating System for Drying Applications in Morelos-México. Energies 2021, 14, 5417. [Google Scholar] [CrossRef]
- Sohani, A.; Hoseinzadeh, S.; Berenjkar, K. Experimental analysis of innovative designs for solar still desalination technologies; An in-depth technical and economic assessment. J. Energy Storage 2021, 33, 101862. [Google Scholar] [CrossRef]
- Mostafizur, R.M.; Rasul, M.G.; Nabi, M.N. Energy and Exergy Analyses of a Flat Plate Solar Collector Using Various Nanofluids: An Analytical Approach. Energies 2021, 14, 4305. [Google Scholar] [CrossRef]
- Eismann, R.; Hummel, S.; Giovannetti, F. A Thermal-Hydraulic Model for the Stagnation of Solar Thermal Systems with Flat-Plate Collector Arrays. Energies 2021, 14, 733. [Google Scholar] [CrossRef]
- Shahverdian, M.H.; Sohani, A.; Sayyaadi, H.; Samiezadeh, S.; Doranehgard, M.H.; Karimi, N.; Li, L.K.B. A dynamic multi-objective optimization procedure for water cooling of a photovoltaic module. Sustain. Energy Technol. Assess. 2021, 45, 101111. [Google Scholar] [CrossRef]
- Sohani, A.; Dehnavi, A.; Sayyaadi, H.; Hoseinzadeh, S.; Goodarzi, E.; Garcia, D.A.; Groppi, D. The real-time dynamic multi-objective optimization of a building integrated photovoltaic thermal (BIPV/T) system enhanced by phase change materials. J. Energy Storage 2022, 46, 103777. [Google Scholar] [CrossRef]
- Sohani, A.; Sayyaadi, H. Employing genetic programming to find the best correlation to predict temperature of solar photovoltaic panels. Energy Convers. Manag. 2020, 224, 113291. [Google Scholar] [CrossRef]
- Kuczynski, W.; Kaminski, K.; Znaczko, P.; Chamier-Gliszczynski, N.; Piatkowski, P. On the Correlation between the Geometrical Features and Thermal Efficiency of Flat-Plate Solar Collectors. Energies 2021, 14, 261. [Google Scholar] [CrossRef]
- Alvi, J.Z.; Feng, Y.; Wang, Q.; Imran, M.; Khan, L.A.; Pei, G. Effect of Phase Change Material Storage on the Dynamic Performance of a Direct Vapor Generation Solar Organic Rankine Cycle System. Energies 2020, 13, 5904. [Google Scholar] [CrossRef]
- Zukowski, M.; Radzajewska, P. A New Method to Determine the Annual Energy Output of Liquid-Based Solar Collectors. Energies 2019, 12, 4586. [Google Scholar] [CrossRef] [Green Version]
- Shamshirgaran, S.; Khalaji Assadi, M.; Al-Kayiem, H.H.; Viswanatha Sharma, K. Energetic and exergetic performance of a solar flat-plate collector working with Cu nanofluid. J. Sol. Energy Eng. 2018, 140, 031002. [Google Scholar] [CrossRef]
- Kumaresan, G.; Santosh, R.; Raju, G.; Velraj, R. Experimental and numerical investigation of solar flat plate cooking unit for domestic applications. Energy 2018, 157, 436–447. [Google Scholar] [CrossRef]
- Mortazavi, A.; Ameri, M. Conventional and advanced exergy analysis of solar flat plate air collectors. Energy 2018, 142, 277–288. [Google Scholar] [CrossRef]
- García, A.; Herrero-Martin, R.; Solano, J.; Pérez-García, J. The role of insert devices on enhancing heat transfer in a flat-plate solar water collector. Appl. Therm. Eng. 2018, 132, 479–489. [Google Scholar] [CrossRef]
- Amraoui, M.A.; Aliane, K. Three-dimensional analysis of air flow in a flat plate solar collector. Period. Polytech. Mech. Eng. 2018, 62, 126–135. [Google Scholar] [CrossRef] [Green Version]
- Hashim, W.M.; Shomran, A.T.; Jurmut, H.A.; Gaaz, T.S.; Kadhum, A.A.H.; Al-Amiery, A.A. Case study on solar water heating for flat plate collector. Case Stud. Therm. Eng. 2018, 12, 666–671. [Google Scholar] [CrossRef]
- Karki, S.; Haapala, K.R.; Fronk, B.M. Technical and economic feasibility of solar flat-plate collector thermal energy systems for small and medium manufacturers. Appl. Energy 2019, 254, 113649. [Google Scholar] [CrossRef]
- Carmona, M.; Palacio, M. Thermal modelling of a flat plate solar collector with latent heat storage validated with experimental data in outdoor conditions. Sol. Energy 2019, 177, 620–633. [Google Scholar] [CrossRef]
- Garcia, R.P.; del Rio Oliveira, S.; Scalon, V.L. Thermal efficiency experimental evaluation of solar flat plate collectors when introducing convective barriers. Sol. Energy 2019, 182, 278–285. [Google Scholar] [CrossRef]
- Diez, F.; Navas-Gracia, L.; Martínez-Rodríguez, A.; Correa-Guimaraes, A.; Chico-Santamarta, L. Modelling of a flat-plate solar collector using artificial neural networks for different working fluid (water) flow rates. Sol. Energy 2019, 188, 1320–1331. [Google Scholar] [CrossRef]
- Toapanta, L.F.; Anthony Xavier, A.; Quitiaquez Sarzosa, W. CFD Analysis of a solar flat plate collector with different cross sections. Enfoque UTE 2020, 11, 95–108. [Google Scholar]
- Hussein, O.A.; Habib, K.; Muhsan, A.S.; Saidur, R.; Alawi, O.A.; Ibrahim, T.K. Thermal performance enhancement of a flat plate solar collector using hybrid nanofluid. Sol. Energy 2020, 204, 208–222. [Google Scholar] [CrossRef]
- Verma, S.K.; Sharma, K.; Gupta, N.K.; Soni, P.; Upadhyay, N. Performance comparison of innovative spiral shaped solar collector design with conventional flat plate solar collector. Energy 2020, 194, 116853. [Google Scholar] [CrossRef]
- Stalin, P.M.J.; Arjunan, T.; Matheswaran, M.; Dolli, H.; Sadanandam, N. Energy, economic and environmental investigation of a flat plate solar collector with CeO2/water nanofluid. J. Therm. Anal. Calorim. 2020, 139, 3219–3233. [Google Scholar] [CrossRef]
- Jafari, S.; Aghel, M.; Sohani, A.; Hoseinzadeh, S. Geographical Preference for Installation of Solar Still Water Desalination Technologies in Iran: An Analytical Hierarchy Process (AHP)-Based Answer. Water 2022, 14, 265. [Google Scholar] [CrossRef]
- Balyani, H.H.; Sohani, A.; Sayyaadi, H.; Karami, R. Acquiring the best cooling strategy based on thermal comfort and 3E analyses for small scale residential buildings at diverse climatic conditions. Int. J. Refrig. 2015, 57, 112–137. [Google Scholar] [CrossRef]
- Sohani, A.; Shahverdian, M.H.; Sayyaadi, H.; Samiezadeh, S.; Doranehgard, M.H.; Nizetic, S.; Karimi, N. Selecting the best nanofluid type for A photovoltaic thermal (PV/T) system based on reliability, efficiency, energy, economic, and environmental criteria. J. Taiwan Inst. Chem. Eng. 2021, 124, 351–358. [Google Scholar] [CrossRef]
- Moghadam, R.S.; Sayyaadi, H.; Hosseinzade, H. Sizing a solar dish Stirling micro-CHP system for residential application in diverse climatic conditions based on 3E analysis. Energy Convers. Manag. 2013, 75, 348–365. [Google Scholar] [CrossRef]
- Duffie, J.A.; Beckman, W.A.; Blair, N. Solar Engineering of Thermal Processes, Photovoltaics and Wind; John Wiley & Sons: Hoboken, NJ, USA, 2020. [Google Scholar]
- Sayigh, A.M.; Nasser, S.H. Comparing a way to calculate the heat loss coefficient of solar flat plate collector. J. Teknol. Energi 2012, 1, 11–21. [Google Scholar]
- Bergman, T.L.; Lavine, A.S.; Incropera, F.P.; DeWitt, D.P. Introduction to Heat Transfer; John Wiley & Sons: Hoboken, NJ, USA, 2011. [Google Scholar]
- Kalogirou, S.A. Solar Energy Engineering: Processes and Systems; Academic Press: Cambridge, MA, USA, 2013. [Google Scholar]
- Wang, W.; Liu, Y.; Wu, X.; Xu, Y.; Yu, W.; Zhao, C.; Zhong, Y. Environmental assessments and economic performance of BAPV and BIPV systems in Shanghai. Energy Build. 2016, 130, 98–106. [Google Scholar] [CrossRef]
- Peng, J.; Lu, L.; Yang, H. Review on life cycle assessment of energy payback and greenhouse gas emission of solar photovoltaic systems. Renew. Sustain. Energy Rev. 2013, 19, 255–274. [Google Scholar] [CrossRef]
- Sohani, A.; Sayyaadi, H. Design and retrofit optimization of the cellulose evaporative cooling pad systems at diverse climatic conditions. Appl. Therm. Eng. 2017, 123, 1396–1418. [Google Scholar] [CrossRef]
- Sohani, A.; Rezapour, S.; Sayyaadi, H. Comprehensive performance evaluation and demands’ sensitivity analysis of different optimum sizing strategies for a combined cooling, heating, and power system. J. Clean. Prod. 2021, 279, 123225. [Google Scholar] [CrossRef]
- Saaty, T.L. A scaling method for priorities in hierarchical structures. J. Math. Psychol. 1977, 15, 234–281. [Google Scholar] [CrossRef]
- Sohani, A.; Delfani, F.; Fassadi Chimeh, A.; Hoseinzadeh, S.; Panchal, H. A conceptual optimum design for a high-efficiency solar-assisted desalination system based on economic, exergy, energy, and environmental (4E) criteria. Sustain. Energy Technol. Assess. 2022, 52, 102053. [Google Scholar] [CrossRef]
- Alvarez, A.; Cabeza, O.; Muñiz, M.C.; Varela, L.M. Experimental and numerical investigation of a flat-plate solar collector. Energy 2010, 35, 3707–3716. [Google Scholar] [CrossRef]


| Study | Year | Were Payback Periods of Energy and Greenhouse Gas Emissions Calculated and Evaluated for System? | Was the Best Place for Utilizing the System among a Number of Regions Chosen Using a Systematic Approach? |
|---|---|---|---|
| Shamshirgaran et al. [11] | 2018 | No | No |
| Kumaresan et al. [12] | 2018 | No | No |
| Mortazavi and Ameri [13] | 2018 | No | No |
| García et al. [14] | 2018 | No | No |
| Amraoui and Aliane [15] | 2018 | No | No |
| Hashim et al. [16] | 2018 | No | No |
| Karki et al. [17] | 2019 | No | No |
| Carmona and Palacio [18] | 2019 | No | No |
| Garcia et al. [19] | 2019 | No | No |
| Diez et al. [20] | 2019 | No | No |
| Toapanta et al. [21] | 2020 | No | No |
| Hussein et al. [22] | 2020 | No | No |
| Verma et al. [23] | 2021 | No | No |
| Stalin et al. [24] | 2021 | No | No |
| Current study | 2022 | Yes | Yes |
| City | Climate Type | Winter | Summer | Average Annual Relative Humidity (%) | Latitude (°N) | Longitude (°E) | |
|---|---|---|---|---|---|---|---|
| Tdb (°C) | Tdb (°C) | Twb (°C) | |||||
| Rasht | Temperate and humid | −2.2 | 31.9 | 25.7 | 71.3 | 37.3 | 50.2 |
| Tabriz | Cold and dry | −10.8 | 33.9 | 18 | 53.7 | 37.8 | 46.3 |
| Yazd | Hot and dry | −5.3 | 40 | 18.3 | 31.4 | 31.9 | 54.4 |
| Tehran | Hot Semi desert | −4.4 | 37.8 | 19.4 | 40.1 | 35.7 | 51.4 |
| Bandar Abbas | Hot and humid | 7.5 | 40.6 | 31.9 | 65 | 27.2 | 56.4 |
| EPBP | IPBP | GGEPBP | |
|---|---|---|---|
| EPBP | 1 | 1/4 | 1/2 |
| IPBP | 4 | 1 | 2 |
| GGEPBP | 2 | 1/2 | 1 |
Publisher’s Note: MDPI stays neutral with regard to jurisdictional claims in published maps and institutional affiliations. |
© 2022 by the authors. Licensee MDPI, Basel, Switzerland. This article is an open access article distributed under the terms and conditions of the Creative Commons Attribution (CC BY) license (https://creativecommons.org/licenses/by/4.0/).
Share and Cite
Jafari, S.; Sohani, A.; Hoseinzadeh, S.; Pourfayaz, F. The 3E Optimal Location Assessment of Flat-Plate Solar Collectors for Domestic Applications in Iran. Energies 2022, 15, 3589. https://doi.org/10.3390/en15103589
Jafari S, Sohani A, Hoseinzadeh S, Pourfayaz F. The 3E Optimal Location Assessment of Flat-Plate Solar Collectors for Domestic Applications in Iran. Energies. 2022; 15(10):3589. https://doi.org/10.3390/en15103589
Chicago/Turabian StyleJafari, Sina, Ali Sohani, Siamak Hoseinzadeh, and Fathollah Pourfayaz. 2022. "The 3E Optimal Location Assessment of Flat-Plate Solar Collectors for Domestic Applications in Iran" Energies 15, no. 10: 3589. https://doi.org/10.3390/en15103589