
Simulation and Flow Analysis of the Hole Diaphragm Labyrinth Seal at Several Whirl Frequencies


Abstract
:1. Introduction
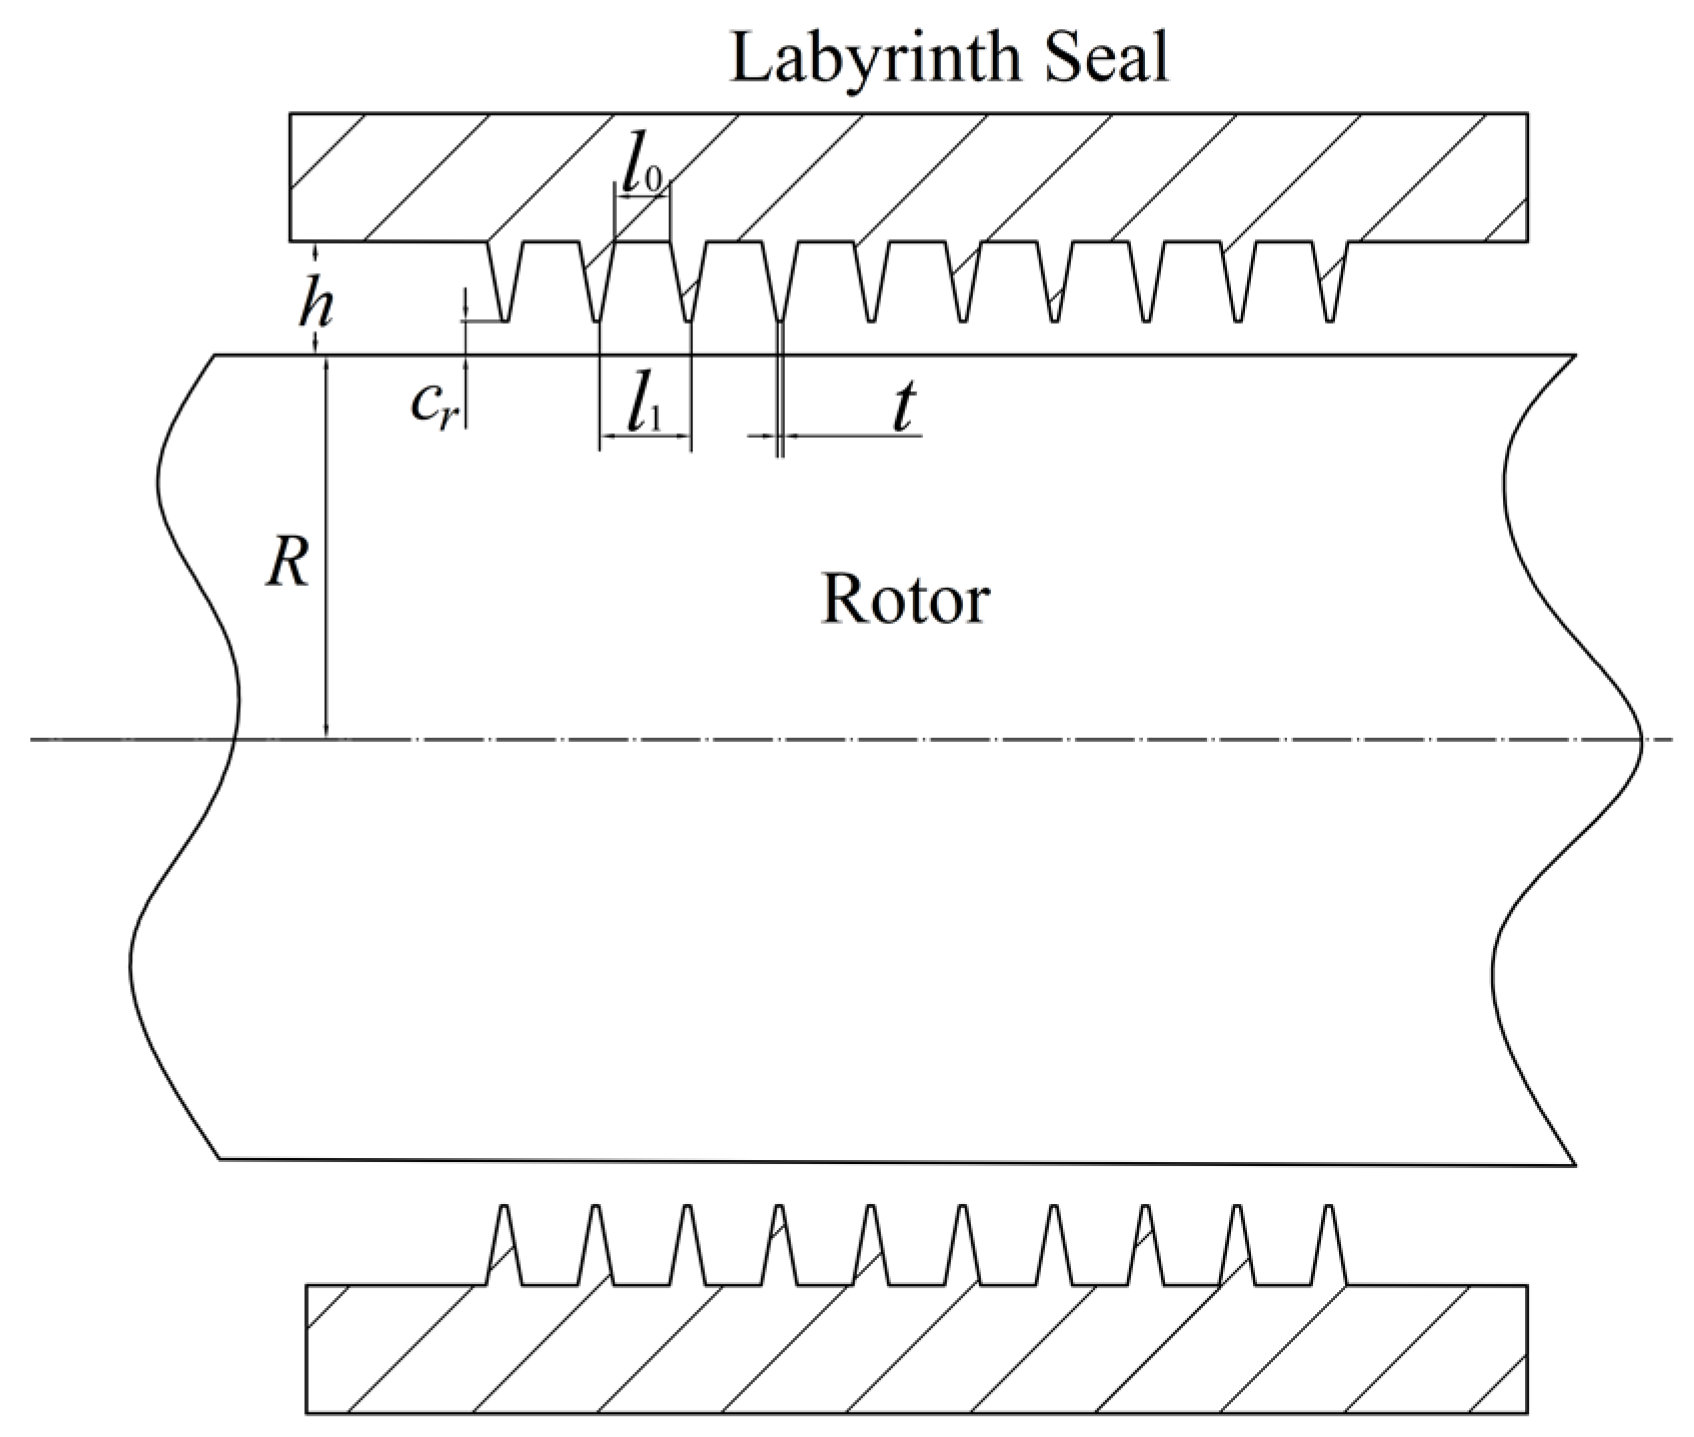
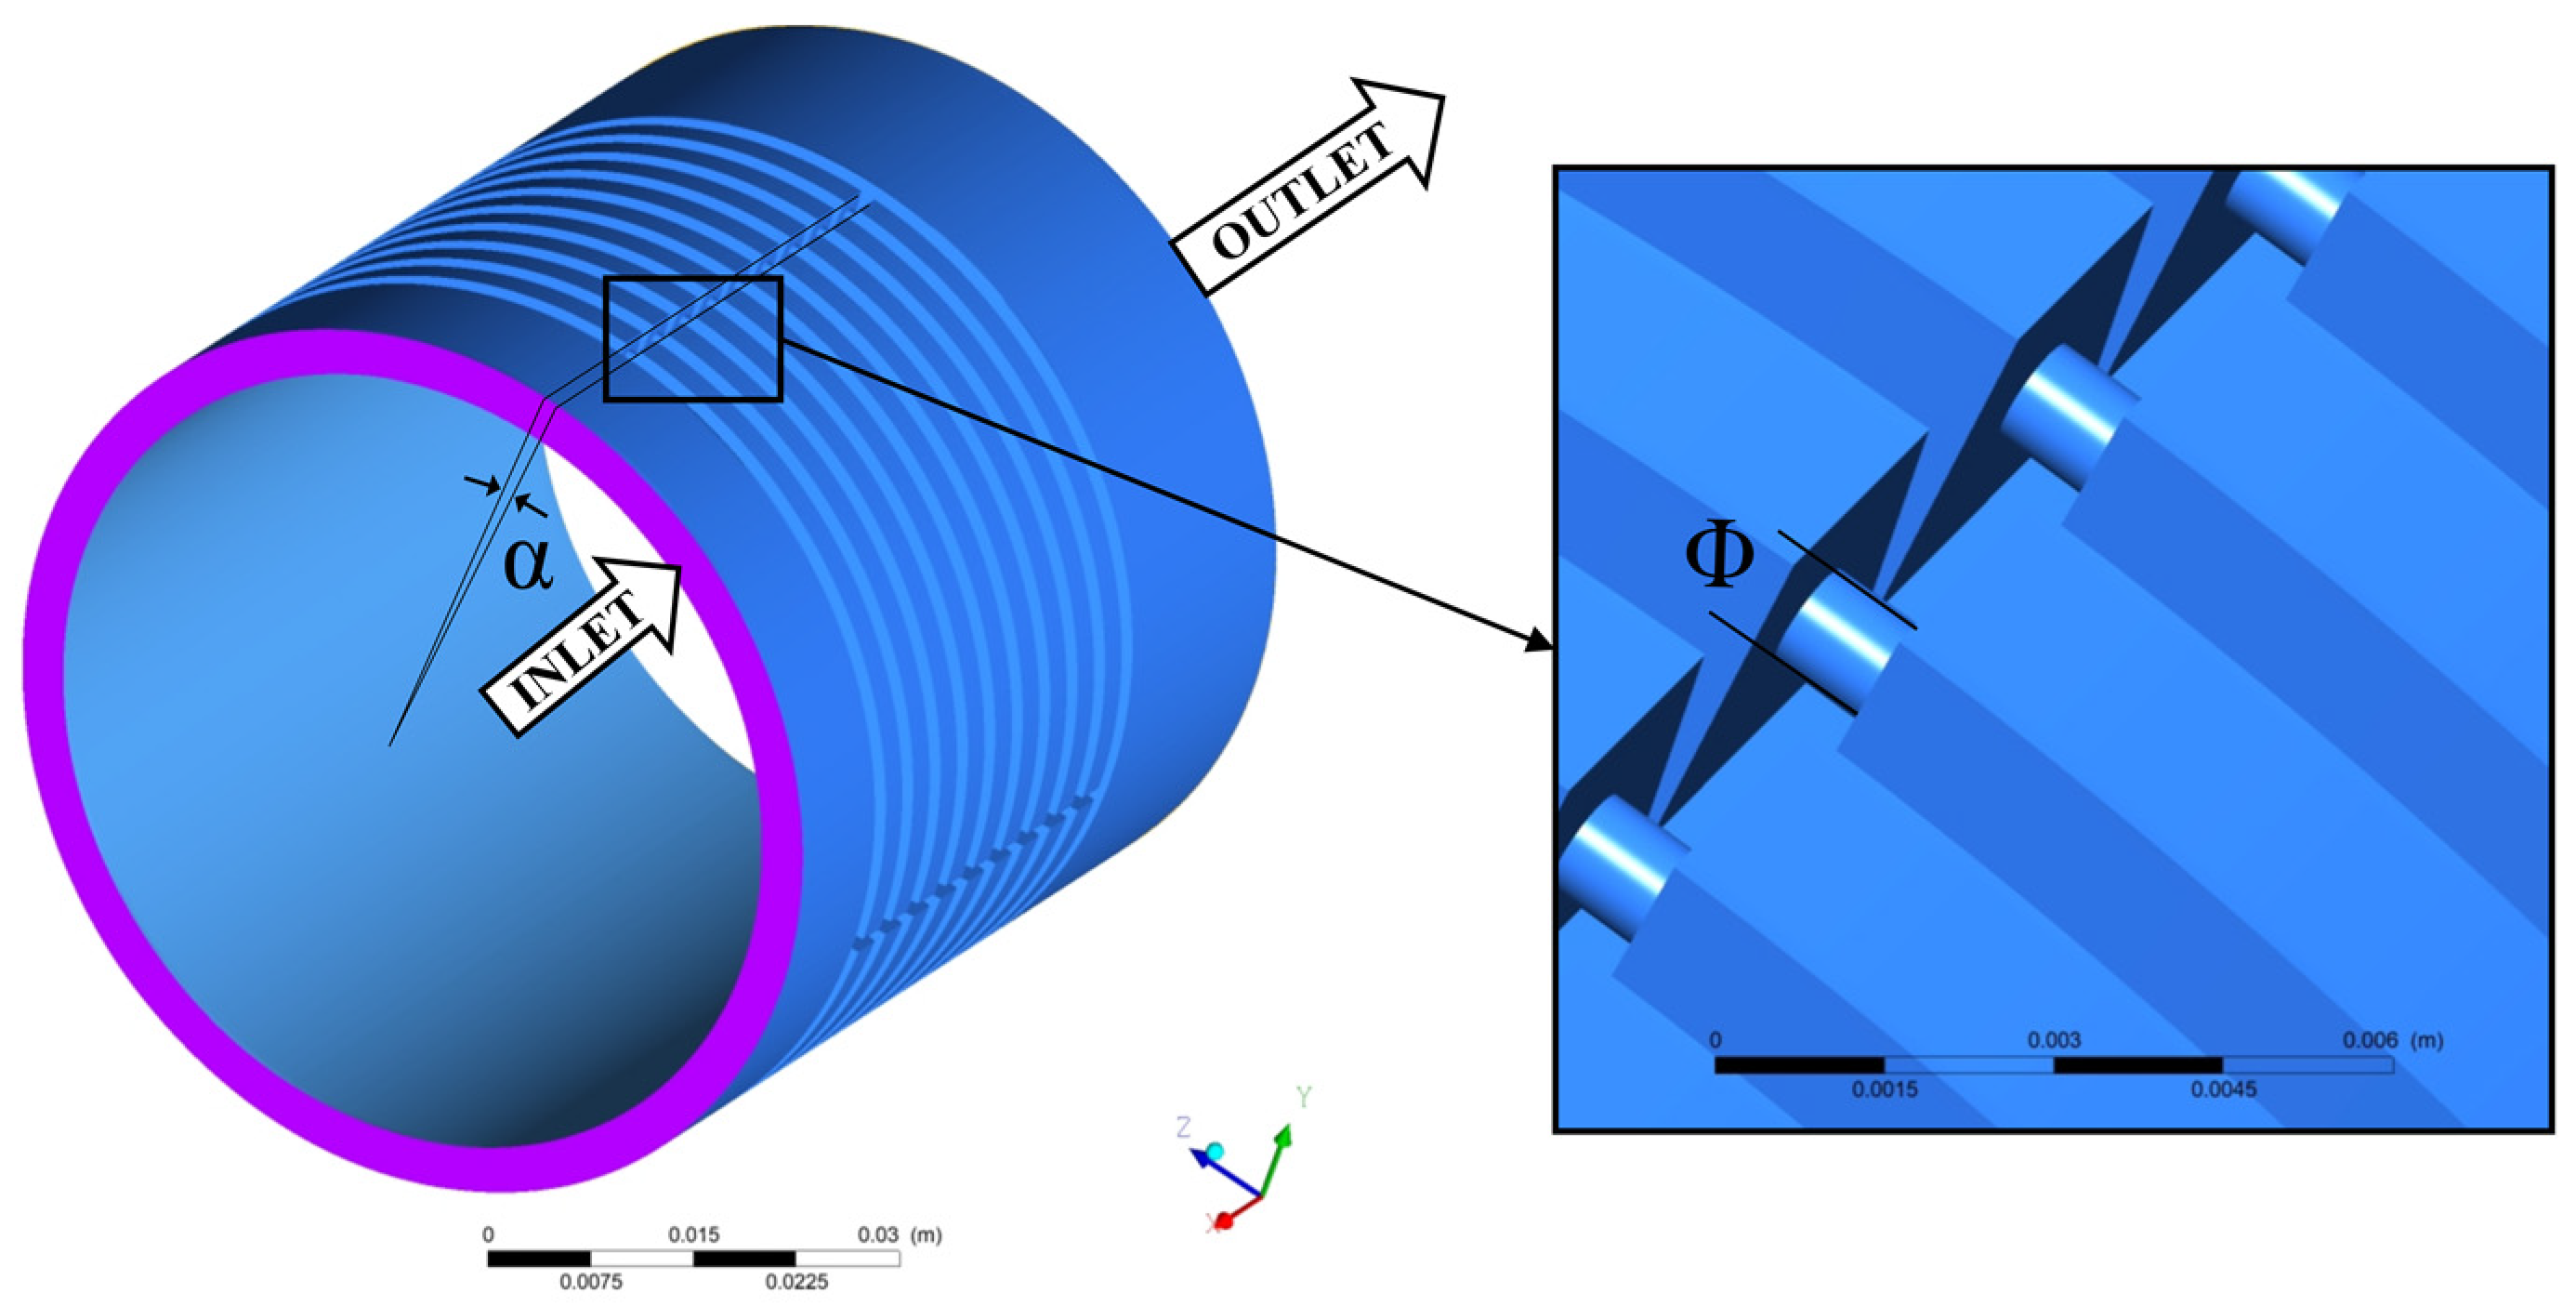
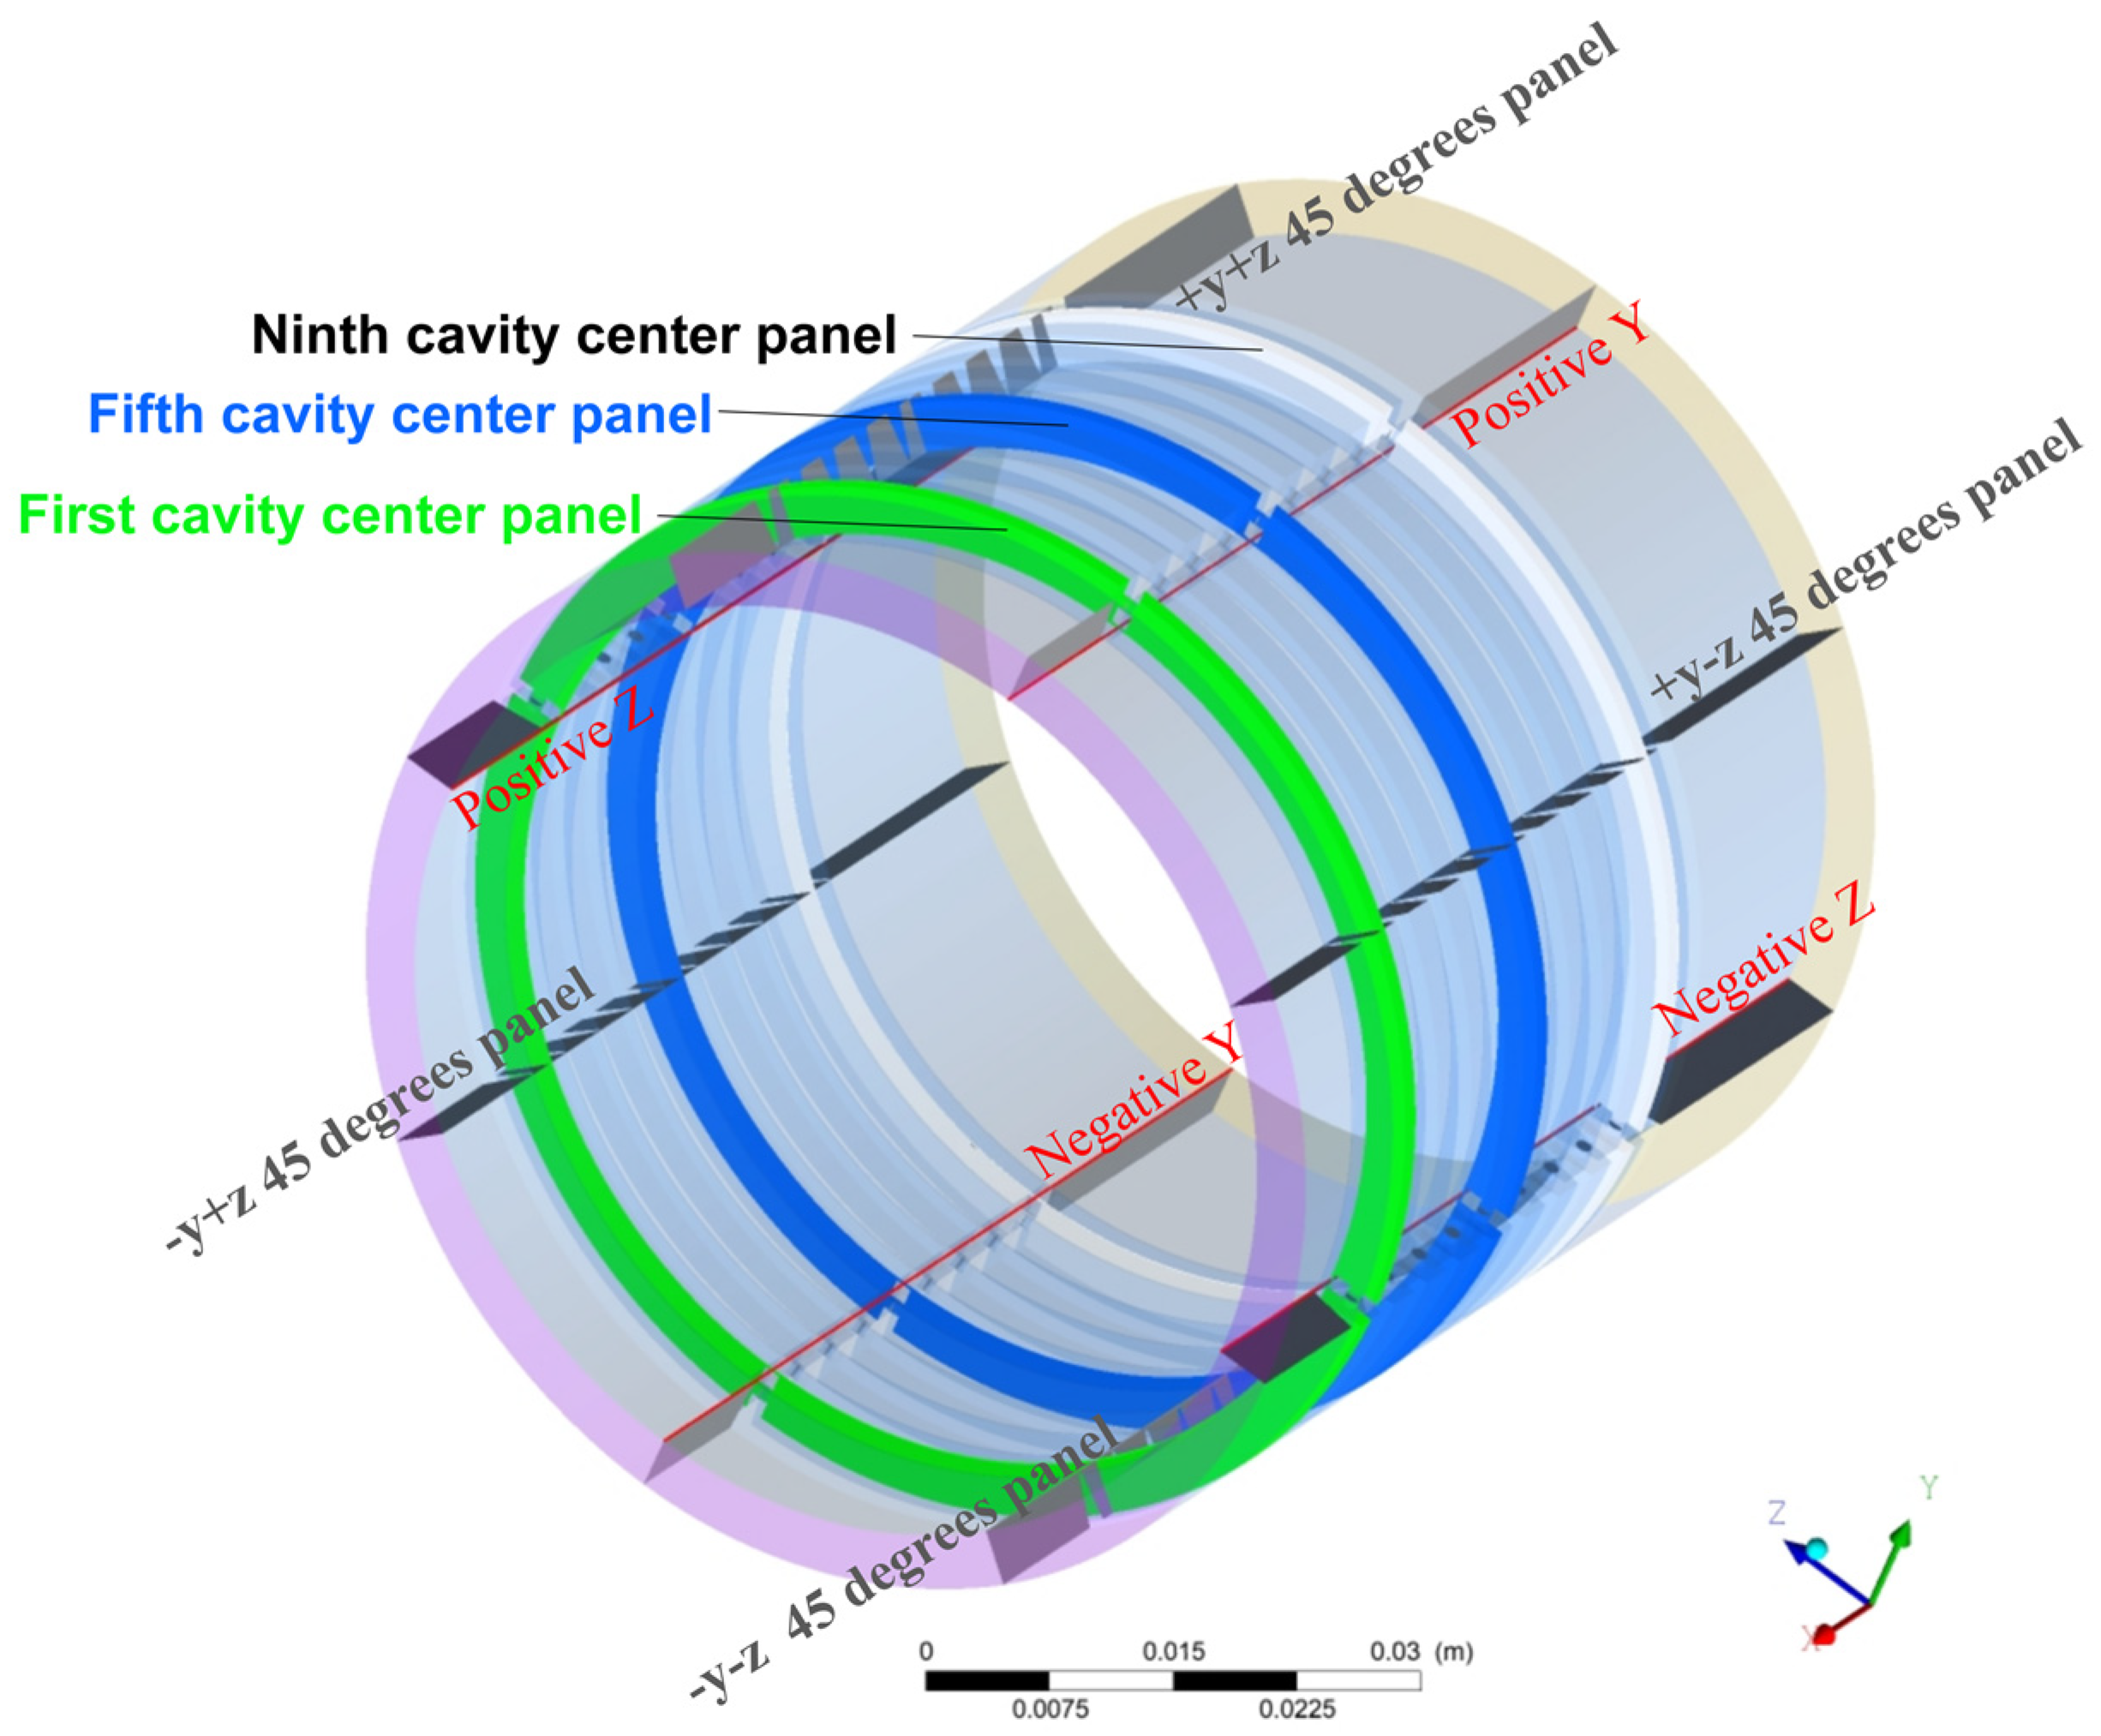
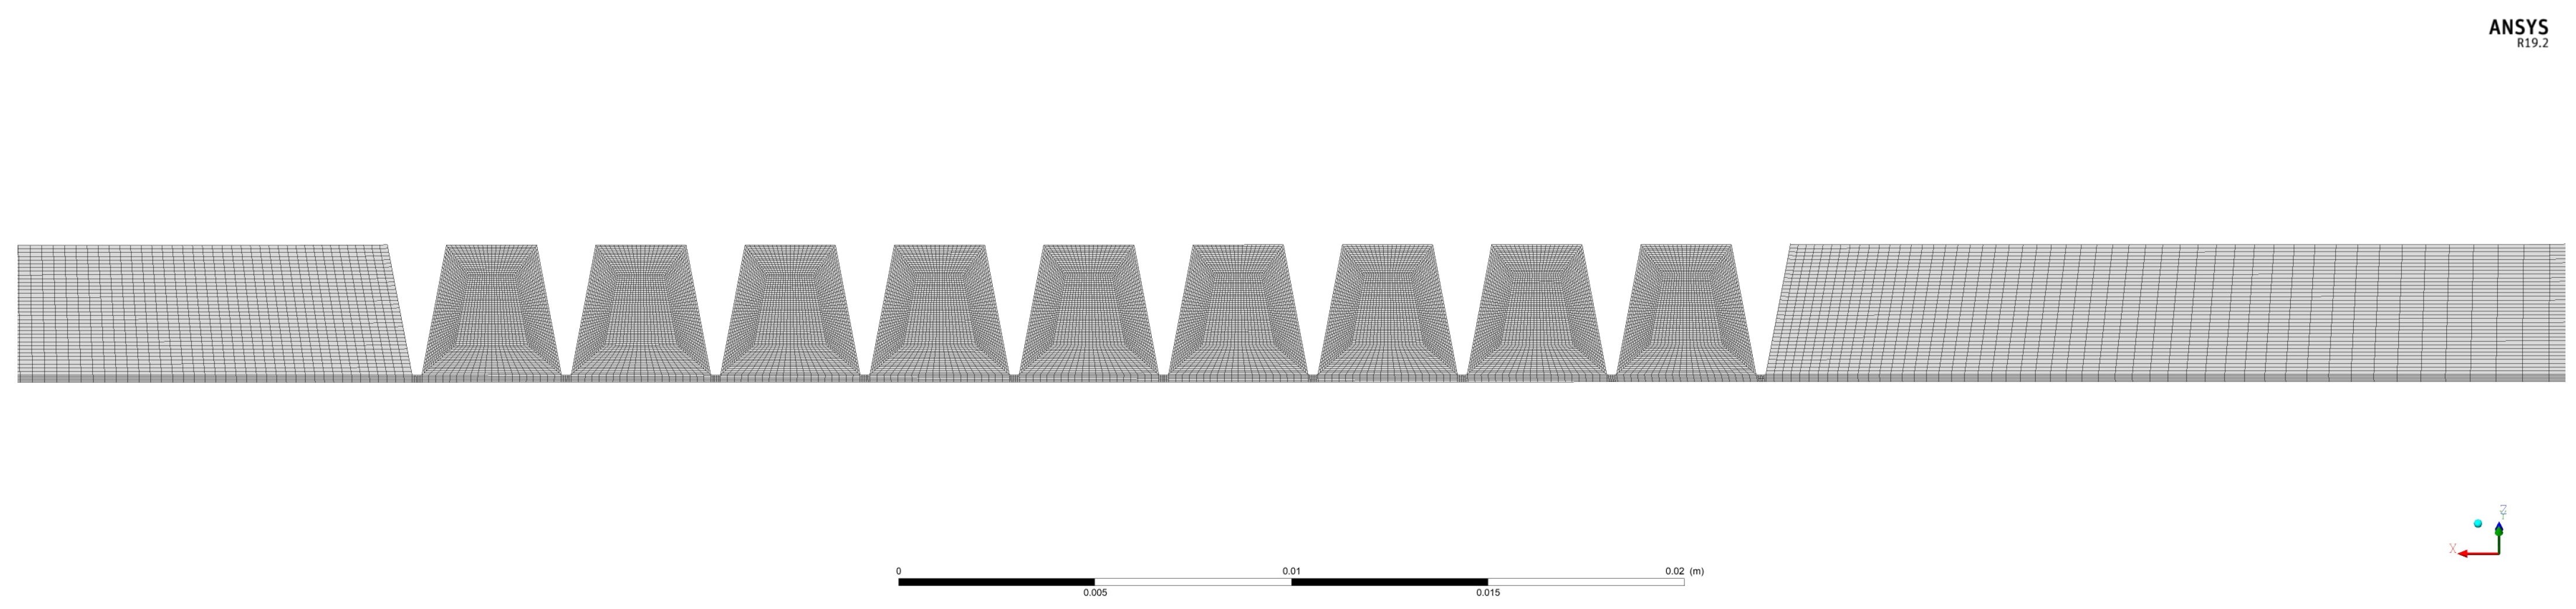
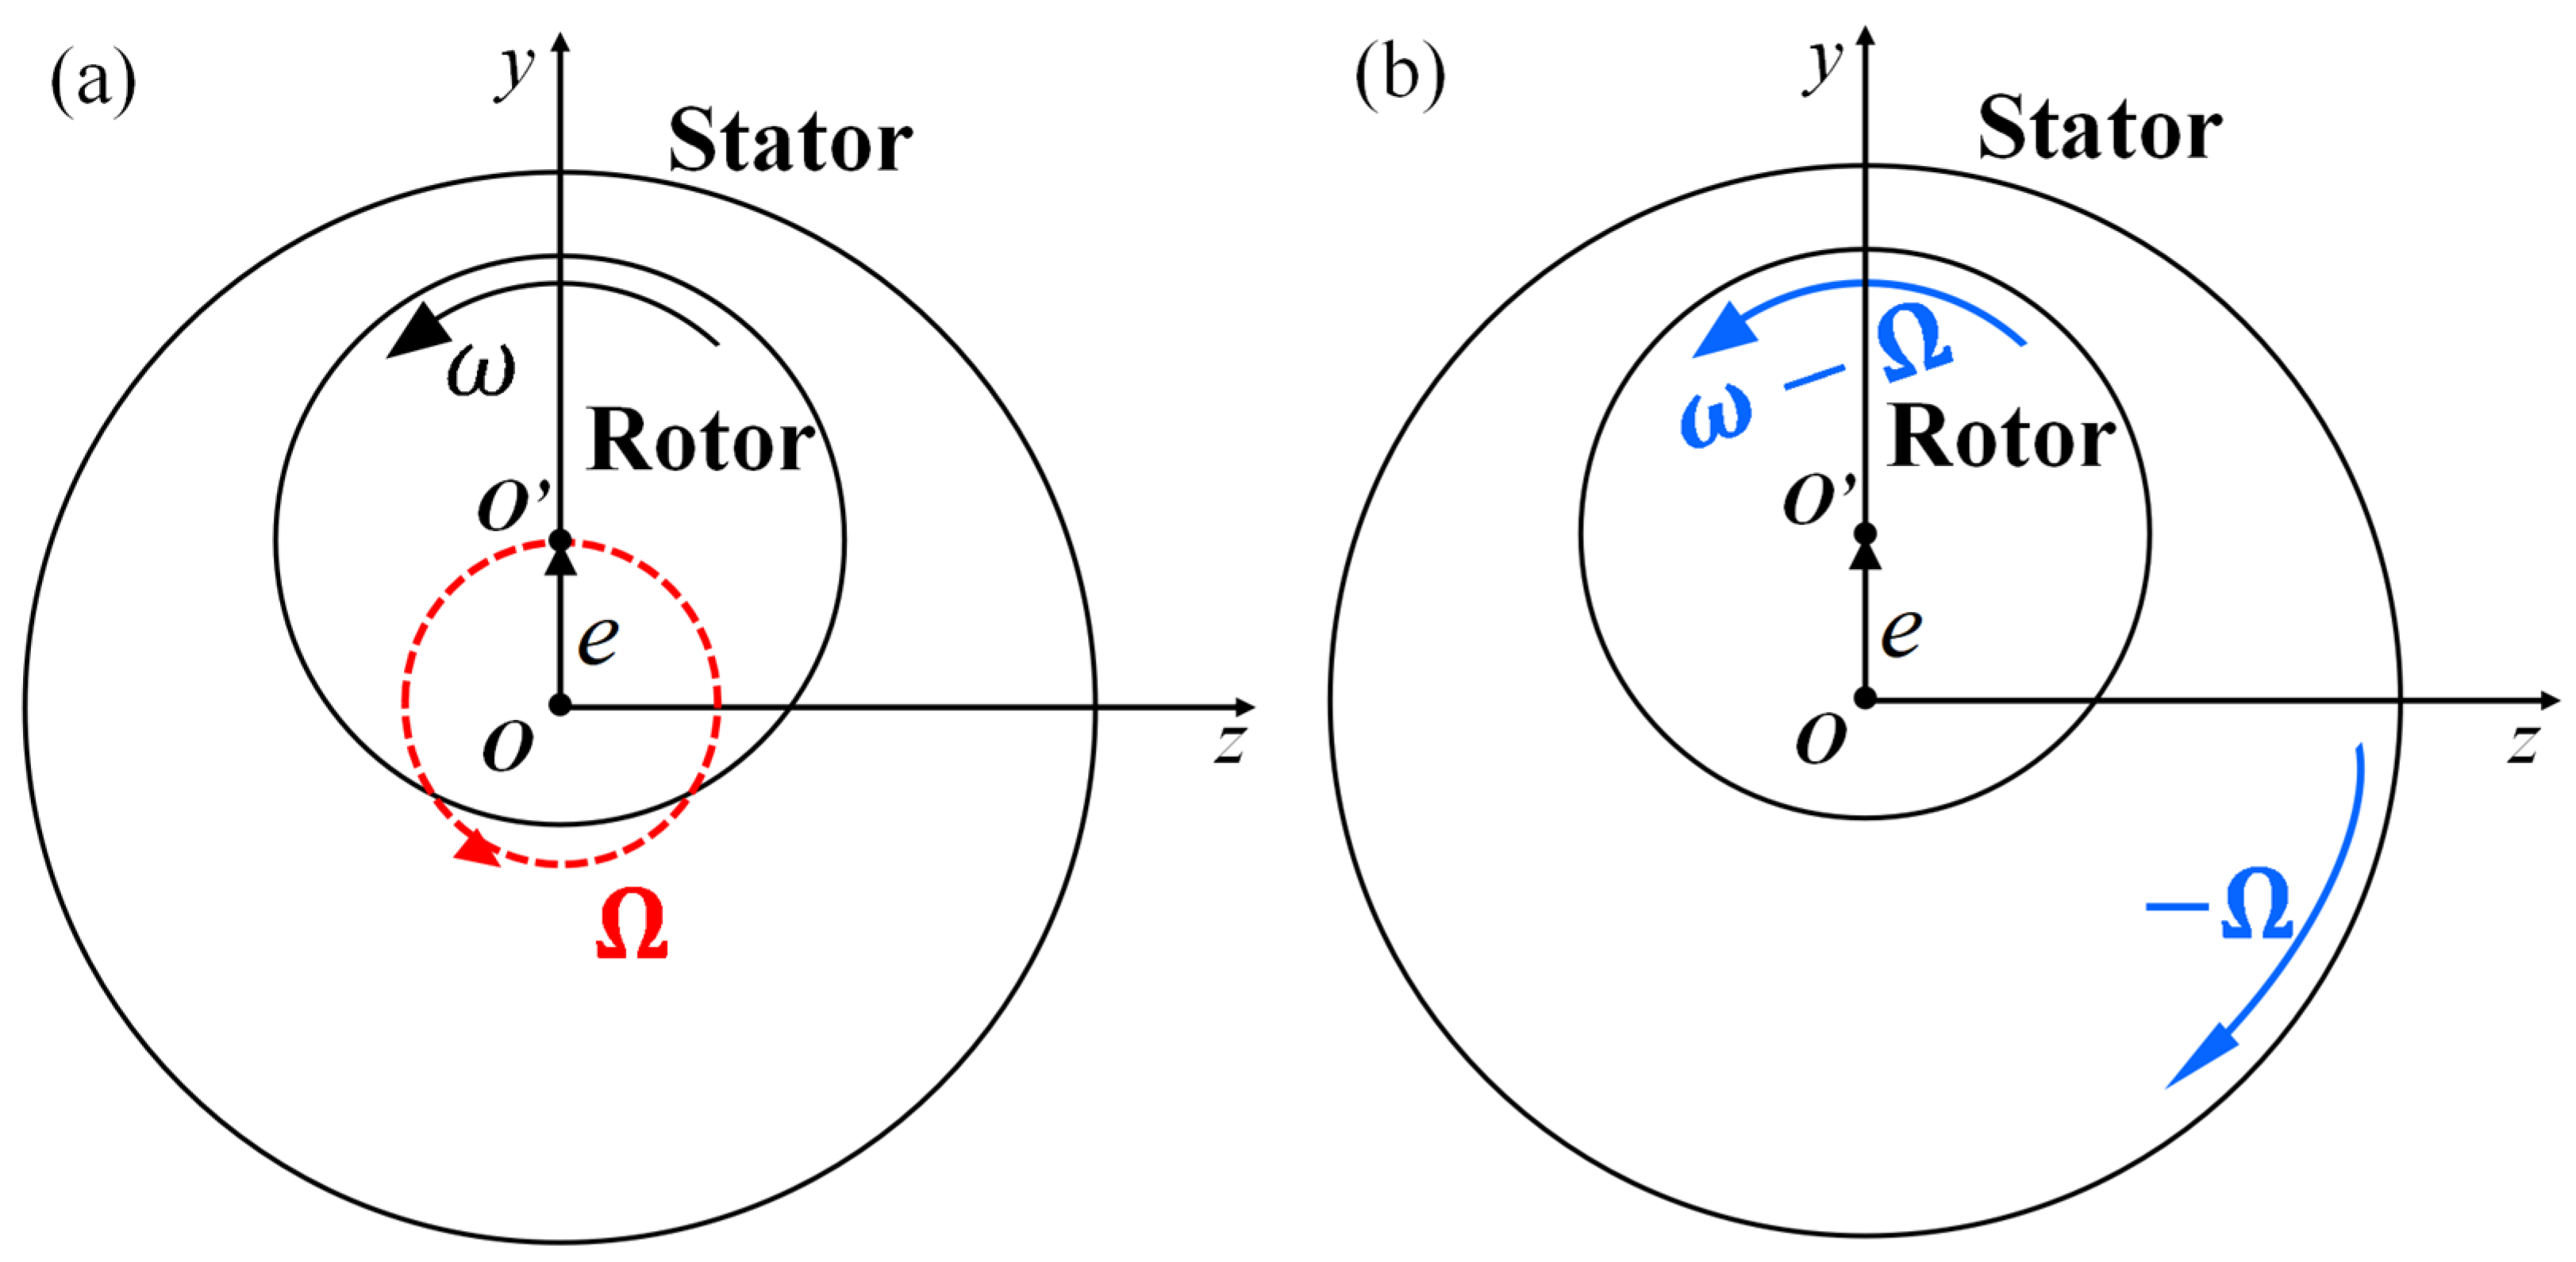
2. Materials and Methods
3. Results and Discussions
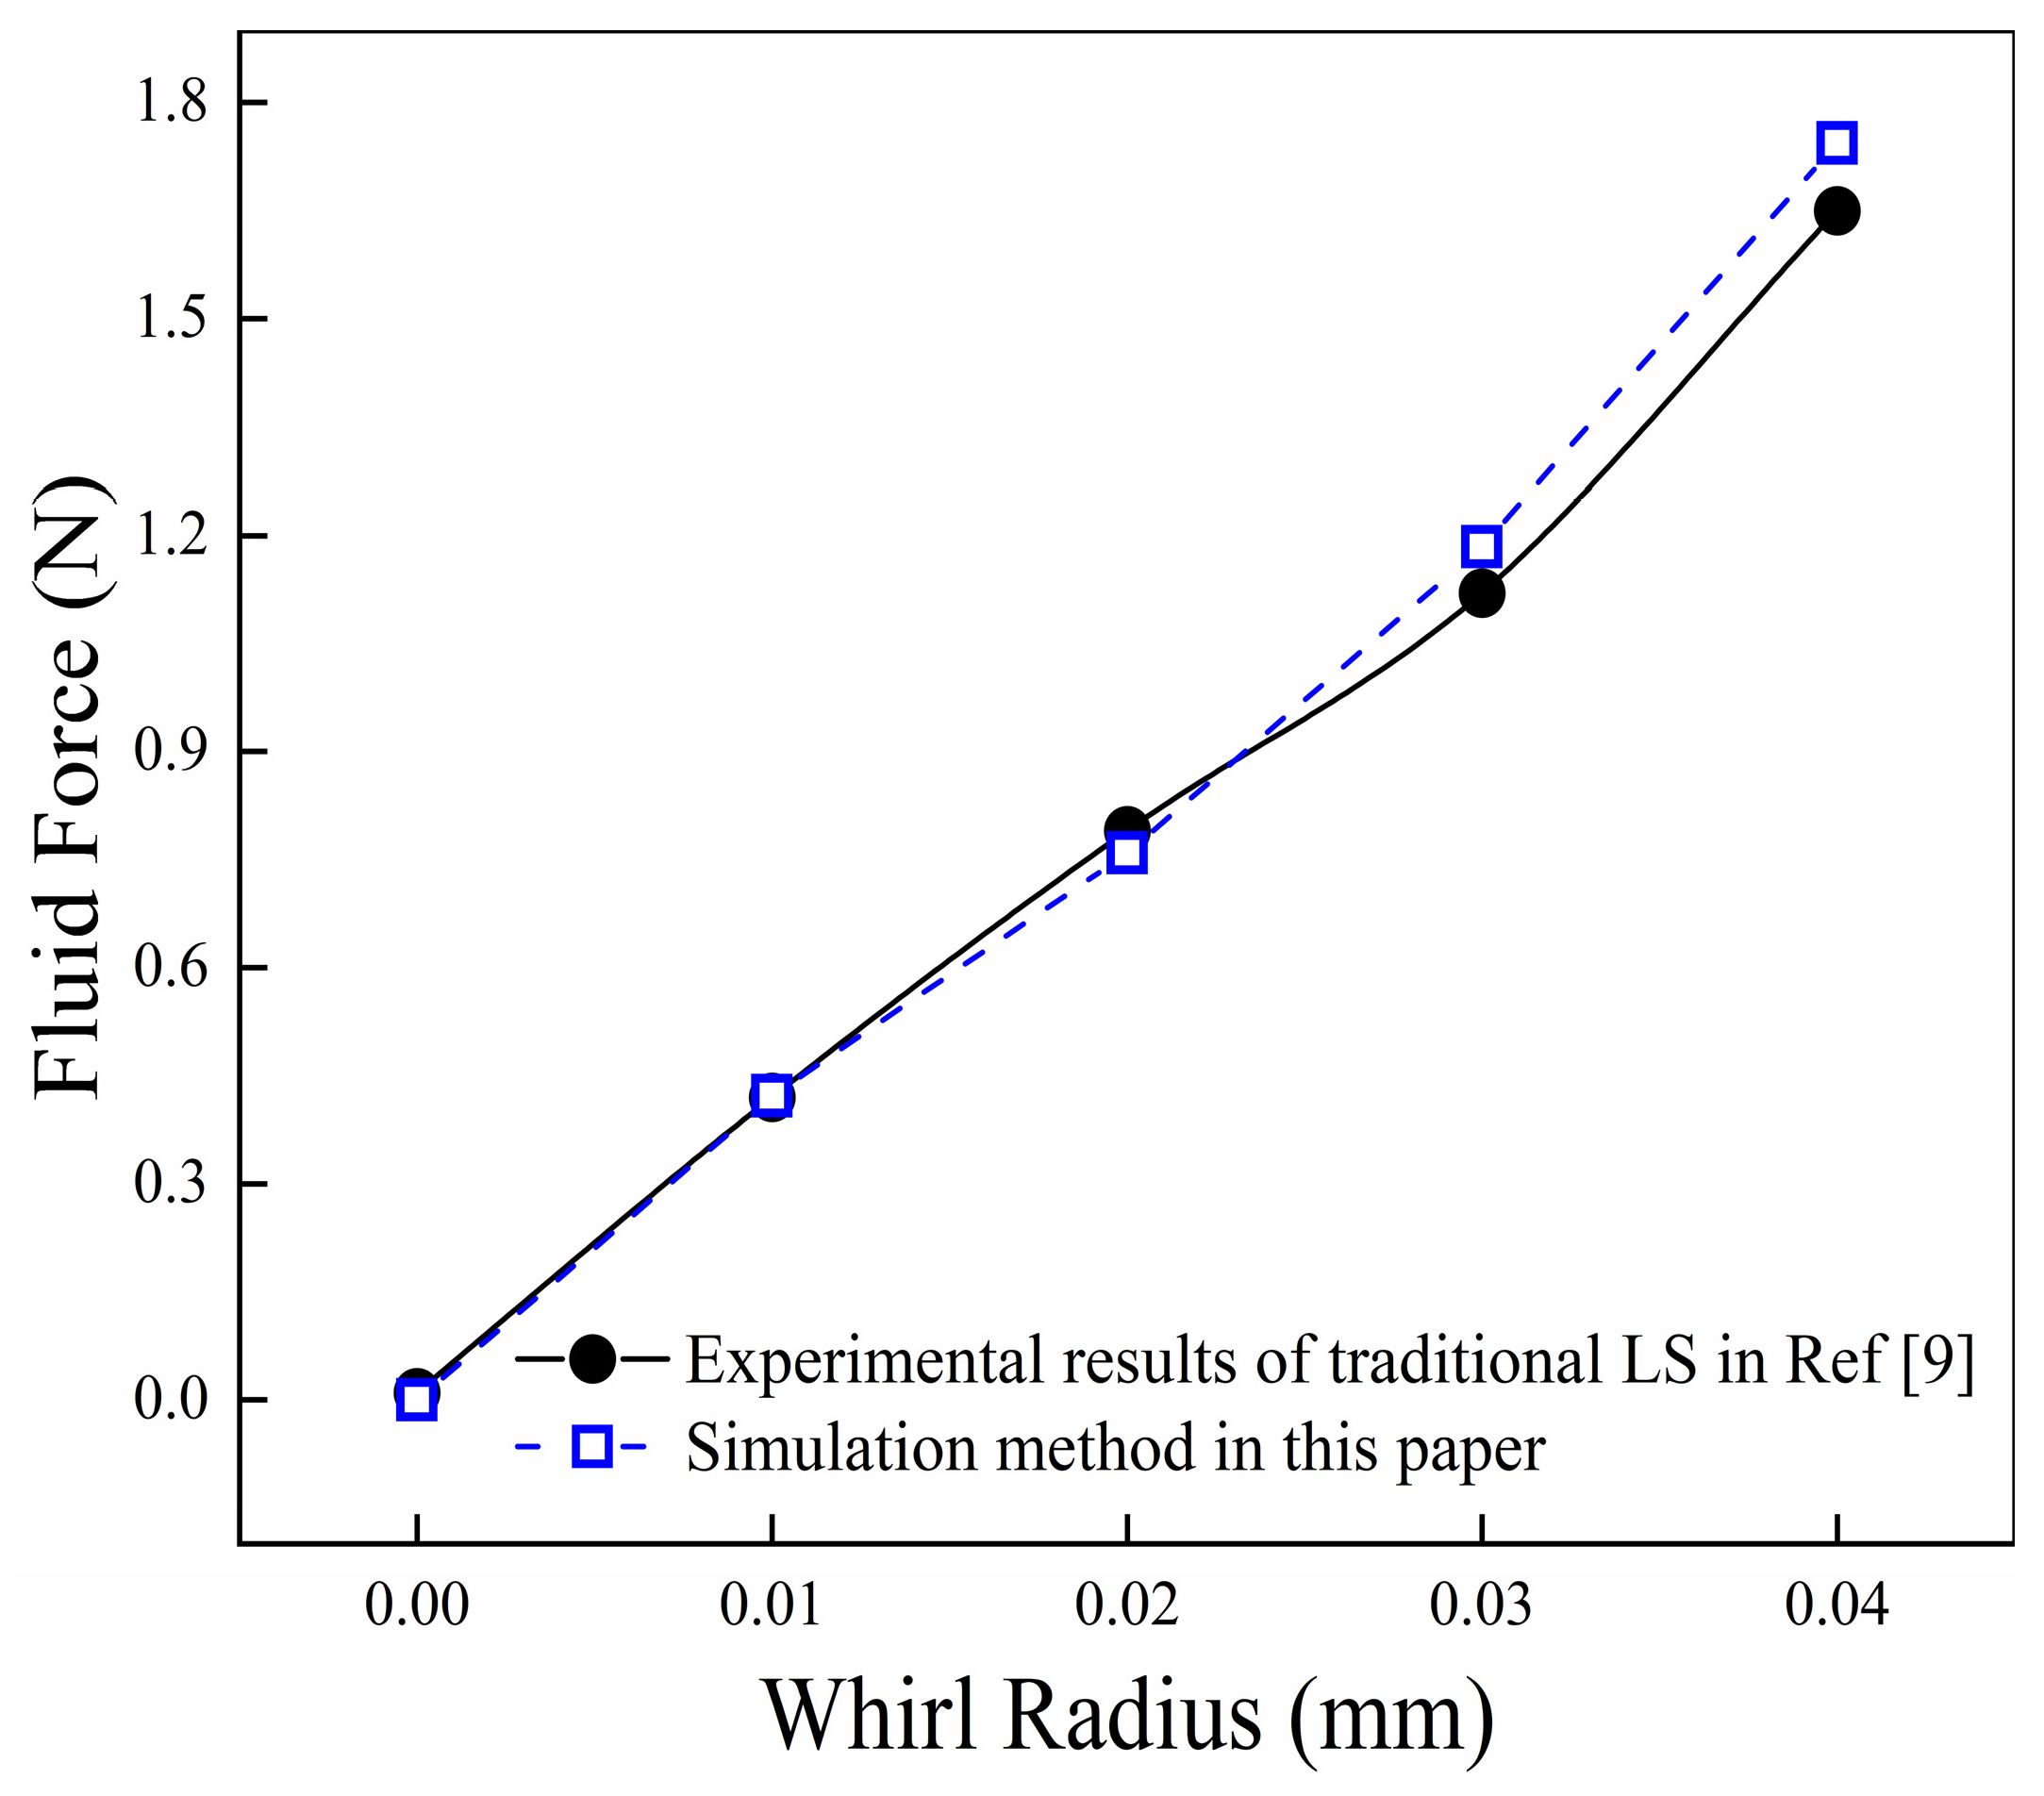
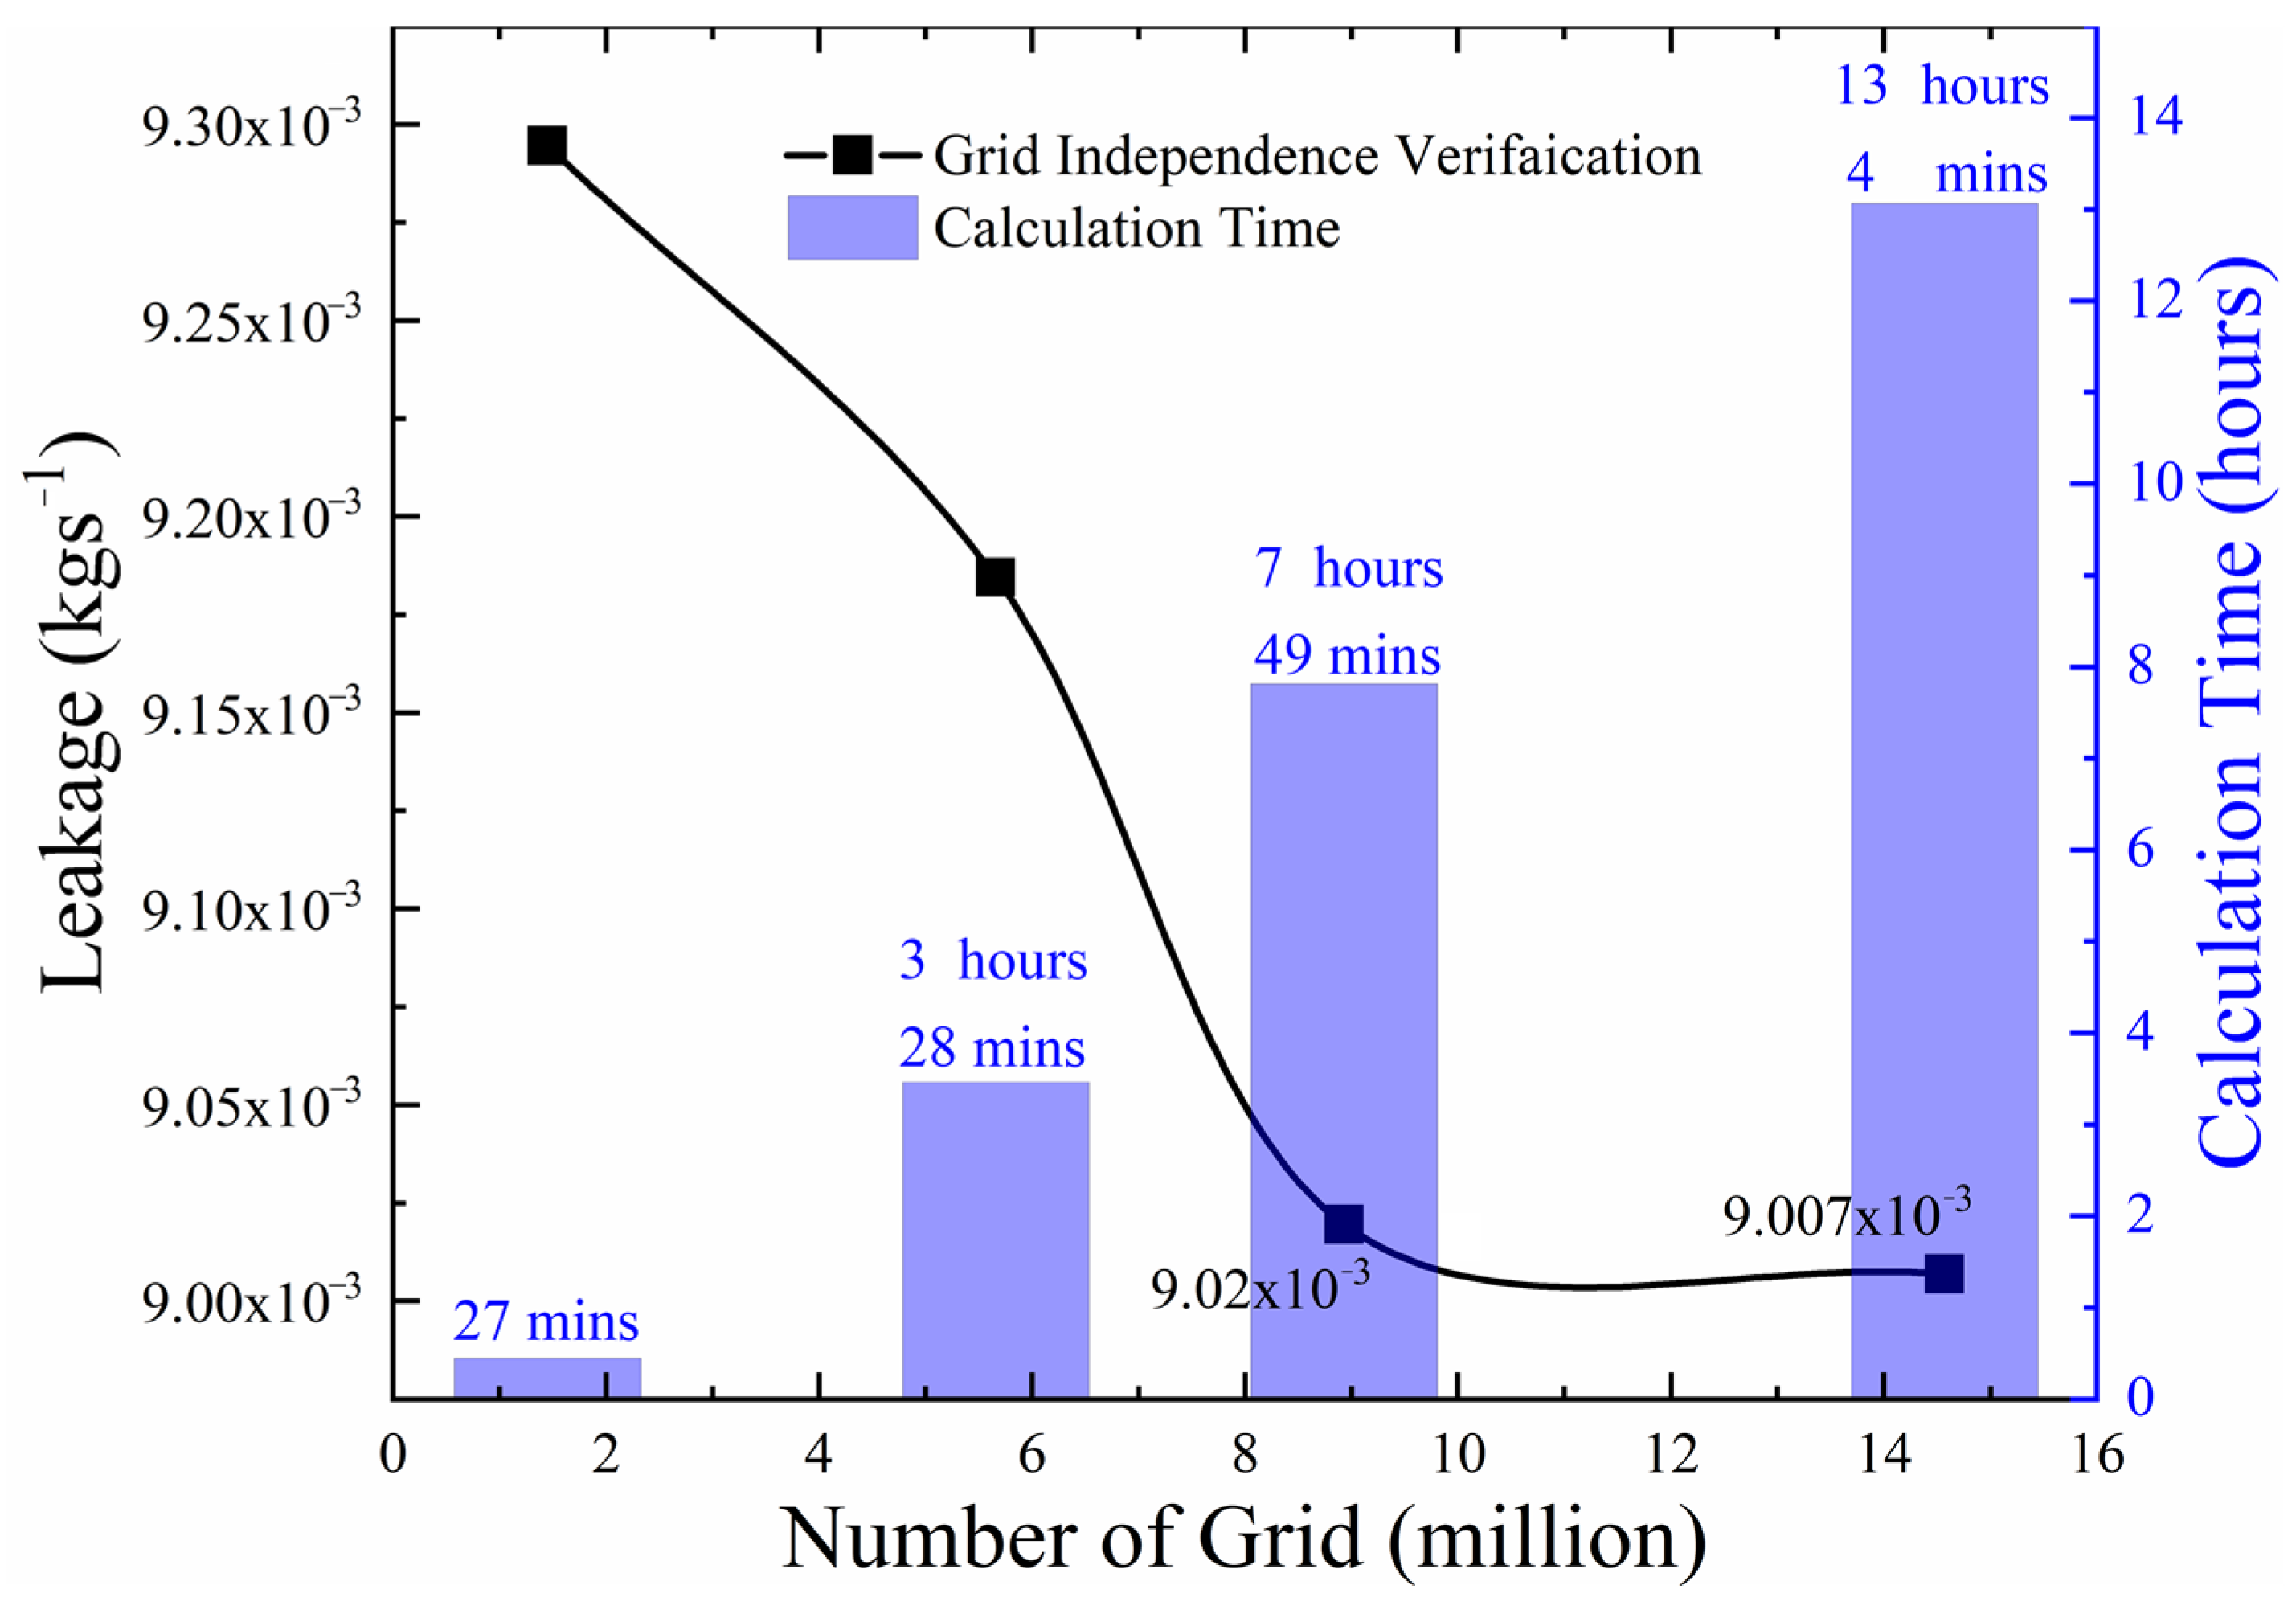
3.1. Validation of Grid Independence
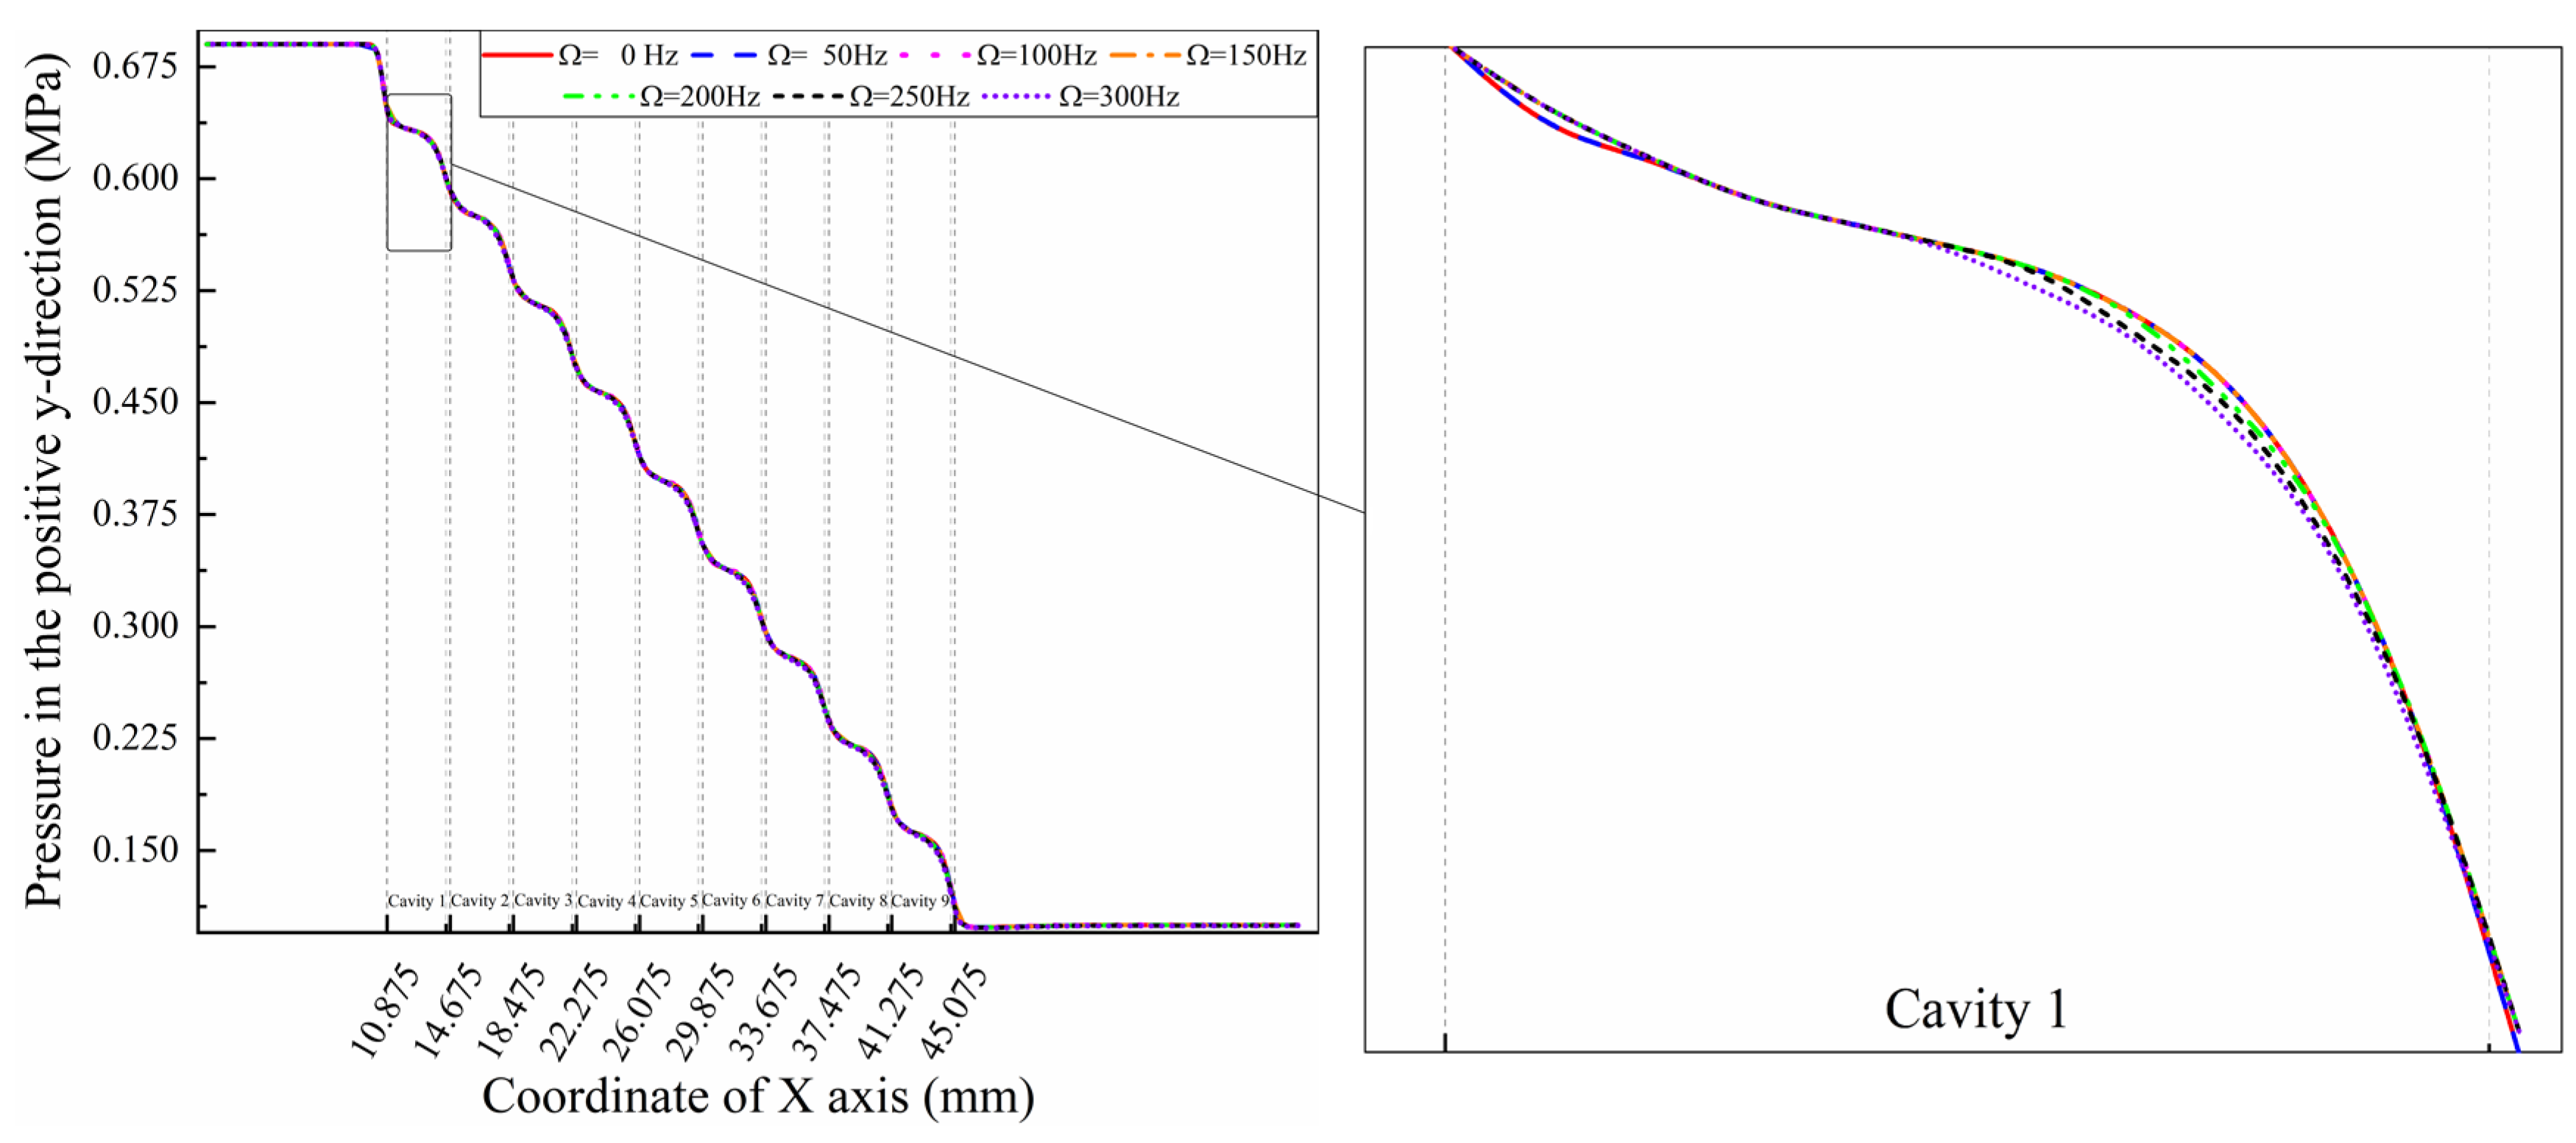
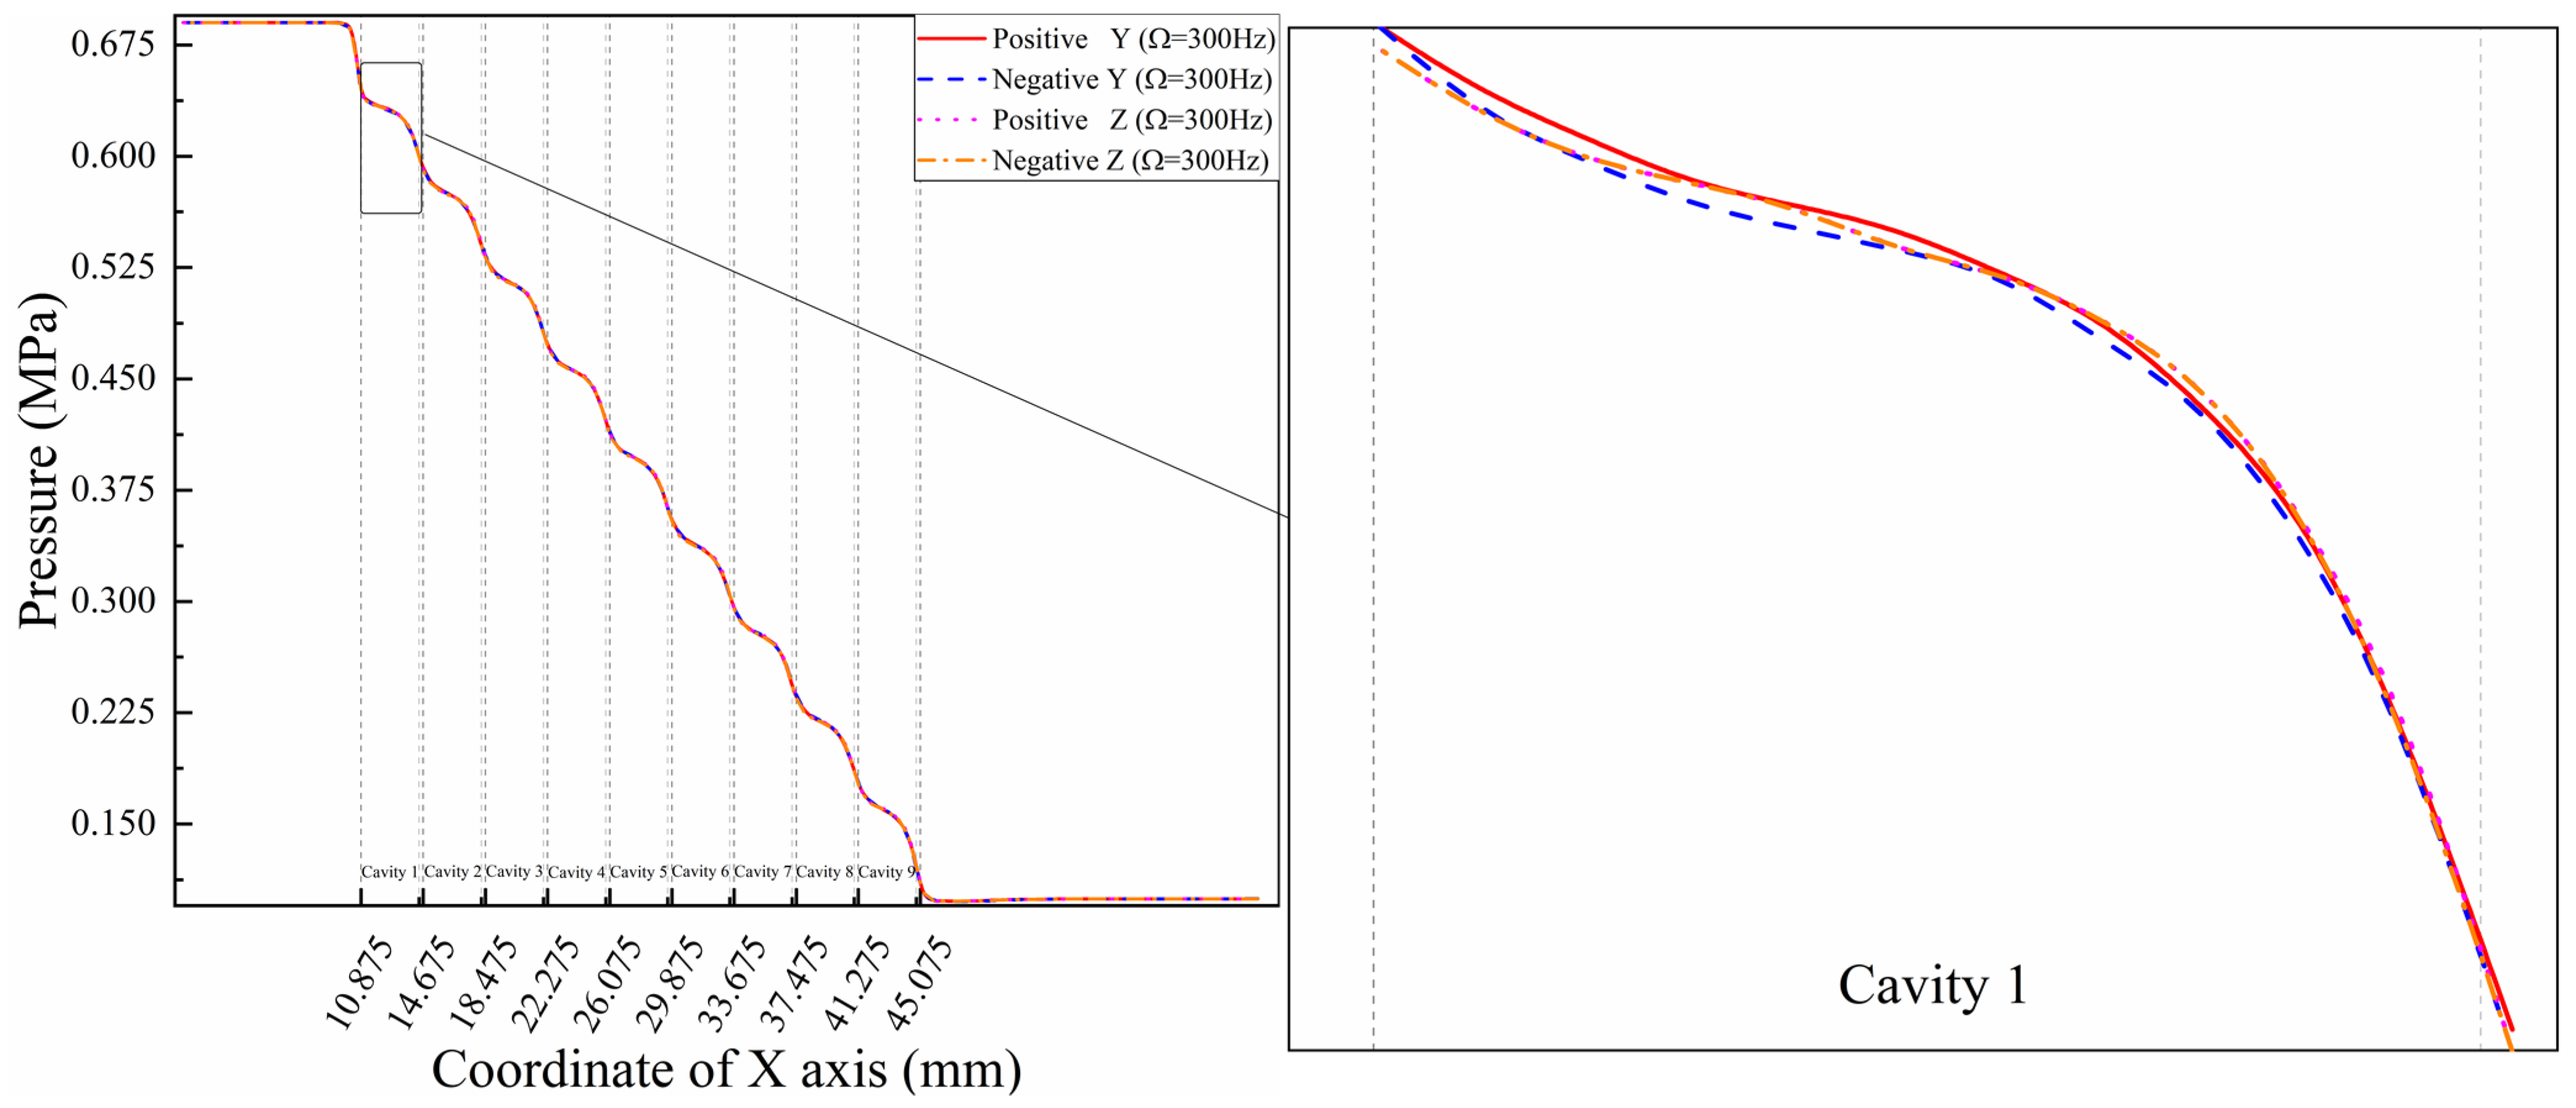
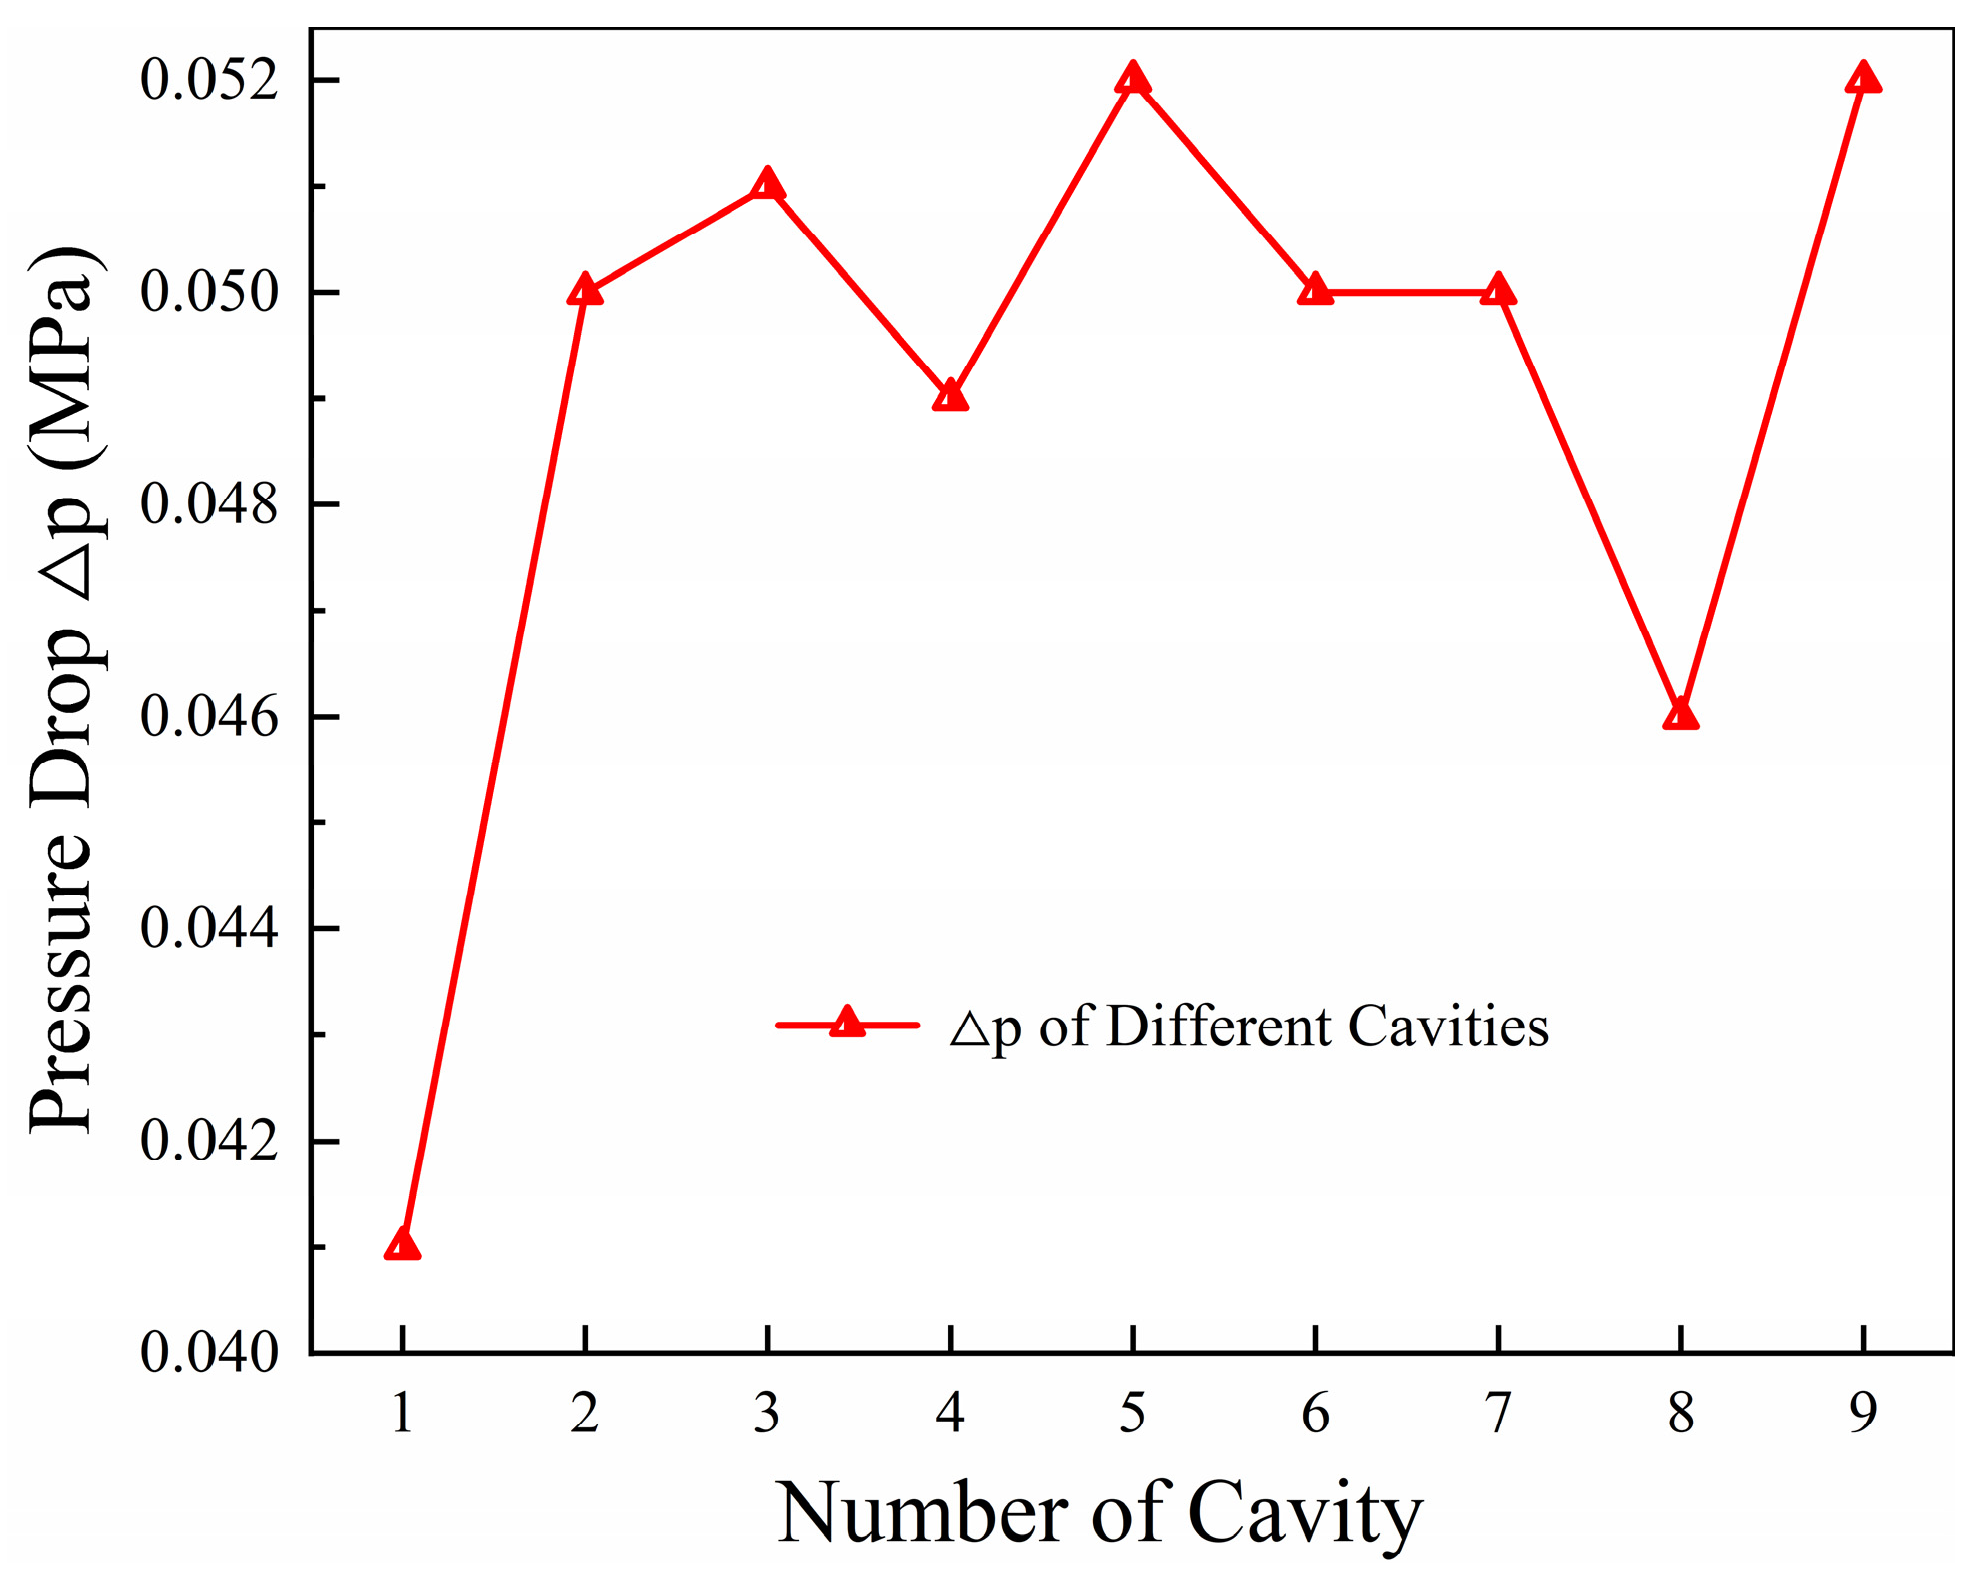
3.2. Pressure
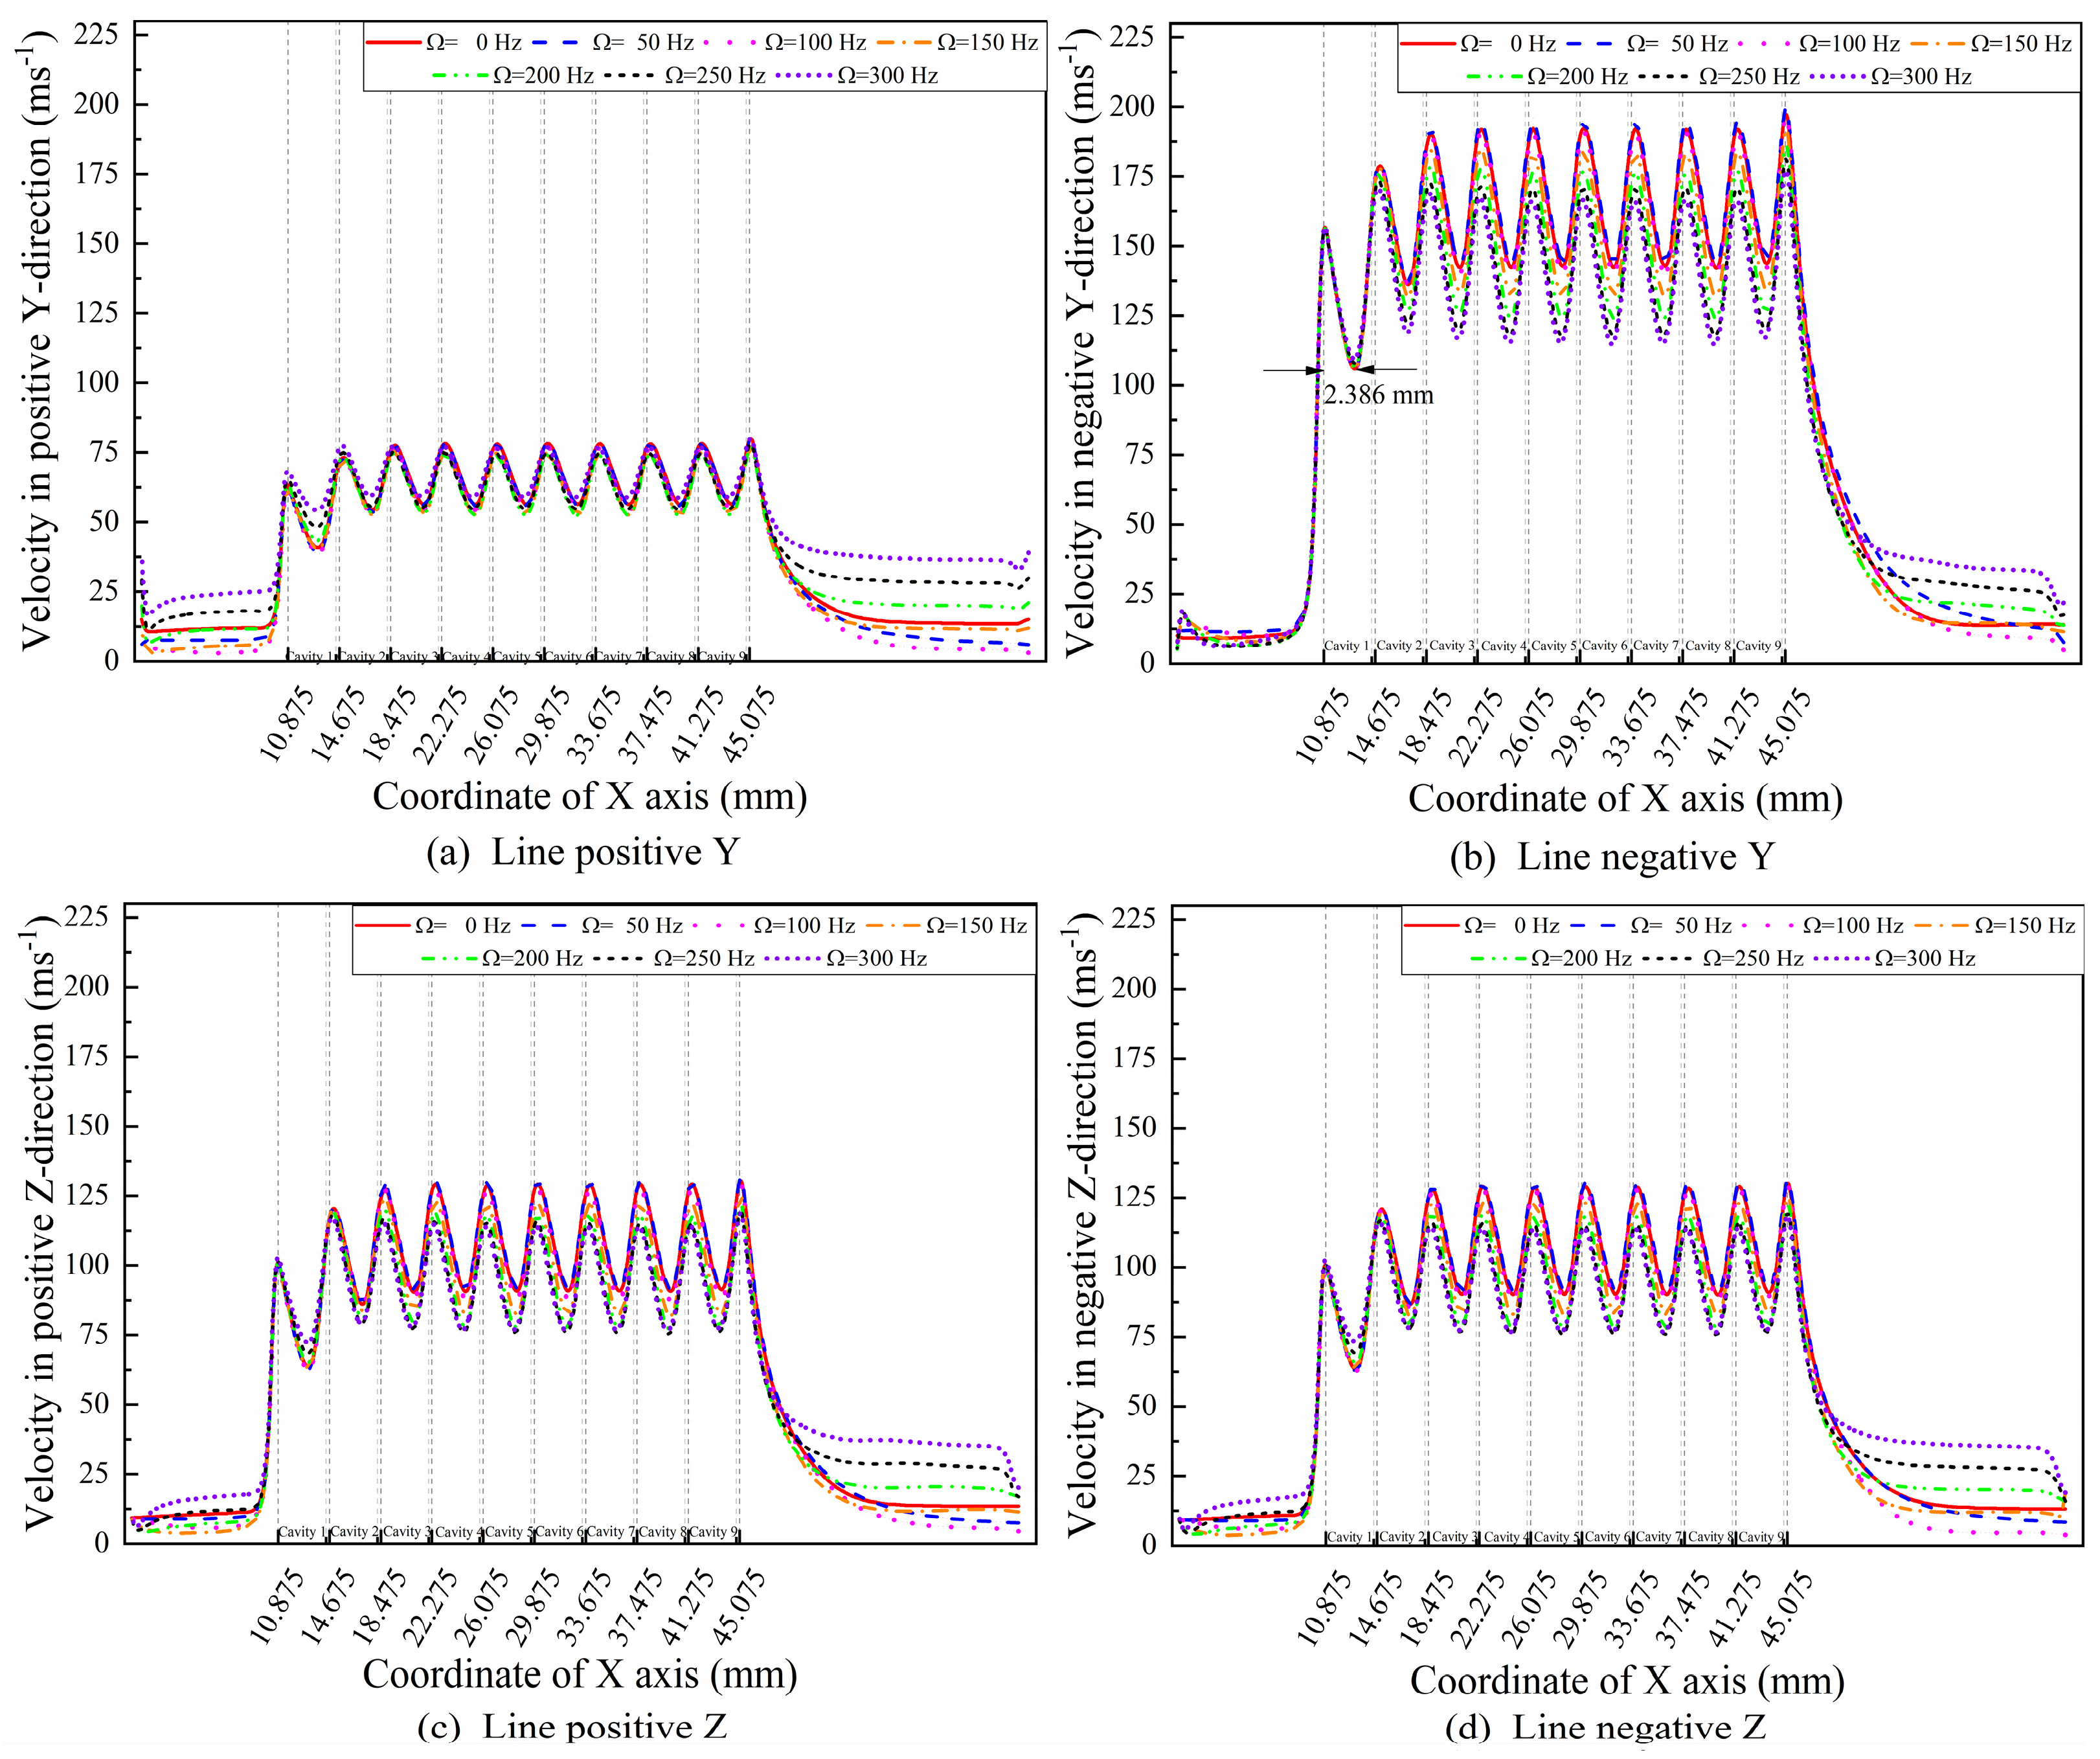
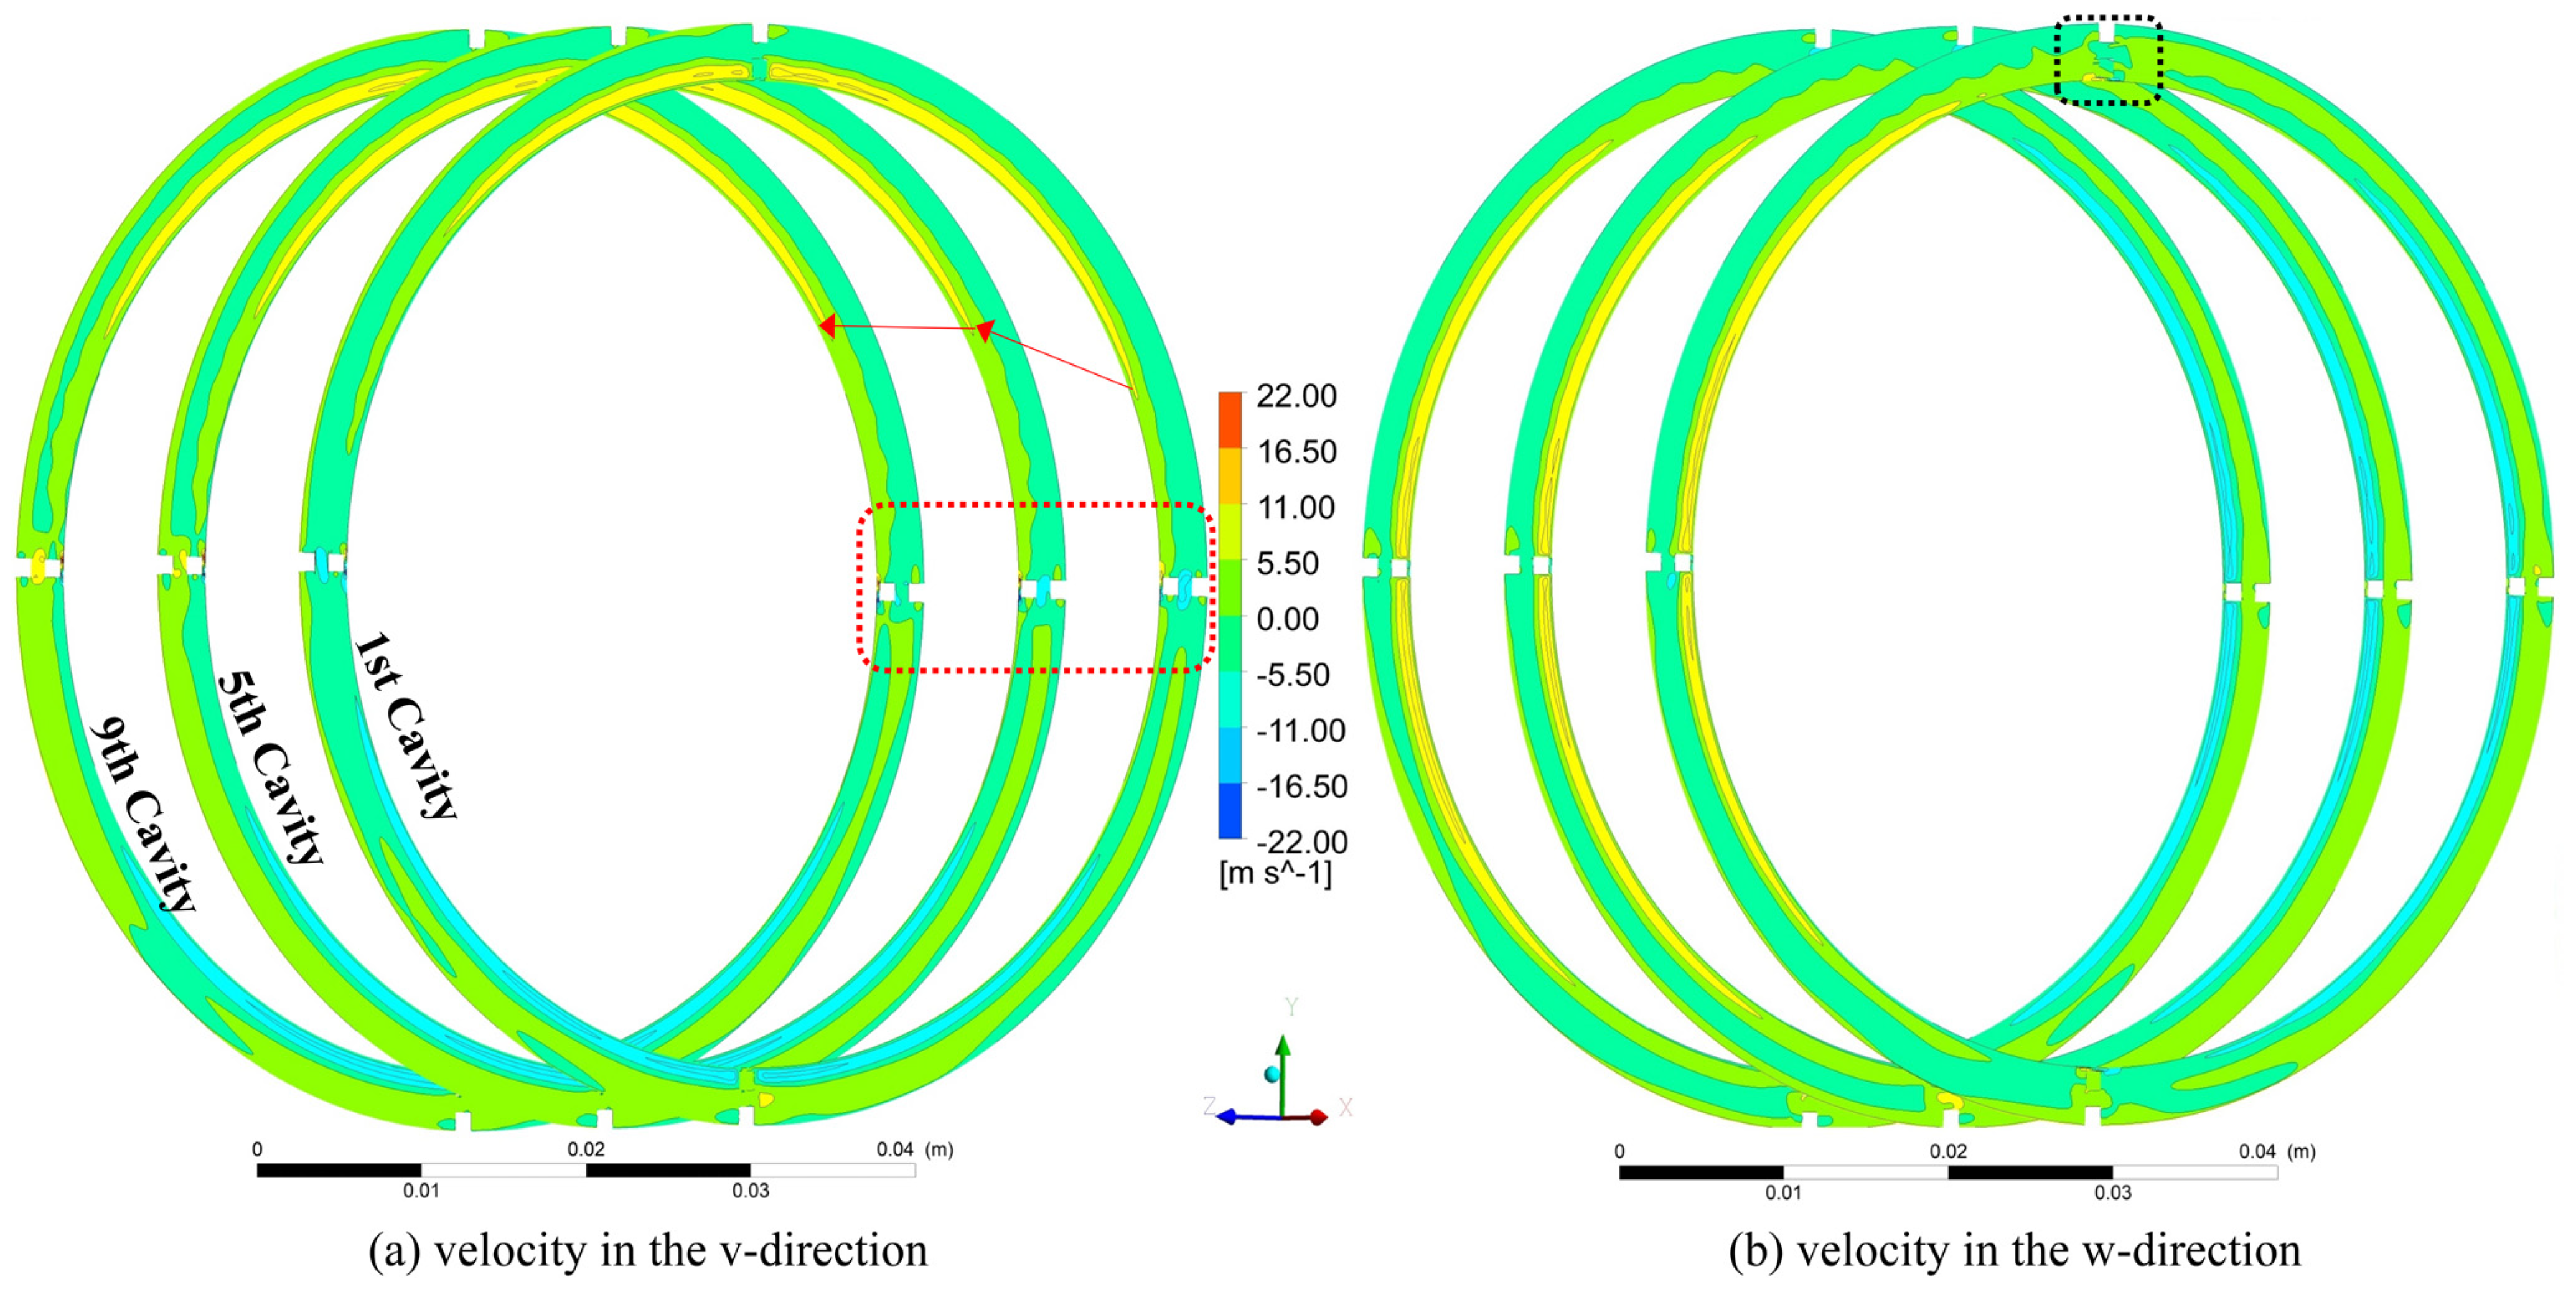
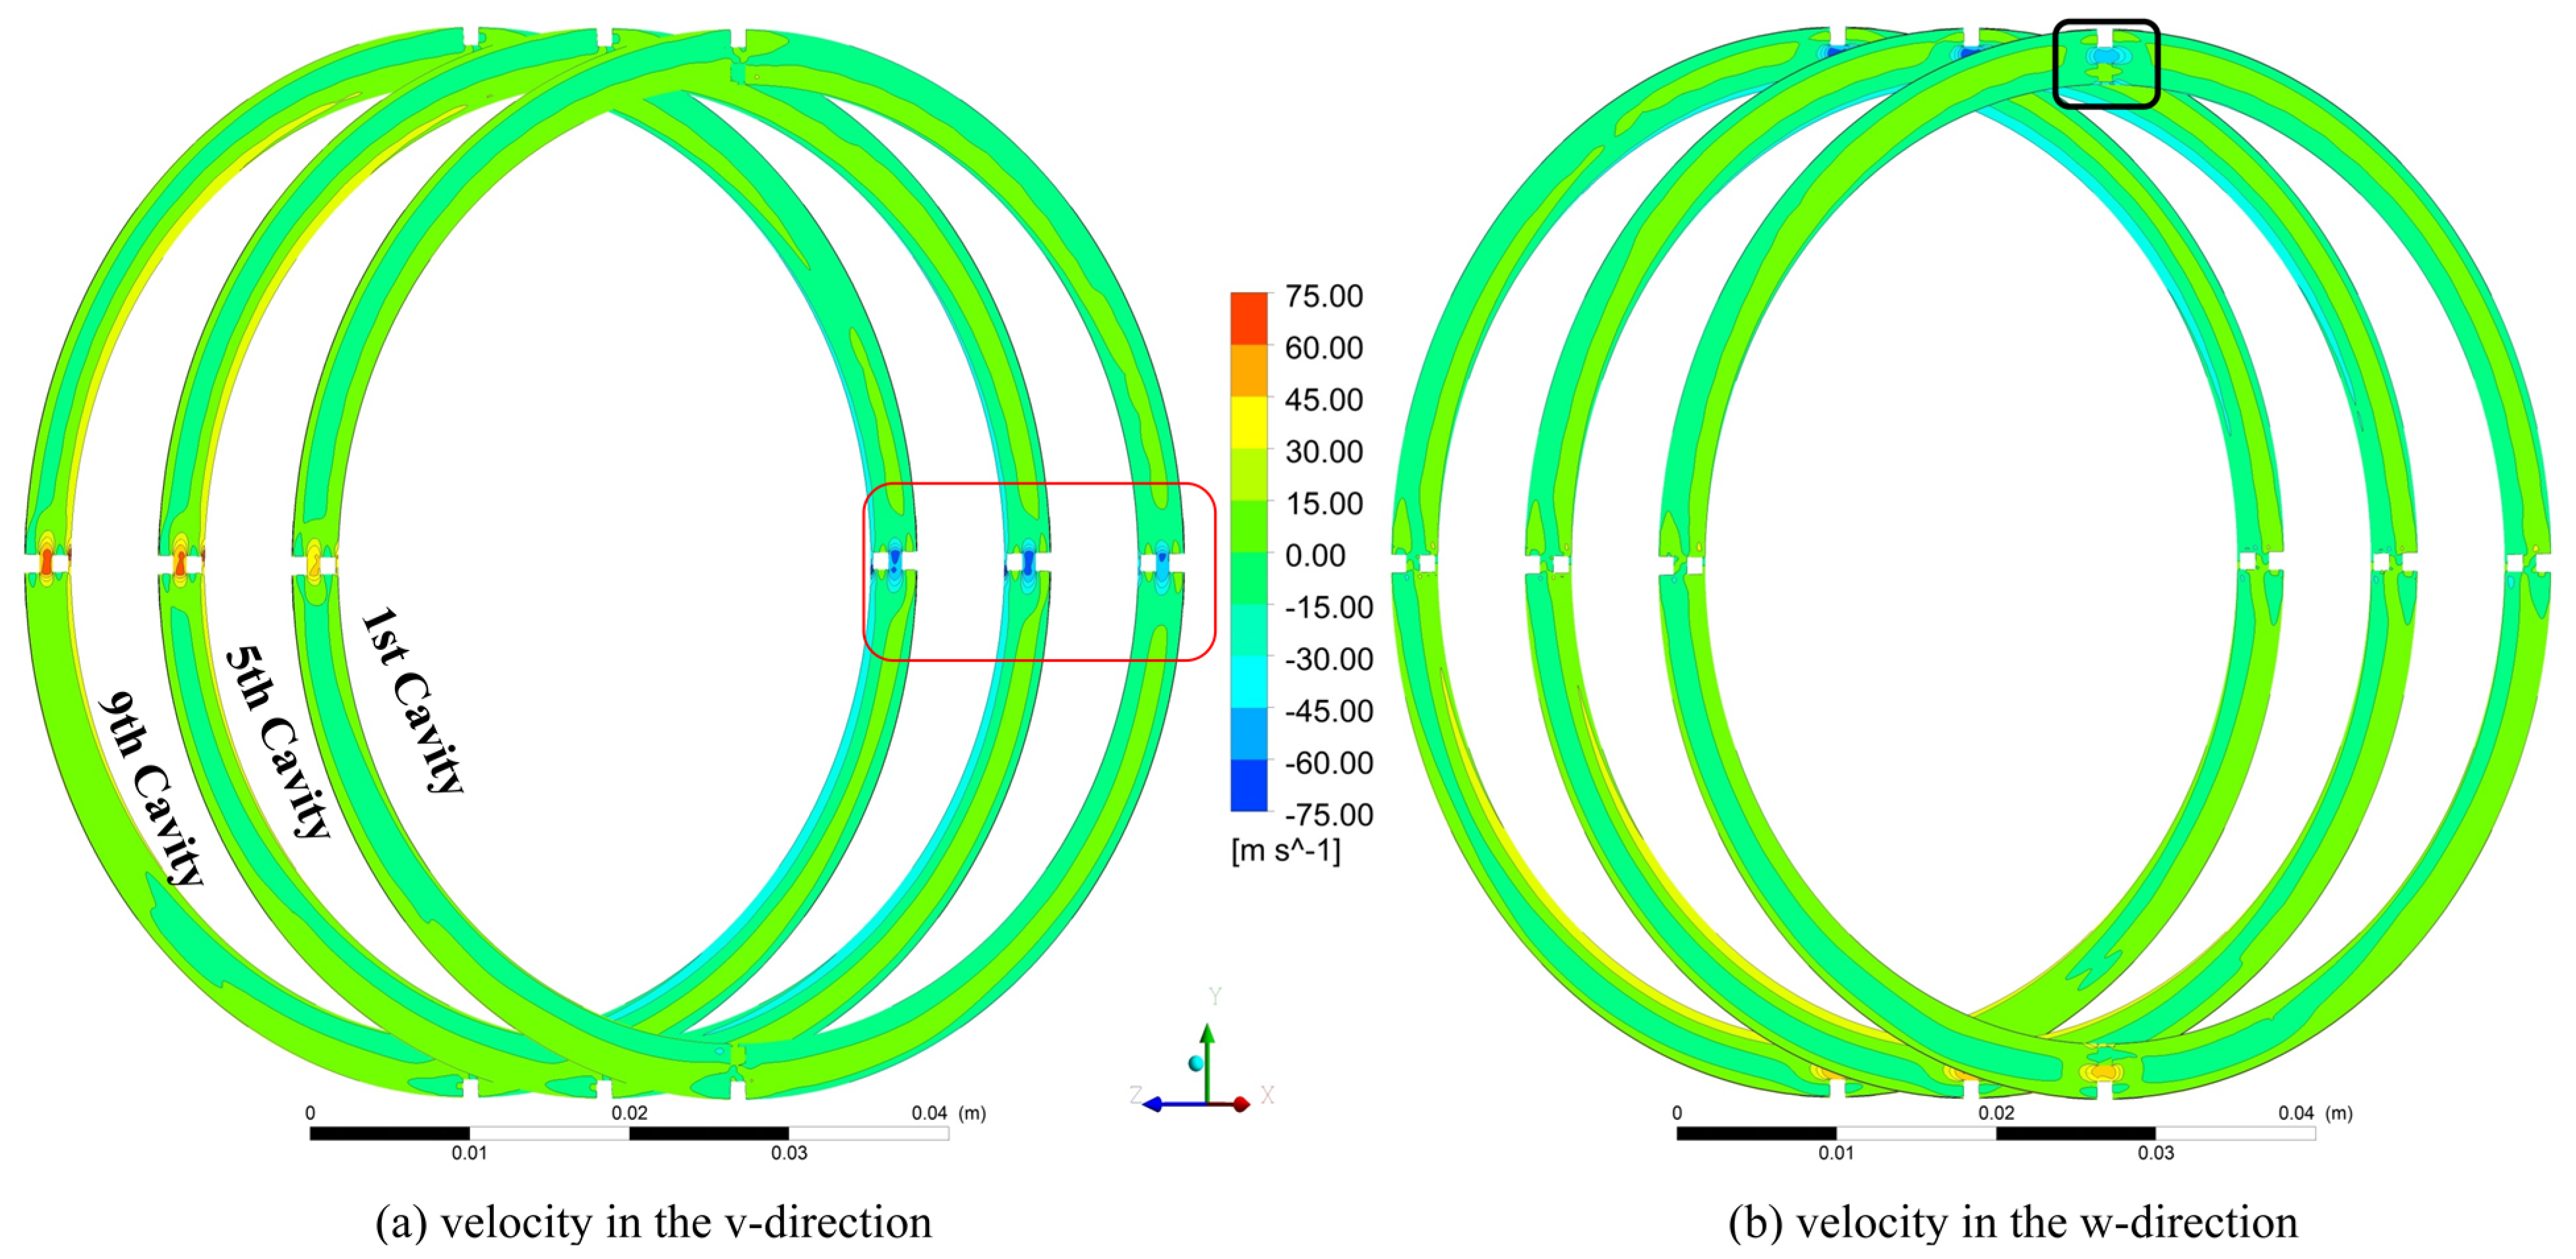
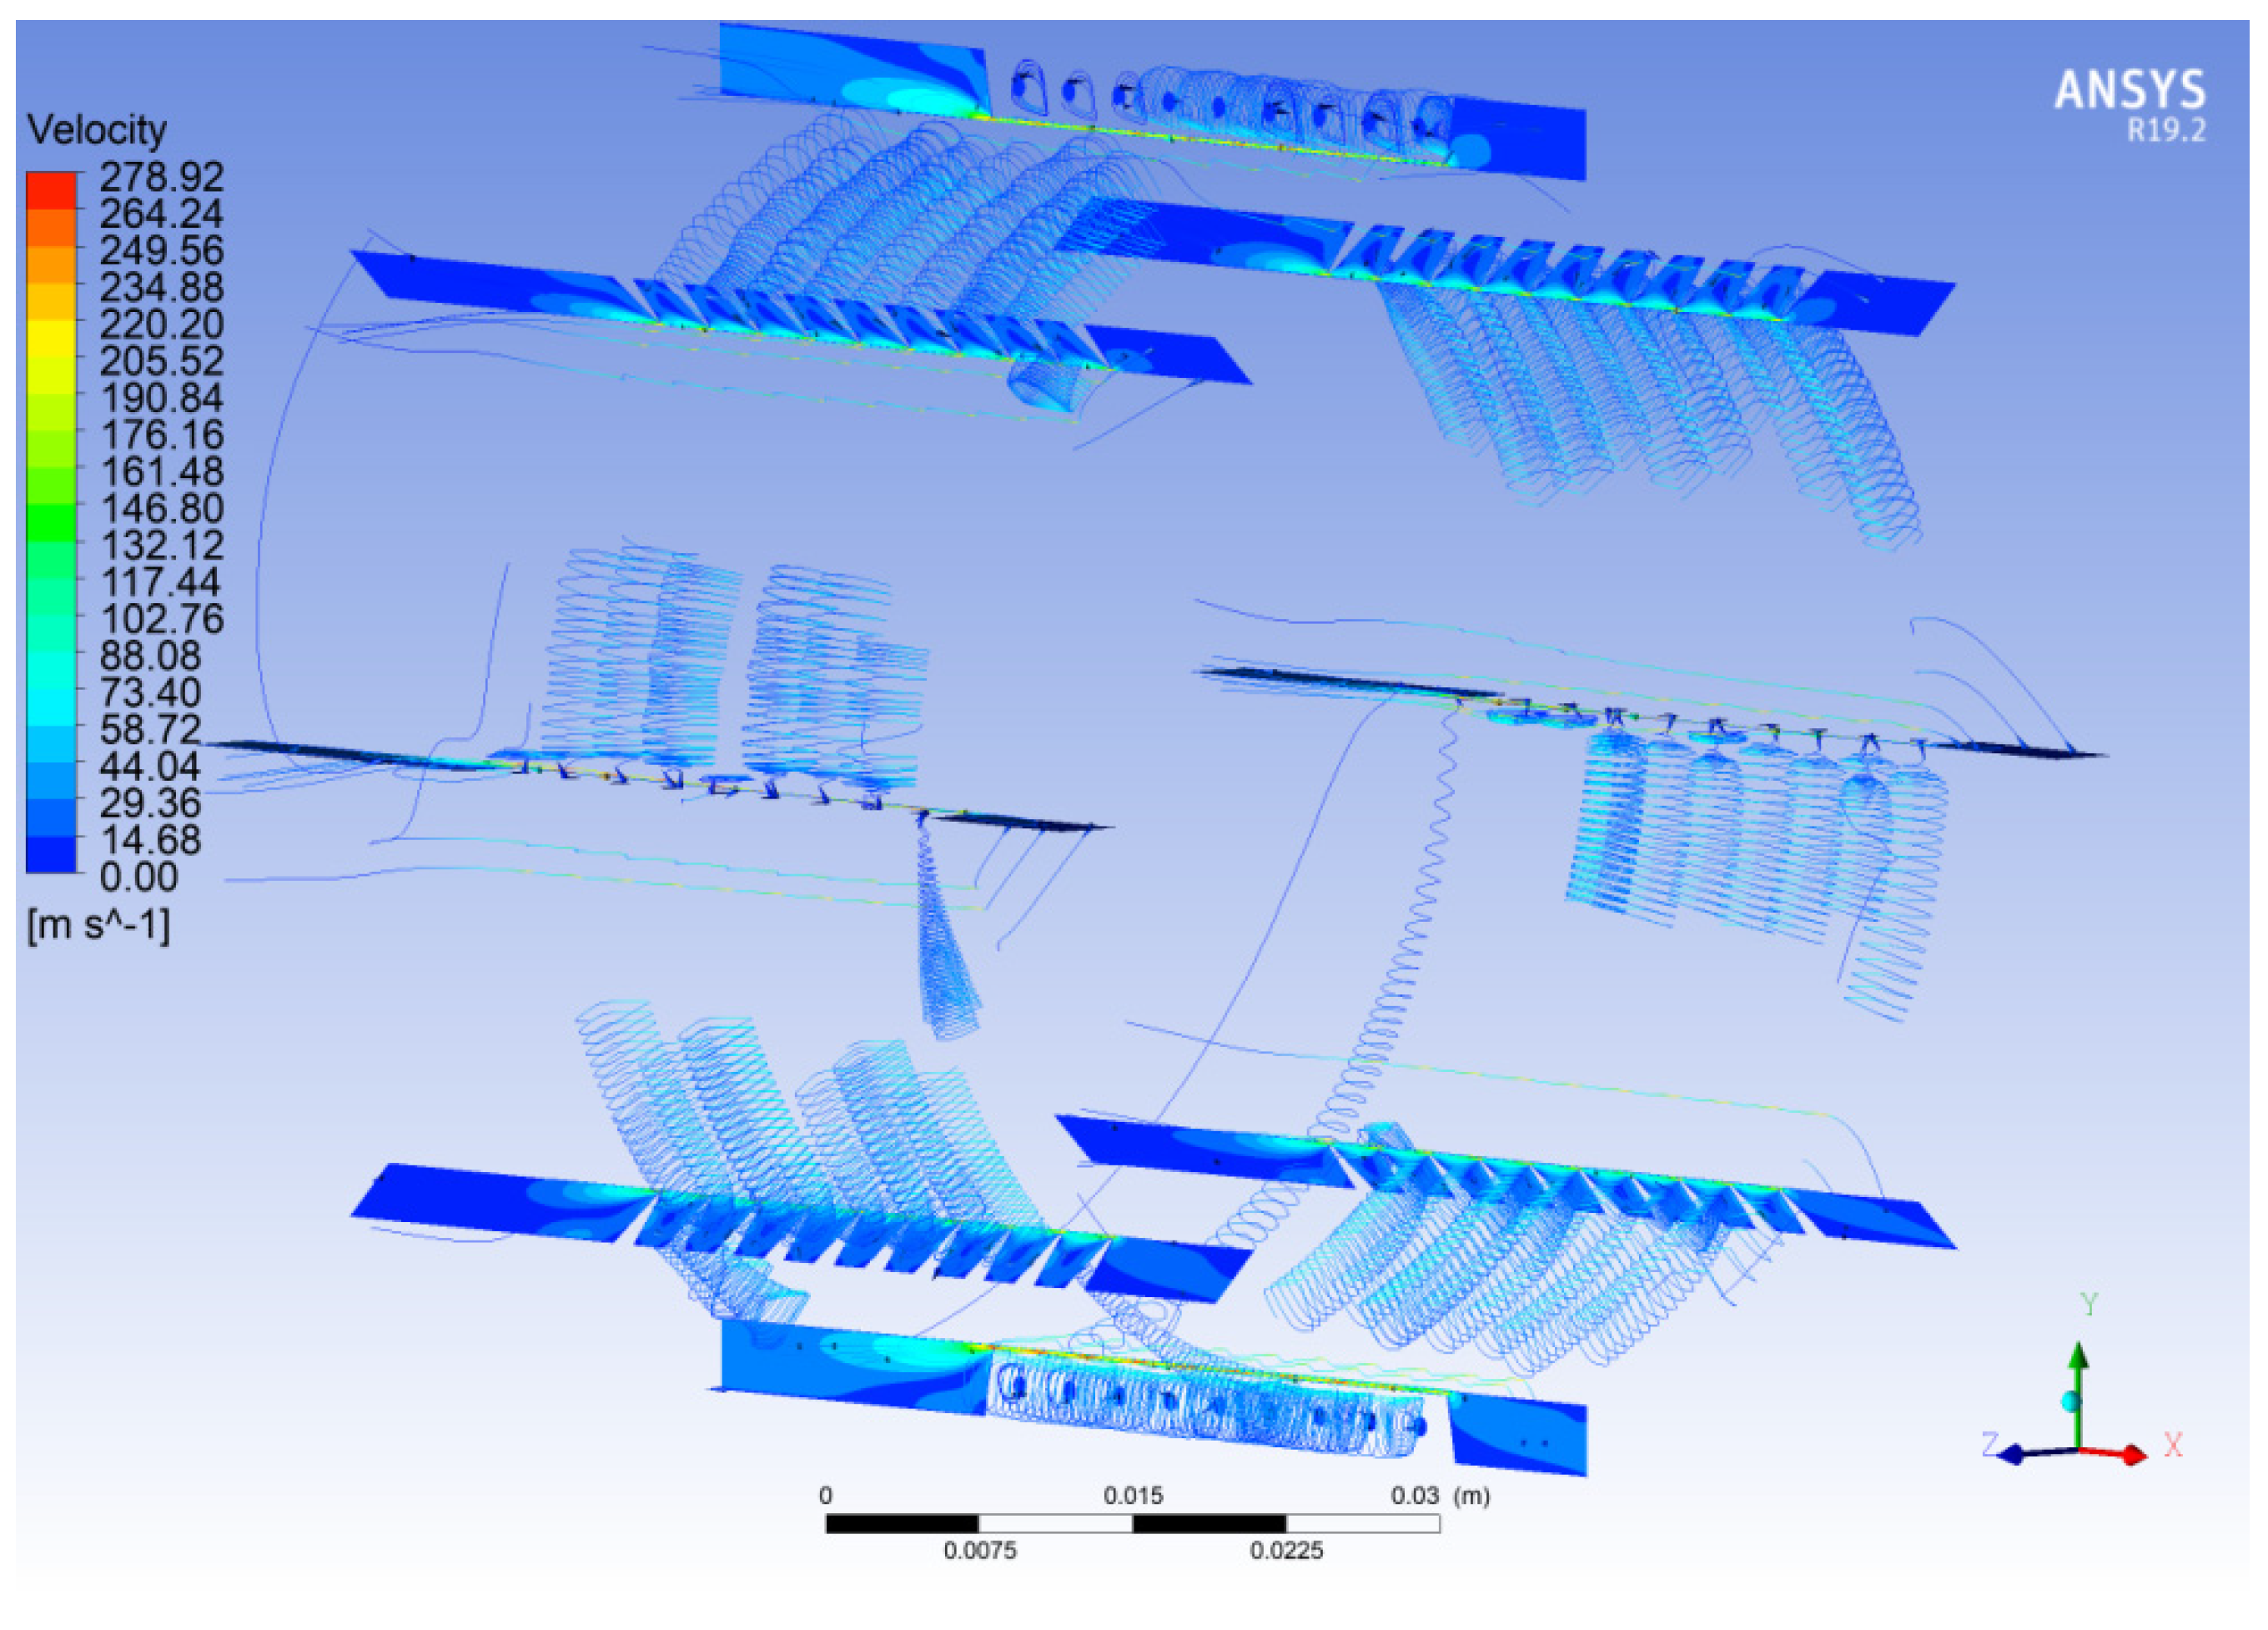
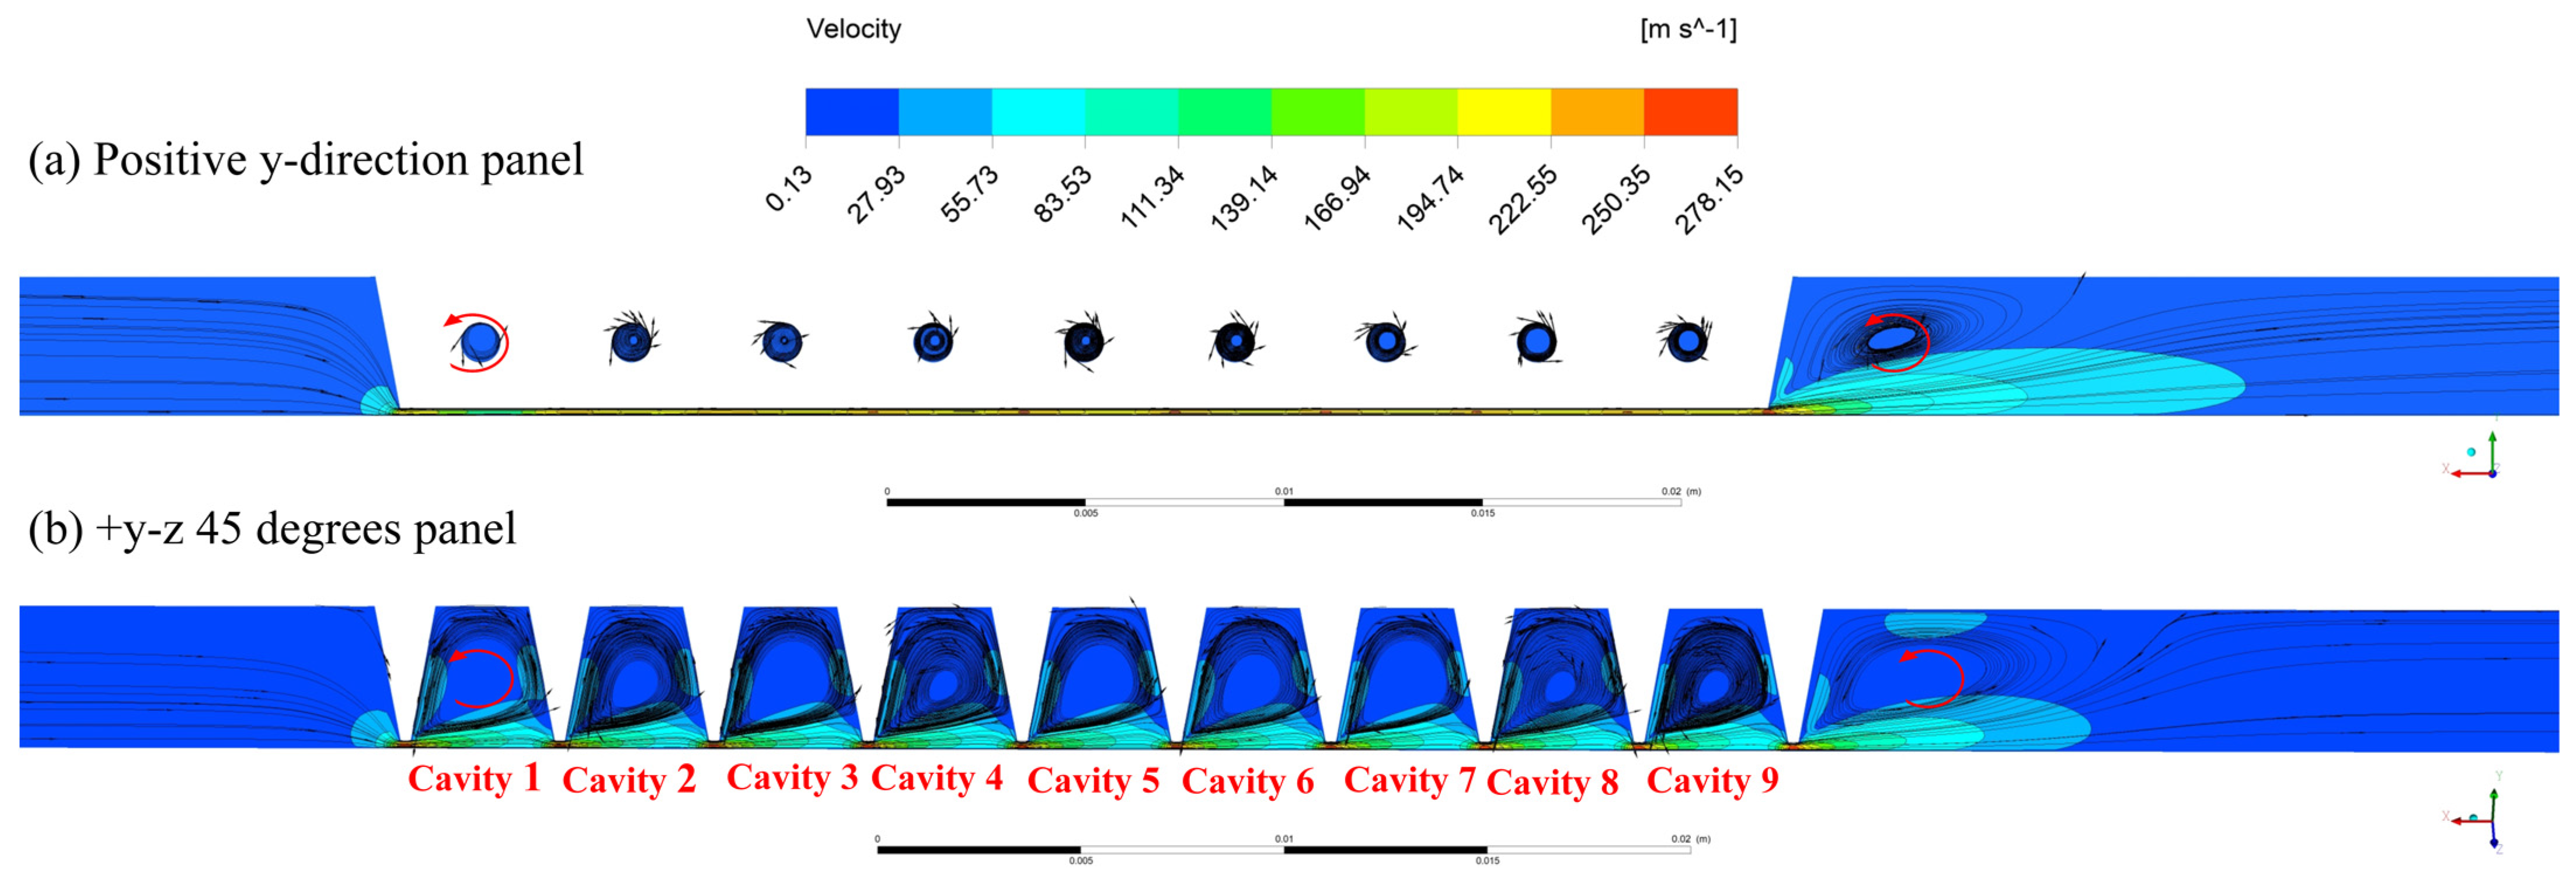
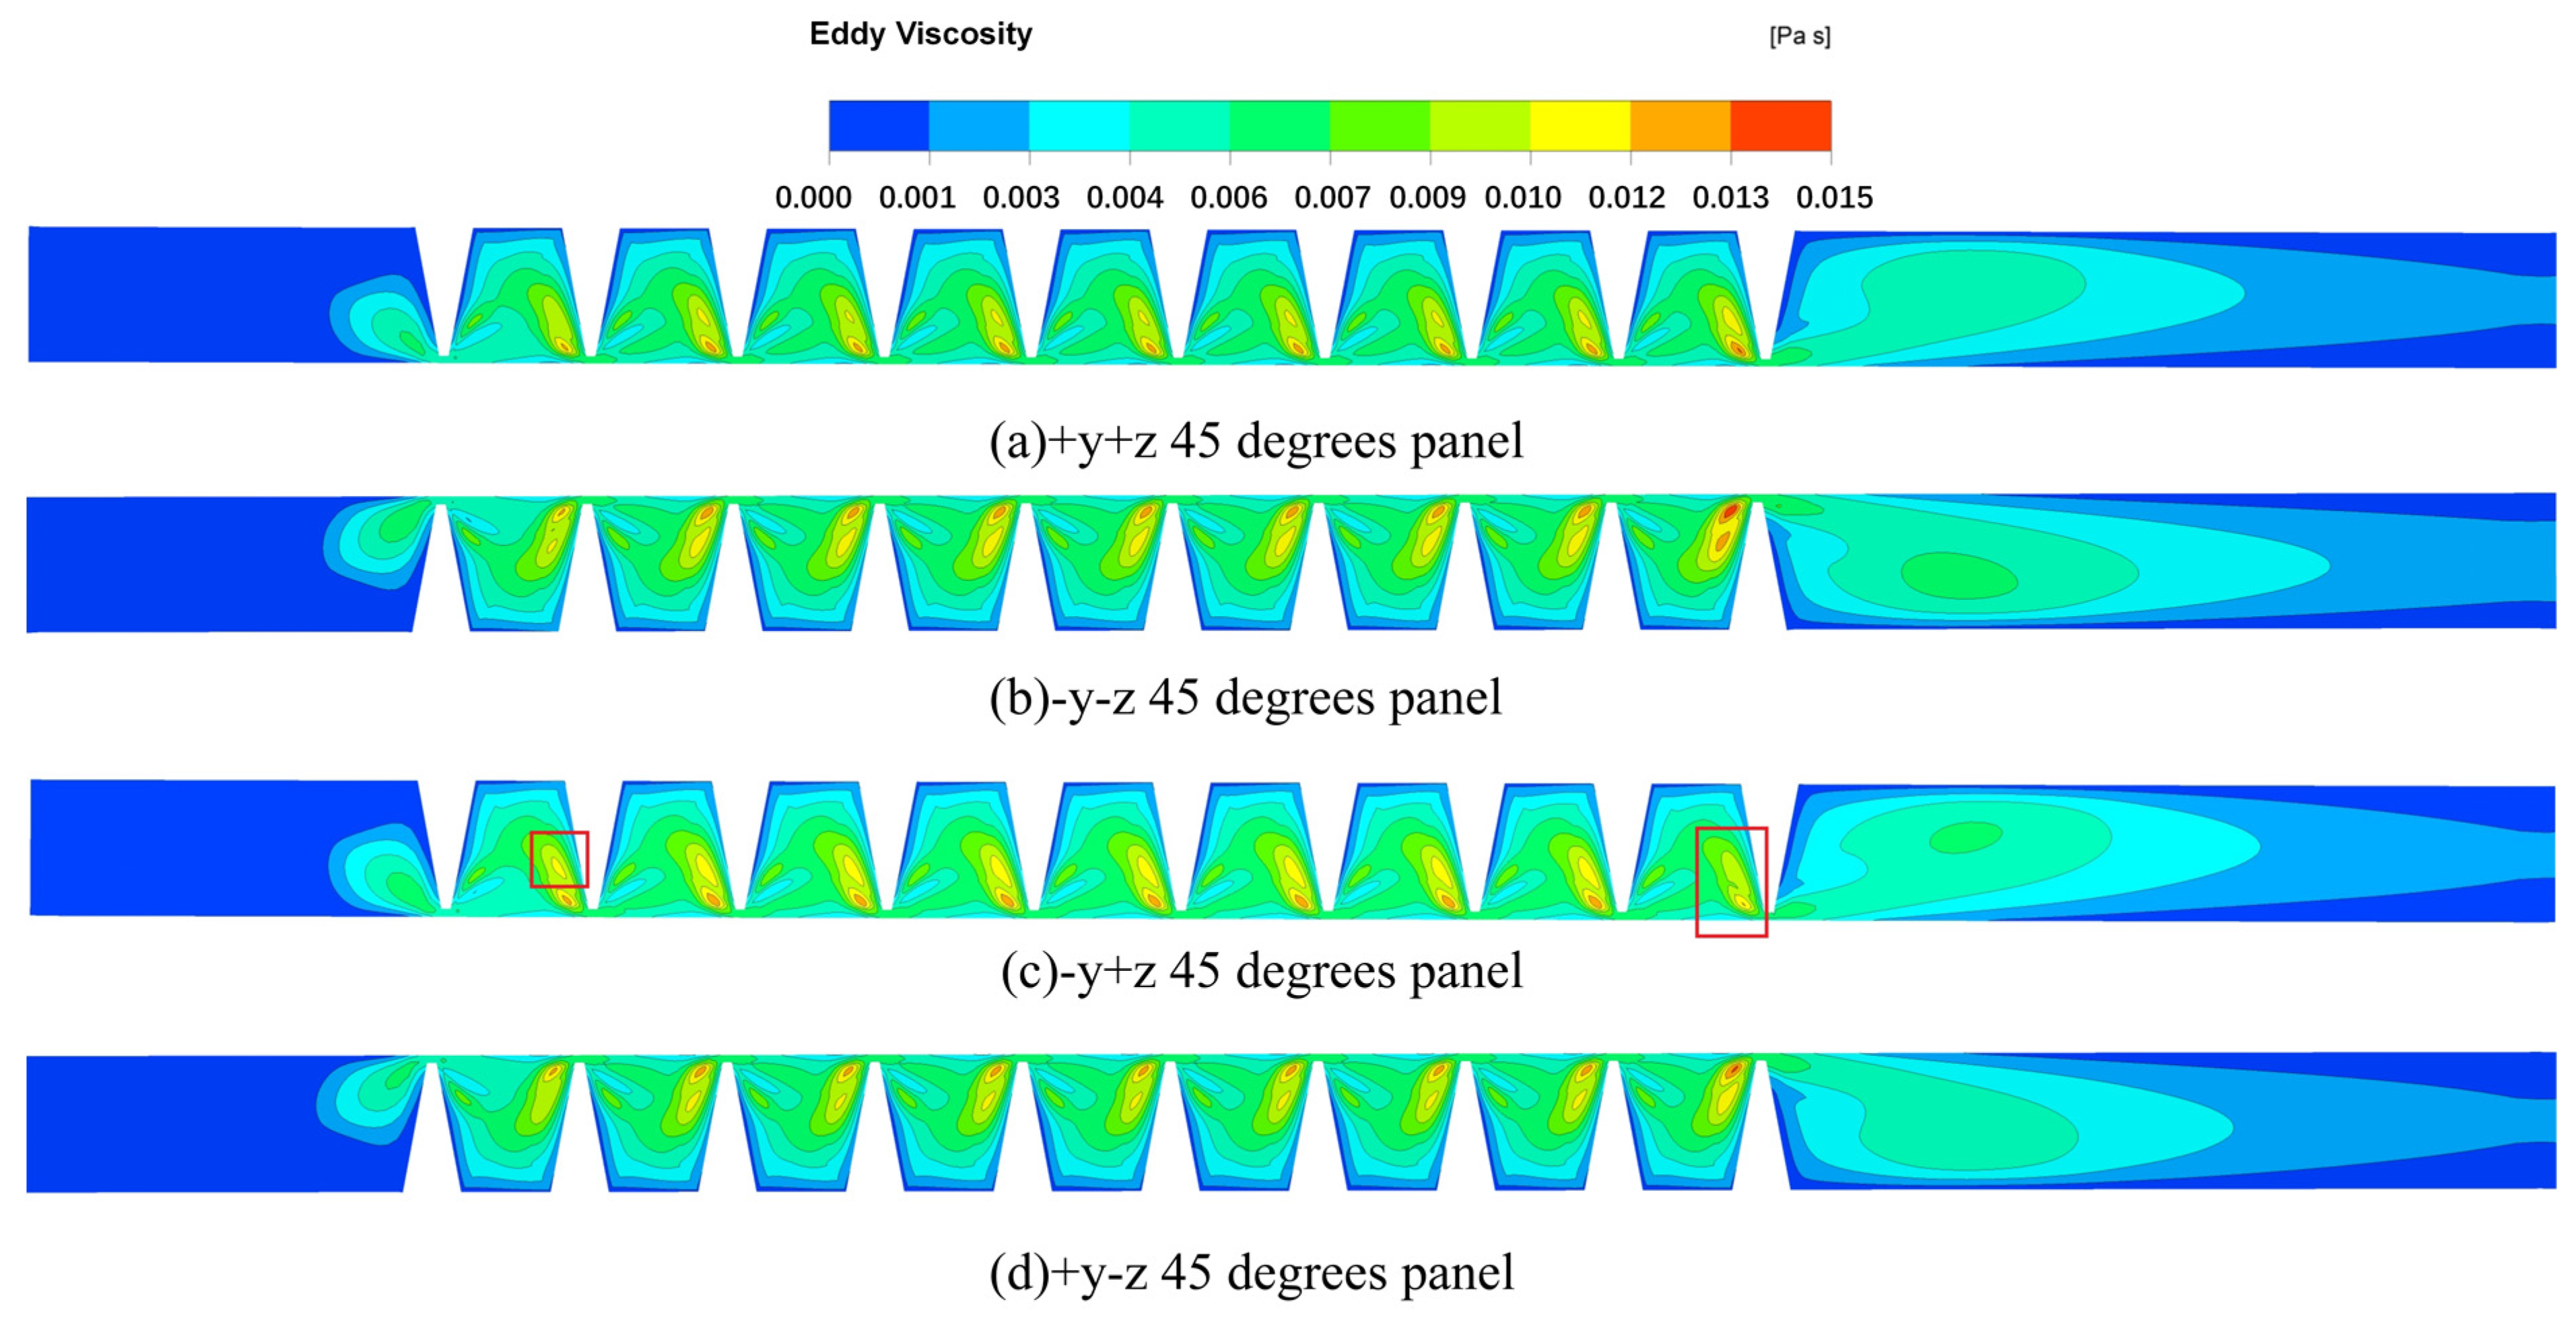
3.3. Velocity
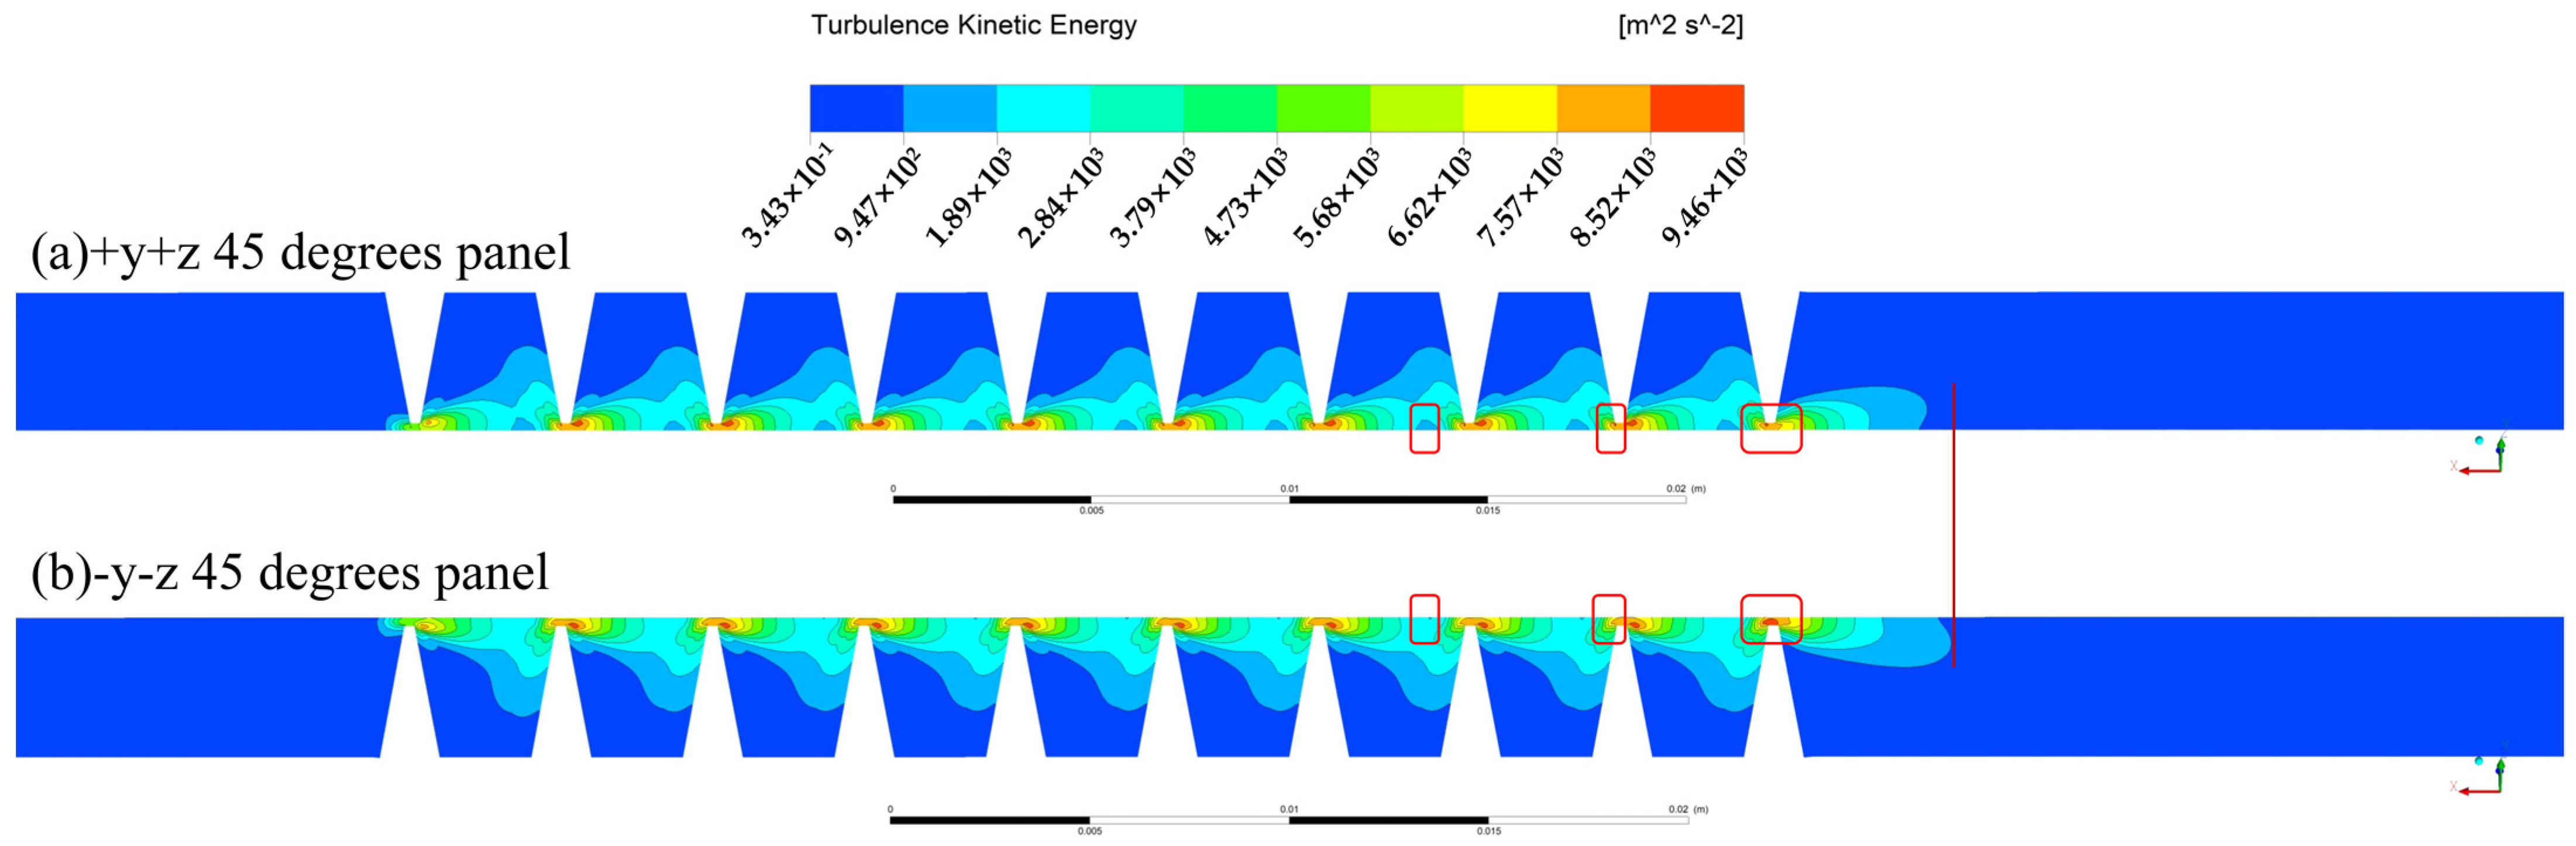
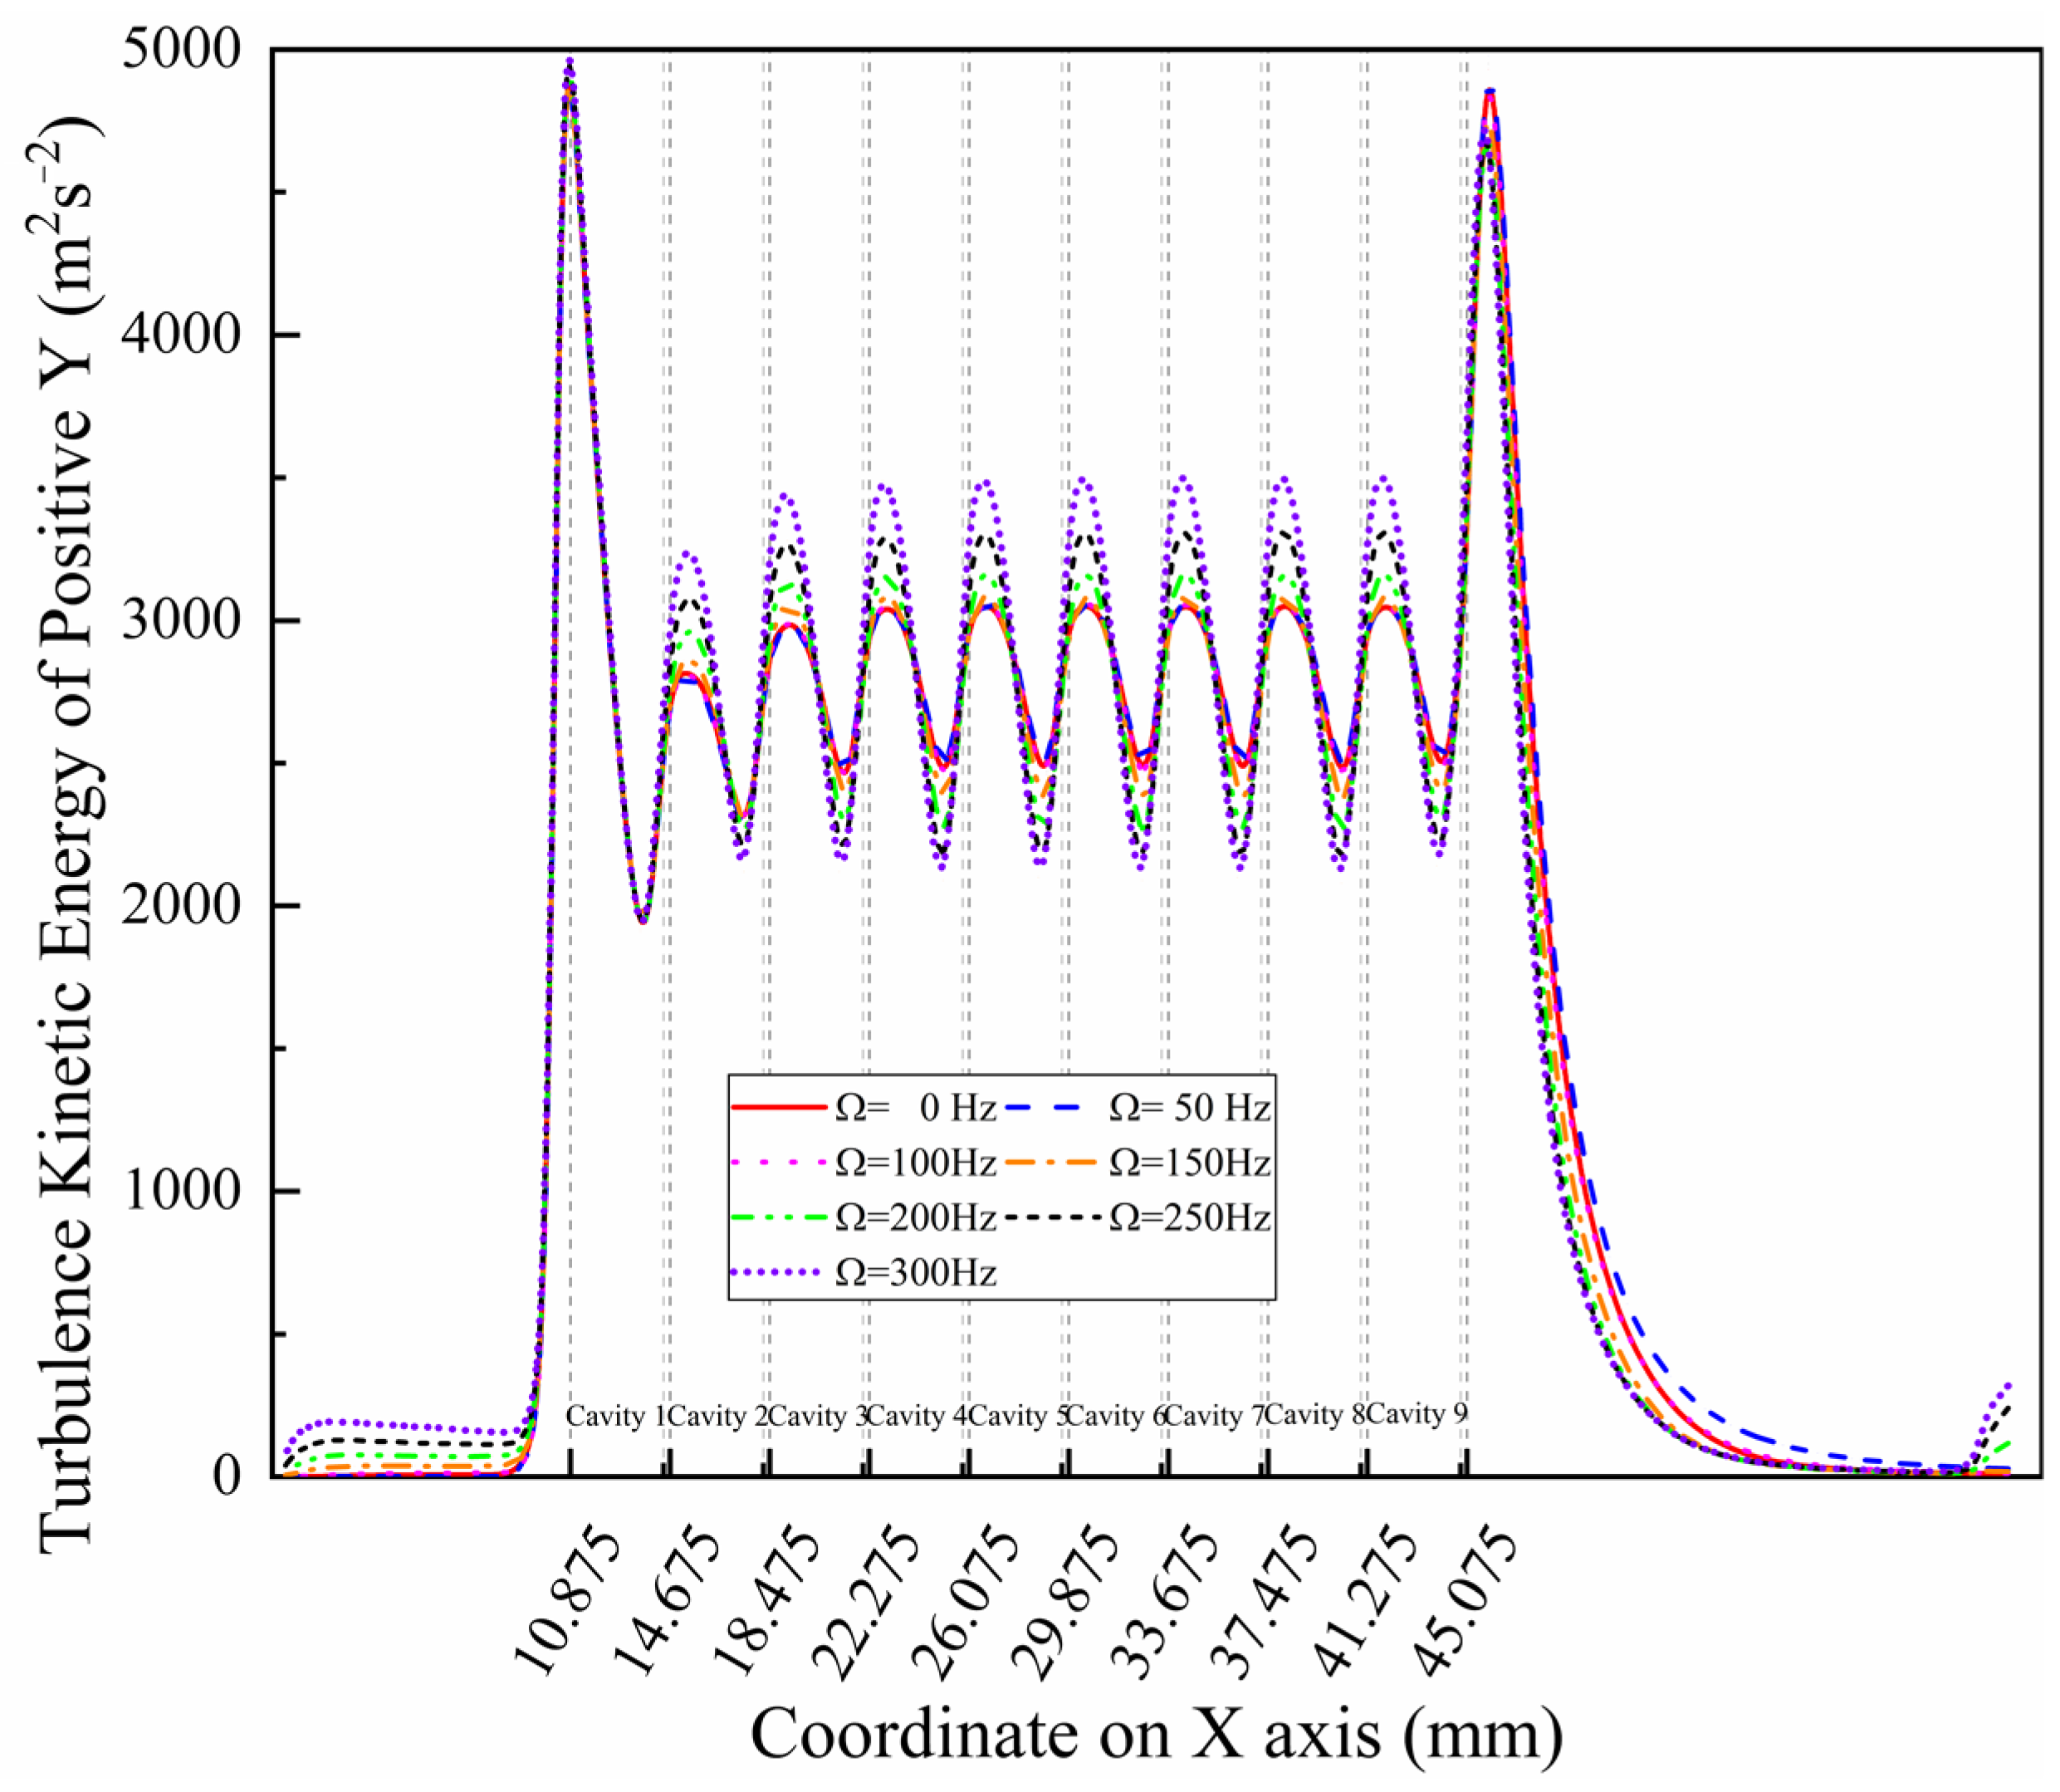
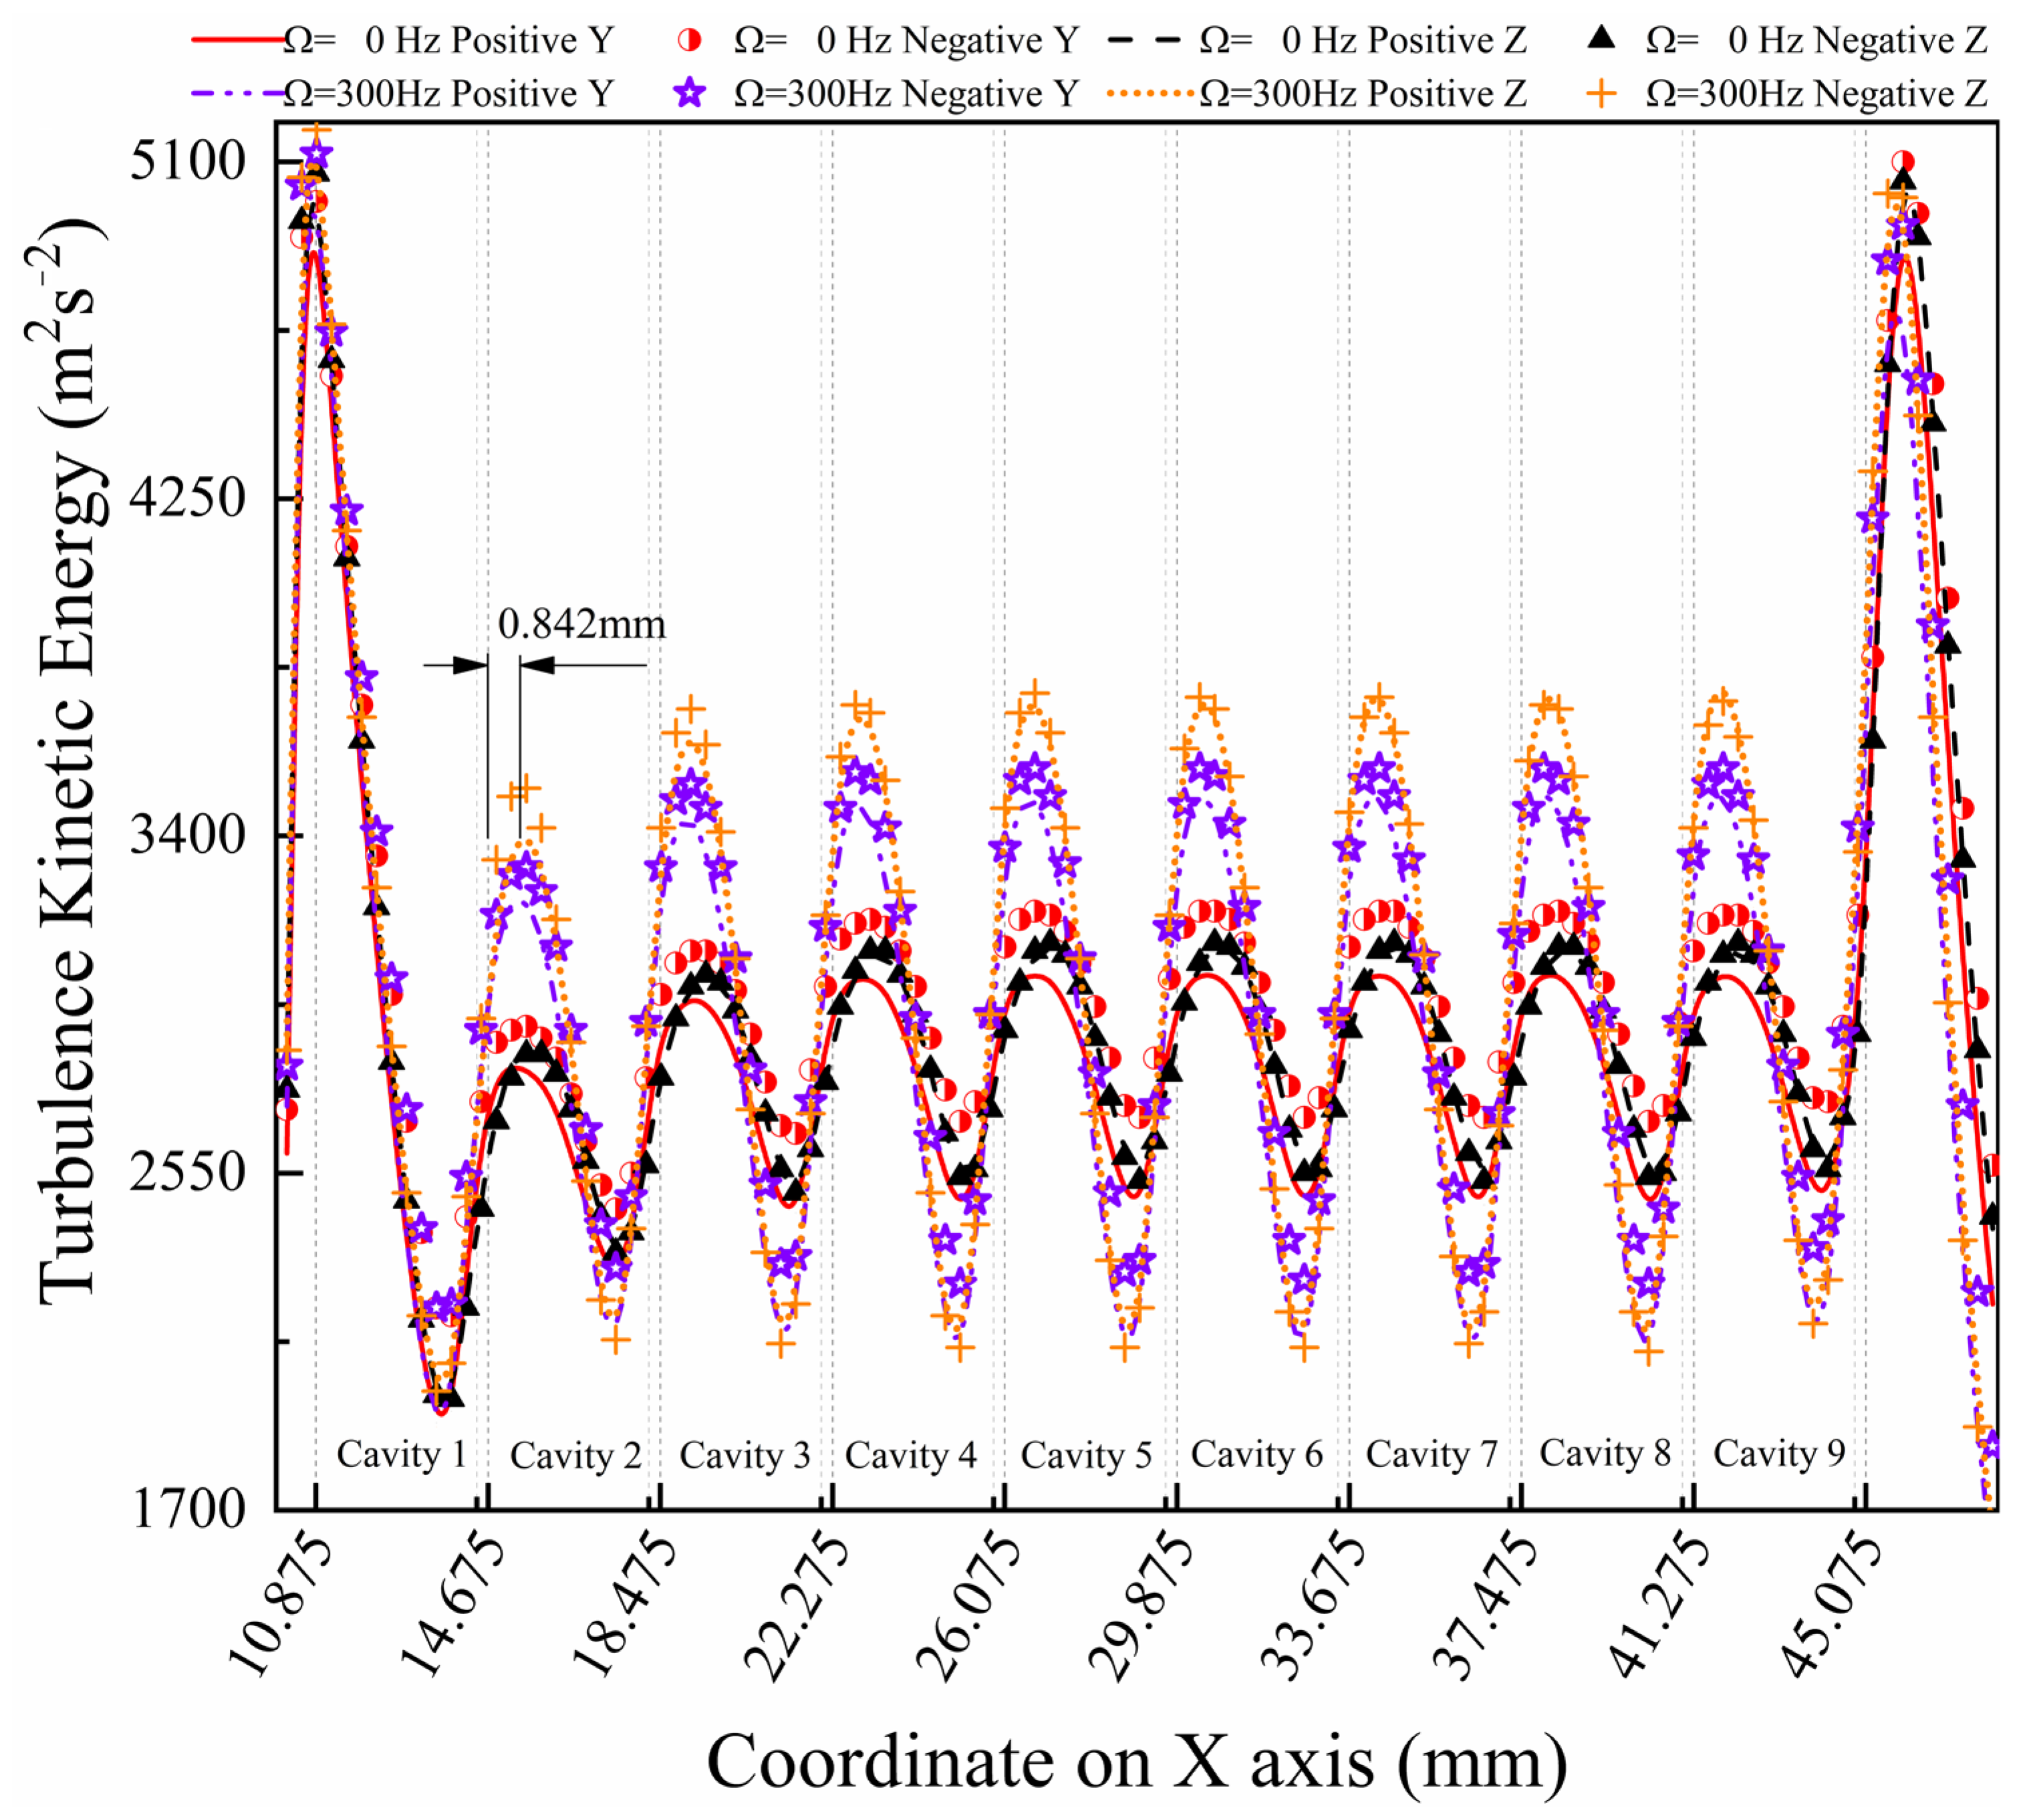
3.4. Turbulence Kinetic Energy
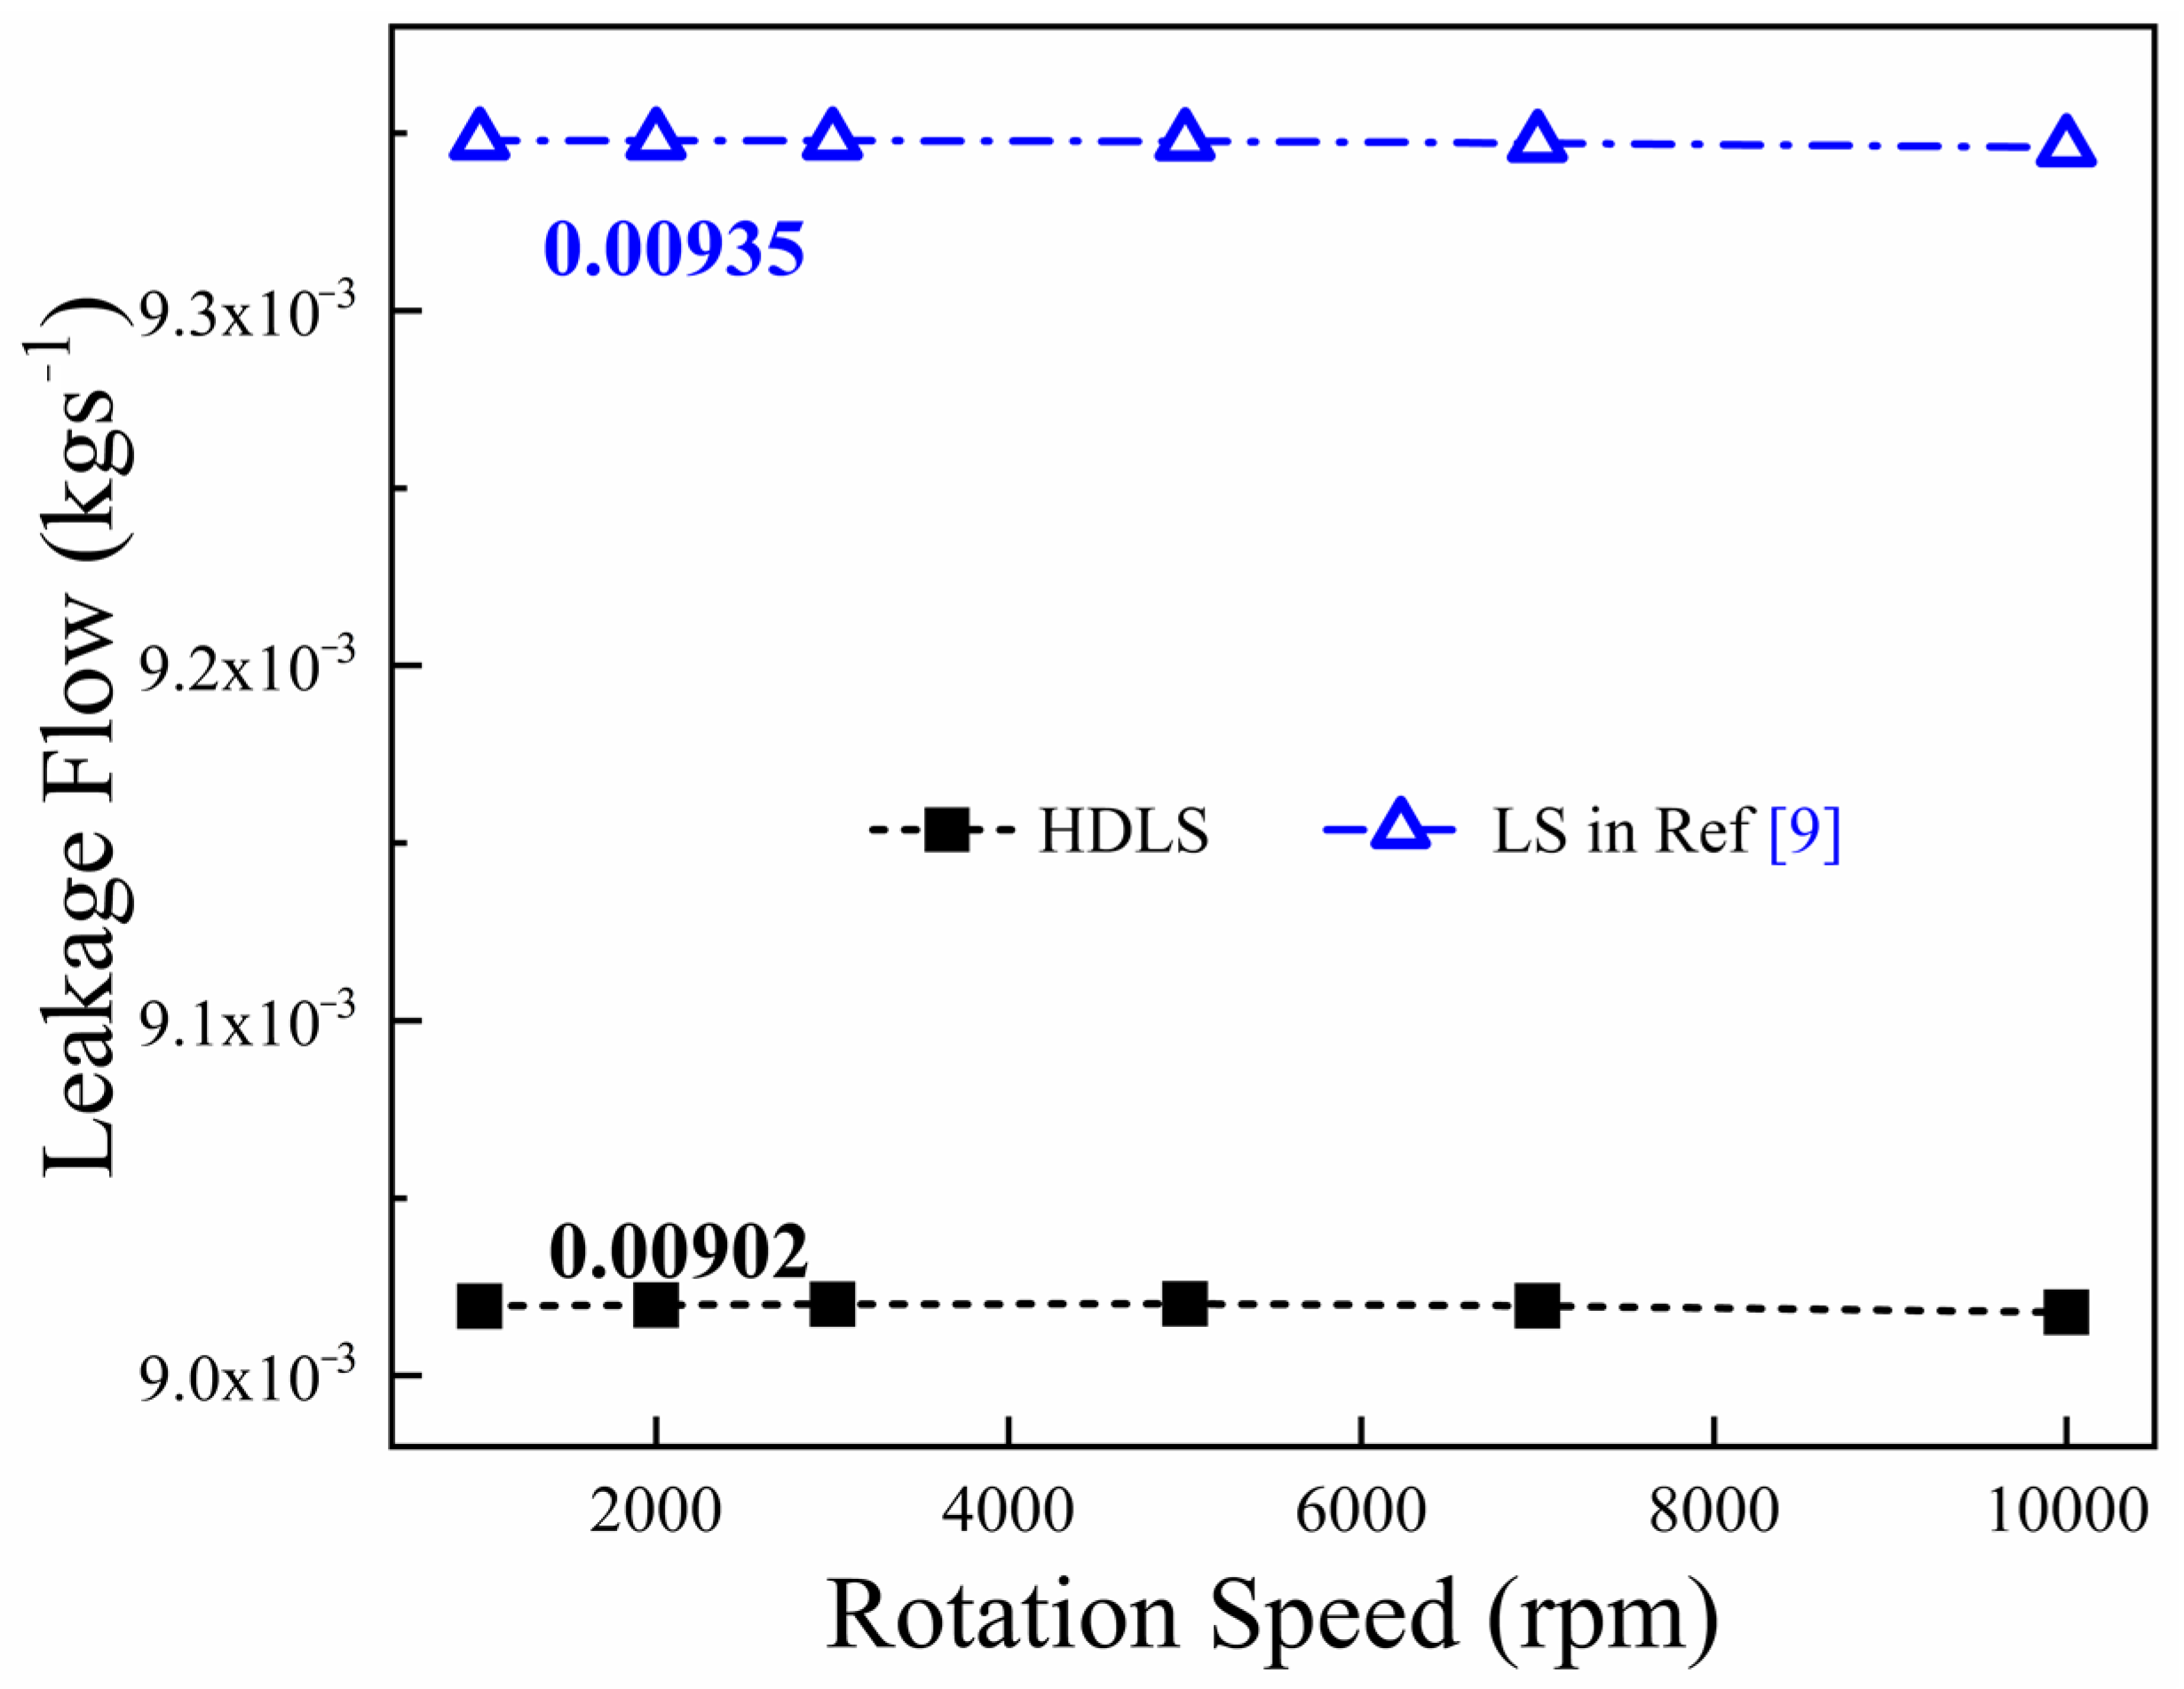
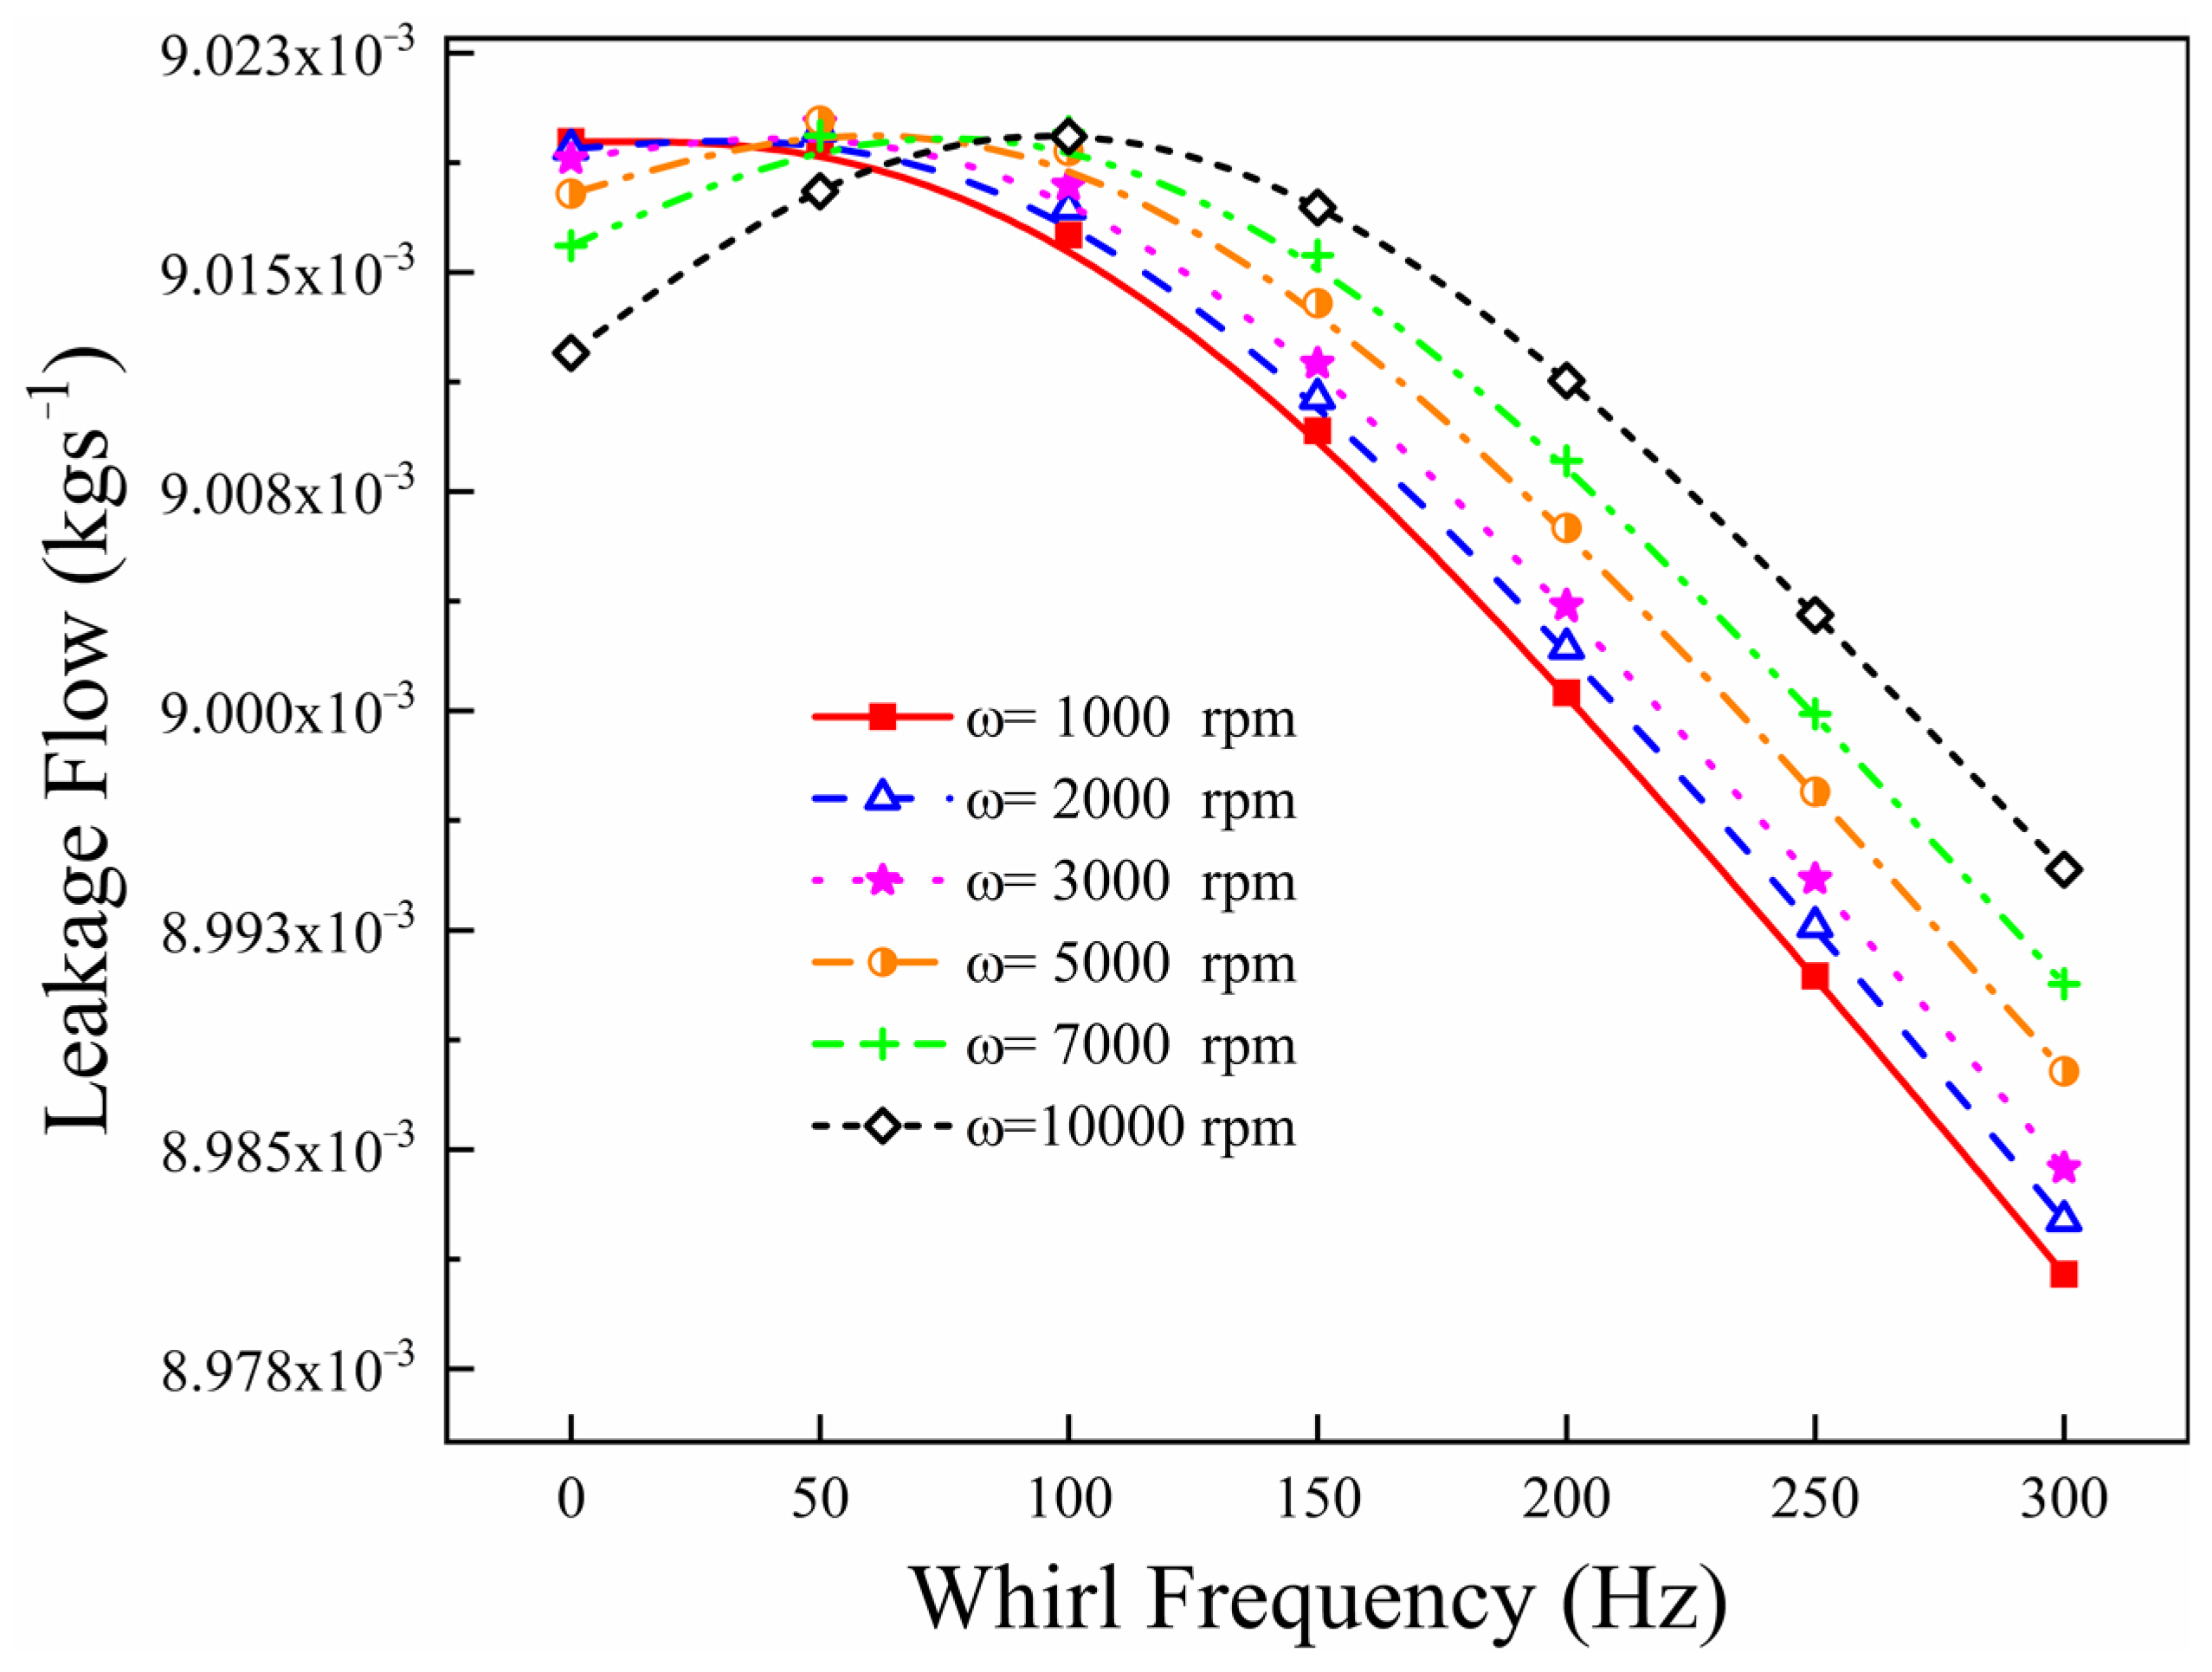
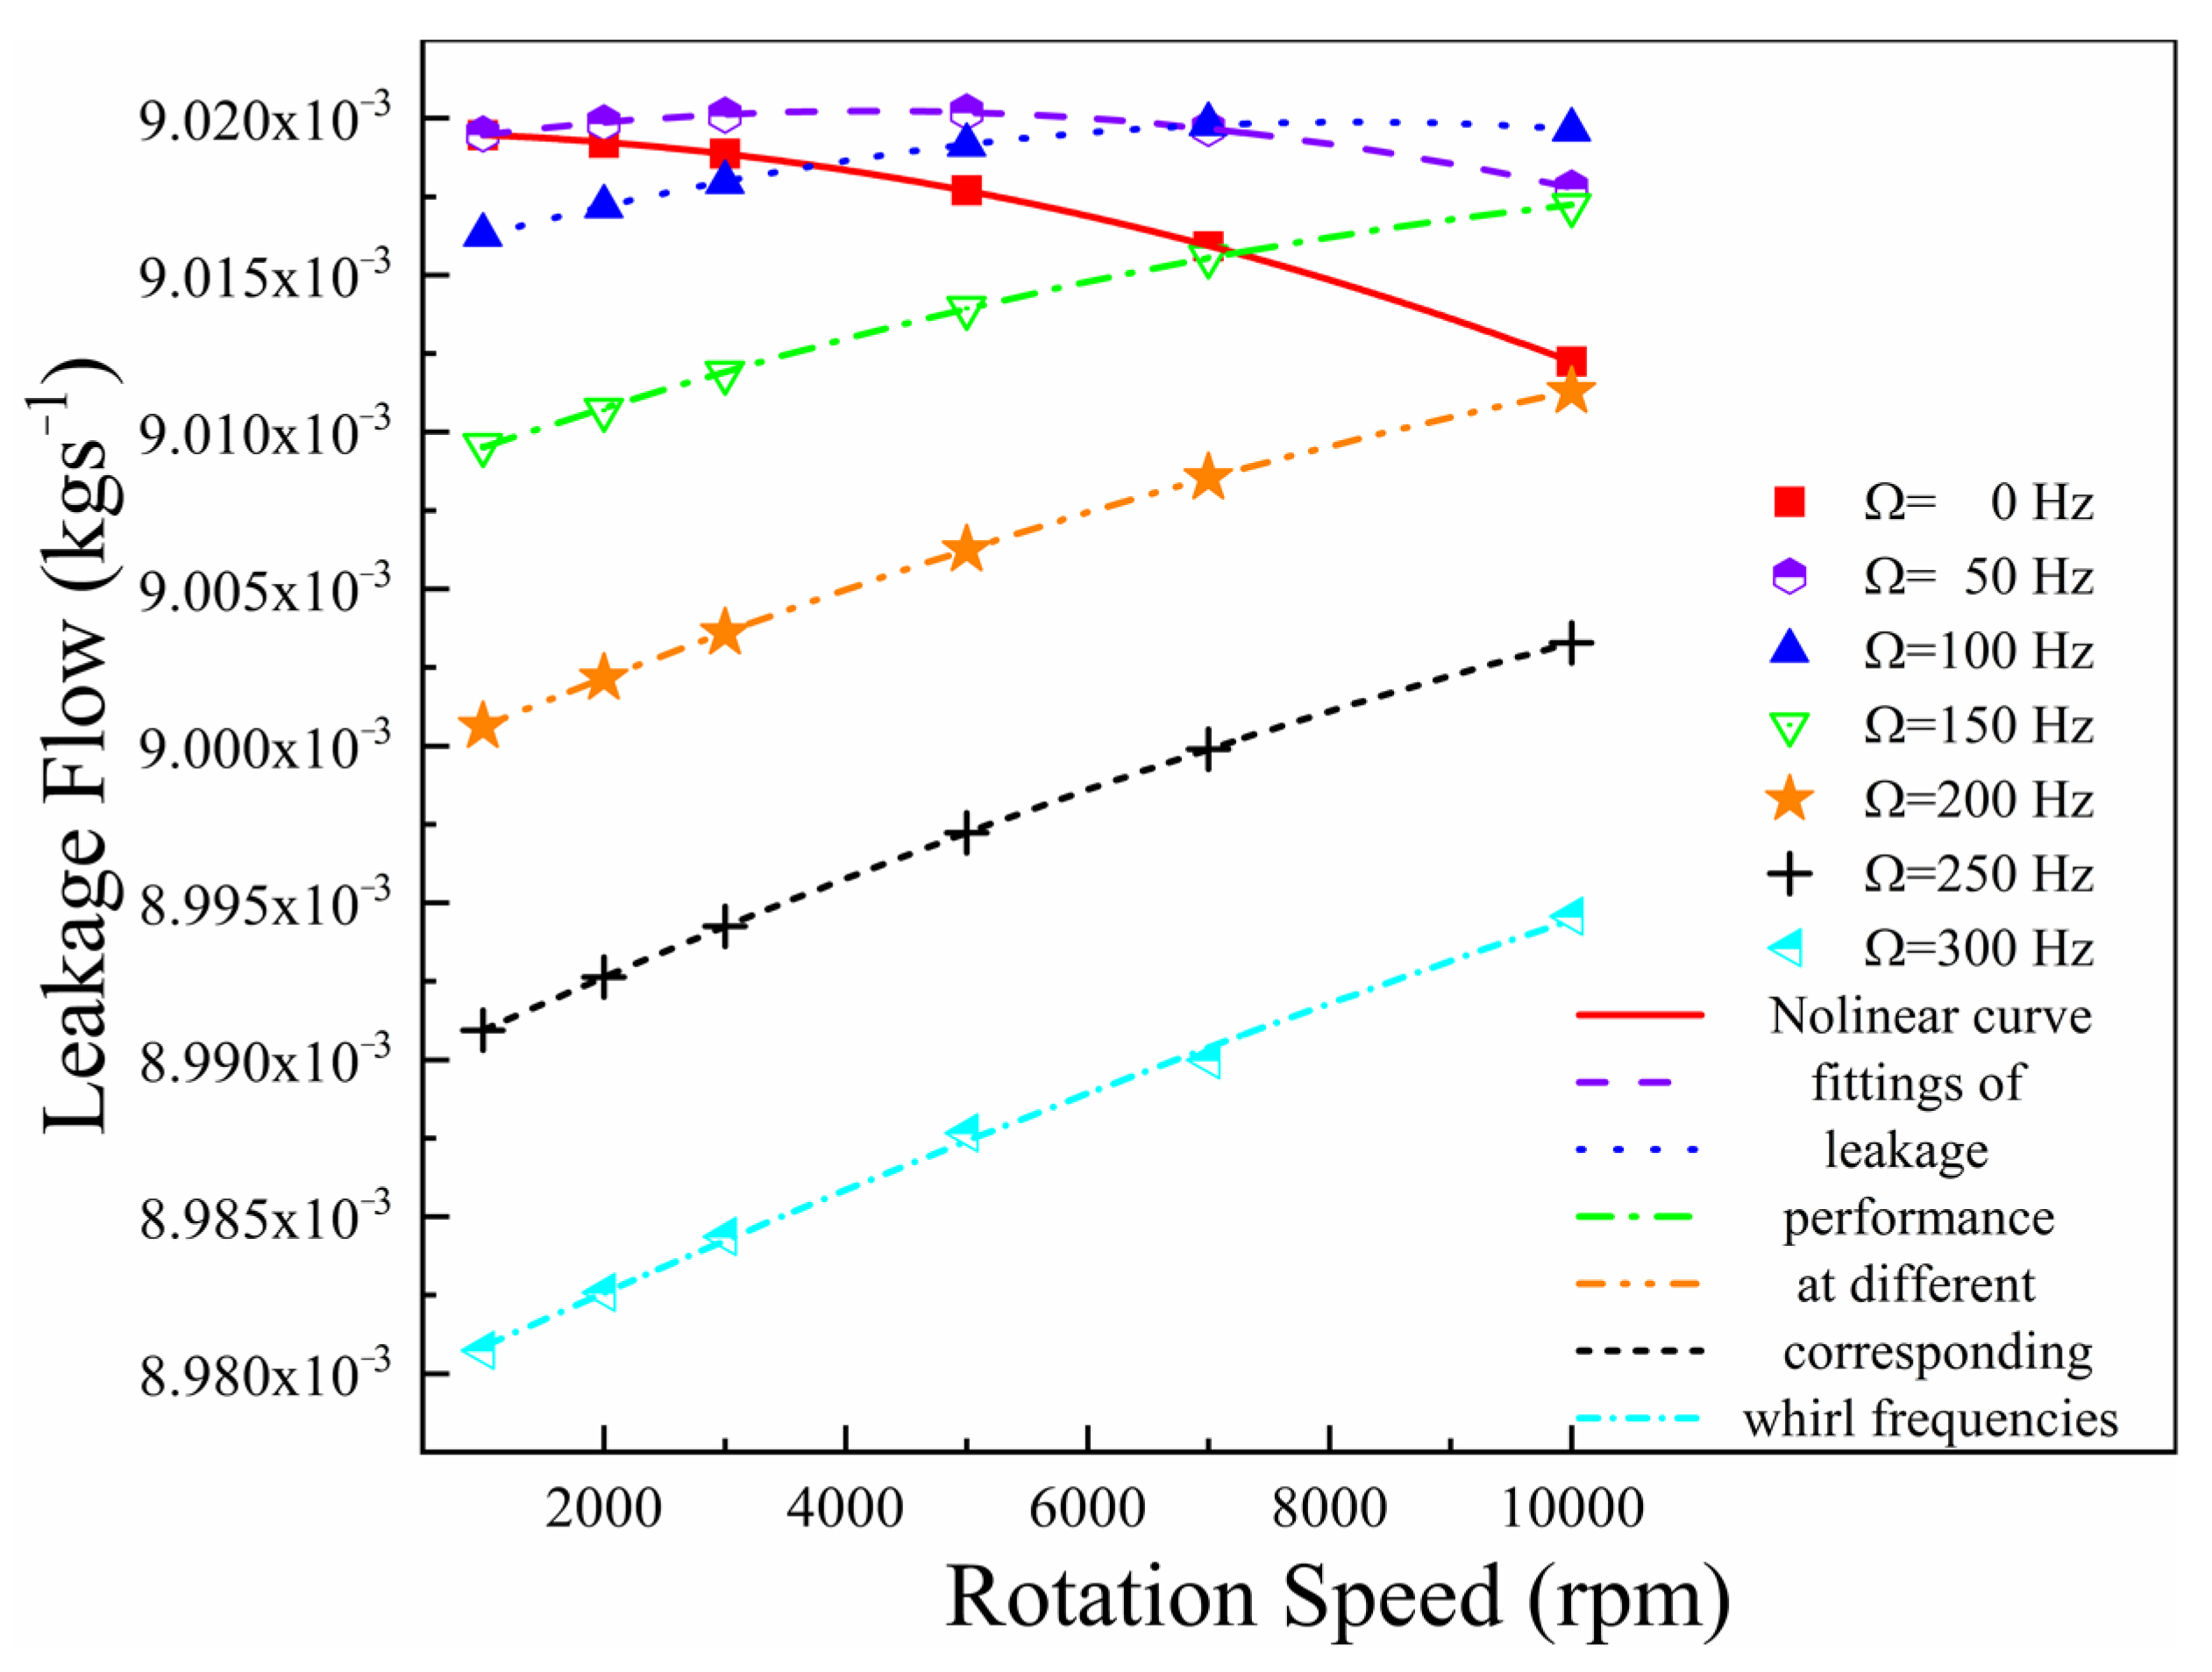
3.5. Leakage Performance
4. Conclusions
- The pressure drop in different cavities of the HDLS does not follow some specific rules, while the velocity values in each cavity show some peculiar phenomenon of the HDLS.
- The velocity values in different directions showed some whirl frequency dependence performance. Meanwhile, the velocity analysis in different cavities showed an additional energy dissipation source due to the hole-diaphragm structures added in the traditional labyrinth seal. The study on turbulence kinetic energy confirmed this advantage of the HDLS.
- The physical characteristics of the whirl frequency influence on the leakage of the HDLS were discussed in detail. A reverse flow rate between the rotor surface and working medium was proposed to describe the unusual phenomenon that the leakage increases at higher whirl frequencies.
- An exponential-type relationship between rotation speeds and leakage flow at different whirl frequencies was observed by curve fit technology, which can be used to predict leakage performance studies of hole diaphragm labyrinth seals, and provide an exciting direction for seal-rotor system studies.
Author Contributions
Funding
Conflicts of Interest
References
- Jiang, P.N.; Wang, W.Z.; Liu, Y.Z.; Meng, G. Influence of steam leakage through vane, gland, and shaft seals on rotordynamics of high-pressure rotor of a 1000 MW ultra-supercritical steam turbine. Arch. Appl. Mech. 2012, 82, 177–189. [Google Scholar] [CrossRef]
- Andrés, L.S.; Yang, J.; Kawashita, R. On the Effect of Clearance on the Leakage and Cavity Pressures in an Interlocking Labyrinth Seal Operating With and Without Swirl Brakes: Experiments and Predictions. J. Eng. Gas Turbines Power 2021, 143, 031003. [Google Scholar] [CrossRef]
- Thorat, M.R.; Childs, D.W. Predicted Rotordynamic Behavior of a Labyrinth Seal as Rotor Surface Speed Approaches Mach 1. J. Eng. Gas Turbines Power-Trans. Asme 2010, 132, 112504. [Google Scholar] [CrossRef]
- Childs, D.W. Finite-Length Solutions for Rotordynamic Coefficients of Turbulent Annular Seals. J. Tribol. 1983, 105, 437–444. [Google Scholar] [CrossRef]
- Alford, S.J. Protection of Labyrinth Seals From Flexural Vibration. ASME J. Eng. Gass Turbines Power 1964, 86, 141–147. [Google Scholar] [CrossRef]
- Wang, W.Z.; Liu, Y.Z.; Chen, H.P.; Jiang, P.N. Computation of rotordynamic coefficients associated with leakage steam flow through labyrinth seal. Arch. Appl. Mech. 2007, 77, 587–597. [Google Scholar] [CrossRef]
- Si, H.; Cao, L.; Li, P.; Chen, D. Steam flow excited vibration and dynamic characteristics of seal in different rotor whirling motion. Tribol. Int. 2021, 160, 107029. [Google Scholar] [CrossRef]
- Zhang, W.; Wang, Y.; Gu, Q.; Yin, L.; Yang, J. Rotordynamic Performance of the Interlocking Labyrinth Seal With a Tilting Rotor. J. Eng. Gas Turbines Power 2021, 143, 011012. [Google Scholar] [CrossRef]
- Zhang, W.; Gu, Q.; Cao, H.; Wang, Y.; Yin, L. Improving the rotordynamic stability of short labyrinth seals using positive preswirl. J. Vibroeng. 2020, 22, 1295–1308. [Google Scholar] [CrossRef]
- Sun, D.; Wang, S.; Xiao, Z.H.; Meng, J.G.; Wang, X.J.; Zheng, T.S. Measurement versus predictions of rotordynamic coefficients of seal with swirl brakes. Mech. Mach. Theory 2015, 94, 188–199. [Google Scholar] [CrossRef]
- Rong, X.; Zhu, H.; Hu, B. Performance Research and Structure Optimization of Labyrinth Screw Pump. Micromachines 2021, 12, 790. [Google Scholar] [CrossRef]
- Zeng, F.; Zhang, W.; Wang, Y.; Cao, X.; Zou, Z. Effects of Squealer Geometry of Turbine Blade Tip on the Tip-Leakage Flow and Loss. J. Therm. Sci. 2021, 30, 1376–1387. [Google Scholar] [CrossRef]
- Zhang, X.; Jiang, J.; Peng, X.; Zhao, W.; Li, J. Leakage reduction by optimization of hole-pattern damping seal with inclined hole cavity. Int. J. Heat Mass Transf. 2021, 169, 120924. [Google Scholar] [CrossRef]
- Zaniewski, D.; Klimaszewski, P.; Klonowicz, P.; Lampart, P.; Witanowski, Ł.; Jędrzejewski, Ł.; Suchocki, T.; Antczak, Ł. Performance of the honeycomb type sealings in organic vapour microturbines. Energy 2021, 226, 120242. [Google Scholar] [CrossRef]
- Szymański, A.; Wróblewski, W.; Bochon, K.; Majkut, M.; Strozik, M.; Marugi, K. Experimental validation of optimised straight-through labyrinth seals with various land structures. Int. J. Heat Mass Transf. 2020, 158, 119930. [Google Scholar] [CrossRef]
- Lu, B.; Xuan, H.; Ma, X.; Han, F.; Hong, W.; Zhi, S. The Influence of the Axial Rub Added in the Radial Rub on the Wear of the Seal Fins during the High Speed Rub of Labyrinth-Honeycomb Seal. Materials 2021, 14, 1997. [Google Scholar] [CrossRef]
- Chen, Y.; Li, Z.; Li, J.; Yan, X. Effects of tooth bending damage on the leakage performance and rotordynamic coefficients of labyrinth seals. Chin. J. Aeronaut. 2020, 33, 1206–1217. [Google Scholar] [CrossRef]
- Li, J.; Fu, X.; Yan, S. Simulation and Experimental Investigation of a New Type of Combined Seal Structure. J. Fluids Eng. 2021, 143, 051503. [Google Scholar] [CrossRef]
- Zhang, Y.; Li, J.; Ma, D.; He, Y.; Ji, J.; Sun, B.; Li, Z.; Yan, X. Experimental and Numerical Investigations on the Leakage Flow Characteristics of Helical-Labyrinth-Brush Seals. J. Eng. Gas Turbines Power 2021, 143, 041023. [Google Scholar] [CrossRef]
- Zahorulko, A.V.; Lee, Y.-B. Computational analysis for scallop seals with sickle grooves, part I: Leakage performance. Mech. Syst. Signal Processing 2021, 147, 107024. [Google Scholar] [CrossRef]
- Zahorulko, A.V.; Lee, Y.-B. Computational analysis for scallop seals with sickle grooves, part II: Rotordynamic characteristics. Mech. Syst. Signal Processing 2021, 147, 107154. [Google Scholar] [CrossRef]
- Campagnoli, E.; Desando, A.; Monterossi, M.P.; Rapisarda, A. Numerical and Experimental Analysis of Labyrinth Seals with Rhomboidal Cells. Appl. Sci. 2021, 11, 1371. [Google Scholar] [CrossRef]
- Wasilczuk, F.; Flaszynski, P.; Kaczynski, P.; Szwaba, R.; Doerffer, P.; Marugi, K. Air curtain application for leakage reduction in gas turbine shroud sealing. Aerosp. Sci. Technol. 2021, 112, 106636. [Google Scholar] [CrossRef]
- Tang, H.N.; Yao, H.; Wang, S.J.; Meng, X.S.; Qiao, H.T.; Qiao, J.H. Numerical simulation of leakage rates of labyrinth seal in reciprocating compressor. IOP Conf. Ser. Mater. Sci. Eng. 2017, 164, 012015. [Google Scholar] [CrossRef]
- Childs, D.W.; Wade, J. Rotordynamic-Coefficient and Leakage Characteristics for Hole-Pattern-Stator Annular Gas Seals—Measurements Versus Predictions. J. Tribol. 2004, 126, 326–333. [Google Scholar] [CrossRef]
- Hagquist, C.; Stenbeck, M. Goodness of fit in regression analysi-R-2 and G(2) reconsidered. Qual. Quant. 1998, 32, 229–245. [Google Scholar] [CrossRef]


| Parameters of Traditional Labyrinth Seal | Values |
|---|---|
| Rotor radius /mm | 30 |
| Radial clearance /mm | 0.2 |
| Cavity depth /mm | 3.5 |
| Cavity width /mm | 3.8 |
| Blade thickness /mm | 0.25 |
| Blade space width /mm | 2.3 |
| Number of blades | 10 |
| Parameters’ Name | Values |
|---|---|
| Thickness of diaphragm /° | 2 |
| Diameter of hole /mm | 1 |
| Number of diaphragm and holes | 36 |
| Turbulence model | Standard |
| Residual control | |
| Inlet pressure/bar | 6.9 |
| Outlet pressure/bar | 1 |
| Mass leakage differences between inlet and outlet boundaries/% | 0.01 |
| Whirl radius /mm | 0.01 |
| Whirl frequency /Hz | 0, 50, 100, 150, 200, 250, 300 |
| Rotation speed /rpm | 0, 1000, 2000, 3000, 5000, 7000, 10,000 |
| Values on Different Whirl Frequencies | |||||||
|---|---|---|---|---|---|---|---|
| 0 Hz | 50 Hz | 100 Hz | 150 Hz | 200 Hz | 250 Hz | 300 Hz | |
| a | −7.94 × 10⁻¹² ± 9.85 × 10⁻¹⁴ | −8.11 × 10− 12 ± 1.38 × 10− 13 | −7.72 × 10⁻¹² ± 1.80 × 10⁻¹³ | −5.46 × 10⁻¹² ± 3.54 × 10⁻¹³ | −4.96 × 10⁻¹² ± 4.37 × 10⁻¹⁴ | −4.50 × 10⁻¹² ± 1.01 × 10⁻¹⁴ | −2.89 × 10⁻¹² ± 1.66 × 10⁻¹² |
| b | −1.70 × 10⁻⁹ ± 1.11 × 10⁻⁹ | 6.84 × 10⁻⁸ ± 1.55 × 10⁻⁹ | 1.27 × 10⁻⁷ ± 2.02 × 10⁻⁹ | 1.55 × 10⁻⁷ ± 3.98 × 10⁻⁹ | 1.86 × 10⁻⁷ ± 4.91 × 10⁻¹⁰ | 2.02 × 10⁻⁷ ± 1.14 × 10⁻¹⁰ | 2.00 × 10⁻⁷ ± 1.86 × 10⁻⁸ |
| c | −4.71 ± 2.40 × 10⁻⁶ | −4.71 ± 3.38 × 10⁻⁶ | −4.71 ± 4.40 × 10⁻⁶ | −4.71 ± 8.65 × 10⁻⁶ | −4.71 ± 1.07 × 10⁻⁶ | −4.71 ± 2.48 × 10⁻⁷ | −4.71 ± 4.05 × 10⁻⁵ |
| 0.99998 | 0.99955 | 0.9997 | 0.99973 | 1 | 1 | 0.99806 | |
Publisher’s Note: MDPI stays neutral with regard to jurisdictional claims in published maps and institutional affiliations. |
© 2022 by the authors. Licensee MDPI, Basel, Switzerland. This article is an open access article distributed under the terms and conditions of the Creative Commons Attribution (CC BY) license (https://creativecommons.org/licenses/by/4.0/).
Share and Cite
Zhang, X.; Jiao, Y.; Qu, X.; Huo, G.; Zhao, Z. Simulation and Flow Analysis of the Hole Diaphragm Labyrinth Seal at Several Whirl Frequencies. Energies 2022, 15, 379. https://doi.org/10.3390/en15010379
Zhang X, Jiao Y, Qu X, Huo G, Zhao Z. Simulation and Flow Analysis of the Hole Diaphragm Labyrinth Seal at Several Whirl Frequencies. Energies. 2022; 15(1):379. https://doi.org/10.3390/en15010379
Chicago/Turabian StyleZhang, Xiang, Yinghou Jiao, Xiuquan Qu, Guanghe Huo, and Zhiqian Zhao. 2022. "Simulation and Flow Analysis of the Hole Diaphragm Labyrinth Seal at Several Whirl Frequencies" Energies 15, no. 1: 379. https://doi.org/10.3390/en15010379