Article

Industry Survey on the Current State of Stope Design Methods in the Underground Mining Sector

Department of Civil Engineering, School of Engineering, Aalto University, 00076 Espoo, Finland
*
Author to whom correspondence should be addressed.
Energies 2022, 15(1), 240; https://doi.org/10.3390/en15010240
Submission received: 24 November 2021 / Revised: 16 December 2021 / Accepted: 25 December 2021 / Published: 30 December 2021

Abstract

:
Stope design is a core discipline within mining engineering. This study analyzes the current state-of-the-art of stope design through a survey addressed to mining industry professionals. In stope design research the dominance of empirical methods has slowly shifted towards numerical methods. Recent advancements have mostly focused on the development of stope optimization algorithms. The survey consisted of 19 questions and was distributed to stope design experts via email, LinkedIn messages, and the Mining Industry Professionals network forum. In total, 36 responses of satisfying quality from 20 countries were received and analyzed. No dominance of a single stope design method was recognized. Empirical methods and personal expertise are still used widely. However, a readiness for change in stope design practice was indicated in 87% of responses. The current needs of the stoping-based underground mining sector are to increase the amount of geotechnical data, automate stope design and implement related software, and integrate these into general mine planning. According to 70% of the participants, acquired geotechnical data should be available within three days to be employed in design practice. The industry is ready to implement more efficient stope design methods if they offer results proven in case studies.

1. Introduction

Underground mining operations are progressing into deeper and increasingly more complex deposits, associated with more challenging geological conditions, while the demand for minerals and metals continues to grow rapidly. Additionally, ore grades are decreasing, and thus, valuable metals will more likely occur as refractory or trace minerals in future mining operations [1]. With the goal of transforming the mining industry into a more sustainable one, the necessity to utilize mining methods with limited impact on the surface is becoming ever more urgent. To satisfy this need, the application of non-caving underground mining methods offers a convenient solution and presents a promising prospect for increasing the importance of these mining methods for the mining industry. Brady and Brown [2] divide mining methods into three main categories: pillar supported, artificially supported and unsupported. Each category is further divided into specific mining methods with varying degrees of rock mass response to mining. The pillar and artificially supported, so-called stoping-based, mining methods, with no or very limited subsidence, are the solutions of choice for the future challenges of the mining industry [3]. The lack of visible environmental damage from these mines allows for a more positive public perception of the mining industry. These stoping-based mining methods rely on diving the orebody into stopes for ore production and have already become amongst the most common methods in modern underground mining. This is due to their inherent operational safety, reliable design, and cost efficiency [4]. Therefore, this study focuses on stoping-based mining methods. Additionally, increasingly challenging geological conditions can potentially result in more hazardous working environments. To prevent this, adequate consideration during mine planning and design are deemed necessary [5]. Stoping-based mining methods are prone to dangers related to instability of the surrounding rock mass. This creates a considerable danger to both people and equipment [6]. Thus, stoping-based mining methods are reliant on adequate estimations of the stability of the rock mass in which they are applied, to allow their application. This condition results in considerable efforts being applied to enable reliable estimations, predictions and dimensioning of the stopes to be mined.
Empirical methods have been used in geomechanics since their development in the 1970s. Most commonly they are used for preliminary design in the early stage of mining [7,8,9,10]. The empirical methods include, but are not limited to: rock mass rating (RMR) system [11], Q-system [12], geological strength index (GSI) [13], mining rock mass rating (MRMR) system [14], Laubscher block caving rules [15], hard rock pillar design chart [12,16], and the tributary area method for naturally supported mining. A comprehensive overview of the most common empirical methods within geomechanics can be found in [7]. For stope design, empirical methods can be grouped within three commonly used design methods [17], the stability graph method and its adaptations [18], the Hoek and Brown failure criterion [19,20], and the span design graph [21,22]. The most well-known empirical method for stope design is the stability graph method. Over time, several issues have been identified as intrinsic to the stability graph (e.g., limited database entries) [23,24]. Thus, the original stability graph was extended, modified, and the underlying system adapted to different needs and challenges of stope design, for various mining methods, mine environments, and geological conditions [25,26,27,28,29,30,31,32,33,34,35,36,37,38,39,40,41,42,43,44,45]. The Hoek and Brown failure criterion is an empirical failure criterion that has undergone repeated revisions since its introduction in the 1980s [19,46,47,48,49,50]. Even though it is an effective tool for estimating the strength of jointed rock masses, there is a high degree of uncertainty of estimations related to the evaluation of in situ rock mass conditions being heavily reliant on subjective interpretation of qualitative guidelines [51]. The span design graph [21,22] method relies on comparing rock mass data and geometry of stope designs to case histories and uses the RMR76 (rock mass rating) system. The RMR76 classification is plotted against the desired span while considering, in a rudimentary way, the joint orientations and stress levels. One of the most recent developments in empirical methods was the creation of novel empirical software that enables the creation of regional and mine specific case studies [43].
Numerical modeling methods for modeling underground stopes have become ever more important with the advancements in computing power which allows numerical modeling of the behavior of rock mass for increasingly complex scenarios [44,45,46,47,48,49,50,51,52,53,54]. Both continuum-based [55,56,57,58,59], and discrete numerical methods [60,61,62,63,64,65] are used in stope design. An important advancement in numerical approaches to stope design is the ability to simulate jointed rock masses to analyze stope stability [66,67]. Stability analysis of stopes is based on the characteristic mechanical properties of jointed rock masses. Therefore, deformability and strength of a fractured rock mass must be evaluated first. The simplest approach is to use the equivalent continuum (EC) method to estimate strength and deformability properties, using empirical, analytical, or numerical methods and to up-scale them for the region of interest [68]. In a more comprehensive approach, geometrical fracture properties are characterized by field mapping, geostatistical, and geophysical methods [69,70,71,72] or remote sensing [73,74], and the mechanical properties of both intact rocks and rock discontinuities are measured in the laboratory or field. This enables large-scale modeling and stability analysis of multiple stopes, and the stability of each stope can be analyzed by numerical deterministic or probabilistic approaches e.g., [75,76,77]. Another approach for formulating a fractured rock mass model uses explicitly defined discontinuities with properties back-calculated using in situ measurements and the EC method for the surrounding rock mass. This can allow for efficient modeling of the whole mine and stope optimization [78]. Another method implemented numerically is the back-analysis method for stope design aimed at analyzing how previous stope designs behaved compared to their expected behavior. This allows for a reconciliation process, where the results from back-analysis are used to adapt the design of future stopes [79].
Recent research related to stope design has not advanced to the same extent as research in other mining-related areas [80,81,82,83]. The research is mainly focused on optimization of stope boundaries, production schedule, and development activities [9]. An overview of specific research topics with a selection of featured research papers is given here:
  • The incorporation of grade uncertainty and minimization of associated risk on stope design optimization [84,85]
  • Iterative cut-off grade optimization [86,87]
  • Integration of stope design into mine planning [88,89]
  • Empirical software to create deposit-specific case studies [43,44]
  • Integration of real-time instrumentation and risk assessment [90]
  • Finding novel mining methods that allow for facilitated optimization methods [91]
  • Big data analytics in mining geomechanics [92]
  • Machine and deep learning methods for prediction and classification of stope designs [93,94]
  • Stope sequencing optimization [95]
  • Improvements in the efficiency of stope optimization algorithms [83]
Many studies have focused on stope design optimization algorithms due to the larger computing power available [96,97,98,99,100,101,102,103,104,105,106,107,108,109,110]. The first group of stope optimization algorithms is level-oriented algorithms that are applied at the single mine level, including Riddle dynamic programming [111], the branch and bound method [99,100], mixed integer programming [84], optimum limit integrated probable stope (OLIPS) [112,113,114], and the global optimization for underground mining area (GOUMA) algorithm [115]. The second group is field-oriented algorithms where the entire mining area is considered for the determination of mining limits, including the floating stope algorithm [103,116], multiple pass floating stope process (MPFSP) [101], maximum value neighborhood method, nested stopes [104], heuristic approaches [97,106,117,118], network flow method [119], octree-division [120], and integrated method [88]. However, the transition from algorithms working in 2D towards algorithms realizing a truly 3D optimization is still advancing as there are only a limited number of 3D algorithms available [83]. A wide variety of underground mine planning and optimization software tools have been implemented recently [121]. In general, the recent developments can be understood as a growing trend towards developing new software tools to overcome problems in design, scheduling and optimization. Software for stope design and mine planning and their working principles are explained in more detail in [121].
Even though a large amount of stope design research on various aspects is published in the literature, the level of implementation of this research in the mining industry is not clear. No existing study has been found in the literature that addresses this problem. Therefore, this study aims to adequately identify the degree of stope design research implementation in the mining industry and to characterize the most urgent challenges related to stope design. Thus, a questionnaire, following principles of questionnaire design and statistical science [122,123], was created and responded to by mining industry professionals who work with stope design. The key value of this work relates to the assessment of the current research focus on the one hand, and the identification of industry needs on the other, as well as the relationship between these.

2. Methodology

2.1. Questionnaire Development

The WebRoPol electronic survey system [124] was utilized for the development of the questionnaire. This allowed for the creation of various interactive features and facilitated the distribution of the questionnaire, as well as enabling evaluation of the results.
The questionnaire consisted of 19 questions with multiple choice and free answer options addressing 19 topics (see Table 1) and was designed based on state-of-the-art survey methodology [123]. The design adhered to scientific survey principles, such as balanced multiple-choice response options, non-mandatory responses, randomized answer option order, and use of a multilayer funnel approach. The questionnaire started with general questions, evolving into detailed questions about stope design. While each question required specific responses, each question also allowed for detailed free-text answers. The questionnaire was represented on several small pages, based on specific topics. To minimize information overload, additional answer options were only shown when the previous option was selected.

2.2. Questionnaire Target

The Mining Intelligence database [125] was drawn from to create a database containing 250 international mines that use stoping methods. The database created included continent, country, commodity, mining method, owner, and contact information (if available). Once the population size for the survey had been estimated (250 mines), the aim was to contact as many of the mines as possible to exceed the target sample size needed to represent the population adequately. Following the principles of survey science, the desired sample size was estimated according to the following formula [126]:
Sample   Size = z 2 × p ( 1 p ) e 2 1 + ( z 2 × p ( 1 p ) e 2 × N )
where N = population size, e = margin of error, z = z-score (standard deviation), and p = expected proportion. With a confidence level of 90% and a margin of error of 14%, with a population size of 250, this resulted in the estimated sample size desired to exceed 31 responses.

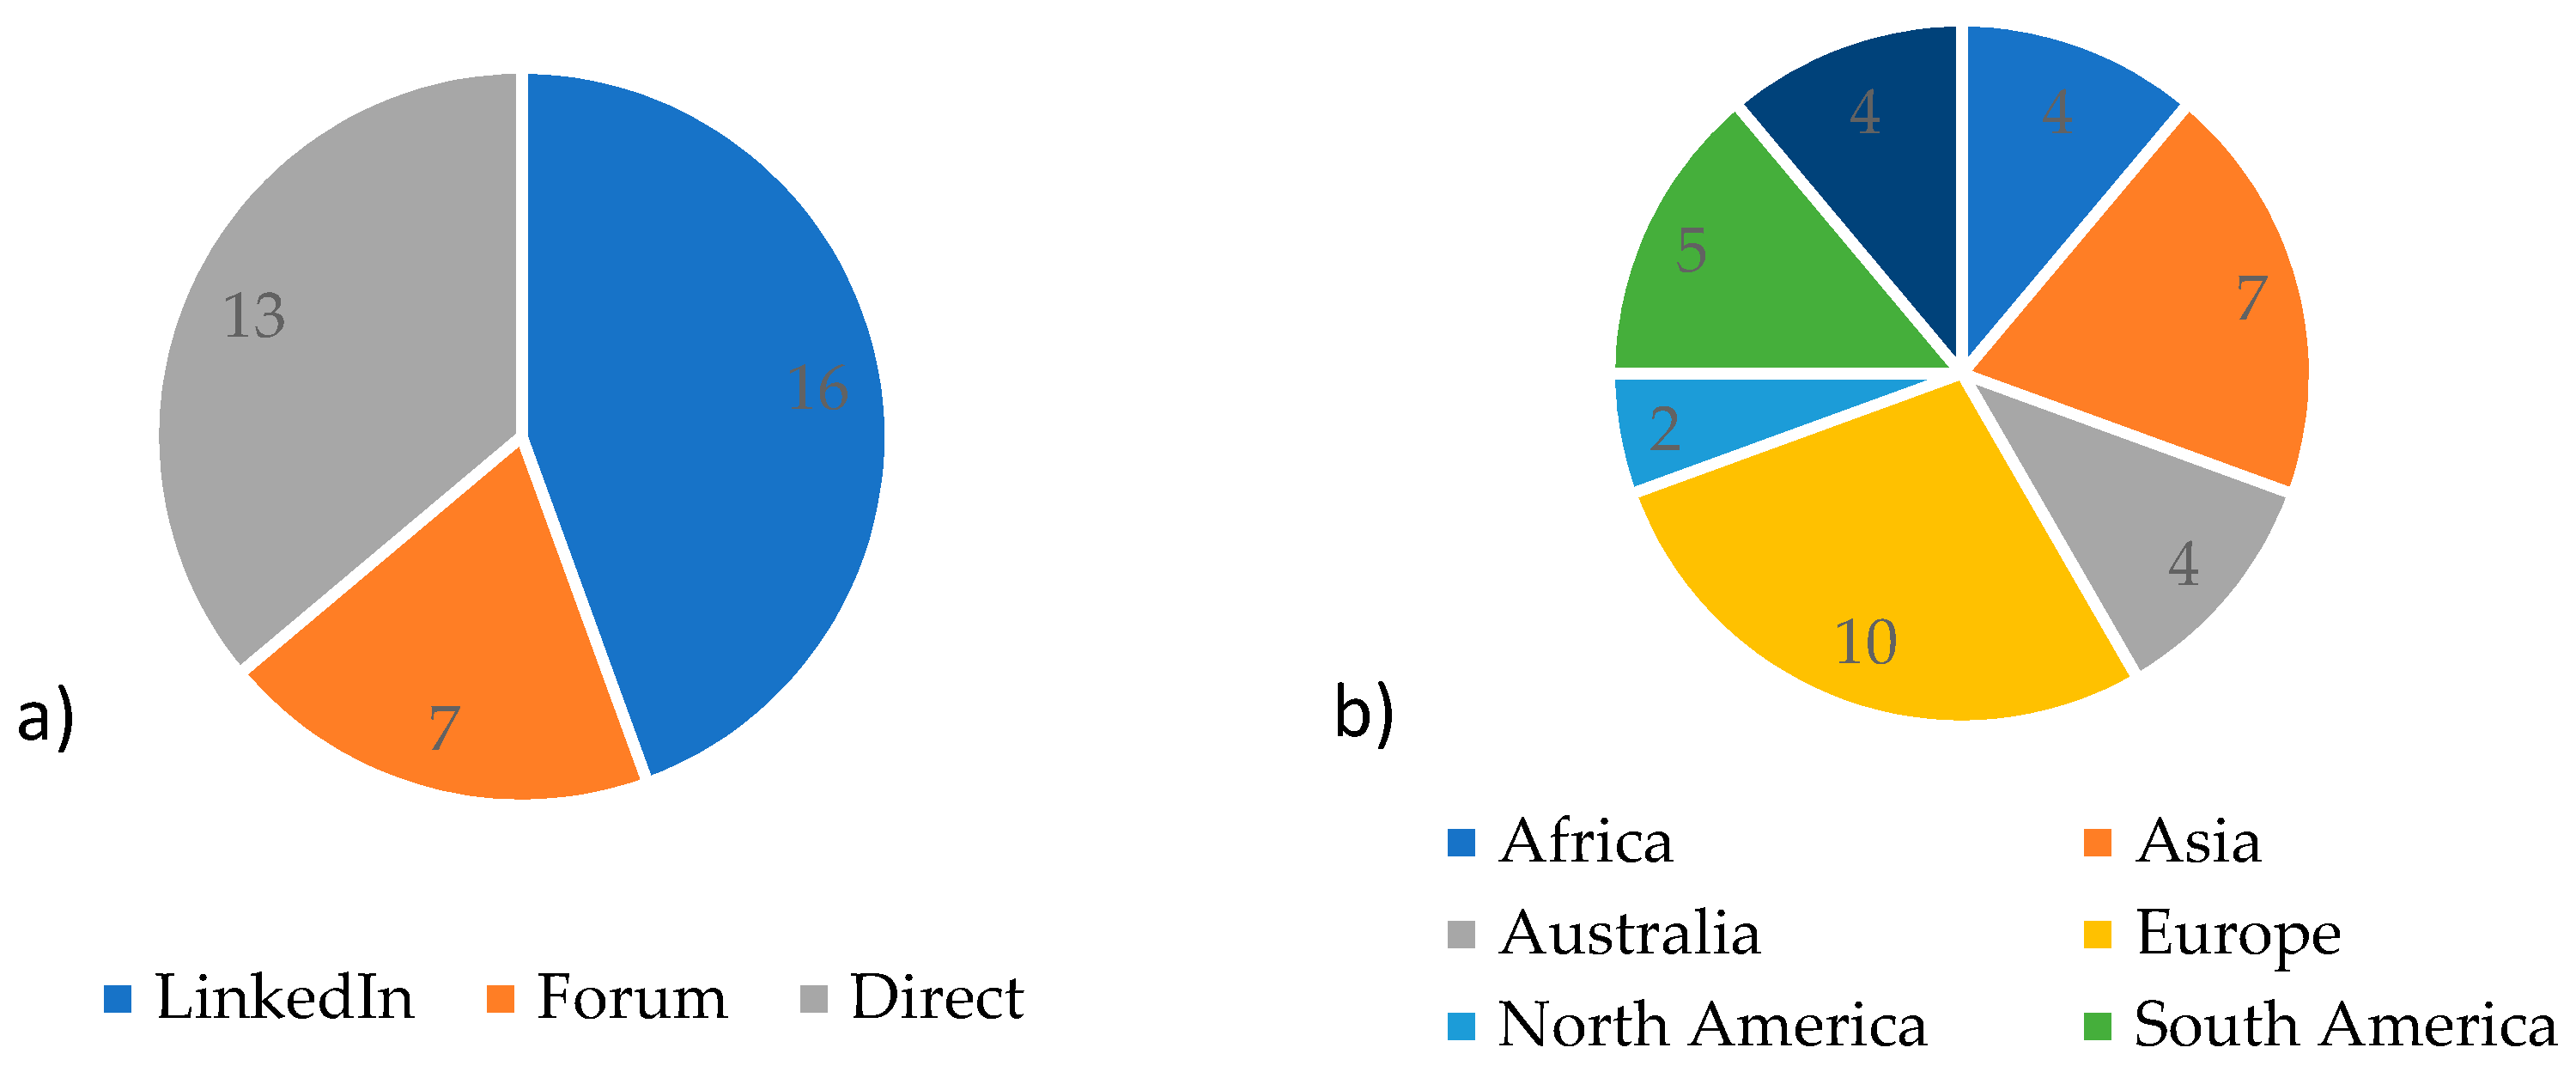
2.3. Participant Details

About 1000 potential participants were identified and contacted, and about 500 persons received an invitation to participate in the survey. Additionally, the survey invitation was advertised on the Mining Industry Professionals network forum on the LinkedIn platform. The invitation to the survey was additionally featured in LinkedIn’s June 2019 newsletter of the Mining Industry Professionals network with about 300,000 members. To allow for tracing which form of contact delivered the best results, the survey was split into three groups (direct contact via emails, LinkedIn messages, and Mining Industry Professionals network forum on LinkedIn platform). In total, approximately 500 people were contacted, and a total of 36 responses were gathered. Therefore, the targeted sample size of 31 was exceeded by 16% and was considered a good representation of the studied population.
The survey was undertaken between May and July 2019. Due to the creation of different response origin sub-groups, it was possible to analyze where most responses originated, and which form of contact achieved the best results. The origin of the respondents by contact form and region can be seen in Figure 1. Mines from all continents were represented with the most answers received from European mines. However, the participants from Europe represented Nordic mines that are technologically advanced. A broad variety of different areas of expertise of respondents was achieved; the job titles of the respondents covered a broad range including mine managers and mining engineers, rock mechanics engineers, geotechnical engineers, project engineers, and geologists. The participants represented mines of varying sizes and commodities, such as gold, silver, copper, zinc, and lead. The annual ore production amongst survey respondents ranged between 0.2 Mt to 10.7 Mt with an average of 1.8 Mt.
The responses from participants contacted via LinkedIn messages showed the highest response quality, while the responses from the Mining Industry Professionals network forum showed the longest average response times. A more detailed survey description is given in [127].

3. Results of Stope Design Survey

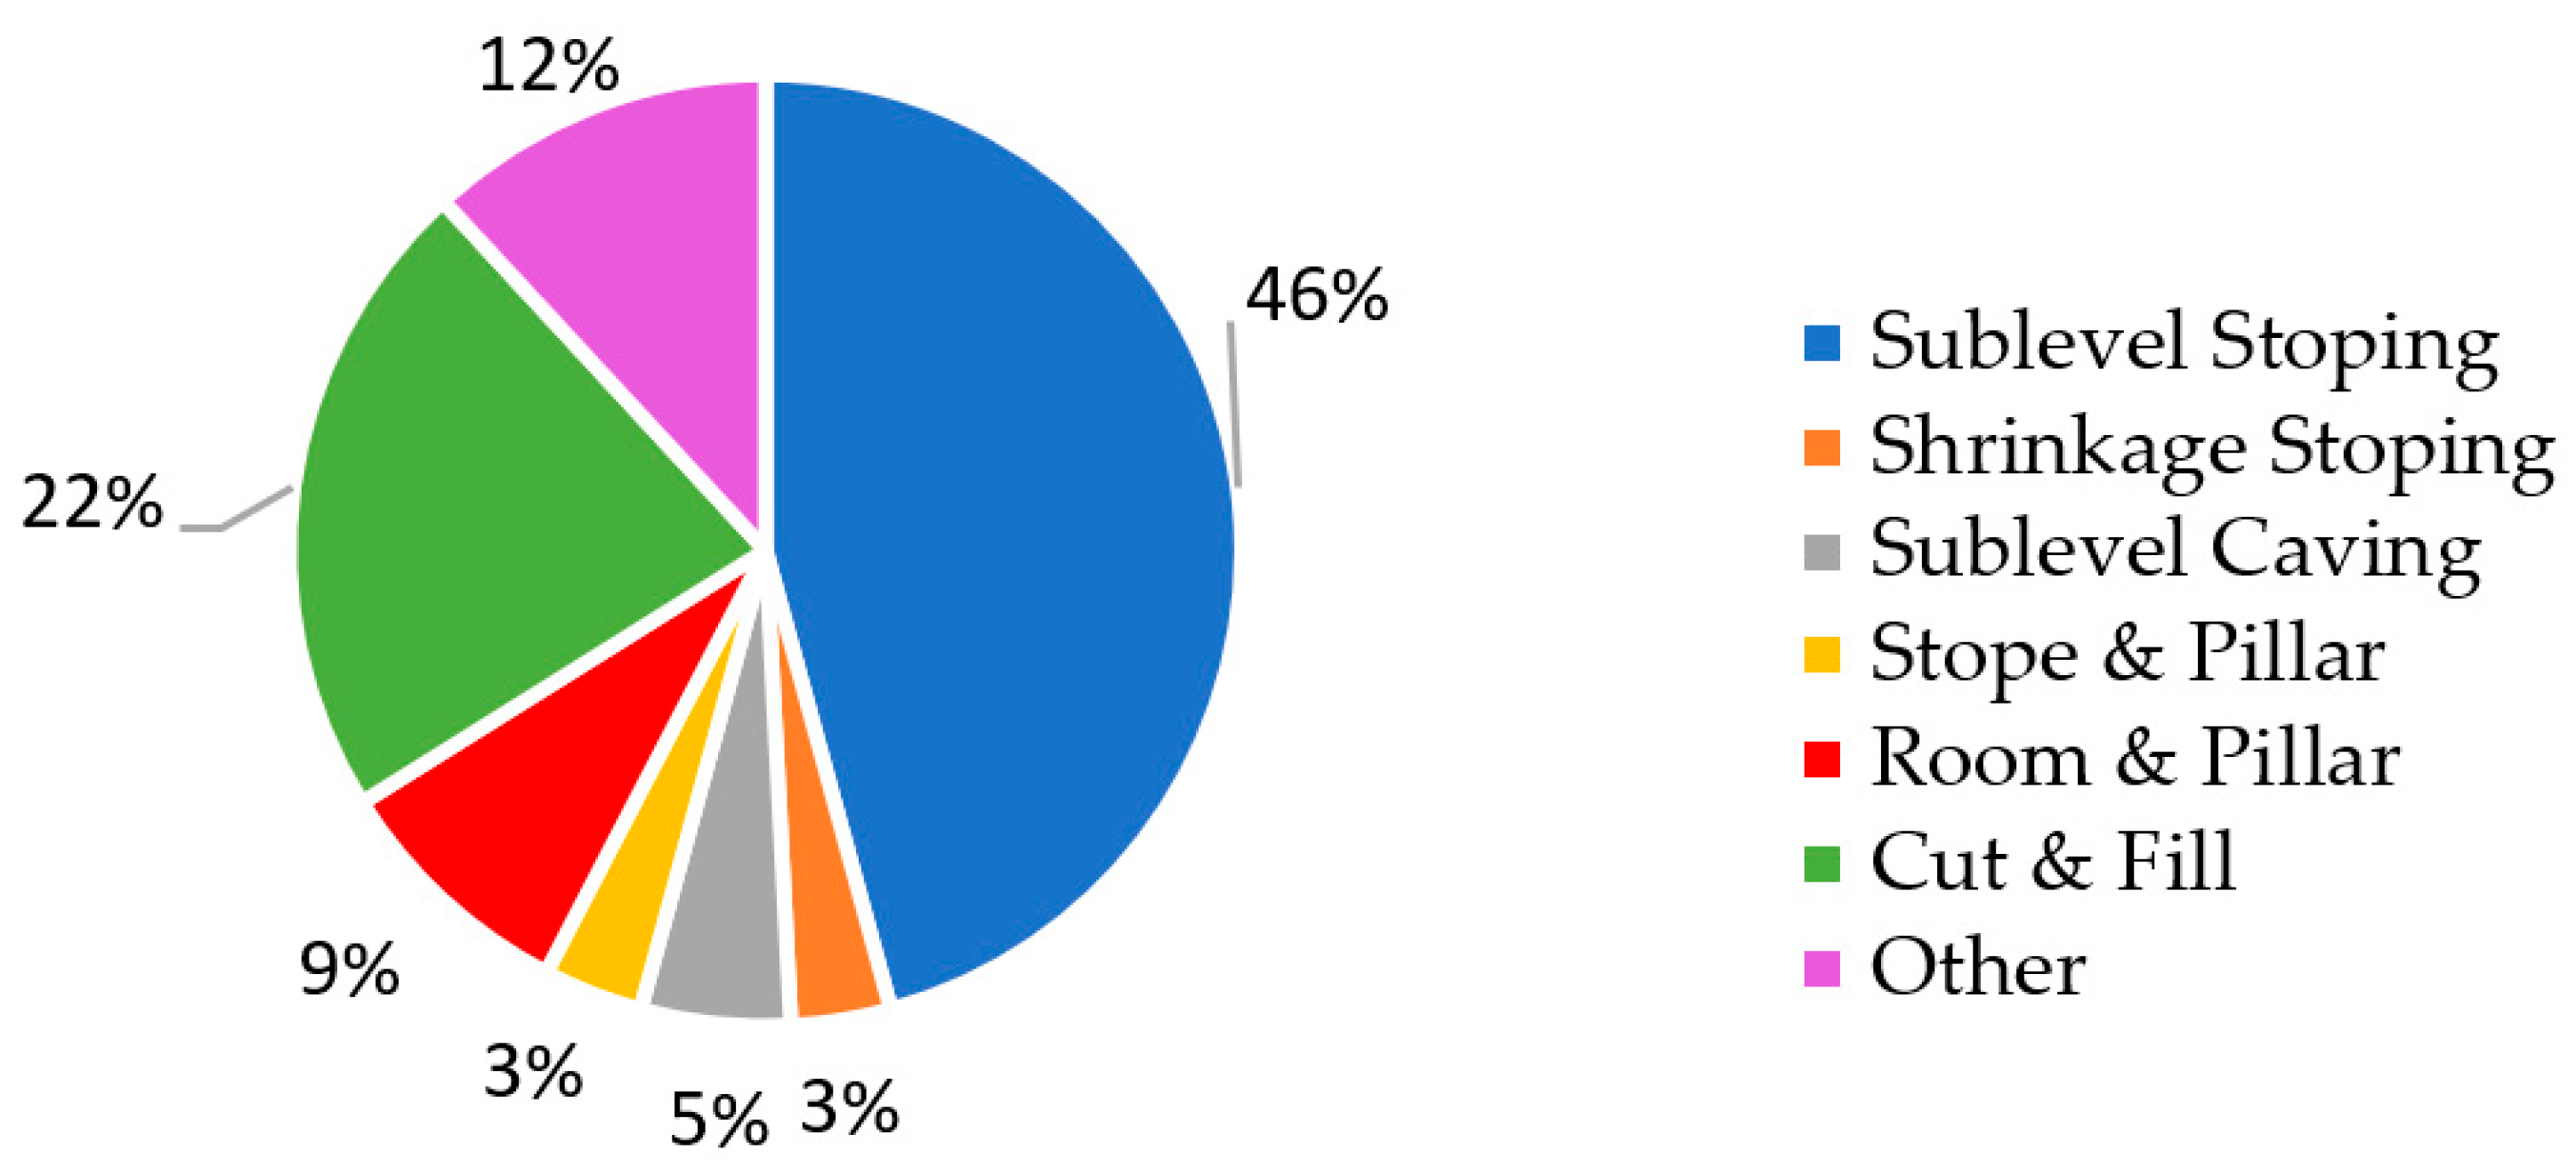
3.1. Applied Mining Methods

The distribution of the applied mining methods is illustrated in Figure 2. The survey shows a strong dominance of the sublevel stoping mining method, with approximately 46% of the responses reporting it as their applied mining method, followed by cut and fill with 22% of the responses.
To enable improved insight into the consistency of the applied mining methods, whether the currently applied mining methods had been used since the beginning of the life of the mine or changes had been applied to them was assessed. Figure 3 shows that changes in the mining method were reported in 69% of the responses. The reasons for the changes in the applied mining methods varied between economic, geological, technical, and geotechnical factors.

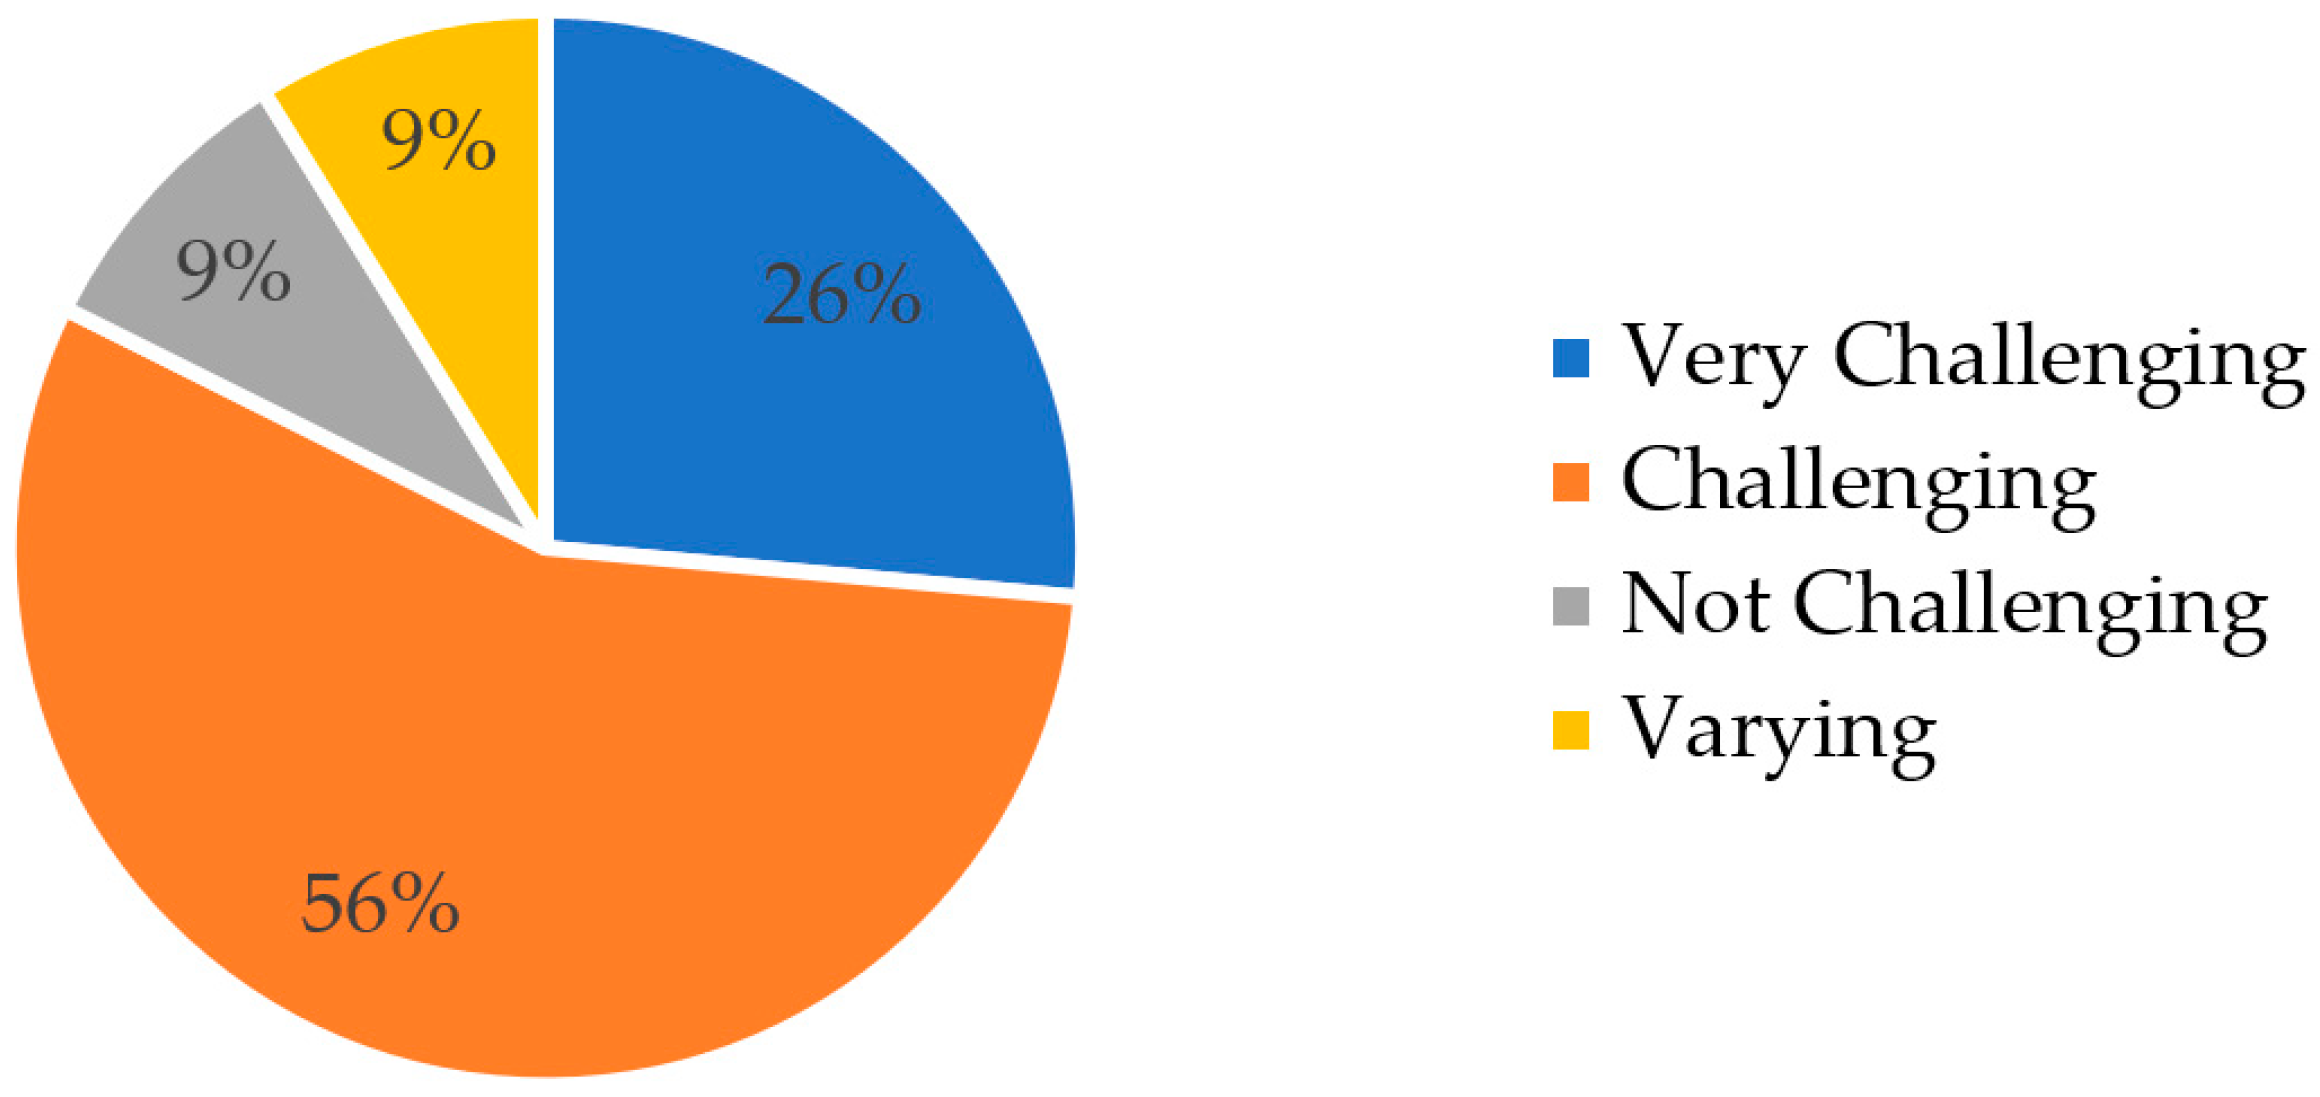
3.2. Geological Conditions

The mining professionals were asked to evaluate the geological conditions in their mines. More than 80% of the respondents described their mine’s geological conditions as “challenging” or “very challenging” (Figure 4).

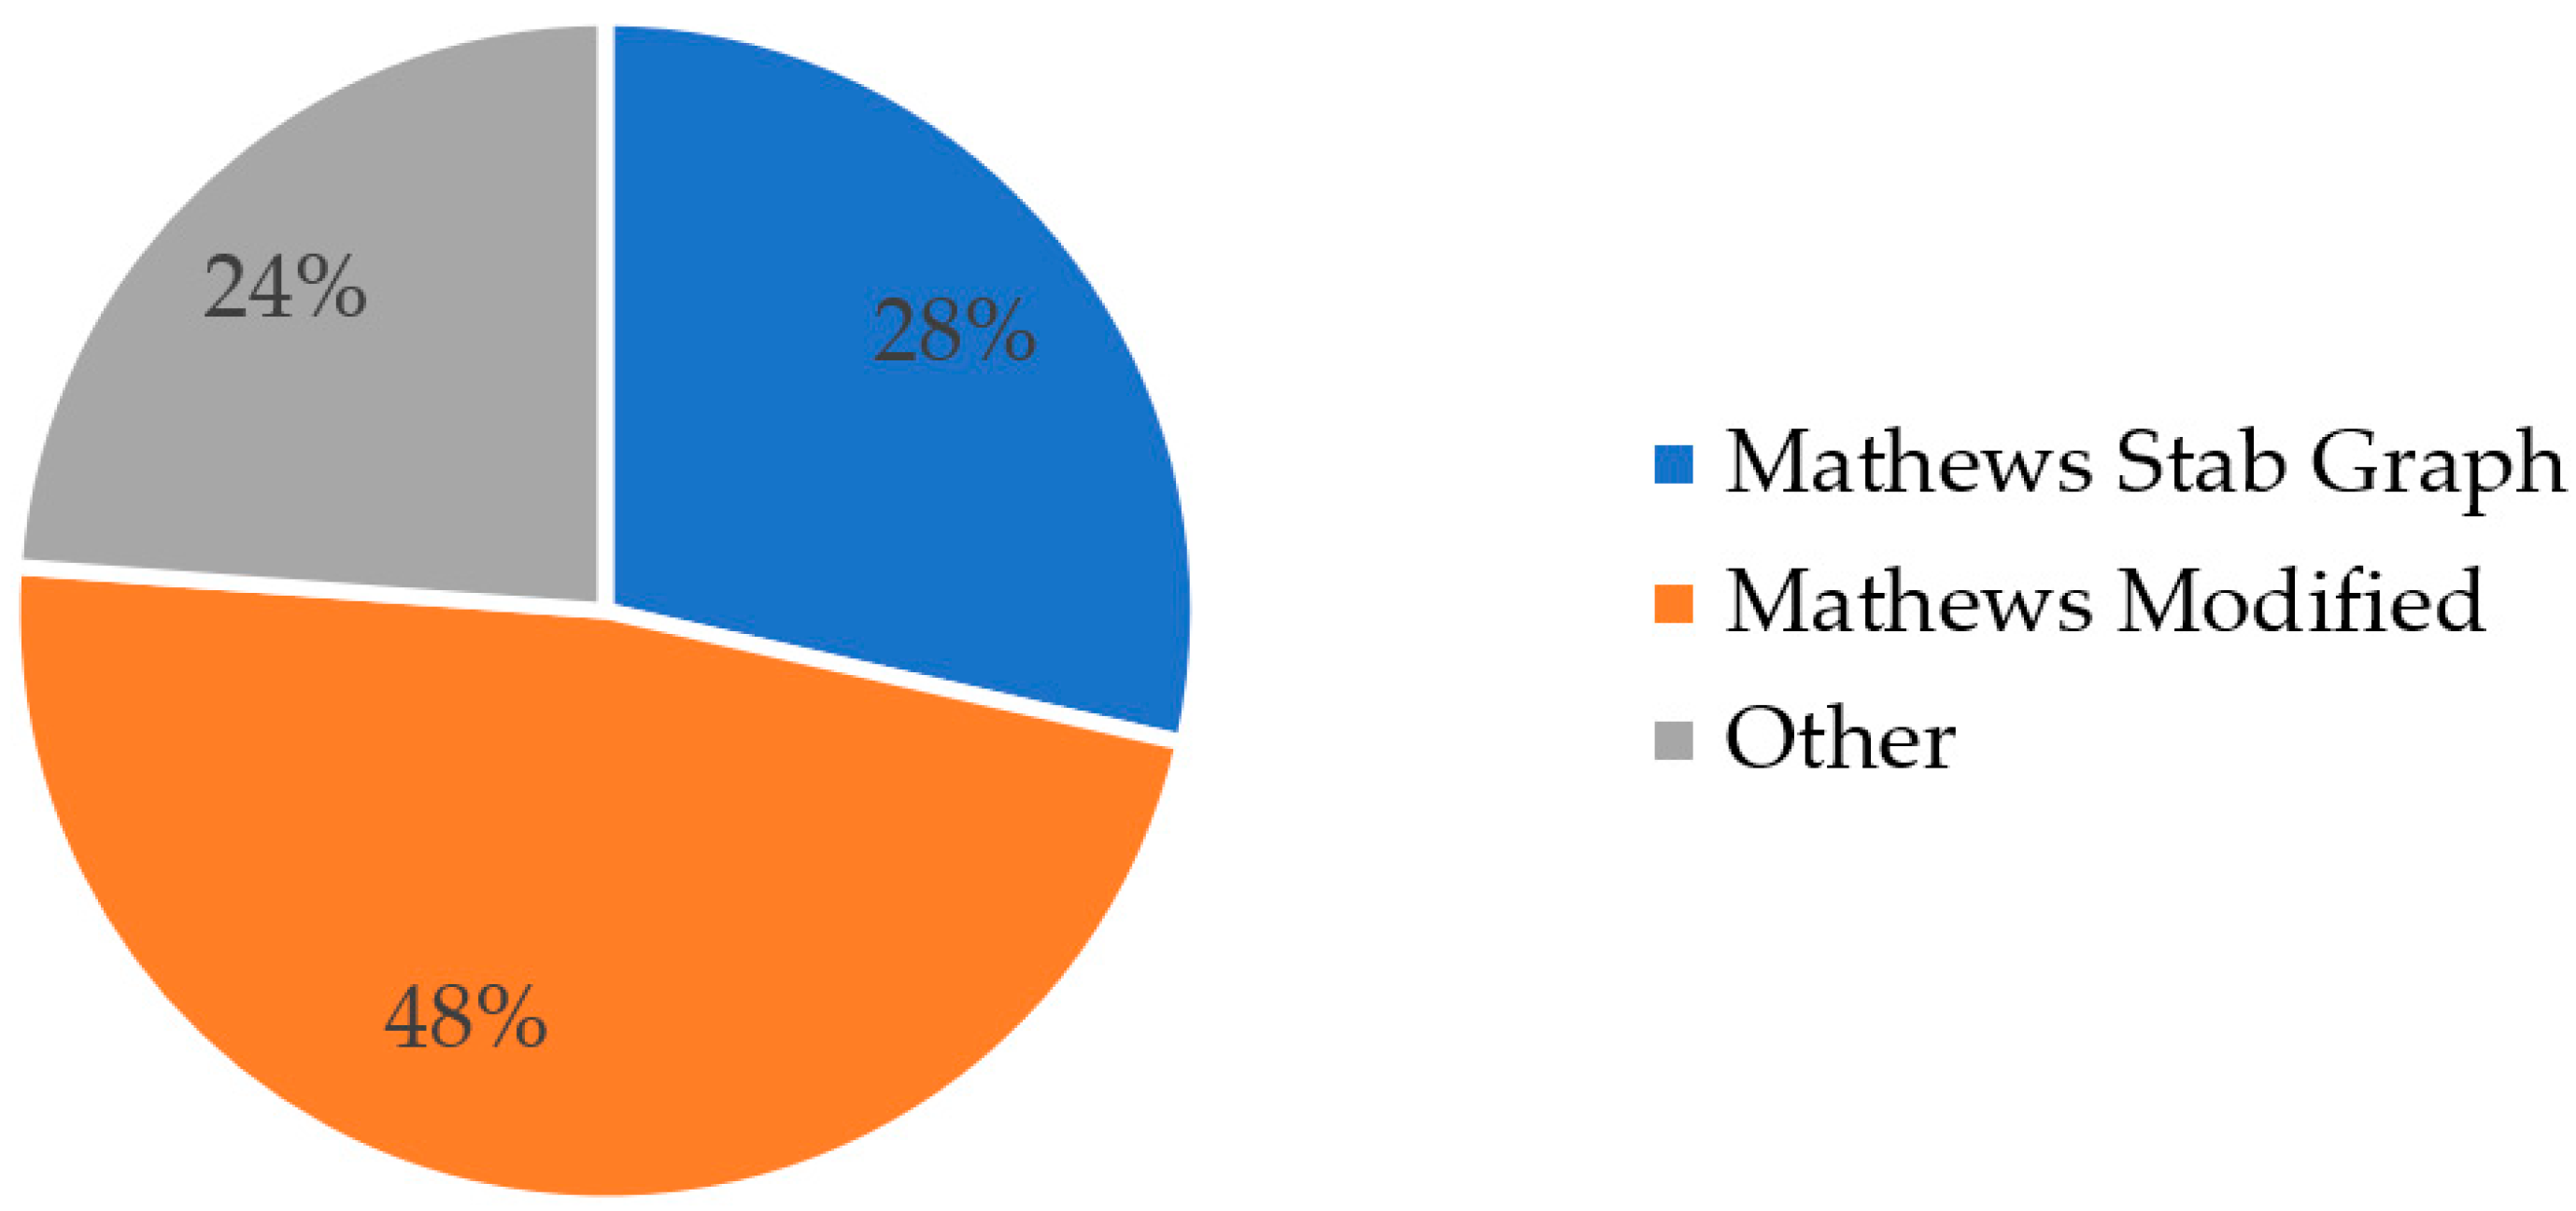
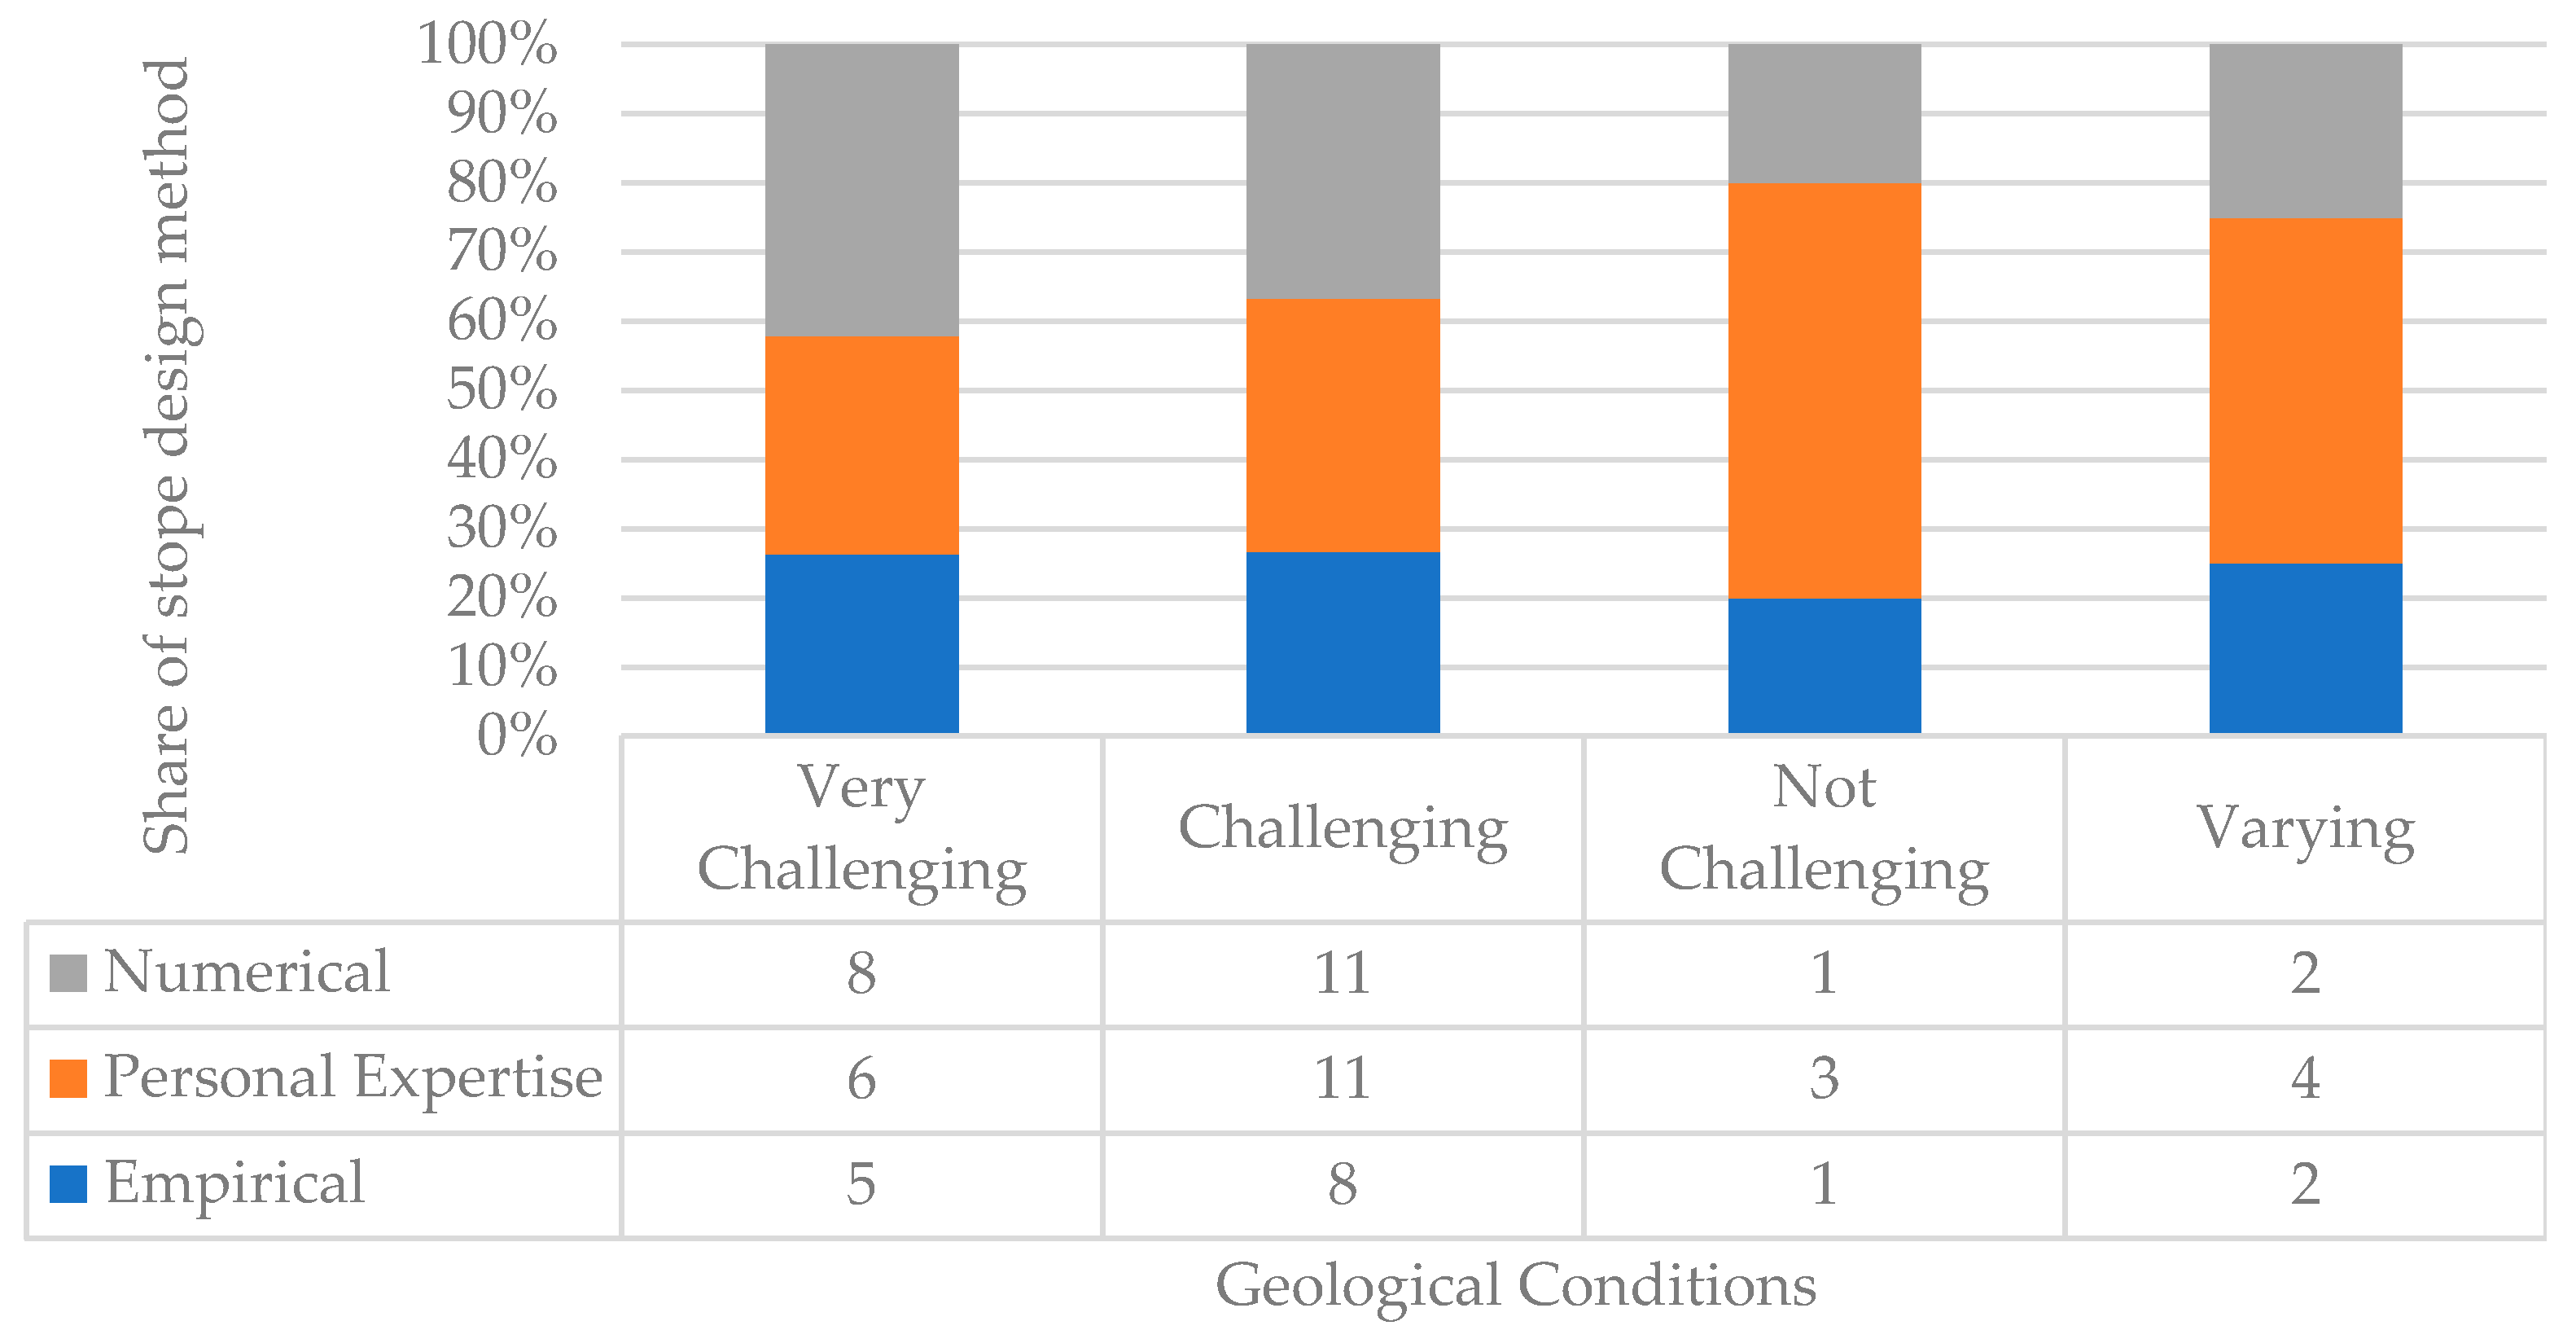
3.3. Stope Design Methods

Concerning the various methods for stope design, it was important to assess which of these were utilized in the industry. As shown in Figure 5, personal expertise and numerical methods represented a significantly higher proportion than empirical methods.
The empirical methods used were mainly limited to the application of Mathew´s stability graph or the modified Mathew´s stability graph and utilization of the rock mass rating system (Figure 6). Personal expertise was utilized in the form of a broad variety of personnel from different disciplines including mine planners, drill and blast engineers, geologists, specialists in rock mechanics, and mining and geotechnical engineers. Commonly, they utilized their personally acquired experience within specific geological settings. This can be viewed as a personal empirical approach.
The most utilized software in stope design were Micromine, Map3D, Surpac, Maptek Vulcan, Gantt Scheduler, Deswik (Microstation), Auto Stope Designer and Stope Optimizer, Rocscience (RS2, Slide, Phase2, Examine, DIPS, Unwedge and CPillar) and Recursos Mineros. Quantifiable values are not available here since these methods were only assessed in the free-text answers. Of note is that no participants mentioned any of the ITASCA software, such as FLAC, UDEC or 3DEC, that are widely used for rock mechanical numerical simulations.
Figure 7 illustrates in which state of mining the principal stope design was carried out. It is to be noted, that an iterative approach (stope design applied at multiple stages) was executed by only 6 respondents.
The survey respondents were asked how long it took to design stopes. Figure 8 provides an overview of the duration of the stope design process. Based on the survey, stope design mainly required less than a week; some stopes though were reported to be designed as quickly as in a matter of minutes, whereas other responses stated several weeks. The relationships between stope size and geological complexity and the time needed to perform stope design were frequently mentioned as important influencing factors.
An additional aspect of stope design is the number of people involved in the process. The average number reported was three, though numbers as low as a single person and a maximum of 15 people were reported. Several responses indicated that the number of people involved depends on how much of the previous planning work was counted as part of the stope design process.
Finally, respondents were asked to rank parameters influencing stope design (Figure 9). Cutoff grade and dilution were reported as the most important parameters, though no single factor was of outstanding importance. Several additional factors were stated to have a considerable influence on stope design, though these cannot be assessed quantitatively as they were provided as individual free-text answers. These factors were: productivity, ventilation, mining cost, sequencing, drill and blast, flexibility in mine planning, rock mass, labor efficiency, selective mining unit (SMU), and safety. A discussion of these factors is not provided here, but they should be considered important factors sometimes affecting stope design.

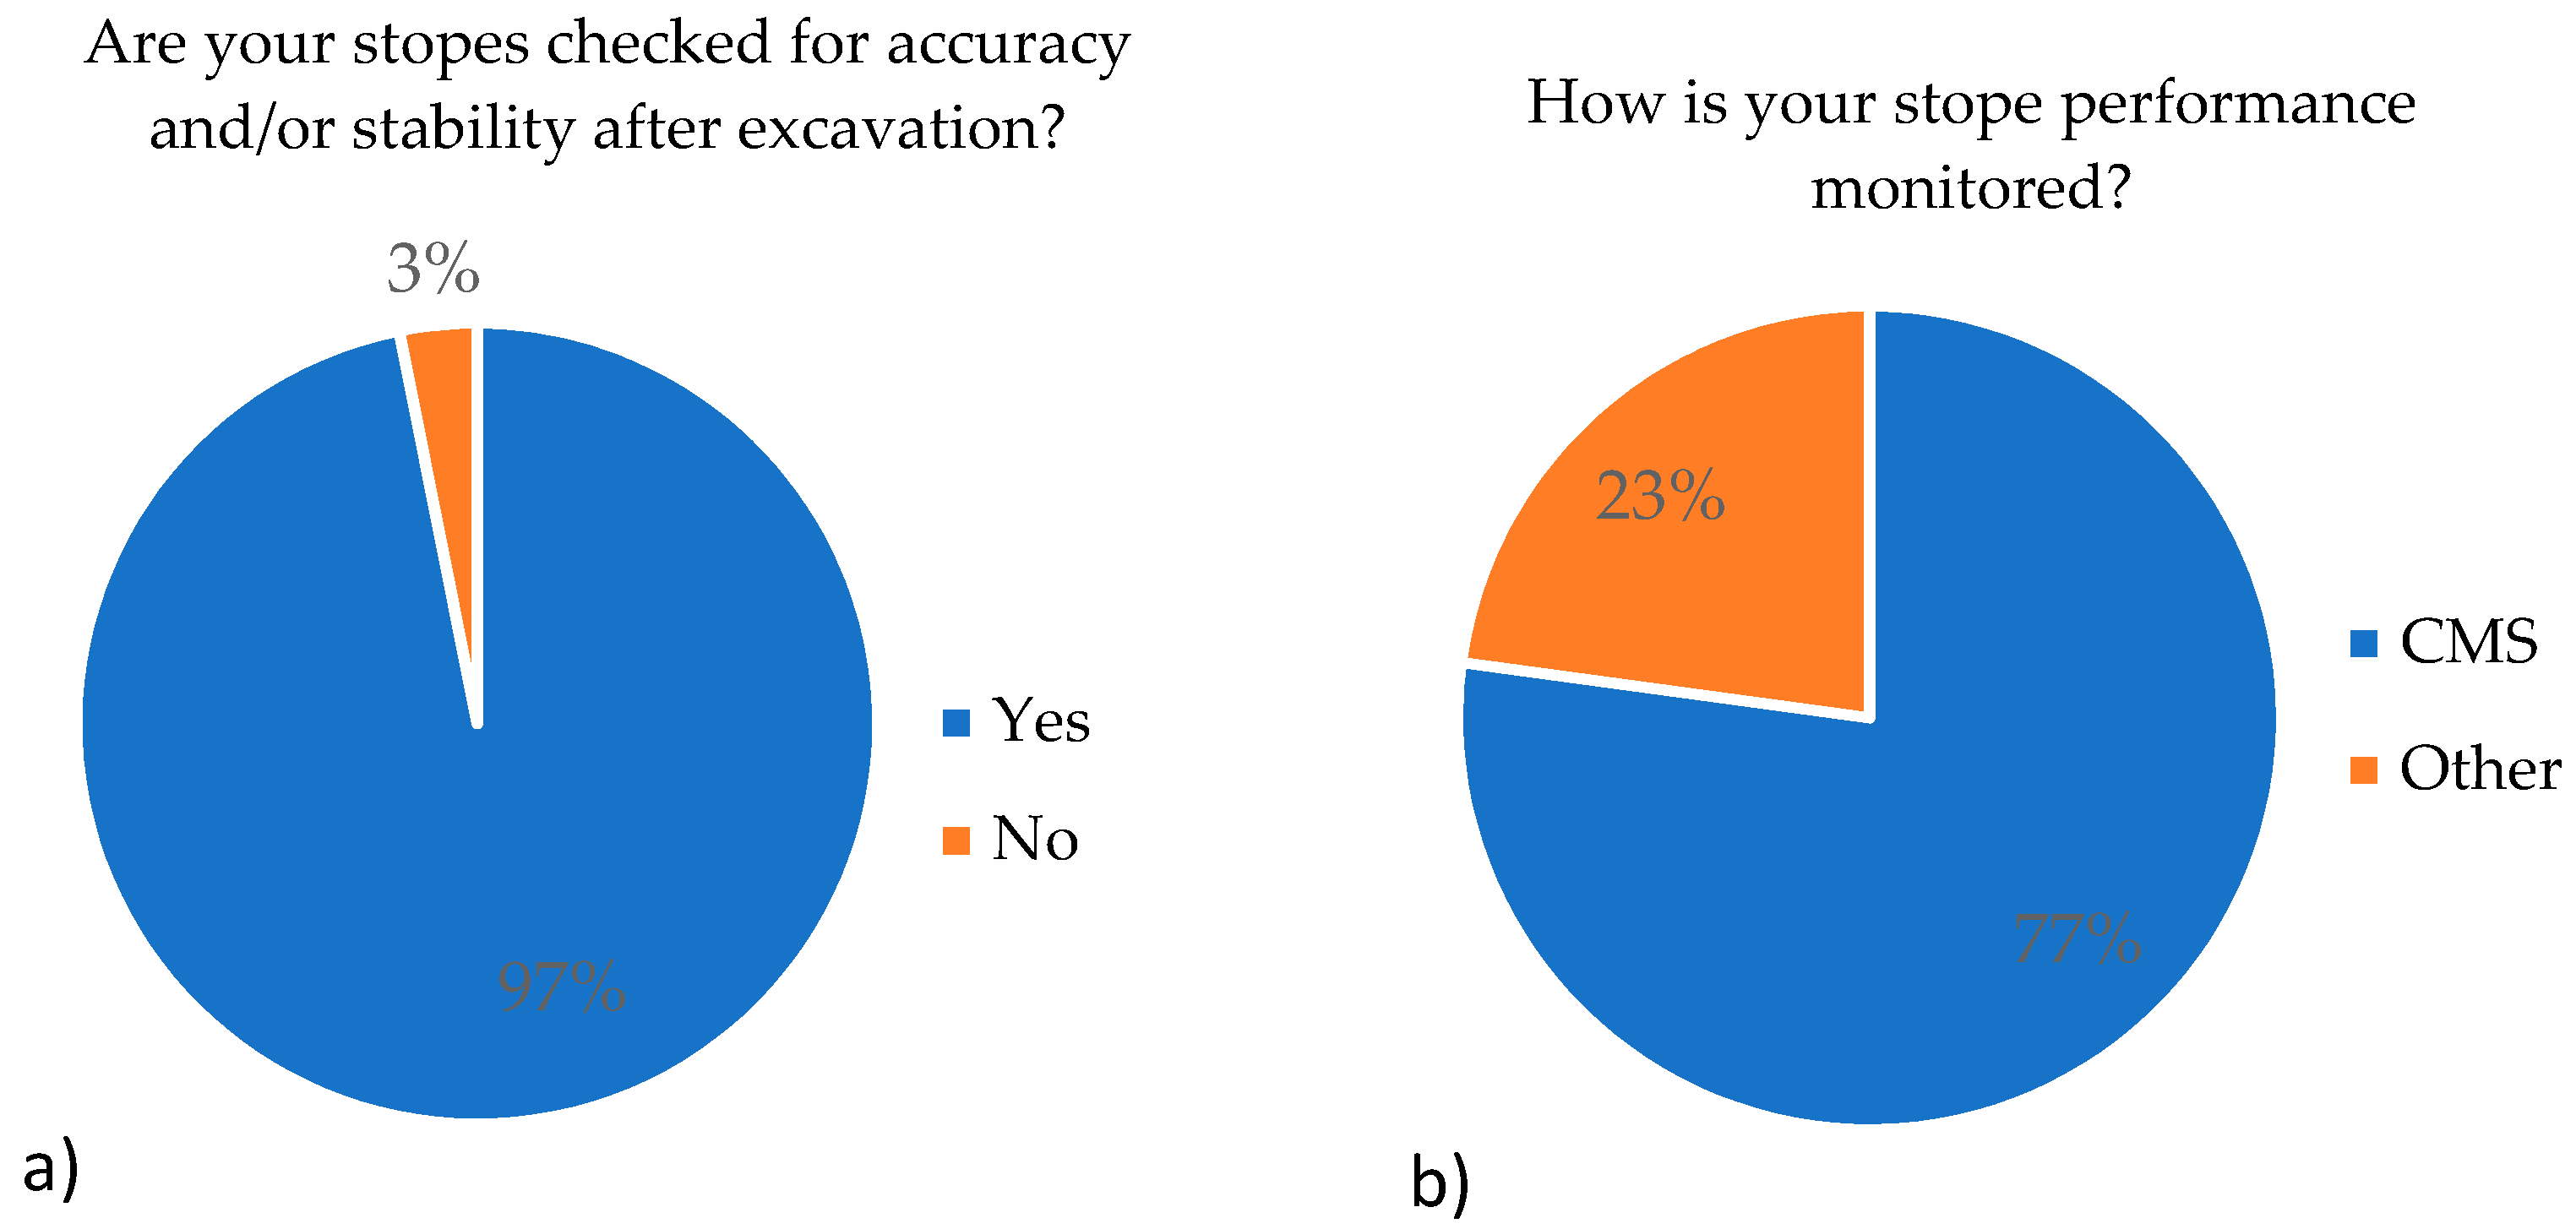
3.4. Stope Performance

The prevalence of stope stability monitoring is shown in Figure 10. According to the survey, almost all (97%) respondents stated that stability monitoring occurred, most often (77%) using cavity monitoring systems (CMS). The other methods used relied on comparing planned and mucked tons, visual inspections, seismic controls, borehole extensometers, and laser scanning with point cloud data.

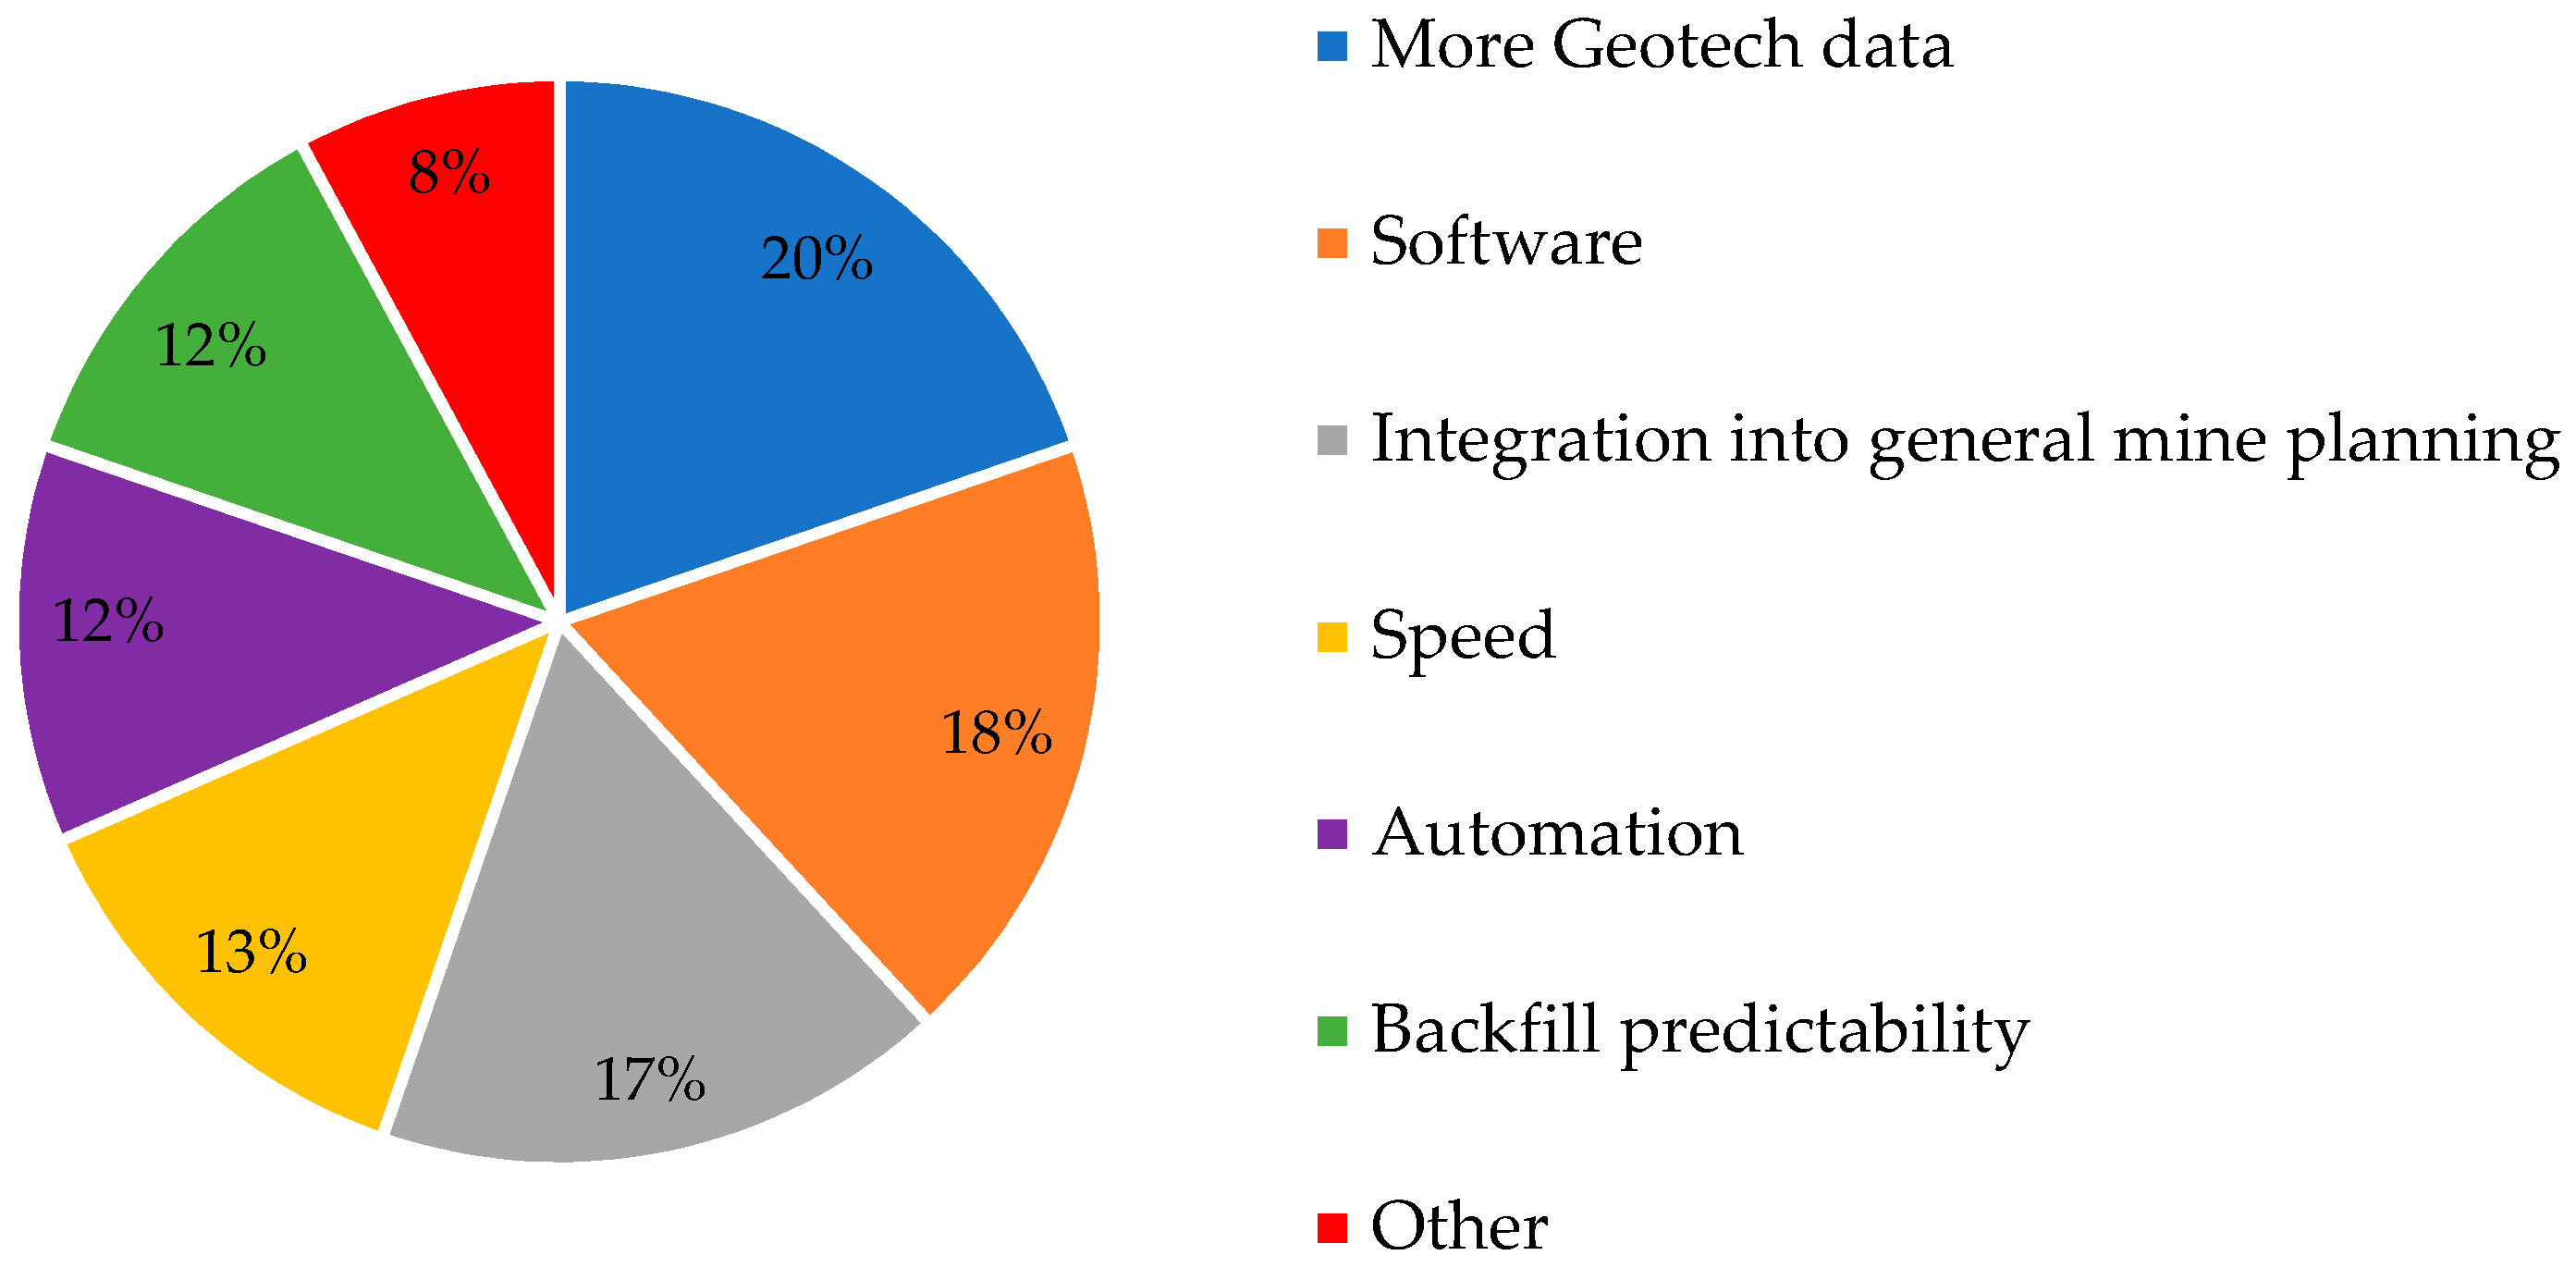
3.5. Most Important Improvement Suggestions for Stope Design

Expert suggestions on the most important improvements for stope design were assessed. Figure 11 illustrates that the implementation of additional geotechnical data, improvements in software, and integration into general mine planning, were reported as the most urgently desired improvements. There was considerable diversity within the listed methods, which indicates that there are several aspects requiring improvement in the stope design process. Several other areas for improvement were mentioned, such as the implementation of more reliable grade data, a variable cut-off, reliable performance indication for dilution-cable-bolt utilization, and utilization of hanging-wall offset to decrease dilution.

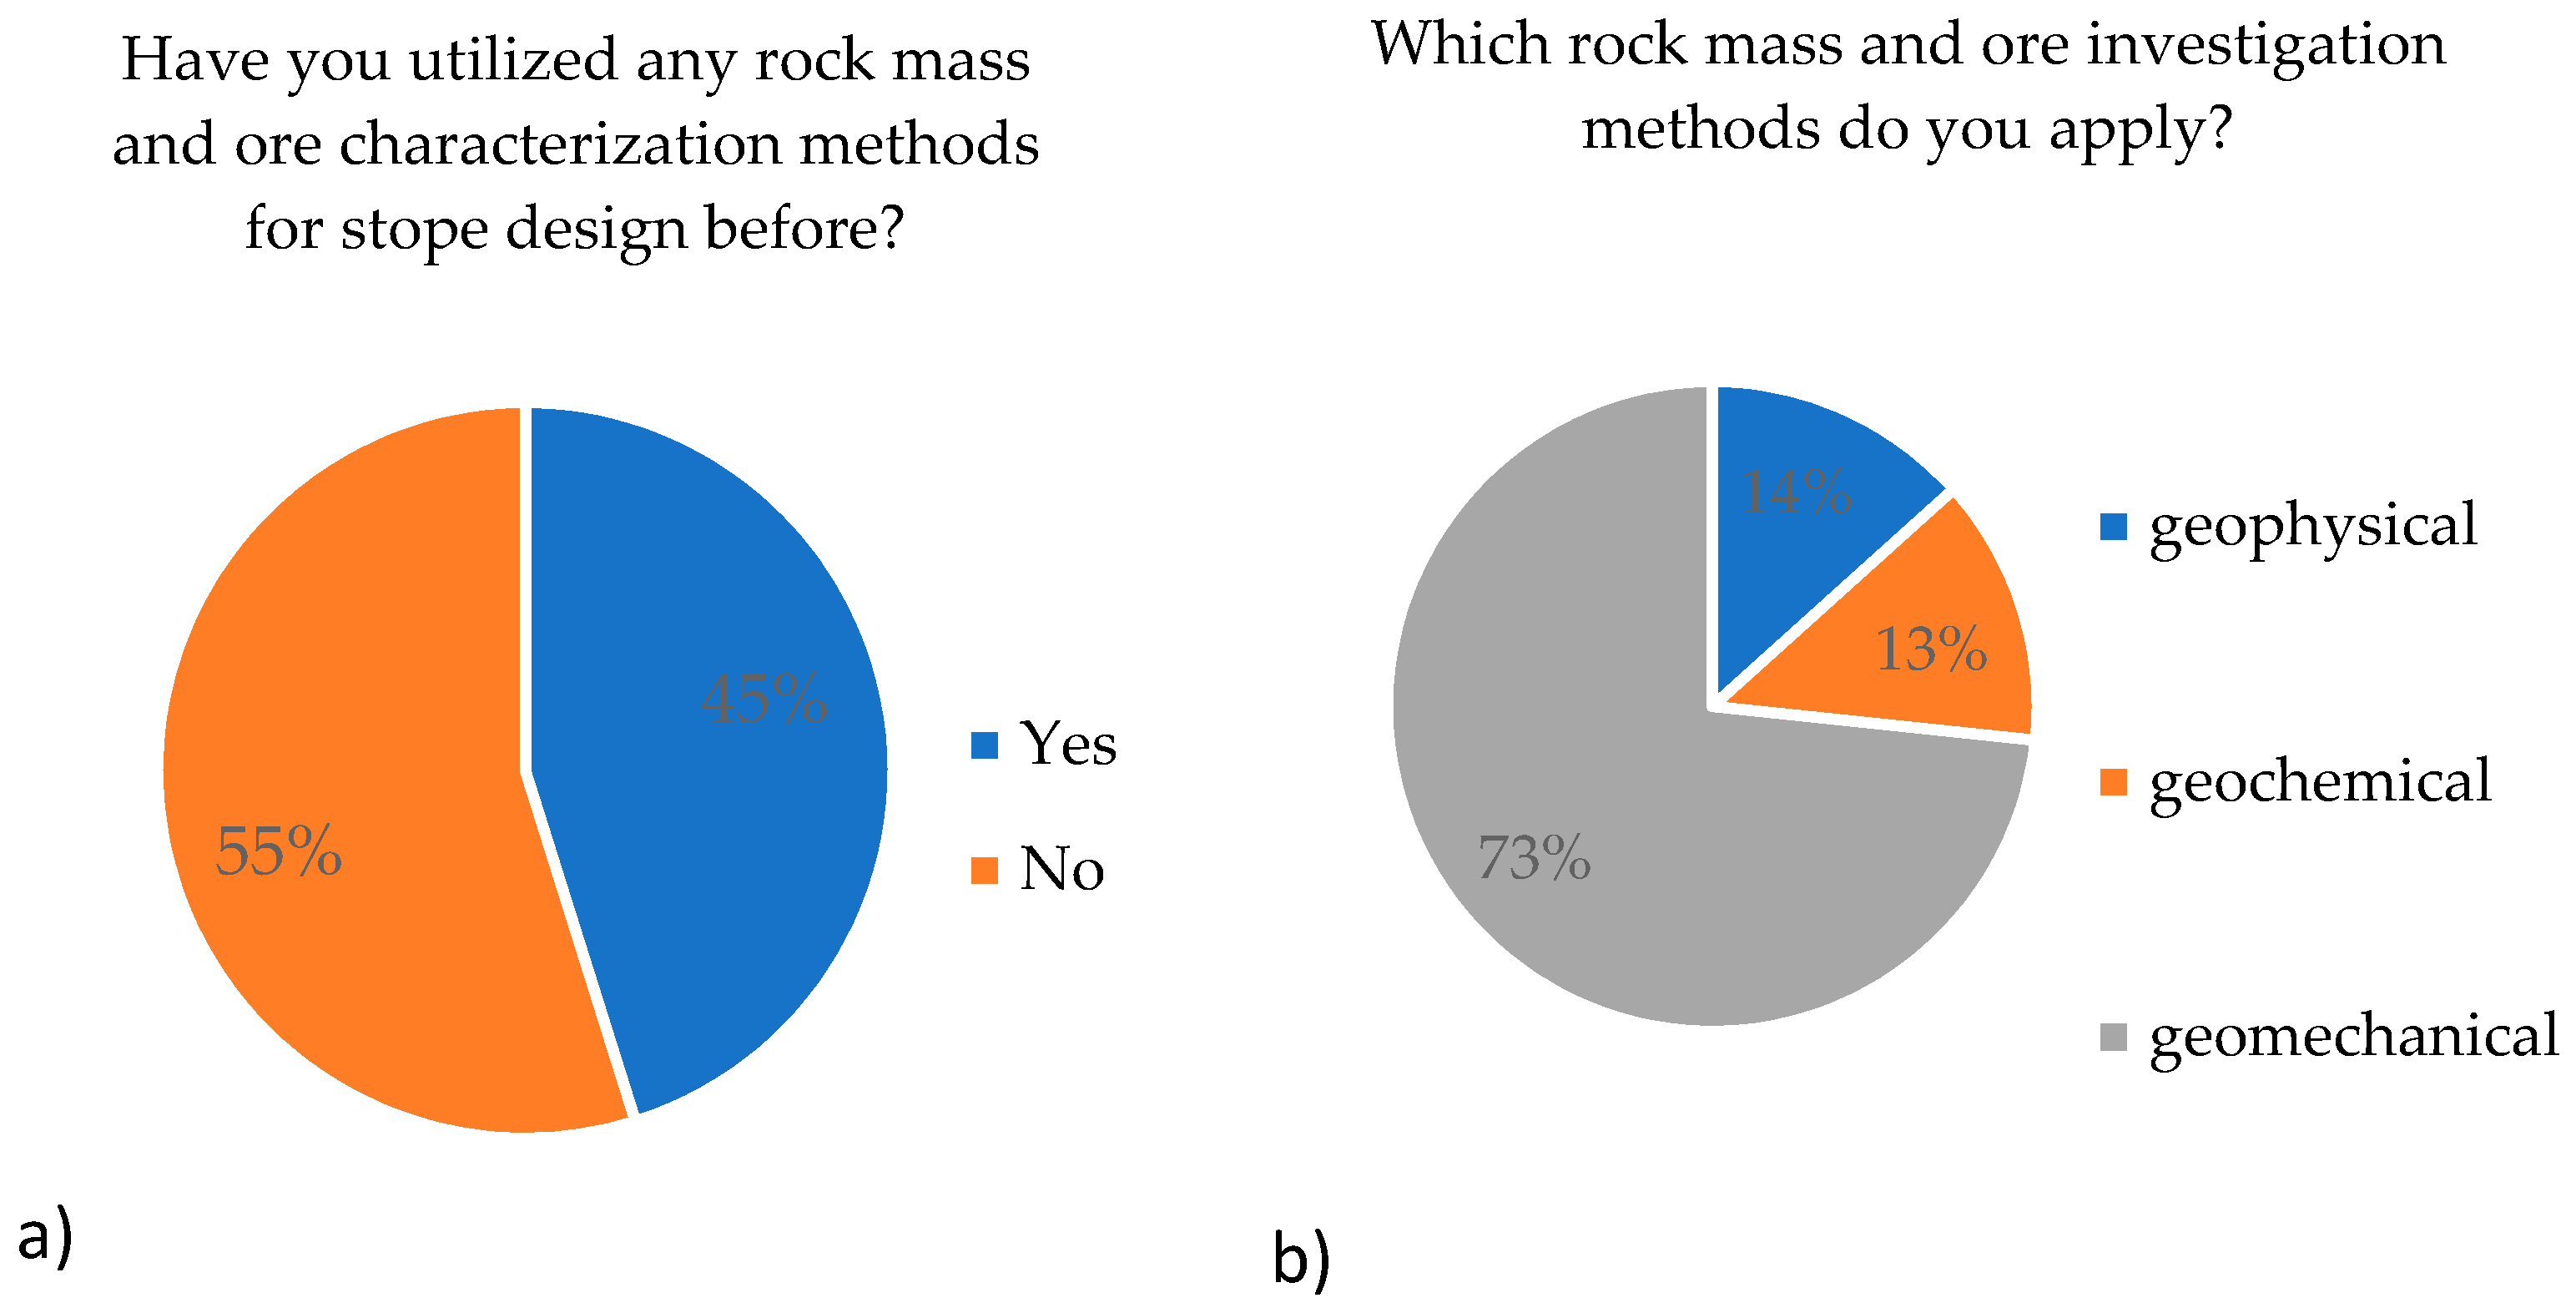
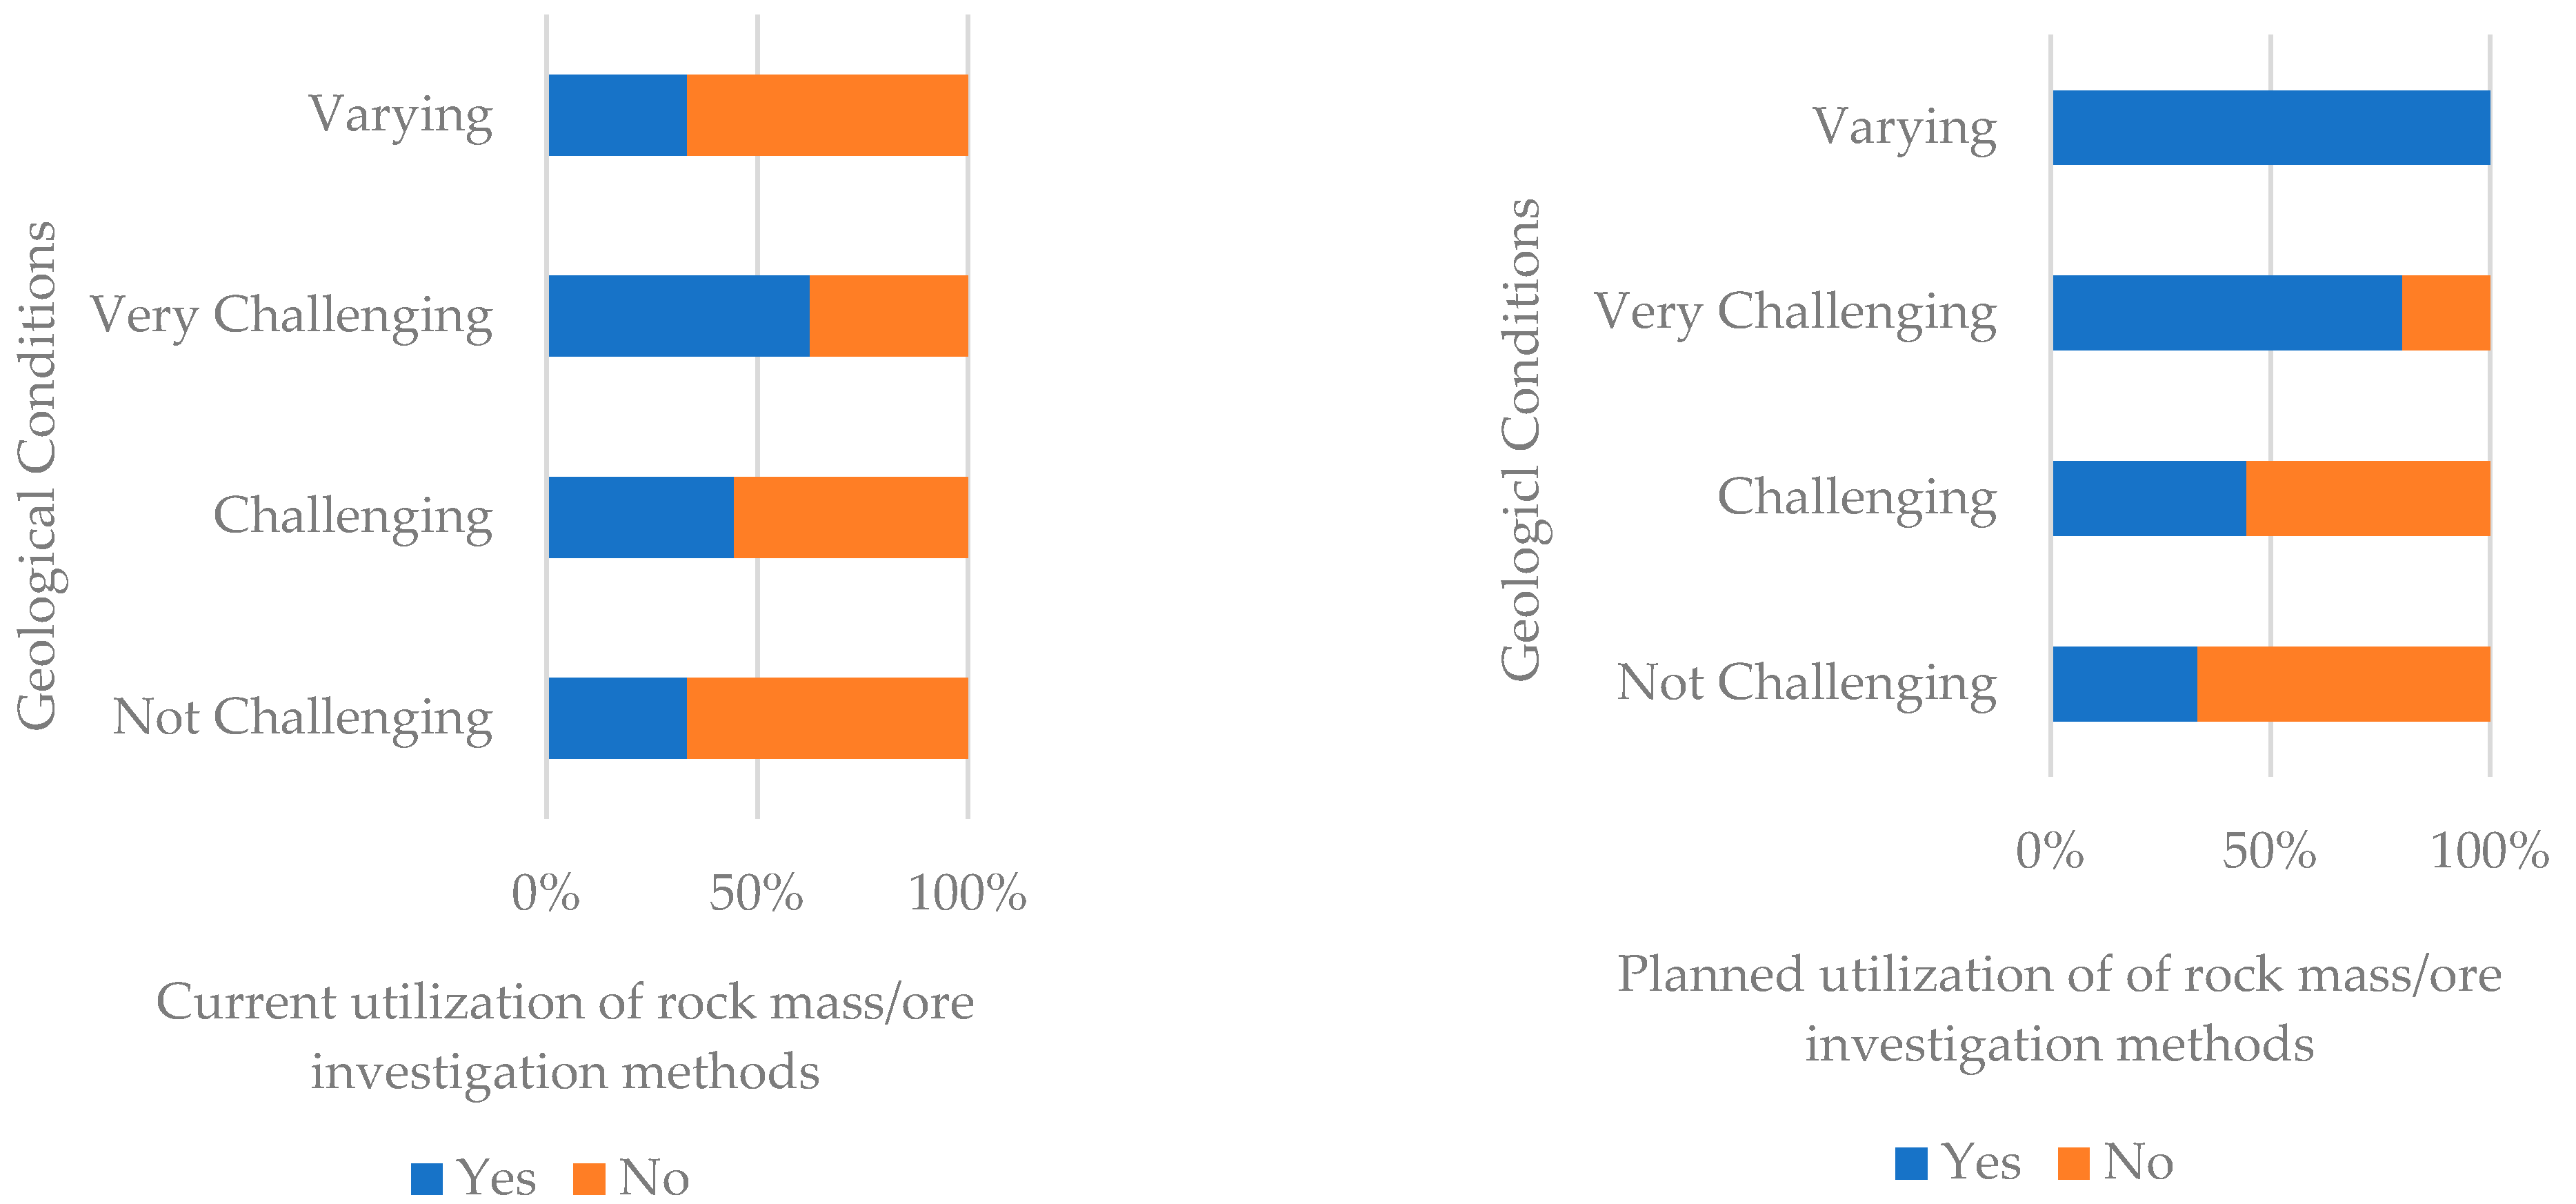
3.6. Utilization of Geotechnical Methods

The utilization of rock mass characterization methods was assessed. This served as an indication of how likely potential implementation of specific methods within the industry would be considered. Figure 12 shows that 45% of the respondents have utilized rock mass investigations for stope design. Most of the applied methods dealt with geomechanics, while minor parts involved geophysical and geochemical investigations. The geomechanical methods reported included RQD, RMR, MRMR, life of mine (LOM) stress model, deformation monitoring, core logging, Q-system, equivalent linear overbreak (ELOS)-chart and the Hoek–Brown failure-criterion. The geophysical methods reported included acoustical and optical televiewer and gravimetric testing, and geochemical methods, which were mostly limited to atomic absorption spectroscopy and fire assay.
The planned future implementation of rock mass characterization methods into the stope design process was assessed (Figure 13). The term “new rock mass characterization methods” was meant to address the willingness of the participants of the survey to implement new methods for rock mass characterization that are different from their currently applied methods. The results indicated that half of the participants were willing to implement novel methods. The geophysical and geochemical methods included in Figure 13b refer to collecting the rock mass data for stope design specifically, such as for location and orientation of discontinuities, or determination of their properties, the ore/waste boundary, or in situ rock strength. It was concluded that there was a marked trend towards the utilization of geophysical and geochemical methods for rock mass characterization in stope design in the future.

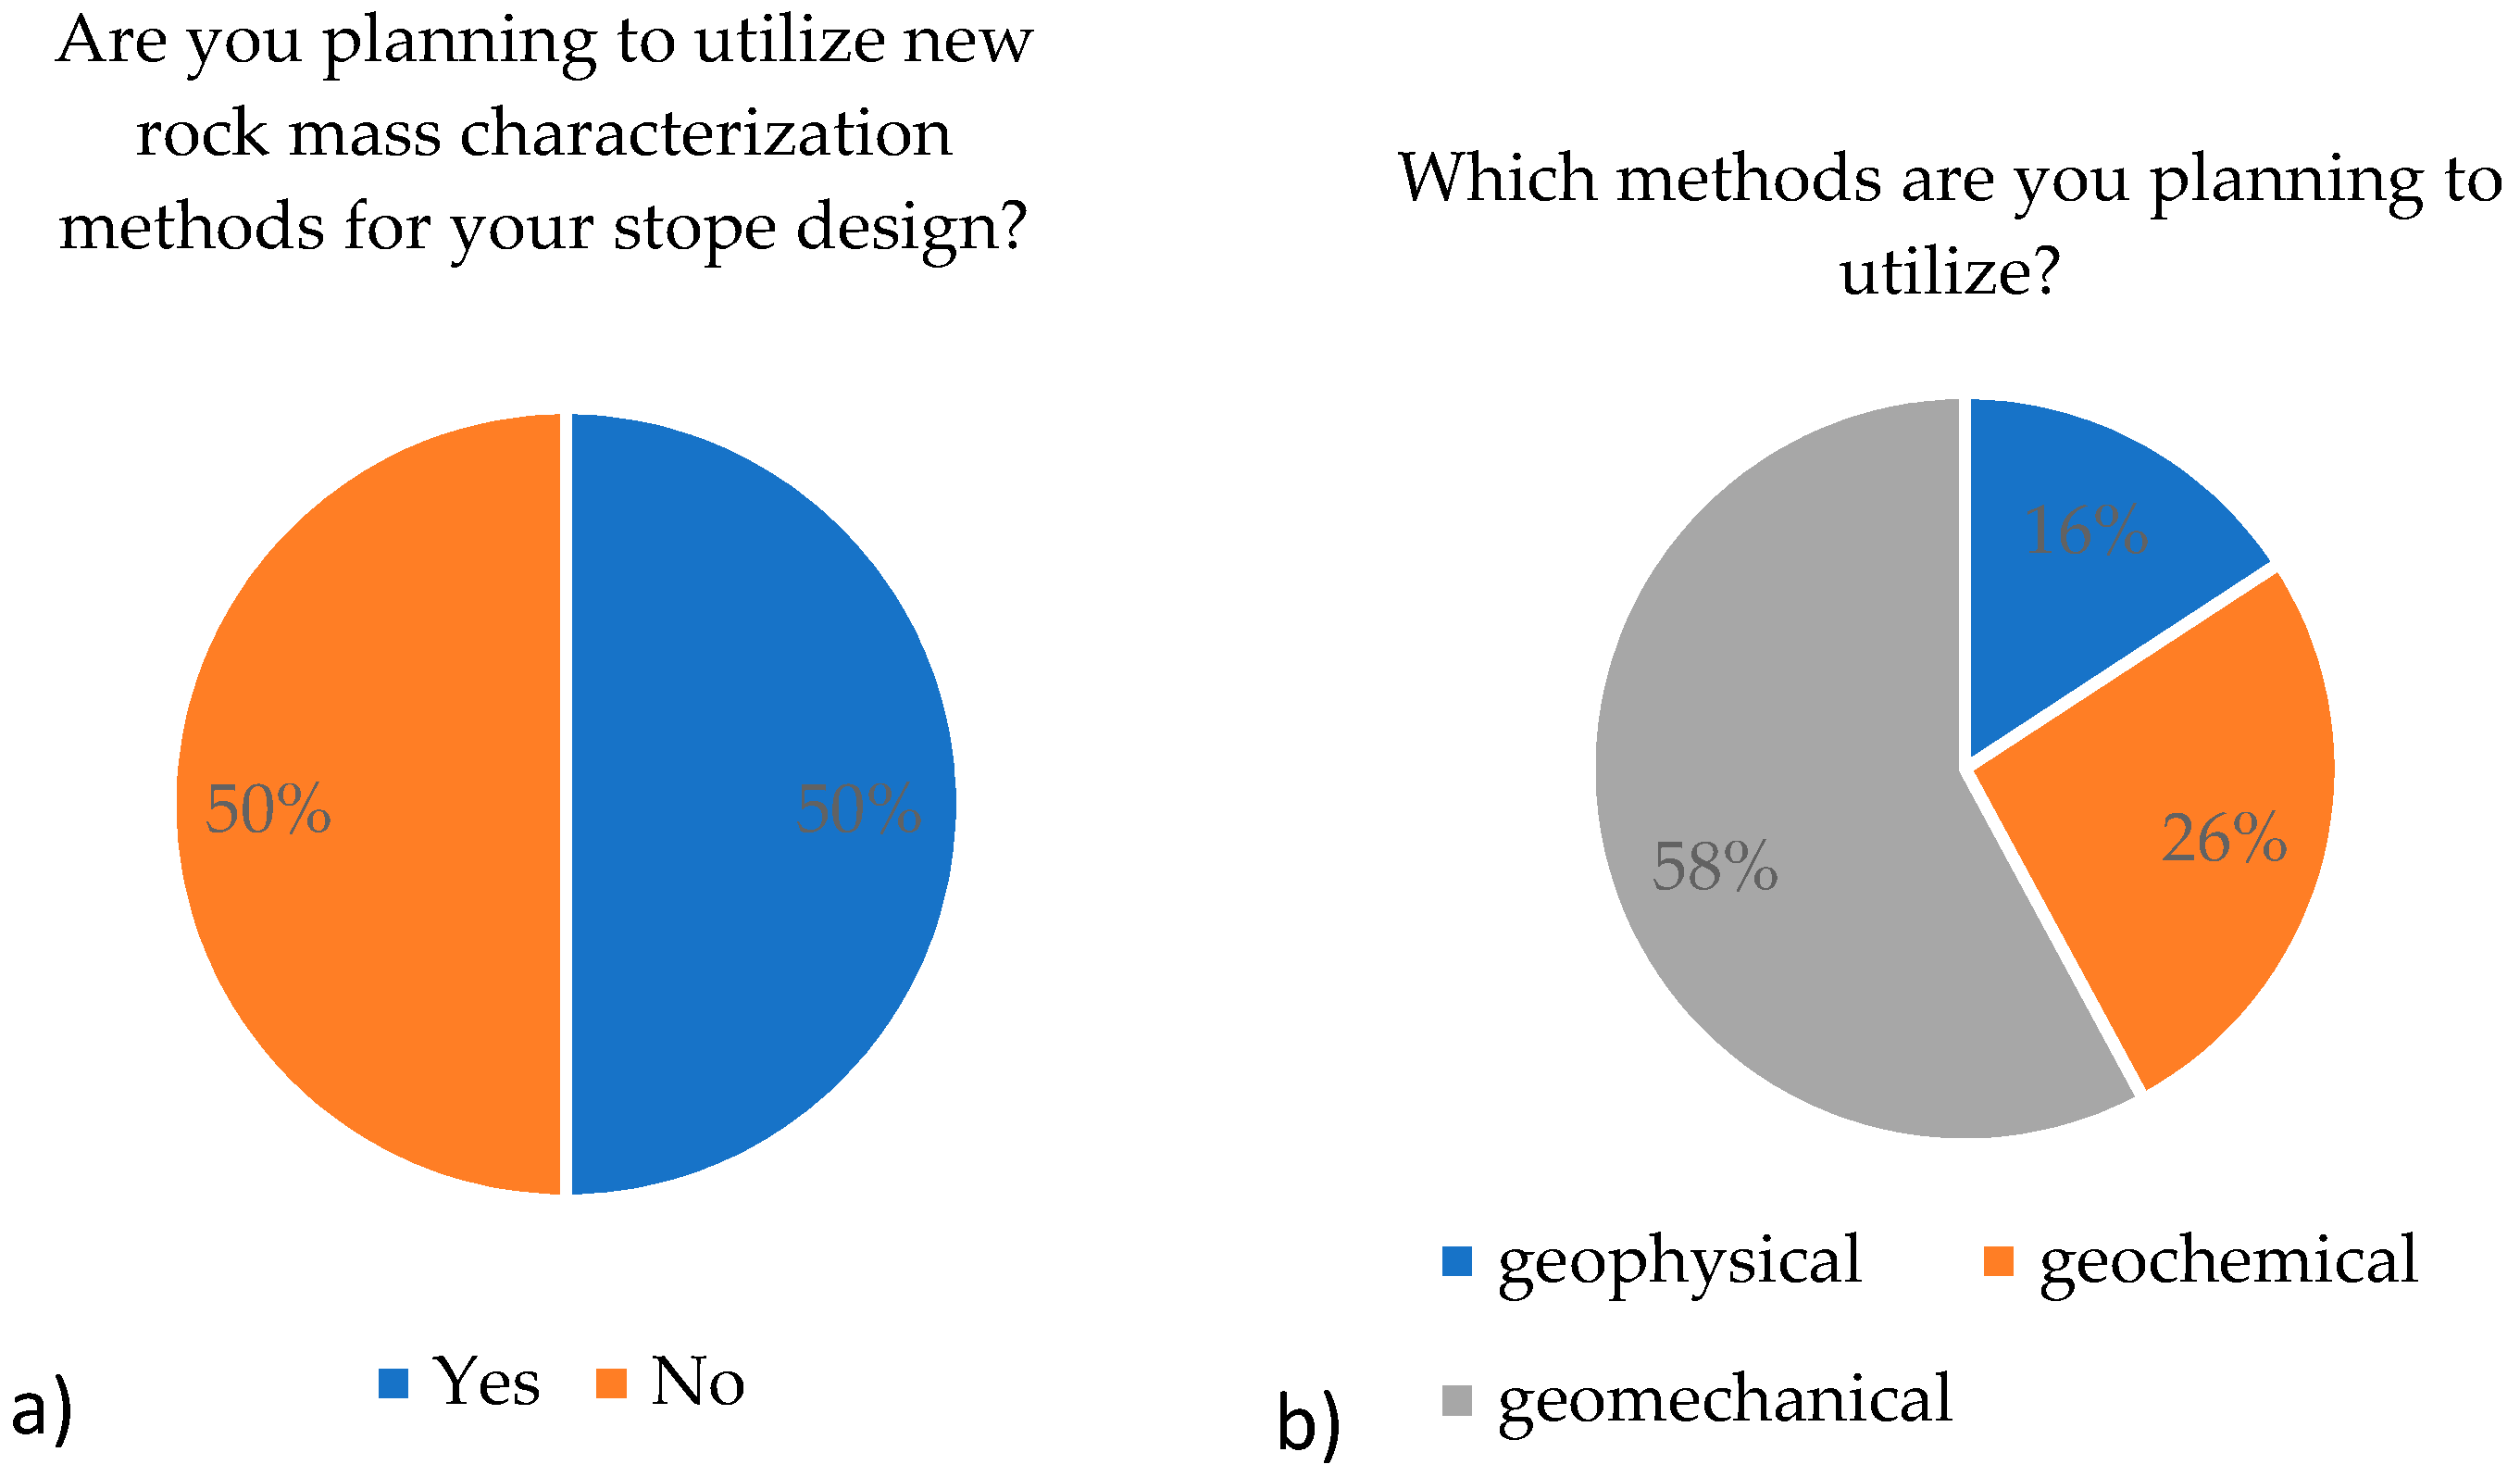
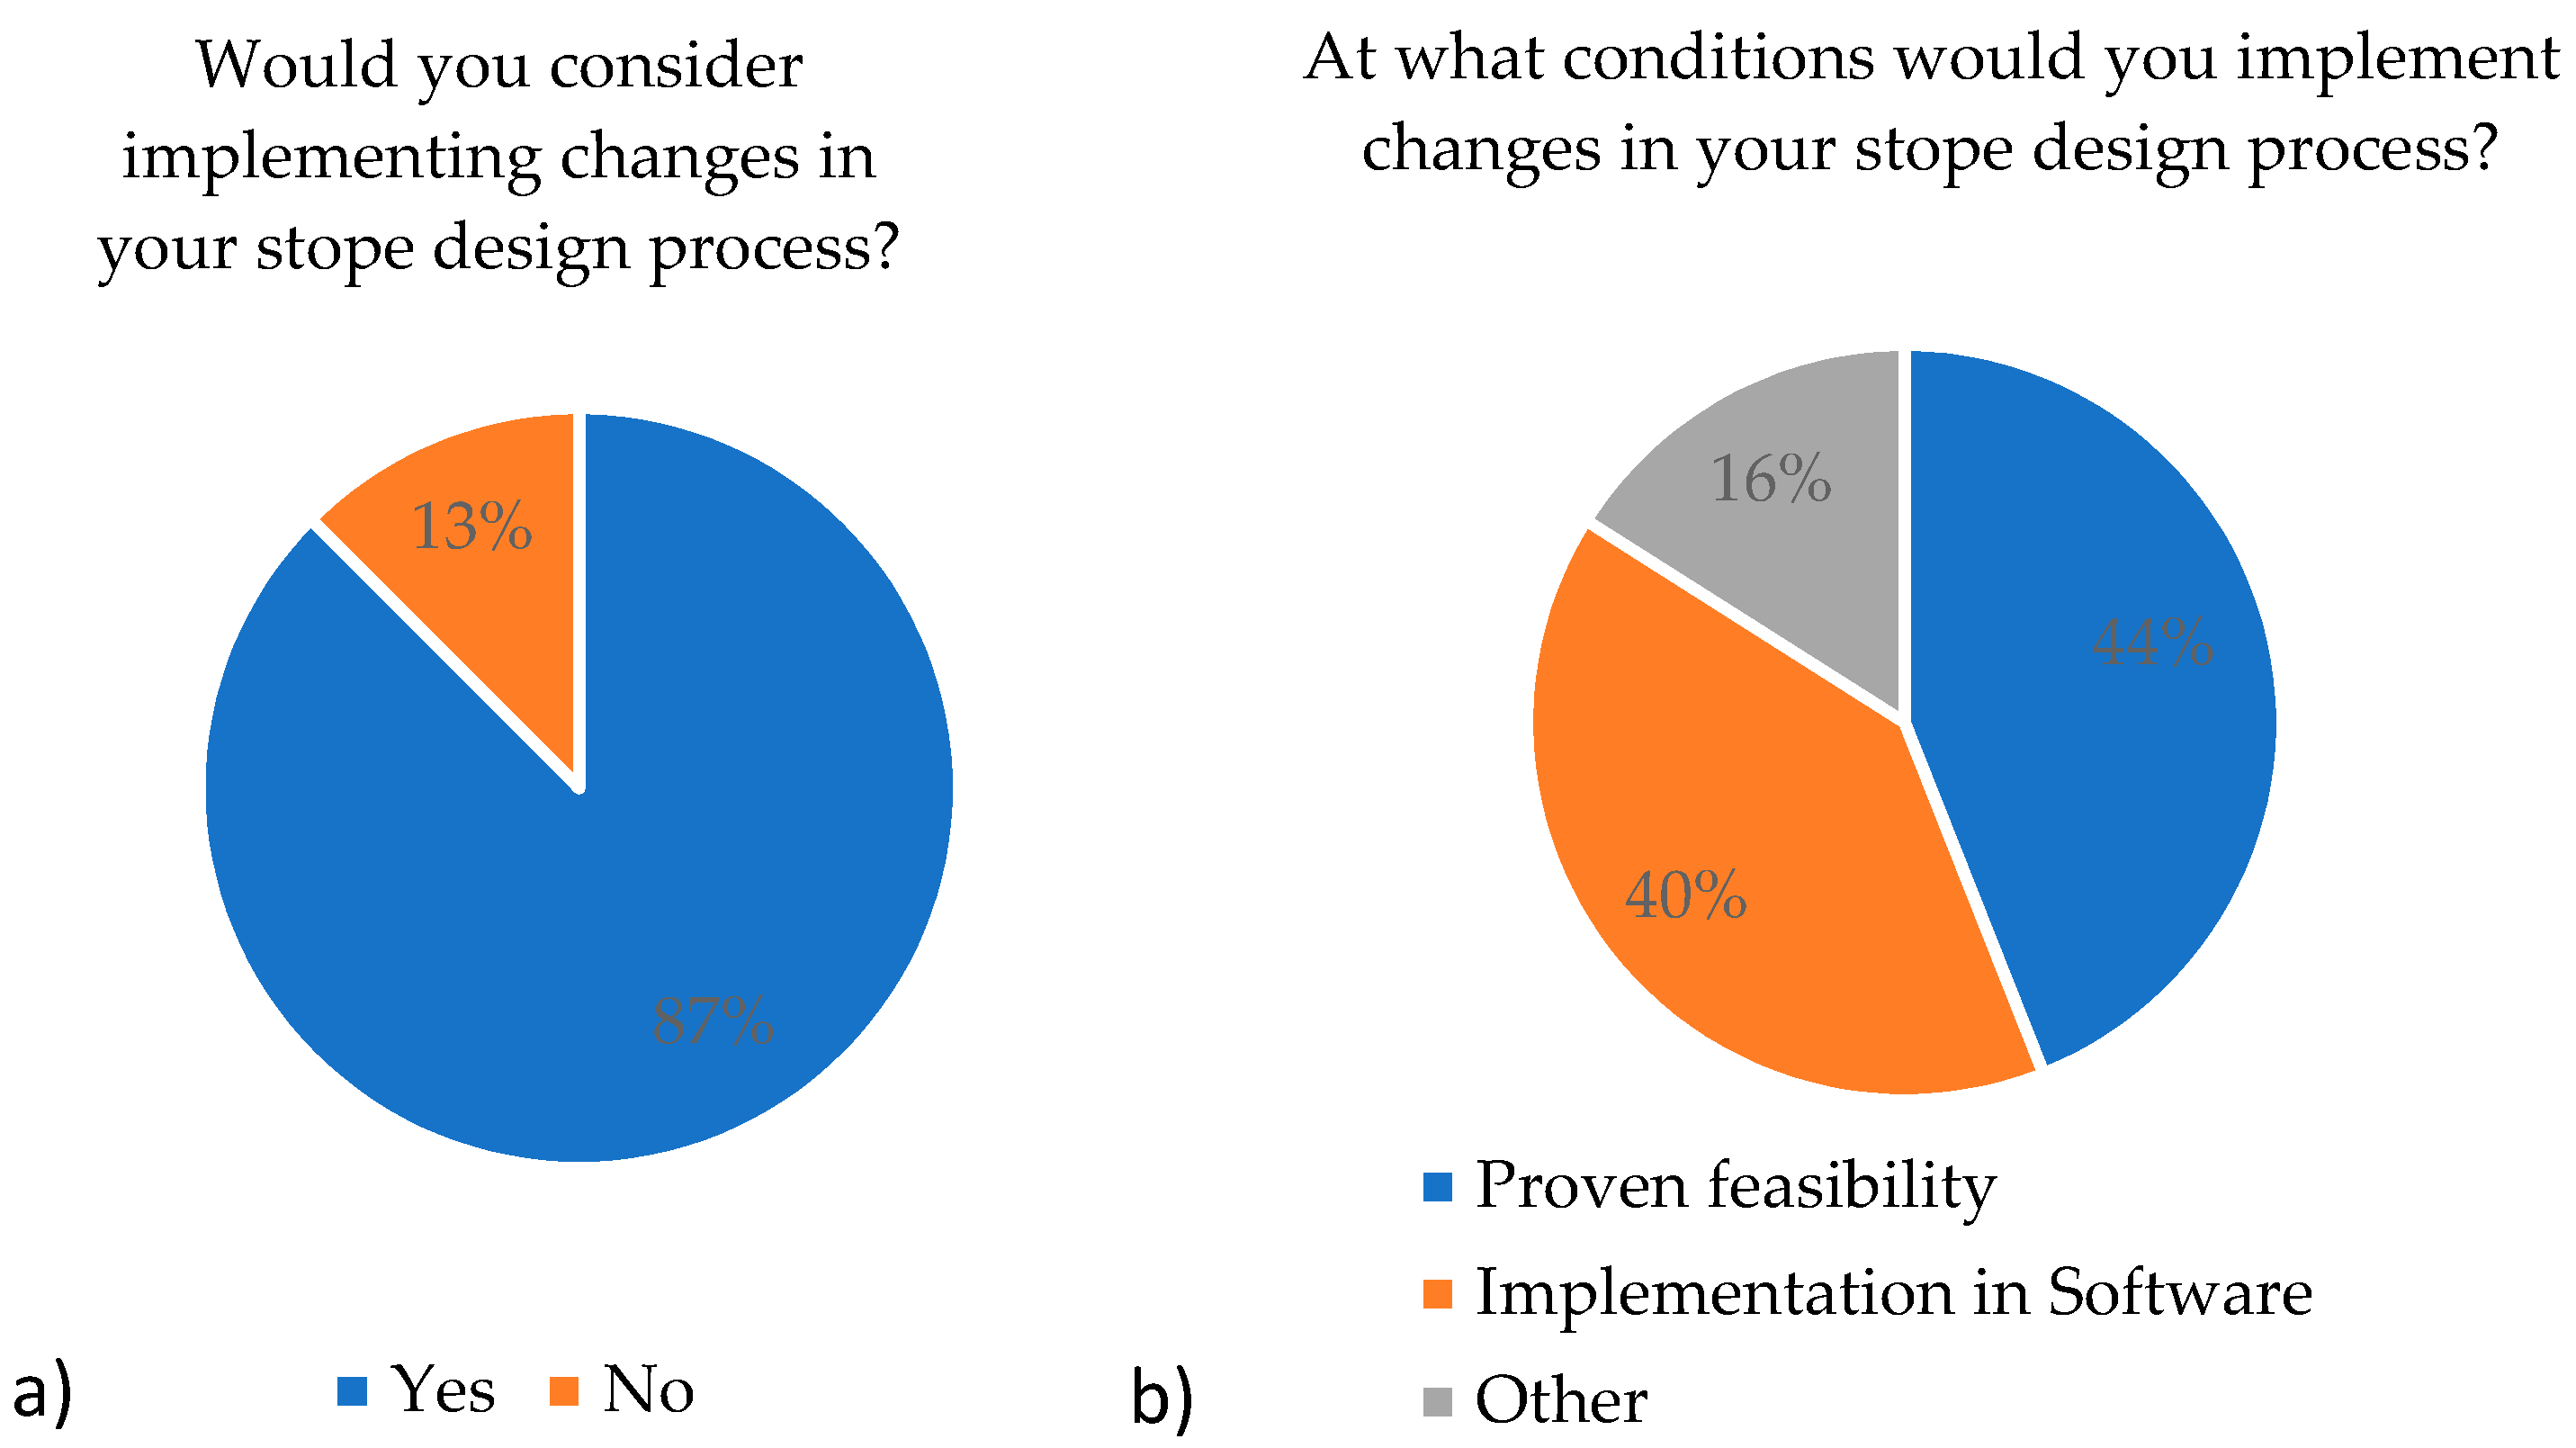
3.7. Improvement Implementation and Conditions

Next, the participants were asked if they would be interested in applying new methods in stope design. This is different from the previous question (Figure 13a) where the participants were asked if they were already planning to implement new methods. Figure 14 illustrates that the interest in the implementation of novel ore characterization, such as LIBS (laser-induced breakdown spectroscopy) and novel in-situ rock mass characterization methods, ranged between 65% and 70%. This is considerably higher than response rates for the already planned implementation of new methods, as assessed in the previous questions. This should be understood as an indication that by explaining the specific methods and their associated benefits in detail, the potential for implementation for the proposed methods could be increased considerably.
The question was set to assess whether there is a general willingness to implement changes in the stope design process, and which conditions and requirements would be associated with these changes. In addition, the acceptable timeframe for possible improvements was identified. The general willingness to implement changes in the stope design process was very high, reaching a value of 87% (Figure 15). However, respondents noted that changes must be proven in feasibility studies and implemented into the software. Other requirements identified were realized benefits, reliability, predictability, faster process, and new personnel. Potential changes to stope design were not only limited to geotechnical methods but other methods, such as geophysical methods, were also desired.
The timeframe for the availability of additional geotechnical data to be acquired was identified as a potential key issue for the implementation, utilization, and ease of use of the new technology. Therefore, the tolerable timeframe for obtaining additional measurement data to be used in stope design was assessed (Figure 16). It was found that data from additional measurements available within three days would satisfy the needs of more than 70% of the respondents. However, a considerable number of responses stated that the timeframe for obtaining the data could be extended if the data added substantial value to the stope design process.

3.8. Hypothesis Analysis

To achieve a deeper level of understanding of survey responses, the results can be analyzed using either correlational or hypothesis analysis [128]. In this study, correlational analysis was not implemented due the limited availability of quantifiable values. Therefore, a hypothesis analysis was performed as it is of value in surveys with a large number of free-text answers and where there is elaborated complexity in the questionnaire [129]. Two hypotheses related to the surveyed subject were defined and evaluated by assessing the responses from the survey. The first hypothesis tested assumed that the more challenging the geological conditions, the more rock mass and ore investigation methods would be applied for stope design. To test this hypothesis, it was necessary to analyze the correlation between the geological conditions and the current and planned implementation of rock mass and ore investigation methods. The results of this analysis are represented in Figure 17. There was a clear trend towards an increase in the utilization of rock mass and ore investigation methods with increasingly challenging geological conditions. It can be concluded that the first hypothesis holds true and was confirmed.
The second hypothesis that was tested assumed that the more challenging geological conditions result in lower utilization of empirical methods for stope design. For analysis, the geological conditions were compared to the preferred stope design method type. The results are presented in Figure 18. The only clear trend that could be extracted from analyzing the comparison between these two factors was that under varying and unchallenging geological conditions the utilization of personal expertise in stope design showed an increase. However, these geological conditions were reported by only a very limited proportion of the survey population and, therefore, this hypothesis was rejected.

4. Discussion

4.1. State of Stope Design Methods in the Industry

The general survey responses provided detailed insights on stope design methods. It must be noted that block-caving methods were not considered in this study, as the approaches to stability and design in block caving are beyond the scope of stope design methods. The sublevel stoping methods were dominant, and the geological conditions were mostly challenging according to responses. The results demonstrated that a great interest in improvements for stope design exists. Many respondents highlighted the need to gather more geotechnical data as early as possible to allow for more optimal stope design. This would also limit the negative impact resulting from the limited-data issue of stope design and mine planning integration. Other challenges indicated by the participants were the need for development and improvement of software packages for stope design, integration into general mine planning and automation of the design process to increase its speed and reduce human bias (Figure 11). This indicates that machine and deep learning approaches for stope design (e.g., methods proposed by [93,94]) have the highest potential to be implemented in stope design practice in mines due to their speed, automation, and data utilization capabilities. The substantial interest in improvements in stope design processes should be considered by researchers. The timescale to effect stope design based on measurements within a timeframe of three days should be considered as guidance for future development.

4.2. Survey Sample Size and Response Rate

The targeted sample size of 31 was estimated using Equation (1). Based on previous experience of collecting survey data in the mining industry [90,130,131], it was anticipated that the response would be minimal. Therefore, a large number of invitations were sent to exceed the targeted sample size. The 36 responses received exceeded the estimated sample size by 16%, and therefore the results are considered representative of the studied sector comprising a population of 250 mines.
From the meta-data of the survey responses, the most successful approach for conducting the survey, which also resulted in the best answer quality, was a direct message through LinkedIn. The responses from the Mining Industry Professionals network forum were limited, possibly because it was not possible to directly address the possible reader. The best answers were received mainly from unknown individuals, who most likely believed in the value of related research and this survey; thus, they filled in the questionnaire out of goodwill rather than feeling obliged to do so. Support for this assumption is provided by the increased quality of answers within this group. In general, it was interesting to observe how much time people were willing to spend on responding to the survey and which kind of high-quality answers, allowing for valuable insights, were received. Some excellent answers were created in only 20 min, though on average an excellent answer required 39 min to be created. It was fortunate that so many industry professionals from different fields of stope design replied. The high degree of internationality and different positions within the management hierarchy were adequately represented.

4.3. Questionaire Response Quality Assessment

During the results evaluation process, the responses were initially assessed for their information value. Due to an identified high degree of variety in the answer complexity and quality, a response quality evaluation was performed. To minimize the subjective impact on the evaluation process, response quality/complexity indicators (average free-text-answer-length, or total response time) were chosen. These indicators were then used to create a response quality classification system. As part of the system´s implementation, every response was assigned to a single class and the responses were divided into four categories, as can be seen in Table 2. Table 3 shows the results from the response quality evaluation grouped by the means of contact. The overall response quality of all participants was satisfactory on average and the share of excellent responses was 28%. The responses from participants contacted via LinkedIn showed the highest average response quality and the highest share of excellent responses, while the forum responses showed the lowest quality.

5. Conclusions

This study analyzed the current state-of-the-art of stope design methods through an industry survey distributed among mining professionals. The survey sought to assess the level of implementation of novel methods for stope design into stope design practice and to characterize current challenges. In total, 36 responses of satisfactory response quality were received, and an international audience was reached, adequately representing the diverse environment of the stope-based underground mines. Based on the survey results, stope design is considered an important focal point for improvements. The most important challenges are to increase the amount of geotechnical data for stope planning, to improve stope design software, and to integrate stope design into general mine planning to a larger extent. Other challenges identified in the survey are the development of software packages for stope design, integration into general mine planning, and automation of the design process to increase its speed. Therefore, machine and deep learning methods for the stope design process have strong potential for implementation in the industry as they can: (1) utilize a large amount of geotechnical data, (2) be automated and implemented into a software package, and (3) increase speed and reliability.
The survey showed a strong dominance of the sublevel stoping mining method currently being applied as the primary mining method in underground stoping-based mines. The results suggest that there is no dominant stope design method and in some mines stope design is still commonly based on personal expertise or empirical methods, even though this may yield very sub-optimal results. The reliability of personal expertise or empirical methods as stand-alone approaches is not considered to be sufficient. On the other hand, a variety of numerical methods for stope design have been developed and many different methods and algorithms exist and were applied in 37% of the mines.
The stope design process occurs either within mine planning or during the production stage. The period of stope design varies from less than a week to more than a month. The utilization of an iterative approach for stope design at multiple mining phases is not yet well established.
The important factors in stope design are cut-off grades and ore dilution. Most professionals consider the geological conditions of the mine they represent to be challenging or very challenging. Those who reported very challenging conditions suggest improved methods to gather more geotechnical data. The newly acquired data is desired to be compatible with the mine planning software. A time frame of three days to make new geotechnical data available for stope design is sufficient for about 70% of the specialists. Changes in the mining method were reported in 69% of the responses due to various reasons and the industry is ready to implement new and more efficient stope design methods. The feasibility of the new method should be proven by case studies. New design processes do not have to substitute old design methods but can rather be seen as potentially complementary actions.
The strong interest in improvements in stope design processes suggests great potential for incorporation of recent scientific findings into the current practice of stope design. However, the benefits must first be showcased by case studies.

Author Contributions

Conceptualization, M.J. and S.P.; methodology, S.P.; investigation and analysis, S.P.; writing—original draft preparation, S.P. and M.J.; writing—review and editing, M.J. and M.R.; supervision and project administration, M.R. and M.J. All authors have read and agreed to the published version of the manuscript.

Funding

This research was part of GAGS project funded by the Academy of Finland under grant no. 319798. The authors greatly appreciate the financial support.

Institutional Review Board Statement

Not applicable.

Informed Consent Statement

Not applicable.

Acknowledgments

The authors would like to kindly acknowledge the survey respondents who took valuable time away from their jobs to participate in the survey.

Conflicts of Interest

The authors declare no conflict of interest.

References

  1. Mateus, A.; Martins, L. Challenges and opportunities for a successful mining industry in the future. Boletín Geológico Min. 2019, 130, 99–121. [Google Scholar] [CrossRef]
  2. Brady, B.H.; Brown, E.T. Rock Mechanics: For Underground Mining; Springer: Berlin/Heidelberg, Germany, 2013. [Google Scholar]
  3. Villaescusa, E. Geotechnical Design for Sublevel Open Stoping; CRC Press: Boca Raton, FL, USA, 2014. [Google Scholar]
  4. Dzimunya, N.; Radhe, K.; William, C.M. Design and dimensioning of sublevel stoping for extraction of thin ore (<12 m) at very deep level: A case study of konkola copper mines (kcm), Zambia. Math. Model. Eng. Probl. 2018, 5, 27–32. [Google Scholar] [CrossRef]
  5. Ranjith, P.G.; Zhao, J.; Ju, M.; De SIlva, R.; Rathnaweera, T.; Bandara, A. Opportunities and Challenges in Deep Mining: A Brief Review. Engineering 2017, 3, 546–551. [Google Scholar] [CrossRef]
  6. Vallejos, J.A.; Miranda, O.; Gary, C.; Delonca, A. Development of an integrated platform for stability analysis and design in sublevel stoping mines—MineRoc. In Proceedings of the International Seminar on Design Methods in Underground Mining 2015, ACG, Perth, Australia, 17–19 November 2015; pp. 477–488. [Google Scholar]
  7. Suorineni, F.T. Reflections on empirical methods in geomechanics–The unmentionables and hidden risks. In Proceedings of the AusRock 2014: Third Australasian Ground Control in Mining Conference, Sydney, Australia, 4–5 November 2014. [Google Scholar]
  8. Starfield, A.M.; Cundall, P.A. Towards a methodology for rock mechanics modelling. Int. J. Rock Mech. Min. Sci. Geomech. Abstr. 1988, 25, 99–106. [Google Scholar] [CrossRef]
  9. Erdogan, G.; Yavuz, M. Application of Three Existing Stope Boundary Optimisation Methods in an Operating Underground Mine. In IOP Conference Series: Earth and Environmental Science; IOP Publishing: Bristol, UK, 2017; Volume 95, p. 042077. [Google Scholar]
  10. Mark, C. Science of empirical design in mining ground control. Int. J. Min. Sci. Technol. 2016, 26, 461–470. [Google Scholar] [CrossRef]
  11. Bieniawski, Z.T. Engineering classification of jointed rock masses. Civil. Eng. S. Afr. 1973, 15, 335–343. [Google Scholar]
  12. Barton, N.; Lien, R.; Lunde, J. Engineering classification of rock masses for the design of rock support. Rock Mech. 1974, 6, 189–236. [Google Scholar] [CrossRef]
  13. Hoek, E.; Kaiser, P.K.; Bawden, W.F. Support of Underground Excavations in Hard Rock; CRC Press: Boca Raton, FL, USA, 1993. [Google Scholar]
  14. Laubscher, D.H. A geomechanics classification system for the rating of rock mass in mine design. J. S. Afr. Inst. Min. Metall. 1990, 90, 257–273. [Google Scholar]
  15. Laubscher, D.H. Cave mining—The state of the art. J. S. Afr. Inst. Min. Metall. 1994, 94, 279–293. [Google Scholar]
  16. Lunder, P.J.; Pakalnis, R.C. Determination of the strength of hard-rock mine pillars. CIM Bull. 1997, 90, 51–55. [Google Scholar]
  17. Milne, D.; Pakalnis, R. Advances in Methods of Empirical Stope Design. In Proceedings of the 46th US Rock Mechanics/Geomechanics Symposium, Chicago, IL, USA, 24–27 June 2012. [Google Scholar]
  18. Mathews, K.E.; Hoek, E.; Wyllie, D.C.; Stewart, S.B.V. Prediction of Stable Excavations for Mining at Depths below 1000 Metres in Hard Rock; CANMET Report DSS Serial No. OSQ80-00081, DSS File No. 17SQ.23440-0-9020; Department Energy, Mines and Resources: Ottawa, ON, Canada, 1981; pp. 802–1571.
  19. Hoek, E.; Brown, E.T. Empirical strength criterion for rock masses. J. Geotech Eng. Div. 1980, 106, 1013–1035. [Google Scholar] [CrossRef]
  20. Hoek, E.; Marinos, V. A brief history of the development of the Hoek-Brown failure criterion. Soils Rocks 2007, 2007, 85–92. [Google Scholar]
  21. Lang, B.D.A. Span Design for Entry-Type Excavations. Ph.D. Thesis, University of British Columbia, Vancouver, BC, Canada, 1994. [Google Scholar]
  22. Wang, H.; Webber, T. Practical semiautomatic stope design and cutoff grade calculation method. Min. Eng. 2012, 64, 85–91. [Google Scholar]
  23. Potvin, Y. Empirical Open Stope Design in Canada. Ph.D. Thesis, University of British Columbia, Vancouver, BC, Canada, 1988. [Google Scholar]
  24. Suorineni, F.T. A critical review of the stability graph method for open stope design. In Proceedings of the MassMin 2012: 6th International Conference & Exhibition on Mass Mining, Sudbury, ON, Canada, 10–14 June 2012; pp. 10–14. [Google Scholar]
  25. Suorineni, F.T. The stability graph after three decades in use: Experiences and the way forward. Int. J. Min. Reclam. Environ. 2010, 24, 307–339. [Google Scholar] [CrossRef]
  26. Potvin, Y.; Milne, D. Empirical cable bolt support design. In Proceedings of the International Symposium on Rock Mechanics, Sudbury, ON, Canada, 16–19 June 1992. [Google Scholar]
  27. Nickson, S.D. Cable Support Guidelines for Underground Hard Rock Mine Operations. Master’s Thesis, University of British Columbia, Vancouver, BC, Canada, 1992. [Google Scholar]
  28. Scoble, M.J.; Moss, A. Dilution in underground bulk mining: Implications for production management, mineral resource evaluation, II. Geol. Soc. Sp. Publ. 1994, 79, 95–108. [Google Scholar] [CrossRef]
  29. Stewart, S.B.V.; Forsyth, W.W. The Mathew’s method for open stope design. CIM Bull. 1995, 88, 45–53. [Google Scholar]
  30. Hadjigeorgiou, J.; Leclaire, J.; Potvin, Y. An update of the stability graph method of open stope design. In Proceedings of the 97th Annual General Meeting, CIM, Halifax, NS, Canada, 14–18 May 1995; pp. 154–161. [Google Scholar]
  31. Milne, D.M.; Pakalnis, R.C.; Lunder, P.J. Approach to the quantification of hanging-wall behaviour. Trans. Inst. Min. Metall. 1996, 105, A69–A74. [Google Scholar]
  32. Clark, L.M.; Pakalnis, R.C. An empirical approach for estimating unplanned dilution from open stope hangingwalls and footwalls. In Proceedings of the 99th Annual General Meeting, Vancouver, BC, Canada, 27 April–1 May 1997. [Google Scholar]
  33. Germain, P.; Hadjigeorgiou, J. Influence of stope geometry on mining performance. In Proceedings of the 100th Annual General Meeting, Montreal, QC, Canada, 3–7 May 1998; Canadian Institute of Mining, Metallurgy and Petroleum: Vancouver, BC, Canada, 1998. [Google Scholar]
  34. Suorineni, F.T. Effects of Faults and Stress on Open Stope Design. Ph.D. Thesis, University of Waterloo, Waterloo, ON, Canada, 1998. [Google Scholar]
  35. Suorineni, F.T.; Tannant, D.D.; Kaiser, P.K. Determination of fault-related sloughage in open stopes. Int. J. Rock Mech. Min. Sci. 1999, 36, 891–906. [Google Scholar] [CrossRef]
  36. Diederichs, M.S.; Kaiser, P.K. Tensile strength and abutment relaxation as failure control mechanisms in underground excavations. Int. J. Rock Mech. Min. Sci. 1999, 36, 69–96. [Google Scholar] [CrossRef]
  37. Trueman, R.; Mikula, P.; Mawdesley, C.; Harries, N. Experience in Australia with the application of the Mathews’ method for open stope design. CIM Bull. 2000, 93, 162–167. [Google Scholar]
  38. Mawdesley, C.; Trueman, R.; Whiten, W.J. Extending the Mathews stability graph for open–stope design. Min. Technol. 2001, 110, 27–39. [Google Scholar] [CrossRef]
  39. Trueman, R.; Mawdesley, C. Predicting cave initiation and propagation. CIM Bull. 2003, 96, 53–59. [Google Scholar]
  40. Henning, J.G.; Kaiser, P.K.; Mitri, H. Evaluation of stress influences on ore dilution: A case study. In Proceedings of the Conference: 38th U.S. Rock Mechanics Symposium, Washington, DC, USA, 7–10 July 2001; ARMA-01-0409. Available online: https://onepetro.org/ARMAUSRMS/proceedings/ARMA01/All-ARMA01/ARMA-01-0409/116537 (accessed on 1 December 2021).
  41. Bewick, R.; Kaiser, P.K. Influence of Rock Mass Anisotropy on Tunnel Stability. In Proceedings of the 3rd CANUS Rock Mechanics Symposium, 01/2009, Toronto, ON, Canada, 9–15 May 2009. [Google Scholar]
  42. Mitri, H.S.; Hughes, R.; Zhang, Y. New Rock Stress Factor for the Stability Graph Method. Int. J. Rock Mech. Min. Sci. 2011, 48, 141–145. [Google Scholar] [CrossRef]
  43. Vallejos, J.A.; Miranda, R.; Burgos, L.; Perez, E. Development of New Design Tools for Open Stoping Underground Mines. In Proceedings of the 51st US Rock Mechanics/Geomechanics Symposium; American Rock Mechanics Association, San Francisco, CA, USA, 25–28 June 2017. [Google Scholar]
  44. Razavi, M.; Espley, S.; Yao, M. Open stope stability analysis of VRM stope in the vicinity of Creighton Fault by numerical and empirical methods. In Proceedings of the 45th US Rock Mechanics/Geomechanics Symposium, San Francisco, CA, USA, 26–29 June 2011; American Rock Mechanics Association: San Francisco, CA, USA, 2011. [Google Scholar]
  45. Vallejos, J. Stability graph using major geological structures. Fluid Mech. Res. Int. J. 2018, 2, 243–246. [Google Scholar] [CrossRef]
  46. Hoek, E.; Brown, E.T. The Hoek–Brown failure criterion—A 1988 update. In Proceedings of the 15th Canadian Rock Mechanics Symposium, Toronto, ON, Canada, 1988; Curran, J.H., Ed.; pp. 31–38. Available online: https://www.researchgate.net/profile/E-Brown-2/publication/247896456_The_Hoek-Brown_failure_criterion_-a_1988_update/links/54da95b00cf2ba88a68d4bd5/The-Hoek-Brown-failure-criterion-a-1988-update.pdf (accessed on 1 December 2021).
  47. Hoek, E.; Wood, D.; Shah, S. A modified Hoek–Brown criterion for jointed rock masses. In Proceedings of the Rock Characterization Symposium, ISRM, Eurock ′92, Chester, UK, 14–17 September 1992; Hudson, J., Ed.; pp. 209–213. [Google Scholar]
  48. Marinos, P.; Hoek, E. GSI—A geologically friendly tool for rock mass strength. In Proceedings of the GeoEng 2000 International Conference on Geotechnical and Geological Engineering, Melbourne, Australia, 19–24 November 2000; pp. 1422–1440. [Google Scholar]
  49. Hoek, E.; Carter, T.G.; Diederichs, M.S. Quantification of the Geological Strength Index Chart. In Proceedings of the 47th US rock Mechanics/Geomechanics Symposium, San Francisco, CA, USA, 23–26 June 2013. [Google Scholar]
  50. Hoek, E.; Brown, E.T. The Hoek–Brown failure criterion and GSI–2018 edition. J. Rock Mech. Geotech. Eng. 2019, 11, 445–463. [Google Scholar] [CrossRef]
  51. Renani, H.R.; Cai, M. Forty-Year Review of the Hoek–Brown Failure Criterion for Jointed Rock Masses. Rock Mech. Rock Eng. 2021, 1–23. [Google Scholar] [CrossRef]
  52. Heidarzadeh, S.; Saeidi, A.; Rouleau, A. Assessing the effect of open stope geometry on rock mass brittle damage using a response surface methodology. Int. J. Rock Mech. Min. Sci. 2018, 106, 60–73. [Google Scholar] [CrossRef]
  53. Napa-García, G.; Camara, T.; Navarro Torres, V. Optimization of room-and-pillar dimensions using automated numerical models. Int. J. Min. Sci. Technol. 2019, 29, 797–801. [Google Scholar] [CrossRef]
  54. Alejano, L.R.; Arzúa, J.; Castro-Filgueira, U.; Malan, F. Strapping of pillars with cables to enhance pillar stability. J. S. Afr. Inst. Min. Metall. 2017, 117, 527–540. [Google Scholar] [CrossRef] [Green Version]
  55. Carvalho, J.L.; Hoek, E.; Corkum, B.T. Phases Program; Department of Civil Engineering, University of Toronto: Toronto, ON, Canada, 1991. [Google Scholar]
  56. Curran, J.H.; Corkum, B.T. Examine 2D Boundary Element Method Code User’s Manual; Rocscience Inc.: Toronto, ON, Canada, 1994. [Google Scholar]
  57. Shen, B.; Stephansson, O.; Rinne, M. Modeling Rock Fracturing Processes; Springer: Berlin/Heidelberg, Germany, 2014. [Google Scholar]
  58. Wiles, T.D. Rockburst Prediction Using Numerical Modelling—Realistic Limits for Failure Prediction Accuracy. In Proceedings of the Sixth International Symposium on Rockburst and Seismicity in Mines, Australian Centre for Geomechanics, Perth, Australia, 9–11 March 2005; Potvin, Y., Hudyma, M., Eds.; pp. 57–63. [Google Scholar] [CrossRef]
  59. Curran, J.H.; Corkum, B.T. EXAMINE 3D Version 2.0 Users Manual: Three-Dimensional Excavation Analysis for Mines; Data Visualization Laboratory, Department of Civil Engineering, University of Toronto: Toronto, ON, Canada, 1993. [Google Scholar]
  60. Jing, L.; Stephansson, O. Fundamentals of Discrete Element Methods for Rock Engineering: Theory and Applications; Elsevier: Amsterdam, The Netherlands, 2007. [Google Scholar]
  61. Kleine, T.; La Pointe, P.; Forsyth, B. Realizing the potential of accurate and realistic fracture modeling in mining. Int. J. Rock Mech. Min. Sci. 1997, 34, 3. [Google Scholar] [CrossRef]
  62. Elmo, D.; Stead, D. An Integrated Numerical Modelling–Discrete Fracture Network Approach Applied to the Characterisation of Rock Mass Strength of Naturally Fractured Pillars. Rock Mech. Rock Eng. 2009, 43, 3–19. [Google Scholar] [CrossRef]
  63. Grenon, M.; Landry, A.; Hadjigeorgiou, J.; Lajoie, P.L. Discrete fracture network based drift stability at the Éléonore mine. Mining Technology. Trans. Inst. Min. Metall. Sect. A 2017, 126, 22–33. [Google Scholar]
  64. Grenon, M.; Hadjigeorgiou, J. Open Stope Stability Using 3D Joint Networks. Rock Mech. Rock Eng. 2003, 36, 183–208. [Google Scholar] [CrossRef]
  65. Esterhuizen, G.; Gearhart, D.; Klemetti, T.; Dfougherty, H.; Van Dyke, M. Analysis of gateroad stability at two longwall mines based on field monitoring results and numerical model analysis. Int. J. Min. Sci. Technol. 2018, 29. [Google Scholar] [CrossRef]
  66. Amedie, B.; Savage, W.Z. Effect of Joints on Rock Mass Strength and Deformability. In Comprehensive Rock Engineering; Hudson, J., Ed.; Pergamon Press: Ann Arbor, MI, USA, 1993; Volume 1, pp. 331–365. [Google Scholar]
  67. Nasseri, M.H.B.; Rao, K.S.; Rammamurthy, T. Anisotropic strength and deformational behavior of Himalayan schists. Int. J. Rock Mech. Min. Sci. 2003, 40, 23. [Google Scholar] [CrossRef]
  68. Heidarzadeh, S.; Saeidi, A.; Rouleau, A. Evaluation of the effect of geometrical parameters on stope probability of failure in the open stoping method using numerical modeling. Int. J. Min. Sci. Technol. 2019, 29, 399–408. [Google Scholar] [CrossRef]
  69. Jessop, J.A.; Friedel, M.J.; Jackson, M.J.; Tweeton, D.R. Fracture detection with seismic crosshole tomography for solution control in a stope. In Proceedings of the Symposium on the Application of Geophysics to Engineering and Environmental Problems, Oakbrook, IL, USA, 26–29 April 1992. [Google Scholar]
  70. Cichowicz, A.; Milev, A.M.; Durrheim, R.J. Rock mass behaviour under seismic loading in a deep mine environment: Implications for stope support. J. S. Afr. Inst. Min. Metall. 2000, 100, 121–128. [Google Scholar]
  71. Ferrero, A.M.; Godio, A.; Sambuelli, L.; Voyat, I.H. Geophysical and geomechanical investigations applied to the rock mass characterization for distinct element modeling. Rock Mech. Rock Eng. 2007, 40, 603–622. [Google Scholar] [CrossRef]
  72. Torres, C.A. Geometric Characterization of Rock Mass Discontinuities Using TERRESTRIAL Laser Scanner and Ground Penetration Radar. Master’s Thesis, University of Twente, Enschede, The Netherlands, 2008. [Google Scholar]
  73. Sturzenegger, M. Multi-Scale Characterization Rock Mass Discontinuities and Rock Slope Geometry Using Terrestrial Remote Sensing Techniques. Ph.D. Thesis, Simon Fraser University, Burnaby, BC, Canada, 2010. [Google Scholar]
  74. Janiszewski, M.; Uotinen, L.; Baghbanan, A.; Rinne, M. Digitisation of hard rock tunnel for remote fracture mapping and virtual training environment. In Proceedings of the ISRM International Symposium—EUROCK 2020: International Society for Rock Mechanics and Rock Engineering, Trondheim, Norway, 14–19 June 2020. [Google Scholar]
  75. Idris, M.A.; Basarir, H.; Nordlund, E.; Wettainen, T. Probabilistic Estimation of Rock Masses Properties in Malmberget Mine, Sweden. Electron. J. Geotech. Eng. 2013, 8, 269–287. [Google Scholar]
  76. Monsalve, J.J.; Baggett, J.; Bishop, R.; Ripepi, N. A Preliminary Investigation for Characterization and Modeling of Structurally Controlled Underground Limestone Mines by Integrating Laser Scanning with Discrete Element Modeling. In Proceedings of the North American Tunneling Conference, Washington, DC, USA, 24–27 June 2018; pp. 49–57. [Google Scholar]
  77. Heidarzadeh, S. Probabilistic Stability Analysis of Open Stopes in Sublevel Stoping Method by Numerical Modeling. Ph.D. Thesis, University of Quebec, Quebec, QC, Canada, 2018. [Google Scholar]
  78. Gang, H.; Kulatilake, P.H.S.W.; Shreedharan, S.; Cai, S.; Song, H. 3-D discontinuum numerical modeling of subsidence incorporating ore extraction and backfilling operations in an underground iron mine in China. Int. J. Min. Sci. Technol. 2017, 27, 191–201. [Google Scholar]
  79. Cepuritis, P.M.; Villaescusa, E. Back analysis techniques for assessing open stope performance. In Proceedings of the 2006 Australian Mining Technology Conference, Hunter Valley, NSW, Australia, 26–27 September 2006; pp. 261–271. [Google Scholar]
  80. Wagner, H. Deep Mining: A Rock Engineering Challenge. Rock Mech. Rock Eng. 2019, 52, 1417–1446. [Google Scholar] [CrossRef] [Green Version]
  81. Scoble, M.J.; Lizotte, Y.C.; Paventi, M.; Mohanty, B.B. Measurement of blast damage. Min. Eng. 1997, 49, 103–108. [Google Scholar]
  82. Dowd, P.A.; Xu, C.; Coward, S. Strategic mine planning and design: Some challenges and strategies for addressing them. Min. Technol. 2016, 125, 22–34. [Google Scholar] [CrossRef]
  83. Sotoudeh, F.; Kakaie, R.; Ataei, M. Development of a computer program for underground mine stope optimisation using a heuristic algorithm. In Proceedings of the First International Conference on Underground Mining Technology, Sudbury, ON, Canada, 11–13 October 2017; pp. 689–700. [Google Scholar]
  84. Grieco, N.; Dimitrakopoulos, R. Managing grade risk in stope design optimisation: Probabilistic mathematical programming model and application in sublevel stoping. Min. Technol. 2007, 116, 49–57. [Google Scholar] [CrossRef]
  85. Villalba Matamoros, M.E.; Kumral, M. Underground mine planning: Stope layout optimisation under grade uncertainty using genetic algorithms. Int. J. Min. Recl. Environ. 2019, 33, 353–370. [Google Scholar] [CrossRef]
  86. Bootsma, M.; Alford, C.; Benndorf, J.; Buxton, M. Cut-off Grade Based Sublevel Stope Mine Optimisation. Adv. Appl. Strat Min. Plan 2018, 537–557. [Google Scholar] [CrossRef]
  87. Will, K.; Vendla, S. Underground Cut-off Grade Optimisation in Narrow Vein Deposits Based on an Innovative Mine Design Algorithm. Min. Rep. Glückauf 2018, 154, 452–459. [Google Scholar]
  88. Hou, X.; Dowd, P. Integrated optimisation of stope boundary and access layout for underground mining operations. Min. Technol. 2019, 128, 193–205. [Google Scholar] [CrossRef]
  89. Hou, J.; Li, G.; Wang, H.; Hu, N. Genetic algorithm to simultaneously optimise stope sequencing and equipment dispatching in underground short-term mine planning under time uncertainty. Int. J. Min. Recl. Environ. 2019, 34, 307–32519. [Google Scholar] [CrossRef]
  90. Mishra, R.; Kiuru, R.; Uotinen, L.; Janiszewski, M.; Rinne, M. Combining expert opinion and instrumentation data using Bayesian networks to carry out stope collapse risk assessment. In Proceedings of the MGR 2019: Proceedings of the First International Conference on Mining Geomechanical Risk, Perth, Australia, 9–11 April 2019; Wesseloo, J., Ed.; Australian Centre for Geomechanics: Perth, Australia; pp. 85–96. [Google Scholar] [CrossRef] [Green Version]
  91. Mousavi, A.; Sellers, E. Optimisation of production planning for an innovative hybrid underground mining method. Resour. Policy 2019, 62, 184–192. [Google Scholar] [CrossRef]
  92. McGaughey, J. Artificial intelligence and big data analytics in mining geomechanics. In Proceedings of the Ninth International Conference on Deep and High. Stress Mining, The Southern Africa Institute of Mining and Metallurgy, Johannesburg, South Africa, 24–25 June 2019; Joughin, W., Ed.; pp. 45–54. [Google Scholar]
  93. Adoko, A.C.; Saadaari, F.; Mireku-Gyimah, D. A Feasibility Study on the Implementation of Neural Network Classifiers for Open Stope Design. Geotech. Geol. Eng. 2021, 1–20. [Google Scholar] [CrossRef]
  94. Bazarbay, B.; Adoko, A.C. A Comparison of Prediction and Classification Models of Unplanned Stope Dilution in Open Stope Design. In Proceedings of the 55th U.S. Rock Mechanics/Geomechanics Symposium, Virtual Event, 22 June 2021. [Google Scholar]
  95. Bouzeran, L.; Pierce, M.; Jalbout, A.; Ruest, M. Stoping sequence optimisation at Eleonore Mine based on stress analysis through horizon scale numerical modelling. In Proceedings of the Ninth International Conference on Deep and High Stress Mining, Johannesburg, South Africa, 24–25 June 2019; Joughin, W., Ed.; The Southern Africa Institute of Mining and Metallurgy: Johannesburg, South Africa; pp. 253–266. [Google Scholar]
  96. Topal, E. Early start and late start algorithms to improve the solution time for long-term underground mine production scheduling. J. S. Afr. Inst. Min. Metall. 2008, 108, 99–107. [Google Scholar]
  97. Topal, E.; Sens, J. A new algorithm for stope boundary optimization. J. Coal Sci. Eng. (China) 2010, 16, 113–119. [Google Scholar] [CrossRef]
  98. Copland, T.; Nehring, M. Integrated optimization of stope boundary selection and scheduling for sublevel stoping operations. J. S. Afr. Inst. Min. Metall 2016, 116, 1135–1142. [Google Scholar] [CrossRef]
  99. Ovanic, J.; Young, D.S. Economic Optimization of Stope Geometry Using Separable Programming with Special Branch and Bound Technique. In Proceedings of the 3rd Canadian Conference on Computer Applications in the Minerals Industry, Montreal, QC, Canada, 22–25 October 1995. [Google Scholar]
  100. Ovanic, J.; Young, D.S. Economic Optimization of Open Stope Geometry. In Proceedings of the 28th International APCOM Symposium, Golden, CO, Canada, 20–22 October 1999. [Google Scholar]
  101. Cawrse, I. Multiple Pass Floating Stope Process. In Proceedings of the 4th Biennial Strategic Mine Planning Conference; The Australasian Institute of Mining and Metallurgy: Melbourne, Australia, 2001. Available online: https://www.researchgate.net/publication/287021836_Multiple_Pass_Floating_Stope_Process (accessed on 1 December 2021).
  102. Ataee-Pour, M. A critical survey of the existing stope layout optimization techniques. J. Min. Sci. 2005, 41, 447–466. [Google Scholar] [CrossRef]
  103. Alford, C.; Brazil, M.; Lee, D.H. Optimisation in underground mining. In Handbook of Operations Research in Natural Resources; Springer: Boston, MA, USA, 2007; pp. 561–577. [Google Scholar]
  104. Alford, C.; Hall, B. Stope Optimisation Tools for Selection of Optimum Cut-off Grade in Underground Mine Design. In Project Evaluation Conference 2009; Australasian Institute of Mining and Metallurgy Publication, Curran Associates Inc.: Victoria, Australia, 2009; pp. 135–143. [Google Scholar]
  105. Bai, X.; Marcotte, D.; Simon, R. Underground stope optimization with network flow method. Comput. Geosci. 2013, 52, 361–371. [Google Scholar] [CrossRef]
  106. Sandanayake, D.; Topal, E.; Asad, M. A heuristic approach to optimal design of an underground mine stope layout. Appl. Soft Comput. 2015, 30, 595–603. [Google Scholar] [CrossRef]
  107. Keane, S. Optimization Improvements in Whittle using Stope Optimization Software. In Proceedings of the Mine Planning and Equipment Selection (MPES) Conference, Fremantle, WA, USA, 1–3 December 2010; pp. 121–128. [Google Scholar]
  108. Little, L. Simultaneous Optimisation of Stope Layouts and Production Schedules for Long-Term Underground Mine Planning. Ph.D. Thesis, University of Queensland, Queensland, Australia, 2012. [Google Scholar]
  109. Nikbin, V.; Ataee-Pour, M.; Shahriar, K.; Pourrahimian, Y. A 3D approximate hybrid algorithm for stope boundary optimization. Comput. Oper. Res. 2018, 115, 104475. [Google Scholar] [CrossRef]
  110. Amedjoe, C.G.; Agyeman, J. Assessment of effective factors in performance of an open stope using cavity monitoring system data: A case study. J. Geol. Min. Res. 2015, 7, 19–30. [Google Scholar]
  111. Riddle, J. A Dynamic Programming Solution of a Block Caving Mine Layout. In Proceedings of the 14th International APCOM Sympo-sium, New York, NY, USA; 1977. Available online: https://www.onemine.org/document/abstract.cfm?docid=32802&title=A-Dynamic-Programming-Solution-Of-A-BlockCaving-Mine-Layout (accessed on 1 December 2021).
  112. Jalali, S.; Ataee-Pour, M. A 2D dynamic programming algorithm to optimize stope boundaries. In Proceedings of the 13th Symposium on Mine Planning and Equipment Selection, Wroclaw, Poland, 1–3 September 2004; p. 13. [Google Scholar]
  113. Jalali, S.; Ataee-Pour, M.; Shahriyar, K.; Elahi, E. َA Computer Program to Optimize Stope Boundaries Using Probable Stope Algorithm. Iran. J. Min. Eng. (IRJME) 2007, 2, 7–14. [Google Scholar]
  114. Jalali, S.; Ataee-Pour, M.; Shahriyar, K. Rigorous algorithms to optimise stope boundaries: Capabilities, restrictions and applications. In Proceedings of the 7th International Scientific Conference-SGEM2007, Varna, Bulgaria, 11–15 June 2007. [Google Scholar]
  115. Jalali, S.E.; Ataee-Pour, M.; Shahriar, K.; Elahi-Zeyni, E.; Nikbin, V. Computer based optimisation of underground mining area. J. Civ. Environ. Eng. Sci. Technol. 2016, 48, 475–489. [Google Scholar]
  116. Alford, C. Optimisation in underground mine design. In Proceedings of the 25th International APCOM Symposium, Brisbane, Australia, 9–14 July 1995; pp. 213–218. [Google Scholar]
  117. Ataee-Pour, M. A Heuristic Algorithm to Optimise Stope Boundaries. Ph.D. Thesis, Faculty of Engineering, University of Wollongong, Wollongong, Australia, 2000. [Google Scholar]
  118. Bai, X.; Marcotte, D.; Simon, R. A heuristic sublevel stope optimizer with multiple raises. J. S. Afr. Inst. Min. Metall. 2014, 114, 427–434. [Google Scholar]
  119. Nikbin, V.; Ataee-pour, M.; Shahriar, K.; Pourrahimian, Y.; MirHassani, S.A. Stope boundary optimization: A mathematical model and efficient heuristics. Resour. Policy 2019, 62, 515–526. [Google Scholar] [CrossRef]
  120. Cheimanoff, N.; Deliac, E.; Mallet, J. GEOCAD: An alternative CAD and artificial intelligence tool that helps moving from geological resources to mineable reserves. In Proceedings of the 21st Application of Computers and Operations Research in the Mineral Industry: 21st International Symposium Papers, Las Vegas, NV, USA, 27 February–2 March 1989; p. 471. [Google Scholar]
  121. Erdogan, G.; Cigla, M.; Topal, E.; Yavuz, M. Implementation and comparison of four stope boundary optimization algorithms in an existing underground mine. Int. J. Min. Reclam. Environ. 2017, 31, 389–403. [Google Scholar] [CrossRef]
  122. Fowler, F.J., Jr. Improving Survey Questions: Design and Evaluation. In Applied Social Research Methods Series; SAGE Publications: Thousand Oaks, CA, USA, 1995; Volume 38. [Google Scholar]
  123. Regmi, P.; Waithaka, E.; Paudyal, A.; Simkhada, P.; Van Teijlingen, E. Guide to the design and application of online questionnaire surveys. Nepal J. Epidemiol. 2016, 6, 640–644. [Google Scholar] [CrossRef] [PubMed]
  124. WebRoPol. Available online: https://webropol.com/ (accessed on 9 September 2021).
  125. Mining Intelligence. Available online: https://www.miningintelligence.com/ (accessed on 9 September 2021).
  126. Suresh, K.P.; Chandrashekara, S. Sample size estimation and power analysis for clinical research studies. J. Hum. Reprod. Sci. 2012, 5, 7–13. [Google Scholar] [CrossRef] [PubMed]
  127. Pontow, S. Evaluation of Methods for Stope Design in Mining and Potential of Improvement by Pre-Investigations. Master’s Thesis, Aalto University, Aalto, Finland, 2019. [Google Scholar]
  128. Friedman, J.; Alm, E.J. Inferring correlation networks from genomic survey data. PLoS Comput. Biol. 2012, 8, e1002687. [Google Scholar] [CrossRef] [Green Version]
  129. Lynn, P. Hypothesis Testing Using Complex Survey Data. A Short Course Presented by Peter Lynn, University of Essex in Association with the Conference of the European Survey Research Association. 2007. Available online: https://www.restore.ac.uk/Longitudinal/surveynetwork/documents/PragueCourseNotesPLv3.pdf (accessed on 1 December 2021).
  130. Szydlowska, M. Systematic Review of Georisk in Underground Hard Rock Mines. Master’s Thesis, Aalto University, Espoo, Finland, 2016. [Google Scholar]
  131. Mishra, R.K.; Janiszewski, M.; Uotinen, L.K.T.; Szydlowska, M.; Siren, T.; Rinne, M. Geotechnical Risk Management Concept for Intelligent Deep Mines. Procedia Eng. 2017, 191, 361–368. [Google Scholar] [CrossRef]
Figure 1. Origin of survey respondents: (a) survey distribution method (b) region.
Energies 15 00240 g001
Figure 2. Applied mining methods at mines participating in the survey.
Energies 15 00240 g002
Figure 3. Ratio of the mines where changes were made to the applied mining methods, which indicates the process is adjusted to the conditions.
Energies 15 00240 g003
Figure 4. Geological conditions present at mines represented in the survey.
Energies 15 00240 g004
Figure 5. Ratio of the method that is used for design stopes in the mines.
Energies 15 00240 g005
Figure 6. Ratio of the applied empirical method for designing stopes: Mathew’s stability graph, Mathews modified stability graph, and other (e.g., rock mass rating, RMR).
Energies 15 00240 g006
Figure 7. Mining stage at which the stope design process takes place. The iterative stage means the stope design takes place in multiple stages with a feedback loop.
Energies 15 00240 g007
Figure 8. Duration of stope design.
Energies 15 00240 g008
Figure 9. Impact of factors on stope design (1 = very unimportant to 5 = very important).
Energies 15 00240 g009
Figure 10. The application of stope performance and control after excavation takes place (a) including the cavity monitoring system (CMS) to measure the stopes (b).
Energies 15 00240 g010
Figure 11. Most important improvement suggestions for stope design.
Energies 15 00240 g011
Figure 12. The current utilization of rock mass and ore investigation methods in the mines (a) and the type of method that is used to collect rock mass and ore data (b).
Energies 15 00240 g012
Figure 13. The planned implementation of rock mass and ore characterization methods for stope design (a) and the type of method that is planned to be used to collect rock mass and ore data (b).
Energies 15 00240 g013
Figure 14. Interest in new rock and ore classification methods (a) and rock mass characterization methods (b).
Energies 15 00240 g014
Figure 15. Willingness to implement changes in the stope design process (a) and the acceptance conditions to implement new methods (b) (other requirements identified were realized benefits, reliability, predictability, faster process, and new personnel).
Energies 15 00240 g015
Figure 16. Number of responses on the tolerable time for measurement data to become available for stope design.
Energies 15 00240 g016
Figure 17. Correlation of the current (left) and planned (right) utilization of rock mass and ore characterization methods with geological conditions.
Energies 15 00240 g017
Figure 18. Correlation of geological conditions and the applied stope design method.
Energies 15 00240 g018
Table 1. Questions asked in the industry survey on stope design methods.
Question
Q1.Provide your contact details and position
Q2.Do you wish to be notified about the results of the survey?
Q3.Which exact stoping/mining methods do you apply?
Q4.Have there been changes in your applied mining/stoping methods and if so why and when?
Q5.Which mining methods did you use previously?
Q6.Which methods are you currently applying to design your stopes?
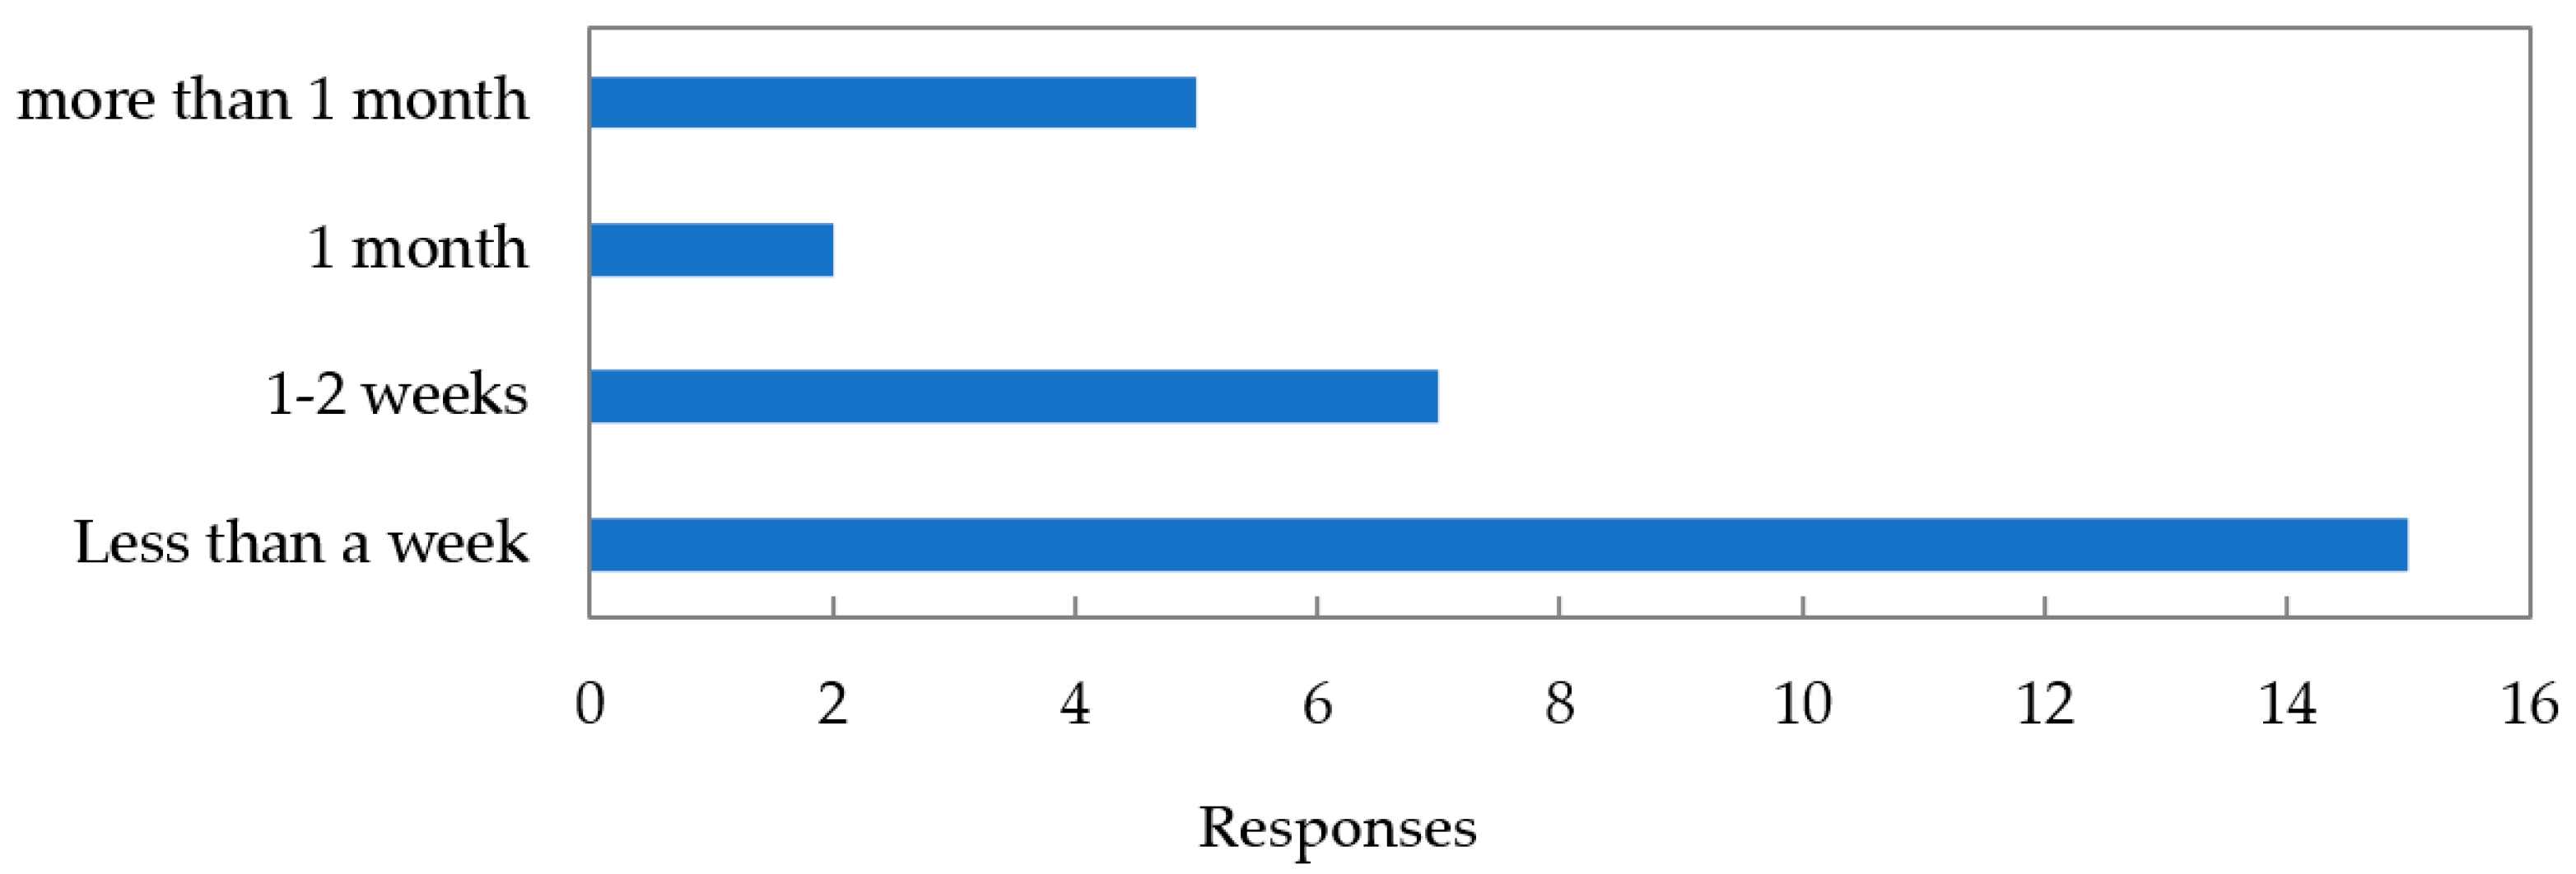
Q7.How long does the process of designing stopes usually take and how many people are commonly involved?
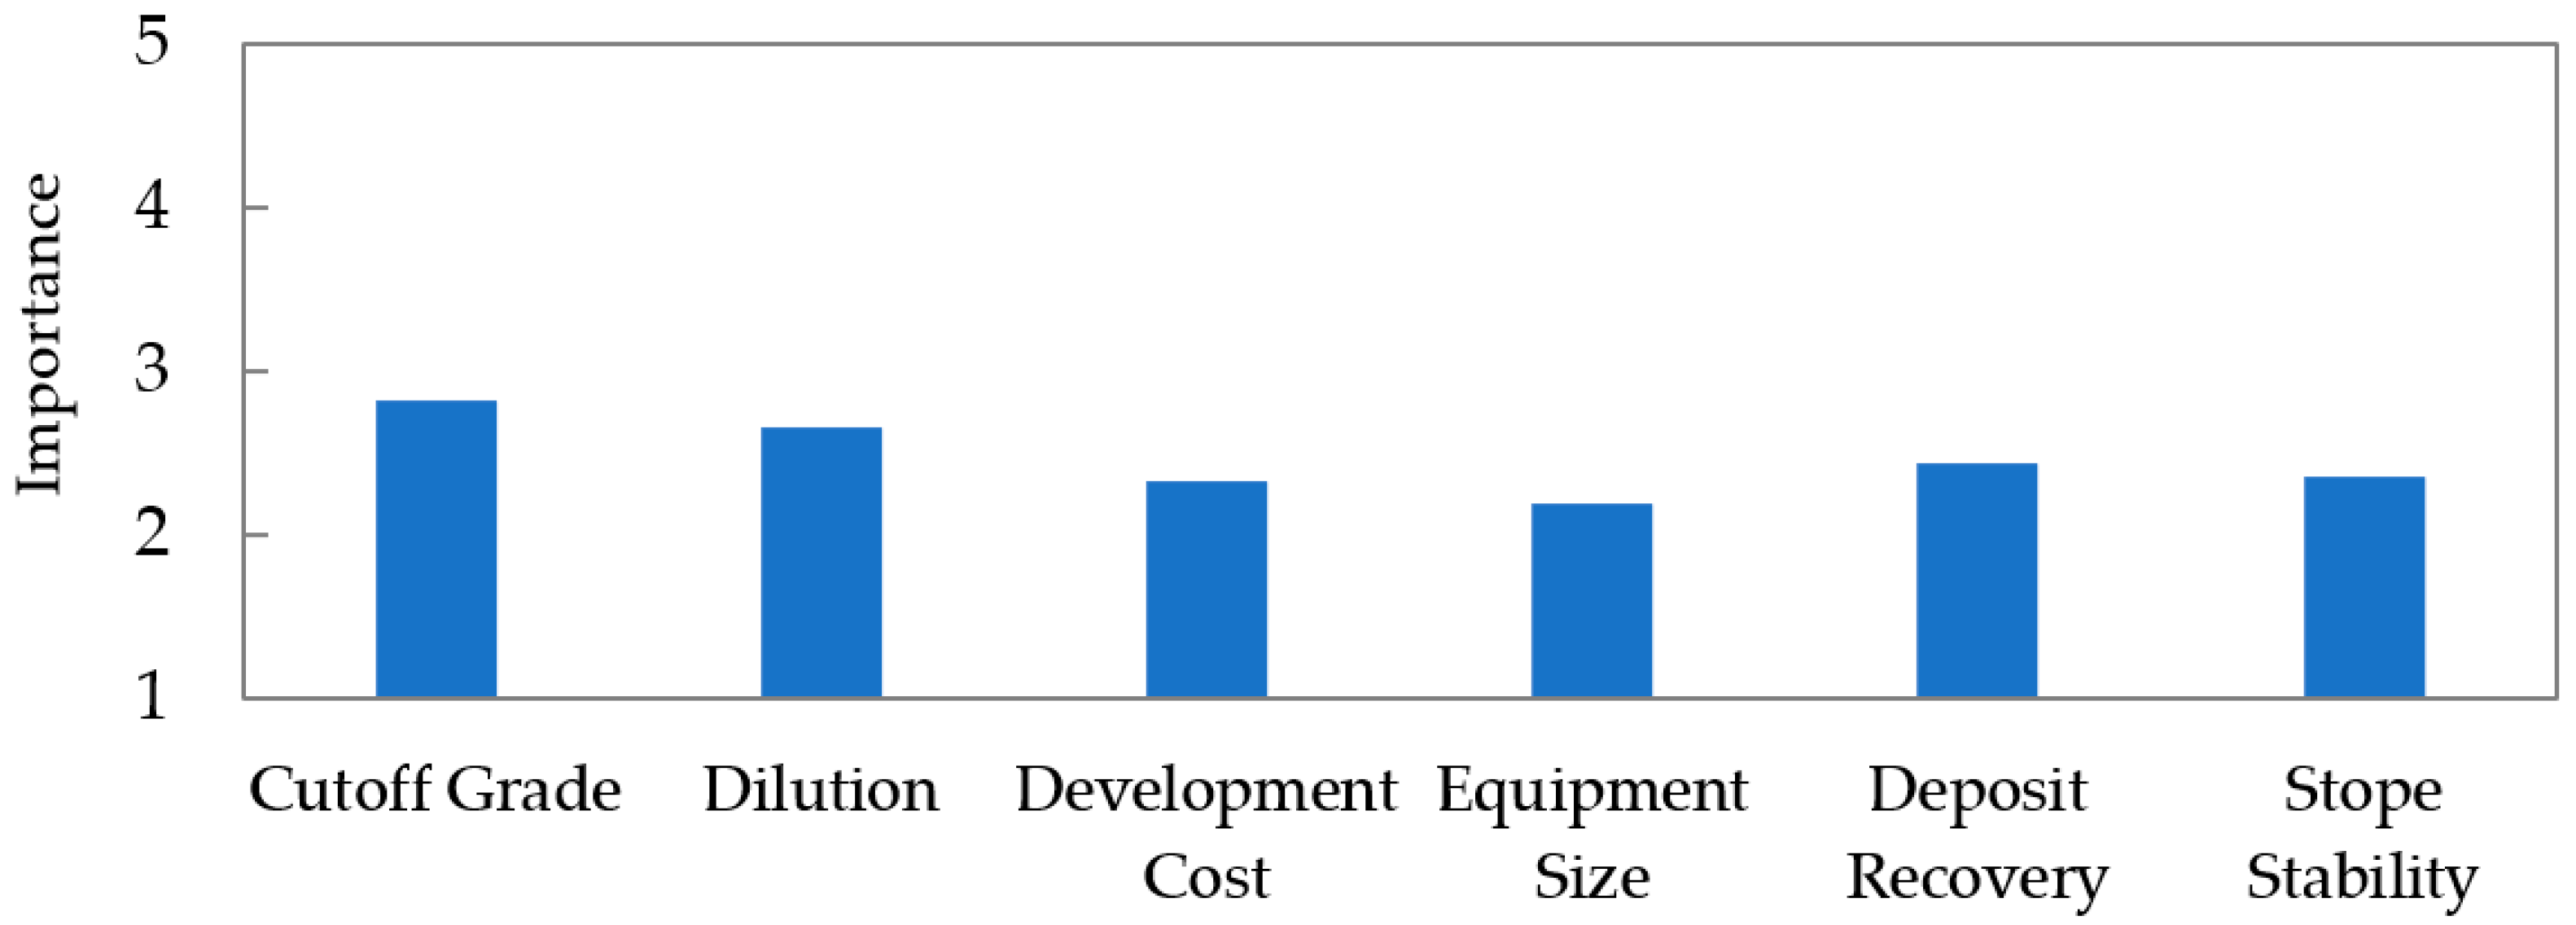
Q8.How important are different parameters for the stope design (1 = very important; 5 = very unimportant)?
Q9.How challenging are the geological conditions in your deposit?
Q10.Are your stopes checked for accuracy and stability after excavation?
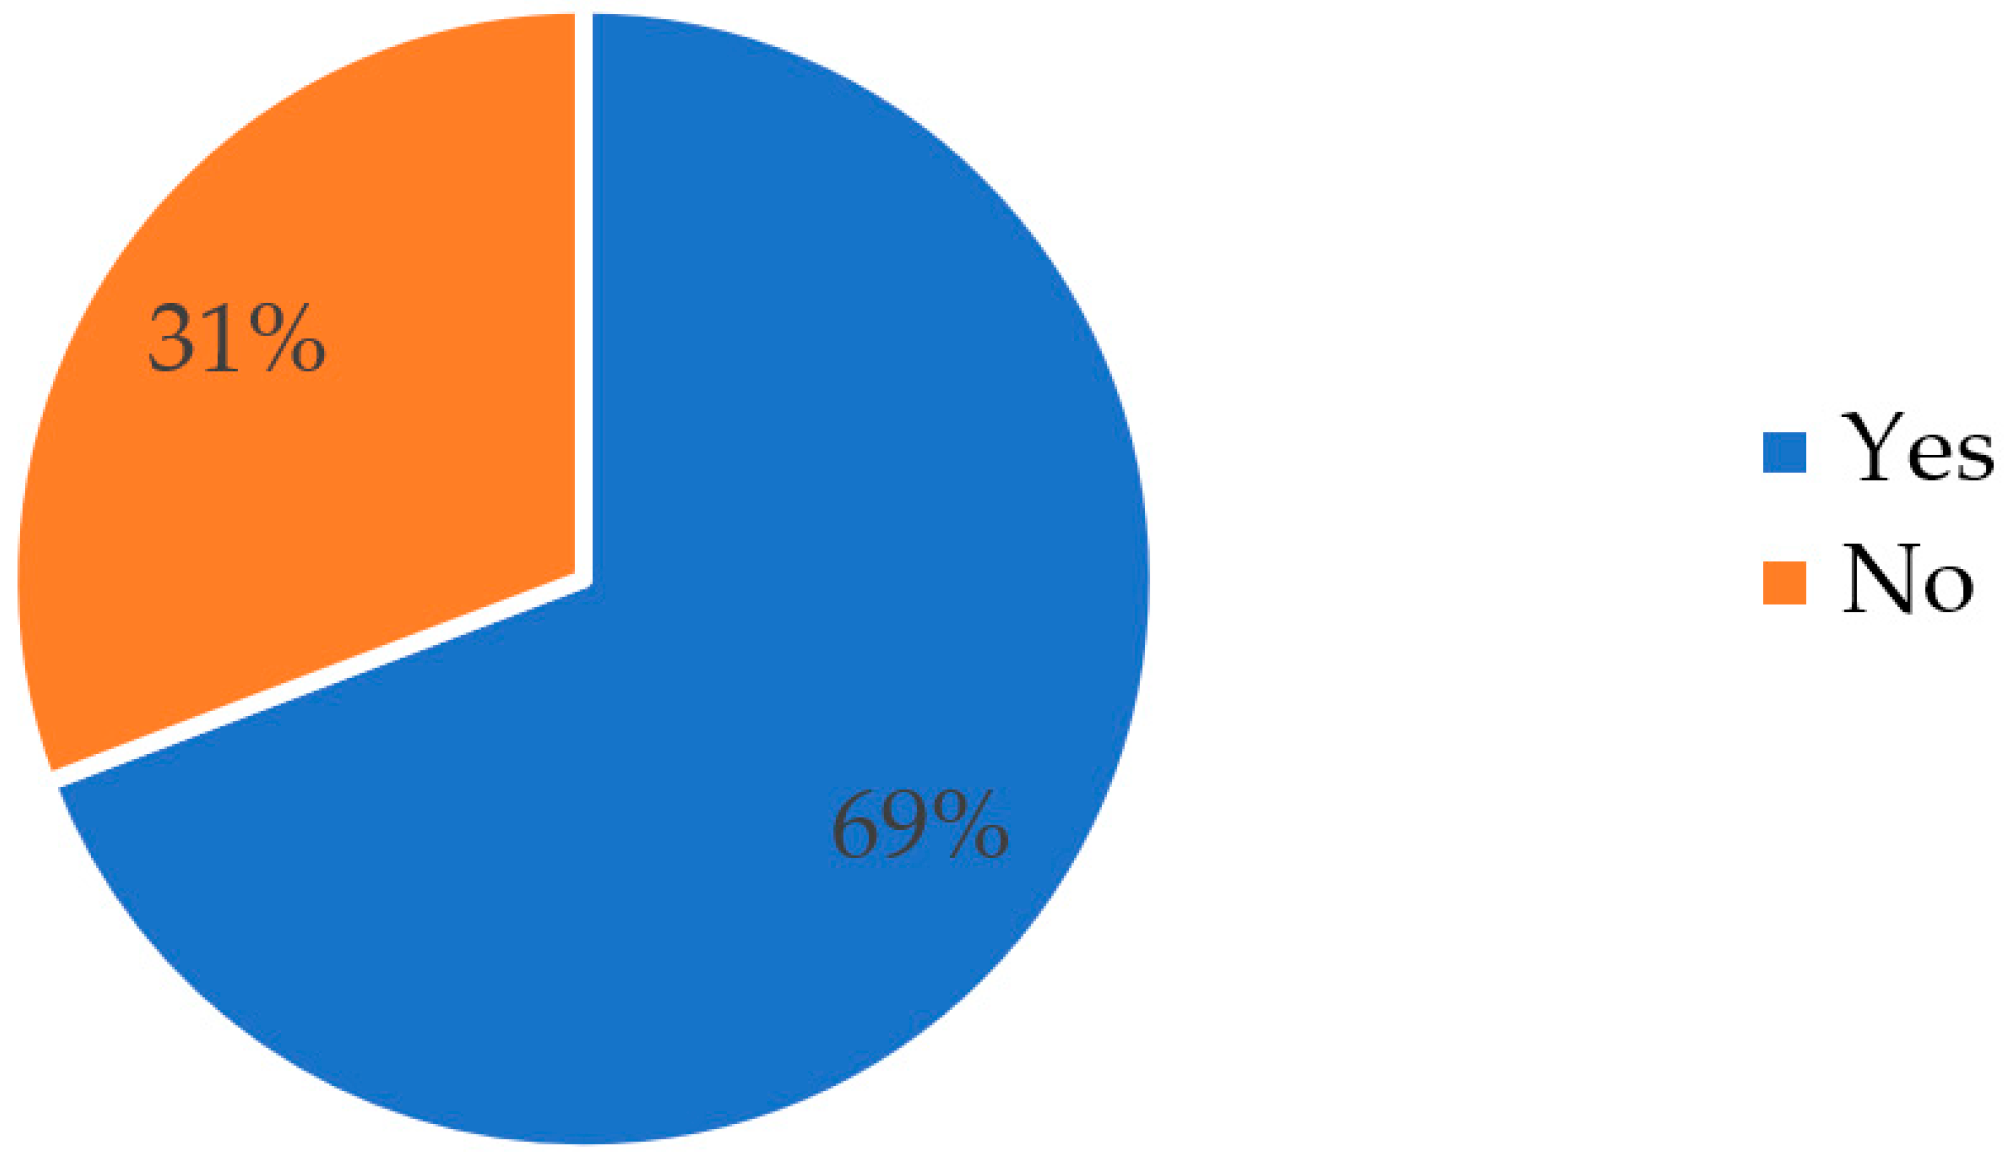
Q11.Would you recommend your current stope design and stability estimations to other mines?
Q12.What would you consider the most valuable improvement to the stope designing process?
Q13.Have you utilized any geochemical, geophysical and/or geomechanical investigation methods for stope design before?
Q14.Are you planning to utilize geochemical, geophysical and/or geomechanical methods for your stope design?
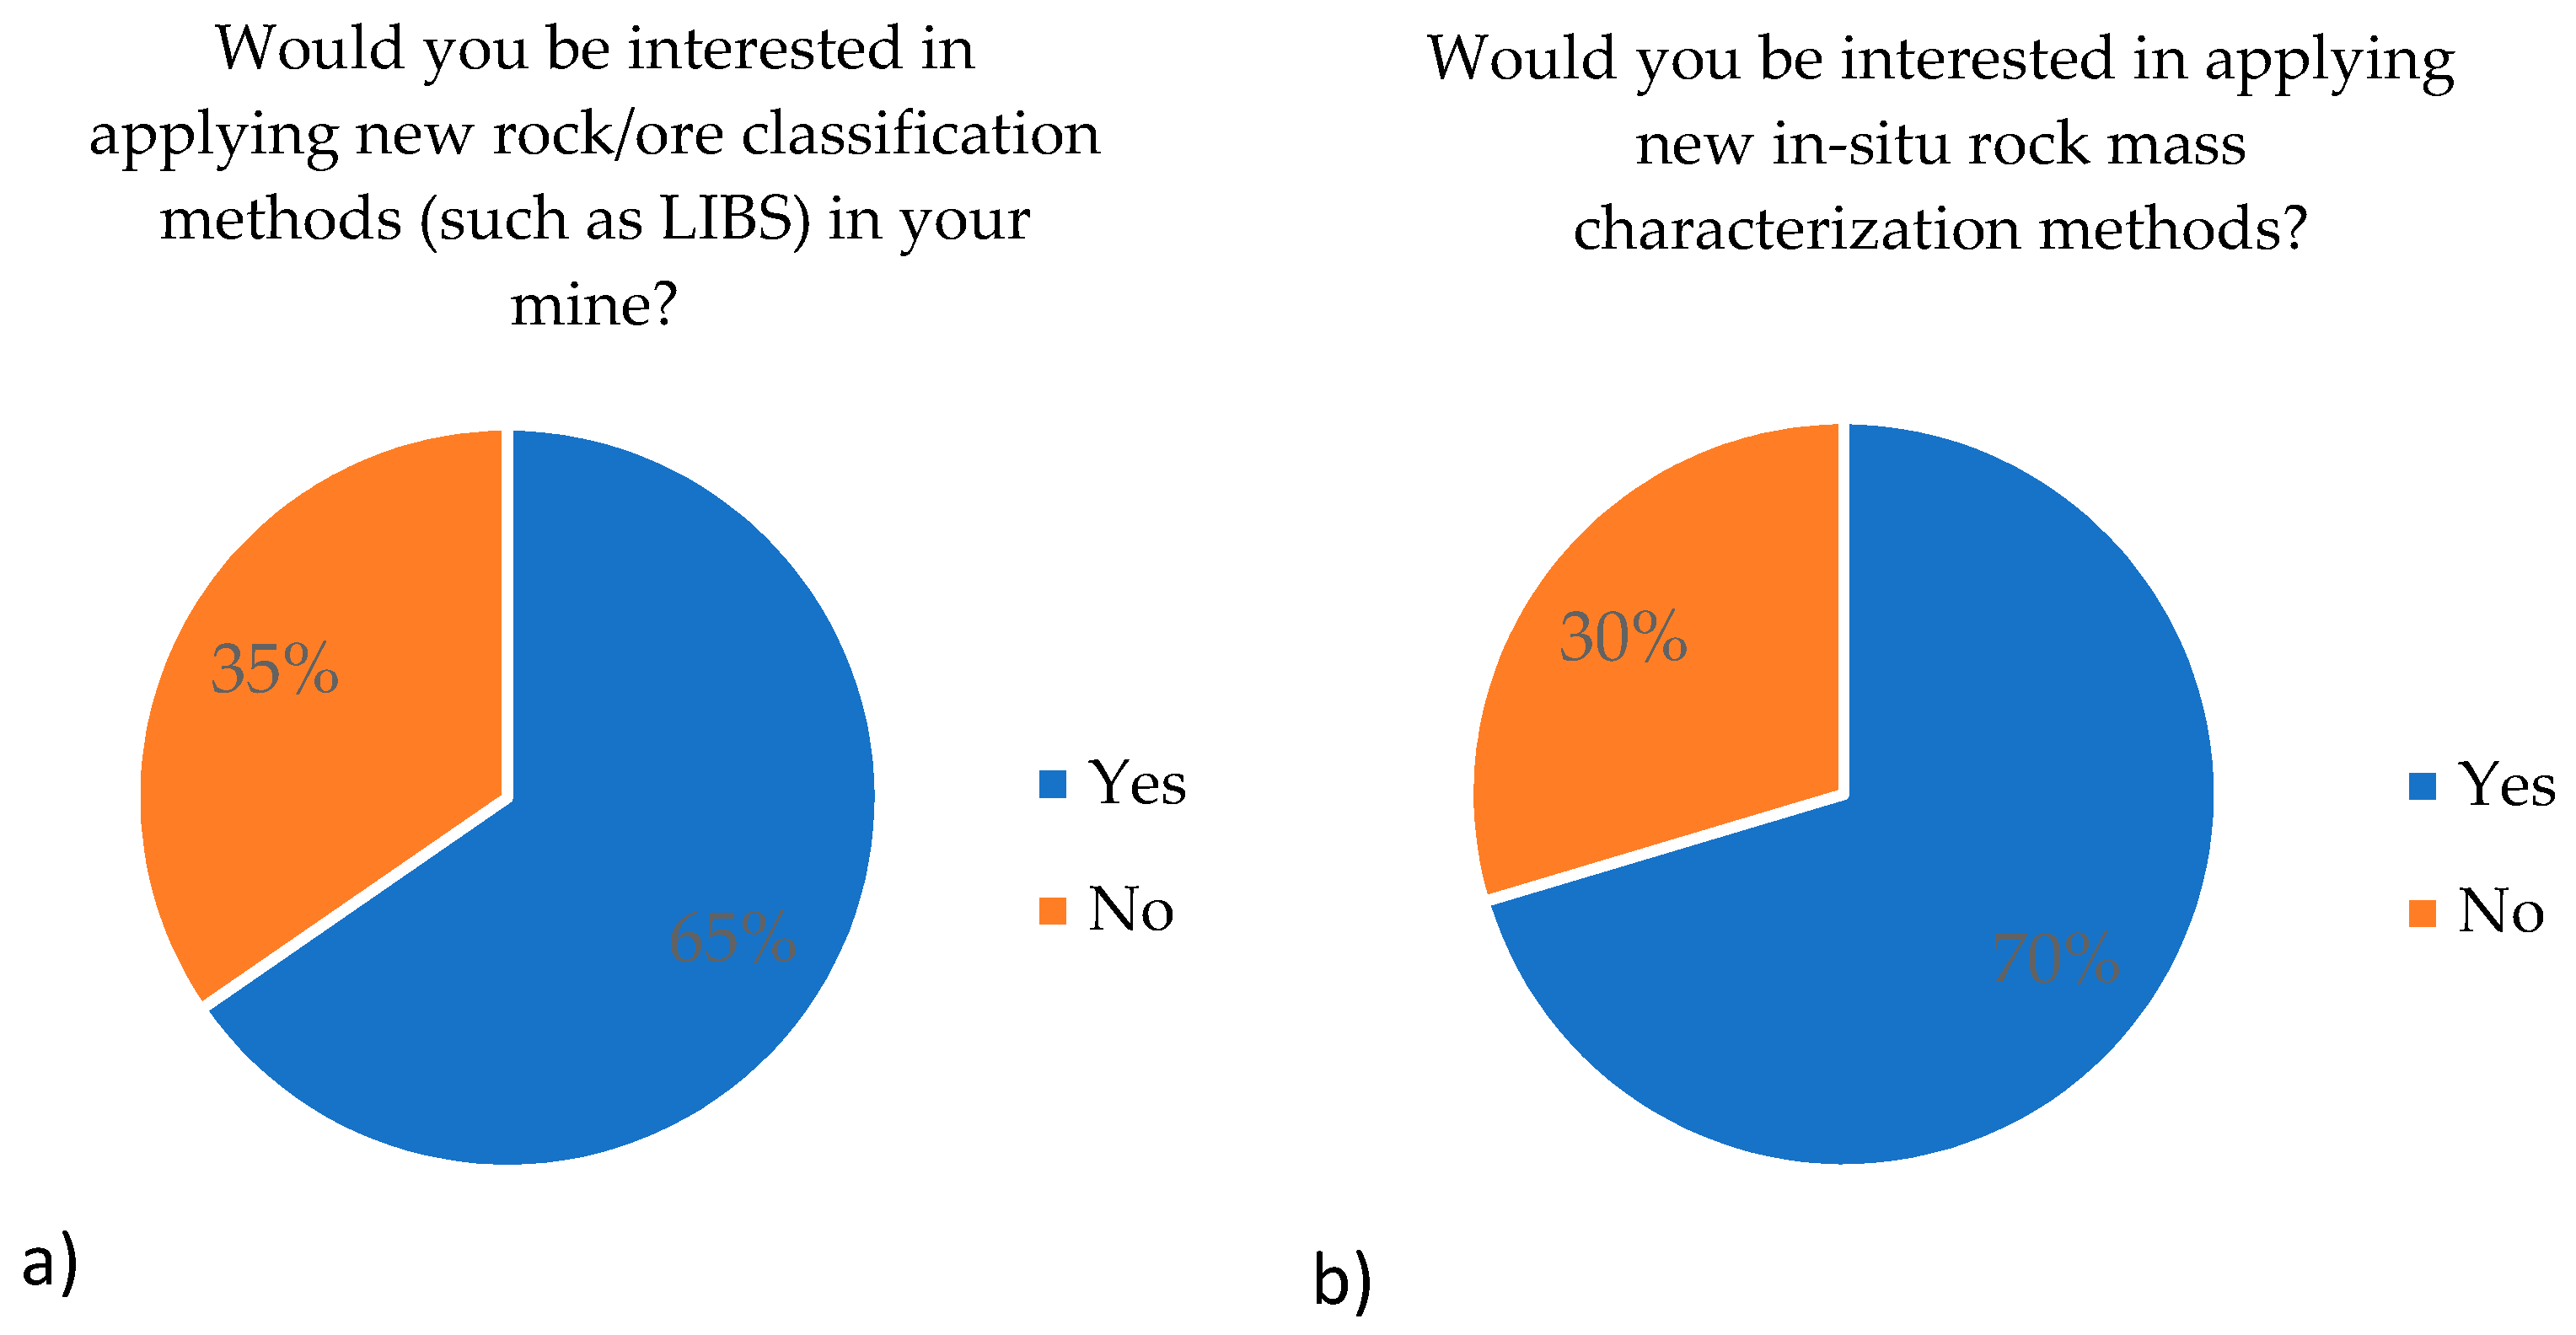
Q15.Would you be interested in applying new rock/ore characterization methods?
Q16.Would you be interested in applying new in-situ rock mass characterization methods (geophysical/geomechanical tests) in your mine?
Q17.How fast would new geochemical/geophysical/geomechanical information have to be available to be implemented in the stope designing process?
Q18.Would you consider implementing changes in your stope designing process and under what conditions?
Q19.Please feel free to leave any remarks or recommendations here.
Table 2. Response quality classification system.
ClassValueDescription
Disqualified0Disqualified response; due to unsatisfying response quality.
Low quality1Minimum standard, at least 80% of the questions answered, free-text answer length below 4 words on average or repetitive
Satisfying2Considerably complex answers for most part, multiple phrase free-text responses in some parts but not consistently
Excellent3Very complex answers, stretching over several phrases, respondent shows effort to explain his point of view and allows for thorough understanding
Table 3. Overview of response quality results grouped by means of contact.
ClassLinkedIn MessageE-MailForumTotal
Responses1613736
Average response quality2.11.81.61.9
Share of excellent responses31%23%29%28%
Publisher’s Note: MDPI stays neutral with regard to jurisdictional claims in published maps and institutional affiliations.

