Article

Characteristic Analysis and Experimental Verification of Electromagnetic and Vibration/Noise Aspects of Fractional-Slot Concentrated Winding IPMSMs of e-Bike

Department of Electrical Engineering, Chungnam National University, Daejeon 34134, Korea
*
Author to whom correspondence should be addressed.
Energies 2022, 15(1), 238; https://doi.org/10.3390/en15010238
Submission received: 2 December 2021 / Revised: 26 December 2021 / Accepted: 27 December 2021 / Published: 30 December 2021

Abstract

:
In this study, we performed the electromagnetic and mechanical characteristic analyses of an 8-pole 12-slot interior permanent magnet synchronous motor (IPMSM). Permanent magnet synchronous motors are classified into surface permanent magnet synchronous motor and interior permanent magnet synchronous motors according to the type of rotor. The IPM type is advantageous for high-speed operation because of the structure where the permanent magnet is embedded inside the rotor, and it has the advantage of having a high output density by generating not only the magnetic torque of the permanent magnet, but also the reluctance torque. However, such a motor has more vibration/noise sources than other types, owing to changes in reluctance. The sources of motor noise/vibration can be broadly classified into electromagnetic, mechanical, and aerodynamic sources. Electromagnetic noise sources are classified into electromagnetic excitation sources, torque pulsations, and unbalanced magnetic forces (UMFs). Vibration and noise cause machine malfunctions and affect the entire system. Therefore, it is important to analyze the electromagnetic vibration source. In this study, the electromagnetic characteristics of an IPMSM were analyzed through the finite element method to derive the UMF. Vibration and noise analyses were performed by electromagnetic–mechanical coupling analysis, and vibration and noise characteristics based on electromagnetic noise sources were analyzed.

1. Introduction

Recently, owing to the increasing public concern about environmental problems, such as global climate change, various technologies have been considered for this challenge. Particularly, ecofriendly mobility has attracted increasing attention because it contributes to reducing global warming. For the dissemination of ecofriendly mobility, it is necessary to develop high-performance traction motors that exhibit high torque at low speed, and constant output characteristics over a wide range. Considering this, interior permanent magnet synchronous motors (IPMSMs) are the most suitable traction motors for ecofriendly mobility.
In the electromagnetic aspect, IPMSMs produce reluctance torque, which is an additional torque, from the difference in inductances in the d and q axes. Furthermore, a permanent magnet mechanically inserted in the rotor prevents magnet scattering at high speeds and exhibits equal mechanical and electrical air-gap length [1,2]. Therefore, IPMSMs have a wider operating range through flux-weakening control compared to other types. However, the operating range differs according to the flux-weakening (FW) control range, which in turn depends on parameters such as the d- and q-axes inductance of the motor and the electrical saliency. Additionally, the FW control range, which is essential for motor design and optimization, can be predicted from the flux vector diagram of the motor [3,4,5,6,7].
In the vibration/noise aspect, IPMSMs suffer from more vibration/noise sources than other types of motors owing to changes in reluctance. Vibration and noise can cause motor eccentricity, bearing defects, and misalignments. Electromagnetic vibration sources are roughly classified into torque pulsations and electromagnetic forces [8]. Torque pulsation is classified as torque because of the interaction between the permanent magnets of the rotor and the stator slots of a permanent magnet machine (cogging torque) and load pulsation, owing to the interaction between the input current and the back-electromotive force (back-EMF) (torque ripple), and the difference between the d- and q-axes air-gap reluctance (reluctance torque). Electromagnetic force is classified as magnetic pull force (MPF) owing to the distribution of magnetic flux density generated by the slot structure and winding pattern and unbalanced magnetic force (UMF) generated according to the change in magnetic flux density [9,10,11,12,13,14,15]. MPF indicates the magnitude and distribution of the magnetic force density, which affects the motor based on the magnitude of the force, and not the distribution of the force. Additionally, the MPF distribution changes depending on the combination of the motor pole-slots, and the MPF distribution should be symmetrical to obtain motor stability. The electromagnetic vibration of the motor is mainly generated by the radial force, which is one of the components of the UMF [16,17,18,19]. The radial force is proportional to the square of the air-gap magnetic flux density, and as the torque density of the motor increases, the air-gap flux density also increases. Therefore, in the case of an electric motor with a high torque density, such as a PMSMs, the rate of electromagnetic vibration increases. Moreover, the spatial distribution of the radial force is affected by the stator and rotor, and its magnitude changes with time; thus, the radial force generates a vibration frequency that affects the vibration. This makes it possible to predict the electromagnetic noise/vibration characteristics generated by the motor [20,21,22,23,24]. If the noise and vibration characteristics of the motor are predicted through this method, not only the noise and vibration characteristics of the motor can be identified in the design stage, but also a more mechanically robust design can be made. In addition, as sensors and electronic components increase as the system becomes electronics, disturbance caused by the motor to the external system may be reduced in the design stage.
Therefore, in this study, dynamic modeling of the IPMSM was performed to predict the operation characteristics based on the electromagnetic characteristics and parameter analysis results of the model using the finite element method (FEM). Additionally, based on electromagnetic characteristic data, the vibration source generated in the stator was analyzed through the circumferential mode of the radial force, which is the electromagnetic vibration source, and the fast Fourier transform (FFT) analysis. Figure 1 shows the analysis flow of this study, and Table 1 lists the design specifications of the analysis model.

2. Electromagnetic Analysis

2.1. No-Load Analysis

The no-load back-EMF of a permanent magnet machine is the electromotive force induced by the interaction between the field magnetic flux and the armature winding. The no-load back-EMF waveform when controlling the IPMSM is realized as the basis for determining the accessibility of the control. That is, the closer the no-load back-EMF is to a sine wave, the easier it is to control the IPMSM. Moreover, electrical equipment generates cogging torque because of non-uniform air gap transmittance owing to the tooth slot structure, and this should be checked during no-load analysis.
The cogging torque is the torque component generated by the tendency of the stator and rotor to align in the direction that maximizes the permeance of the magnetic circuit in a permanent magnet machine. As shown in Equation (1), it can be expressed as a function of the magnetic flux density ( B r g , B θ g ) in the radial and tangential directions of the air gap, the length in the axial direction ( l s t k ), and the distance to the air gap ( r ). The cogging torque acts on the rotor without applying an input current (in a no-load state). Because there is no input current, the average torque is zero; thus, it is not recognized as an active ingredient that generates power. Additionally, the cogging torque generates torque ripple, velocity ripple, and vibration/noise. The harmonic component of the cogging torque is represented by a function of the number of poles and the least common multiple of the number of slots; the electric harmonic frequency of the cogging torque is as shown in Equation (2). f e represents the frequency of the motor, L C M ( 2 p , Q s ) represents the least common multiple of the number of poles and slots, and p denotes the number of pole pairs.
Figure 2a,b shows the magnitude and waveform of the no-load back electromotive force (EMF) and FFT analysis results of the no-load back-EMF. The total harmonic distortion (THD) of the no-load back-EMF was 5.17%. Figure 2c–e shows the no-load back-EMF of the experiment result, the magnitude and waveform of the cogging torque, and the FFT analysis results of the cogging torque.
T = r 2 l s t k μ 0 0 2 π B r g B θ g d θ
f c o g = f e L C M ( 2 p , Q s ) / p
The peak-to-peak value of the cogging torque is 34.9 mNm, and as a result of FFT analysis, the main harmonic order is interpreted as 6th, which is also consistent with the result of Equation (2).

2.2. Parameter Calculation
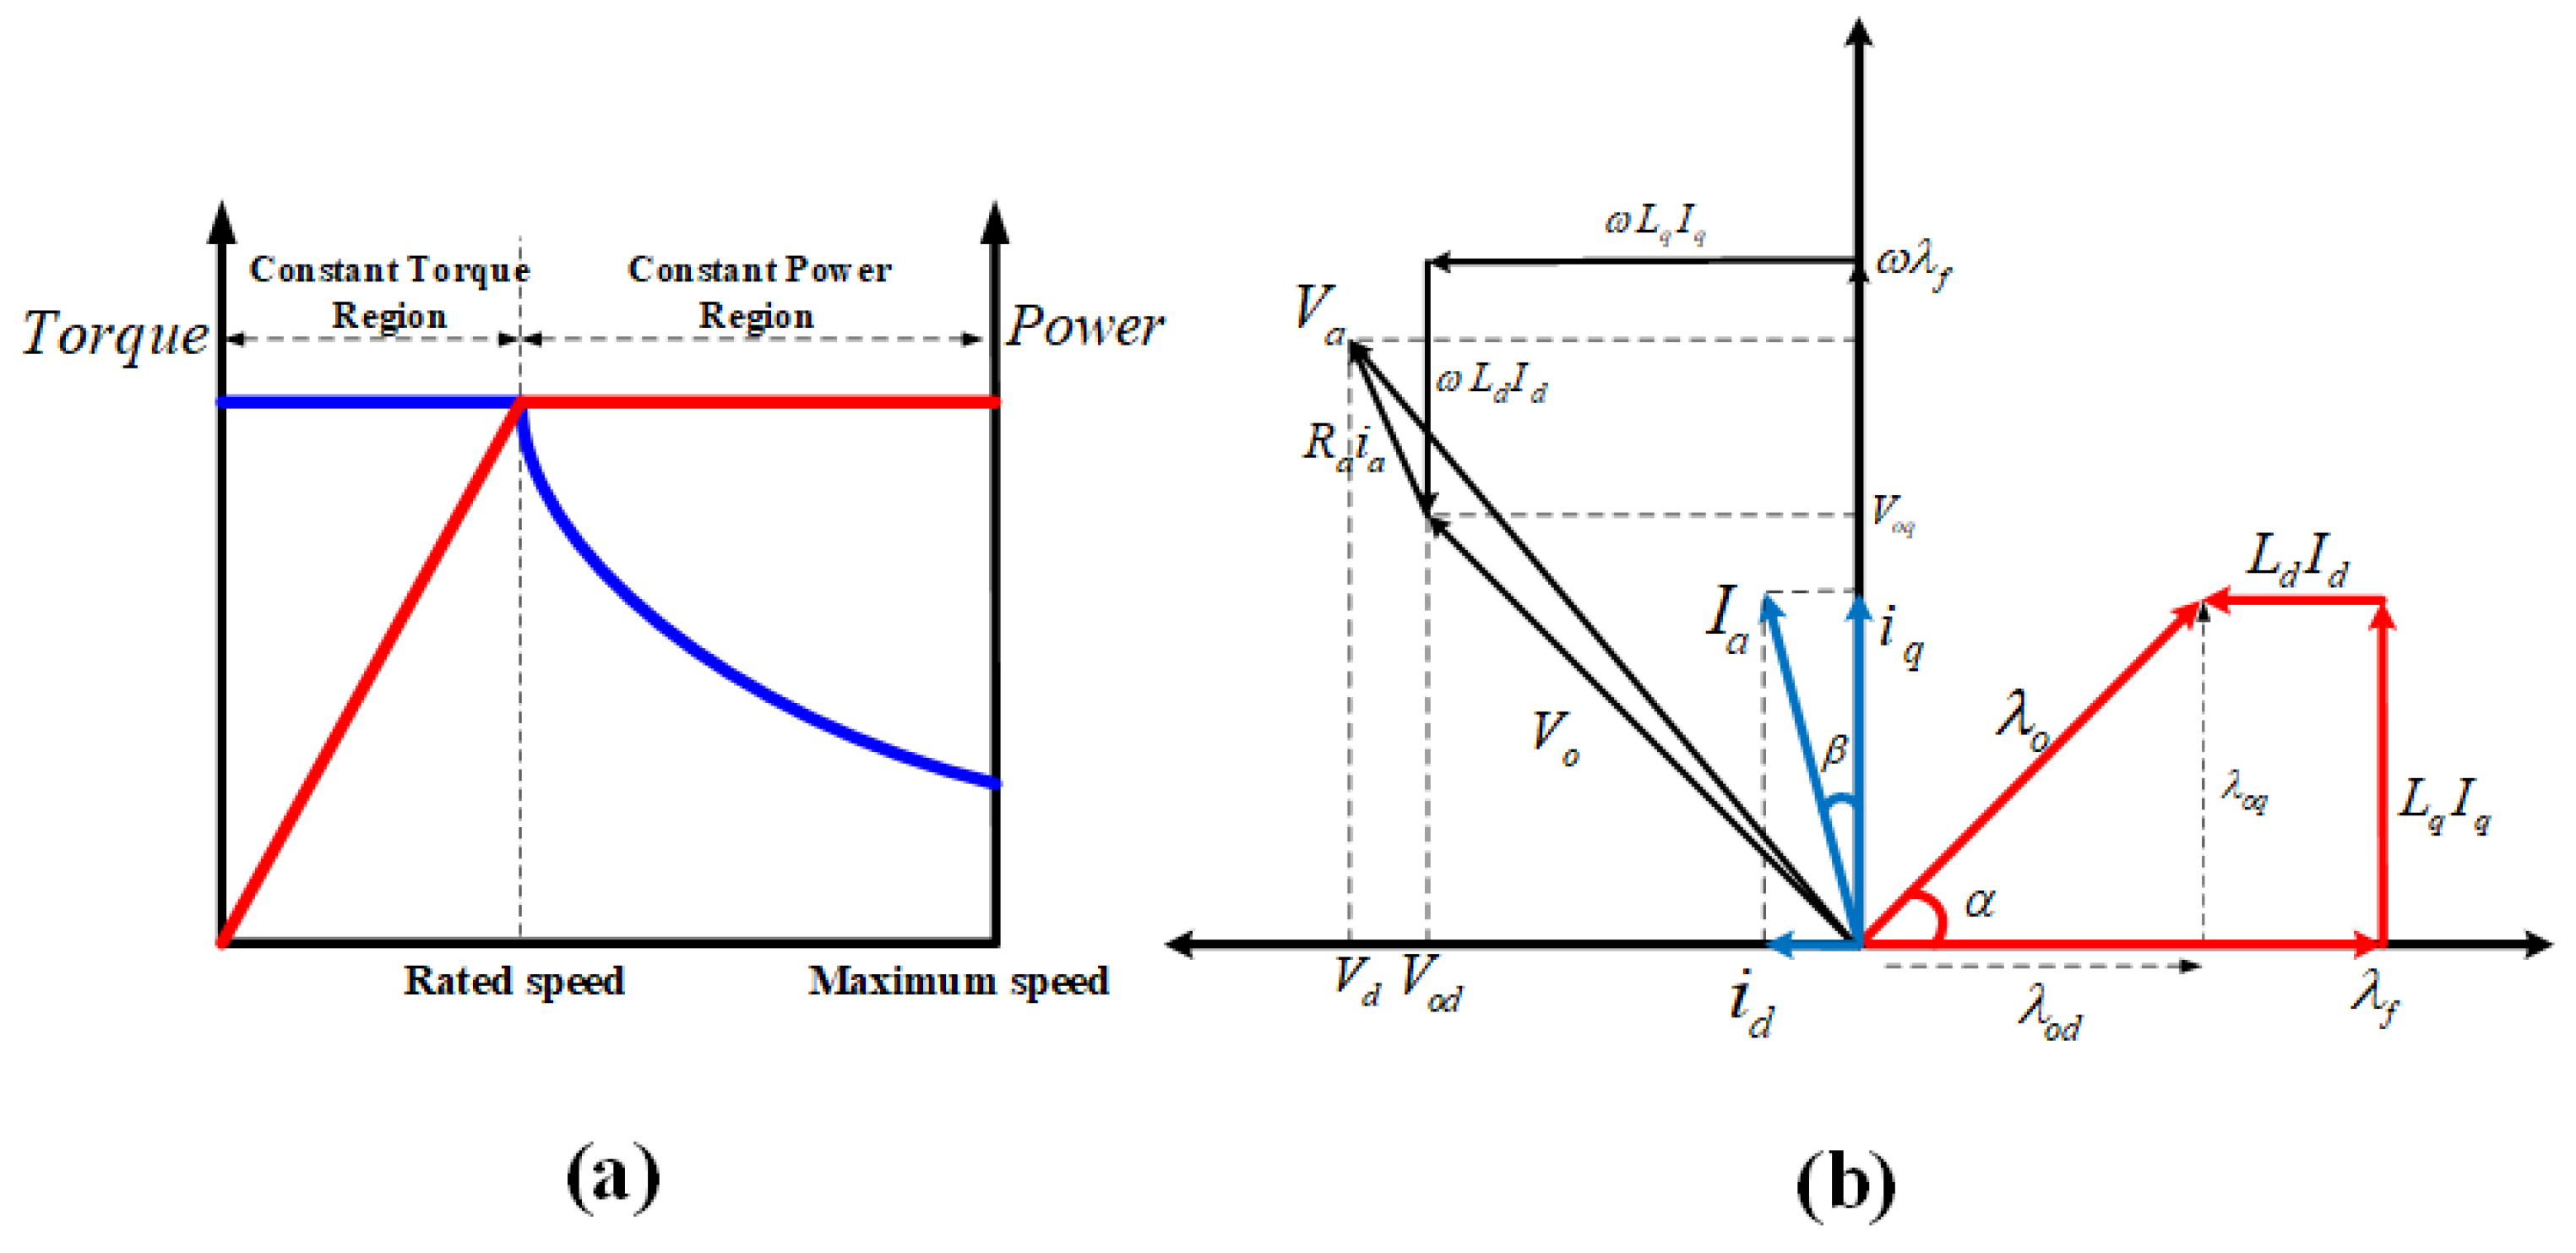
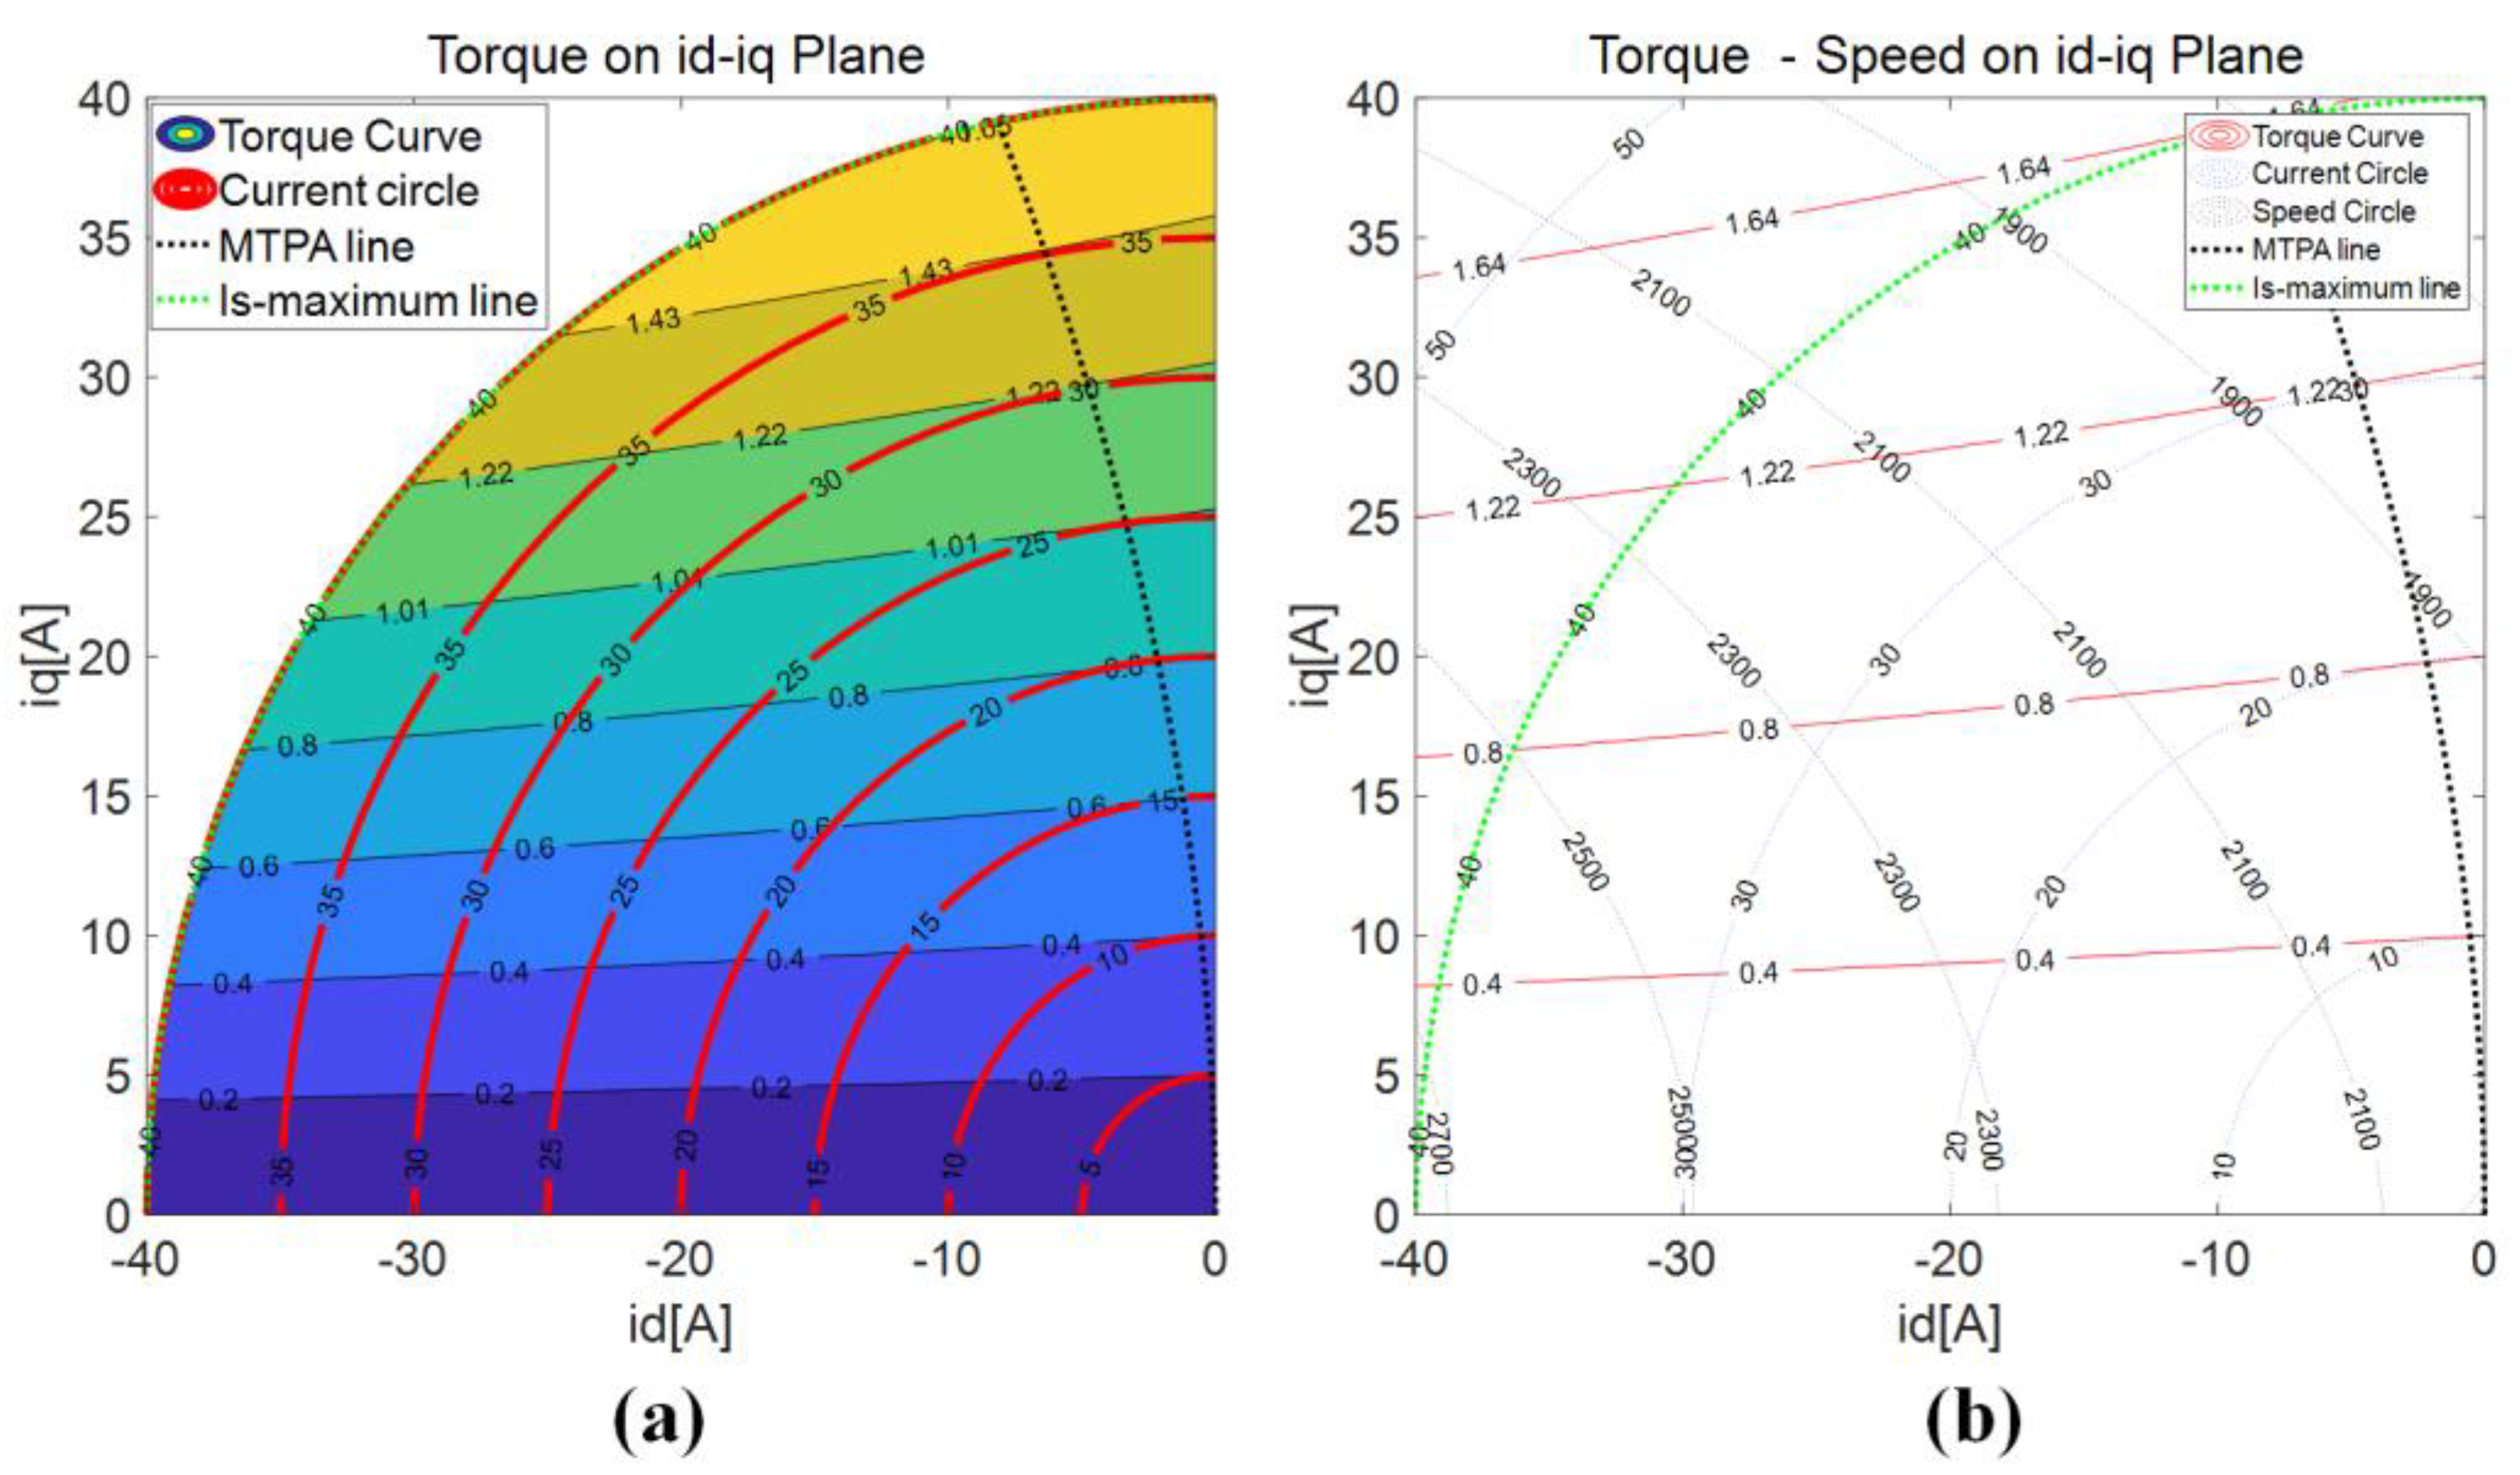
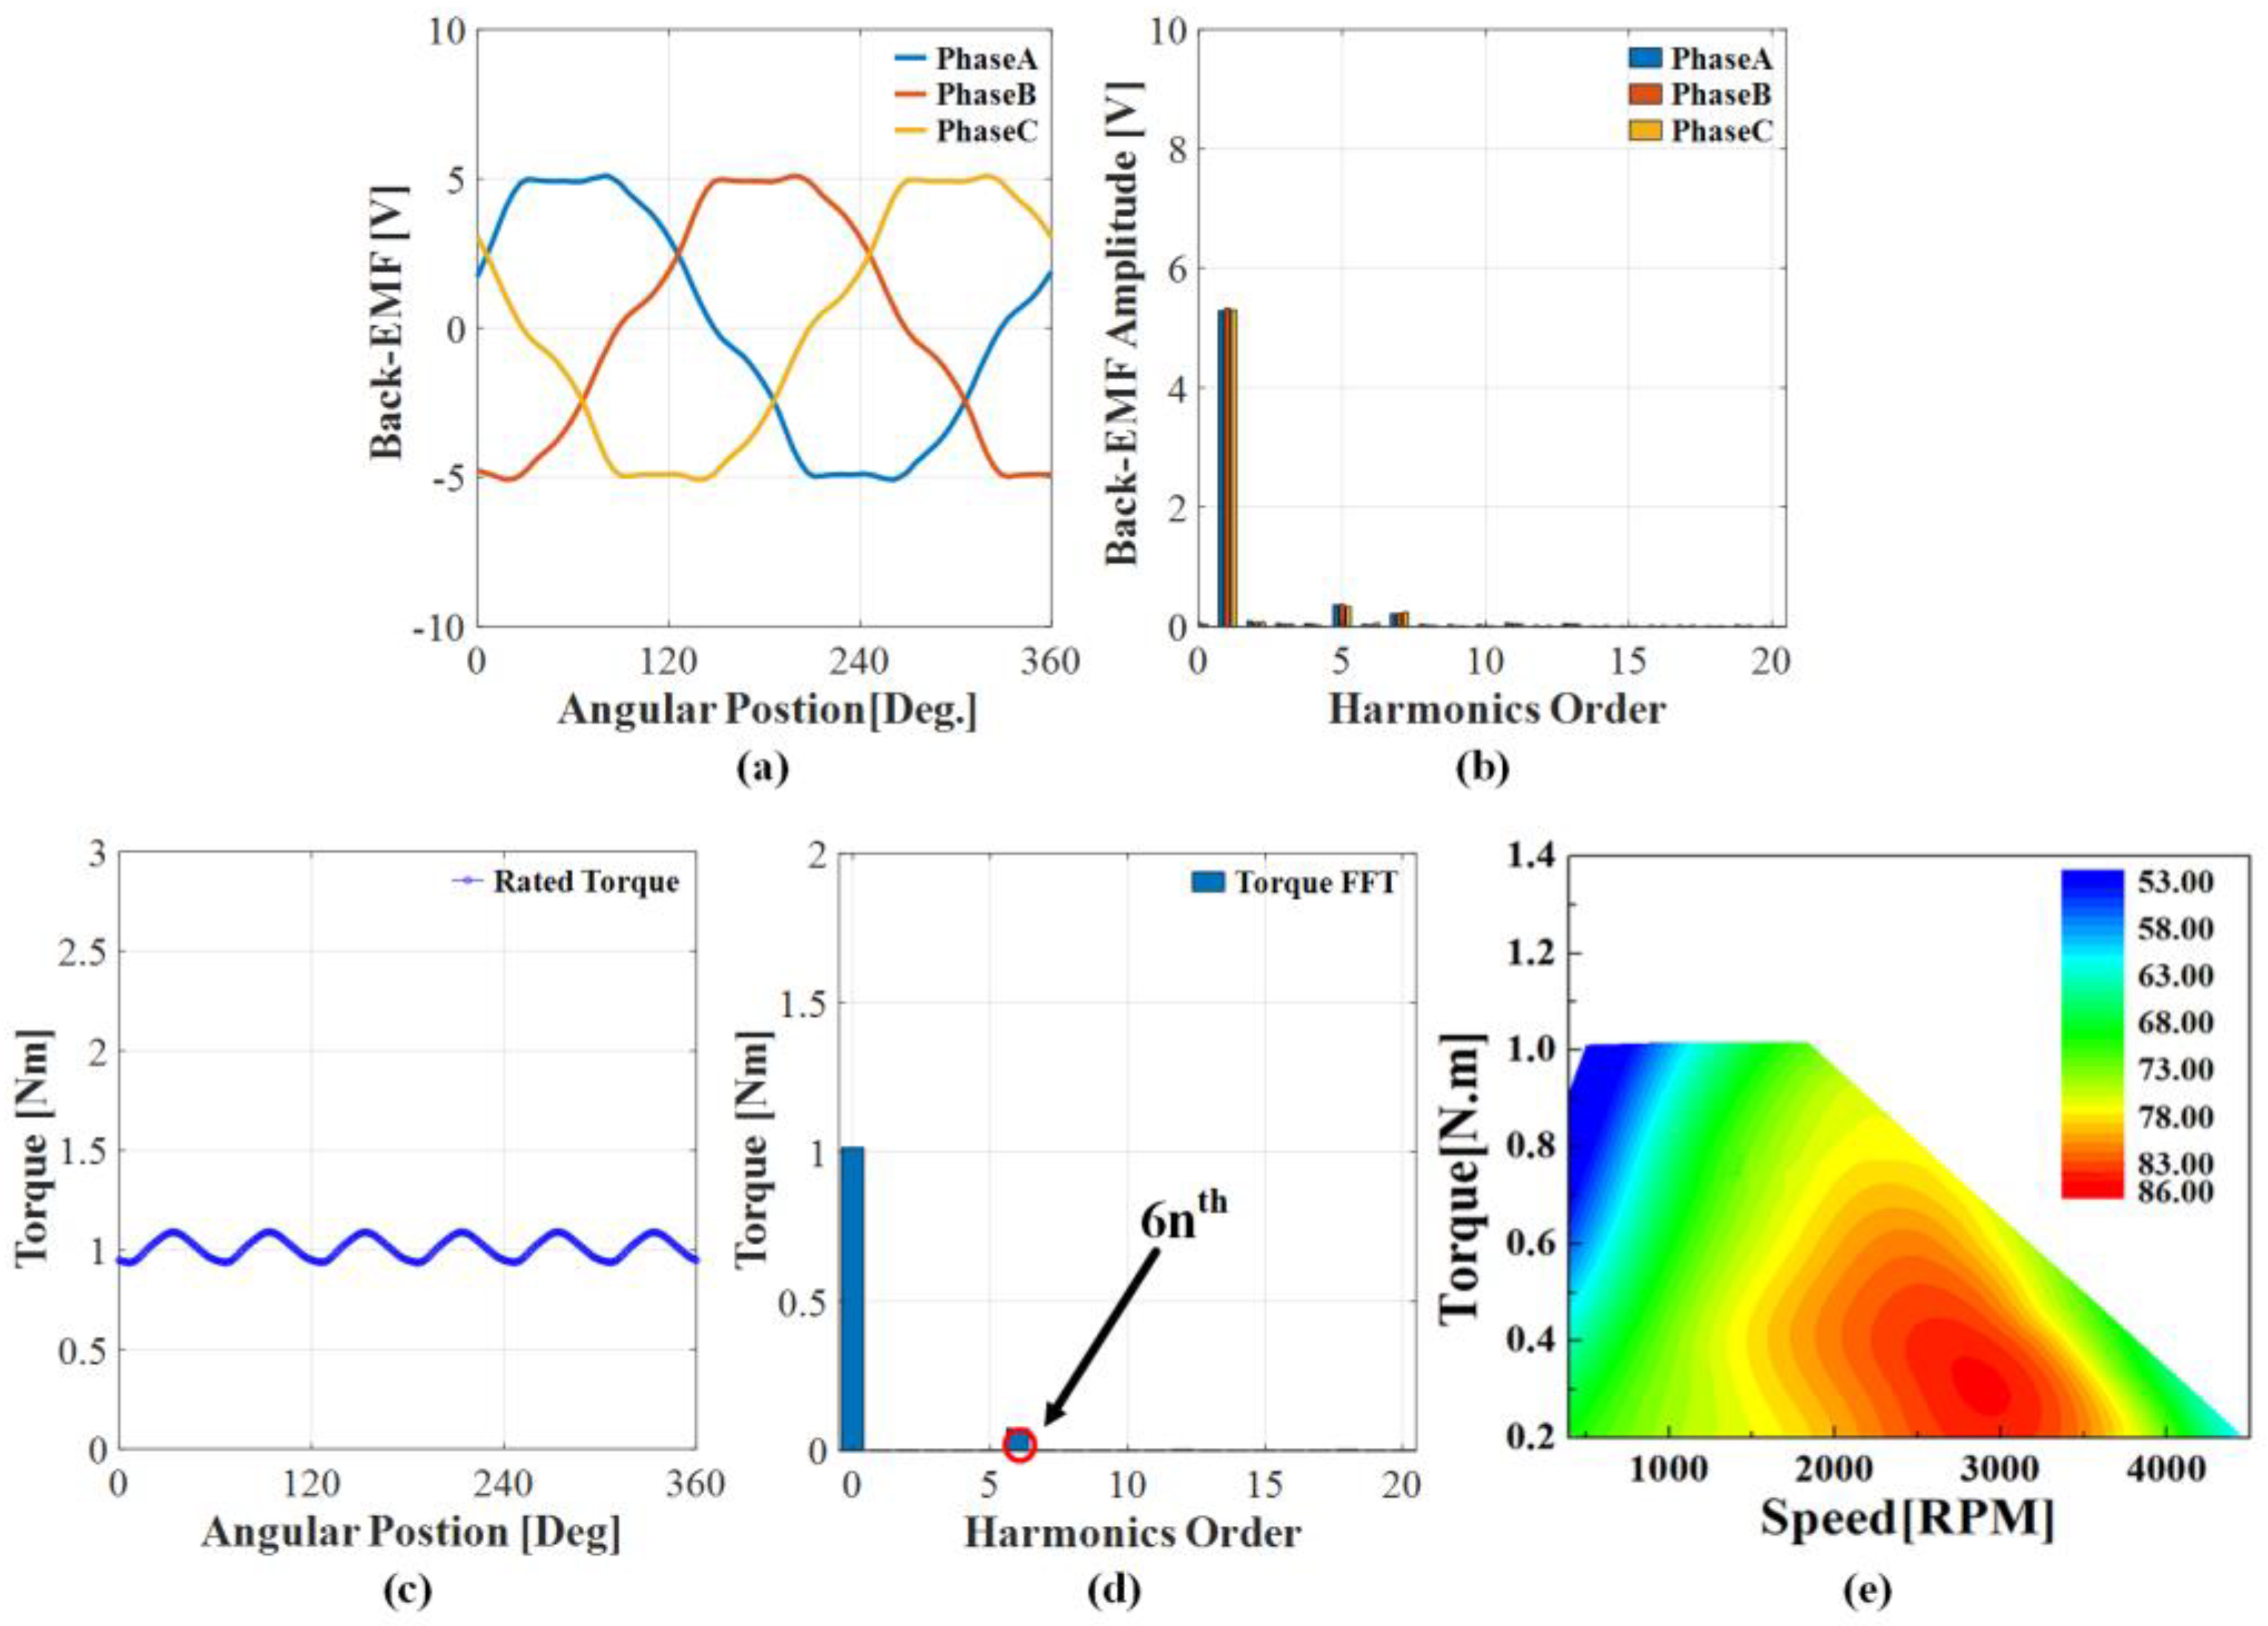
As mentioned in the introduction, the IPMSM has different d- and q-axes inductances because permanent magnets are embedded inside the rotor core. Therefore, both magnetic torque and reluctance torque occur, and they have reverse saliency. The IPMSM operation region is generally divided into a constant torque region where the torque is constant as the speed increases and a constant output region where the output is constant when the speed increases. The maximum torque per ampere (MTPA) control and flux weakening (FW) control are applied according to each region. However, the operating range differs based on the FW control range, which depends on parameters such as the d- and q-axes inductance of the motor and the electrical saliency. Additionally, the FW control range, which is essential for motor design and optimization, can be predicted from the flux vector motor diagram.
Figure 3a,b shows the general operating characteristics of the IPMSM, and a vector diagram, respectively. The blue line in Figure 3a represents the torque curve, and the red line represents the power curve.
i d = I a sin β ,   i q = I a cos β
L d = λ o cos α λ f i d , L q = λ o sin α i q
ζ = L q L d
V d s = R s i d s + L d s d i d s d t ω r L q s i q s
V q s = R s i q s + L q s d i q s d t ω r ( L d s i d s + λ f )
The important parameters of the IPMSM can be derived using vector diagrams that represent the electromagnetic relationship through the IPMSM d- and q-axes parameters and FEM analysis results.
α is the phase difference between the no- and on-load magnetic flux linkages. β is the phase angle of the current. If we derive the α and β , we can derive the saliency ζ that expresses rate of d- and q-axes inductances. λ f and λ 0 are the no- and on-load flux linkages, respectively. The magnitude and phase of no-load magnetic flux linkage were derived through no-load analysis without current, and the magnitude and phase of the load magnetic flux linkage were derived by applying the rated current. I a represents the maximum current applied to the stator. The stator current I a is again divided into a d- and q-axes currents, as shown in Equation (5). Additionally, the d- and q-axes inductances and saliency of an IPMSM can be expressed by Equations (4) and (5) because of the relationship between the d- and q-axes currents, and armature magnetic flux linkage. The magnitudes of the d- and q-axes inductances differ depending on the phase angle of the current. Therefore, a process of searching for the phase angle that generates the maximum torque is required. Finally, by deriving the d- and q-axes voltage Equations (6) and (7), the main parameter calculations using the vector diagram were completed.
Figure 4 shows the no-, on-load flux linkage, and phase difference calculated based on vector diagrams and FEM analysis data, and the d- and q-axes inductances based on the current phase angle.

2.3. Load Analysis

The IPMSM torque equation can be expressed by Equation (8). In Equation (8), the first term represents the magnetic torque generated by the permanent magnet, and the second term represents the reluctance torque generated by the difference between the d- and q-axes reluctances. As shown in the torque equation, the magnetic torque is proportional to the current and the amount of armature magnetic flux linkage owing to the permanent magnet. Further, the reluctance torque is proportional to the d- and q-axes currents, and the multiple of the d- and q-axes inductance difference. Further, the magnetic and reluctance torques vary in magnitude depending on the phase angle of the current, and the IPMSM torque implies that there is a current phase in which the generated torque can be maximized for the same current magnitude.
T t o t a l = P 2 3 2 [ λ f i q + ( L d L q ) i d i q ]
Therefore, the maximum torque/current control method was used to generate the maximum torque, and the optimum current phase and current vector for creating this condition can be derived as shown in Equations (9)–(12).
i s = i d 2 + i q 2
V s = ( R s i d ω L q i q ) 2 + ( R s i q + ω L d i d + ω λ f ) 2
i d = λ f + ( λ f 2 + 8 ( L d L q ) 2 I s 2 4 ( L d L q )
β = sin 1 [ λ f + ( λ f 2 + 8 ( L d L q ) 2 I s 2 4 ( L d L q ) I s ]
In the above equation, the stator applied current (is) should be less than or equal to the current limit value ( i a m ), and the current limit value corresponds to the rated current during continuous operation. Similarly, the back-EMF ( V s ) of the motor should be equal to or less than the maximum output voltage ( V a m ) of the inverter.
Considering the current and voltage limits, the range of selectable current vectors is highly limited. Therefore, to satisfy this limitation and operate the motor through maximum output control, appropriate current control based on the motor speed is required.
If the motor is driven by the maximum torque control per unit current, the back-EMF of the motor approaches the speed (base speed) at which the maximum output voltage of the inverter is reached. In the speed range above the base speed, it is necessary to consider both the current and voltage limits. As a result, FW control is required for operation in the high-speed region. In this case, the operation was performed based the d- and q-axes current commands that generate the maximum torque with the allowable current, as in the case of MTPA control for the same loss minimum operation. Above the base speed, the magnitude of the applied current was the same as the current magnitude below the base speed. The voltage was controlled such that the maximum output voltage of the inverter and the voltage of the motor are equal. Therefore, the current was controlled until the current-limiting source matches the maximum torque control line per unit magnetic flux. In relation to the parameters, if there is no maximum torque control curve per unit magnetic flux inside the current limit circle, it can be operated until the output becomes zero.
Both the voltage and current limits should be met when operating the IPMSMs. When both of these limiting conditions are achieved, the controllable current region is considered as the common region of the voltage-limiting ellipse and the current-limiting circle. Therefore, the current command cannot be controlled unless it is located inside the common area.
Figure 5 and Figure 6 show the current and torque characteristics based on the IPMSM operating region derived from the above equation. Clearly, the maximum torque was generated when there is a phase angle of the current at 25 A, which is the current condition for generating the maximum torque, and the size of the voltage-limiting ellipse decreases as the speed increases. There is a point where the reduced voltage-limiting ellipse, current-limiting circle, and torque curve meet, and the intersection of these three curves becomes the next operating point. Theoretically, the analysis model in this study can run to the intersection of the d-axis and the current-limiting circle, because the voltage-limiting ellipse is not included in the current-limiting circle. These conditions allow the load characteristics to be derived using an IPMSM load simulation [25,26]. The back-EMF of a motor is generated by a variation in the magnetic flux density that varies depending on the position of the rotor in the air gap. Therefore, the mode of variation in the magnetic flux density affects the back-EMF of the motor. Additionally, when the THD of the back-EMF increases, the input current for generating the same torque increases, and the motor has a low-torque density characteristic; thus, the motor does not operate efficiently. Figure 7 shows the results of the load analysis and the experimental results of the efficiency map.
f r i p p l e = 6 n f e
The electromagnetic torque is represented by the products of back-EMF and applied current, and the rate of change that occurs periodically in torque is called torque ripple. Therefore, because the harmonic components of the back-EMF and the applied current affect the torque ripple, it is necessary to analyze the harmonic components of the back-EMF to predict the vibration/noise. The relationship between torque ripple and frequency is expressed by Equation (13), and clearly, the results of the main harmonics confirmed by the FFT analysis of torque are in agreement. Figure 7 shows the results of the load analysis.
The UMF and electromagnetic force acting on the motor are obtained through load analysis. In this study, we used the Maxwell stress tensor method to derive the electromagnetic force or UMF generated by the motor. The stress vector per unit area is expressed by Equation (14).
F = 1 μ 0 ( B n 2 1 2 | B | 2 ) i n 1 μ 0 B n B t i t
where B is the magnetic flux density, and n and t represent the normal and tangential components in the coordinate system, respectively. Assuming that the magnetic permeability of the stator and rotor is infinite, the force densities in the radial and tangential directions acting on the surface of the stator are expressed by Equation (15). B r and B t represent the magnetic flux density in the radial and tangential directions, respectively.
Figure 8a,b shows the force density in the radial and tangential directions derived from Equation (15). Generally, the symmetry of the force density distribution can be used to determine its influence on vibration. Therefore, it can be confirmed that the force density of this analysis model is symmetrically distributed.
f r = 1 μ 0 ( B r 2 B θ 2 ) ,   f θ = 1 2 μ 0 B r B θ
Equation (15) is converted into a Cartesian coordinate system, which is expressed as in Equation (16).
f x = f r cos θ f θ sin θ ,   f y = f r sin θ + f θ cos θ
The components of the magnetic unbalanced force exerted on the stator center are calculated over a circular surface of radius normally in the middle of the air gap region, as shown in Equations (17) and (18).
F x = r l s t k 2 μ 0 0 2 π [ ( B θ 2 B r 2 ) cos θ 2 B θ B r sin θ ] d θ
F y = r l s t k 2 μ 0 0 2 π [ ( B θ 2 B r 2 ) sin θ + 2 B θ B r cos θ ] d θ
Figure 8c,d shows UMF derived from Equations (17) and (18). The UMF result of the integral relationship with force density indicates that the value of UMF is close to zero, because the spatial distribution of the force density is symmetric. Therefore, it is considered that UMF does not significantly affect the vibration and noise characteristics of the analysis model.

3. Mechanical Analysis
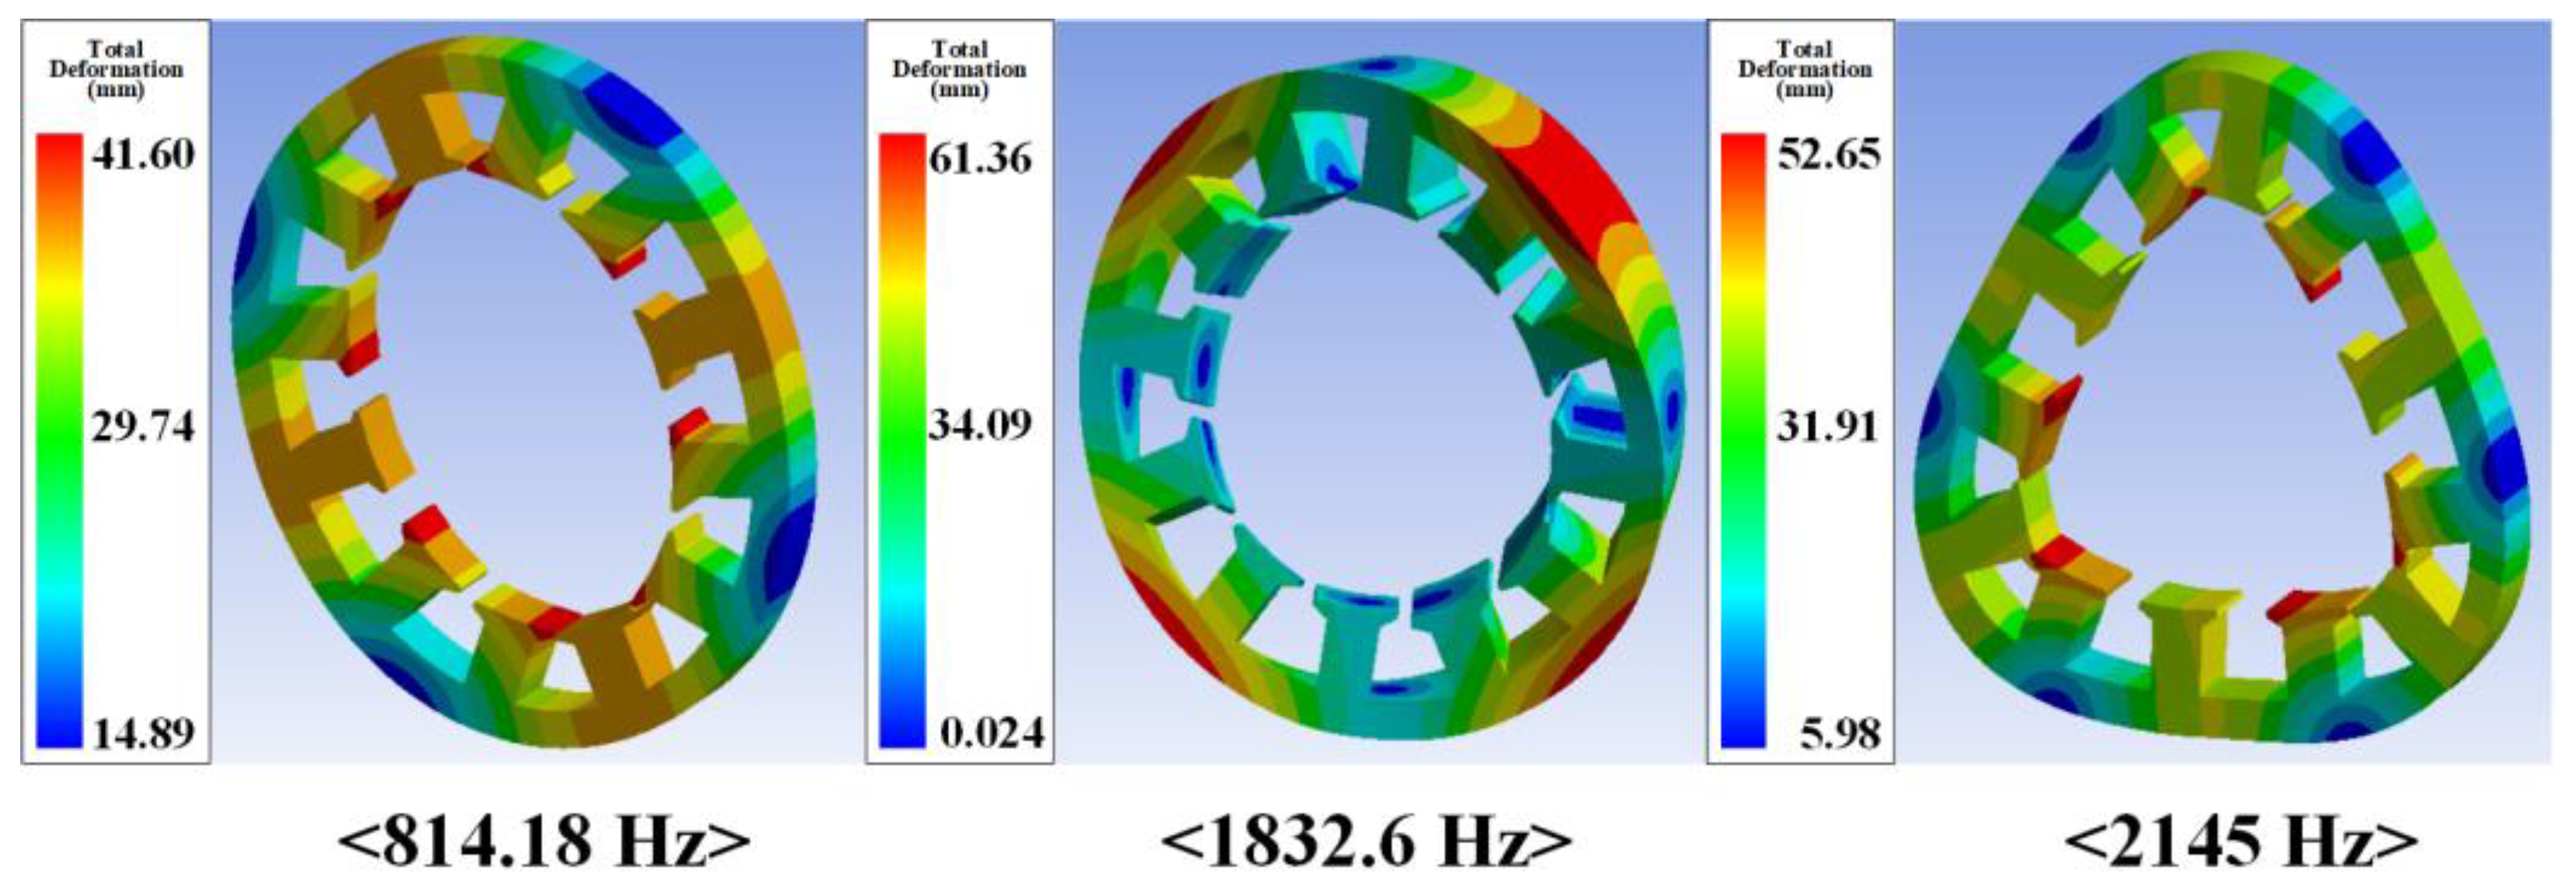
3.1. Modal Analysis

Resonance occurs when the force imbalance, which is a radial force acting as a source of electromagnetic vibration of the motor, and the frequency owing to torque ripple and cogging torque are in a region close to the natural frequency of the motor. Resonance wears parts and reduces the drive performance of the motor, in addition to adversely affecting other systems. Moreover, the stator natural-vibration frequency plays a dominant role in vibration and resonance; therefore, a modal analysis of the stator should be performed. Therefore, it is important to confirm the natural frequency and mode shape, which are the mechanical characteristics of the electrical machine, at the design stage.
Free vibration is generated by the force inherent in the system itself when there is no external force. As for free vibration, the system oscillates at one or more natural frequencies, which are the natural characteristics of the dynamic system determined by the distribution of mass and stiffness. The mode represents a unique dynamic aspect of a system constituting the vibrator; when the stator vibrates by a force with a certain frequency, the shape of the stator is a unique mode with a frequency band of the force.
Figure 9 shows the free vibration of the 8-pole 12-slot motor model analyzed without a vibration source, that is, the natural frequency of the stator and the three mode shapes for each natural frequency. The red part contains a high resonance value. Based on the mode analysis, the frequency (natural frequency) of the first, second, and third modes of each model was higher than the operating frequency. Because this analysis is a structural analysis of a single motor, it is a mode analysis that proceeds without any restrictions. Notably, the amount of strain of a specific length itself is not meaningful, and there is a difference in the magnitude of vibration by that proportion. Basically, it is important to observe where and how often the deformation owing to vibration occurs with the amount of strain, and it can be expected that vibration based on the resonance of the stator structure owing to the natural frequency will not occur.

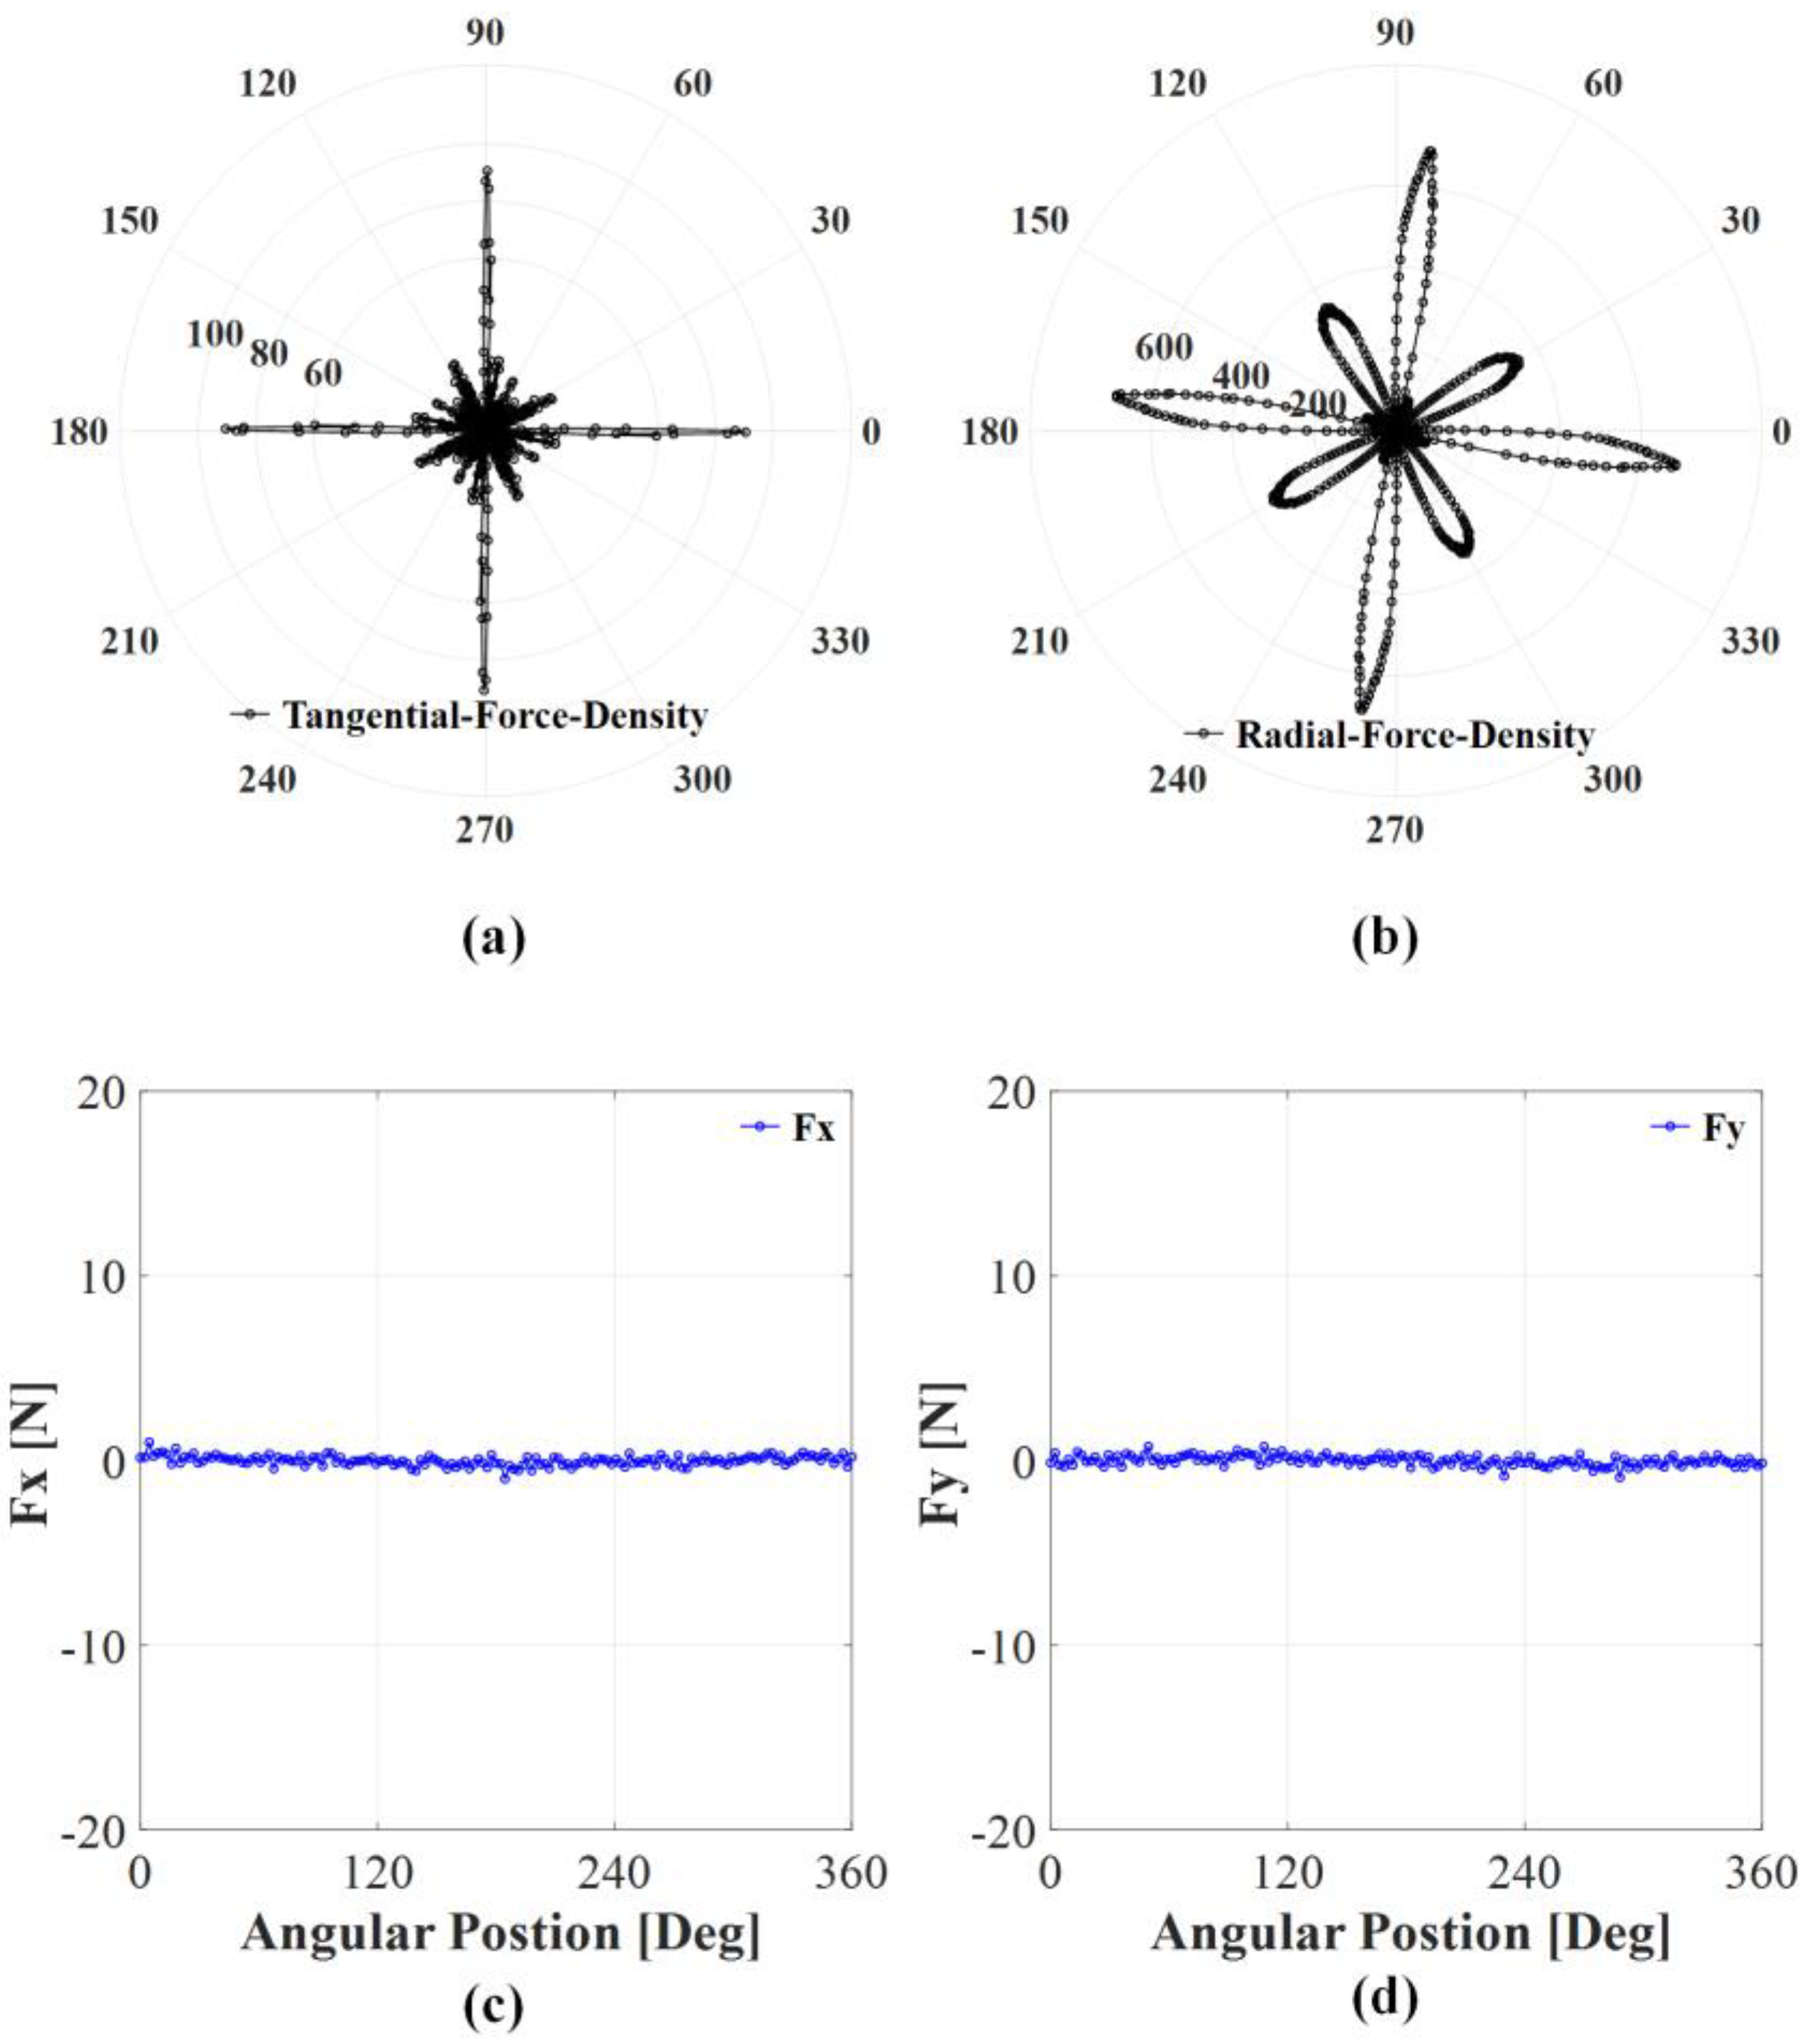
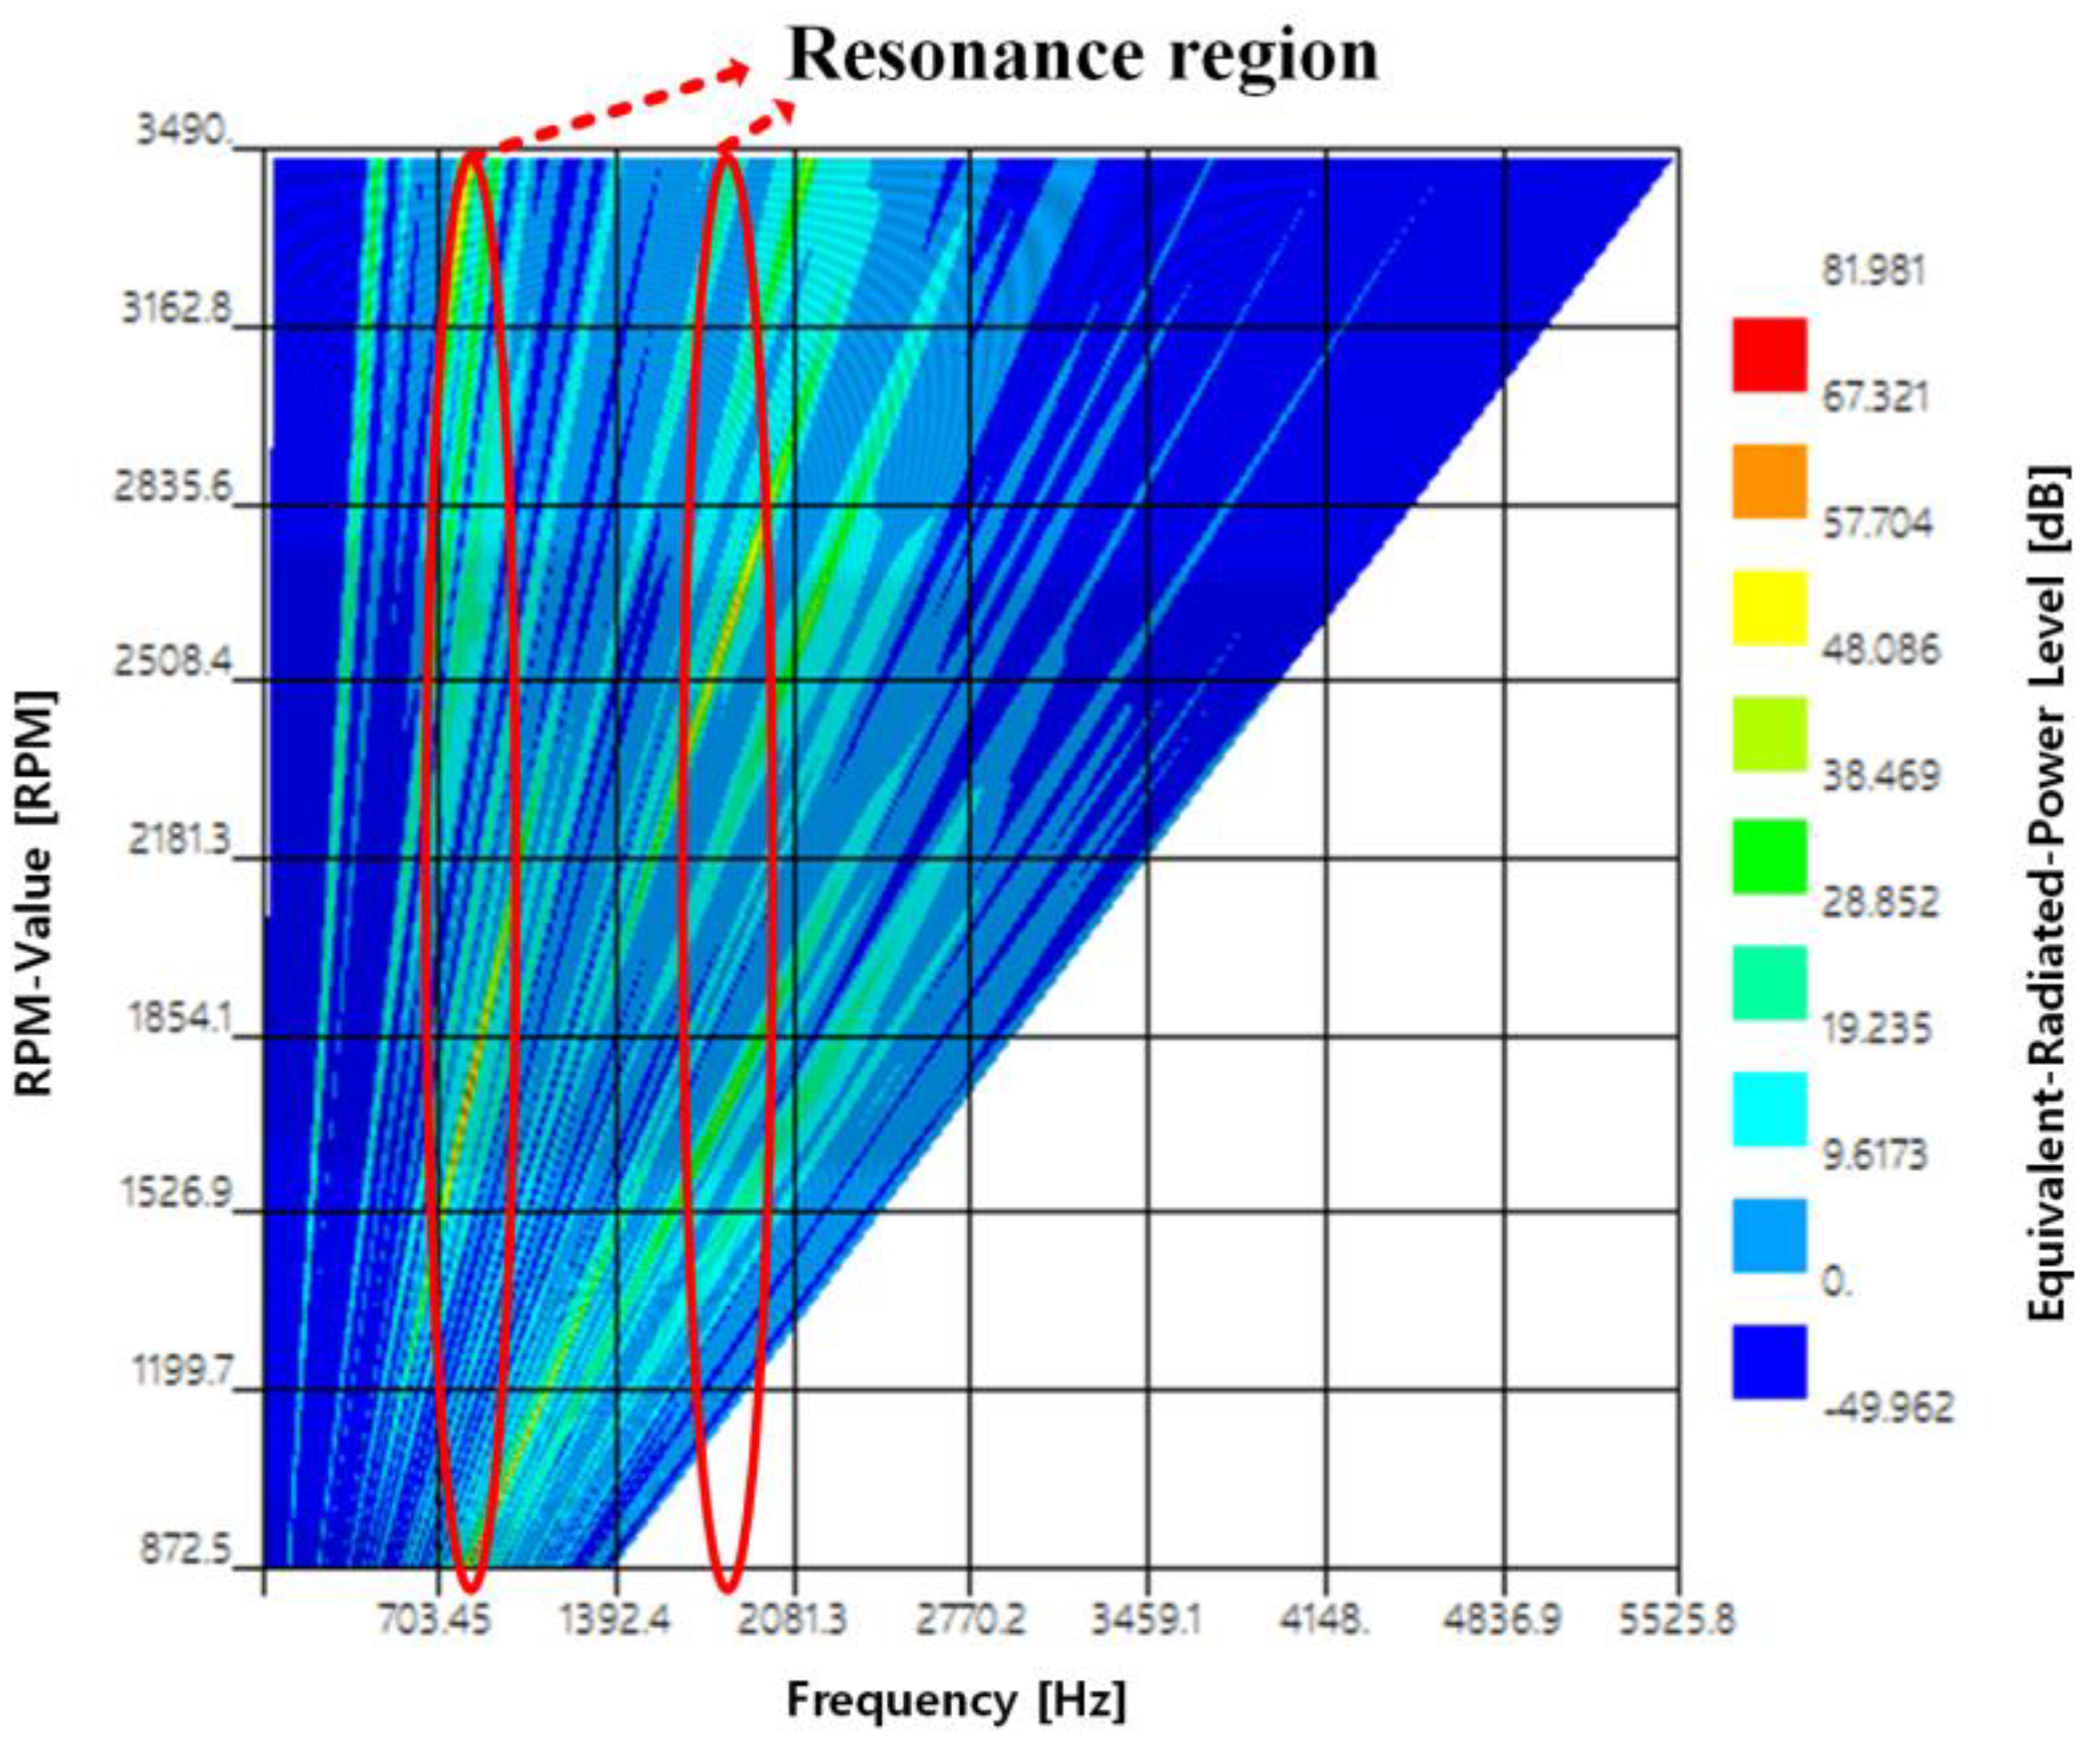
3.2. Acoustic Noise Analysis

The vibration data used for the NVH characteristic analysis of PMSM were derived using 3D FEM considering the previously analyzed electromagnetic characteristic results. Figure 10 presents a waterfall diagram showing the NVH characteristic analysis results of the 8-pole 12-slot (8P12S) IPMSM to which an electromagnetic source was applied. This waterfall diagram was performed according to conditions of rotational speed. Here, the rotational speed conditions are 870, 1745, 2600, and 3490 rpm, respectively, and the load torque was selected at rated torque. In addition, as the analysis results are derived based on the mechanical 1 cycle in this NVH characteristic analysis, the characteristics of the electromagnetic vibration source of the motor for the mechanical 1 cycle should be considered.
As aforementioned, the unbalanced electromagnetic force generated by the stator tip is close to zero; thus, other sources of vibration generate noise and vibration. Therefore, the level of vibration and noise was determined based on electromagnetic vibration sources, such as cogging torque and torque ripple. Of the torque-pulsation components, the cogging torque was mainly composed of the 6th harmonic component, and the torque ripple was mainly composed of the fundamental wave and the 6th order. The back-EMF under load was mainly in the harmonic order of 1, 5, and 7. Although the harmonic component of back-EMF was derived as a 1st, 5th, and 7th harmonic component, this harmonic component eventually appears as a harmonic component of torque ripple by interaction with the harmonic component of the applied current. Therefore, we need to focus on the FFT analysis result of the torque ripple.
Clearly from Figure 10, this corresponds to the FFT analysis results of cogging torque and torque ripple classified as electromagnetic vibration sources. In the case of cogging torque, the mechanical frequency 24th harmonic was the largest harmonic order, and in the case of torque ripple, the mechanical frequency was the largest in the order of 24th, 48th, and 8th harmonic order. Therefore, the noise level is higher in the frequency domain of the 1st, 8th, and 24th components than in the other regions. However, it is clear that the frequency at which the maximum noise is generated is larger in the resonance frequency region than in the harmonic region of the electromagnetic vibration/noise source.

4. Experiment Results

We performed experiments using a power analyzer and WT3000 manufactured by yaskawa in JAPAN, and the experimental results were validated by comparing them with the analysis results. Figure 11 shows the experiment setting.
The back-EMF voltage induced in a stator winding because of the magnet flux crossing the air gap is given by the rate of change in flux linkage with respect to time. Figure 2c shows the back-EMF of the manufactured model under the no-load condition. As shown in Figure 2c, the predicted results mostly agree with the measurements in both waveform and amplitude. The effects on the leakage flux occurred in the end turn of the winding, fabrication error, and losses such as bearing friction, windage, and stray loss.
The torque obtained from the experiment was slightly lower than the FEM under identical conditions because the torque constant is proportional to the amplitude of the back-EMF. Figure 7b shows the characteristic performance and efficiency map of the analysis model under the rated load condition. These results were obtained under a variety of speed conditions at the rated load.
Based on the electromagnetic experiment data, the electromagnetic analysis performed in this study and the electromagnetic analysis were in good agreement; thus, the validity of the electromagnetic analysis was verified. As the validity of electromagnetic characteristics analysis was verified through experiments, it was confirmed whether the frequency was matched with the NVH analysis result based on the data derived through finite element analysis. It was confirmed that the harmonic order of the electromagnetic vibration source and the harmonic order of the mechanical vibration analysis result correspond. In addition, it was confirmed that the vibration/noise generated by mechanical resonance was greater than the vibration/noise component caused by electromagnetic vibration sources.

5. Conclusions

In this study, we predicted the noise and vibration generated by 8P12S IPMSMs through electromagnetic analysis. At the electromagnetic characteristics analysis step, we calculated important parameters based on the results of FEM and Vector diagram and identified operation characteristics according to the operation area. We also performed vibration/noise analysis and verified the results using electromagnetic experiments. We classified the electromagnetic vibration sources into several causes owing to torque pulsation and electromagnetic forces, analyzed the FFT analysis and waveform for the characteristics that affect vibration and noise, and verified their validity through experiments. Further, vibration and noise generated by the motor through electromagnetic-mechanical coupling analysis were simulated using an FEM tool. As a result, if there is no mechanical vibration or noise source such as bearing faults and eccentricities, it is possible to predict the noise/vibration generated in the motor, even if only the electromagnetic characteristic analyses of the motor to be analyzed are accurate.

Author Contributions

J.-Y.C.: conceptualization, review and editing; Y.-G.L.: analysis, original draft preparation; J.-I.L.: experiment and motor control algorithm; T.-K.B.: experiment, motor control algorithm and co-simulation; J.-H.W.: co-simulation; S.-T.J.: experiment and motor control algorithm. All authors have read and agreed to the published version of the manuscript.

Funding

This research was supported by the “Basic Science Research Program through the National Research Foundation of Korea (NRF-2020R1A4A2002021), this research was supported by the National Research Foundation of Korea (NRF) grant funded by the Korea government (MSIT). (No. 2020R1A2C1007353).

Institutional Review Board Statement

Not applicable.

Informed Consent Statement

Not applicable.

Data Availability Statement

The data presented in this study are available on request from the corresponding author.

Conflicts of Interest

The authors declare no conflict of interest.

References

  1. Tomigashi, Y.; Ueta, T.; Yokotani, K.; Ikegami, K. Reducing Cogging Torque of Interior Permanent Magnet Synchronous Motor for Electric Bicycles. In Proceedings of the IEEE European Conference on Power Electronics and Applications, Dresden, Germany, 11–14 September 2005. [Google Scholar]
  2. Yang, Z.; Shang, F.; Brown, I.P.; Krishnamurthy, M. Comparative Study of Interior Permanent Magnet, Induction, and Switched Reluctance Motor Drives for EV and HEV Applications. Proc. IEEE Trans. Transp. Electrif. 2015, 1, 245–254. [Google Scholar] [CrossRef]
  3. Bae, J.N. Permanent Magnet Synchronous Machine Design through and Automatic Selection of the Specific Loadings. Ph.D. Thesis, Hanyang University, Seoul, Korea, 2010. [Google Scholar]
  4. Cho, S.; Jung, K.; Choi, J. Design Optimization of Interior Permanent Magnet Synchronous Motor for Electric Compressors of Air-Conditioning Systems Mounted on EVs and HEVs. IEEE Trans. Magn. 2018, 54, 1–5. [Google Scholar] [CrossRef]
  5. Shin, K.; Choi, J.; Cho, H. Characteristic Analysis of Interior Permanent-Magnet Synchronous Machine with Fractional-Slot Concentrated Winding Considering Nonlinear Magnetic Saturation. IEEE Trans. Appl. Supercond. 2016, 26, 5200404. [Google Scholar] [CrossRef]
  6. Kim, S.; Lee, G.; Hong, J.; Jung, T. Design Process of Interior PM Synchronous Motor for 42-V Electric Air-Conditioner System in Hybrid Electric Vehicle. IEEE Trans. Magn. 2008, 44, 1590–1593. [Google Scholar]
  7. Kim, S.H. DC, AC, BLDC Motor Control; Bokdoo Press: Seoul, Korea, 2012. [Google Scholar]
  8. Gieras, J.F.; Wang, C.; Lai, J.C. Noise of Poly-Phase Electric Motors, 2nd ed.; Taylor & Francis: New York, NY, USA, 2006. [Google Scholar]
  9. Zhu, Z.Q.; Xia, Z.P.; Wu, L.J.; Jewell, G.W. Influence of slot and pole number combination on radial force and vibration modes in fractional slot PM brushless machines having single-and double-layer windings. In Proceedings of the IEEE Energy Conversion Congress and Exposition (ECCE), San Jose, CA, USA, 20–24 September 2009; pp. 3443–3450. [Google Scholar]
  10. Zhu, Z.Q.; Xia, Z.P.; Wu, L.J.; Jewell, G.W. Analytical modeling and finite element computation of radial vibration force in fractional-slot permanent-magnet brushless machines. IEEE Trans. Ind. Appl. 2010, 46, 1908–1918. [Google Scholar] [CrossRef]
  11. Im, D.H.; Chang, J.H.; Park, S.C.; Kwon, B.I.; Hong, J.P.; Kim, B.T. Analysis of radial force as a source of vibration in an induction motor with skewed slots. IEEE Trans. Magn. 1997, 33, 1650–1653. [Google Scholar] [CrossRef]
  12. Kobayashi, T.; Tajima, F.; Ito, M.; Shibukawa, S. Effects of slot combination on acoustic noise from induction motors. IEEE Trans. Magn. 1997, 33, 2101–2104. [Google Scholar] [CrossRef]
  13. Studer, C.; Keyhani, A.; Sebastian, T.; Murthy, S.K. Study of cogging torque in permanent magnet machines. In Proceedings of the 1997 IEEE Industry Applications Society (IAS ’97), New Orleans, LA, USA, 4–9 October 1997; pp. 42–49. [Google Scholar]
  14. Kim, B.-T.; Kwon, B.-I.; Park, S.-C. Reduction of electromagnetic force harmonics in asynchronous traction motor by adapting the rotor slot number. IEEE Trans. Magn. 1999, 35, 3742–3744. [Google Scholar]
  15. Bianchi, N.; Bolognani, S. Design techniques for reducing the cogging torque in surface-mounted PM motors. IEEE Trans. Ind. Appl. 2002, 38, 1259–1265. [Google Scholar] [CrossRef]
  16. Dai, M.; Keyhani, A.; Sebastian, T. Torque ripple analysis of a PM brushless DC motor using finite element method. IEEE Trans. Energy Convers. 2004, 19, 40–45. [Google Scholar] [CrossRef]
  17. Mori, D.; Ishikawa, T. Force and vibration analysis of induction motors. IEEE Trans. Magn. 2005, 41, 1948–1951. [Google Scholar] [CrossRef]
  18. Sung, S.; Jang, G.; Kang, K. Noise and vibration due to rotor eccentricity in a HDD spindle system. Microsyst. Technol. 2014, 20, 1461–1469. [Google Scholar] [CrossRef]
  19. Seo, B.; Sung, S.; Kang, K.; Song, J.; Jang, G. Unbalanced magnetic force and cogging torque of PM motors due to the interaction between PM magnetization and stator eccentricity. Microsyst. Technol. 2016, 22, 1249–1255. [Google Scholar] [CrossRef]
  20. Chen, Q.; Liu, G.; Gong, W.; Qu, L.; Zhao, W.; Shen, Y. Design of a spoke-type permanent-magnet motor with optimal winding configuration for electric vehicle applications. J. Appl. Phys. 2012, 111, 07E710. [Google Scholar] [CrossRef]
  21. Meessen, K.J.; Paulides, J.J.H.; Lomonova, E.A. Force calculations in 3-D cylindrical structures using Fourier analysis and the Maxwell stress tensor. IEEE Trans. Magn. 2012, 49, 536–545. [Google Scholar] [CrossRef]
  22. Hur, J.; Reu, J.-W.; Kim, B.; Kang, G.-H. Vibration reduction of IPM-type BLDC motor using negative third harmonic elimination method of air-gap flux density. IEEE Trans. Ind. Appl. 2011, 47, 1300–1309. [Google Scholar]
  23. Fang, L.; Jung, J.; Hong, J.-P.; Lee, J.-H. Study on high-efficiency performance in interior permanent-magnet synchronous motor with double-layer PM design. IEEE Trans. Magn. 2008, 44, 4393–4396. [Google Scholar] [CrossRef]
  24. Jung, J.-W.; Lee, S.-H.; Lee, G.-H.; Hong, J.-P.; Lee, D.-H.; Kim, K.-N. Reduction design of vibration and noise in IPMSM type integrated starter and generator for HEV. IEEE Trans. Magn. 2010, 46, 2454–2457. [Google Scholar] [CrossRef]
  25. Ge, H.; Yu, M.; Berker, B.; Babak, N.-M.; Ali, E. Speed Range Extended Maximum Torque Per Ampere Control for PM Drives Considering Inverter and Motor Nonlinearities. IEEE Trans. Power Electron. 2017, 32, 7151–7159. [Google Scholar] [CrossRef]
  26. Mohamed, Y.A.-R.I.; Lee, T.K. Adaptive self-tuning MTPA vector controller for IPMSM drive system. IEEE Trans. Energy Convers. 2006, 21, 636–644. [Google Scholar] [CrossRef]
Figure 1. Analysis flow.
Energies 15 00238 g001
Figure 2. No-load Analysis result of no-load back EMF and Cogging Torque: (a) waveform of no-load back-EMF, (b) FFT of no-load back EMF, (c) experiment results of no-load back-EMF, (d) waveform of cogging torque, and (e) FFT of cogging torque.
Energies 15 00238 g002
Figure 3. IPMSMs operating region and vector diagram: (a) characteristic of IPMSMs and (b) vector diagram according to d- and q-axis.
Energies 15 00238 g003
Figure 4. Calculation of d-, q-axis inductance, flux linkage, and phase difference at no-, on-load flux linkages according to input current and current angle. (a) d-axis inductance, (b) q-axis inductance, (c) saliency, (d) flux linkage, and (e) flux linkage phase difference angle.
Energies 15 00238 g004
Figure 5. Current according to torque and current phase angle of IPMSM: (a) current and torque according to MTPA control and (b) current phase angle characteristic according to I s .
Energies 15 00238 g005
Figure 6. Characteristic curve of IPMSM: (a) Torque on I d , I q plane. (b) Torque and speed on I d , I q plane.
Energies 15 00238 g006
Figure 7. Load analysis result: (a) load back EMF waveform, (b) load back EMF FFT result, (c) torque waveform, (d) torque FFT result, and (e) efficiency map.
Energies 15 00238 g007
Figure 8. Force density and UMF result: (a) tangential distribution, (b) radial distribution, (c) x-component, and (d) y-component.
Energies 15 00238 g008
Figure 9. Modal analysis result.
Energies 15 00238 g009
Figure 10. NVH Analysis result.
Energies 15 00238 g010
Figure 11. Concept of experimental system.
Energies 15 00238 g011
Table 1. Specification of analysis model.
SpecificationIPMSMUnit
Rated output power180W
Rated speed1745RPM
Pole/Slot8/12-
Stator OD116mm
Rotor OD71mm
Total magnet volume6249.6mm3
Publisher’s Note: MDPI stays neutral with regard to jurisdictional claims in published maps and institutional affiliations.

