Article

Impact of Demand Response on Optimal Sizing of Distributed Generation and Customer Tariff

by
Krishna Mohan Reddy Pothireddy
1,
Sandeep Vuddanti
1 and
Surender Reddy Salkuti
2,*
1
Department of Electrical Engineering, National Institute of Technology Andhra Pradesh (NIT-AP), Tadepalligudem 534101, India
2
Department of Railroad and Electrical Engineering, Woosong University, Daejeon 34606, Korea
*
Author to whom correspondence should be addressed.
Energies 2022, 15(1), 190; https://doi.org/10.3390/en15010190
Submission received: 26 November 2021 / Revised: 18 December 2021 / Accepted: 25 December 2021 / Published: 28 December 2021

Abstract

:
Due to the surge in load demand, the scarcity of fossil fuels, and increased concerns about global climate change, researchers have found distributed energy resources (DERs) to be alternatives to large conventional power generation. However, a drastic increase in the installation of distributed generation (DGs) increases the variability, volatility, and poor power quality issues in the microgrid (MG). To avoid prolonged outages in the distribution system, the implementation of energy management strategies (EMS) is necessary within the MG environment. The loads are allowed to participate in the energy management (EM) so as to reduce or shift their demands to non-peak hours such that the maximum peak in the system gets reduced. Therefore, this article addresses the complication of solutions, merits, and demerits that may be encountered in today’s power system and encompassed with demand response (DR) and its impacts in reducing the installation cost, the capital cost of DGs, and total electricity tariff. Moreover, the paper focuses on various communication technologies, load clustering techniques, and sizing methodologies presented.

1. Introduction

The ever-increasing population has led to a plethora of electricity needs in the country. Existing power systems got overstressed to meet the increased load demands. Though the power generation by the conventional fossil fuel-fired generators is flexible, controllable, and dispatchable, the demerits of these sources are not economic, environmentally unfriendly, and non-sustainable [1]. Moreover, the triple bottom line [2] approach suggests the reduction in global emissions, increasing profits, and achieving maximum benefits for the people. It encourages people to develop in a sustainable manner. Its main objective is to enhance the economic, environmental, and social development of a home or community or organisation. A possible solution is to ameliorate the existing system with the DERs [3], but the output of these sources is stochastic and uncertain in nature. Another possible solution is to deploy a battery energy storage system (BESS) into the existing MG to meet the power balance condition, but it is a costly solution. A localized grouping of DGs, BESS, and scattered loads form a MG [4]. Two modes of operation of MGs exist, namely, isolated MG or off-grid modes or autonomous mode and grid-connected mode or on-grid mode. Further, the MG has three topologies, namely, alternating current MG (AC-MG), direct current MG (DC-MG), and hybrid MG. In AC-MG and DC-MG, the sources may be AC or DC but the converters convert them into one form. In the case of AC-MG the converters convert the power into AC, whereas, in case of DC-MG the converters convert all the generations to DC. This process increases the number of converter operations. Hybrid MG enhances the performance and reduces the redundancy of converters required. MG can be operated in grid-connected mode and isolated or stand-alone mode based on the system type. The higher the peak load demand on the system, the more the generation capacity to be installed is, which increases the capital cost of MG. To mitigate the present issues such as load increment, fossil fuel deficit, and environmental degradation, steps have been taken to reshape existing power systems into green and efficient systems. Therefore, an EM system [5] is essential in a MG system for achieving efficient operation. Other factors that drive the EM of MG are economic benefits [6], environmental benefits [7], energy security [8], and energy integration [9]. Developments in power systems are due to advances in technology and an increase in electricity usage. Figure 1 shows various stages of the evolved power system from a source point of view.
EM can be done in two ways: supply-side management and demand-side management (DSM). DSM focuses on DR, so as to improve the energy efficiency of the MG. DR can be stated as changes in electricity consumption by end-users based on market price fluctuation (Rs/kWh) without jeopardizing power system security. Response of the loads in accordance with the proper way benefits both the utility and the consumer. By adjusting a part of peak load to other time horizons results in reduced peak demand on the system, reduces the peak to average ratio of the load demand, and increases the load factor.
Therefore, the proposed work addresses the complication of solutions, merits, and demerits that may be encountered in today’s power system and encompasses demand response (DR) and its impacts in reducing the installation cost, the capital cost of DGs, and total electricity tariff. To achieve this an objective function was formulated and an optimal sizing method has been proposed by considering the impact of DR for finding the optimal size of DGs, i.e., WT, PV, and diesel generator. Further, the proposed algorithm clusters the load into ILs and NILs and assigns a priority to the non-essential loads with the order of scheduled times by using TOU pricing. In addition, the paper suggests a limit on the amount of load shift to avoid the issues like rebound effect, increase in marginal price, and operational cost of the MG due to load recovery. Three penetration levels of demand responsive loads were considered, namely, 0%, 5%, and 10%, for studying the impact of DR programs on optimal sizing of the DGs and on consumer tariffs.

2. Literature and Contributions of the Work

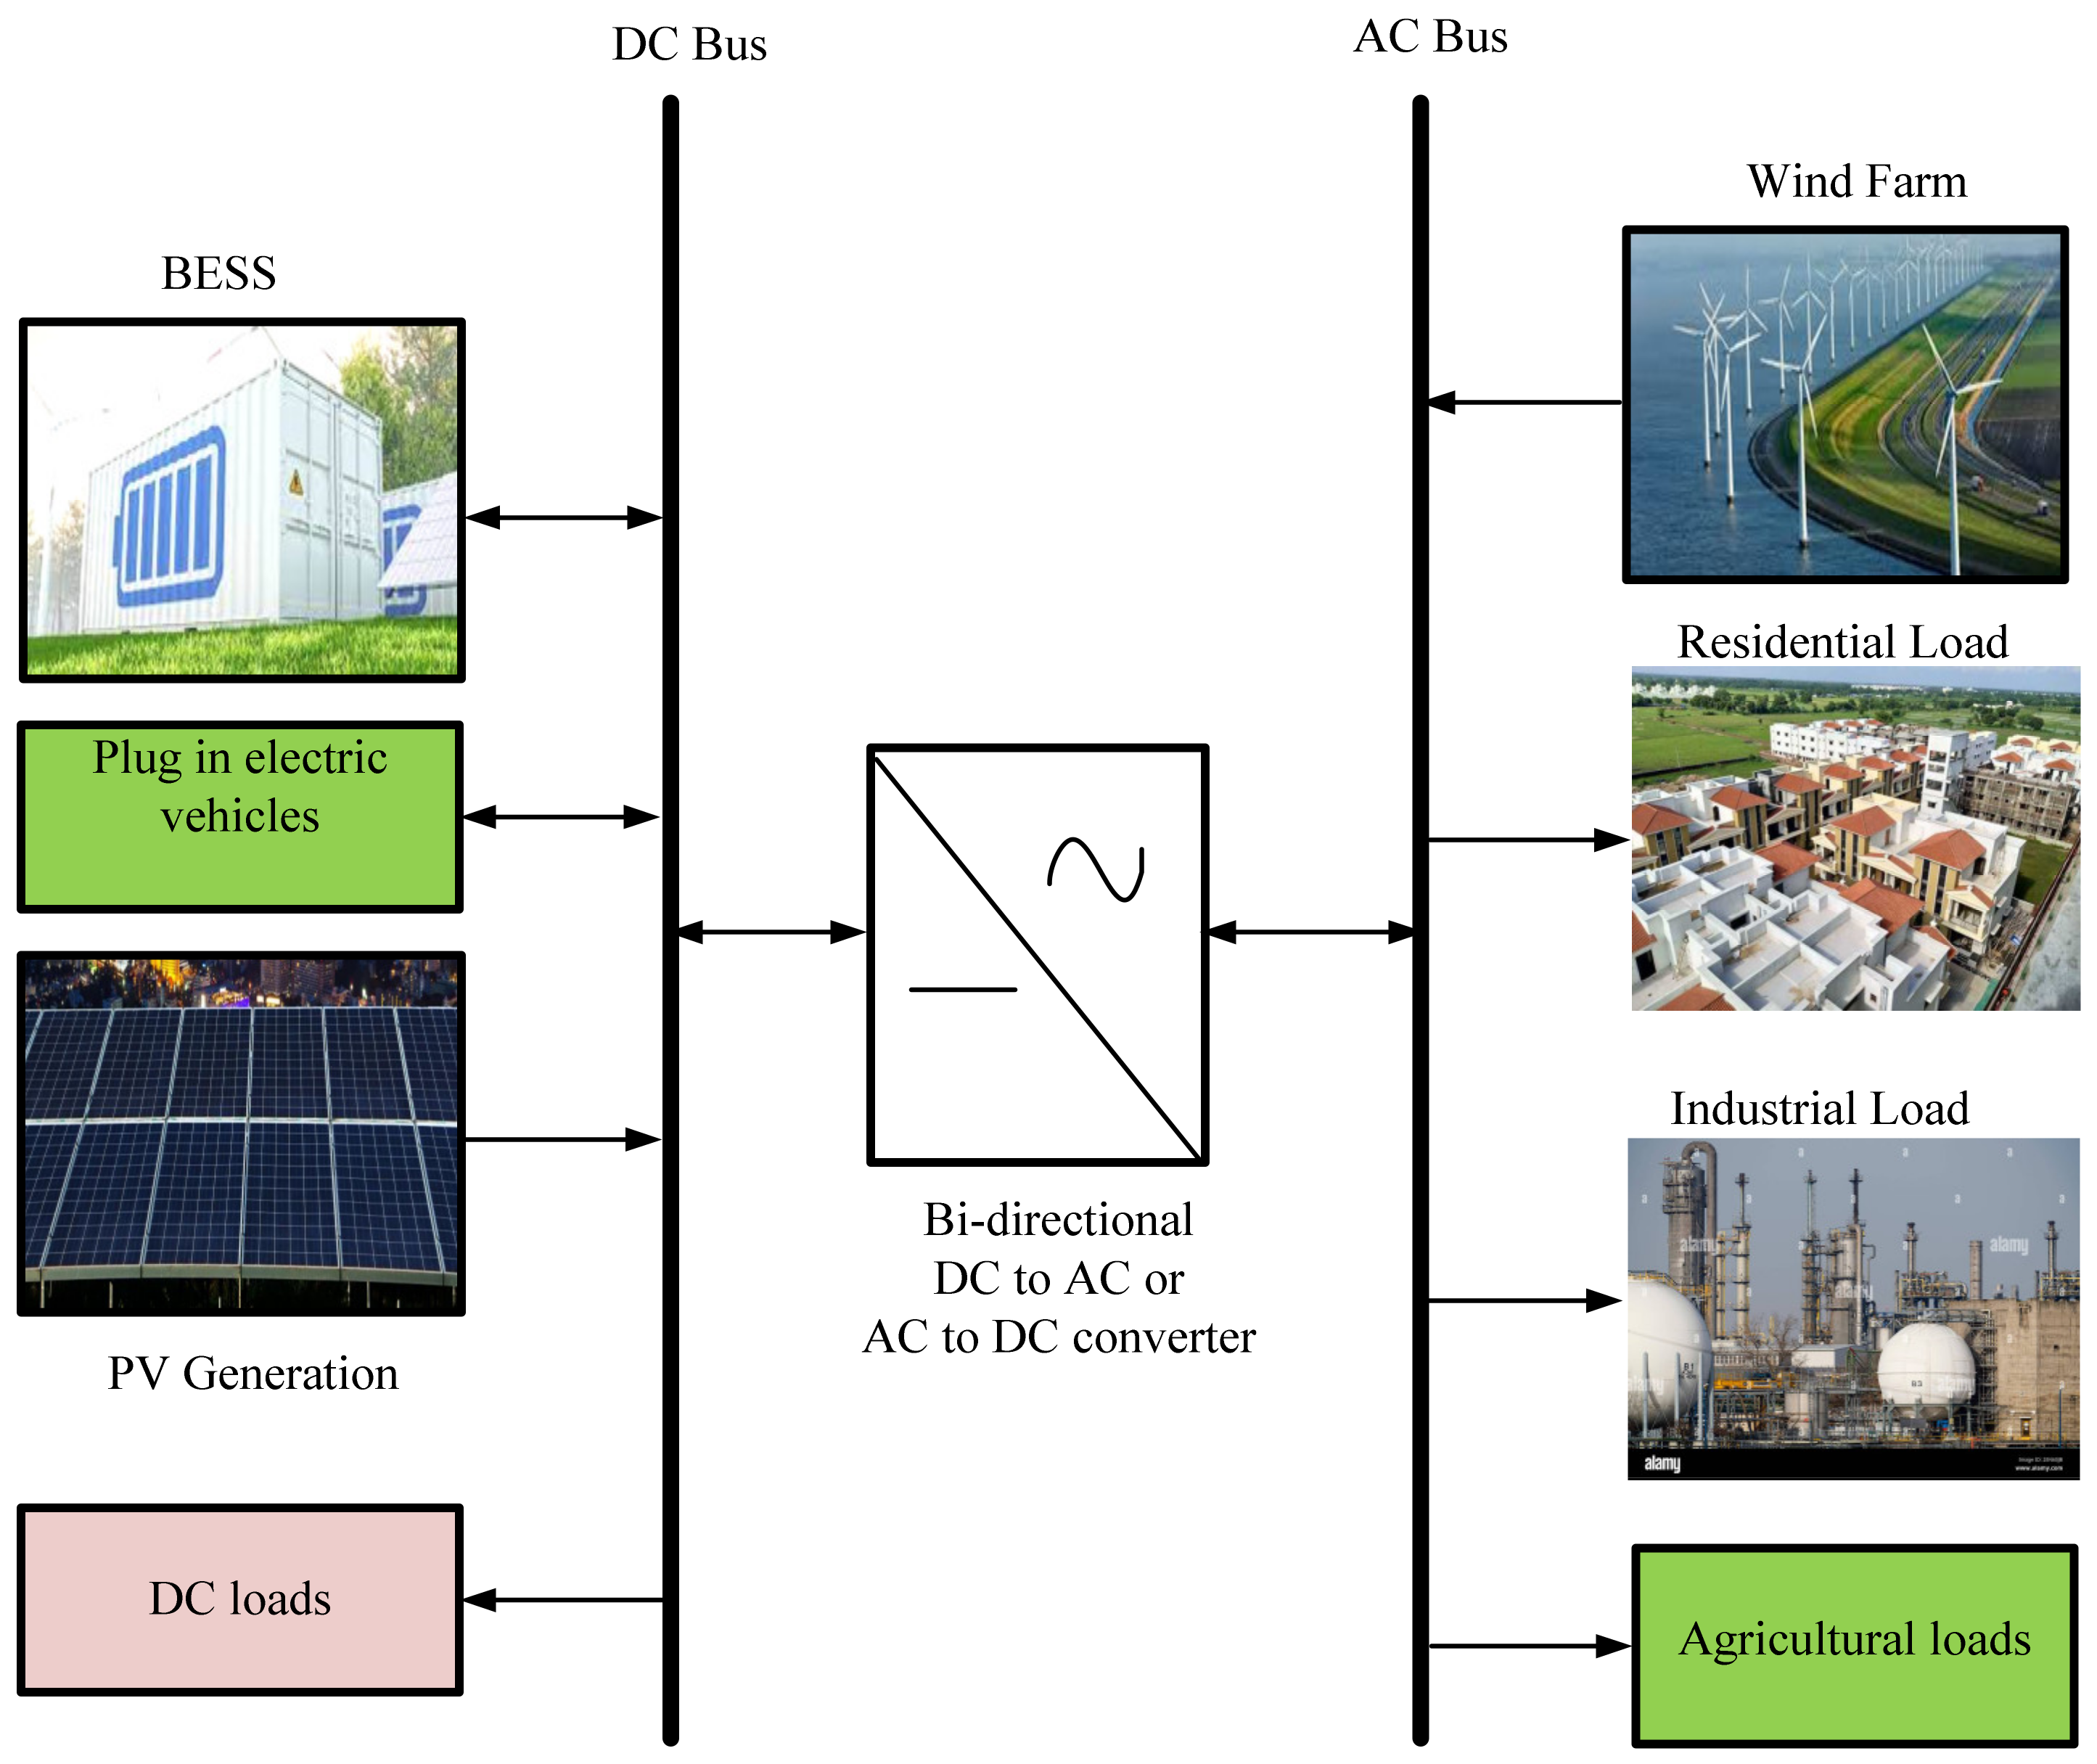
Figure 2 shows a general layout of hybrid MG systems where the DC bus and AC bus are connected using a bi-directional converter. The EM achieved in grid-connected mode [
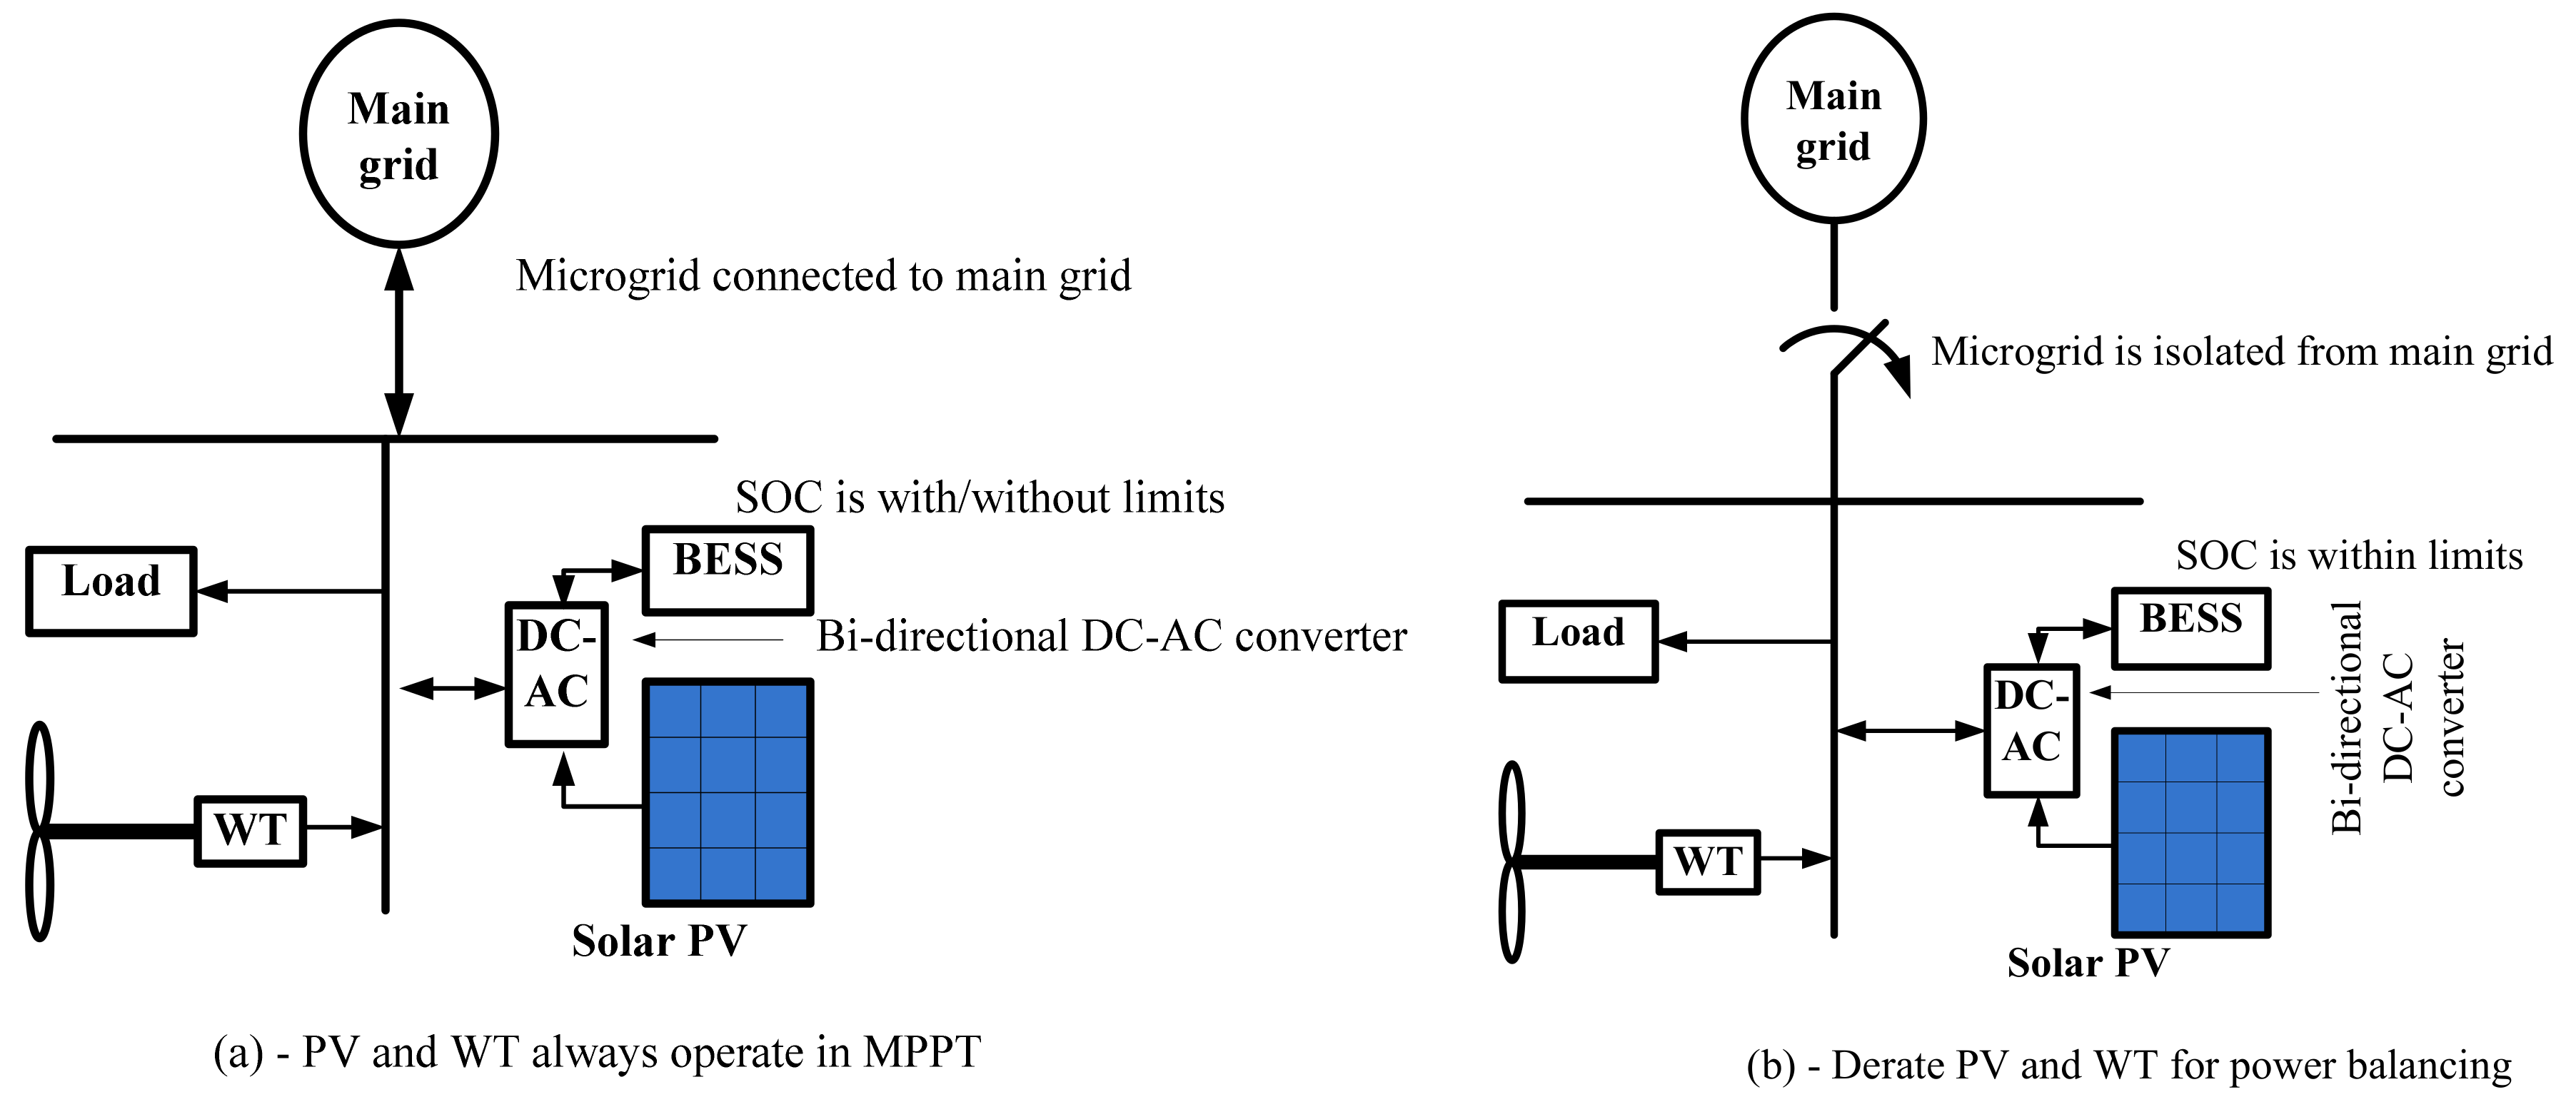
10] is as follows: all the DGs, i.e., wind turbine (WT) and photo voltaic (PV) operate in maximum power point tracking (MPPT), and the dispatchable sources in the main grid supply the surplus load demand if any. During the energy surplus from MG, the BESS gets charged based on SOC. If the maximum SOC level is met, then the DGs supply the main grid and all dispatchable sources control their outputs as shown in Figure 3.
P d i s p = P L o a d P W i n d P P V P B E S S
In isolated mode [11], based on the level of SOC, the DGs may or may not operate in MPPT. BESS supplies the surplus load if any. In off-MPPT, the DGs output is controlled by derating its power where PVs operate in voltage-controlled mode and WT output power operates with the pitch control mechanism. During MPPT operation, the DGs work in MPPT and the BESS charges/discharges based on the energy surplus/deficit.
P B E S S = P L o a d P W i n d P P V
The stochasticity produced by DGs and loads injects high frequency switching transients within the MG which degrades the life of the BESS, because of its low frequency and low power density capability. A super capacitor (SC) has low energy and high density; therefore, to enhance the life of the BESS [12], the BESS operates with a SC and forms a hybrid storage energy system. Proper EM is needed to boost the efficiency of the power system and manage the ever-increasing peak demand. Deployment of new sources for meeting the shortage of electrical power is not a key solution. A promising solution to overcome the above challenges is the active participation of customers in electricity usage. In the last few decades, the power system has been in a situation where the sporadic nature is at the customer end and the generation should meet the fluctuations in the load demand.
The modern power system is quite complex, and the sporadic nature is also shifted towards the source side [13]. Therefore, it is necessary for the implementation of DR programs in the existing environment so as to manage the energy flow and control the stochasticity of loads, sources, and electricity price as shown in Figure 4.
Large integration of intermittent sources and loads into the MG needs proper EM. EM can be done at both ends, either at the source side or at the load side depending on the method of control. Optimal scheduling of DERs, optimal sizing of DERs, and optimal sizing of BESS perform supply-demand balance from the source end side, DR programs perform supply-demand balance from the end-user side. Uncertainty in RES, uncertainty in loads, and uncertainty in price require effective control. The former is mitigated by deploying fast-acting sources, the latter two addressed by performing DR programs. Power system restructuring leads to the usage of advanced metering infrastructure (AMI) which helps customers to monitor the electricity prices continuously. There can be effective scheduling of their interruptible loads (ILs) as per the charges of the real-time market by safeguarding the security of the power system. The paradigm shift from the way customers buy or sell energy has been enabled by the creation of a common marketplace or platform which establishes both energy transfer and transaction settlement on both sides. A significant change in the technologies of transmission networks is essential so as to uphold the reliability and security of the microgrid. To overcome the above challenges, there is a need to incorporate communication technologies into the distribution network such as smart metering infrastructure, supervisory control and data acquisition (SCADA), etc.
Moreover, the incorporation of EMS into the distribution network leads to the active participation of customers. The basic inputs for managing the energy in the MG are load and weather forecasting, state of charge (SOC) levels of BESS, operational, security, and reliability constraints, and the possible solutions from the EM algorithm are the schedule of DERs, load shedding/load growth, and optimal sizing of DERs. There are mainly two EMS viz., demand-side management and supply-side management and the control may be either centralized or decentralized. It is necessary to model the loads for applying the above two methods. Based on the elasticity and cross elasticity behavior of consumers, they are categorized into agricultural, industrial, residential, and commercial loads.
DR is well-defined as variations in electricity consumption by end-users based on market price fluctuation (Rs/kWh) without jeopardizing power system security [14]. DR contributes to the system reliability, security, efficiency, and economic operation of the MG. Further, DR provides a dynamic balance between supply and demand in all instances. DR is seen as one of the cornerstones of future MG for addressing the above-concerned challenges, it can be noted that resilient control can be incorporated at this stage to deal with faults [15]. Moreover, customer comfort [16] should be ensured while performing the DR operations. The load consumption pattern should match the generation profile. Loads should be diversified so that the diversity factor gets improved. DR alleviates the load profile by shifting the peak load, filling the valley point which decreases the operational cost of the MG. Various researchers are working in this field as DR techniques have the potential to solve the majority of existing power system problems. This paper focuses on the impact of DR programs on sizing problems and consumer price. Moreover, a brief review of aggregator functions, load clustering methods, and various trading models are mentioned.
Figure 5 shows the function of DSM. The collaboration between the BESS and DR programs will enhance the performance of the power system due to the uncertainty present in generation, loads, and electricity price. Decomposition algorithm with three scheduling patterns employed in [17], namely day ahead (DA) scheduling to optimize the expected operational cost of MG, an hour ahead (HA) scheduling to reduce the gap between DA, and real-time (RT) scheduling, and RT scheduling is employed to reduce the real power imbalance.
A review on DR programs and EMS is presented in [18]. A review on integration of DGs with the BESS, utilizing the demand side resources for increasing the flexibility of MG, and various market rules have been proposed in [19]. A review on DR strategies and EM in smart environments is presented in [20]. A detailed review on various artificial intelligence (AI)-based algorithms to forecast the energy requirement during peak hours is presented in [21], in which home energy management system (HEMS) is considered for the course of study. The forecast and EMS can be applied on any of the issues such as DGs output power, electricity price, and on loads [22,23,24,25,26]. A review [27] on EM in buildings based on reinforcement learning (RL) algorithms is applied for responsive sources in buildings, i.e., PV, BESS, electric vehicles (EVs), and heating, ventilating and air conditioning (HVAC) systems. 
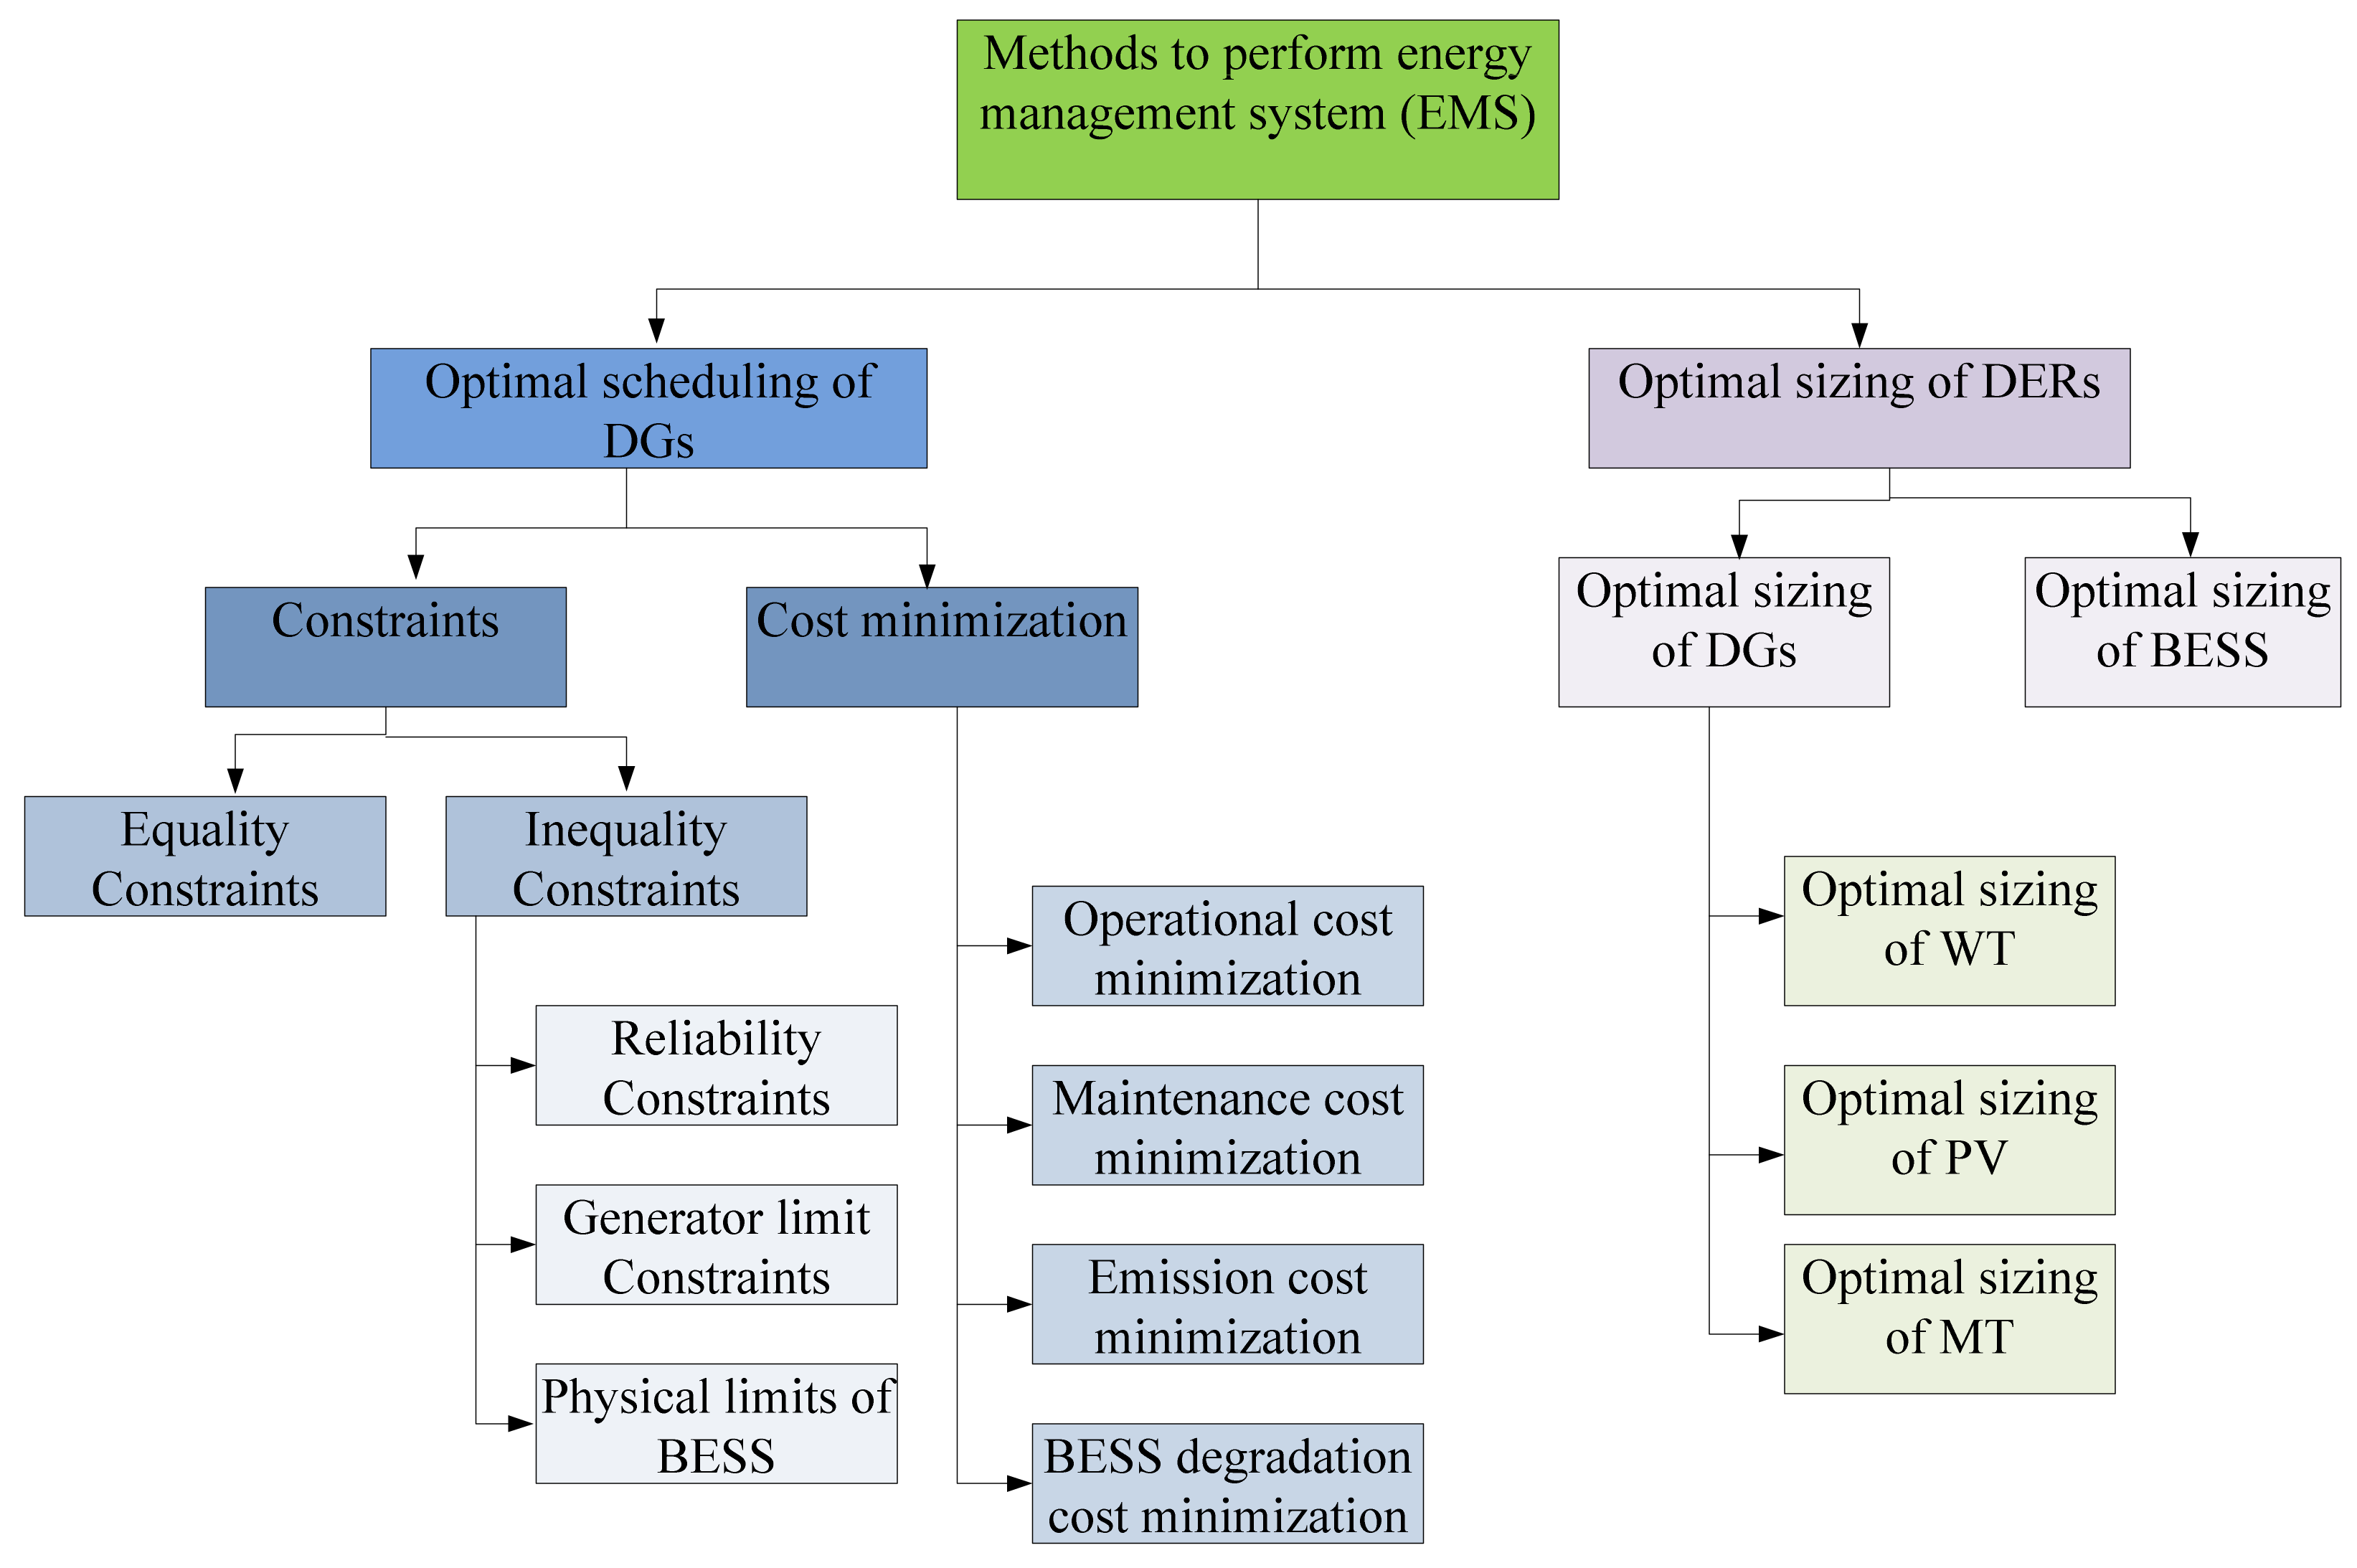
Figure 6 shows various EM techniques at source side.
The deployment of RES causes a drop in the overall inertia of the modern power system. This poor inertia subsequently leads to frequency oscillations [28]. Frequency stability [29] can be analyzed by simulating a loss of a generator or a loss of the majority of a load under an aggregator or a balanced fault on the steady-state system. At present, supervision of distribution networks has become more difficult due to the penetration of intermittent renewable energy in large amounts. Volatility and uncertainty in renewable energy sources (RES) increase the burden on independent system operators (ISO) to match the generation and demand. Large-size thermal generators do not have an immediate ramp-up capability. BESS provides sufficient power balance with high speed compared to other DGs; however, it is costly. Therefore, there is a necessity to find alternate solutions. The literature and the case studies considered depict the influence of DR programs on the sizing and on consumer’s tariff.
In [30], a real-time hardware prototype is developed to manage the energy flow between the MG and the main grid efficiently. Three cases have been considered, namely, peak hours on the conventional grid, off-peak mode on the main grid, and isolated mode where MG is disconnected from the main grid. A peak EMS is proposed by scheduling the PV and the BESS in order to mitigate the stress developed on the main grid during peak hours and optimize the battery status based on SOC and grid status based on load profile. The failure rate on the system is a function of the number of devices connected. As the type of sources considered is of a DC nature, redundancy of equipment should be limited by considering the DC-MG to improve the reliability and reduce the conversion losses of the MG system. Therefore, the number of devices required to integrate DC sources with the AC grid gets reduced which ultimately decreases the failure rate of the system.
By performing the above two strategies as shown in Figure 6 and Figure 7, the system operators increase the energy efficiency and improve the reliability of the MG. The area under the curve before and after valley filling should be identical to each other. Basically, the type of tariff should be simple and easy to understand by every consumer. There should be a minimum number of price updates. Depending on the number of updates and duration for each price, pricing-based tariffs are classified into three types. Table 1 shows the key differences between price-based techniques.
Incentive-based tariffs are clustered into two types, namely, direct load curtailment (DLC) and indirect load curtailment. In the former one, utilities directly control the consumer appliances, therefore there is a possibility to secure threat and customer confidentiality, whereas, in the latter, customers control their loading based on the price signals displayed. Customer baseline load is used for deriving the compensations received by the consumers. However, it requires sophisticated metering infrastructure. Figure 8 shows some of the DR strategies performed by the system operator for effective management of the load whereas Figure 9 shows the benefits of applying DR strategies.

2.1. A Brief Introduction on Optimal Scheduling in a MG

The operational cost of a MG is a function of fuel and operating crew and the amount of fuel required is a function of available load demand on the system. Therefore, proper scheduling of DERs is mandatory for reducing the operational cost of MG. Table 2 presents a brief introduction to various problem definitions for the optimal scheduling of DERs in a MG.

2.2. The Necessity of Optimal Sizing of DERs in a MG

For effective functioning of the power systems, there should be a dynamic balance between the supply and the demand occurring on the system. Though the peak loads on the system occur rarely, there is a need to meet the peak load demand by increasing the supply of electricity. Therefore, the size of DGs is a function of the peak load demand.
Figure 10 depicts the various costs involved while solving the optimal size problem of BESS where the trade-off point is taken between the operational, emission, and installation cost of BESS. As the size increases, the installation cost of BESS increases but the operational cost of MG decreases. The emission cost reduces to a certain point and then increases as the size of BESS increases. The underlying fact is that as the size of BESS increases the recycling cost also increases. Table 3 represents a brief study on various problem definitions for optimal sizing of DERs in a MG.

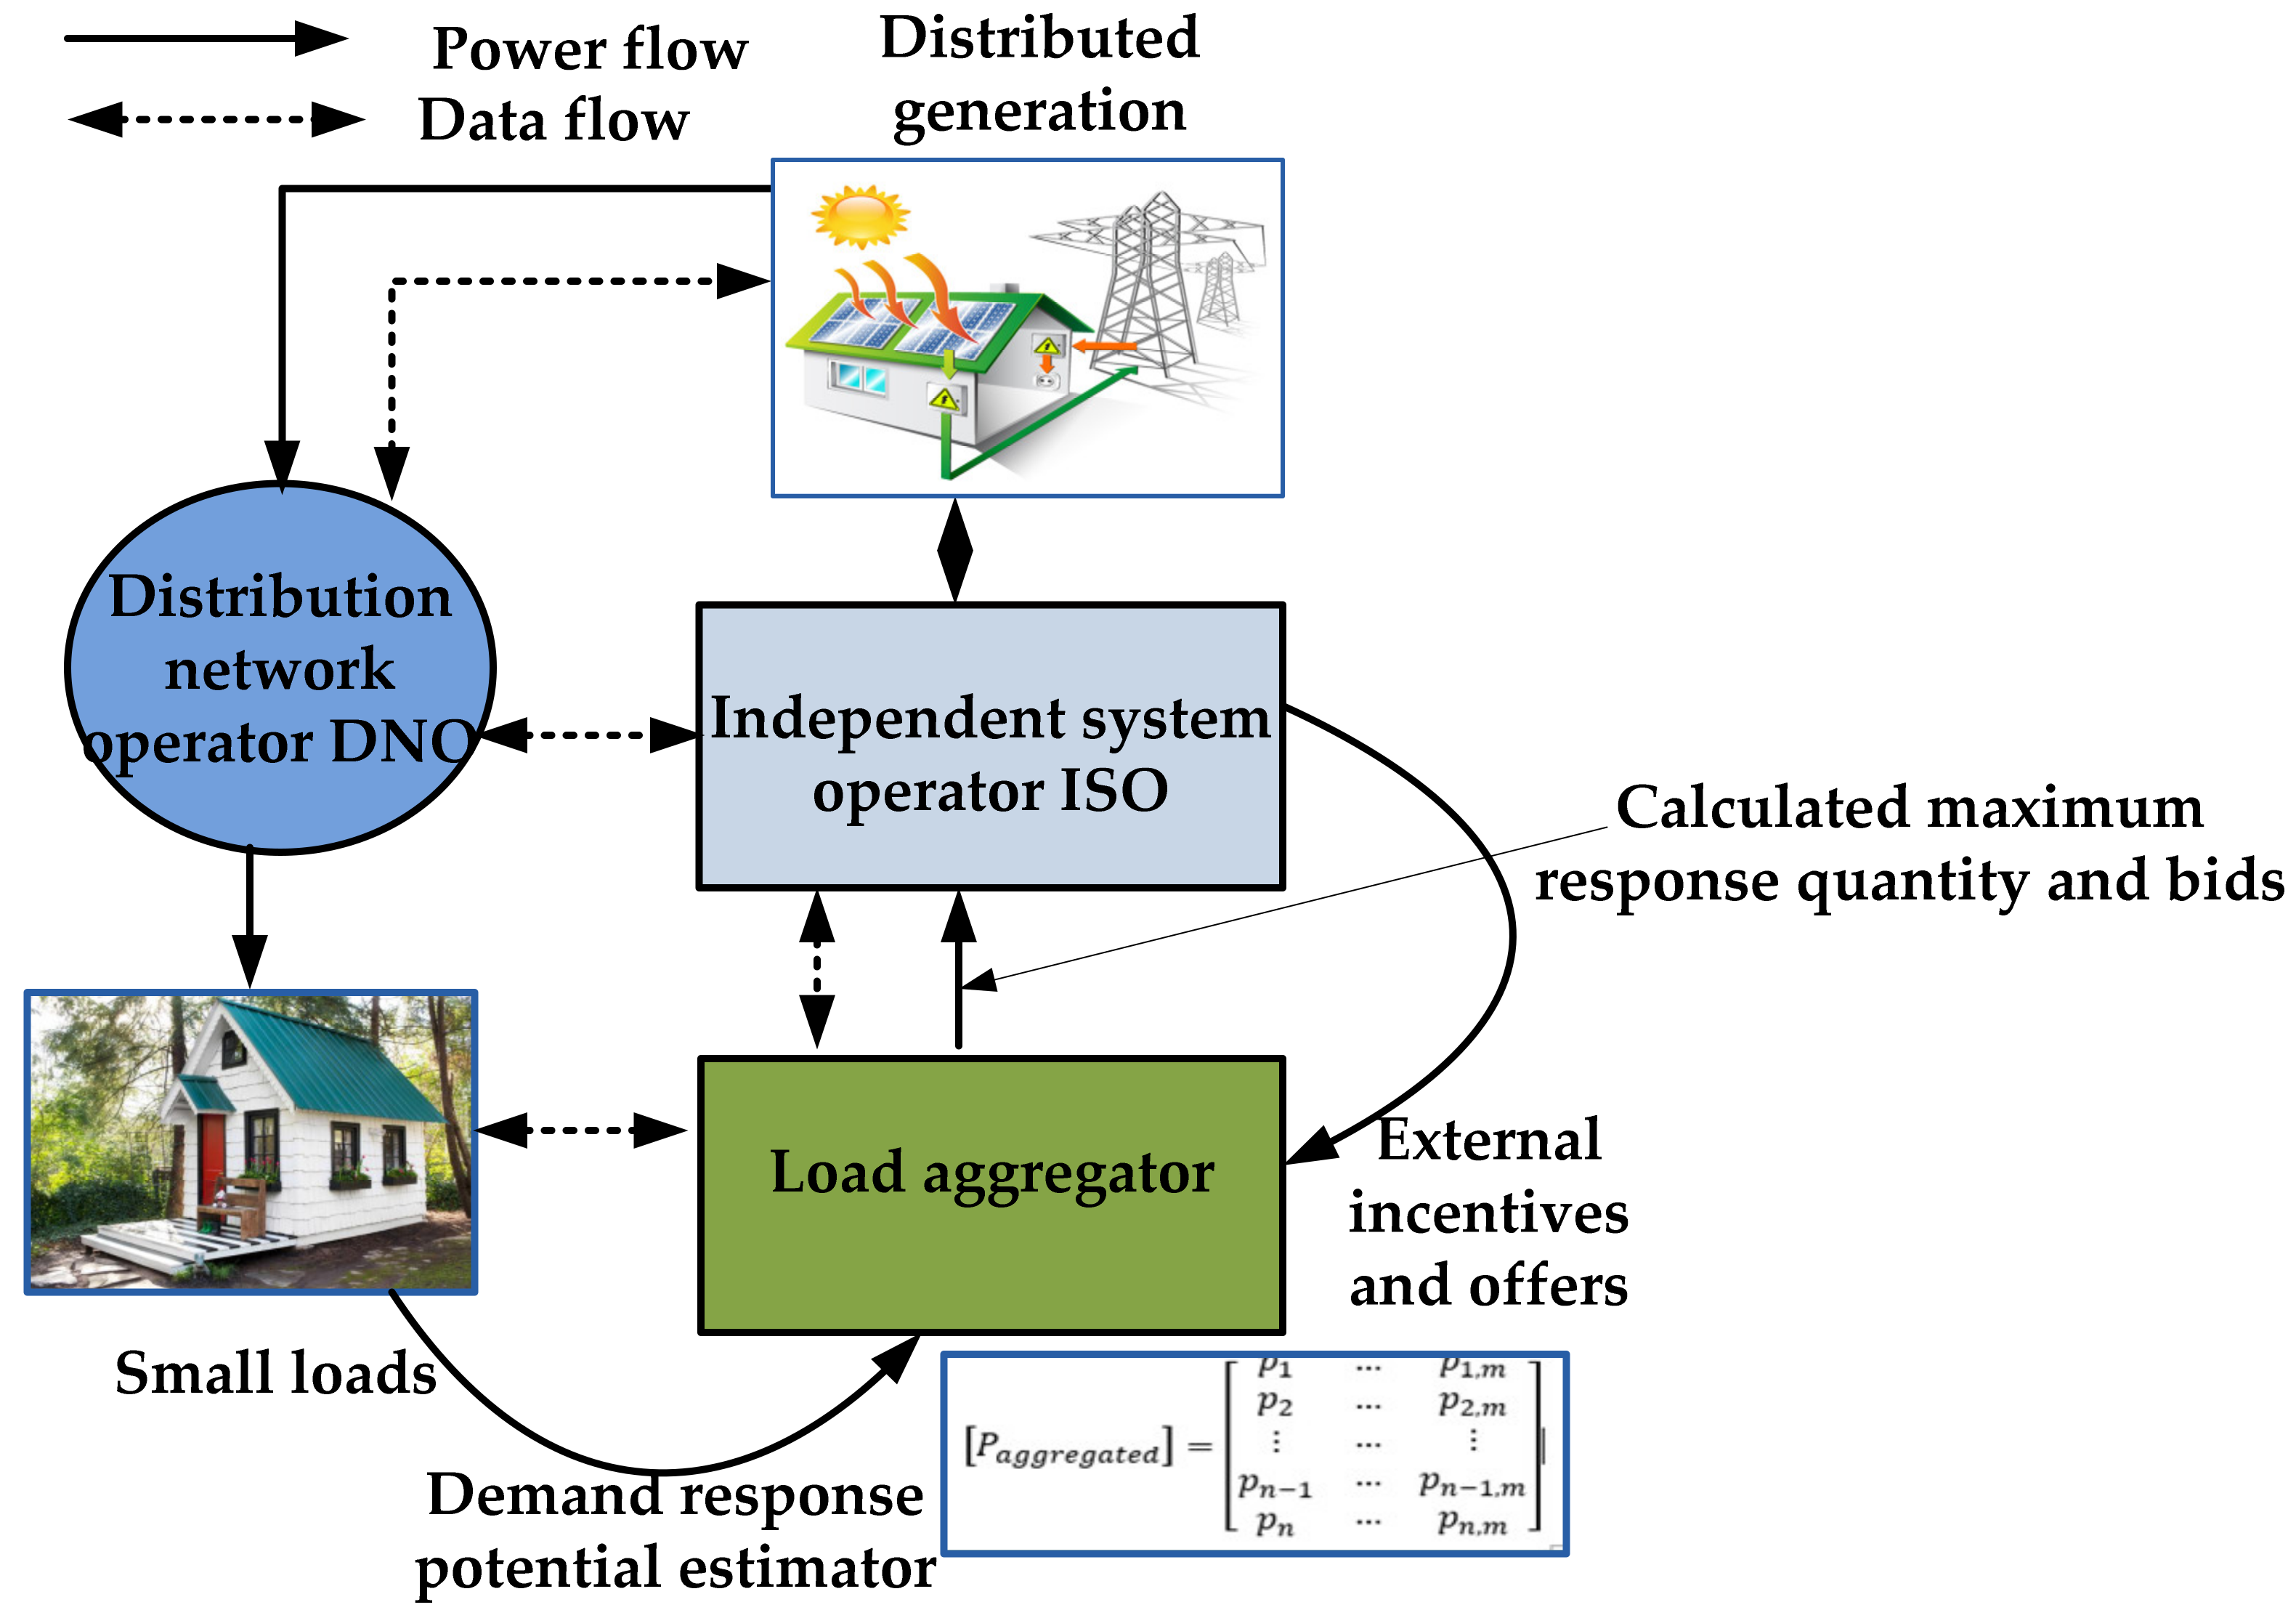
2.3. Functions of DR Aggregator

Customers approach a DR aggregator if they wish to participate in DR programs. Then, the DR aggregator forms a single large load by aggregating the small load demands and establishes linkage with a distributed network operator (DNO) for maximizing the profits. The aggregator acts as a mediator between loads and the ISO and the direction of data flow is bi-directional as shown in Figure 11. The below equation represents the load profiles of ‘n’ individual customers with ‘m’ load profiles submitted to the load aggregator customers, aggregates it, and changes the load pattern as per the electricity price elasticity, and submits the aggregated load data to the ISO. ISO is considered as an information hub when seen from both ends of the power system. The decision variables in DR programs are the electricity price and the incentive cost.
The profit obtained by aggregators depends on the level of penetration of responsive loads. Moreover, high penetration of DERs will offer a benefit to reduce the energy price in the local community and address the undesirable line congestion issues. In [54], a framework was proposed to introduce the competition between the prosumers in which an aggregator plays as a local market operator. In [55], an aggregator model was proposed for reducing the issues in line congestion and voltage deviation, arising in response to flexible resources such as ILs, intelligent electronic devices (IEDs), and various sensors to the external price signals.
The response of loads is uncertain and the consumers participating in the DR programs should be bound to the agreed amount of curtailment or shifting of load. In [56], a method was proposed to assign priority to the reliable loads by reliability analysis. The registration period for the consumers participating in the DR is one month. During this, the aggregator derives the priority based on the consumer response in the scheduled period. Moreover, the aggregator verifies the performance of the reliable customers during the course of action by evaluating the difference between the agreed load curtailment and the actual load curtailment and changes the priority levels based on the response. Disputes in energy trading are inevitable which arises due to the multiple market players of different conflicts of interest. There should be a third party for negotiations or mediations between the prosumers and the upstream grid for suppressing the dispute. Transparency in the supply of electricity and price policies mitigates disputes.
The potential of residential consumers in DR events is increasing because the portion of load consumed by the residential loads when compared with other types of loads gets increased. In [57], the authors proposed a framework for optimal bidding strategy by considering the uncertainty in willingness to participate in DR programs of residential consumers. 
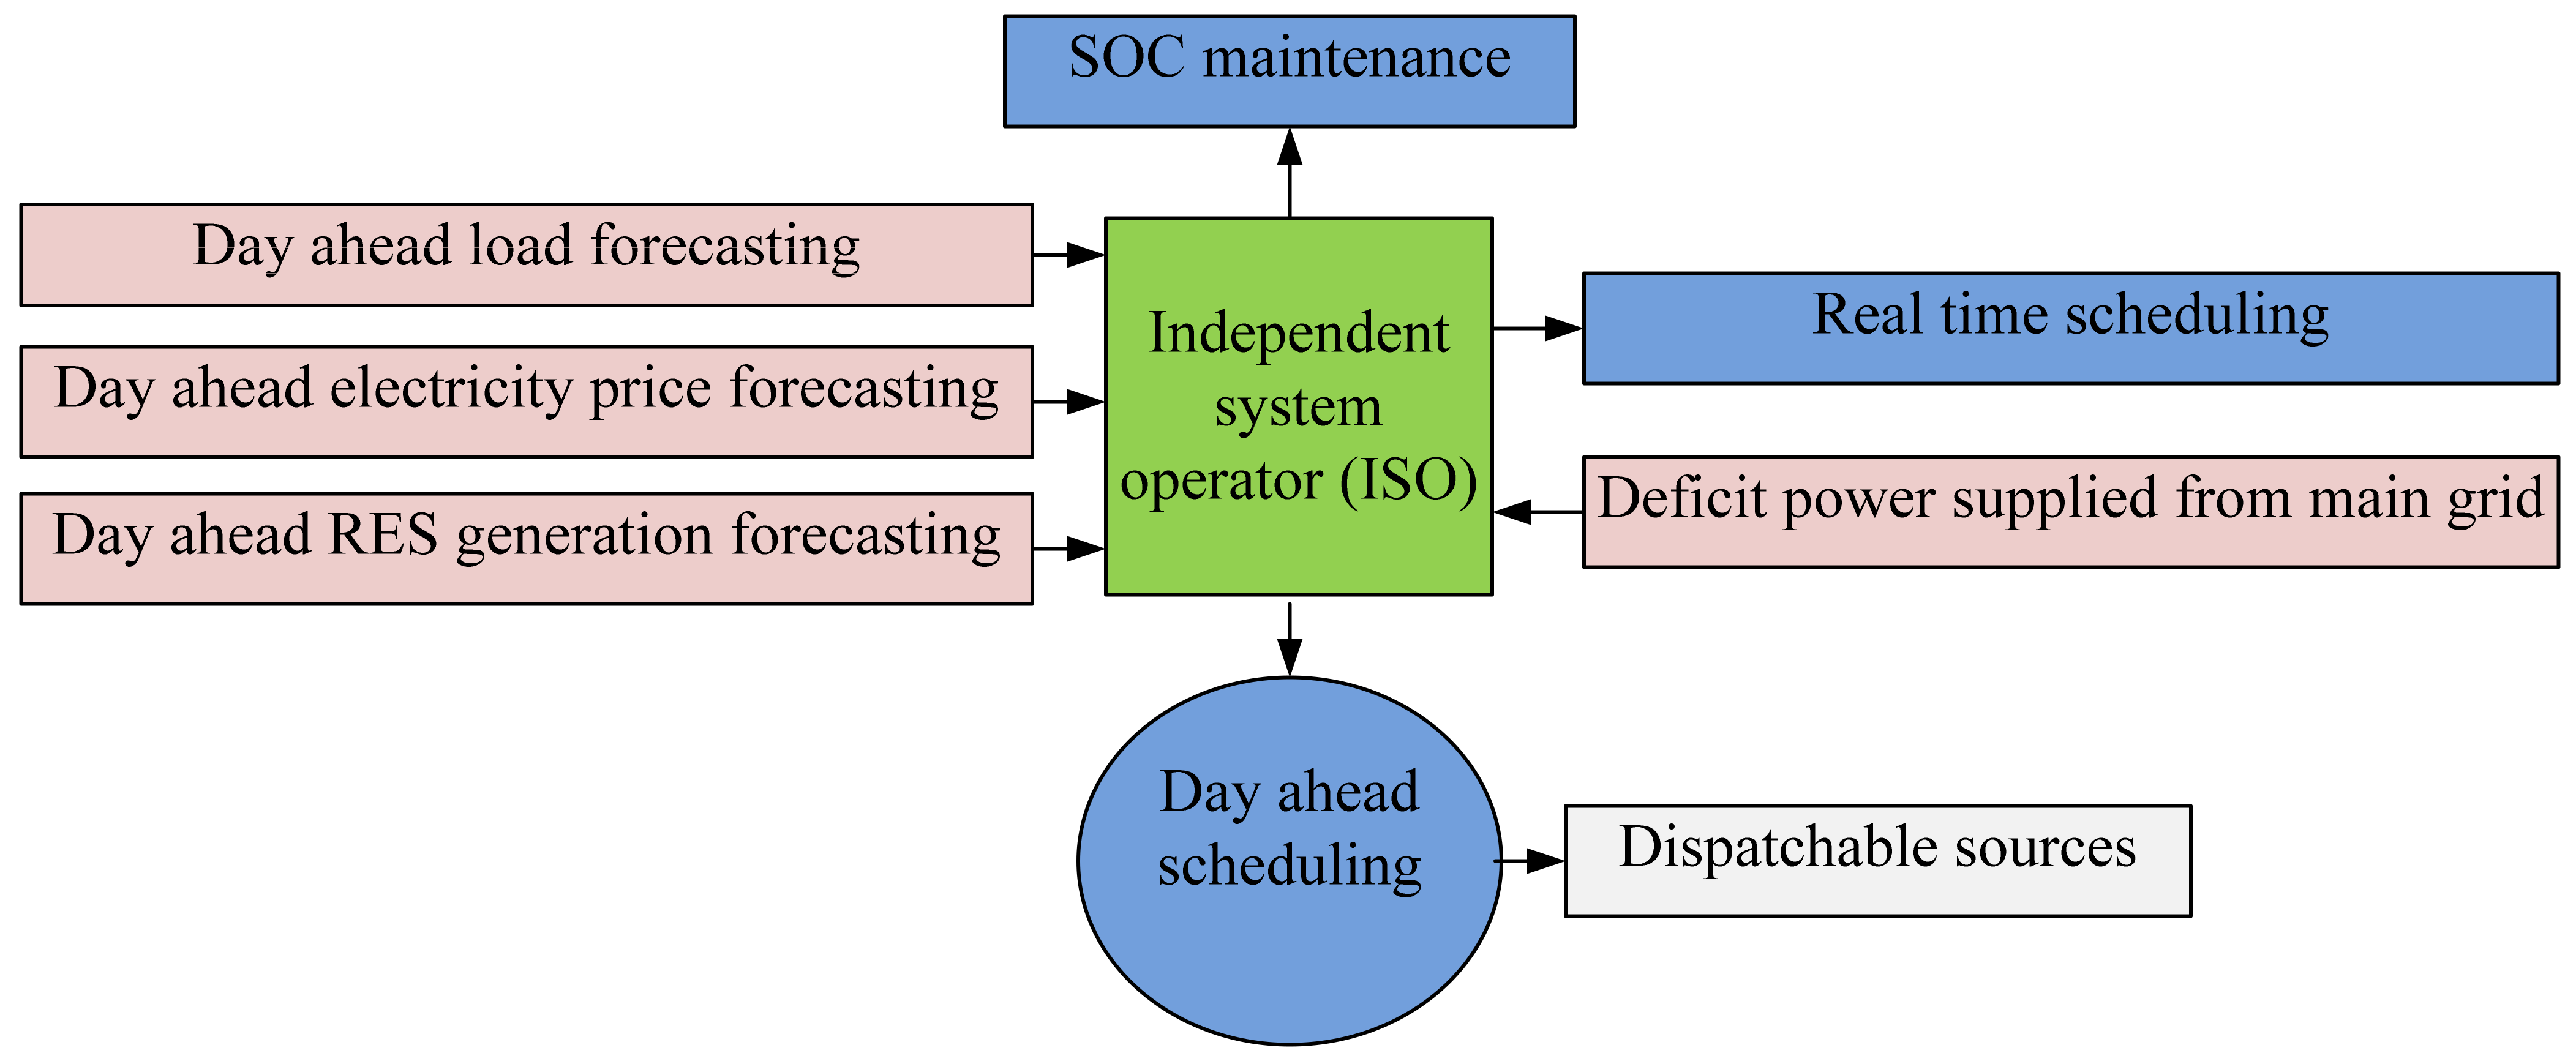
Table 4 represents the function of the aggregator in a MG whereas, Figure 12 indicates the functions of ISO. In general, the below Equation (3) is a function of time. It may change its shape from time to time, either in minutes, hours, or a greater number of frequent updates depending on the type of load connected, scheduled time to run, and duration of run.
P a g g r e g a t e d t = p 1 t p 1 , m t p 2 t p 2 , m t p n 1 t p n 1 , m t p n t p n , m t

2.4. Recap of Energy Trading Models

A novel approach for energy trading is proposed in [67], where a group of MGs has been clustered into individual MGs. In each individual cluster, the deficit power or excess power is taken from/supplied to the neighboring MGs or main grid. The price for supplying excess power is fixed in between the grid buy power and grid sell power. In [68], a fuzzy logic-based model was presented to assess the willingness of customers to participate in DR programs, and then by using the queuing method, a decision was obtained to maximize the profit of the aggregator. In [69], a method was proposed in order to directly control the heating and cooling loads as these loads have the ability to maintain the temperature within tolerable limits for subsequent hours if proper insulation is provided. A two-stage bidding strategy derived from the DA market is suggested to address the uncertainties in the electricity price.
In the majority of European Union (EU) countries, the application of DR programs is restricted to industrial applications. A method named DR-blocks of a building (DR-BOB) is proposed in [70] to apply DR programs to the BOB and aggregate many such buildings for effective bidding in electricity markets. For dynamic balance between the generation and the load, for effective monitoring of voltage levels, frequency, and phase angles at every instant and every point of MG, there is a need to incorporate fast and accurate data transferring technologies. Communication devices are ubiquitous these days in power systems because of their speed and precise data transfer. The data are bulk because more intelligent devices are connected to the distribution network. The centralized controller governs the entire MG by gathering information from all the devices. Therefore, if the size of the data is large then the time taken by the central controller to issue the governing signals gets delayed whereas, in the case of decentralized control, each agent, i.e., customer, DGs, and BESS, defines their own load schedule which employs a multi-agent system (MAS) is presented in [71]. Buildings consume 40% of the total load [72], therefore, Nikos Kampelis et al. [73] implemented a genetic algorithm (GA)-based optimization technique for EM in a building and used artificial neural networks (ANNs) prediction model for yielding DA power requirements of the customer. Time of use (TOU) pricing is used in this literature.
There is a need for a protocol [74] in order to effectively monitor, communicate, optimize, and control the information flow between the loads, distributed generators, intelligent devices, and ISO. The automation system should fetch data from the sensors, process, and be able to give necessary feedback signals to all the essential infrastructure to which it is connected. Implementation of DR-BOB by using DR-technology readiness level (DR-TRL) is proposed in [75]. The distribution system can be made smarter only when the data regarding the states of operation available at all nodes should be transferred by using a wireless communication link as shown in Figure 13. A great amount of information is generated by metering, detecting, and monitoring devices. Therefore, the MG needs dedicated and advanced communication technologies for holding, integrating, processing, and transferring the data. The function of smart meters here is to monitor, troubleshoot, and analyze the energy usage and billing for each period concerned and transfer to the grid as well as to the consumer through a mobile application for effective control. Communication infrastructures such as 5G technology are espoused seamlessly in modern power systems because of their speed, low power consumption, security, and large frequency spectrum presented in [76]. A real example for application of 5G technology in power systems is in 2019, China had carried out a pilot project in establishing protection of distribution network by using 5G technology on China southern power grid [77].
The information and communication technology (ICT) in [78] should have low latency and be able to transfer large market data for the effective operation of power systems. The below Figure 13 shows data flow in a simple MG. A low-cost and low power consumption device named Zig-bee communication in a home area network (HAN) [79,80,81]. Zig-bee, because of its limited range constraint, cannot be used in neighboring area networks (NAN). Wireless fidelity (Wi-Fi) can be used in HAN, NAN, and field area network (FAN). WiMAX has maximum coverage distance compared to all wireless data transfer techniques.
In [82], a pilot project is considered for effective demand-side management and green technology improvements. Game theory is all about achieving the equilibrium point so as to maximize the profit of all the market players. Each and every agent participating in the game gets profit. The profit of each agent depends on the strategy applied by that agent and the strategy of opponents participating in the game. The market players are DSO, aggregator, and the customers. The objective function of each player is considered as the pay-off function. Consider two market players where player 1′s strategy to get maximum payoff is A and player 2′s strategy to get maximum payoff is B and no other strategy for player 1 will yield better outcome other than strategy A, similar for player B; then this equilibrium point is said to be NASH equilibrium. This is used in order to analyze the outcome of the tactical interaction of several choice makers. Table 5 represents a brief introduction to various trading models in a MG.
Each order (either buy or sell option) consists of TAP (time period for energy trade, amount of energy to be traded, and price of energy to be traded). After successful placement of orders, they may be modified or canceled by the same peer until the gate closure time. Once the time lapses, then the individual peer cannot alter the data; only the system operator has the right to alter the list to ensure smooth operation of the power system. A penalty should be imposed on those market players who do not meet their quoted amount of energy listed in the order.
Energy these days has become more or less a commodity. Therefore, it can be related to the stocks. The fundamental difference between them is that electricity cannot be stored, there should be a continuous balancing of supply and demand. There is a need for a flagship trading platform for placing bids and offers. The platform should encompass the following provisions: order placed, the status of orders (pending or executed), portfolio window to check the amount of energy consumed/generated with the amount to be paid/received. There should be a watchlist with all energy participants’ data such as quantity, offer price, bid price, and expected time for price dip: ratings and reviews for each participant should be provided. A hierarchical decision-making trading model is proposed in [83], so as to reduce the DR contract cost at the market operator level and to reduce the incentives at the DR aggregator level so as to maximize social welfare.

2.5. A Combined Literature Survey on Various EMS

Table 6 represents various EM methods for achieving lower operational costs and reducing the installation cost and capital cost of a MG.
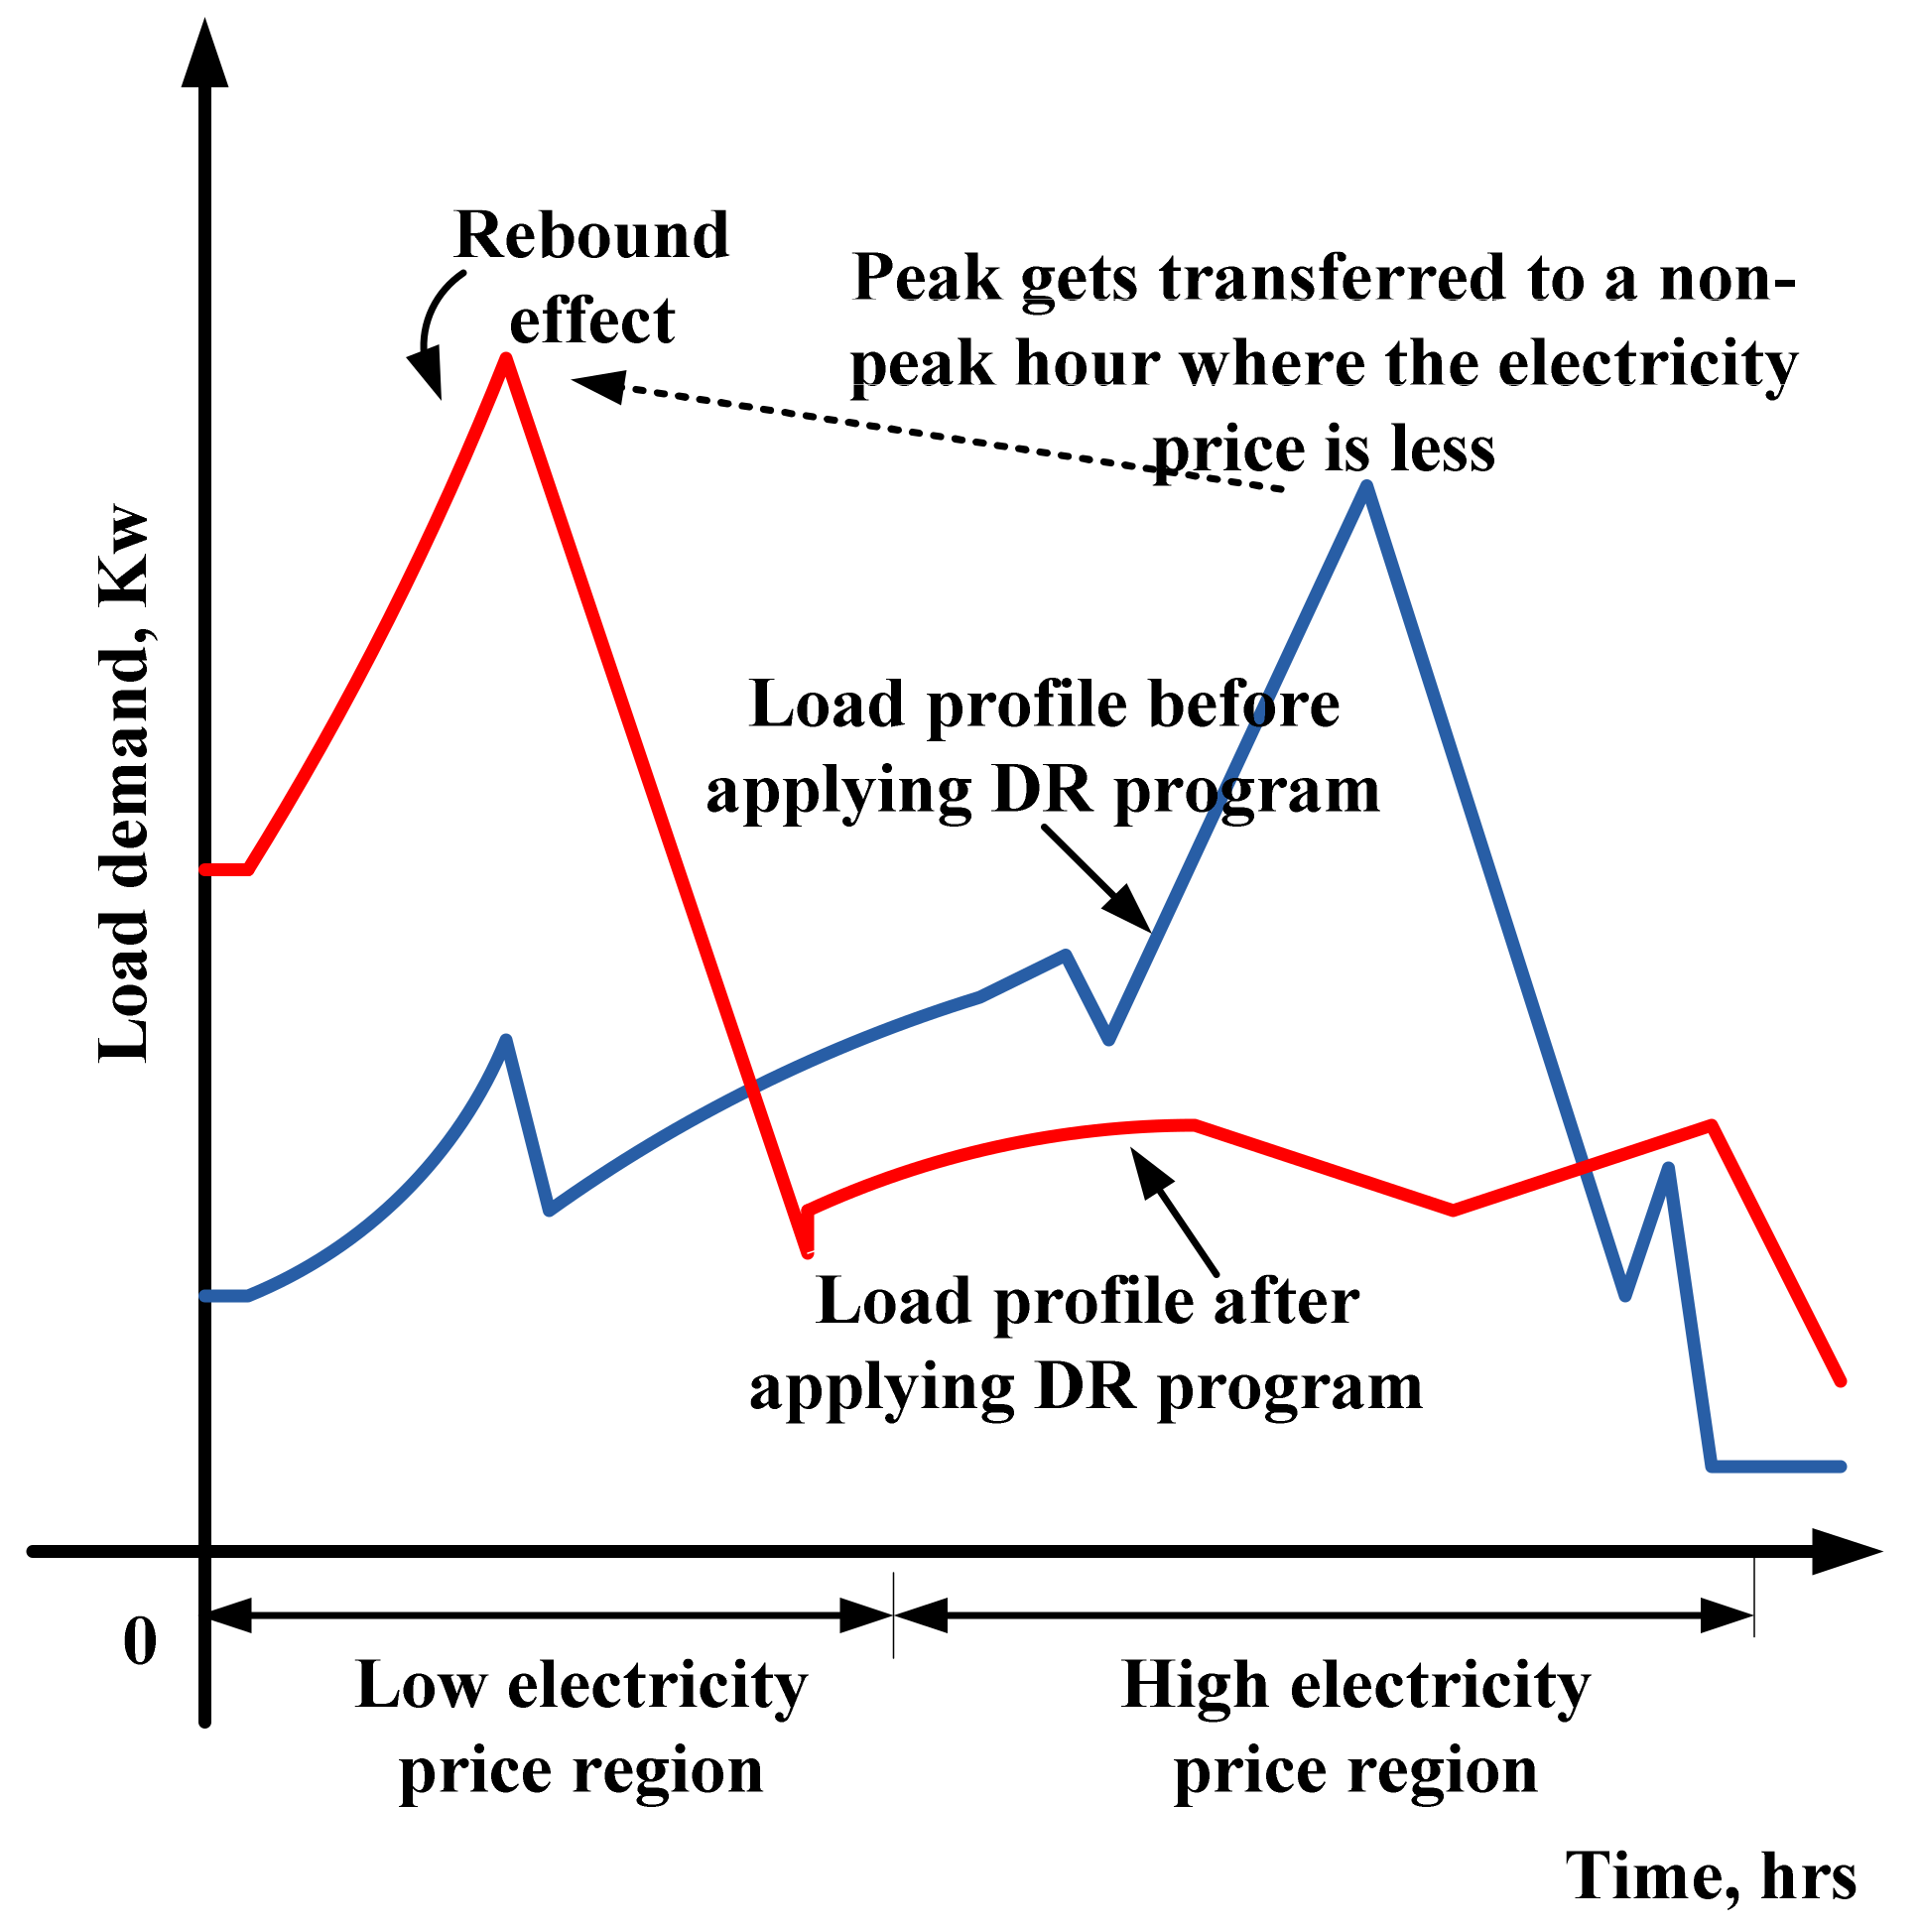
If the level of penetration of flexible or non-critical loads increases, there is a chance of occurrence of payback or rebound effect. Figure 14 shows the impact of load shifting on the rebound effect. The formation of local peaks at low electricity price zones due to the shifting of flexible loads. As the consumer’s participation in DR events increases, the level of peak increases at non-peak hours. The operational cost of the MG also changes because of the load recovery. Further, the system marginal price (SMP) depends on the incremental fuel cost of the marginal generator. Hence, the SMP increases as the demand on the system increases. Therefore, unjustified shifting of non-essential load from peak duration to the off peak should be avoided to reduce the burden on the power systems.

2.6. Load Clustering and Its Significance

The first step in the application of DR programs by the ISO is load clustering. Therefore, there is a need to develop robust clustering models for avoiding the demerits of existing algorithms. There are various clustering mechanisms, among all the clustering algorithms partitional clustering is mostly used. Load clustering can be done by using optimization techniques such as ant colony optimization (ACO), bee colony optimization (BCO), and modified bee colony optimization (MBCO). There are mixed clustering methods where K-means clustering and BCO can be used for hybridization. In K-means clustering, the loads are split into K-clusters and the centroid of each cluster is found. The cluster is grouped with the nearest centroid and the process continued until the centroid gets constant. A K-means algorithm effectively works when the dataset is large. The demerit of this clustering is that there is a need to specify the number of cluster centers before starting the trial run. However, it is also to be noted that complex systems often indicate an intrinsic cluster number if an appropriate tool is chosen [98]. It further explained the necessary and sufficient conditions for cluster consensus of discrete time linear systems. Table 7 shows a brief survey on various clustering methods.
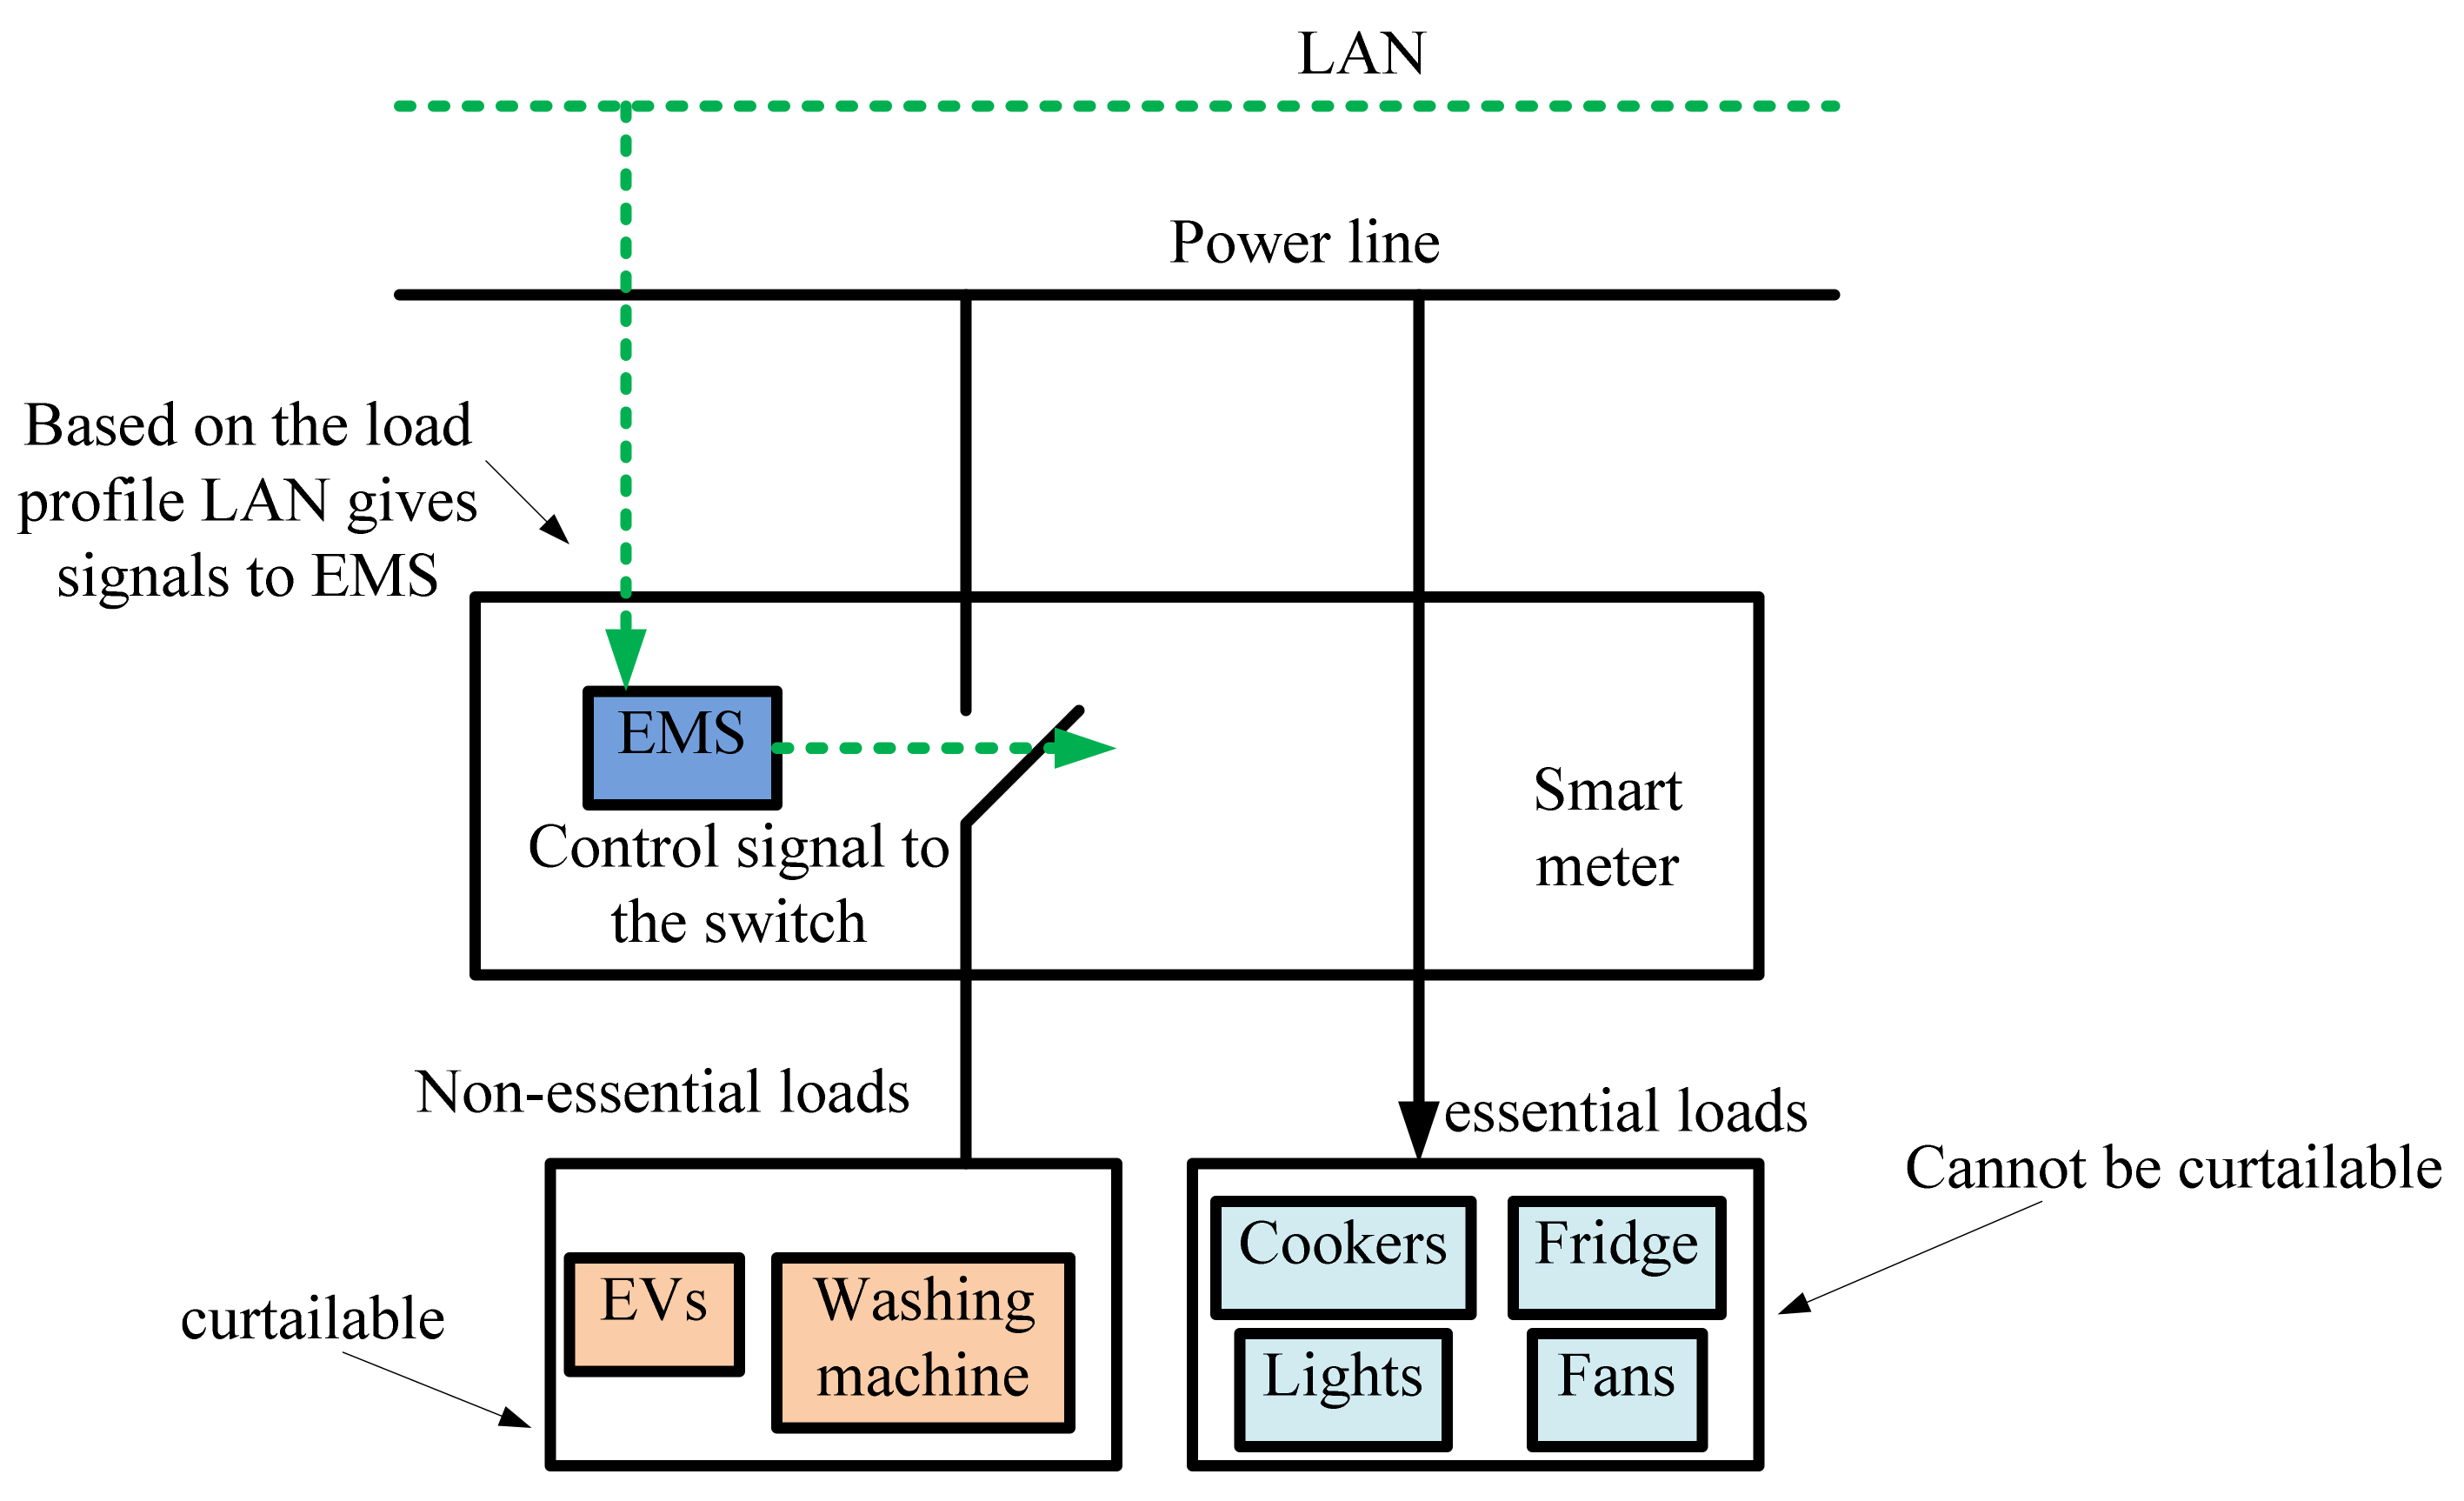
The switching signal obtained from EMS turns on or off the non-essential loads. The increment in load shift from peak to non-peak hours should be strictly controlled by the EMS to avoid the rebound effect. EMS plays a significant role in effective and efficient management of these flexible loads. Figure 15 shows the function of HEMS in a home.

2.7. Noteworthy Points

The following are the key conclusions obtained from a detailed literature survey.
  • Effective load clustering is required to avoid unnecessary compromise in consumers’ satisfaction and lifestyle.
  • The size of DGs is proportional to the peak load demand which has to be supplied by the sources.
  • The consumer’s tariff is a direct function of electricity price, therefore, if there is any change in the consumers’ load pattern in accordance with the electricity price, it may reduce the consumers’ tariff.
  • Occurrence of payback or rebound effect during low electricity price zone.

2.8. Contributions of the Work

A test system is considered and the impacts of DR programs on the supply-side and demand side analyzed. With the basic load profile and the electricity price in the area considered, the optimal size of DGs has been proposed and the electricity tariff burden on the consumer was reduced by the mentioned methods. All the loads are considered as residential loads and clustered into essential and non-essential loads without compromising the lifestyle and satisfaction of the customer. There will be no shifting of essential loads which are scheduled at a particular time. The non-essential loads may or may not be shifted based on the availability of load demand at that instant. Priority is assigned to the non-essential loads with the order of scheduled times by using TOU pricing. An objective function was formulated and an algorithm was proposed for avoiding the rebound effect during load shift. Various sizing methods have been proposed in order to optimally size the DGs with and without considering the uncertainty in PV and WT. The TOU pricing method has been applied for load shifting in DR programs in order to reduce the electricity tariff of the customer.

3. Objective Function Modeling

To reduce the above-mentioned concerns such as capital and installation cost minimization and reduction of consumers tariff, the objective function can be modeled which clusters the load as follows.
The following are the objectives to be solved.
  • Minimize the size of DGs in the power system.
  • Minimize the consumer’s electricity bill and improve the load factor.
Minimize ,   C o s t   f u n c t i o n =   F c a p i t a l + F i n s t a l l a t i o n + F c u s t o m e r s   b i l l
Minimize total cost of installation:
f 1 = T C = i = 1 n C c a p + C m a i n t e n a n c e + C r e p l a c e m e n t
t = o f f ,   i f   t T o f f m i d ,   i f   t T m i d o n ,   i f   t T o n   T   1 ,   2 ,   .   24
where C c a p is the capital cost, C m a i n t e n a n c e is the cost involved in maintenance, t   is the electricity price at time ‘t’, o f f , o n , and m i d are the price during off-peak ( T o f f ), on-peak ( T o n ), and mid-peak ( T m i d ) hours, respectively.
f 2 = m i n ( T E T c u s t o m e r ) = m i n t = 1 24 i = 1 N P i t t
N’ indicates the number of sources available for dispatch and P i t is the consumed power by the consumer ‘i’ at time horizon ‘t’. The problem formulation for minimizing the consumer’s tariff is represented in Equation (7). For achieving the objectives, the loads on the system are effectively clustered into essential ( E L ) and non-essential loads ( N E L ) [106] by considering all the loads as residential loads as they are sharing 25% of load demand on the system.
Total   load   demand ,   T L = E L + N E L
N E L = W 1 L 1 + W 2 L 2 + W 3 L 3
Allocation of priorities to the non-essential loads or curtailable loads in such a way that there should not be any compromise in customer comforts and lifestyle.
  • L 1 Air conditioners, heating loads.
  • L 2 Washing machines
  • L 3 EV’s
L 1 , L 2 , and L 3   are the non-essential loads and the order of priority based on importance is L 1   > L 2 >   L 3 . The higher degree of charging flexibility associated with EVs makes it less prioritized when compared to the other loads in the MG. Therefore, to represent the importance of each load according to its priority, the weights added to the loads should be of different values, where, W 1 = 0.66 , W 2 = 0.33 , W 3 = 0.13 such that all the loads should be met on the same day with some shift in time without violating the customer’s satisfaction.
Subjected to the following constraints:
n = 1 N P n , t g e n = l = 1 L P l , t d e m s = 1 S P s , t , i s h i f t + s = 1 S P s , i , t s h i f t
The energy recovered during peak load is shifted or re-distributed to the other time horizons where the electricity price is low. Total energy curtailed has been re-distributed to other time horizons where electricity price is low. Therefore, the total area before curtailment and after curtailment becomes identical.
The generation should meet the load demand before and after shifting. The above Equation (10) represents the equality constraint, i.e., energy balance equation. Equation (11) shows the simplified version of the energy balance equation, where the difference between generation (by all the ‘N’ generators) and load demand (at all the ‘L’ loads) on the system should be dynamically balanced throughout the considered period, i.e., 24 h. to avoid any frequency drops. The response in loads can be modeled as an ideally flexible negative generation. s = 1 S P t , i s h i f t is the amount of load that has been shifted from ‘t’ to ‘i’ and s = 1 S P s , i , t s h i f t is the amount of load that has been shifted from ‘i’ to ‘t’, l = 1 L P l , t d e m is the amount of load demand and n = 1 N P n , t g e n is the total generated power.
n = 1 N P n , t g e n l = 1 L P l , t d e m = 0   T   1 ,   2 ,   .   24
s = 1 S P D R s , t , i m a x   s h i f t 110   % P b a s e   s   1 ,   2 ,   .   S
T’ represents time in h and ‘S’ represents number of shifting intervals. The generator limits should not be violated while solving DR programs. The increased percentage of load shift by DR programs creates local peaks which occur due to rebound or payback phenomenon [107], at the non-peak hours. Here, P b a s e is considered an average load on the system. The maximum limit on the amount of load shift depends on the shape of load duration curves. The maximum allowable load shift by using DR programs for this considered system should be 110% of base load power, represented in Equation (12) as s = 1 S P D R s , t , i m a x   s h i f t . This constraint is included in order to avoid payback effect or rebound effect. The operational cost of the MG also changes because of the load recovery. Further, the system marginal price (SMP) depends on the incremental fuel cost of the marginal generator. Hence, the SMP increases as the demand on the system increases.
P b a s e = a v g t = 1 24 P L
P m i n P t P m a x
P s i z e D i e s e l = max   d i s p a t c h e d   e n e r g y   b y   t h a t   g e n e r a t o r   i n   24   h o u r s
E C M G   w i t h   D R E C M G   w i t h o u t   D R
Optimal sizing of DGs without considering the impact of uncertainty is proposed. E C M G   w i t h   D R , E C M G   w i t h o u t   D R are the emission costs of MG with DR and without DR program, the total load demand on the system during 24 h. P m i n , P m a x are the minimum and maximum limits on generated power P t from a generator ‘t’. Aggregated load demand is calculated based on the following Equation (17).
P a g g = 1 T t = 1 24 P t
L F = P a g g P L , m a x
where P a g g is average of aggregated load demand, L F is the load factor of the MG, and P L , m a x is the peak load demand that is occurring on the system over 24 h.

4. Proposed Methodology

The solution methodology for reducing the total cost of the system is represented as follows:
  • Read the load data, electricity price in each hour, generator data such as the minimum and maximum capacity, operating costs, and maintenance cost of each generator.
  • Analyze the load profile and check whether the peak load is occurring at a high electricity price zone or not.
  • As the total load on the system is considered as residential loads, cluster them as depicted in Equation (8), based on their priority without sacrificing the customer’s satisfaction and lifestyle.
  • If yes, shift a part of non-essential loads from the peak-occurring instant to the non-peak zone. Therefore, cluster the loads on the basis of an order of priority and based on electricity price, the clustered loads are allocated or dispatched at a particular time instant where the electricity price is low. Priority is added by giving large weight to the highest priority load. If the load on the system is less than the average of the aggregated load, no need to cluster. Shift a part of the peak load to those intervals where the available load is less than the average aggregated load.
  • There should be an upper limit imposed on the amount of load shift on the system to overcome the rebound effect, which is represented in Equation (12).
  • If yes, shift the loads to another time horizon. If no, size the sources, i.e., the sizes of WT, PV, and diesel generators that have to be installed to supply the available load demand in the area without considering the impact of uncertainty based on the peak load demand. Moreover, a portion of generator capacity allocated for any further increment on load demand is represented in Equation (19). The total capacity of generators installed is the sum of all the DGs capacity.
    P s i z e D G s = x   %   ( P s i z e M T + P s i z e D i e s e l + P s i z e R e n e w a l e s )
  • Calculate the capital cost, installation cost, and maintenance cost of each generator by using Table 8.
    T C = S = 1 n C P V S P V + C W T S W T + C d i e s e l S d i e s e l
  • C P V , C W T , and C d i e s e l are the total costs including capital and installation costs of PV, WT, and diesel. S P V , S W T , and S d i e s e l are the sizes of various sources yielded from the simulations.
  • Dispatch or schedule the load on the available generators that are committed to supply and calculate the tariff of the consumer by using Equation (7).
  • Calculate the load factor of the MG by using Equation (18). As the amount of load shift increases, the load curve becomes more uniform thereby improving the load factor.
Figure 16 shows the proposed methodology for achieving the optimal total cost of installation and optimal consumer tariff.

5. Results and Discussions

A test case has been considered to assess the influence of DR programs on optimal sizing of DGs and on the consumer’s tariff. The IEEE-34 bus system is considered whose average load demand is 466.5 kW and the peak demand occurring on the system is 830.3 kW. The case studies are considered simulated with a 24-h load profile and the TOU tariff is taken into consideration. In general, among all the available price-based tariffs, TOU tariff is a simple one, easy to understand, and most customers show interest in this type of tariff.
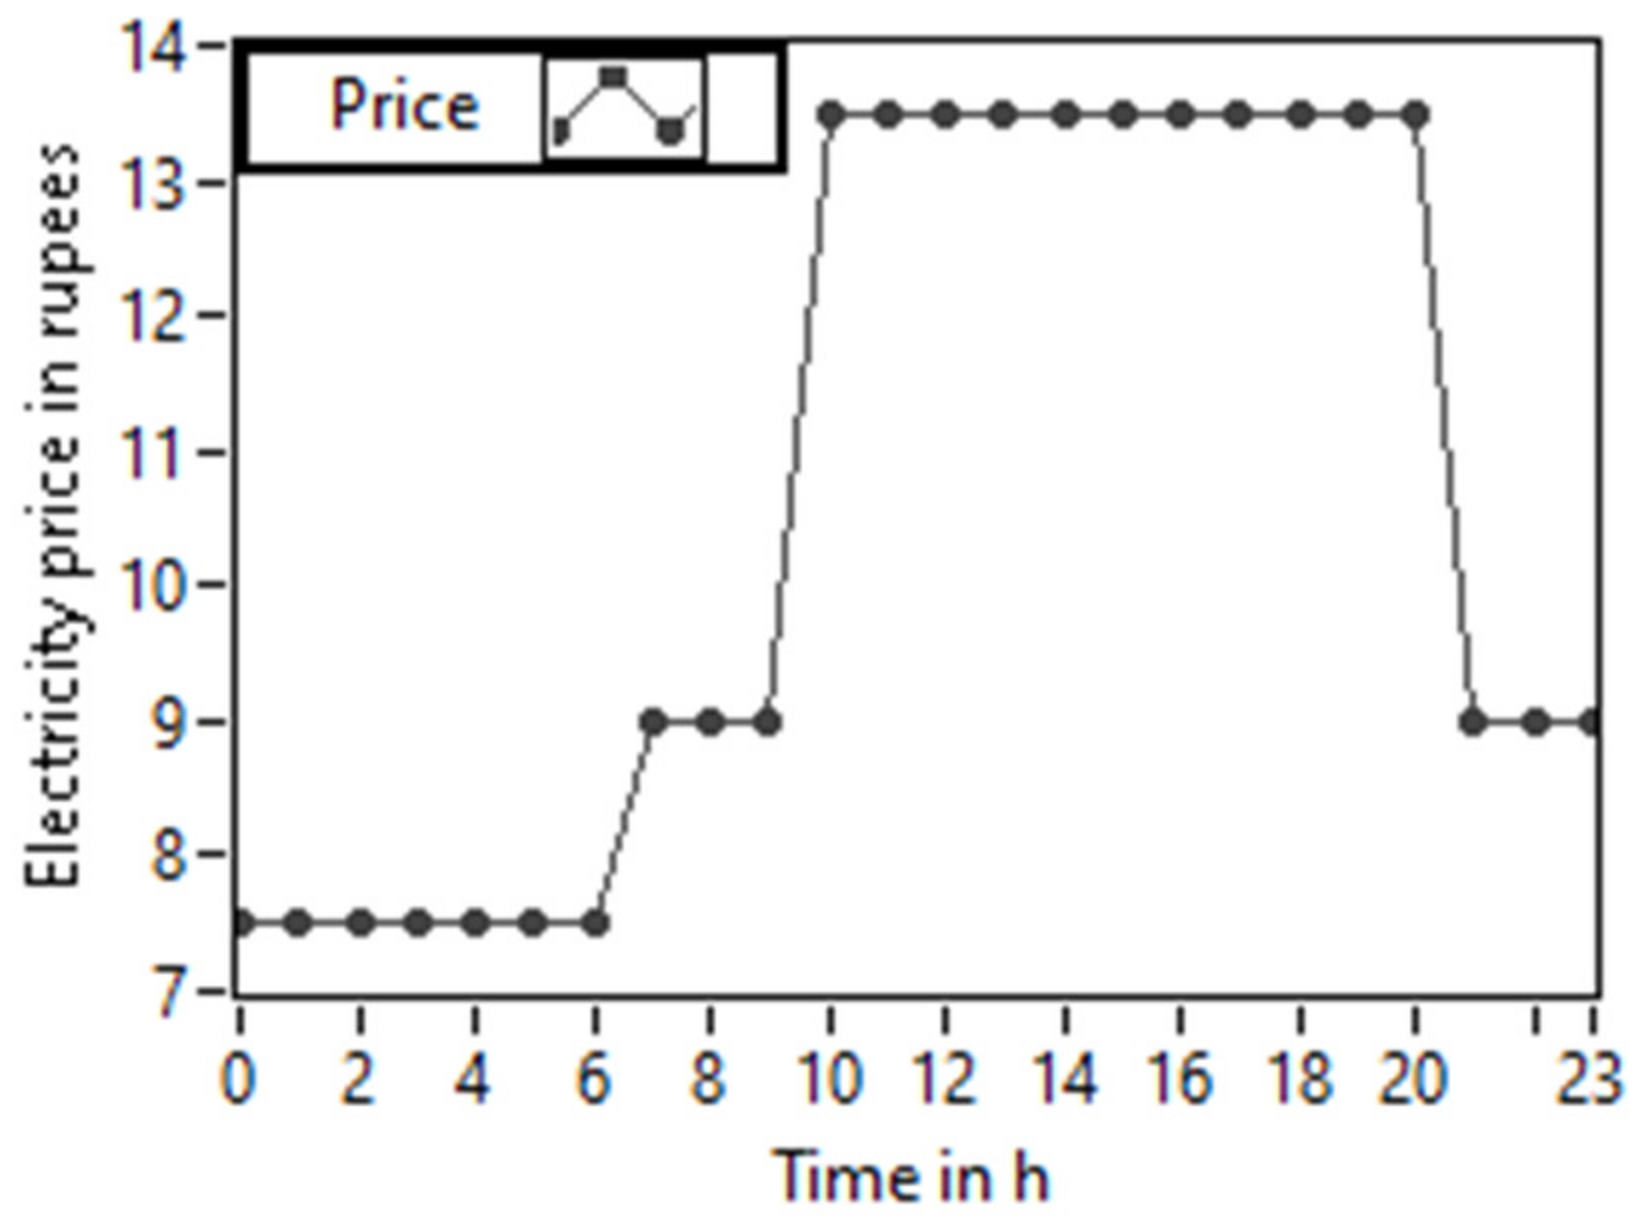
For the considered test system, the customers are charged with a time of use (TOU) tariff where the hours in a day are clustered into peak, off-peak, and moderate peak hours, and the price is fixed. The prices are fixed DA, therefore, there is no ambiguity to the customer to enter into DR programs. Figure 17 shows the variation of DA electricity price and time. The electricity price is high from hours 10:00 to 21:00 and the peak load occurring zone is also at the same time; this results in huge customer bills. One way is to curtail the loads during peak hours to control the tariff where customers’ load demand is not met. Another way is to shift the load demand from the peak load time horizon to off-peak hours. 
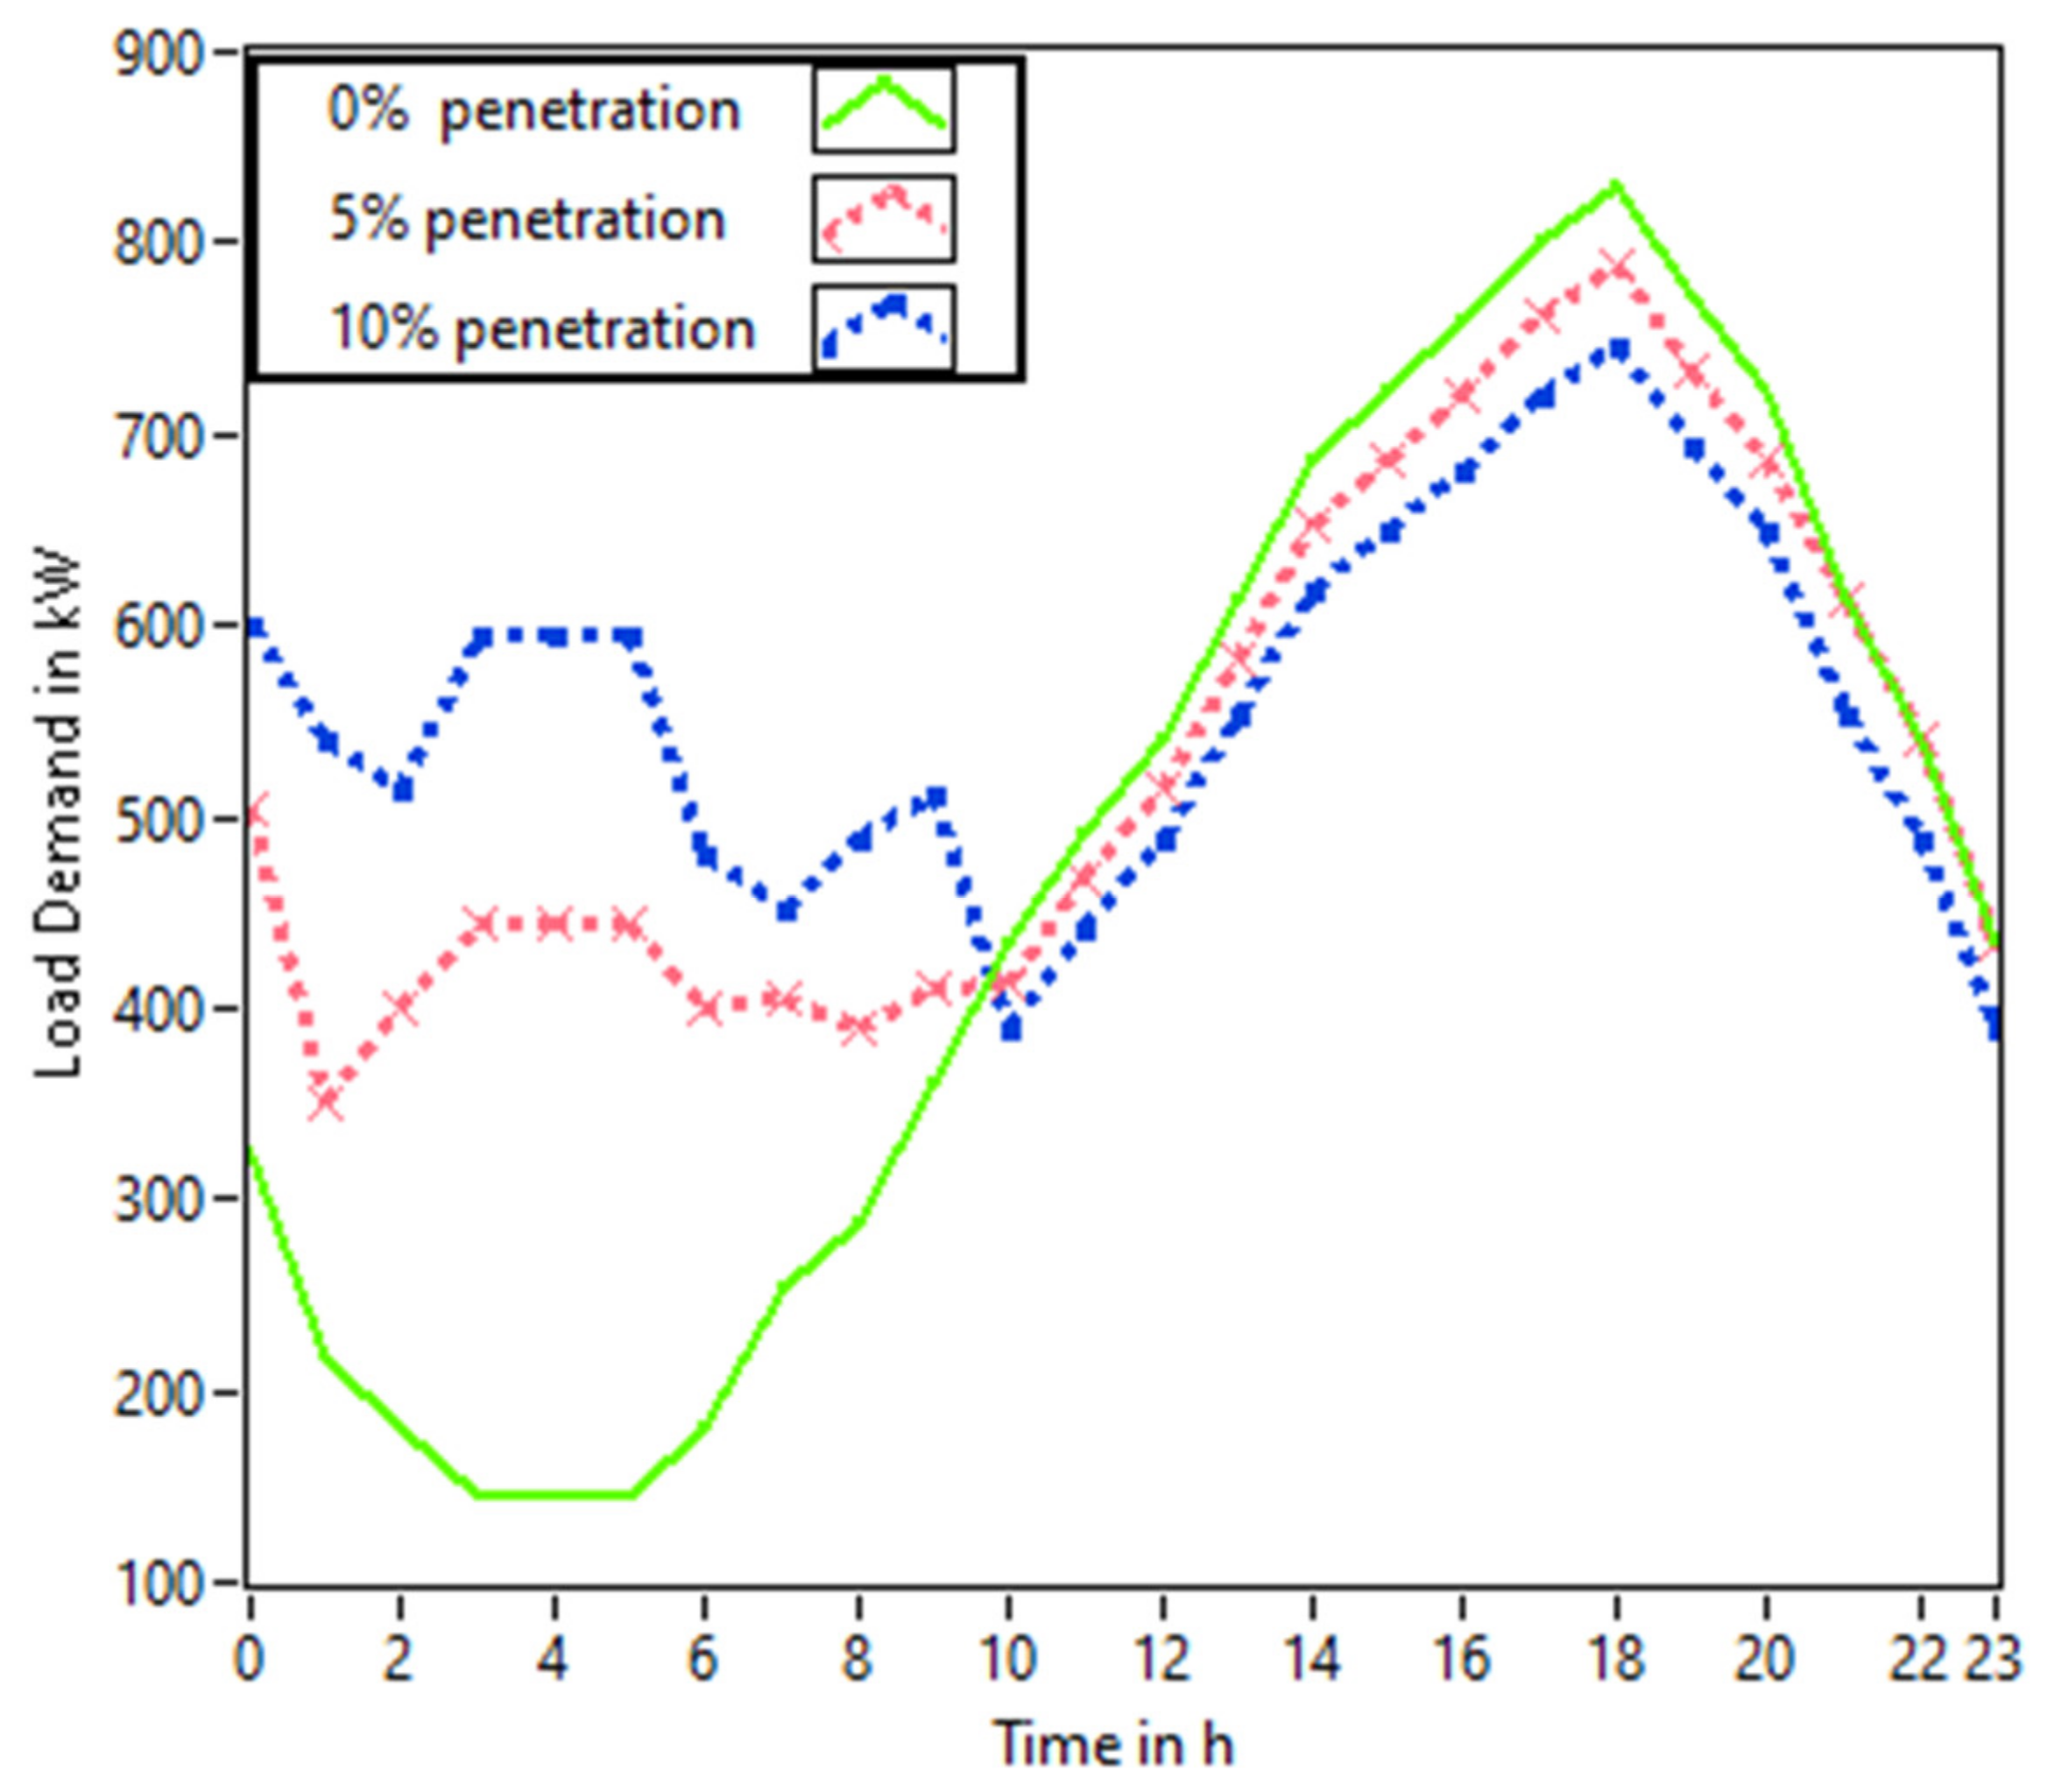
Figure 18 shows the load demand for the three cases considered. Executing DR strategies will benefit not only customers but also the suppliers too. Three cases have been considered, i.e., no penetration of ILs and 5% and 10% penetration of ILs, to analyze the impact of DR programs on consumer electricity bills and load factor. The load has shifted on the time horizon and the total demand on the system per day remains the same. Figure 18 shows the different levels of penetration of loads, i.e., 0%, 5%, and 10%.
Depending on the objective function and the constraints considered the structure of search space changes. Therefore, to avoid this, we considered three scenarios, namely 0% penetration, 5% penetration, and 10% penetration. The algorithm is valid for all the considered scenarios even though the constraints change.
A local peak is created in the load demand curve at non-peak hour instant with a demand of 600 kW. In fact, the load demand before publishing DA tariff is 300 kW at that instant. This occurrence of local peaks at low price time horizon is considered as the rebound effect. If all the utilities supply this local peak demand, the generating companies will run in loss. Further, the emissions increase due to turning on of inefficient generators. To overcome the occurrence of the rebound effect, here, the maximum allowable load shift by using DR programs should be 110% of base load power. Hence, for the load profile considered, the average load is 466.5 kW and the maximum load that can be allowed during the non-peak hour should be less than 515 kW in the beginning hours where electricity price is minimal. Hence, ISO is responsible for maintaining the load profile within the specified limits.

5.1. Influence of DR Strategy on Optimal Sizing of DGs

The peak load on the system occurs occasionally and the generation and load demand balance should be met. The sizing of DGs will be based on the peak load that has to be supplied by the grid at any instant. Moreover, there is no need for installing new sources for supplying the occasional load. Therefore, this section investigates the impact of DR strategy in deciding the optimal capacity of DGs. It has been said that the DR program will reduce the peak demand on the system which obviously reduces the capacity of the individual generators. The lower and upper limits on the decision variables are set as [0, 500] for all the generators considered. The inputs are initialized to the algorithm; it will yield the optimal sizing of each DG, capital cost, installation cost, and total cost of each DG for the proposed size. As seen from Figure 19 and from Table 9, if the penetration of non-critical loads or flexible loads increases, then the size and cost of deploying the DGs get reduced. This is due to the fact that DR makes the load profile near flat and the peak demand on the system gets reduced, which reduces the size of DGs. Therefore, the costs involved such as installation cost and capital cost get reduced. The difference in the total cost of installing DGs in case of 0% penetration of ILs and 5% penetration of ILs is 50,675.21 $/day and of 0% penetration of ILs and 10% penetration of ILs is 93,042.89 $/day. The reduction in installation cost is large in the case of 10% penetration but the chances of getting peaks during the non-peak hours are also higher. Therefore, to nullify the occurrence of rebound effect for the considered case study, it is suggested that 5% penetration of ILs is advisable compared to 10% penetration of ILs.

5.2. Effect of DR Strategy on Consumer Electricity Bill and on Load Factor

The demonstrated work relates to the optimization of various costs, explicitly capital cost [108], installation cost, operational cost, and consumer tariff. To maintain the reliability in a heavily routed line, the ISOs basically charge more compared to the other prices. Under this scheme, the customers will get incentives for shifting [109] their loads to non-peak hours or curtailing their loads. This program is event-based, its fundamental focus is to maintain reliability in the MG. Dynamic pricing techniques alone may not fetch the feasible results as proposed in [110].
Figure 20 depicts that while increasing the level of penetration of the customer electricity bill gets reduced and the load factor gets increased. The reduction in customer bill from 0% penetration of ILs to the 5% penetration of ILs is 3709.26 Rs/day and from 0% to 10%, the reduction is 6059.025 Rs/day. Table 10 represents the reduction of electricity price and improvement in load factor for the system considered. Further, it also depicts that the reduction in peak demand from 830.300 kW to 747.270 kW from 0% penetration to 10% penetration, where the load factor is increased from 0.561957 to 0.624397.
As the level of penetration increases, the load profile becomes flat and the electricity tariff gets reduced and is clearly depicted in Figure 18 at 00:00 to 08:00 a.m. However, there is a chance of the local peak occurring in case 3 where 10% penetration of flexible or non-critical loads allowed it to penetrate the MG system. As a greater number of customers participate in the DR program, the level of peak increases. Therefore, unjustified shifting of a portion of the load from global peak to the off-peak should be avoided to reduce the burden on the power systems. Hence, there should be an upper limit on the amount of load shift. ISO should focus not only on possible reduction of consumer tariff but also ensure to overcome the rebound effect.

6. Conclusions

A detailed literature survey on various effects of DR programs for EM in the MG was done. A test system with three scenarios considered, namely no penetration of ILs (i.e., 0% load shift), 5% penetration of ILs, and 10% penetration of ILs, showed total daily load demand of 11,198.2 kW and maximum peak on the system on an hourly basis is 830.3 kW. The capacity of DERs is a function of peak load occurring on the system and the system load factor is a function of uniformity of load curve. Therefore, with the reduction in peak demand on the system, the load curve gets more uniform which reduces the size of DERs and improves the load factor of the system which further reduces the customer tariff. The reduction in peak demand for the MG from 0% penetration to 5% penetration is 41.515 kW and from 0% penetration to 10% penetration is 83.03 kW and the reduction in the cost of installation of DGs is 50,675.21 $/day. A time of use pricing model is considered and the loads are clustered based on the prices at each interval. From the results, it is shown that the reduction in customer electricity tariff from 0% penetration to 5% penetration is 3709.26 Rs/day. The results show that, with the deployment of DR programs into the MG, there is a huge impact on the above-considered test systems.
The maximum load shift constraint is a function of shape of the load curve, therefore, for the addressed test case, the maximum shift in load is 110% of base load. This 110% is not fixed for other problems. In the future, an effective objective function in which the maximum constraint on amount of load shift can be modeled to avoid the rebound effect for any type of load curve considered. A new meta-heuristic algorithm can be developed for effective load clustering. Further, researchers can define a new set of rules for reducing the conflicts between the consumer and aggregator and between the aggregator and ISO such that there should be an imposition of penalty for violation of code of conduct. New wireless technologies can be proposed for reducing the time lapse between the IEDs and the smart meter or protection devices. One more future direction is impact of DR programs in optimal sizing of DGs by considering the uncetainty in RES. Finding the elasticity and cross elasticity matrix of load with respect to price changes can be performed.
Future researchers can further address the problems associated with load recovery, i.e., increase in production cost, increase in SMP, and increase in stress of already committed generators. In addition, there is a difference in gross load curtailed and the net load curtailed; this problem arises when the load curtailment of one customer overlaps with the load recovery period of another customer. The aggregator has to pay incentives for the gross load curtailed but the net load curtailed on the system is less. Therefore, a loss in monetary value arises. Reasearchers may develop an effective framework to avoid this situation.

Author Contributions

Conceptualization, K.M.R.P. and S.V.; methodology, S.R.S.; software, K.M.R.P.; validation, K.M.R.P., S.V. and S.R.S.; formal analysis, K.M.R.P.; investigation, S.V.; resources, S.R.S.; data curation, K.M.R.P.; writing—original draft preparation, K.M.R.P.; writing—review and editing, K.M.R.P., S.V. and S.R.S.; visualization, K.M.R.P.; supervision, S.V. and S.R.S.; project administration, K.M.R.P.; funding acquisition, S.V. and S.R.S. All authors have read and agreed to the published version of the manuscript.

Funding

This research was funded by the National Institute of Technology Andhra Pradesh (NIT-AP) and Woosong University’s Academic Research Funding—2021.

Institutional Review Board Statement

Not applicable.

Informed Consent Statement

Not applicable.

Data Availability Statement

Not applicable.

Acknowledgments

We acknowledge the National Institute of Technology Andhra Pradesh (NIT-AP), Tadepalligudem, Andhra Pradesh, India and Woosong University, Korea for their support in carrying out this research work.

Conflicts of Interest

The authors declare no conflict of interest.

Abbreviations

DR programDemand response programAMIAdvanced metering infrastructure
MGMicrogridDA schedulingDay-ahead scheduling
TOUTime of use pricingHA schedulingHour ahead scheduling
RTPReal-time pricingRT schedulingReal-time scheduling
CPPCritical peak pricingAIArtificial intelligence
DGDistributed generationSOCState of charge
BESSBattery energy storage systemDLCDirect load curtailment
HEMSHome energy management systemBEMSBuilding energy management system
RESRenewable energy systemDNO Distribution network operator
DRDemand responseISO Independent system operator
DERsDistributed energy resourcesICTInformation and communication technology
GGrid-connectedMAS Multi-agent system
IIsolatedEMSEnergy management strategies
EMEnergy management THDTotal harmonic distortion
ILsInterruptible loadsIEDsIntelligent electronic devices
HVACHeating, ventilating, and air conditioningRLReinforcement learning techniques
GAMSGeneral algebraic modeling systemPSOParticle swarm optimization
GWOGrey wolf optimizationGAGenetic algorithm
ACOAnt colony optimizationBCOBee colony optimization
MBCOModified bee colony optimizationDISCOMSDistribution companies
ANN Artificial neural networksLV-MG Low voltage microgrid
MILPMixed integer linear programmingCCHPCold climate heat pump
DSMSDemand side management systemCVARConditional value at risk
SCASine cosine algorithmNILsNon-interruptible loads
HANHome area networkMPPTMaximum power point tracking
PVPhotovoltaicWTWind turbine
MTMicro turbineFC Fuel cell
AC-MGAlternating current microgridDC-MGDirect current microgrid
SOCPSecond order cone programmingASFLAAdaptive shuffled frog leaping algorithm
AIArtificial intelligence DLCDirect load curtailment
SCADA DR-BOBDemand response blocks of buildings
KKTKarush Kuhn TuckerSCSuper capacitor
DR-TRLDemand response technology readiness levelMASMulti-agent system
NANNeighboring area networkFANField area network
Wi-FiWireless fidelitySMPSystem marginal price

References

  1. Li, K.; Thompson, S.; Peng, J. Modelling and prediction of NOx emission in a coal-fired power generation plant. Control Eng. Pract. 2004, 12, 707–723. [Google Scholar] [CrossRef]
  2. Ahi, P.; Searcy, C. Assessing sustainability in the supply chain: A triple bottom line approach. Appl. Math. Model. 2015, 39, 2882–2896. [Google Scholar] [CrossRef]
  3. Kim, C.-Y.; Kim, C.-R.; Kim, D.-K.; Cho, S.-H. Analysis of Challenges Due to Changes in Net Load Curve in South Korea by Integrating DERs. Electronics 2020, 9, 1310. [Google Scholar] [CrossRef]
  4. Mellouk, L.; Ghazi, M.; Aaroud, A.; Boulmalf, M.; Benhaddou, D.; Zine-Dine, K. Design and energy management optimization for hybrid renewable energy system- case study: Laayoune region. Renew. Energy 2019, 139, 621–634. [Google Scholar] [CrossRef]
  5. Reddy, P.K.M.; Prakash, M. Optimal Dispatch of Energy Resources in an Isolated Micro-Grid with Battery Energy Storage System. In Proceedings of the 2020 4th International Conference on Intelligent Computing and Control Systems (ICICCS), Madurai, India, 13–15 May 2020; pp. 730–735. [Google Scholar] [CrossRef]
  6. Aziz, A.; Tajuddin, M.; Adzman, M.; Ramli, M.; Mekhilef, S. Energy Management and Optimization of a PV/Diesel/Battery Hybrid Energy System Using a Combined Dispatch Strategy. Sustainability 2019, 11, 683. [Google Scholar] [CrossRef] [Green Version]
  7. Shoeb, A.; Shafiullah, G. Renewable Energy Integrated Islanded Microgrid for Sustainable Irrigation—A Bangladesh Perspective. Energies 2018, 11, 1283. [Google Scholar] [CrossRef] [Green Version]
  8. Siritoglou, P.; Oriti, G.; Van Bossuyt, D. Distributed Energy-Resource Design Method to Improve Energy Security in Critical Facilities. Energies 2021, 14, 2773. [Google Scholar] [CrossRef]
  9. Sanjeevikumar, P.; Sarojini, R.K.; Palanisamy, K.; Sanjeevikumar, P. Large Scale Renewable Energy Integration: Issues and Solutions. Energies 2019, 12, 1996. [Google Scholar] [CrossRef] [Green Version]
  10. Kumar, N.; Chopra, S.; Chand, A.; Elavarasan, R.; Shafiullah, G. Hybrid Renewable Energy Microgrid for a Residential Community: A Techno-Economic and Environmental Perspective in the Context of the SDG7. Sustainability 2020, 12, 3944. [Google Scholar] [CrossRef]
  11. Vera, Y.E.G.; Dufo-López, R.; Bernal-Agustín, J.L. Energy Management in Microgrids with Renewable Energy Sources: A Literature Review. Appl. Sci. 2019, 9, 3854. [Google Scholar] [CrossRef] [Green Version]
  12. Bai, Y.; Li, J.; He, H.; Dos Santos, R.C.; Yang, Q. Optimal Design of a Hybrid Energy Storage System in a Plug-In Hybrid Electric Vehicle for Battery Lifetime Improvement. IEEE Access 2020, 8, 142148–142158. [Google Scholar] [CrossRef]
  13. Zsiborács, H.; Baranyai, N.H.; Vincze, A.; Zentkó, L.; Birkner, Z.; Máté, K.; Pintér, G. Intermittent Renewable Energy Sources: The Role of Energy Storage in the European Power System of 2040. Electronics 2019, 8, 729. [Google Scholar] [CrossRef] [Green Version]
  14. Arteconi, A.; Polonara, F. Assessing the Demand Side Management Potential and the Energy Flexibility of Heat Pumps in Buildings. Energies 2018, 11, 1846. [Google Scholar] [CrossRef] [Green Version]
  15. Shang, Y. Resilient Multiscale Coordination Control against Adversarial Nodes. Energies 2018, 11, 1844. [Google Scholar] [CrossRef] [Green Version]
  16. Amer, A.; Shaban, K.; Gaouda, A.; Massoud, A. Home Energy Management System Embedded with a Multi-Objective Demand Response Optimization Model to Benefit Customers and Operators. Energies 2021, 14, 257. [Google Scholar] [CrossRef]
  17. Hu, J.; Yang, G.; Ziras, C.; Kok, K. Aggregator operation in the balancing market through network-constrained transactive energy. IEEE Trans. Power Syst. 2019, 34, 4071–4080. [Google Scholar] [CrossRef] [Green Version]
  18. Durvasulu, V.; Hansen, T.M. Benefits of a Demand Response Exchange Participating in Existing Bulk-Power Markets. Energies 2018, 11, 3361. [Google Scholar] [CrossRef] [Green Version]
  19. Fan, S.; Ai, Q.; Piao, L. Hierarchical Energy Management of Microgrids including Storage and Demand Response. Energies 2018, 11, 1111. [Google Scholar] [CrossRef] [Green Version]
  20. Arias, L.A.; Rivas, E.; Santamaria, F.; Hernandez, V. A Review and Analysis of Trends Related to Demand Response. Energies 2018, 11, 1617. [Google Scholar] [CrossRef] [Green Version]
  21. Khan, A.A.; Razzaq, S.; Khan, A.; Khursheed, F.; Owais. HEMSs and enabled demand response in electricity market: An overview. Renew. Sustain. Energy Rev. 2015, 42, 773–785. [Google Scholar] [CrossRef]
  22. Jang, D.; Eom, J.; Park, M.J.; Rho, J.J. Variability of electricity load patterns and its effect on demand response: A critical peak pricing experiment on Korean commercial and industrial customers. Energy Policy 2016, 88, 11–26. [Google Scholar] [CrossRef]
  23. Hajibandeh, N.; Ehsan, M.; Soleymani, S.; Shafie-khah, M.; Catalão, J.P.S. The Mutual Impact of Demand Response Programs and Renewable Energies: A Survey. Energies 2017, 10, 1353. [Google Scholar] [CrossRef] [Green Version]
  24. Silva, B.N.; Khan, M.; Han, K. Futuristic Sustainable Energy Management in Smart Environments: A Review of Peak Load Shaving and Demand Response Strategies, Challenges, and Opportunities. Sustainability 2020, 12, 5561. [Google Scholar] [CrossRef]
  25. Salinas, S.; Li, M.; Li, P. Multi-Objective Optimal Energy Consumption Scheduling in Smart Grids. IEEE Trans. Smart Grid 2013, 4, 341–348. [Google Scholar] [CrossRef]
  26. Adika, C.O.; Wang, L. Autonomous Appliance Scheduling for Household Energy Management. IEEE Trans. Smart Grid 2014, 5, 673–682. [Google Scholar] [CrossRef]
  27. Vázquez-Canteli, J.R.; Nagy, Z. Reinforcement learning for demand response: A review of algorithms and modeling techniques. Appl. Energy 2019, 235, 1072–1089. [Google Scholar] [CrossRef]
  28. Mandal, R.; Chatterjee, K. Frequency control and sensitivity analysis of an isolated microgrid incorporating fuel cell and diverse distributed energy sources. Int. J. Hydrog. Energy 2020, 45, 13009–13024. [Google Scholar] [CrossRef]
  29. Golpîra, H. Bulk power system frequency stability assessment in presence of microgrids. Electr. Power Syst. Res. 2019, 174, 105863. [Google Scholar] [CrossRef]
  30. Sanjeev, P.; Padhy, N.P.; Agarwal, P. Peak Energy Management Using Renewable Integrated DC Microgrid. IEEE Trans. Smart Grid 2017, 9, 4906–4917. [Google Scholar] [CrossRef]
  31. Ahmed, E.M.; Rathinam, R.; Dayalan, S.; Fernandez, G.S.; Ali, Z.M.; Aleem, S.H.E.A.; Omar, A.I. A Comprehensive Analysis of Demand Response Pricing Strategies in a Smart Grid Environment Using Particle Swarm Optimization and the Strawberry Optimization Algorithm. Mathematics 2021, 9, 2338. [Google Scholar] [CrossRef]
  32. Sundt, S.; Rehdanz, K.; Meyerhoff, J. Consumers’ Willingness to Accept Time-of-Use Tariffs for Shifting Electricity Demand. Energies 2020, 13, 1895. [Google Scholar] [CrossRef]
  33. Song, H.Y.; Lee, G.S.; Yoon, Y.T. Optimal Operation of Critical Peak Pricing for an Energy Retailer Considering Balancing Costs. Energies 2019, 12, 4658. [Google Scholar] [CrossRef] [Green Version]
  34. Ma, T.; Wu, J.; Hao, L.; Yan, H.; Li, D. A Real-Time Pricing Scheme for Energy Management in Integrated Energy Systems: A Stackelberg Game Approach. Energies 2018, 11, 2858. [Google Scholar] [CrossRef] [Green Version]
  35. Jadhav, A.M.; Patne, N.R.; Guerrero, J.M. A Novel Approach to Neighborhood Fair Energy Trading in a Distribution Network of Multiple Microgrid Clusters. IEEE Trans. Ind. Electron. 2019, 66, 1520–1531. [Google Scholar] [CrossRef] [Green Version]
  36. Gazafroudi, A.S.S.; Prieto, J.; Corchado, J.M. Virtual Organization Structure for Agent-Based Local Electricity Trading. Energies 2019, 12, 1521. [Google Scholar] [CrossRef] [Green Version]
  37. Sheikhahmadi, P.; Mafakheri, R.; Bahramara, S.; Damavandi, M.Y.; Catalão, J.P.S. Risk-Based Two-Stage Stochastic Optimization Problem of Micro-Grid Operation with Renewables and Incentive-Based Demand Response Programs. Energies 2018, 11, 610. [Google Scholar] [CrossRef] [Green Version]
  38. Grisales-Noreña, L.F.; Montoya, D.G.; Ramos-Paja, C.A. Optimal Sizing and Location of Distributed Generators Based on PBIL and PSO Techniques. Energies 2018, 11, 1018. [Google Scholar] [CrossRef] [Green Version]
  39. El-Salam, M.F.A.; Beshr, E.; Eteiba, M.B. A New Hybrid Technique for Minimizing Power Losses in a Distribution System by Optimal Sizing and Siting of Distributed Generators with Network Reconfiguration. Energies 2018, 11, 3351. [Google Scholar] [CrossRef] [Green Version]
  40. Zhu, W.; Guo, J.; Zhao, G.; Zeng, B. Optimal Sizing of an Island Hybrid Microgrid Based on Improved Multi-Objective Grey Wolf Optimizer. Processes 2020, 8, 1581. [Google Scholar] [CrossRef]
  41. Jalili, A.; Taheri, B. Optimal Sizing and Sitting of Distributed Generations in Power Distribution Networks Using Firefly Algorithm. Technol. Econ. Smart Grids Sustain. Energy 2020, 5, 1–14. [Google Scholar] [CrossRef] [Green Version]
  42. Montoya, O.D.; Molina-Cabrera, A.; Chamorro, H.R.; Alvarado-Barrios, L.; Rivas-Trujillo, E. A Hybrid Approach Based on SOCP and the Discrete Version of the SCA for Optimal Placement and Sizing DGs in AC Distribution Networks. Electronics 2020, 10, 26. [Google Scholar] [CrossRef]
  43. Karunarathne, E.; Pasupuleti, J.; Ekanayake, J.; Almeida, D. Optimal Placement and Sizing of DGs in Distribution Networks Using MLPSO Algorithm. Energies 2020, 13, 6185. [Google Scholar] [CrossRef]
  44. Madahi, S.K.; Sarić, A. Multi-Criteria Optimal Sizing and Allocation of Renewable and Non-Renewable Distributed Generation Resources at 63 kV/20 kV Substations. Energies 2020, 13, 5364. [Google Scholar] [CrossRef]
  45. Onlam, A.; Yodphet, D.; Chatthaworn, R.; Surawanitkun, C.; Siritaratiwat, A.; Khunkitti, P. Power Loss Minimization and Voltage Stability Improvement in Electrical Distribution System via Network Reconfiguration and Distributed Generation Placement Using Novel Adaptive Shuffled Frogs Leaping Algorithm. Energies 2019, 12, 553. [Google Scholar] [CrossRef] [Green Version]
  46. Yuan, R.; Li, T.; Deng, X.; Ye, J. Optimal Day-Ahead Scheduling of a Smart Distribution Grid Considering Reactive Power Capability of Distributed Generation. Energies 2016, 9, 311. [Google Scholar] [CrossRef] [Green Version]
  47. Galván, L.; Navarro, J.M.; Galván, E.; Carrasco, J.M.; Alcántara, A. Optimal Scheduling of Energy Storage Using a New Priority-Based Smart Grid Control Method. Energies 2019, 12, 579. [Google Scholar] [CrossRef] [Green Version]
  48. Li, J.; Tan, Z.; Ren, Z.; Yang, J.; Yu, X. A Two-Stage Optimal Scheduling Model of Microgrid Based on Chance-Constrained Programming in Spot Markets. Processes 2020, 8, 107. [Google Scholar] [CrossRef] [Green Version]
  49. Wang, J.; Li, K.-J.; Javid, Z.; Sun, Y. Distributed Optimal Coordinated Operation for Distribution System with the Integration of Residential Microgrids. Appl. Sci. 2019, 9, 2136. [Google Scholar] [CrossRef] [Green Version]
  50. Lu, C.; Xu, H.; Pan, X.; Song, J. Optimal Sizing and Control of Battery Energy Storage System for Peak Load Shaving. Energies 2014, 7, 8396–8410. [Google Scholar] [CrossRef] [Green Version]
  51. Zhou, N.; Liu, N.; Zhang, J.; Lei, J. Multi-Objective Optimal Sizing for Battery Storage of PV-Based Microgrid with Demand Response. Energies 2016, 9, 591. [Google Scholar] [CrossRef]
  52. Carpinelli, G.; Di Fazio, A.R.; Khormali, S.; Mottola, F. Optimal Sizing of Battery Storage Systems for Industrial Applications when Uncertainties Exist. Energies 2014, 7, 130–149. [Google Scholar] [CrossRef]
  53. HassanzadehFard, H.; Jalilian, A. Optimal sizing and location of renewable energy based DG units in distribution systems considering load growth. Int. J. Electr. Power Energy Syst. 2018, 101, 356–370. [Google Scholar] [CrossRef]
  54. Sharma, S.; Bhattacharjee, S.; Bhattacharya, A. Operation cost minimization of a micro-grid using quasi-oppositional swine influenza model-based optimization with quarantine. Ain Shams Eng. J. 2018, 9, 45–63. [Google Scholar] [CrossRef] [Green Version]
  55. Moghaddam, A.A.; Seifi, A.; Niknam, T.; Pahlavani, M.R.A. Multi-objective operation management of a renewable MG (micro-grid) with back-up micro-turbine/fuel cell/battery hybrid power source. Energy 2011, 36, 6490–6507. [Google Scholar] [CrossRef]
  56. Ghaffarzadeh, N.; Zolfaghari, M.; Ardakani, F.J.; Jahanbani, A. Optimal sizing of Energy Storage System in a MG using the Mixed Integer Linear programming. Int. J. Renew. Energy Res. 2017, 7, 2004–2016. [Google Scholar]
  57. Sharma, S.; Bhattacharjee, S.; Bhattacharya, A. Grey wolf optimisation for optimal sizing of battery energy storage device to minimise operation cost of MG. IET Gener. Transm. Distrib. 2016, 10, 625–637. [Google Scholar] [CrossRef]
  58. Qiu, J.; Meng, K.; Zheng, Y.; Dong, Z.Y. Optimal scheduling of distributed energy resources as a virtual power plant in a transactive energy framework. IET Gener. Transm. Distrib. 2017, 12, 17–27. [Google Scholar] [CrossRef]
  59. Silva, C.; Faria, P.; Vale, Z. Rating the Participation in Demand Response Programs for a More Accurate Aggregated Schedule of Consumers after Enrolment Period. Electronics 2020, 9, 349. [Google Scholar] [CrossRef] [Green Version]
  60. Wang, N.; Xu, W.; Xu, Z.; Shao, W. Peer-to-Peer Energy Trading among Microgrids with Multidimensional Willingness. Energies 2018, 11, 3312. [Google Scholar] [CrossRef] [Green Version]
  61. Carpinelli, G.; Caramia, P.; Mottola, F.; Proto, D. Exponential weighted method and a compromise programming method for multi-objective operation of plug-in vehicle aggregators in microgrids. Int. J. Electr. Power Energy Syst. 2014, 56, 374–384. [Google Scholar] [CrossRef]
  62. Gu, W.; Lu, S.; Wu, Z.; Zhang, X.; Zhou, J.; Zhao, B.; Wang, J. Residential CCHP microgrid with load aggregator: Operation mode, pricing strategy, and optimal dispatch. Appl. Energy 2017, 205, 173–186. [Google Scholar] [CrossRef]
  63. Aluisio, B.; Conserva, A.; Dicorato, M.; Forte, G.; Trovato, M. Optimal operation planning of V2G-equipped Microgrid in the presence of EV aggregator. Electr. Power Syst. Res. 2017, 152, 295–305. [Google Scholar] [CrossRef]
  64. Nguyen, D.T.; Le, L.B. Risk-Constrained Profit Maximization for Microgrid Aggregators with Demand Response. IEEE Trans. Smart Grid 2015, 6, 135–146. [Google Scholar] [CrossRef]
  65. Goroohi, I.; Sardou; Khodayar, M.E.; Ameli, M.T. Coordinated Operation of Natural Gas and Electricity Networks with Microgrid Aggregators. IEEE Trans. Smart Grid 2018, 9, 199–210. [Google Scholar] [CrossRef]
  66. Pei, W.; Du, Y.; Deng, W.; Sheng, K.; Xiao, H.; Qu, H. Optimal Bidding Strategy and Intramarket Mechanism of Microgrid Aggregator in Real-Time Balancing Market. IEEE Trans. Ind. Inform. 2016, 12, 587–596. [Google Scholar] [CrossRef]
  67. Essiet, I.O.; Sun, Y. Maximizing Demand Response Aggregator Compensation through Optimal RES Utilization: Aggregation in Johannesburg, South Africa. Appl. Sci. 2020, 10, 594. [Google Scholar] [CrossRef] [Green Version]
  68. Gazijahani, F.S.; Salehi, J. Game Theory Based Profit Maximization Model for Microgrid Aggregators with Presence of EDRP Using Information Gap Decision Theory. IEEE Syst. J. 2019, 13, 1767–1775. [Google Scholar] [CrossRef]
  69. Zhu, X.; Xia, M.; Chiang, H. Coordinated sectional droop charging control for EV aggregator enhancing frequency stability of microgrid with high penetration of renewable energy sources. Appl. Energy 2018, 210, 936–943. [Google Scholar] [CrossRef]
  70. Olivella-Rosell, P.; Lloret-Gallego, P.; Munné-Collado, Í.; Villafafila-Robles, R.; Sumper, A.; Ottessen, S.Ø.; Rajasekharan, J.; Bremdal, B.A. Local Flexibility Market Design for Aggregators Providing Multiple Flexibility Services at Distribution Network Level. Energies 2018, 11, 822. [Google Scholar] [CrossRef] [Green Version]
  71. Song, Z.; Shi, J.; Li, S.; Chen, Z.; Yang, W.; Zhang, Z. Day Ahead Bidding of a Load Aggregator Considering Residential Consumers Demand Response Uncertainty Modeling. Appl. Sci. 2020, 10, 7310. [Google Scholar] [CrossRef]
  72. Chen, S.; Chen, Q.; Xu, Y. Strategic Bidding and Compensation Mechanism for a Load Aggregator with Direct Thermostat Control Capabilities. IEEE Trans. Smart Grid 2018, 9, 2327–2336. [Google Scholar] [CrossRef]
  73. Sisinni, M.; Noris, F.; Smit, S.; Messervey, T.B.; Crosbie, T.; Breukers, S.; Van Summeren, L. Identification of Value Proposition and Development of Innovative Business Models for Demand Response Products and Services Enabled by the DR-BOB Solution. Buildings 2017, 7, 93. [Google Scholar] [CrossRef] [Green Version]
  74. Karfopoulos, E.; Tena, L.; Torres, A.; Salas, P.; Jorda, J.G.; Dimeas, A.; Hatziargyriou, N. A multi-agent system providing demand response services from residential consumers. Electr. Power Syst. Res. 2015, 120, 163–176. [Google Scholar] [CrossRef]
  75. UNEP. Buildings and Climate Change, Summary for Decision-Makers. 2009. Available online: https://www.uncclearn.org/wp-content/uploads/library/unep207.pdf (accessed on 17 December 2021).
  76. Liu, Y.; Yang, X.; Wen, W.; Xia, M. Smarter Grid in the 5G Era: A Framework Integrating Power Internet of Things with a Cyber Physical System. Front. Commun. Netw. 2021, 2, 9590. [Google Scholar] [CrossRef]
  77. Jour, D.; Zhang, Y.; Qitong, Z.W. Application Status and Prospects of 5G Technology in Distribution Automation Systems. Wirel. Commun. Mob. Comput. 2021, 2021, 5553159. [Google Scholar] [CrossRef]
  78. Kampelis, N.; Tsekeri, E.; Kolokotsa, D.; Kalaitzakis, K.; Isidori, D.; Cristalli, C. Development of Demand Response Energy Management Optimization at Building and District Levels Using Genetic Algorithm and Artificial Neural Network Modelling Power Predictions. Energies 2018, 11, 3012. [Google Scholar] [CrossRef] [Green Version]
  79. Crosbie, T.; Broderick, J.; Short, M.; Charlesworth, R.; Dawood, M. Demand Response Technology Readiness Levels for Energy Management in Blocks of Buildings. Buildings 2018, 8, 13. [Google Scholar] [CrossRef] [Green Version]
  80. Hui, H.; Ding, Y.; Shi, Q.; Li, F.; Song, Y.; Yan, J. 5G network-based Internet of Things for demand response in smart grid: A survey on application potential. Appl. Energy 2020, 257, 113972. [Google Scholar] [CrossRef]
  81. Cruz, C.; Palomar, E.; Bravo, I.; Gardel, A. Cooperative Demand Response Framework for a Smart Community Targeting Renewables: Testbed Implementation and Performance Evaluation. Energies 2020, 13, 2910. [Google Scholar] [CrossRef]
  82. Shakeri, M.; Pasupuleti, J.; Amin, N.; Rokonuzzaman; Low, F.W.; Yaw, C.T.; Asim, N.; Samsudin, N.A.; Tiong, S.K.; Hen, C.K.; et al. An Overview of the Building Energy Management System Considering the Demand Response Programs, Smart Strategies and Smart Grid. Energies 2020, 13, 3299. [Google Scholar] [CrossRef]
  83. Basu, K.; Hawarah, L.; Arghira, N.; Joumaa, H.; Ploix, S. A prediction system for home appliance usage. Energy Build. 2013, 67, 668–679. [Google Scholar] [CrossRef]
  84. Bera, S.; Gupta, P.; Misra, S. D2S: Dynamic Demand Scheduling in Smart Grid Using Optimal Portfolio Selection Strategy. IEEE Trans. Smart Grid 2015, 6, 1434–1442. [Google Scholar] [CrossRef]
  85. Ko, H.; Praca, I. Design of a Secure Energy Trading Model Based on a Blockchain. Sustainability 2021, 13, 1634. [Google Scholar] [CrossRef]
  86. Mohammad, N.; Mishra, Y. The Role of Demand Response Aggregators and the Effect of GenCos Strategic Bidding on the Flexibility of Demand. Energies 2018, 11, 3296. [Google Scholar] [CrossRef] [Green Version]
  87. Yoo, Y.-S.; Jeon, S.H.; Newaz, S.H.S.; Lee, I.-W.; Choi, J.K. Energy Trading among Power Grid and Renewable Energy Sources: A Dynamic Pricing and Demand Scheme for Profit Maximization. Sensors 2021, 21, 5819. [Google Scholar] [CrossRef]
  88. Ko, W.; Vettikalladi, H.; Song, S.-H.; Choi, H.-J. Implementation of a Demand-Side Management Solution for South Korea’s Demand Response Program. Appl. Sci. 2020, 10, 1751. [Google Scholar] [CrossRef] [Green Version]
  89. Wang, B.; Liu, X.; Zhu, F.; Hu, X.; Ji, W.; Yang, S.; Wang, K.; Feng, S. Unit Commitment Model Considering Flexible Scheduling of Demand Response for High Wind Integration. Energies 2015, 8, 13688–13709. [Google Scholar] [CrossRef] [Green Version]
  90. Chae, J.; Joo, S.-K. Demand Response Resource Allocation Method Using Mean-Variance Portfolio Theory for Load Aggregators in the Korean Demand Response Market. Energies 2017, 10, 879. [Google Scholar] [CrossRef]
  91. Faria, P.; Spínola, J.; Vale, Z. Distributed Energy Resources Scheduling and Aggregation in the Context of Demand Response Programs. Energies 2018, 11, 1987. [Google Scholar] [CrossRef] [Green Version]
  92. Faria, P.; Spínola, J.; Vale, Z. Reschedule of Distributed Energy Resources by an Aggregator for Market Participation. Energies 2018, 11, 713. [Google Scholar] [CrossRef] [Green Version]
  93. Faria, P.; Vale, Z. A Demand Response Approach to Scheduling Constrained Load Shifting. Energies 2019, 12, 1752. [Google Scholar] [CrossRef] [Green Version]
  94. Haghifam, S.; Dadashi, M.; Zare, K.; Seyedi, H. Optimal operation of smart distribution networks in the presence of demand response aggregators and microgrid owners: A multi follower Bi-Level approach. Sustain. Cities Soc. 2020, 55, 102033. [Google Scholar] [CrossRef]
  95. Huq, M.Z.; Islam, S. Home Area Network technology assessment for demand response in smart grid environment. In Proceedings of the 2010 20th Australasian Universities Power Engineering Conference, Christchurch, New Zealand, 5–6 December 2010; pp. 1–6. [Google Scholar]
  96. Samadi, P.; Mohsenian-Rad, H.; Wong, V.W.S.; Schober, R. Tackling the Load Uncertainty Challenges for Energy Consumption Scheduling in Smart Grid. IEEE Trans. Smart Grid 2013, 4, 1007–1016. [Google Scholar] [CrossRef] [Green Version]
  97. Liu, X.; Gao, B.; Li, Y. Bayesian Game-Theoretic Bidding Optimization for Aggregators Considering the Breach of Demand Response Resource. Appl. Sci. 2019, 9, 576. [Google Scholar] [CrossRef] [Green Version]
  98. Posma, J.; Lampropoulos, I.; Schram, W.; Van Sark, W. Provision of Ancillary Services from an Aggregated Portfolio of Residential Heat Pumps on the Dutch Frequency Containment Reserve Market. Appl. Sci. 2019, 9, 590. [Google Scholar] [CrossRef] [Green Version]
  99. Ponds, K.T.; Arefi, A.; Sayigh, A.; Ledwich, G. Aggregator of Demand Response for Renewable Integration and Customer Engagement: Strengths, Weaknesses, Opportunities, and Threats. Energies 2018, 11, 2391. [Google Scholar] [CrossRef] [Green Version]
  100. Shang, Y. A combinatorial necessary and sufficient condition for cluster consensus. Neurocomputing 2016, 216, 611–616. [Google Scholar] [CrossRef]
  101. Alvarez, M.A.Z.; Agbossou, K.; Cardenas, A.; Kelouwani, S.; Boulon, L. Demand Response Strategy Applied to Residential Electric Water Heaters Using Dynamic Programming and K-Means Clustering. IEEE Trans. Sustain. Energy 2019, 11, 524–533. [Google Scholar] [CrossRef]
  102. Mancini, F.; Romano, S.; Lo Basso, G.; Cimaglia, J.; de Santoli, L. How the Italian Residential Sector Could Contribute to Load Flexibility in Demand Response Activities: A Methodology for Residential Clustering and Developing a Flexibility Strategy. Energies 2020, 13, 3359. [Google Scholar] [CrossRef]
  103. Chicco, G.; Ionel, O.; Porumb, R. Electrical Load Pattern Grouping Based on Centroid Model with Ant Colony Clustering. IEEE Trans. Power Syst. 2013, 28, 1706–1715. [Google Scholar] [CrossRef]
  104. Fu-Lin, M.; Hong-yang, L. Power load classification based on spectral clustering of dual-scale. In Proceedings of the 2014 IEEE International Conference on Control Science and Systems Engineering, Yantai, China, 29–30 December 2014; pp. 162–166. [Google Scholar] [CrossRef]
  105. Alonso, A.M.; Nogales, F.J.; Ruiz, C. Hierarchical Clustering for Smart Meter Electricity Loads Based on Quantile Autocovariances. IEEE Trans. Smart Grid 2020, 11, 4522–4530. [Google Scholar] [CrossRef]
  106. Binh, P.T.T.; Ha, N.H.; Tuan, T.C.; Khoa, L.D. Determination of representative load curve based on Fuzzy K-Means. In Proceedings of the 2010 4th International Power Engineering and Optimization Conference (PEOCO), Shah Alam, Malaysia, 23–24 June 2010; pp. 281–286. [Google Scholar] [CrossRef]
  107. Pereira, R.; Fagundes, A.; Melício, R.; Mendes, V.M.F.; Figueiredo, J.; Martins, J.; Quadrado, J.C. A fuzzy clustering approach to a demand response model. Int. J. Electr. Power Energy Syst. 2016, 81, 184–192. [Google Scholar] [CrossRef]
  108. Schwarz, P.; Mohajeryami, S.; Cecchi, V. Building a Better Baseline for Residential Demand Response Programs: Mitigating the Effects of Customer Heterogeneity and Random Variations. Electronics 2020, 9, 570. [Google Scholar] [CrossRef] [Green Version]
  109. Agnetis, A.; de Pascale, G.; Detti, P.; Vicino, A. Load Scheduling for Household Energy Consumption Optimization. IEEE Trans. Smart Grid 2013, 4, 2364–2373. [Google Scholar] [CrossRef]
  110. Siano, P. Demand response and smart grids—A survey. Renew. Sustain. Energy Rev. 2014, 30, 461–478. [Google Scholar] [CrossRef]
Figure 1. The evolution of power systems before DR implementation.
Energies 15 00190 g001
Figure 2. A general layout of hybrid MG.
Energies 15 00190 g002
Figure 3. (a) Power dispatch mode in connected grid, (b) Un-dispatched power mode in isolated modes.
Energies 15 00190 g003
Figure 4. Stochasticity in MG.
Energies 15 00190 g004
Figure 5. Functions of DSM in MG.
Energies 15 00190 g005
Figure 6. Long-term methods to perform EM in the MG system from source end.
Energies 15 00190 g006
Figure 7. Methods to perform EM in the MG system from the load end.
Energies 15 00190 g007
Figure 8. DR strategies.
Energies 15 00190 g008
Figure 9. Merits of DR strategies.
Energies 15 00190 g009
Figure 10. Trade-off points in sizing of BESS.
Energies 15 00190 g010
Figure 11. Function of DR aggregator.
Energies 15 00190 g011
Figure 12. ISO function in load data collection, processing, and scheduling.
Energies 15 00190 g012
Figure 13. A detailed communication framework for effective monitoring.
Energies 15 00190 g013
Figure 14. Impact of DR on rebound effect.
Energies 15 00190 g014
Figure 15. Home energy management system (HEMS) in a home.
Energies 15 00190 g015
Figure 16. Methodology for analyzing the impact of load clustering on DGs sizing and tariff.
Energies 15 00190 g016
Figure 17. Time of use pricing.
Energies 15 00190 g017
Figure 18. Load demand for three cases considered.
Energies 15 00190 g018
Figure 19. Sizing of sources without considering the uncertainty in RESs.
Energies 15 00190 g019
Figure 20. Electricity price of consumers for three cases considered.
Energies 15 00190 g020
Table 1. Differences between various price-based tariffs [31].
S.No.ParameterTime of Use (TOU) Tariff [32]Critical Peak Pricing (CPP) Tariff [33]Real Time Pricing (RTP) [34]
1Volatility in pricesFixed prices during the same season.High price during the event.Dynamic prices.
2ComplexityEasy to use.Moderate and event-driven to ensure reliability. Imposed by the utility.Complex and it needs a robust hardware setup.
3OperationThere is no curtailment of load demand. Only shifting in time horizon takes place.Either curtailment or shifting of load takes place.Shifting of loads is difficult since consumers may not be able to see their incentives.
4Frequency of impositionImposed on daily basis.Not imposed on daily basis.Imposed on hourly or minutes or seconds basis.
5EfficiencyHighly efficient in reducing the energy cost and carbon emissions.Less efficient in reducing the energy cost and carbon emissions.Moderate efficient in reducing the energy cost.
Table 2. Optimal scheduling of DERs in a MG.
Ref No.Size of Distribution NetworkIsolated (I) or Grid Connected (G)Approach Objective FunctionRemarks
[35]33 bus and 69 bus radial networks*Population-based incremental learning method To minimize the power losses, improve voltage profileOptimal power flow analysis has been done for yielding power losses and voltage profiles.
[36]33-bus, 69-bus, and 78-bus radial networks*Hybridized meta-heuristic methodTo optimize the active and reactive power lossesHybridized gray wolf optimization (GWO) and particle swarm optimization (PSO) algorithms. The load power is considered as 3.715 MW and reactive power as 2.3 MVAR.
[37]*IImproved multi-objective grey wolf optimization (IGWO)To optimize the annualized cost of the system and deficiency of power supply probabilityEM system is used to achieve the requirement.
[38]IEEE 33 and 69 busGFirefly algorithmTo minimize the power lossesApplied firefly algorithm for optimal sizing and siting the DGs in a radial network.
[39]IEEE 33 and 69 busGSine cosine algorithm (SCA) + second-order cone programming (SOCP)To minimize the real power lossesEffective placement and sizing of DGs.
Placement by using sine cosine algorithm and sizing by using the second-order cone programming.
[40]IEEE 33 busGMulti-leader PSOActive power loss reductionTo optimally site and size DGs.
[41]IEEE 115 busGGenetic algorithm (GA) has been usedPower loss reduction, improved voltage level, and short circuit levelProper selection and placement of DGs certainly improve the EM system.
[42]IEEE 33 and 69 bus*Adaptive shuffled frog leaping algorithm (ASFLA)Power loss minimization and voltage stability index improvementNovel adaptive technique is used for solving the problem. The performance of the algorithm is compared with the firefly, cuckoo search, and shuffled frog leaping algorithm. Results suggest that ASFLA outperforms other algorithms.
[43]33-bus radial distribution network*Modified differential evolution algorithmTo minimize DA composite economic cost, i.e., operation, economic, and transmission loss costThe problem is modeled as a non-linear problem and scheduling has been done to optimize the fuel cost.
[44]Loads, PV, and BESS*Time decision algorithmTo optimize the peak power costThe model yields the per day load and generation capabilities further, a decision is made for BESS dispatch.
[45]*GImproved particle swarm optimization (IPSO)To achieve economic schedulingUncertainty in wind and solar generation and electricity prices has been considered and a two-stage stochastic model is solved to optimize the operating cost of the MG.
[46]IEEE 33-bus systemGOptimal power flow calculation is carried out and hierarchical distribution network integration methodTo achieve optimal consumption of energy by effective economic schedulingEffective coordination between prosumer and grid is required for the well operation of the power system. An increase in residential loads will make the power flow calculations complex. To overcome the above concern residential customers are clustered into a single residential MG.
* Not specified.
Table 3. BESS sizing for achieving EM in a MG.
Ref No.Isolated (I) or Grid Connected (G)Sources ConsideredObjective FunctionApproachProblem Modelled asRemarks
[47]GBESS aloneTo improve the load factor by decreasing the peak value to valley point differenceThe net energy in the BESS is considered as the initial value of the day Mixed-integer programmingDR strategies improve the load profile which certainly improves the load factor.
[48]GPV and BESSTo increase the annual net profits, PV consumptive rateNon-dominated sorting genetic algorithm 2Multi-objective problemFor optimal sizing of BESS, the constraints considered are reliability constraints, BESS performance constraints, and user purchasing electricity cost.
[49]GSolar, WT, and fuel cell (FC)To reduce electricity costs. In this study, uncertainty in the cost of electricity and load uncertainty is considered for robust sizingDecision theory approach is appliedBESS is considered as a cluster of loads. In this study, decision-making is based on three issues, namely, minimization of expected cost, min-max regret, and stability.
[50]GSolar, WT, and FCTo reduce the total harmonic distortion (THD), active power losses, and to reduce the overall cost of DERsSize is a function of the amount of operational cost decrementBESS supplies the deficit power and maintains the balanceSizing of DERs in an IEEE 31 bus distribution network was performed to reduce the total cost for installing DERs.
[51]GPV, grid, BESS, and WT The aim is to optimize the overall operational cost of the MGA quasi oppositional swine influenza model is appliedThe load difference is supplied by the gridSizing of both rooftop PV and BESS has been done
[52]GPV, WT, grid, BESSThe objective is to minimize the net operational cost and installation of BESSGWO algorithm is usedThe load difference is supplied by the gridThe fuel cost is reduced so that the size of the BESS is reduced.
[53]IPV, WT, BESS, FC, and micro turbine (MT) are consideredThe objective is to reduce the size of BESSThe problem is formulated as a mixed integer linear programming (MILP)Grid is not present so BESS is essentialSizing of BESS varies when the uncertainty of DERs is considered. Three cases have been considered: no BESS, BESS with no initial charge, and BESS with an initial stored charge equal to the total capacity of BESS.
Table 4. Need for aggregator operations.
Ref No.Islanded (I)
(or) Grid Connected Mode (G)
Loads Are Aggregated (A) (or) No Aggregation (N)UsersObjectivesOutcome
[58]GAggregated plug-in-electric vehicle (PEV) fleetLow volatage MG (LV-MG) Three objective functions have been considered: Reduction of power loss, reduction of voltage deviated. and current through the lines should be optimized The problem is modeled as a multi-objective problem in which the results are not a single value but of sequence which is called Pareto solutions therefore, it is necessary to take trade-off points which are called as Pareto optimum.
[59]GClustered loads aggregatedResidential cold climate heat pump (CCHP) MGTo optimize the operating cost of the MGA two-stage optimal dispatch problem was proposed for obtaining low operating costs.
[60]GEVsResidential and commercialAims to reduce the running cost of the MGA non-linear optimization problem was solved by day-ahead scheduling.
[61]GResidential loads within the MG were aggregatedResidential loadsTo maximize the aggregator’s profitDay-ahead scheduling of DERs was considered and to mitigate the sporadic behavior a risk-constrained stochastic model was framed.
[62]GNIEEE 24 busTo achieve the economic profit, security, and stability of the MGA multi-objective problem was solved to assess the dynamic stability.
[63]*A*To maximize the aggregator’s profit by balancing the real-time deficit of powerOptimal bidding strategy of aggregator and real-time balancing at the local level.
[64]*A*Profit maximization of all the market players within the power systemBender’s decomposition is applied.
[65]*ASmart distribution systemTo maximize the operating cost of the agents (aggregators and prosumers) by optimally scheduling the resources and maximizing the profit of energy suppliersMulti-follower bi-level programming is applied. The objective function is linearized and KKT is applied.
[66]IEVs aggregatedMGTo improve the frequency stability of the MGIn autonomous mode of operation of the MG, there is a need for the deployment of storage devices to support the frequency regulation. EVs are the active resources similar to BESS and they enhance the frequency regulation.
* Not specified.
Table 5. Energy trading models.
Ref No.Size of Distribution NetworkEnergy Trading ModelImpact of Aggregator Remarks
[84]33-bus radial networkBottom-up approachNo An iterative algorithm was proposed for energy trade.
[85]*Block-chain modelYesThe objective is to improve the reliability and user security in trading a blockchain approach.
[86]*Block-chain modelYesDeveloping multi-directional trading is of significance. In this paper, the authors proposed a parallel trading model.
[87]*Energy broker modelYesThis method is for maximizing the energy trading between the grid and the consumer. The energy broker decides the demand and the price of electricity by using dual optimization. The problem is modeled as a convex optimization problem.
* Not specified.
Table 6. A literature survey on various EMS.
Ref No.Size of Distribution NetworkApproach Objective FunctionRemarks
[88]118-bus radial networkUnit commitment methodTo minimize the total expected cost A two-stage stochastic model for achieving effective wind power integration.
[89]Korean electricity marketMean-variance portfolio methodTo increase expected return and
to increase the profitability of the aggregator
A mean-variance portfolio method is used to avoid the risk of the DRR portfolio.
[90]20,310 customers,
548 DGs
Resource scheduling, aggregationTo minimize the operating costK-means algorithm for clustering loads.
[91]180-busEconomic dispatch problem is taken into accountTo minimize the running costA two-stage scheduling problem is solved to optimize the fuel cost of the test system.
[92]218 consumers and load profile analyzed at 96-time slots.Economic dispatch of DER To minimize the operating cost The allowable maximum load shift by using the DR program is less than or equal to the base load on the system. Optimization problem modeled as a linear problem. Figure 14 shows the problem associated with unjustified shifting of flexible loads.
[93]DISCOMsOptimal scheduling is doneTo minimize the Expected cost of MGConditional value at risk (CVAR) index is used to analyze the uncertainty of WT. Objective function modeled as MILP. General algebraic modeling system (GAMS) and IBM ILOG CPLEX optimization studio named simply as CPLEX are used.
[94]*A Bayesian game model is proposedTo optimize the bidding strategyTo compensate for the power deficit/excess due to customer breach by placing auxiliary services like BESS.
[95]20,000 heat pumps with a capacity of 1 MW.*Techno-economic feasibility studyTwo scenarios are considered always available and always reliable.
[96]South Korea
Capacity 10 MW
Demand-side management system (DSMS)To minimize the electricity price, energy conservationA strategy of DSMS is proposed for calculating the customer baseline load.
[97]*Improved elephant herd optimizationTo optimize the fuel cost of operationA multi-objective problem has been formulated. Three cases were considered, namely scheduling to reduce operational cost, scheduling to reduce operational cost and variance, and the impact of penetrating EVs on operational cost.
* Not specified.
Table 7. A survey on various clustering methods.
Ref. No.Test System ConsideredClustering MethodRemarks
[99]Residential electric water heatersK-means clustering method is used for clustering the loads. To find the number of clusters, required Silhouette method is applied.The goal is to reduce the impact on the availability of hot water when a DR strategy is applied. The success rate of such clustering methods is more dependent on the accuracy in load forecast.
[100]751 residential customersDwelling’s clusteringBased on the spot market price the decision-making algorithm shifts the load demand.
[101]Non-residential customersAnt colony clusteringThe original electrical pattern is applied to the optimization algorithm named the ant colony clustering algorithm.
[102]*The spectral clustering method is applied.By using the Euclidean function and load curve, the method performs a similarity check on all the load profiles considered. This algorithm is robust to data size.
[103]Real-world smart meter dataHierarchical clusteringPerforms dissimilarity check.
[104]*Fuzzy K-means clusteringThe global criterion method and Bellman–Zadeh’s maximization principle are used.
[105]Domestic customers Fuzzy subtractive clustering is applied.With the proposed method of load shedding and valley, the filling can be accomplished.
* Not specified.
Table 8. Various costs and lifetime of sources involved in installing the MG.
Source TypeCapital Cost ($/kW)Fixed Maintenance Cost ($/kW)Life (Years)
WT10001520
PV130030.33020
DG8000.01215
MT8502.00015
Table 9. Capital cost involved in various sources for the percentage of ILs penetration.
Percentage of ILs PenetrationCapital Cost of PV $/DayCapital Cost of WT $/DayCapital Cost of DG $/DayTotal Cost of MG $/Day
0%279,374.621216,914.635325,225.678821,514.900
5%221,426.776243,299.560306,113.391770,839.700
10%196,888.840248,550.155283,033.045728,472.000
Table 10. Comparison of peak demands, electricity price, and load factor with penetration of ILs.
S.No.Penetration of ILs in %Peak Value of Load, kWElectricity Price, Rs/DayLoad Factor
10%830.300131,952.70.561957
25%788.785128,243.50.591540
310%747.270125,893.70.624397
Publisher’s Note: MDPI stays neutral with regard to jurisdictional claims in published maps and institutional affiliations.

