
Quality Improvement and Cost Evaluation of Pellet Fuel Produced from Pruned Fruit Tree Branches

Abstract
:
1. Introduction
2. Materials and Methods
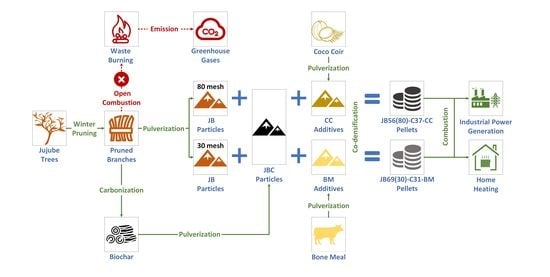
2.1. Raw Materials
2.2. Pre-Treatment of Raw Materials
2.3. Optimization of Pellet Formulation
2.3.1. Densification Process
2.3.2. Experimental Design
2.4. Characterization
3. Results and Discussion
3.1. Analysis of Raw Materials
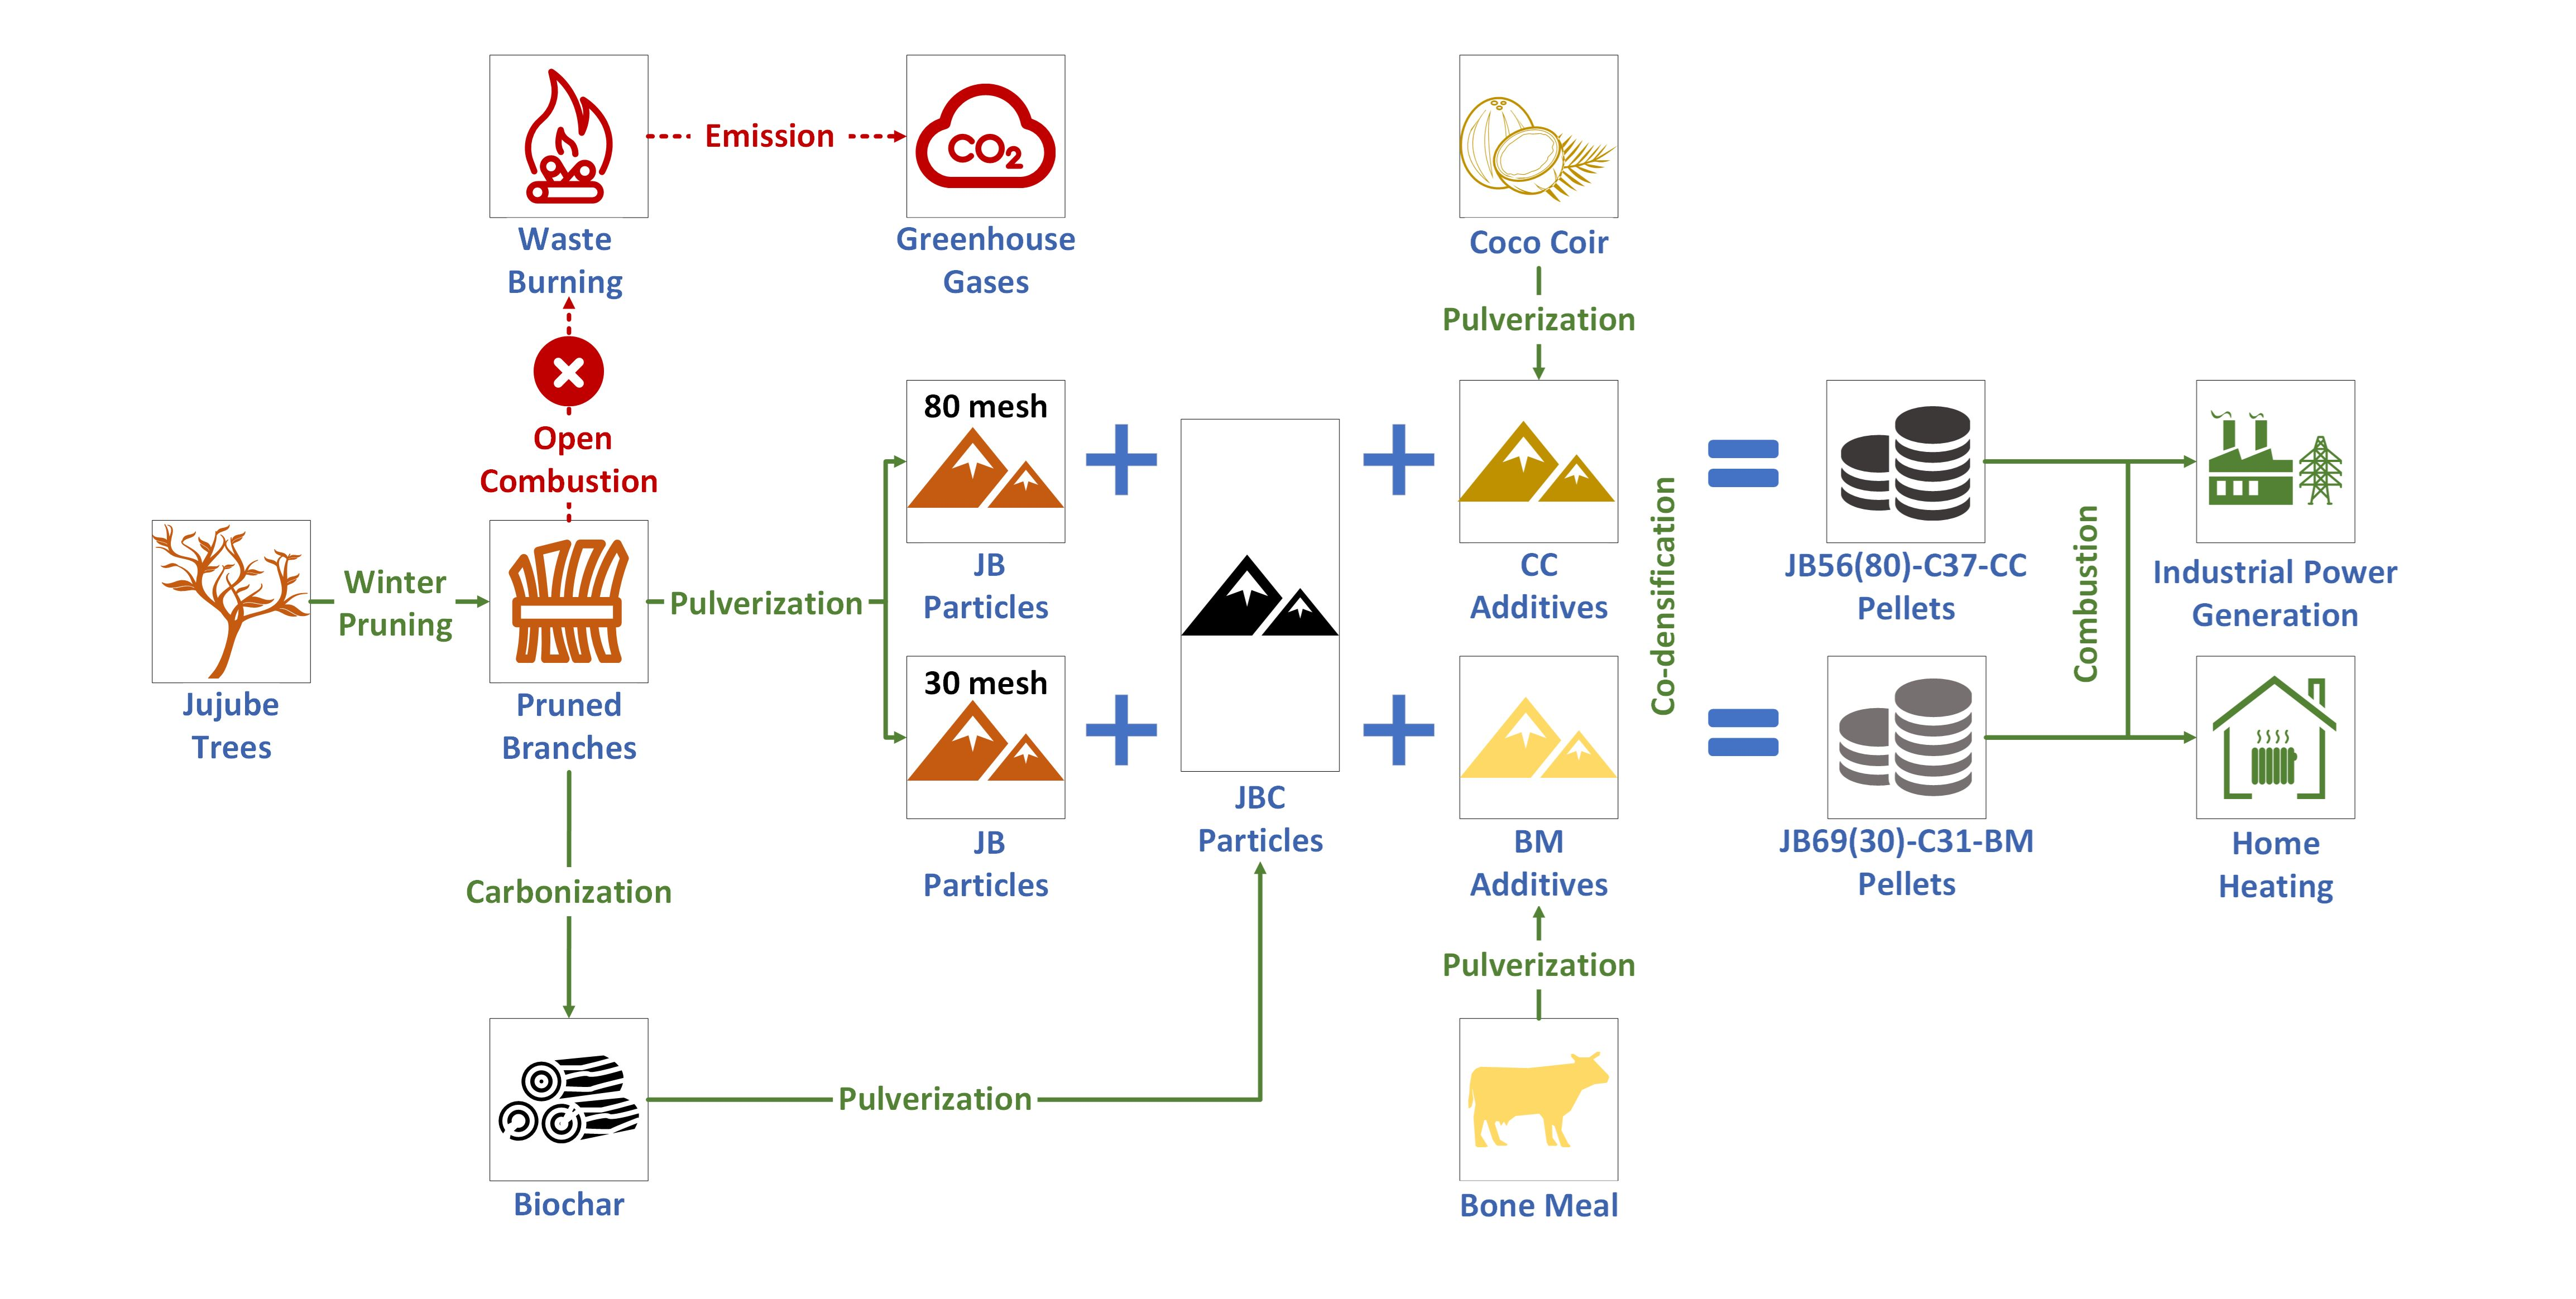
3.1.1. Particle Size and Density Distribution
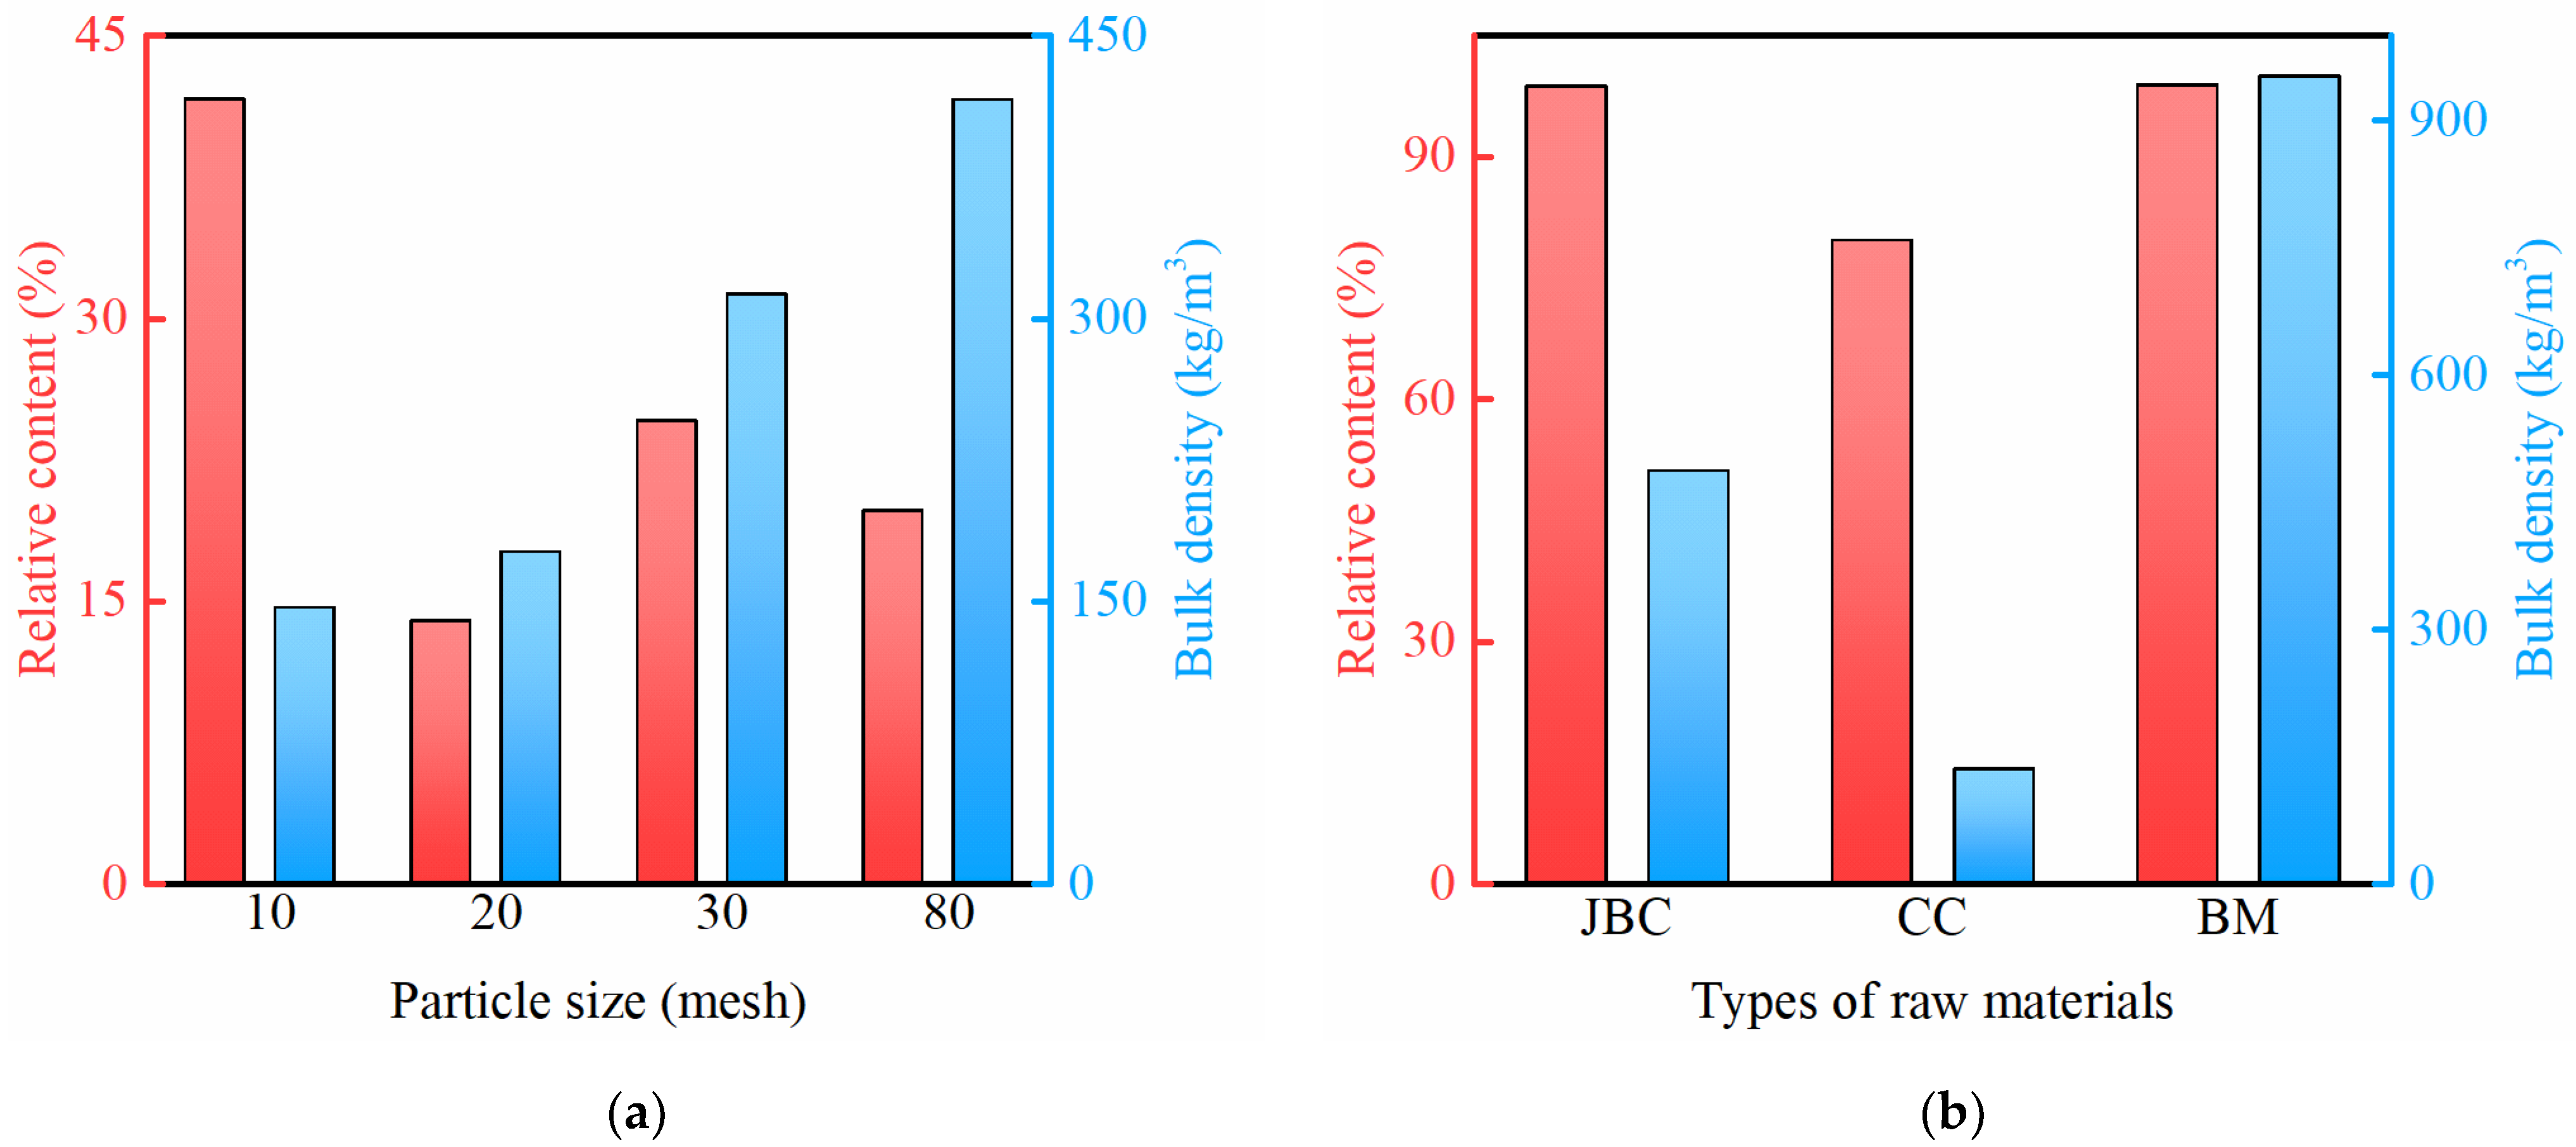
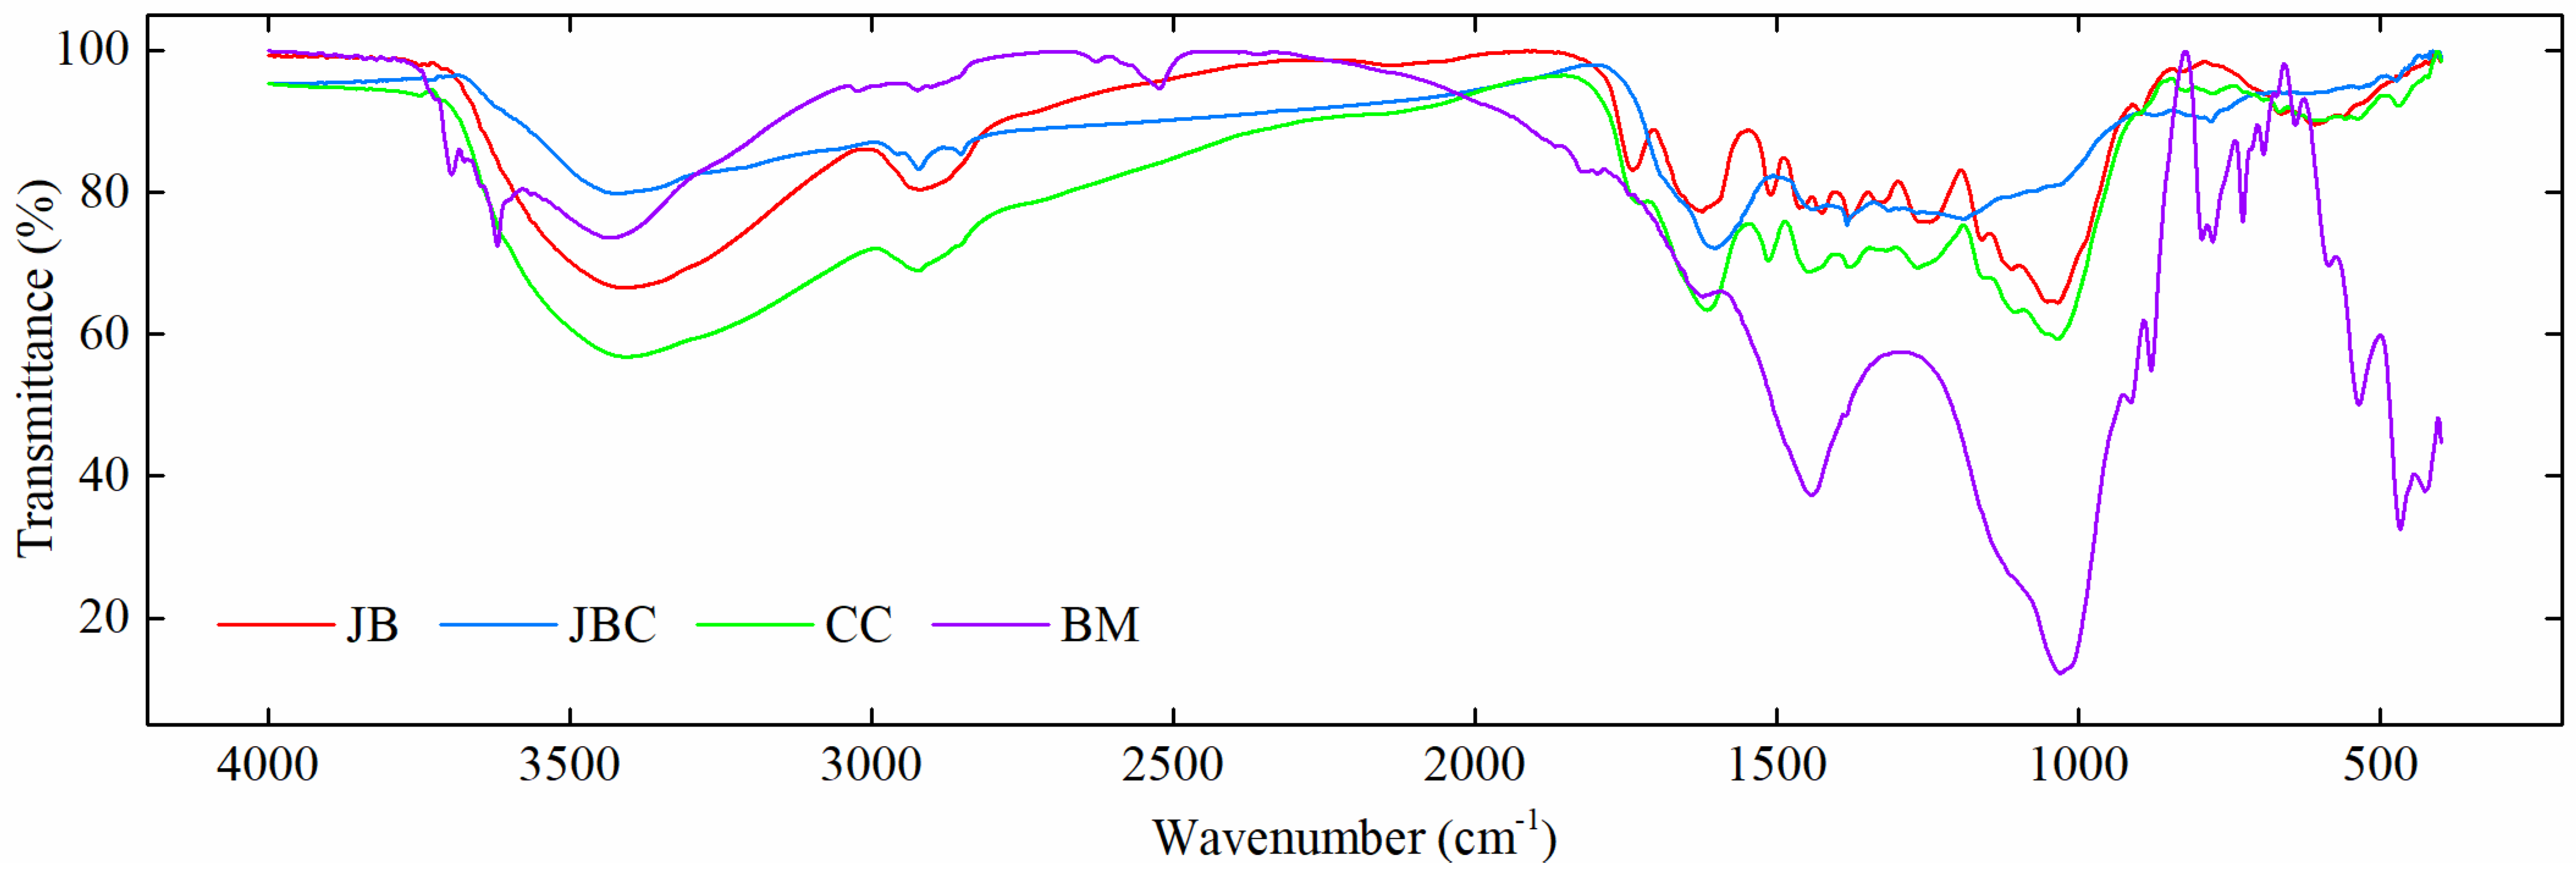
3.1.2. Functional Groups
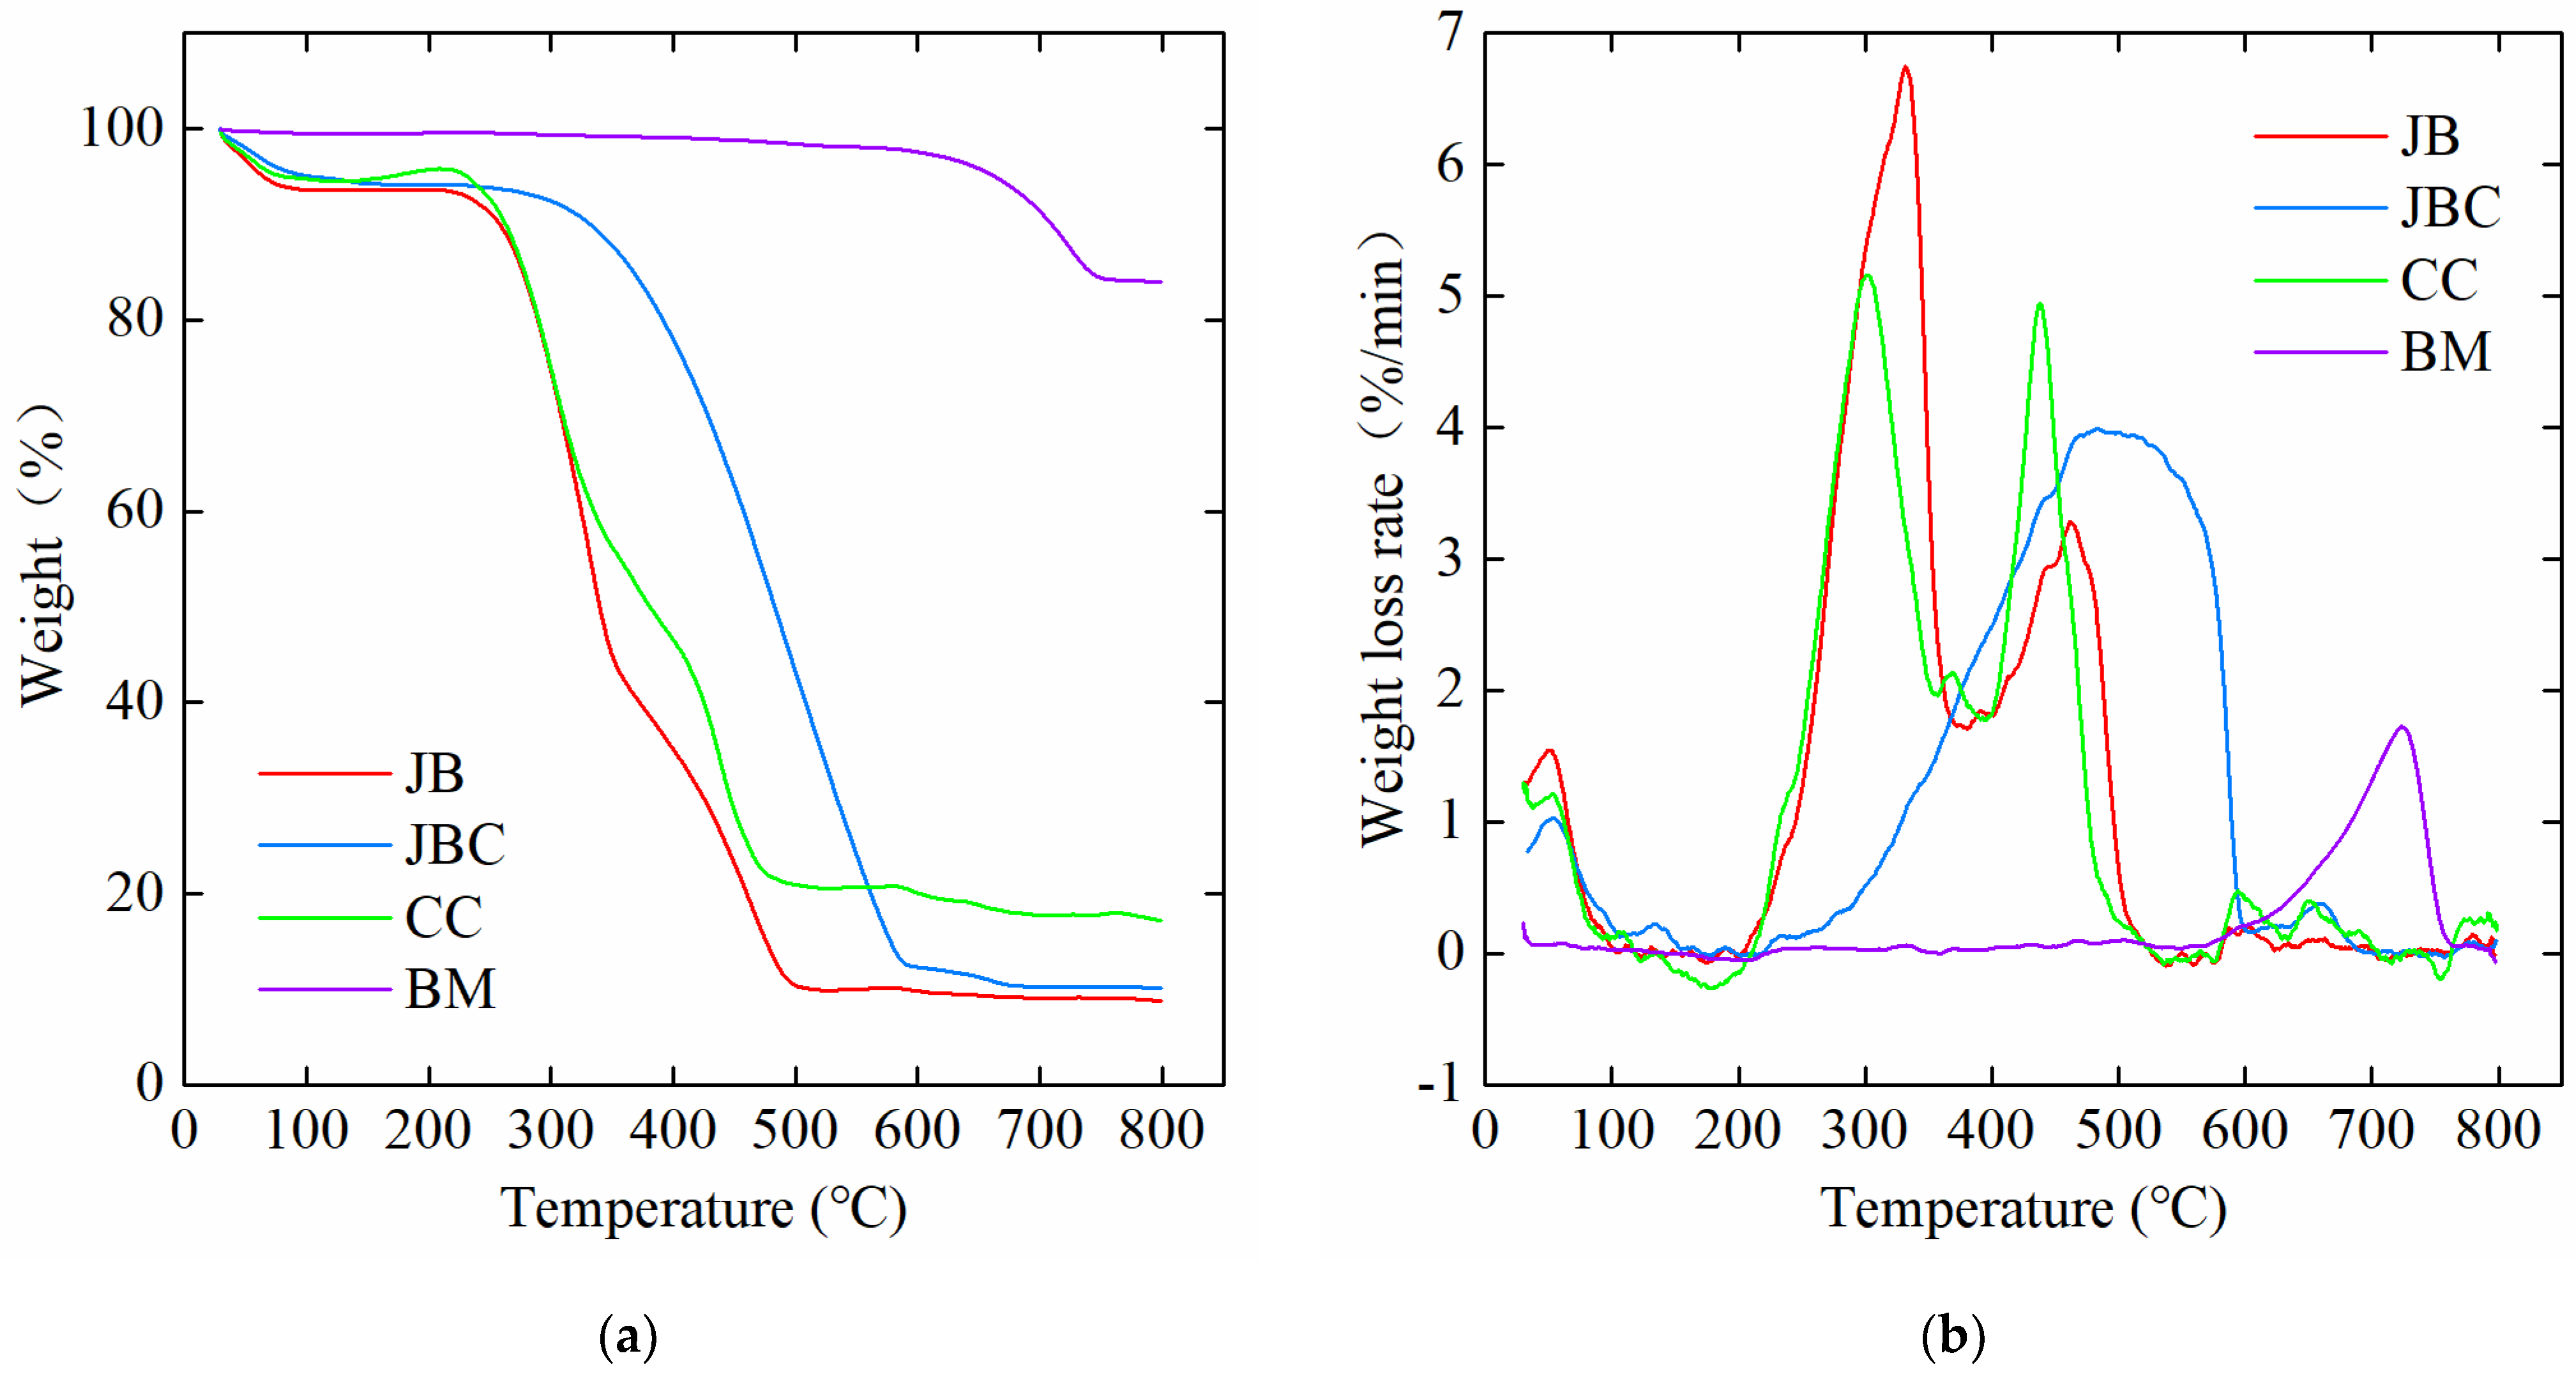
3.1.3. Thermogravimetric Analysis
3.2. Optimization of Formula Parameters
3.2.1. Parameter Range Screening
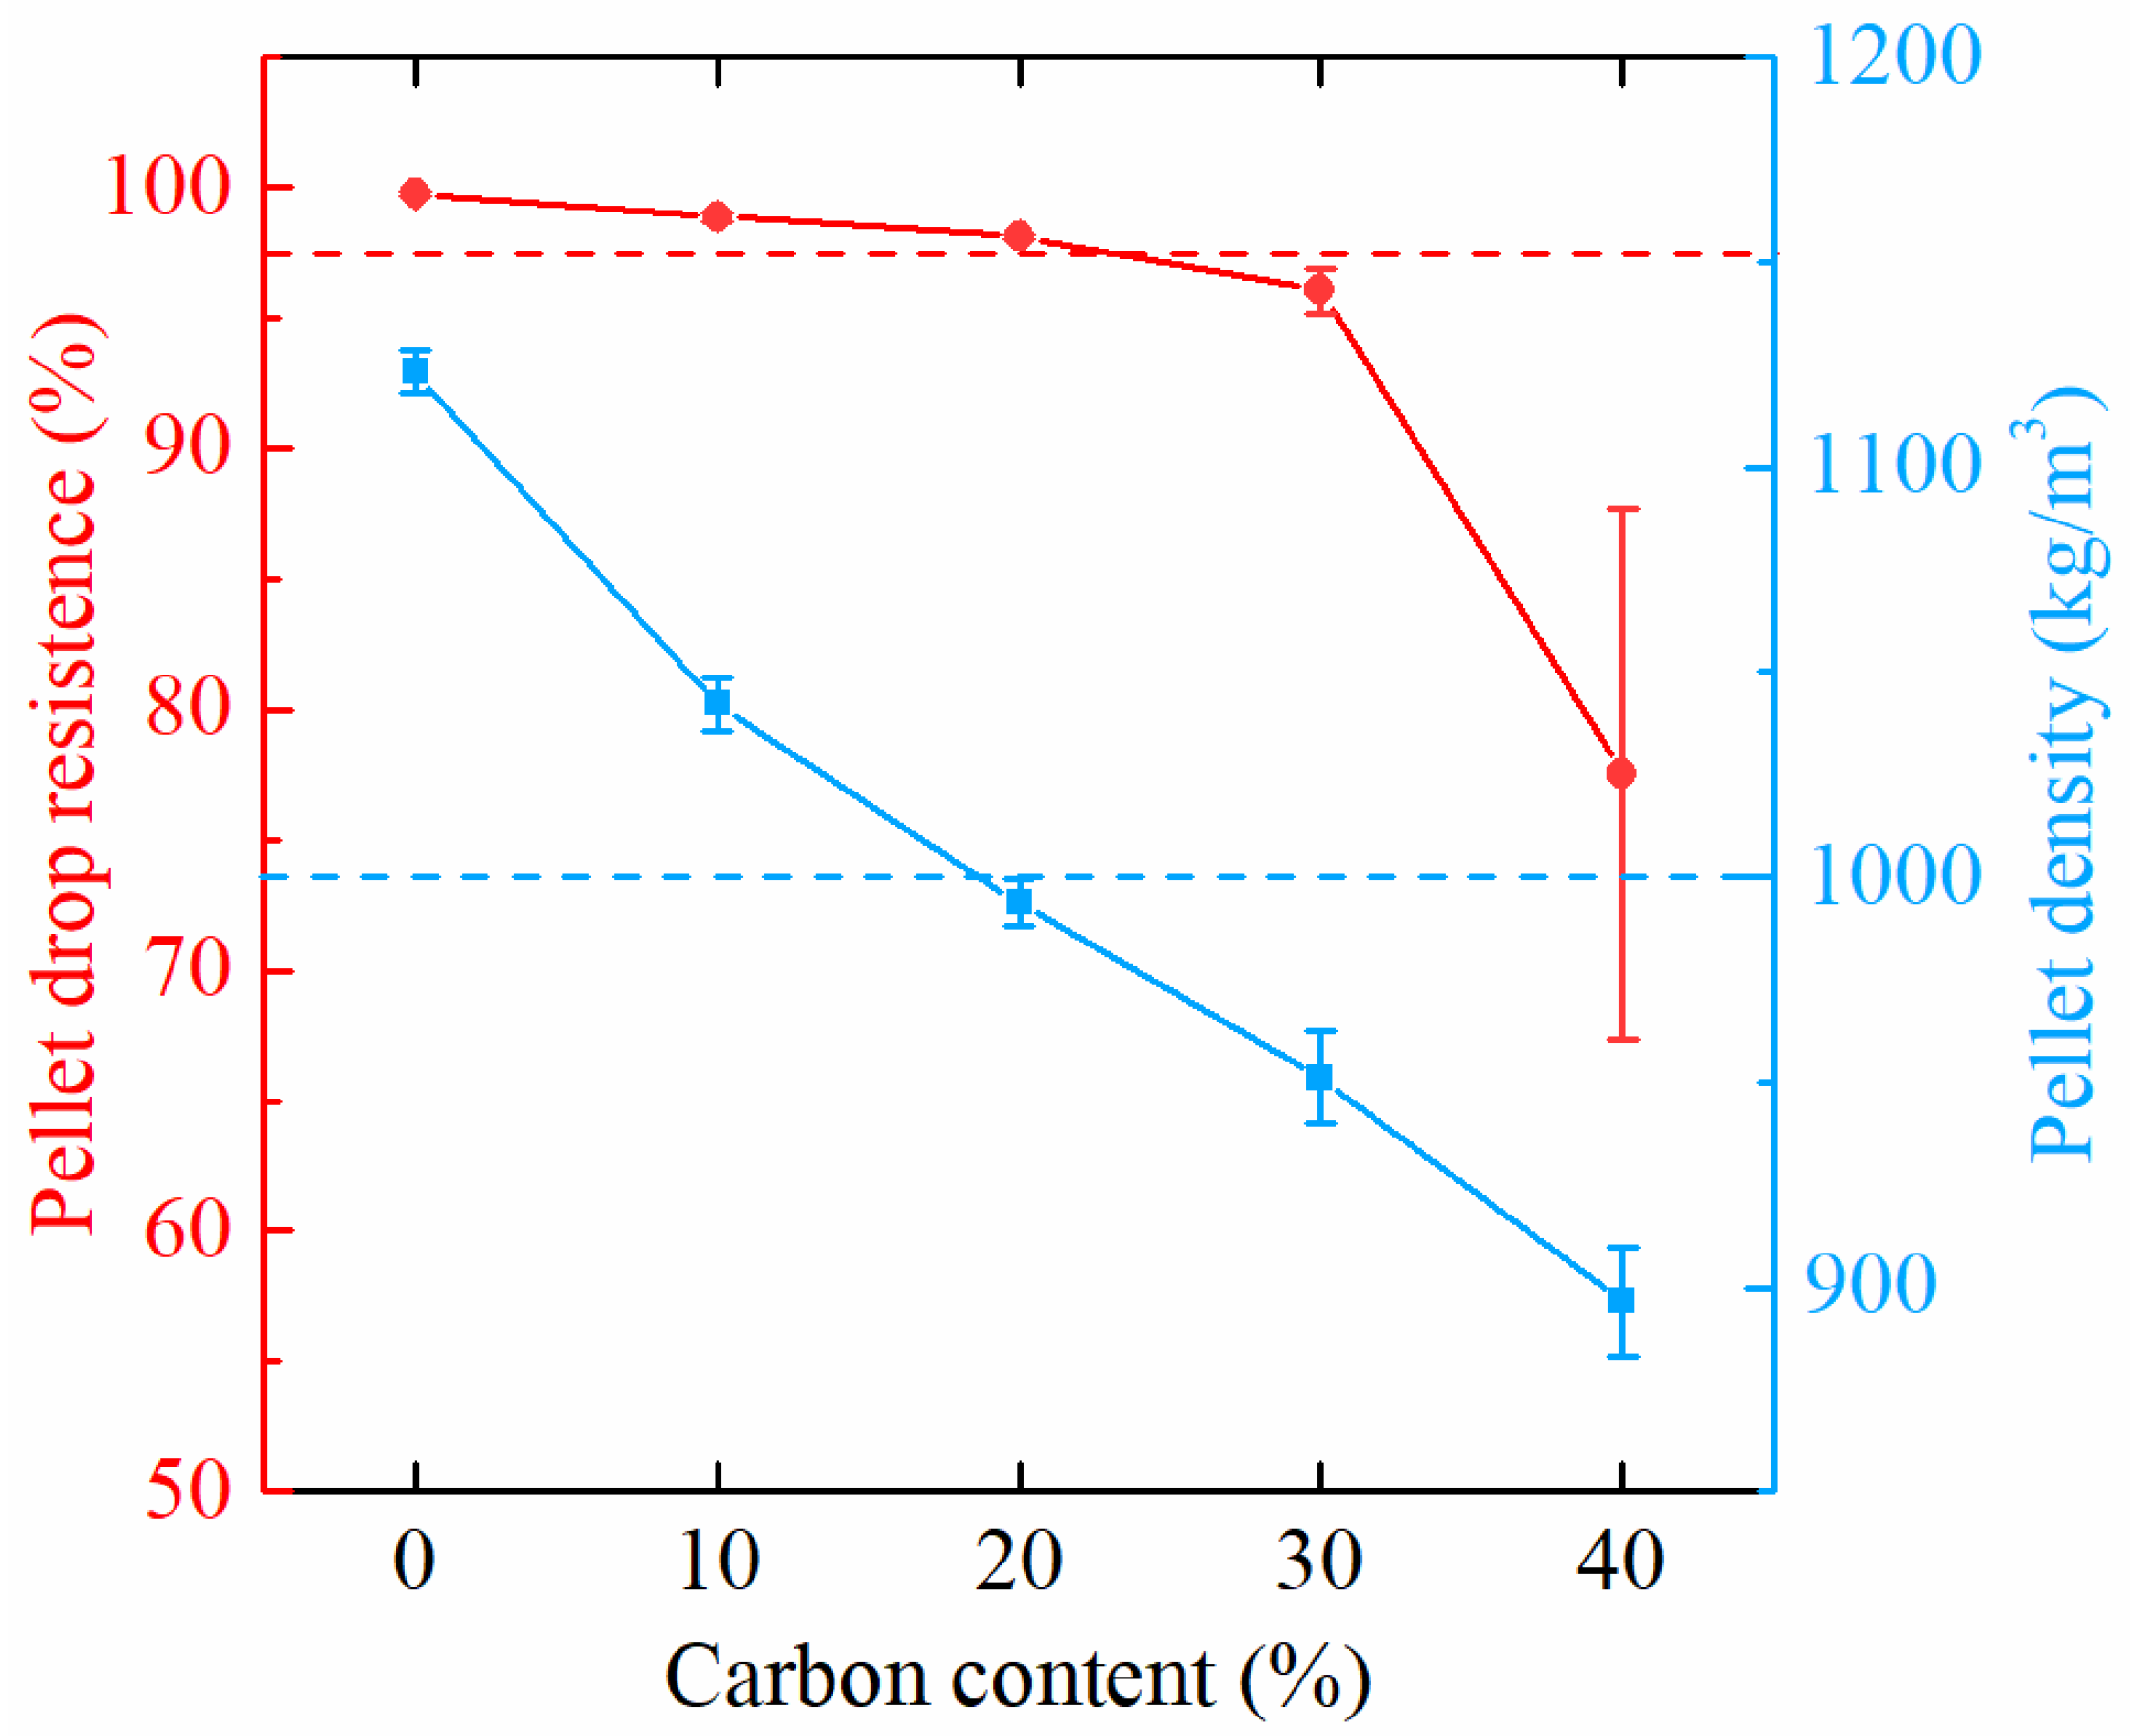
Optimization of JBC Contents
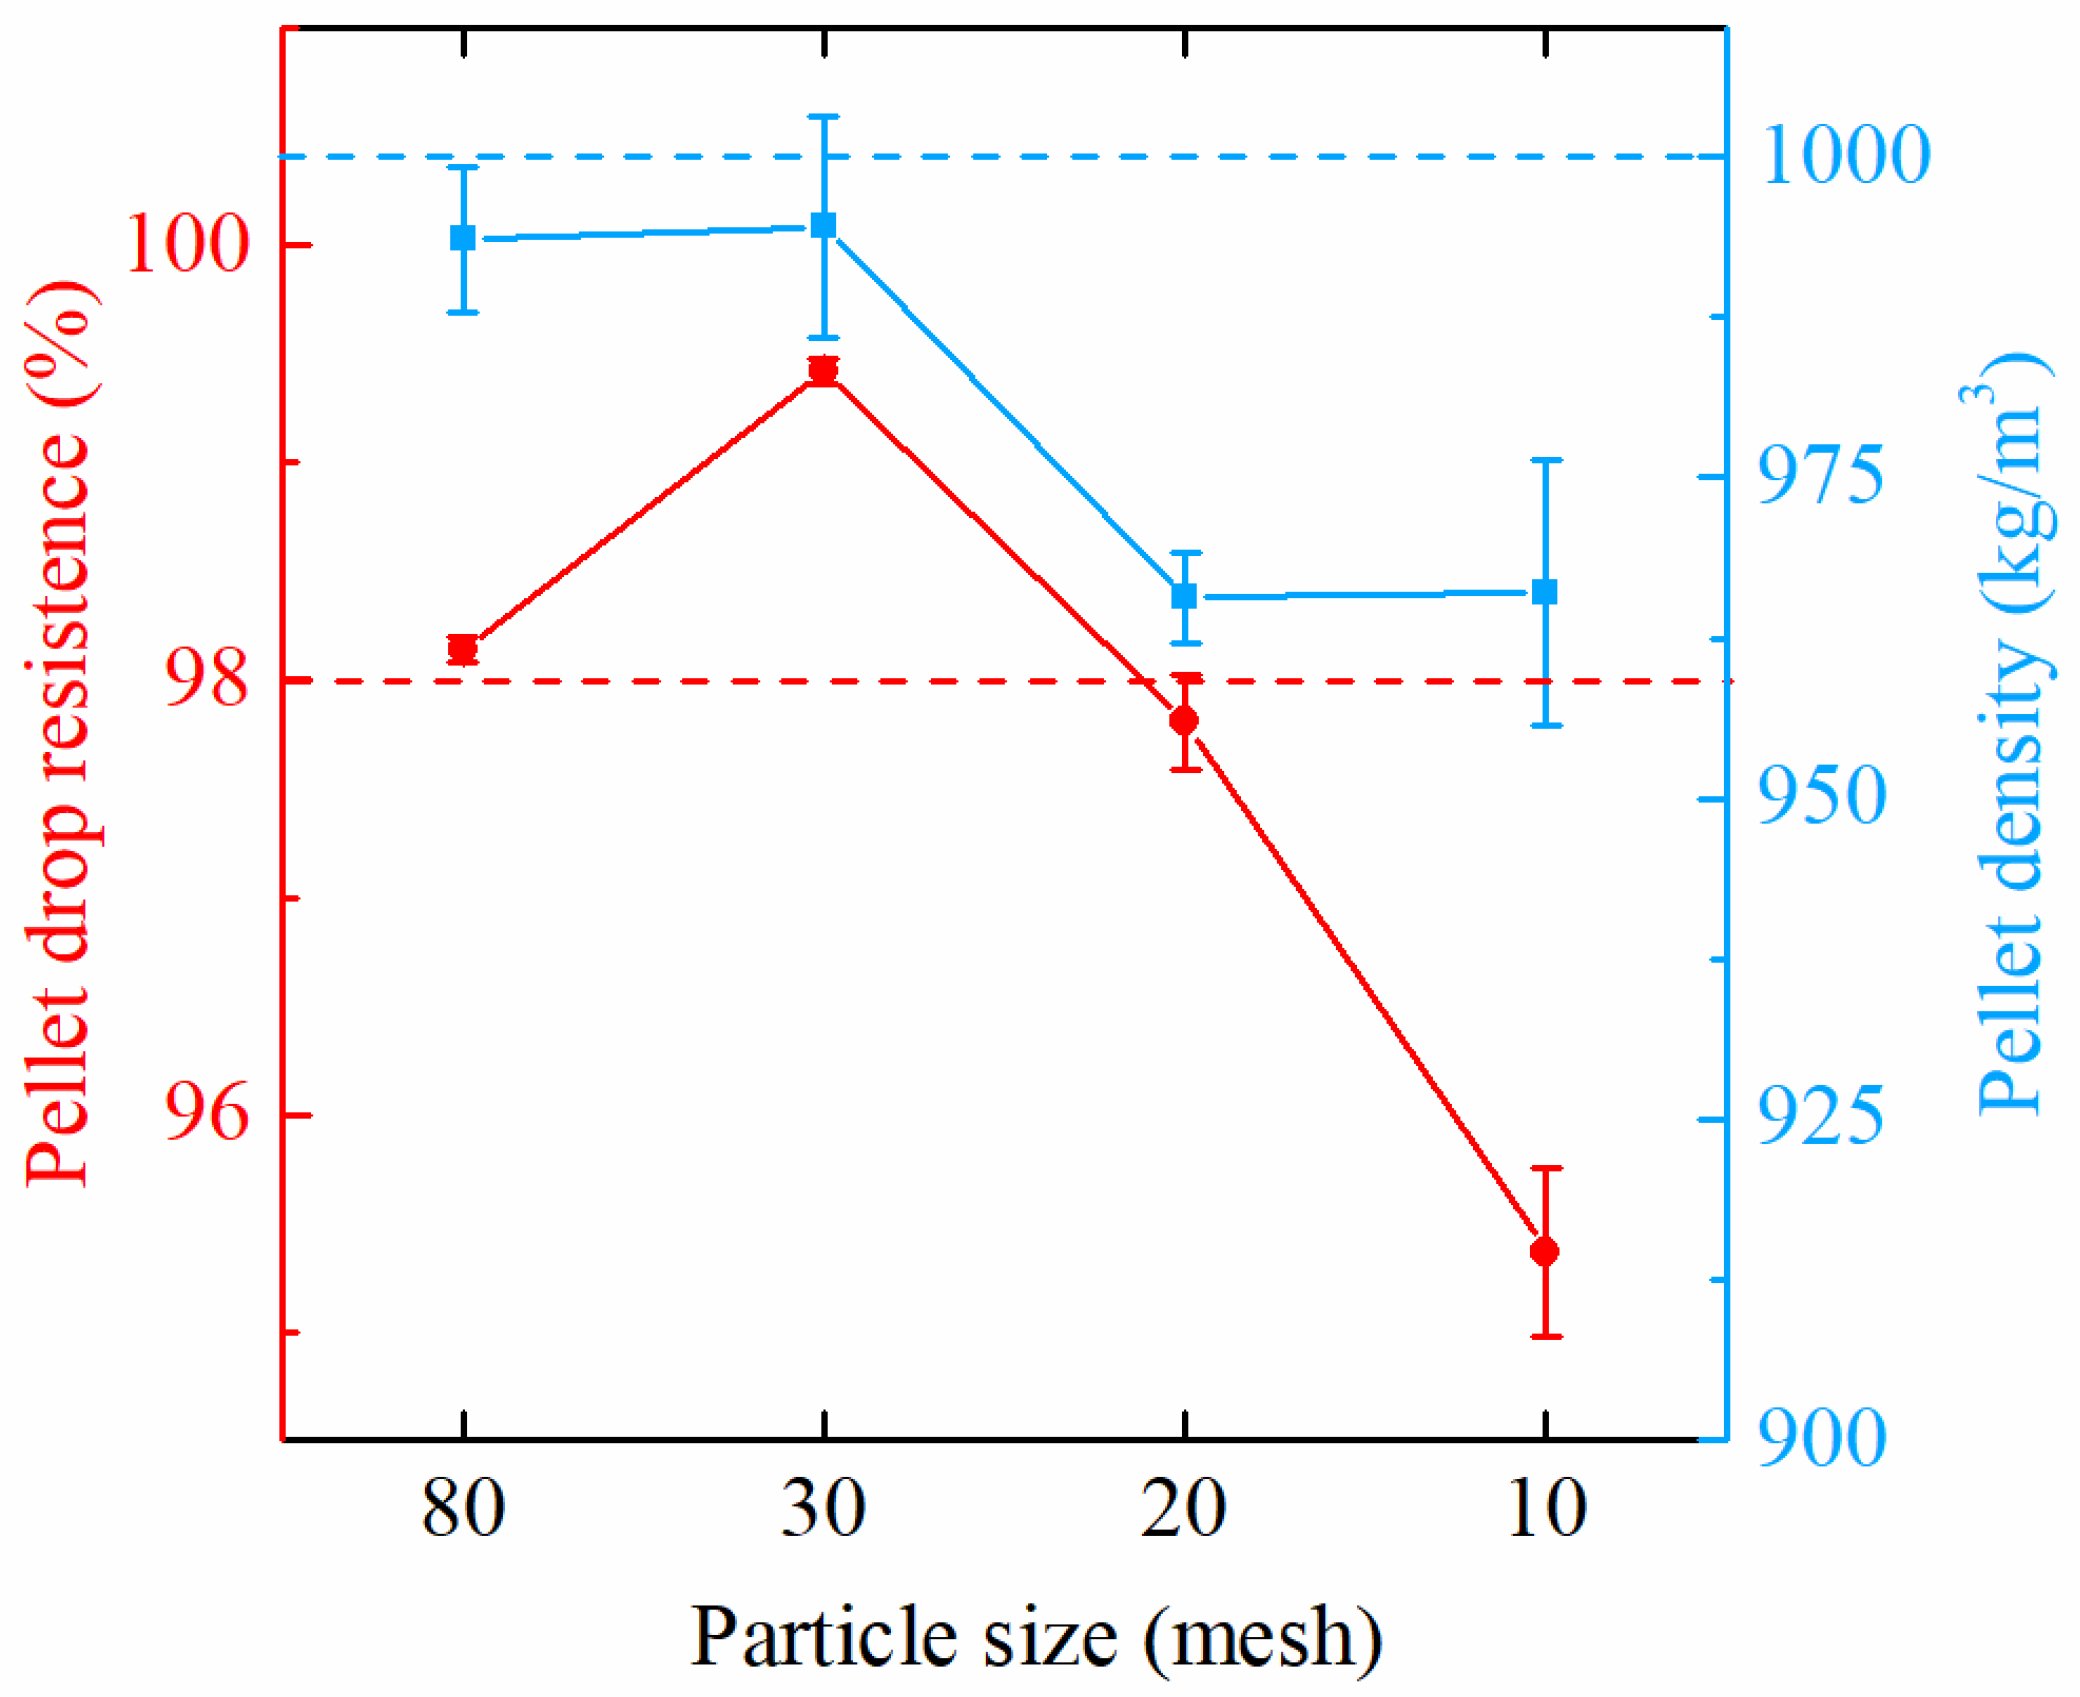
Optimization of JB Particle Sizes
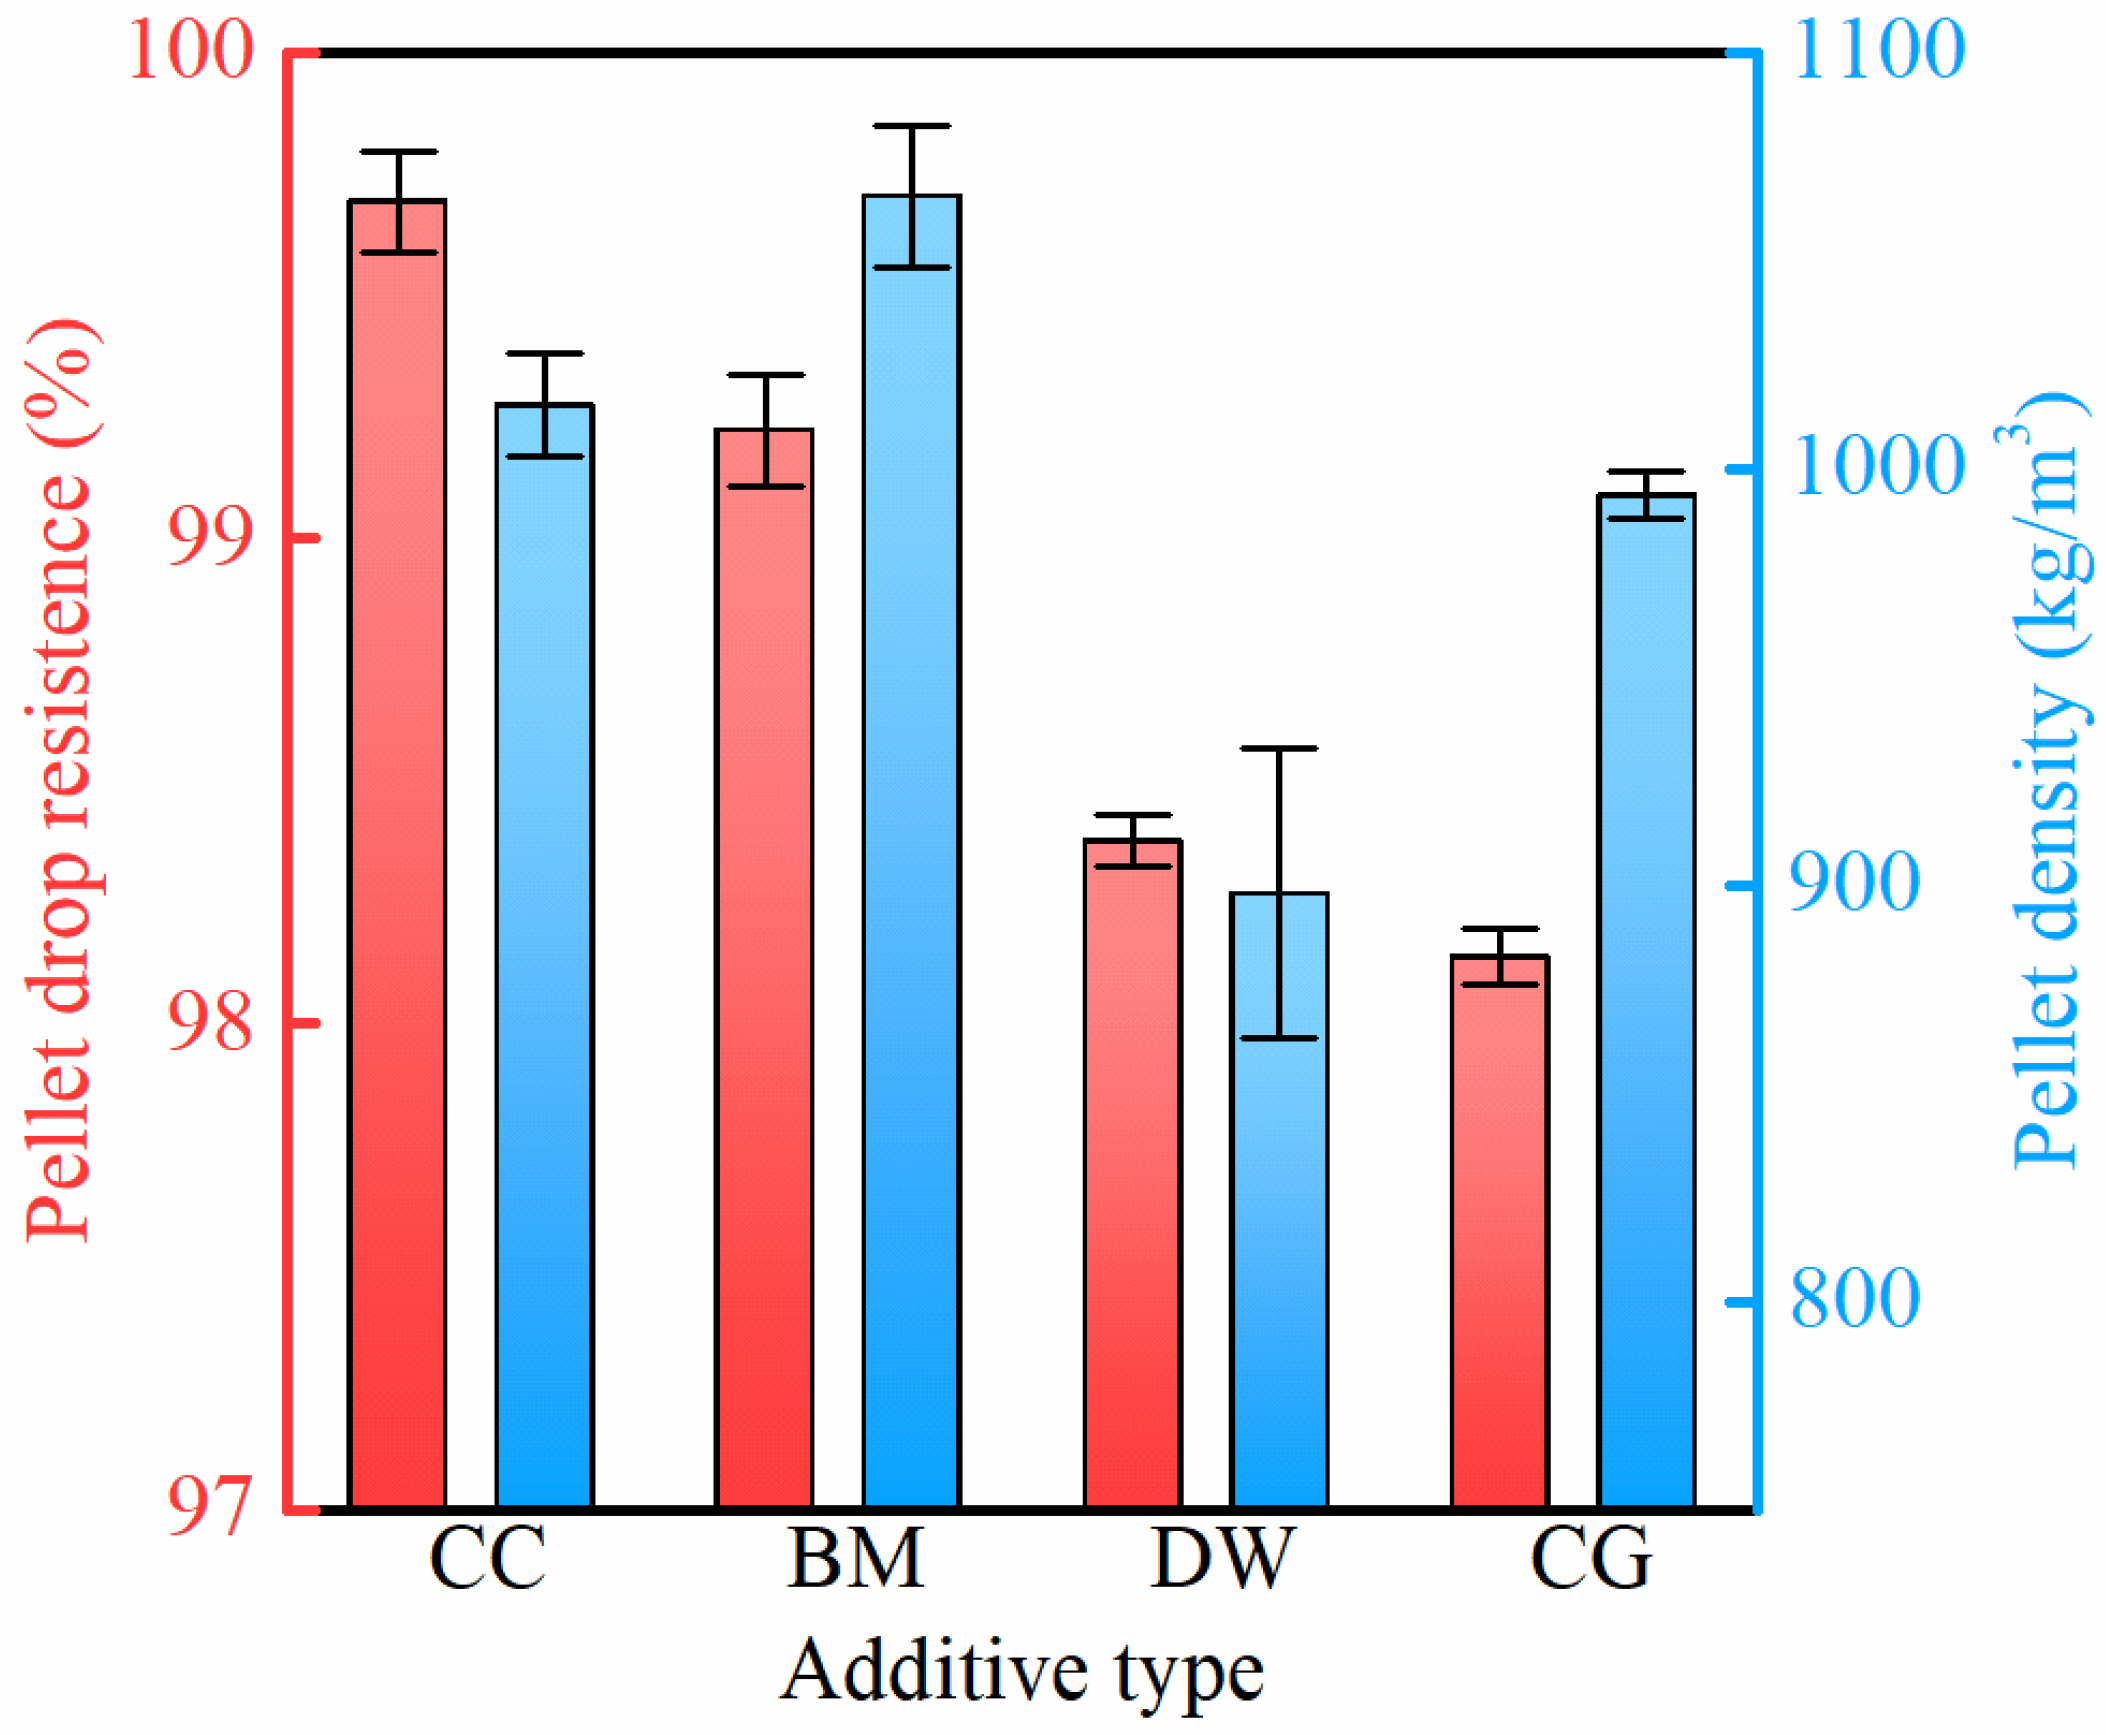
Effect of Additives
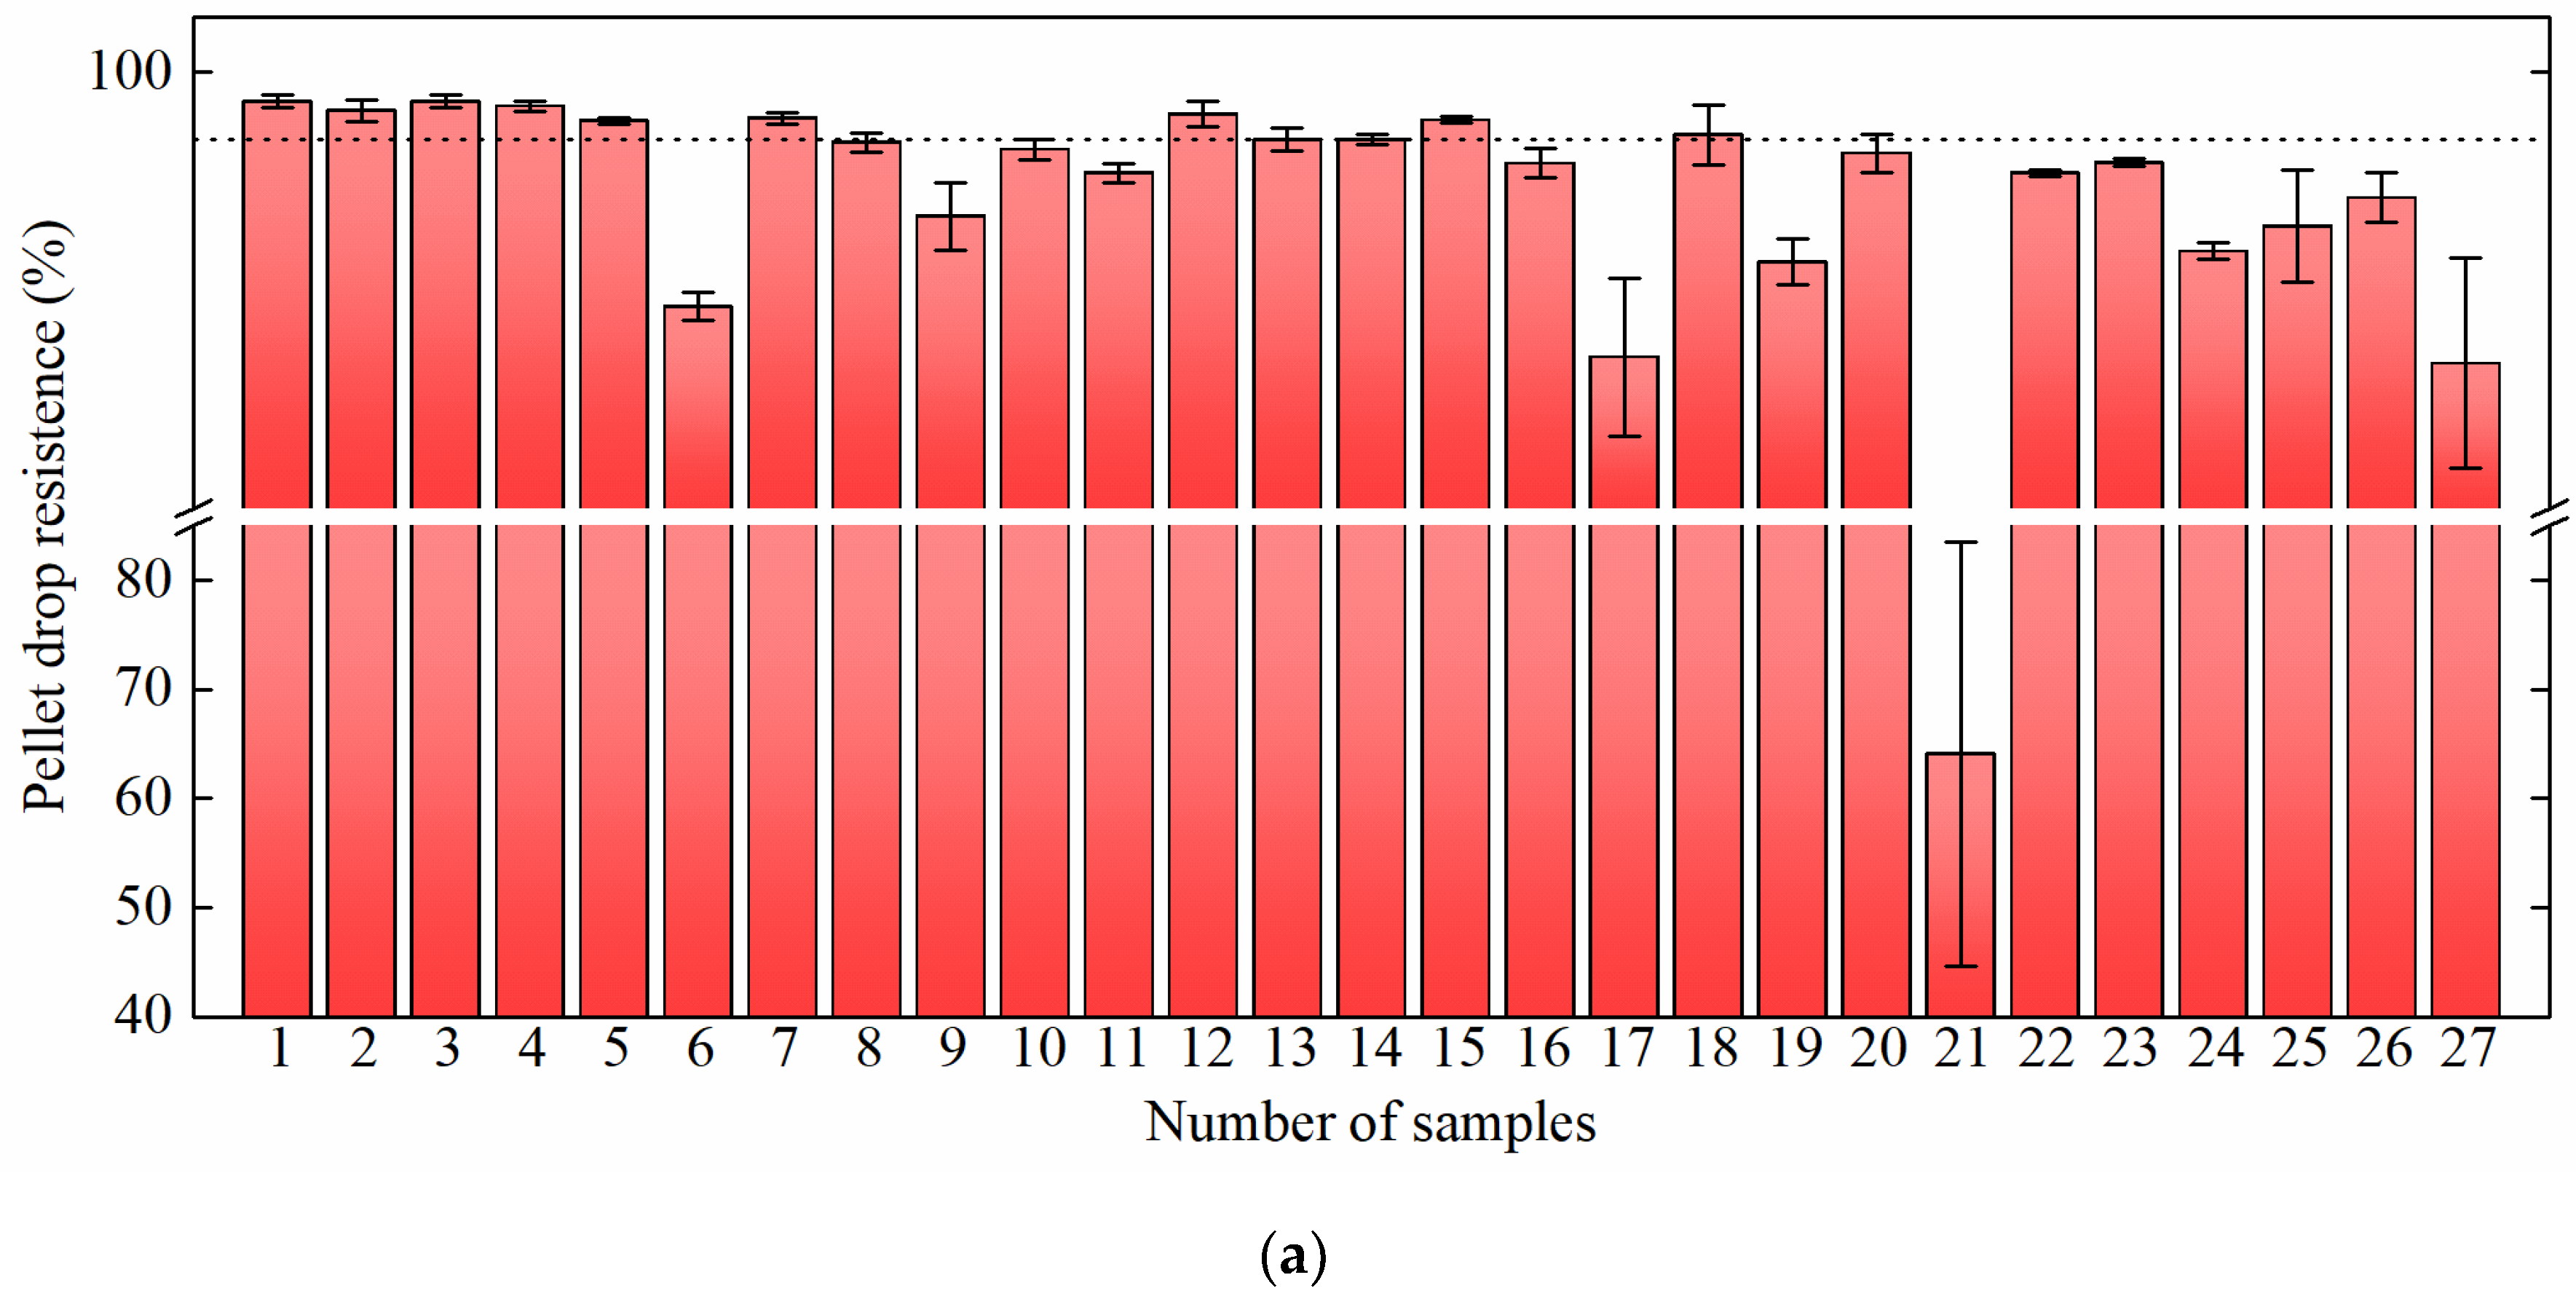
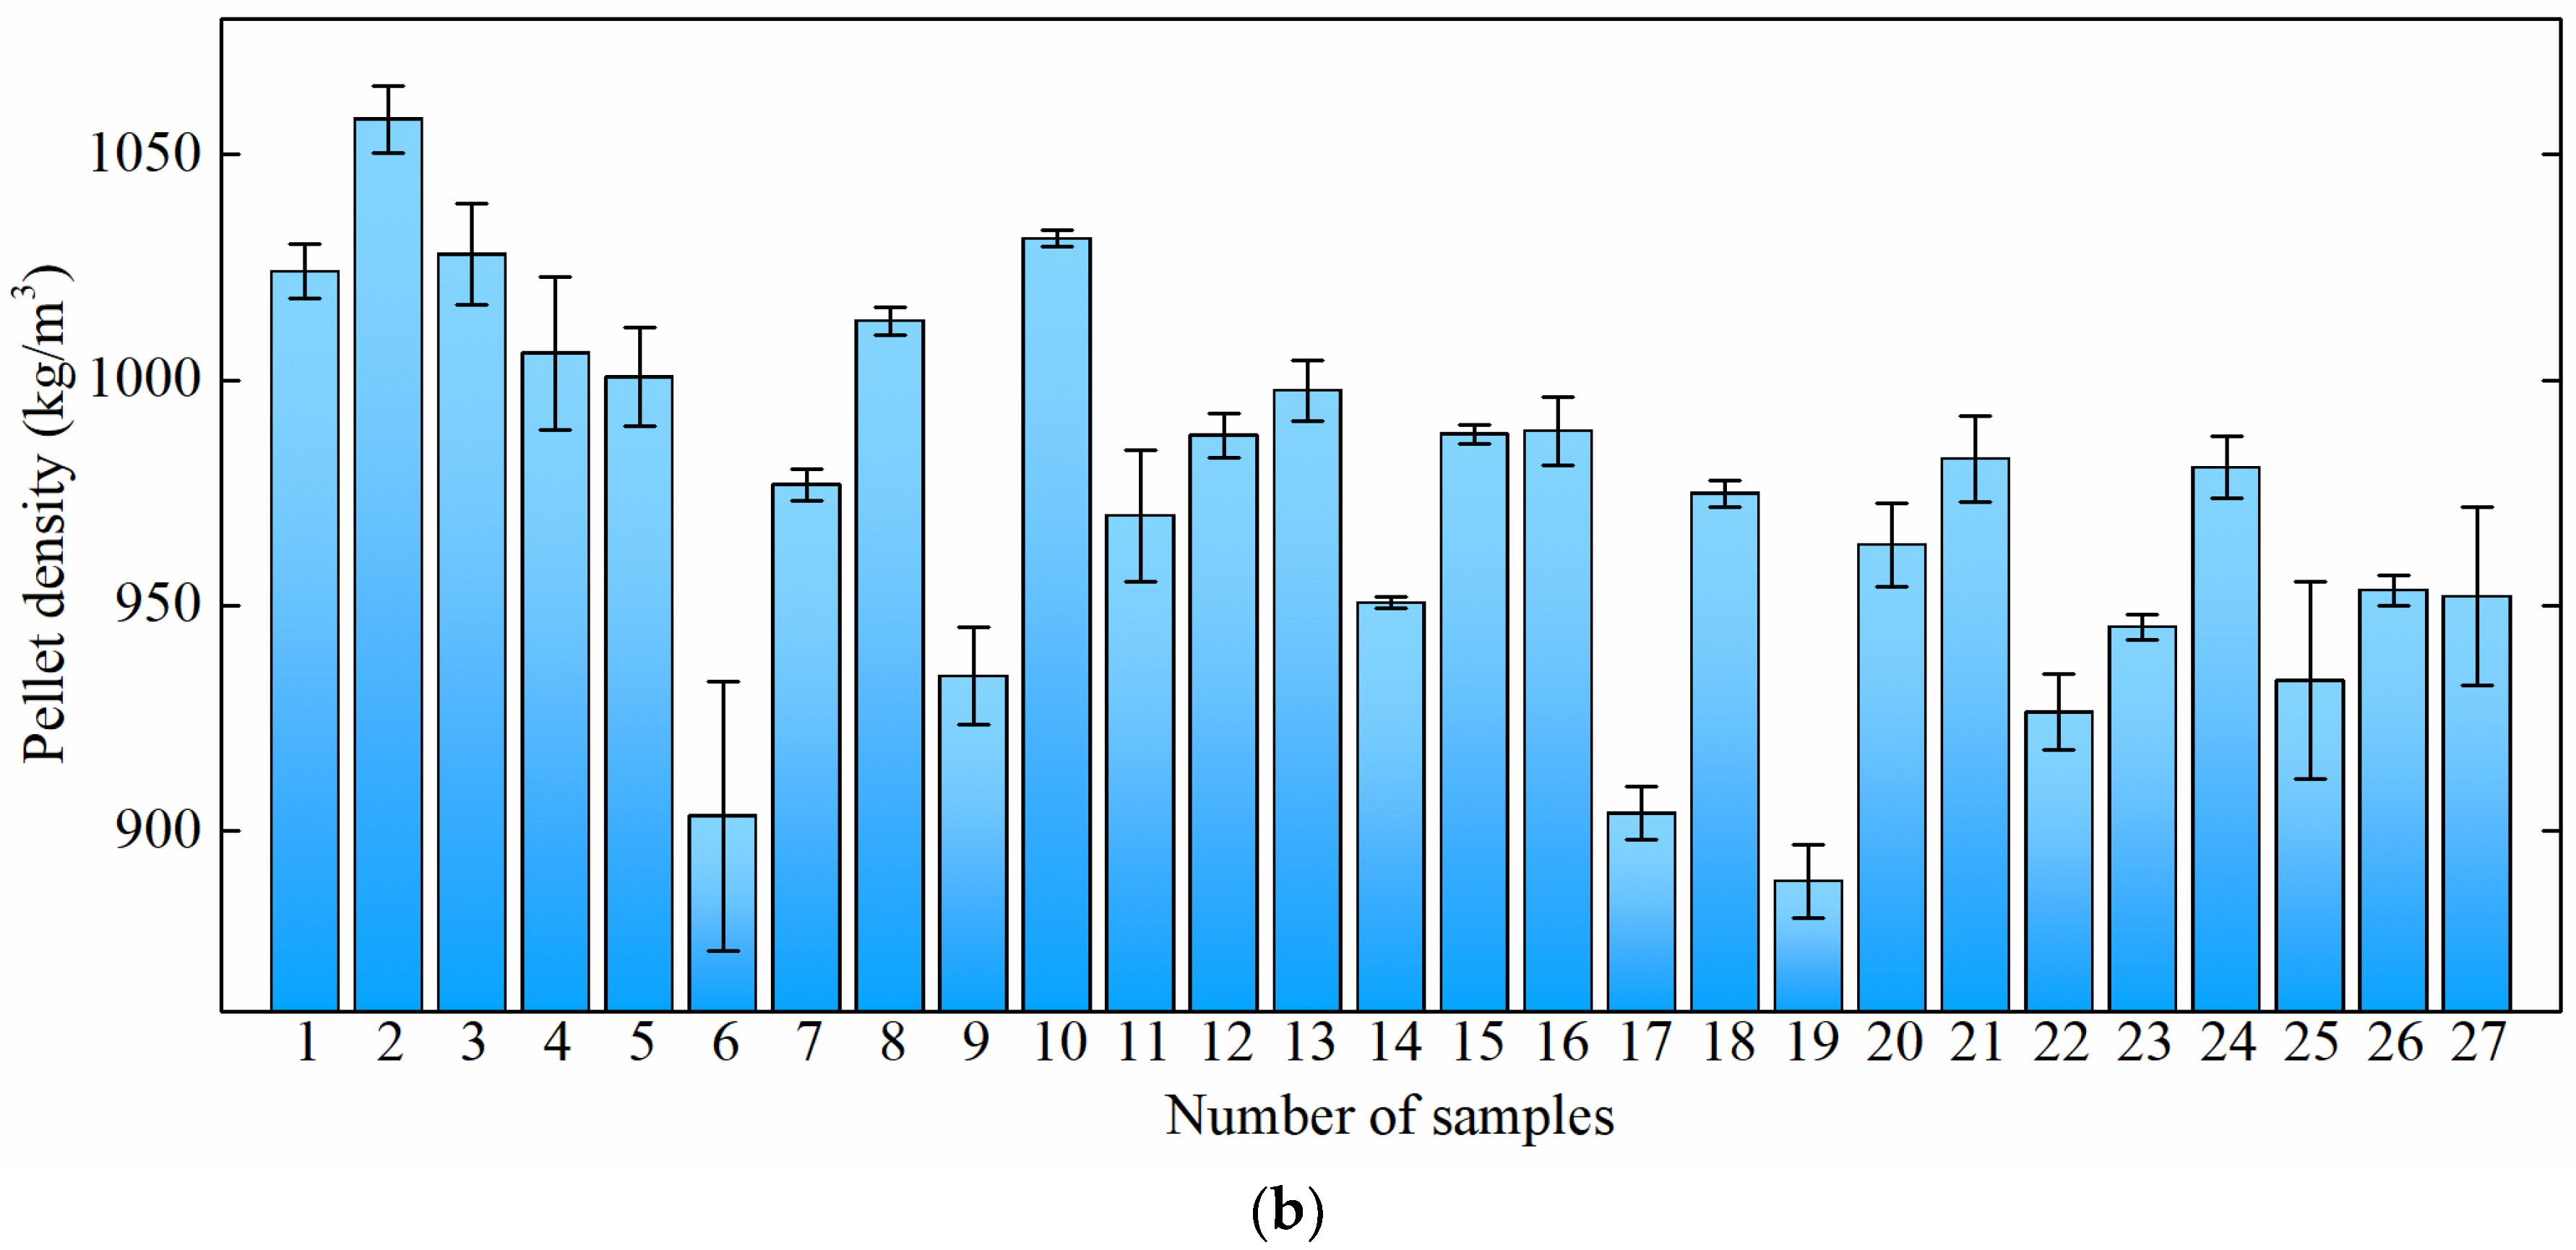
3.2.2. Pellet Formulation Optimization
Experimental Results
Variance Analysis
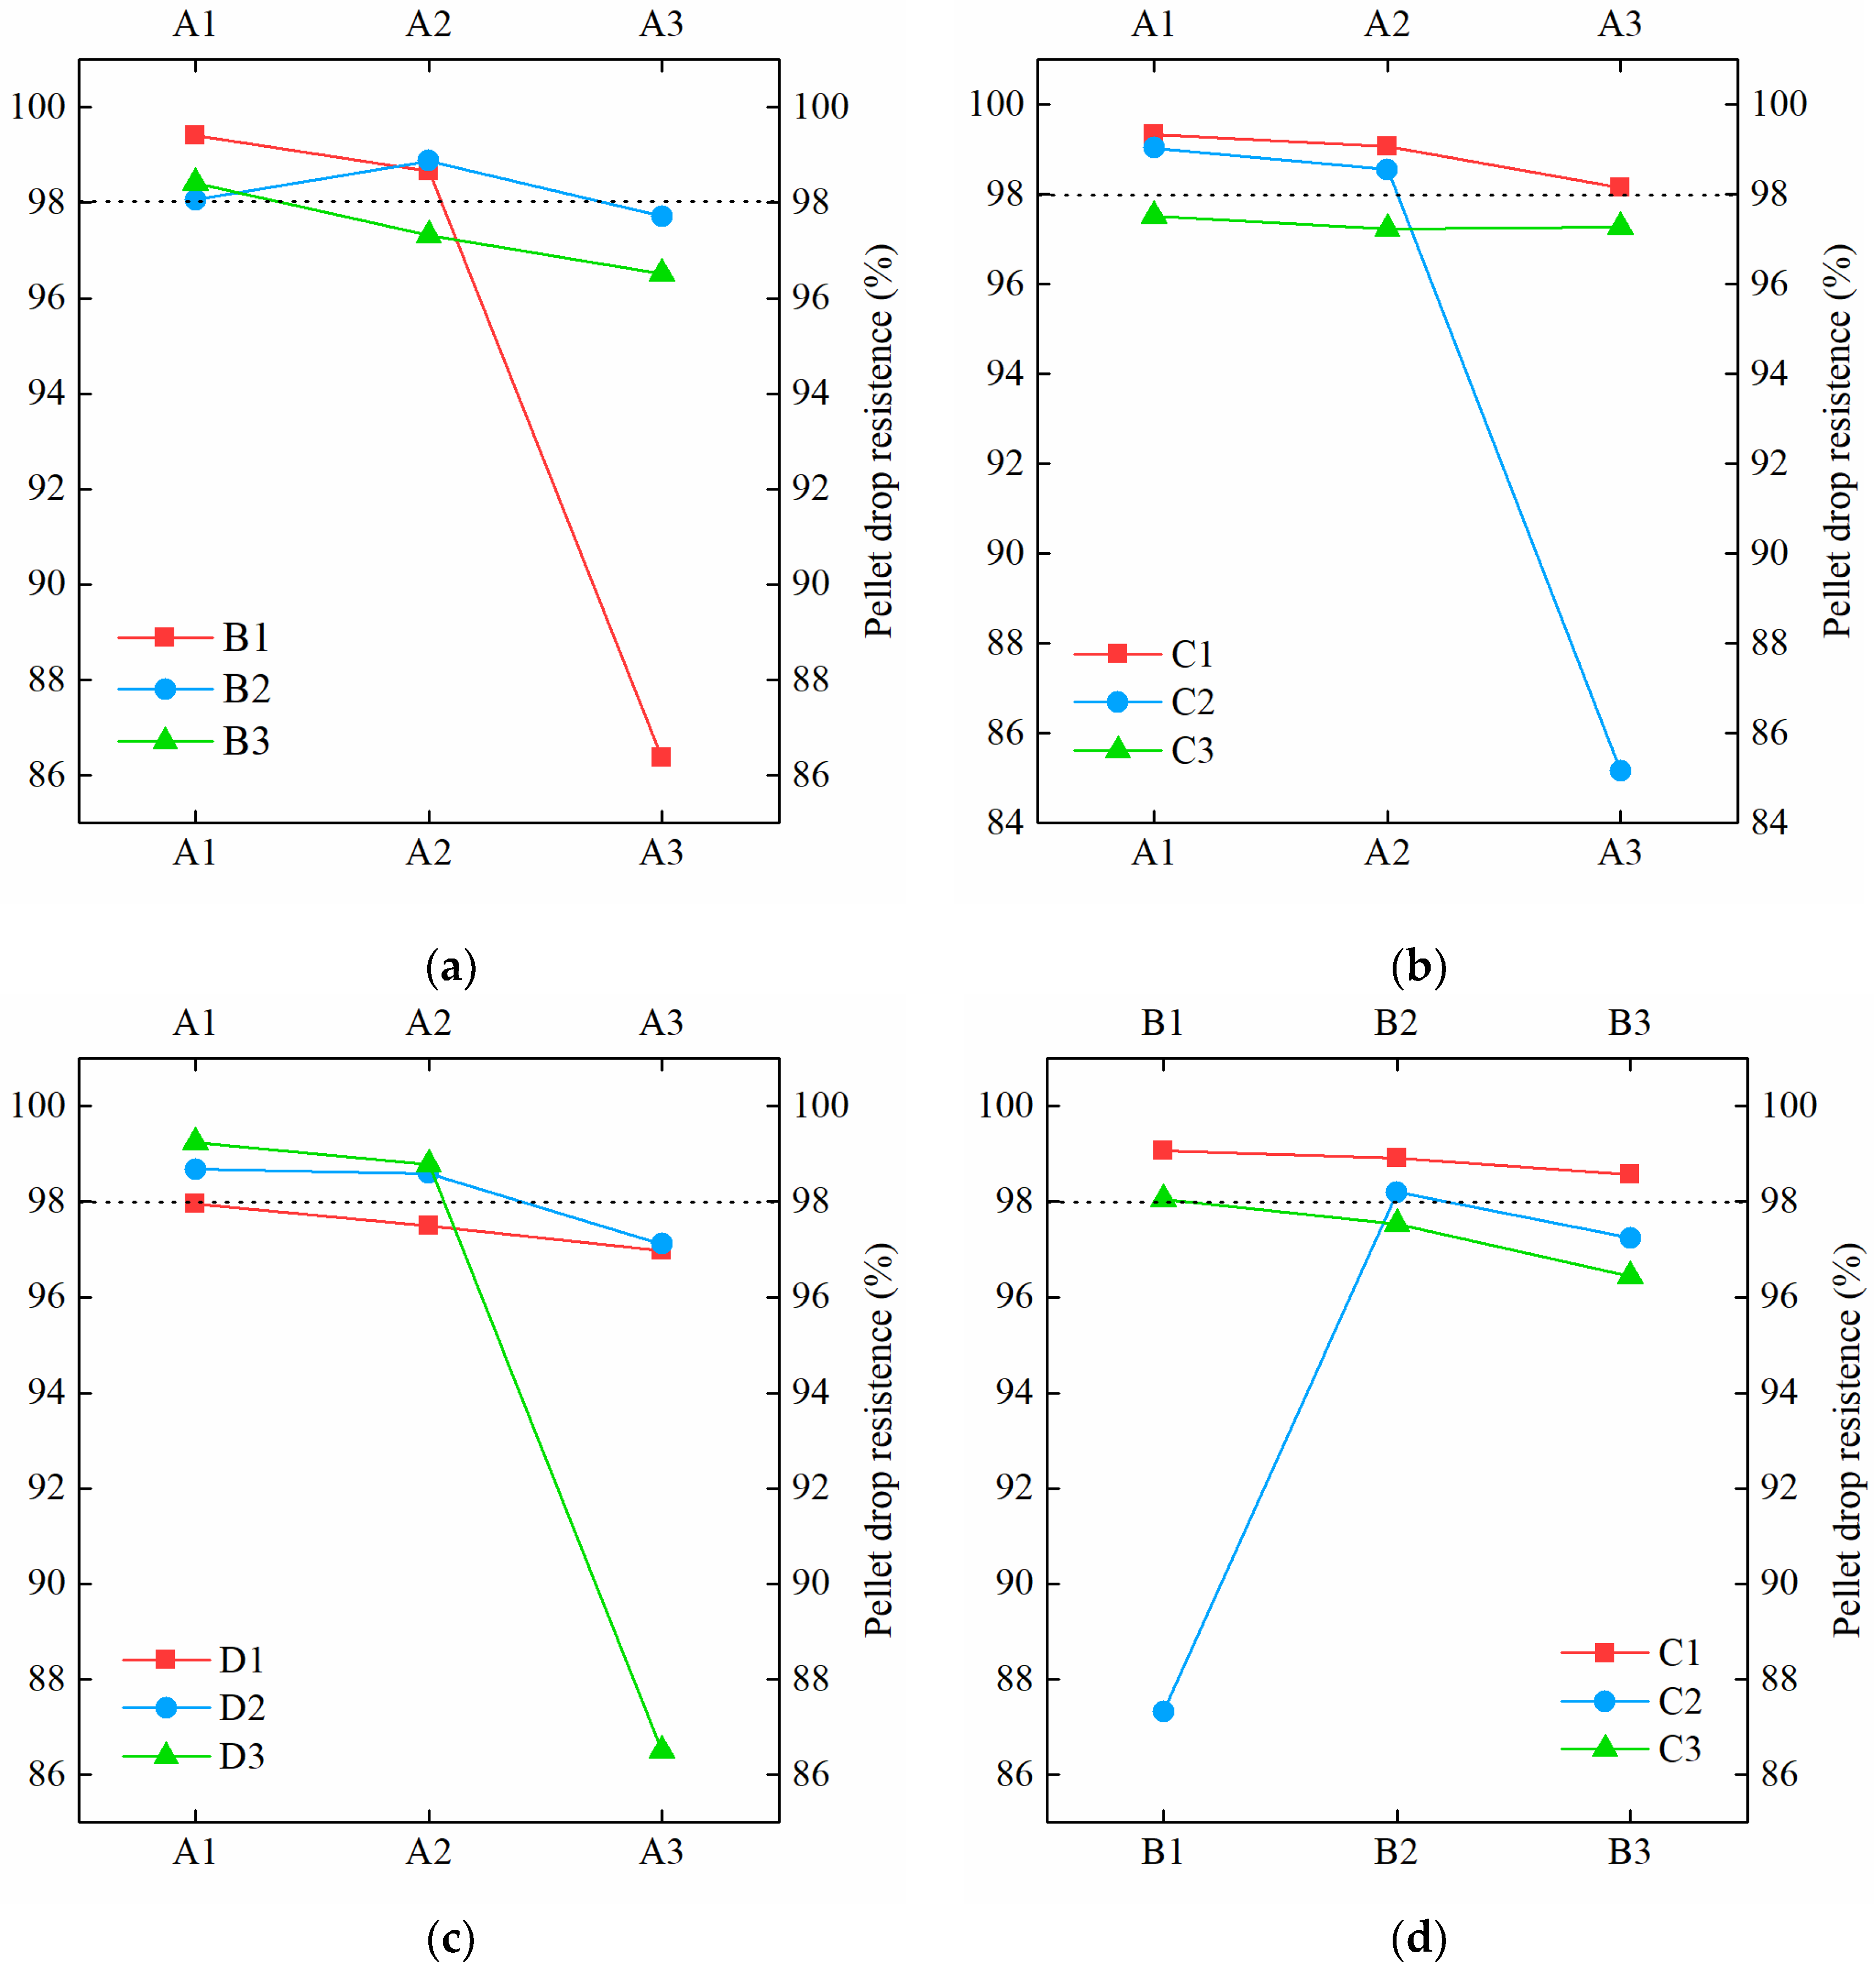
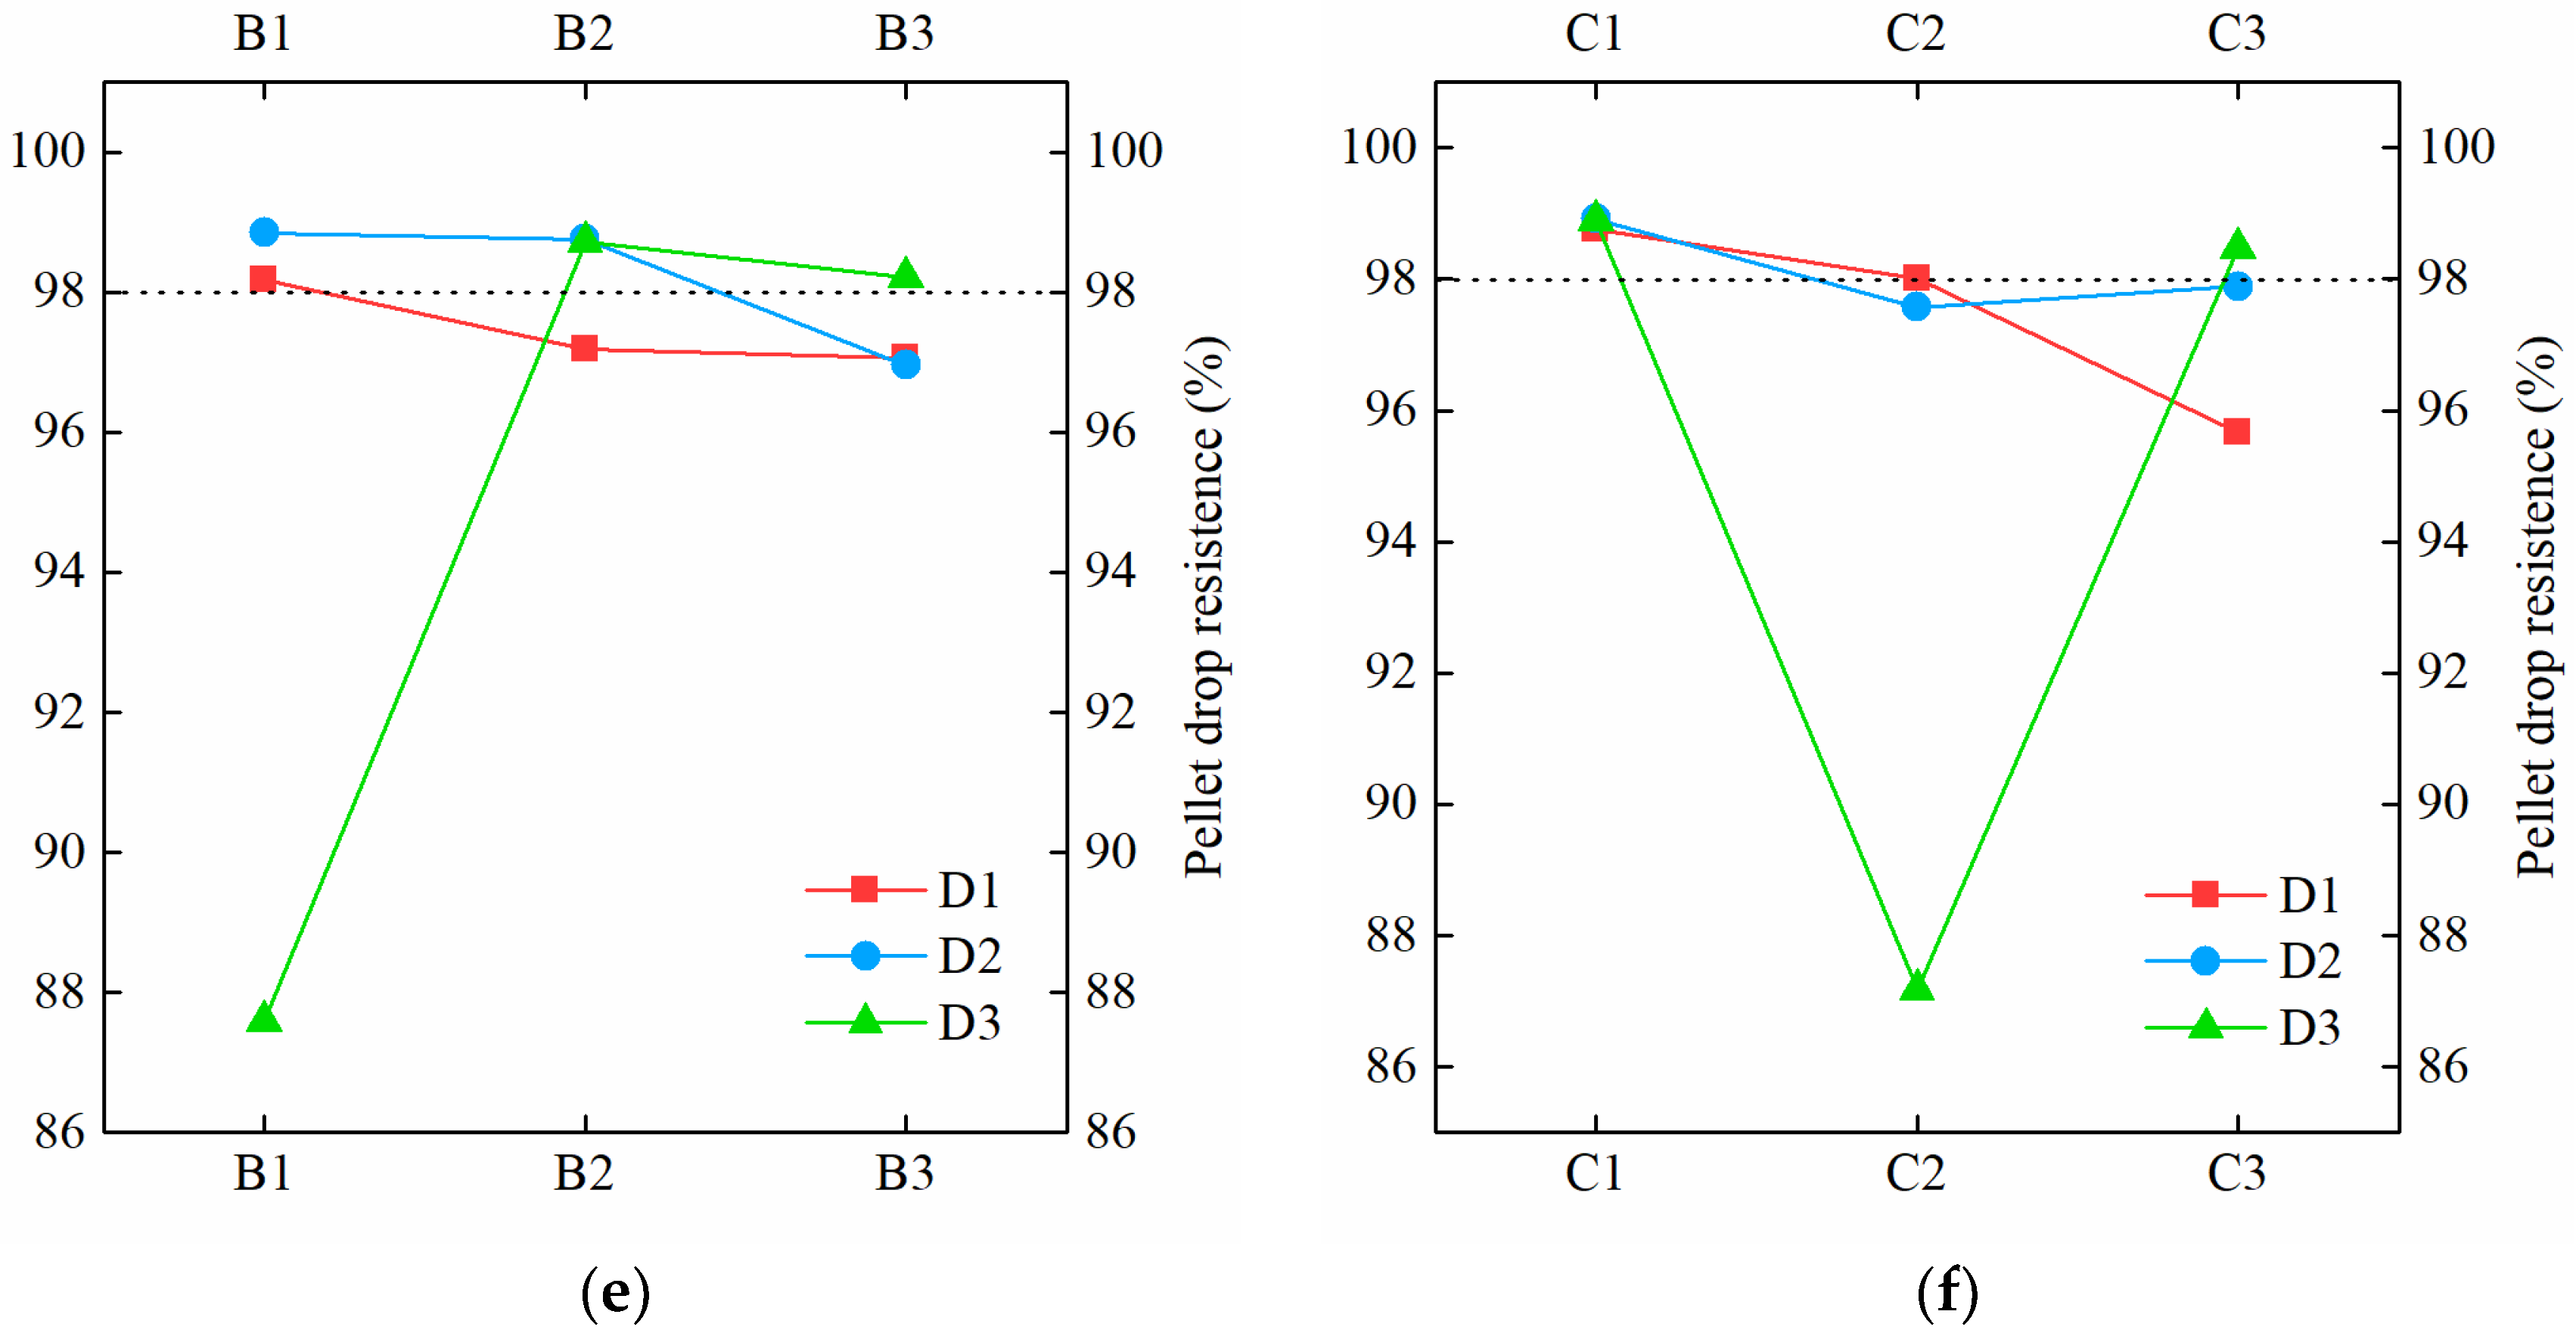
Range Analysis
Optimized Formula Parameters
3.2.3. Pellet Formulation Comparison
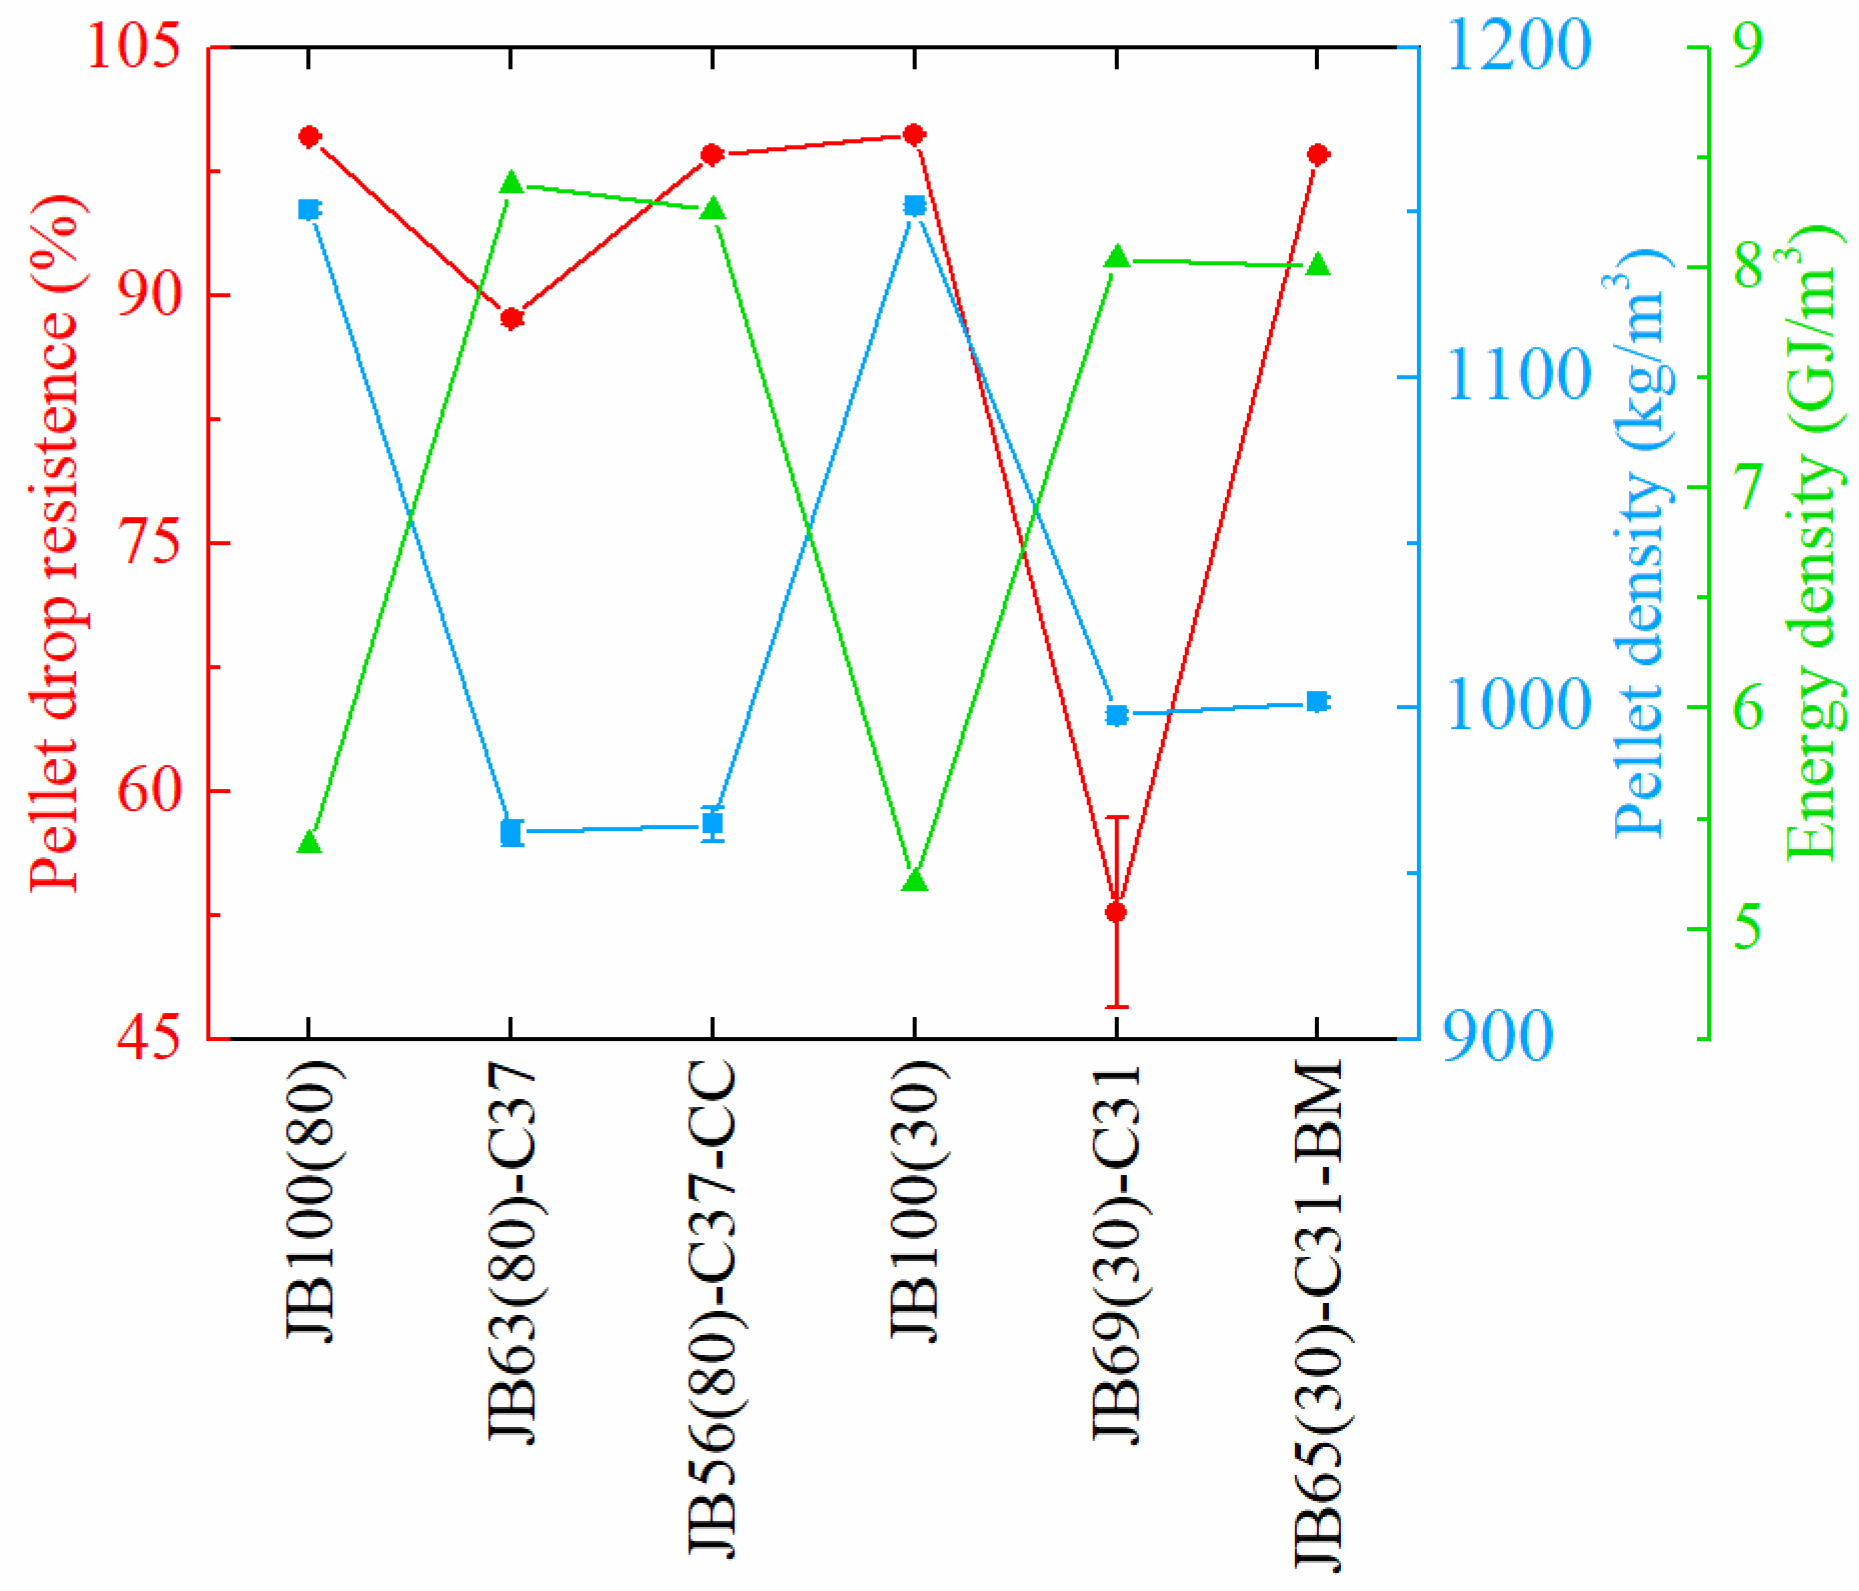
Test Results on Pellet Drop Resistance, Pellet Density, and Energy Density
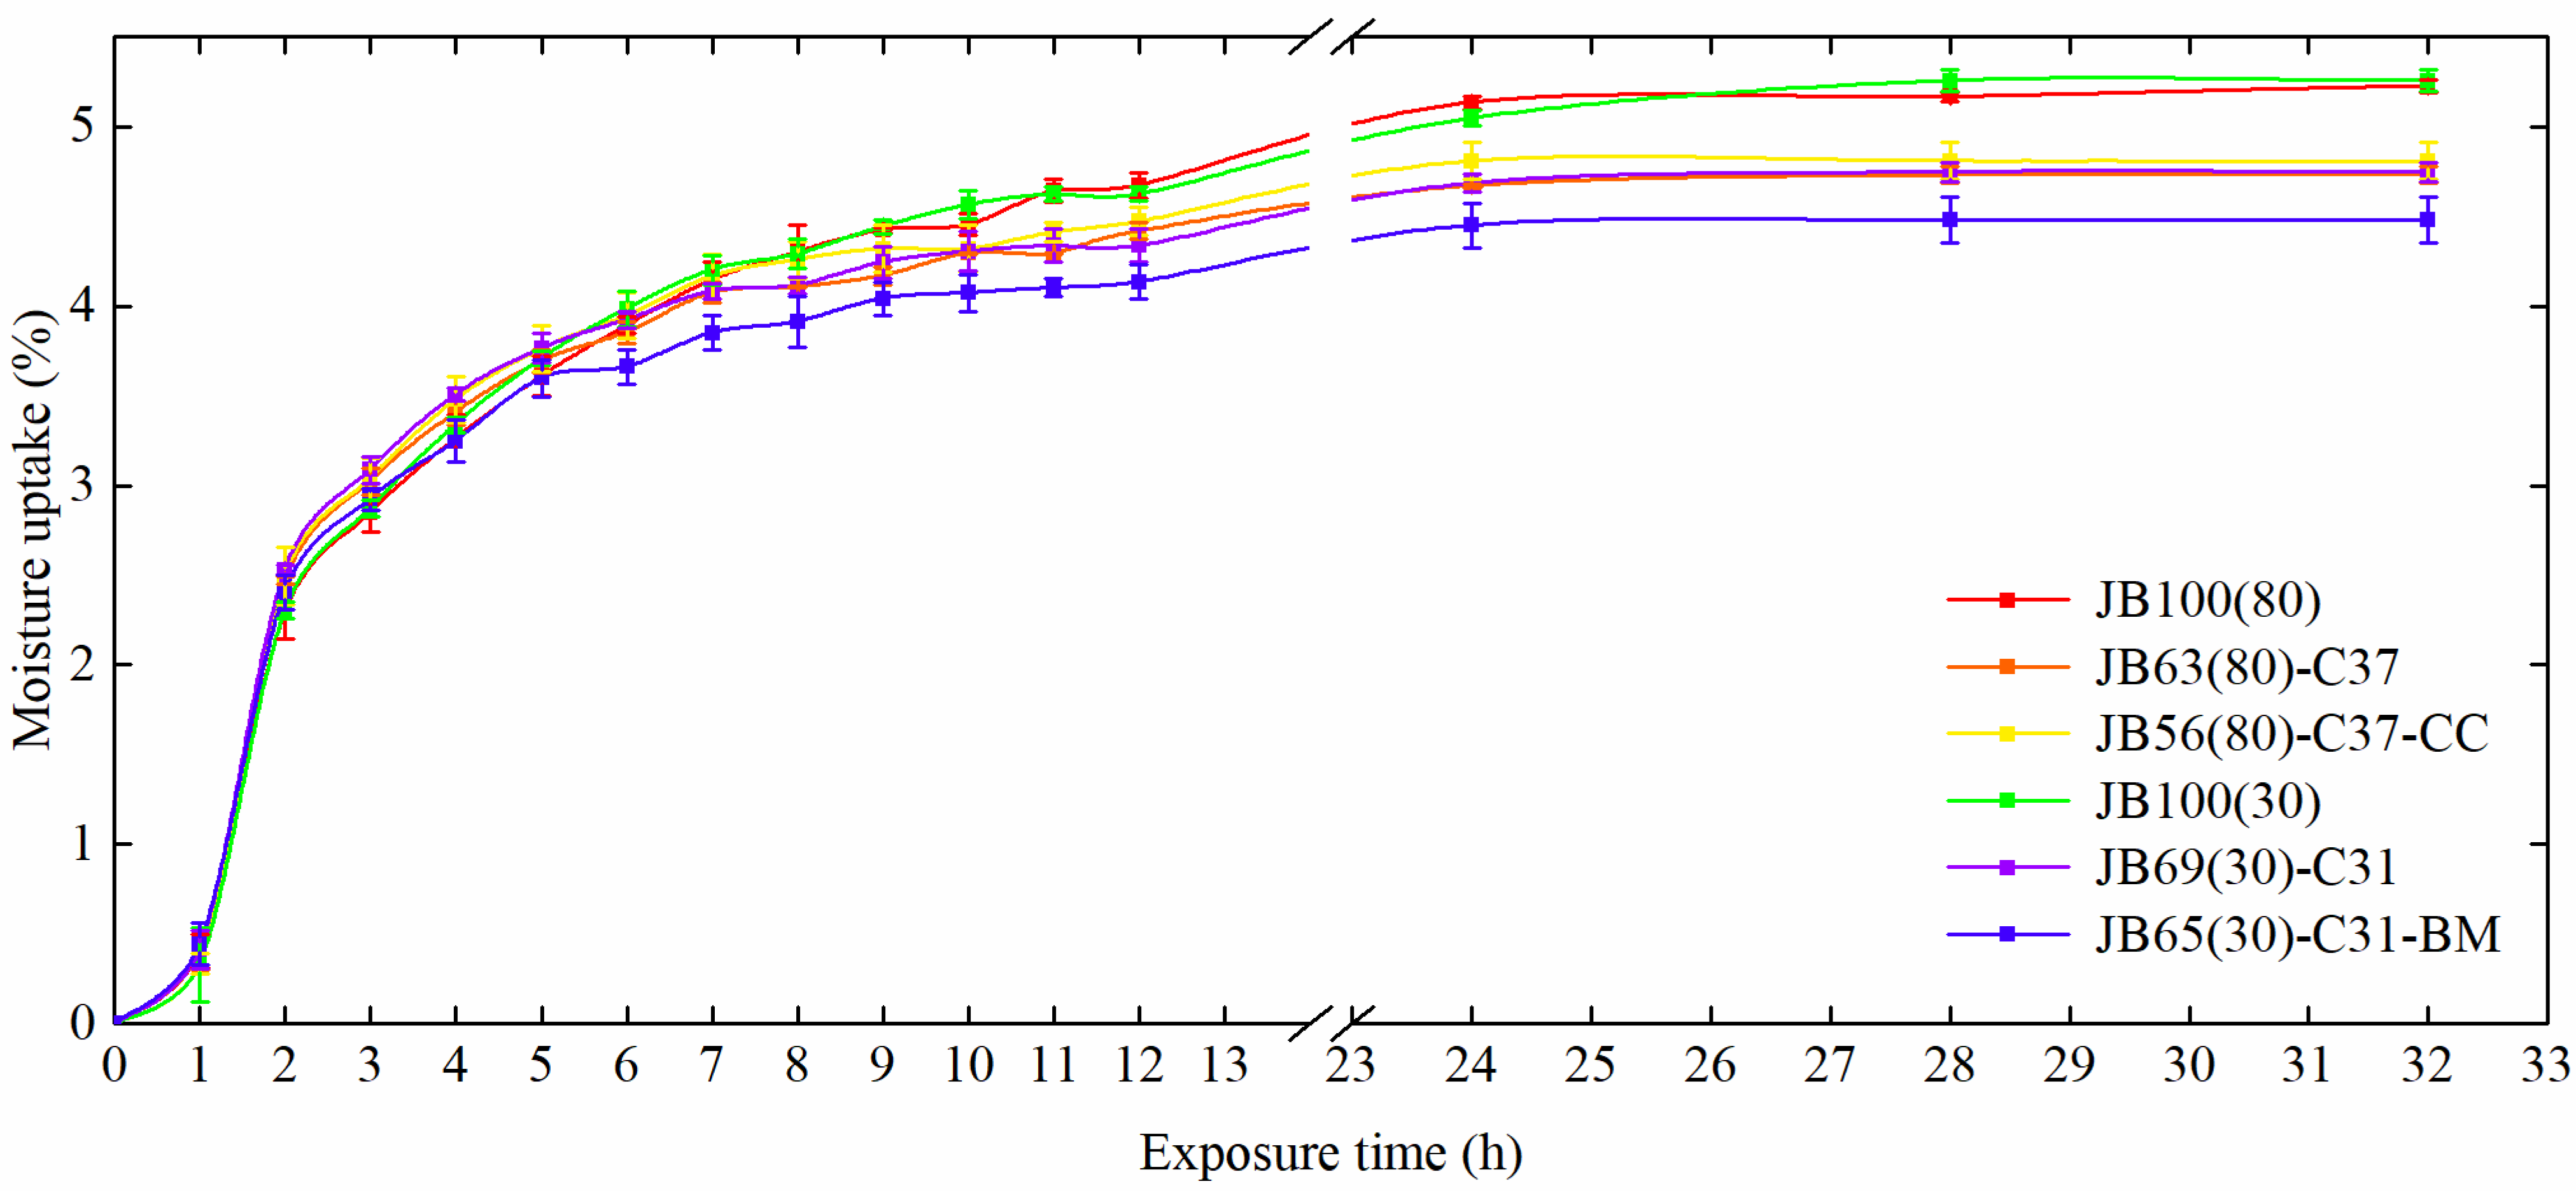
Hydrophobicity Analysis
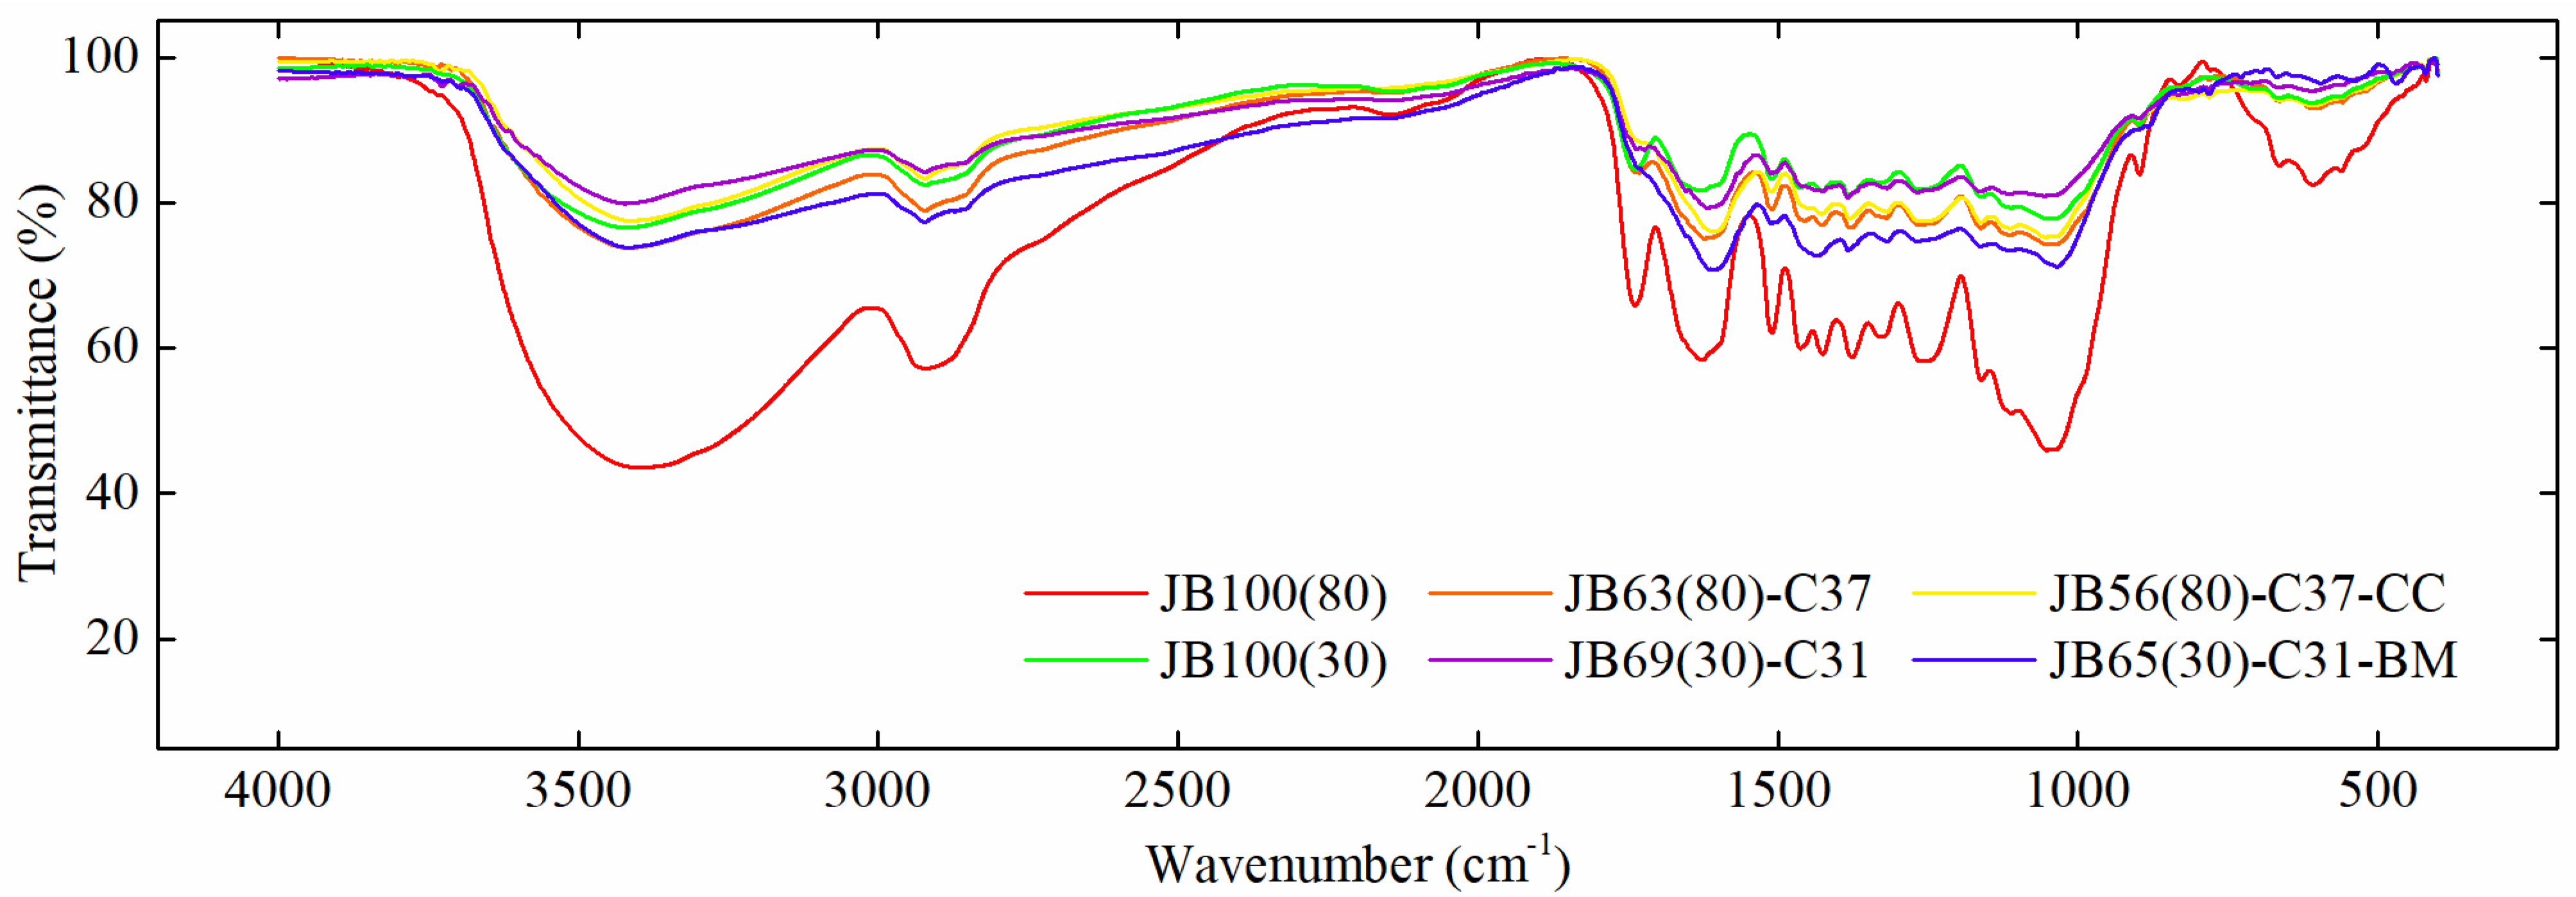
FT-IR Analysis
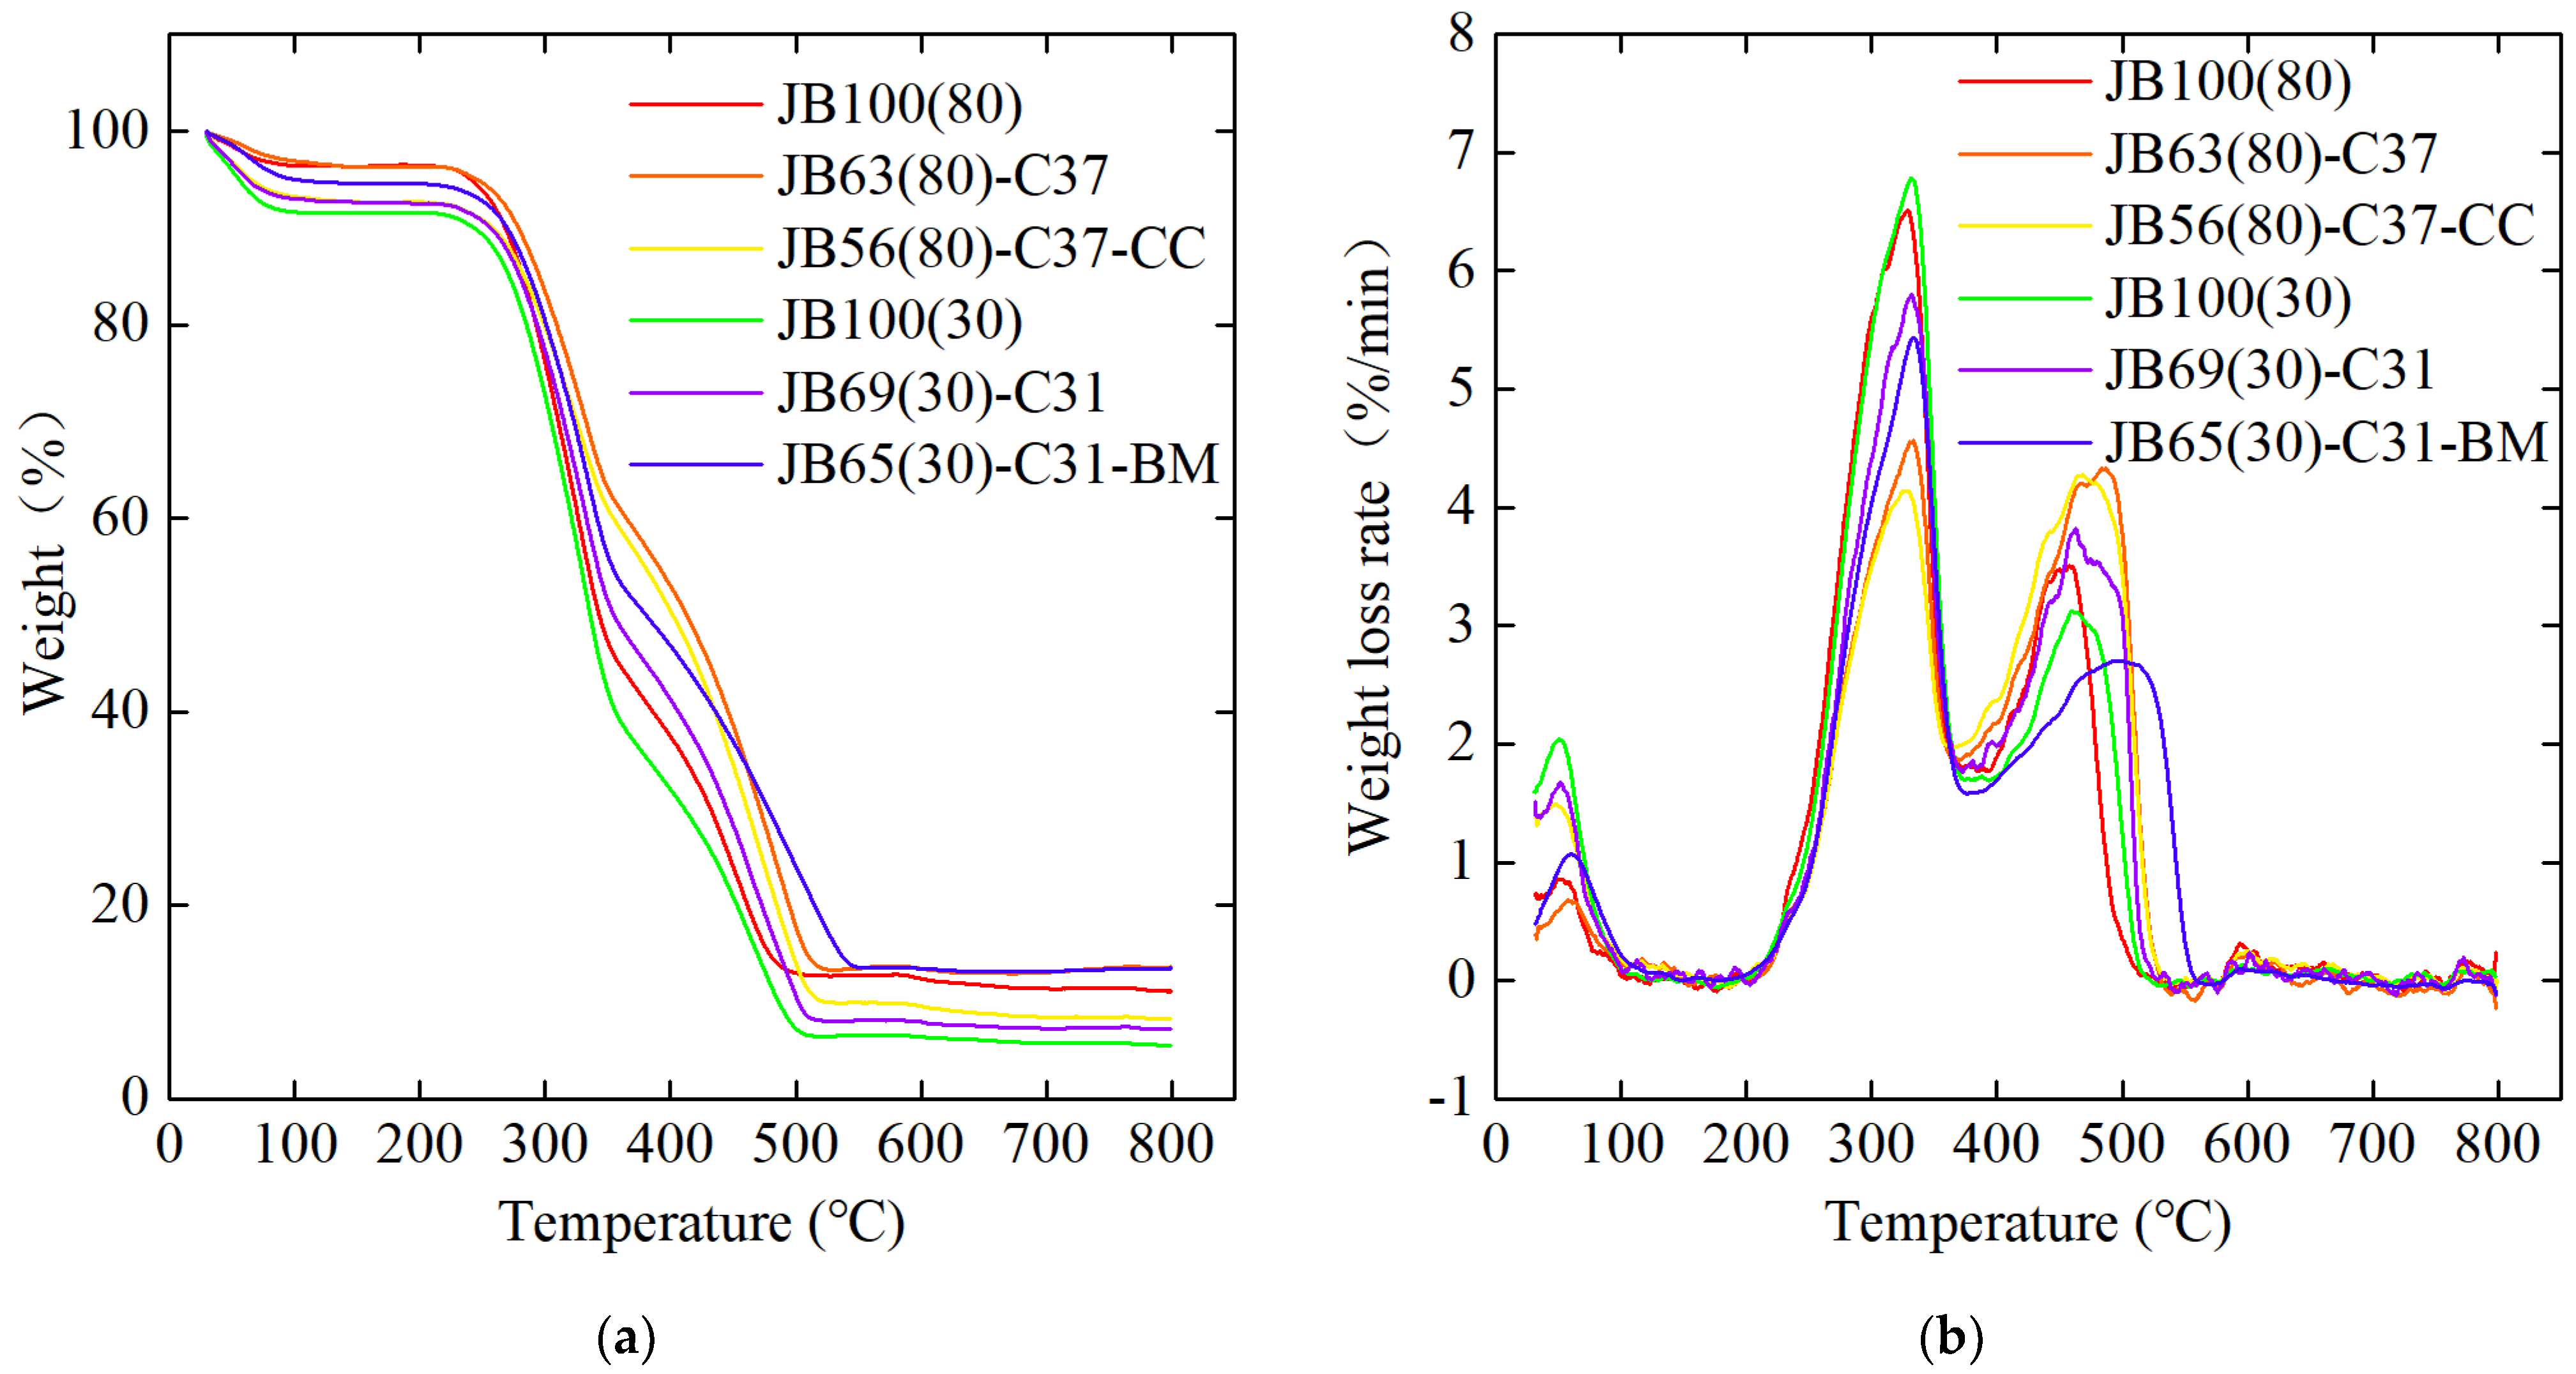
Thermogravimetric Analysis
3.3. Cost Evaluation
4. Conclusions
- (1)
- The optimized formulation of JB, JBC, CC or BM in proportion can effectively improve the combustion performance and simultaneously provide the storage and transportation performance.
- (2)
- Cost estimation showed that the two optimized formulations have significant advantages in terms of relative cost per unit energy compared to pellets made from JB alone; therefore, they have potential for commercial applications.
- (3)
- The results revealed that, in the co-densified pellet, the primary raw materials mainly contributed to forming the pellet framework, the secondary raw materials mainly contributed to improving the fuel characteristics, and the additives mainly contributed to enhancing the storage and transportation performance. All these components were found to be critical for complementarily forming the high-quality pellet.
Author Contributions
Funding
Data Availability Statement
Acknowledgments
Conflicts of Interest
References
- Martins, F.; Felgueiras, C.; Smitkova, M.; Caetano, N. Analysis of Fossil Fuel Energy Consumption and Environmental Impacts in European Countries. Energies 2019, 12, 964. [Google Scholar] [CrossRef] [Green Version]
- Rehman, A.; Rauf, A.; Ahmad, M.; Chandio, A.A.; Deyuan, Z. The effect of carbon dioxide emission and the consumption of electrical energy, fossil fuel energy, and renewable energy, on economic performance: Evidence from Pakistan. Environ. Sci. Pollut. Res. 2019, 26, 21760–21773. [Google Scholar] [CrossRef] [PubMed]
- D’Adamo, I.; Morone, P.; Huisingh, D. Bioenergy: A Sustainable Shift. Energies 2021, 14, 5661. [Google Scholar] [CrossRef]
- Xia, T.; Ji, Q.; Zhang, D.; Han, J. Asymmetric and extreme influence of energy price changes on renewable energy stock performance. J. Clean. Prod. 2019, 241, 118338. [Google Scholar] [CrossRef]
- Civitarese, V.; Acampora, A.; Sperandio, G.; Assirelli, A.; Picchio, R. Production of Wood Pellets from Poplar Trees Managed as Coppices with Different Harvesting Cycles. Energies 2019, 12, 2973. [Google Scholar] [CrossRef] [Green Version]
- Danish; Wang, Z. Does biomass energy consumption help to control environmental pollution? Evidence from BRICS countries. Sci. Total Environ. 2019, 670, 1075–1083. [Google Scholar] [CrossRef] [PubMed]
- Monarca, D.; Cecchini, M.; Colantoni, A. Plant for the production of chips and pellet: Technical and economic aspects of a case study in central Italy. In Proceedings of the International Conference on Computational Science and Its Applications, Santander, Spain, 20–23 June 2011; pp. 296–306. [Google Scholar]
- Tursi, A. A review on biomass: Importance, chemistry, classification, and conversion. Biofuel Res. J. 2019, 6, 962–979. [Google Scholar] [CrossRef]
- Picchi, G.; Lombardini, C.; Pari, L.; Spinelli, R. Physical and chemical characteristics of renewable fuel obtained from pruning residues. J. Clean. Prod. 2018, 171, 457–463. [Google Scholar] [CrossRef]
- Carter, E.; Shan, M.; Zhong, Y.; Ding, W.; Zhang, Y.; Baumgartner, J.; Yang, X. Development of renewable, densified biomass for household energy in China. Energy Sustain. Dev. 2018, 46, 42–52. [Google Scholar] [CrossRef]
- Sun, X.; Wei, X.; Zhang, J.; Ge, Q.; Liang, Y.; Ju, Y.; Zhang, A.; Ma, T.; Fang, Y. Biomass estimation and physicochemical characterization of winter vine prunings in the Chinese and global grape and wine industries. Waste Manag. 2020, 104, 119–129. [Google Scholar] [CrossRef] [PubMed]
- Alves, C.A.; Vicente, E.D.; Evtyugina, M.; Vicente, A.; Pio, C.; Amado, M.F.; Mahía, P.L. Gaseous and speciated particulate emissions from the open burning of wastes from tree pruning. Atmos. Res. 2019, 226, 110–121. [Google Scholar] [CrossRef]
- Nematian, M.; Keske, C.; Ng’Ombe, J.N. A techno-economic analysis of biochar production and the bioeconomy for orchard biomass. Waste Manag. 2021, 135, 467–477. [Google Scholar] [CrossRef] [PubMed]
- Kazimierski, P.; Hercel, P.; Suchocki, T.; Smoliński, J.; Pladzyk, A.; Kardaś, D.; Łuczak, J.; Januszewicz, K. Pyrolysis of Pruning Residues from Various Types of Orchards and Pretreatment for Energetic Use of Biochar. Materials 2021, 14, 2969. [Google Scholar] [CrossRef] [PubMed]
- Pantaleo, A.; Villarini, M.; Colantoni, A.; Carlini, M.; Santoro, F.; Hamedani, S.R. Techno-Economic Modeling of Biomass Pellet Routes: Feasibility in Italy. Energies 2020, 13, 1636. [Google Scholar] [CrossRef] [Green Version]
- Brand, M.A.; Jacinto, R.C. Apple pruning residues: Potential for burning in boiler systems and pellet production. Renew. Energy 2020, 152, 458–466. [Google Scholar] [CrossRef]
- Barbanera, M.; Lascaro, E.; Stanzione, V.; Esposito, A.; Altieri, R.; Bufacchi, M. Characterization of pellets from mixing olive pomace and olive tree pruning. Renew. Energy 2016, 88, 185–191. [Google Scholar] [CrossRef]
- Riva, L.; Wang, L.; Ravenni, G.; Bartocci, P.; Buø, T.V.; Skreiberg, Ø.; Fantozzi, F.; Nielsen, H.K. Considerations on factors affecting biochar densification behavior based on a multiparameter model. Energy 2021, 221, 119893. [Google Scholar] [CrossRef]
- Kang, K.; Qiu, L.; Sun, G.; Zhu, M.; Yang, X.; Yao, Y.; Sun, R. Codensification technology as a critical strategy for energy recovery from biomass and other resources—A review. Renew. Sustain. Energy Rev. 2019, 116, 109414. [Google Scholar] [CrossRef]
- Niu, Y.; Tan, H.; Hui, S. Ash-related issues during biomass combustion: Alkali-induced slagging, silicate melt-induced slagging (ash fusion), agglomeration, corrosion, ash utilization, and related countermeasures. Prog. Energy Combust. Sci. 2016, 52, 1–61. [Google Scholar] [CrossRef]
- Zhou, Y.; Zhang, Z.; Zhang, Y.; Wang, Y.; Yu, Y.; Ji, F.; Ahmad, R.; Dong, R. A comprehensive review on densified solid biofuel industry in China. Renew. Sustain. Energy Rev. 2016, 54, 1412–1428. [Google Scholar] [CrossRef]
- Kang, K.; Qiu, L.; Zhu, M.; Sun, G.; Wang, Y.; Sun, R. Codensification of Agroforestry Residue with Bio-Oil for Improved Fuel Pellets. Energy Fuels 2018, 32, 598–606. [Google Scholar] [CrossRef]
- Kang, K.; Zhu, M.; Sun, G.; Qiu, L.; Guo, X.; Meda, V.; Sun, R. Codensification of Eucommia ulmoides Oliver stem with pyrolysis oil and char for solid biofuel: An optimization and characterization study. Appl. Energy 2018, 223, 347–357. [Google Scholar] [CrossRef]
- Whittaker, C.; Shield, I. Factors affecting wood, energy grass and straw pellet durability—A review. Renew. Sustain. Energy Rev. 2017, 71, 1–11. [Google Scholar] [CrossRef]
- Guan, Y.; Tai, L.; Cheng, Z.; Chen, G.; Yan, B.; Hou, L. Biomass molded fuel in China: Current status, policies and suggestions. Sci. Total Environ. 2020, 724, 138345. [Google Scholar] [CrossRef]
- Zhang, Y.; Zhang, Z.; Zhou, Y.; Dong, R. The Influences of Various Testing Conditions on the Evaluation of Household Biomass Pellet Fuel Combustion. Energies 2018, 11, 1131. [Google Scholar] [CrossRef] [Green Version]
- Oguntunde, P.E.; Adejumo, O.A.; Odetunmibi, O.A.; Okagbue, H.I.; Adejumo, A.O. Data analysis on physical and mechanical properties of cassava pellets. Data Brief 2018, 16, 286–302. [Google Scholar] [CrossRef] [PubMed]
- Gao, W.; Tabil, L.G.; Liu, Q.; Zhao, R.; Zhang, M. Experimental Study on the Effect of Solid-State Fermentation on Pellet Density and Strength of Corn Stover. J. Biobased Mater. Bioenergy 2019, 13, 840–847. [Google Scholar] [CrossRef]
- Aller, D.; Bakshi, S.; Laird, D.A. Modified method for proximate analysis of biochars. J. Anal. Appl. Pyrolysis 2017, 124, 335–342. [Google Scholar] [CrossRef] [Green Version]
- Zaini, I.N.; Novianti, S.; Nurdiawati, A.; Irhamna, A.R.; Aziz, M.; Yoshikawa, K. Investigation of the physical characteristics of washed hydrochar pellets made from empty fruit bunch. Fuel Process. Technol. 2017, 160, 109–120. [Google Scholar] [CrossRef]
- Hu, Q.; Shao, J.; Yang, H.; Yao, D.; Wang, X.; Chen, H. Effects of binders on the properties of bio-char pellets. Appl. Energy 2015, 157, 508–516. [Google Scholar] [CrossRef]
- Pradhan, P.; Arora, A.; Mahajani, S.M. Pilot scale evaluation of fuel pellets production from garden waste biomass. Energy Sustain. Dev. 2018, 43, 1–14. [Google Scholar] [CrossRef]
- Kaliyan, N.; Morey, R.V. Factors affecting strength and durability of densified biomass products. Biomass Bioenergy 2009, 33, 337–359. [Google Scholar] [CrossRef]
- Shah, M.A.; Khan, M.N.S.; Kumar, V. Biomass residue characterization for their potential application as biofuels. J. Therm. Anal. Calorim. 2018, 134, 2137–2145. [Google Scholar] [CrossRef]
- Zheng, Y.; Tao, L.; Yang, X.; Huang, Y.; Liu, C.; Zheng, Z. Comparative study on pyrolysis and catalytic pyrolysis upgrading of biomass model compounds: Thermochemical behaviors, kinetics, and aromatic hydrocarbon formation. J. Energy Inst. 2019, 92, 1348–1363. [Google Scholar] [CrossRef]
- Fan, M.; Li, C.; Sun, Y.; Zhang, L.; Zhang, S.; Hu, X. In Situ characterization of functional groups of biochar in pyrolysis of cellulose. Sci. Total Environ. 2021, 799, 149354. [Google Scholar] [CrossRef] [PubMed]
- Apaydın-Varol, E.; Pütün, A.E. Preparation and characterization of pyrolytic chars from different biomass samples. J. Anal. Appl. Pyrolysis 2012, 98, 29–36. [Google Scholar] [CrossRef]
- El-Hendawy, A.-N.A. Variation in the FTIR spectra of a biomass under impregnation, carbonization and oxidation conditions. J. Anal. Appl. Pyrolysis 2006, 75, 159–166. [Google Scholar] [CrossRef]
- Zçimen, D.; Ersoy-Meriçboyu, A. Characterization of biochar and bio-oil samples obtained from carbonization of various biomass materials. Renew. Energy 2010, 35, 1319–1324. [Google Scholar] [CrossRef]
- Cao, J.; Xiao, G.; Xu, X.; Shen, D.; Jin, B. Study on carbonization of lignin by TG-FTIR and high-temperature carbonization reactor. Fuel Process. Technol. 2013, 106, 41–47. [Google Scholar] [CrossRef]
- El-Sayed, S.A.; Ismail, M.A.; Mostafa, M.E. Thermal decomposition and combustion characteristics of biomass materials using TG/DTG at different high heating rates and sizes in the air. Environ. Prog. Sustain. Energy 2019, 38, 13124. [Google Scholar] [CrossRef]
- Kok, M.V.; Ozgur, E. Characterization of lignocellulose biomass and model compounds by thermogravimetry. Energy Sources Part A Recover. Util. Environ. Eff. 2017, 39, 134–139. [Google Scholar] [CrossRef]
- Kong, L.; Xiong, Y.; Liu, T.; Tu, Y.; Tian, S.; Sun, L.; Chen, T. Effect of fiber natures on the formation of “solid bridge” for preparing wood sawdust derived biomass pellet fuel. Fuel Process. Technol. 2016, 144, 79–84. [Google Scholar] [CrossRef]
- Chen, W.-H.; Peng, J.; Bi, X.T. A state-of-the-art review of biomass torrefaction, densification and applications. Renew. Sustain. Energy Rev. 2015, 44, 847–866. [Google Scholar] [CrossRef]
- Peng, J.H.; Bi, H.T.; Lim, C.J.; Sokhansanj, S. Study on Density, Hardness, and Moisture Uptake of Torrefied Wood Pellets. Energy Fuels 2013, 27, 967–974. [Google Scholar] [CrossRef]
- Duca, D.; Riva, G.; Pedretti, E.F.; Toscano, G. Wood pellet quality with respect to EN 14961-2 standard and certifications. Fuel 2014, 135, 9–14. [Google Scholar] [CrossRef]
- Rumpf, H. The strength of granules and agglomerates. In Agglomeration, Proceedings of the First International Symposium on Agglomeration, Philadelphia, PA, USA, 12–14 April 1961; John Wiley & Sons: New York, NY, USA, 1962; pp. 379–418. [Google Scholar]
- Grover, P.; Mishra, S. Biomass Briquetting: Technology and Practices; Food and Agriculture Organization of the United Nations: Bangkok, Thailand, 1996; Volume 46. [Google Scholar]
- Chen, Y.; Liu, B.; Yang, H.; Yang, Q.; Chen, H. Evolution of functional groups and pore structure during cotton and corn stalks torrefaction and its correlation with hydrophobicity. Fuel 2014, 137, 41–49. [Google Scholar] [CrossRef]


| Sample Name | Proximate Analysis (ar a, wt%) | ||||
|---|---|---|---|---|---|
| MC b | VM | ASH | FC | ||
| JB c | 5.45 ± 0.62 | 84.53 ± 0.59 | 1.84 ± 0.23 | 8.19 ± 0.62 | |
| JBC | 2.45 ± 1.16 | 38.13 ± 0.97 | 4.37 ± 0.04 | 55.05 ± 1.16 | |
| CC | 5.36 ± 0.88 | 61.28 ± 0.38 | 15.21 ± 0.81 | 18.15 ± 0.88 | |
| BM | 0.72 ± 0.23 | 17.37 ± 0.10 | 81.90 ± 0.23 | 0.01 ± 0.23 | |
| Sample Name | Ultimate Analysis (ar, wt%) | ||||
| N | C | H | O | S | |
| JB | 5.75 | 50.41 | 6.11 | 35.85 | 0.48 |
| JBC | 1.81 | 42.61 | 7.80 | 46.20 | 0.44 |
| CC | 2.15 | 44.74 | 6.08 | 44.40 | 0.16 |
| BM | 2.86 | 37.84 | 8.13 | 47.82 | 0.89 |
| Sample Name | HHV d (MJ/kg) | Bulk Density (kg/m3) | Energy Density (GJ/m3) | ||
| JB | 18.67 | 250 | 4.67 | ||
| JBC | 31.84 | 490 | 15.60 | ||
| CC | 17.45 | 140 | 2.44 | ||
| BM | 2.93 | 950 | 2.78 | ||
| Parameter Range Screening Tests | Group Number | Factor | Level | ||||
| 1 | JBC a content (wt%) | 0 | 10 | 20 | 30 | 40 | |
| 2 | JB particle size (mesh) | 10 | 20 | 30 | 80 | - | |
| 3 | Additive type | CC b | BP | UW | CG | - | |
| Pellet Formulation Optimization Tests | Total Number | Factor | Level | ||||
| 27 | JBC content (wt%) | 25 | 30 | 35 | |||
| JB particle size (mesh) | 20 | 30 | 80 | ||||
| Additive type | CC | BM | UW | ||||
| Additive content (wt%) | 10 | 7 | 4 | ||||
| Pellet Formulation Comparison Tests | Sample Name | Formula Parameters | |||||
| JBC Content (wt%) | JB ParticleSize (mm) | Additive Type | Additive Content (wt%) | ||||
| JB100(80) c | - | <0.18 | - | - | |||
| JB63(80)-C37 | 37 | <0.18 | - | - | |||
| JB56(80)-C37-CC | 37 | <0.18 | CC | 7 | |||
| JB100(30) | - | 0.60–0.18 | - | - | |||
| JB69(30)-C31 | 31 | 0.60–0.18 | - | - | |||
| JB65(30)-C31-BP | 31 | 0.60–0.18 | BM | 4 | |||
| Source | Sum of Squares Ⅲ | DF | Mean Square | F | P |
|---|---|---|---|---|---|
| Modified model | 3478.553 a | 26 | 133.790 | 9.359 | 0.00000 |
| Intercept | 759194.670 | 1 | 759194.670 | 53105.501 | 0.00000 |
| A: JBC b content (wt%) | 437.407 | 2 | 218.704 | 15.298 | 0.00001 |
| B: JB particle size (mm) | 2.000 | 2 | 85.588 | 5.987 | 0.00448 |
| C: Additive type | 296.903 | 2 | 148.451 | 10.384 | 0.00015 |
| D: Additive content (wt%) | 163.104 | 2 | 81.552 | 5.705 | 0.00565 |
| AB | 208.997 | 2 | 104.498 | 7.310 | 0.00155 |
| AC | 344.141 | 2 | 172.070 | 12.036 | 0.00005 |
| AD | 245.629 | 2 | 122.814 | 8.591 | 0.00058 |
| BC | 221.672 | 2 | 110.836 | 7.753 | 0.00110 |
| BD | 222.472 | 2 | 111.236 | 7.781 | 0.00107 |
| CD | 212.987 | 2 | 106.493 | 7.449 | 0.00139 |
| Error | 771.982 | 54 | 14.296 | ||
| Total | 763445.205 | 81 | |||
| Adjusted sum | 4250.535 | 80 |
| Raw Materials | Purchase Price (yuan) | Purchase Specifications (g) | Unit Price (Yuan/g) | Relative Content (%) | Raw Materials Relative Unit Cost |
|---|---|---|---|---|---|
| JB(30) a | 3.00 | 500 | 0.006 | 24.59 | 1.000 |
| JB(80) | 3.00 | 500 | 0.006 | 19.82 | 1.241 |
| JBC | 32.04 | 2500 | 0.013 | 98.69 | 0.532 |
| CC | 11.39 | 2800 | 0.004 | 79.69 | 0.209 |
| BM | 10.32 | 1000 | 0.010 | 98.90 | 0.428 |
| Sample | Content | Relative Unit Cost | Relative Unit Energy Density | Relative Cost per Unit Energy | ||||
|---|---|---|---|---|---|---|---|---|
| JB(30) | JB(80) | JBC | CC | BP | ||||
| JB100(80) a | 0.00 | 1.00 | 0.00 | 0.00 | 0.00 | 1.24 | 1.03 | 1.20 |
| JB63(80)-C37 | 0.00 | 0.63 | 0.37 | 0.00 | 0.00 | 0.98 | 1.61 | 0.61 |
| JB56(80)-C37-CC | 0.00 | 0.56 | 0.37 | 0.07 | 0.00 | 0.91 | 1.58 | 0.57 |
| JB100(30) | 1.00 | 0.00 | 0.00 | 0.00 | 0.00 | 1.00 | 1.00 | 1.00 |
| JB69(30)-C31 | 0.69 | 0.00 | 0.31 | 0.00 | 0.00 | 0.85 | 1.54 | 0.55 |
| JB65(30)-C31-BM | 0.65 | 0.00 | 0.31 | 0.00 | 0.04 | 0.83 | 1.53 | 0.54 |
Publisher’s Note: MDPI stays neutral with regard to jurisdictional claims in published maps and institutional affiliations. |
© 2021 by the authors. Licensee MDPI, Basel, Switzerland. This article is an open access article distributed under the terms and conditions of the Creative Commons Attribution (CC BY) license (https://creativecommons.org/licenses/by/4.0/).
Share and Cite
Li, Y.; Kang, K.; Wang, W. Quality Improvement and Cost Evaluation of Pellet Fuel Produced from Pruned Fruit Tree Branches. Energies 2022, 15, 113. https://doi.org/10.3390/en15010113
Li Y, Kang K, Wang W. Quality Improvement and Cost Evaluation of Pellet Fuel Produced from Pruned Fruit Tree Branches. Energies. 2022; 15(1):113. https://doi.org/10.3390/en15010113
Chicago/Turabian StyleLi, Yining, Kang Kang, and Wei Wang. 2022. "Quality Improvement and Cost Evaluation of Pellet Fuel Produced from Pruned Fruit Tree Branches" Energies 15, no. 1: 113. https://doi.org/10.3390/en15010113