1. Introduction
The contemporary development of propulsion systems concerns mostly the search for new technologies in the field of vehicle propulsion sources. Over the hundred years of its history, motorization has always faced challenges related to the user demands and the ongoing economic situation. Internal combustion engines powered by hydrocarbon fuels obtained from fossil sources have become the basic power units in the global automotive industry.
Lively discussions are regularly taking place at different levels regarding the environmental impacts of transport. This aspect cannot be overlooked, nor can its importance; it is central various sides of the discussion. The social awareness of this problem continues to grow, impacting how the future of transport is being shaped today. According to the European Environment Agency, transport in 2017 was responsible for 27% of all greenhouse gas emissions in Europe—2.2% more than in the year prior [
1]. Other reasons for the development of modern propulsion sources include striving to reduce energy consumption for vehicle propulsion, as well as the increasingly stringent exhaust emission norms and regulations [
2].
Dual indirect injection (PFI-PFI) systems are generally well known; however, they are mainly used to deliver a single fuel type simultaneously (mainly in motorcycle engines) or in the classic configuration of an engine powered by unleaded gasoline with an additional LPG fueling system.
There are many fuel injection solutions implemented in the PFI-DI system. The most common are diesel (DI) and natural gas (PFI) injection systems [
3,
4,
5,
6,
7]. By comparing the observed impacts of using diesel oil (DI) and natural gas (PFI), the overall efficiency of the engine was found to have increased by 5–8% [
3]. In [
4], it was found that the gas fuel does not combust completely in dual-fuel engines. This is mainly due to the fact that the combustion reaction does not involve the entire dose of this fuel. The best combustion conditions were obtained with an excess air coefficient λ of about 2. In the studies on exhaust emissions [
5,
6], it was found that the number of solid particles in the average diameter range was approximately 2 times smaller in the dual-fuel supply system than in the case of diesel fuel alone. Such results were obtained regardless of the engine load value. Work carried out by You et al. [
7] confirmed that the fuel mixture quality has a significant impact on the combustion quality and the emissions of exhaust components (including the timing of the gas injection in relation to the crankshaft angle and the injection direction in relation to the inlet duct).
Multiparameter research results on methane and diesel fuel combustion were analyzed in [
8]. In that paper, the effects of the premixed ratio, injection pressure, and fuel doses in relation to the engine efficiency were assessed. The experimental results were compared with the simulation results. Additionally, the exhaust emission assessment was presented in relation to the energy distribution in the engine, taking into account the range of losses in the combustion and exhaust. It was found that with appropriate system settings (especially in terms of injection timing settings), it was possible to obtain a 2–3.5% increase in the indicated efficiency of the engine.
A study of dual-fuel systems for the combustion of diesel oil and ethanol was conducted by Beatrice et al. [
9]. The obtained results indicated a significant reduction in the exhaust emissions of PM and CO
2 from a dual-fuel engine compared to a regular engine running on diesel fuel (despite the acceptable higher HC and CO emission values).
A number of dual-fuel solutions also exist for spark ignition engines, including gasoline (DI) and ethanol (PFI) [
10], or in reverse configuration [
11], gasoline (PFI) and diesel oil (DI) [
12], gasoline (DI) and LPG (PFI) [
13], gasoline (DI or PFI) and hydrogen (PFI or DI) [
2], and methanol (DI) and hydrogen (PFI) [
14]. Work has also been carried out using other fuels with the above-mentioned injection systems for these fuels [
15,
16].
The existing solutions for the injection of gasoline and ethanol mainly involve mixtures of E85 (85% ethanol and 15% gasoline) and E15 (85% gasoline and 15% ethanol), as used by Benajes et al. [
17]. Information from research on dual-fuel direct injection systems for gasoline and ethanol is also available in the literature, such as in the research conducted by Kang et al. [
18]; these analyses, however, include fuel supply with a stoichiometric mixture. Studies have shown that increasing the proportion of ethanol reduces CoV(IMEP). In the absence of ethanol, this ratio was approximately 4%. Increasing the proportion of ethanol to 10% resulted in a 50% reduction in CoV(IMEP). A further increase in the share of ethanol allowed for this indicator to be reduced down to the level of 1–1.5% (with the permissible limit of 1.5%).
Dual-fuel direct injection systems currently involve a number of combinations, among which are the injection of methanol and diesel fuel [
19], as well as n-butanol in combination with biodiesel [
20]. In studies conducted by Dong et al. [
19], analyses of methanol injection (with the injector located centrally in the cylinder) and diesel fuel (in a non-axial position) were performed. Changes in the excess air coefficient were not analyzed, however. The research investigated the notion of replacing diesel fuel with methanol in the dose range of 45% to 95%.
In the work by Ning et al. [
21] from 2020, there were 10 additional publications on direct injection of two fuels: diesel oil and methanol, indicating a high potential of these fuels for use in dual-fuel systems with direct injection.
Despite considerable design challenges, Long et al. [
22] used a dual direct injection system in a compression–ignition engine. This solution uses a premixed dose system prepared by the main preinjection blended fuels of diesel and ethanol–gasoline—the system was called the jet controlled compression ignition (JCCI). The typical compression chamber of the diesel engine was replaced with a flat chamber to fit the premixed combustion mode. The fuel used was a mixture of gasoline and ethanol with diesel fuel constituting 15% (D15) or 30% (D30) share by mass. The injection system was equipped with two independently driven fuel injection pumps. The fuel injection pressure in the pre and main injection systems was maintained at 60 MPa (in the case of an engine load rising above 50%, the fuel injection pressure was increased to its maximum value of 90 MPa). Diesel oil was supplied by the central injector (the fuel injection direction corresponded to the piston movement axis). Mixture D15 or D30 was injected into the chamber with an injector placed at a 10 degree angle. The experimental results and analysis demonstrated that the fuel JCCI mode with the dual direct injection strategy could effectively and robustly control the combustion and emissions in premixed combustion mode.
Similar studies were also conducted by Huang et al. [
23]. Direct injection of two fuels was used in their study, namely methanol and biodiesel. The tests were carried out in a combustion system called an intelligent charge compression ignition (ICCI) system. This combustion mode was proposed to allow flexible stratification of the concentration and reactivity with the best gradient according to the engine operating conditions. In ICCI mode, most of the low-reactivity fuel is directly injected during the intake stroke with single or multiple stage split injection. Then, the rest of the low-reactivity and high-reactivity fuels are directly injected in succession to establish crossed stratification of the equivalence ratio and reactivity in the cylinder.
An internal combustion engine was fueled with hydrogen and diesel oil in a hydrogen–diesel dual direct injection (H2DDI) system was presented by Liu et al. [
24]. Hydrogen was injected into the cylinder at a pressure of 20 MPa and diesel fuel at 100 MPa. The research resulted in the following conclusions:
Direct injection of hydrogen into the cylinder induced up to a 10% increase in the end-of-compression pressure, which is associated with additional compression work. At later injection timings, this effect is less pronounced;
Under the same conditions of this study, the shape of the apparent heat release rate (aHRR) resembles that of the baseline diesel combustion, except when hydrogen is injected late, resulting in insufficient time for mixing, in which case slower aHRR indicative of hydrogen mixing and controlled combustion will be observed.
The dual direct fuel injection systems presented so far do not include gasoline together with other light fuels besides ethanol. For this reason, the authors extended the above systems to include the combustion of other fuels that serve as substitutes for gasoline. The new knowledge presented by the authors in this article is conceptof the system, which shows different aspects from the systems used in the literature. Importantly, it contains precisely defined angular positions for the injectors. These result from the shape of the flowing stream, which moves towards the spark plug. Such a concept in a spark ignition engine, in addition to dual-fuel combustion, also allows the excess air ratio in the vicinity of the spark plug to be effectively controlled.
2. Experiment Method
2.1. Combustion System Concept
The dual-fuel direct injection combustion system was based on the concept of creating stratified mixtures in the combustion chamber. As is the case in single-fuel systems with spark ignition, efforts were made to ensure its stoichiometric composition in the vicinity of the spark plug [
25]. Scientific analyzes of these phenomena, discussed in the previous chapter, help validate this direction of development of mixture formation systems. The use of a second fuel, supplied directly into the cylinder using a separate injector, plays into the concept of the active formation of a stoichiometric mixture in the vicinity of the spark plug (where the global value of this coefficient in the combustion chamber may be much greater than one).
The use of dual direct injection allows the selection of any possible composition of the fuel mixture for each engine cycle. Controlling the dosages of both fuels allows an individual mixture composition to be created in the combustion chamber each time. The resultant value of the excess air coefficient λ depends on the specific fuel doses and the type of fuels used.
As a result of the above procedures, it is possible to control the ignitability of the mixture by adjusting its chemical composition—the quantitative ratio of the supplied fuels. The variable value of the coefficient λ in the vicinity of the spark plug also extends the possibility of controlling the reactivity of the resulting mixture. It also allows selection of the dose depending on the expected effective pressure, exhaust emissions, resistance to knocking, and other effects related to combustion.
2.2. Fuel Selection
It was assumed that liquid (light) hydrocarbon fuels would be used in this research. Due to the growing interest in unconventional fuels (heptane, butanol), a more arbitrary selection of fuels was made, also taking into account their use in research, as shown in the previous chapter. Petrol was the reference fuel and alternative fuels included ethanol (C
2H
6O), n-heptane (C
7H
16), and n-butanol (C
4H
10O). The physical properties of the analyzed fuels are listed in
Table 1.
Each fuel has different values of air for the stoichiometric mixture, as well as different values of the mass of carbon dioxide resulting from the complete combustion of a given volume of fuel (
Table 2).
According to the Spindt formula, extended by Bresenham et al. [
27] to enable calculations for fuels containing oxygen in terms of their chemical composition, the stoichiometric excess air coefficient is calculated as follows:
where y and z are indices of the generalized chemical composition of the fuel (or fuel mixture), the summary formula of which can be denoted as CH
yO
z.
Daniel et al. [
28] proposed calculating the excess air coefficient for two different fuels using the weighted average (where the weight is the mass of the fuel dose):
where ma is the air mass for fuel doses for complete combustion, mp1 is the dose mass of the first fuel type, L
st_p1 is the value of the air required for the combustion of 1 kg of the first fuel, m
p2 is the mass of the second fuel dose, and L
st_p2 is the value of air required for the combustion of 1 kg of the second fuel.
The relation (2) shows that the excess air coefficient can assume different values for the same air mass ma by appropriately selecting fuel doses 1 and 2 with different stoichiometric excess air coefficients.
The share of energy E
p of each fuel can be determined using:
where m
p1 and m
p2 are the respective masses of each fuel, while W
op is their calorific value.
The above considerations lead to the conclusion that it is possible to shape the global excess air coefficient in the combustion chamber in a so-called qualitatively extended way, i.e., the change in λ is possible to obtain by changing the fuel dose or by changing the proportions of fuels supplied directly to the combustion chamber. This approach means changing the global excess air coefficient, while at the same time also changing its local values. This tendency to alter the combustion process was the basis for further experimental work.
The experimental work was carried out in terms of assessing the effects of such modifications, as it was not possible to determine the local values of the excess air coefficient in the chamber.
2.3. Research Method
The combustion process was tested with the use of (i) indicator methods and (ii) optical methods. Indication of the engine consisted of simultaneous registration of the pressure curve inside the combustion chamber along with the position of the piston in the cylinder. The recording of these characteristics enables quantification of the energy values of the combustion process. These values are the combustion pressure, the rate of pressure build-up after ignition, and the heat release rate.
The fuel combustion process has a very direct and specific impact on the process of heat release (its release rate—dQ), which was determined based on the following relationship (without taking into account the heat transfer and with the constant polytropic index value):
where the average value of the polytropic index was assumed as κ = 1.32 and the indices n and n + 1 denote the current and the next pressure value in the cylinder (P) or the corresponding cylinder volume (V).
The fuel combustion process in a rapid compression machine was simultaneously subjected to optical and indicator measurements. The observation of the flame development made it possible to quantify the overall volume taken up by the flame field in the observed projection of the combustion chamber. The dynamics of the flame development observed with the optical method can be correlated with the thermodynamic indicators concerning combustion recorded with the indicator methods.
Due to the specific nature of the research in which the RCM was used, the engine indicators characterizing the operation of a typical internal combustion engine were not analyzed. The scope of work performed should be considered fundamental research. The combustion process was analyzed in the context of the initial phase, involving the formation of a combustible mixture, ignition and the initial development of the flame. For this reason, no tests related to heat transfer, energy balance, or measurement of exhaust emissions (which are difficult to obtain with a rapid compression machine) were performed. The works on energy and exergy analysis carried out by Kul and Kahraman [
29] were based on an internal combustion engine. Similarly, the determination of heat losses applies mainly to engine tests (e.g., [
8]). The use of RCM with only partial work strokes does not allow results to be obtained that would be qualitatively comparable. The above considerations limited this type of research.
2.4. Test Objects
The literature analysis of the design solutions for injector placement in the combustion chamber [
30,
31,
32,
33,
34] showed that the position of the injector in relation to the spark plug depends on the injector type:
In the present test cases, the angular position of the injector in relation to the spark plug was assumed to be at 22 degrees (due to using outward-opening injectors in the tests).
The layout of the finished head of a rapid compression machine with two mounted injectors is shown in
Figure 1.
Piezoelectric injectors with a hollow cone-shaped stream of injected fuel were used in the research. The injector needle allows fuel flow by extending slightly outside the injector (outward-opening design). The technical data for the injector are presented in
Table 3.
Achieving the research objective required the use of a fuel supply system for two different fuels. Hence, it was necessary to build such a system. The injection system used two high-pressure injection pumps from the BMW M4 GTS vehicle model. The original system was modified by disconnecting the pipe connecting the two pumps, which made it possible to use both pumps independently, and thus to use two different fuels.
The test stand (
Figure 2) was equipped with one drive system for the two high-pressure injection pumps, each of which can generate a different fuel pressure value.
A rapid compression machine was used to test the combustion process (
Figure 3). The test represented a physical model of a combustion chamber in a reciprocating engine, in which phenomena occur under transient thermodynamic conditions. The moving piston of the machine had a pneumatic drive. The piston of the machine was translucent, which enabled optical observation and registration of phenomena occurring in the combustion chamber. Technical specifications of the RCM are presented in
Table 4.
A LaVision High Speed Star 5 camera was used to record the images of the combustion process. Image recording was performed at a frequency of f = 10 kHz with an AF Nikkor 50 mm with a 1:14D fixed focal length lens.
Indicator tests consisted of simultaneous recording of the pressure inside the RCM combustion chamber and the position of the piston. The combustion pressure signal was recorded using an AVL GM11D sensor (0–25 MPa; 18.84 pC/bar) integrated with the M12 spark plug. The piston position signal was read from a linear position sensor (Megatron LSR 150 ST R5k SR with a range of 150 mm and a resolution of 0.01 mm) coupled with the piston of the rapid compression machine.
Synchronization of the injection of various fuels, the piston movement, the opening and closing of the machine’s solenoid valves, and the starting of the camera and the indicators system was ensured by the HardSoft HSD V711 sequencer system.
3. Fuel Combustion in a Dual-Fuel System
3.1. Test Conditions
Experimental combustion studies were aimed at confirming the possibility of controlling the mixture preparation and combustion processes for various fuel mixtures.
Combustion tests were carried out in two research groups:
In each research variant, the same dose of energy in the form of fuel was supplied to the combustion chamber as determined using the calorific value of the fuels used. The injector opening time was calculated based on the fuel density and the flow characteristics of the injectors. For the gasoline dose, the basic duration taken to one injector was set at t = 300 µs, and this data point was treated as a reference value for other fuels. The resulting injection times for the analyzed fuels are presented in
Table 5.
Each time, a dose of chemical energy of about 1943 J was delivered to the combustion chamber (the equivalent of two single doses from both injectors). This value was used to further evaluate the combustion process efficiency.
Having determined doses for each fuel, the values of the excess air coefficient during combustion were also determined. The air mass m delivered to the cylinder was determined using the Clapeyron equation:
where P is the cylinder pressure at volume V, R is the gas constant, and T is the dose temperature.
Taking the values for the time t = 0 (Vcyl = 462.9 cm3) as the baseline for the calculations, the value of the air pressure (P = 0.9 bar) was determined (based on the data from the cylinder pressure curve, analyzed later in the article), which was compared to the absolute values (the pressure sensor shows overpressure values in relation to the ambient conditions). Assuming R = 287 J/(kg K) and T = 20 °C and using Equation (5), the air mass m = 1011 mg was determined.
Using Equation (2) describing the excess air coefficient for the fuel mixture and the data from
Table 5, the global values of the excess air coefficient were determined for the analyzed mixtures. The results of these calculations are included in
Table 6.
Combustion tests were carried out for all configurations listed at the beginning of
Section 3.1. A full presentation is provided in
Figure 4.
Each experiment was repeated three times. A single representative variant was selected for the analysis, for which the maximum combustion pressure value was obtained. These values and their greatest percentage deviations are listed in
Table 7.
In three cases, the deviation of the relative maximum pressure values exceeded 10%, however the quality of the results was considered to be sufficient for further analysis.
3.2. Analysis of the Indicator Values (for the Combustion of Gasoline with Other Fuels)
Indicator tests carried out with the use of a rapid compression machine included the simultaneous measurement of the pressure curve in the combustion chamber and the piston position during the combustion process. Based on these values, it was possible to analyze the value of the maximum pressure, the rate of pressure increase after ignition, the heat release rate, and the total released heat.
The time characteristics of pressure inside the combustion chamber during the experiments for gasoline with various fuels are given in
Figure 5.
The cylinder pressure characteristics during combustion show that the type of alternative fuel supplied into the chamber for combustion with gasoline affected the resulting maximum pressure value; each alternative fuel increased the pressure value compared to pure gasoline combustion. Additionally, the use of n-butanol delays the moment when the maximum pressure is reached by the burning mixture.
The indicated combustion pressure curves point to a similar combustion rate (similar values of the curve slope after ignition), however they also indicate different combustion conditions. Despite providing the same amount of energy in the injected fuel doses, different Pmax values were observed. The maximum difference was found to be ΔPmax = 13%.
The heat release rate for the four tested experimental cases was shown in
Figure 6a. Additionally, in the case of the heat release rate, there was a noticeable tendency of the maximum value of this parameter to occur later for the variant of combustion of gasoline with n-butanol. The combustion of gasoline alone results in the slowest process of heat release compared to all other tested variants.
In addition, the dQ/dt analysis showed much greater divergence in combustion than the Pcyl analysis presented previously. The maximum values of dQ/dt (from the smallest ones) were higher in relation to gasoline combustion—n-heptane–butanol by 18% and ethanol–n-butanol by 19.4%. The maximum changes were recorded for n-butanol–gasoline combustion at ΔdQ/dt = 28.4%. Taking into account the occurrence time of dQ/dt, it was determined that the fastest combustion fuel configuration was the n-heptane–gasoline (time to achieve dQ/dt was faster by 0.15 ms compared to the combustion of gasoline alone), then ethanol and n-heptane with gasoline, while the slowest process was butanol and gasoline, for which the delay was measured at 0.25 ms compared to gasoline combustion.
The characteristics of the heat released from the combustion of fuel mixtures are shown in
Figure 6b. The declining shape of the heat release curve resulted from the nature of the rapid compression machine operation and the gas expansion conditions (significant leakage of gases) when the piston was at a certain distance from the TDC.
The total amount of heat released from the combustion process allowed determination of the combustion process efficiency. Assuming that a constant value of the chemical energy was supplied to the cylinder in the form of fuels, the relative values of combustion efficiency were calculated for the tested fuel configurations. The highest value of total released heat was taken as the reference value equal to 100%:
Gasoline + gasoline: 78.1%;
Gasoline + ethanol: 87.7%;
Gasoline + n-heptane: 92.4%;
Gasoline + n-butanol: 100%.
The heat release analysis (
Figure 6b) showed the same slopes of the heat release curves for all cases except for gasoline—for this case the heat gain was the slowest and overall the lowest. The decrease in the amount of heat after reaching the maximum value was due to the specificity of the RCM’s operation, mostly as a result of not having a crank mechanism.
From the obtained results it could be concluded that alternative fuels delivered by means of direct injection into the combustion chamber in parallel with gasoline increase the overall efficiency of the combustion process.
Based on the combustion processes analyzed for the dual-fuel system, it was found that the combustion rates for gasoline and n-butanol were the highest. The worst indicators were found for gasoline combustion. The values of the combustion indicators of all configurations are summarized in
Figure 7.
The combustion of gasoline and n-butanol in relation to the combustion of gasoline alone could be described by stating that:
The maximum combustion pressure in the cylinder was 10% greater—changes in relation to other fuel mixtures reached values up to 4%;
The pressure increase was 17% greater—combustion of the remaining mixtures indicated changes in the pressure increase value of up to 7%;
The maximum heat release rate was measured to be 22% greater—combustion of other fuels showed smaller differences of up to 8%;
The maximum amount of heat released was 22% greater—changes of this ratio for other fuels were 13% (gasoline and ethanol) and 8% (gasoline and n-heptane).
Summarizing the research results discussed above, it was found that the configuration containing n-butanol and gasoline achieved the highest indicator values for the combustion process. The highest pressure in the cylinder enabled the greatest derivative values to be obtained, up to and including the amount of released heat. These benefits were additionally confirmed by the reduced amount of CO
2 produced during combustion (reduced by 17% compared to gasoline, as shown in
Table 2).
Optical tests for the combustion process were carried out in parallel with the indicator tests. They allowed for a more complete identification of the phenomena occurring in the engine during the combustion of various fuels and their mixtures.
3.3. Optical Analysis (Combustion of Gasoline with Other Fuels)
The images recorded from the optical tests of the combustion of selected fuels are shown in
Figure 8. The differences in the flame development for different fuel mixture configurations were significant and indicated slight differences in the combustion process for the individual tested mixtures.
Thanks to the recorded images, it was possible to quantify the stages of flame development in the cross-section view of the combustion chamber. The percentages of the combustion chamber volume covered by the flame are shown in
Figure 9a.
The analysis of
Figure 9a concerning the surface flame area allows for two different types of flame development process to be distinguished. The first of these, in the case of gasoline + gasoline and gasoline + ethanol, was characterized by an intense flame development in the initial combustion stage and its rapid extinction. In the second, namely gasoline + n-heptane and gasoline + n-butanol, slower flame development can be observed in the initial combustion stage, however this flame development lasts longer than for the previously discussed fuel mixtures.
Additionally, it can be observed that the combustion of the mixture with ethanol lasted about 10 ms less than in the case where only gasoline was used.
In [
36], it was found that for the combustion of lean mixtures created by means of direct injection, there was a linear relationship between the heat release rate and the equivalent radius of the flame area in the phase of the heat release rate increase. Therefore, we checked whether this relationship held true for the performed experiments. The equivalent flame radius r
z was determined from the flame area of the circle by assuming that the flame formed a circular shape.
The correlation analysis results for the heat release rate and the equivalent flame radius during the combustion of gasoline with various fuels are shown in
Figure 9b. This showed that the linear relation occurred only for the combustion of gasoline alone and gasoline with n-heptane. In other fuel mixture cases, a linear relationship was not observed.
The differing nature of the relationship between these two values was an important observation in the research on the dual-fuel system and in the creation of a stratified mixture in the combustion chamber. The occurrence of a flame in the area of the combustion chamber does not necessarily define the intensity of the combustion pressure increase as a result of this combustion. This may be due to non-uniformity in calorific value and ignitability of the fuels used to form the mixture. The final confirmation of these hypotheses can be made after analyzing the combustion of one type of fuel delivered by means of direct injection with two injectors.
3.4. Analysis of Operation Indicators for the Combustion Process of One Fuel Type Supplied with Two Injectors
In this section, the impacts of one fuel type on the combustion results in a two-injector system were assessed.
Figure 10 shows the combustion pressure analysis for the four fuel types supplied—each time one fuel type was supplied using both injectors.
The cylinder pressure curves show that any alternative fuel replacing gasoline increases the resulting maximum pressure value. Additionally, the use of n-butanol delays the moment of reaching that maximum value. The trend for maximum combustion pressure values is similar for partial and complete replacement of gasoline with another fuel.
The heat release rate characteristics for the four tested experimental cases are presented in
Figure 11a. Unlike in the case of using a fuel mixture, the use of n-butanol alone does not result in the maximum value for the heat release rate among the four tested fuels. This means that for n-butanol, the addition of gasoline increased the reactivity of the mixture. However, using only gasoline by itself resulted in the lowest value of the heat release rate among the analyzed fuels.
Figure 11b shows the characteristics of heat released in time during fuel combustion. The descending shape of the heat release rate was a result of the nature and operating conditions of the rapid compression machine when the piston was near the bottom dead center.
The combustion process efficiency was determined in the analysis of single fuel type combustion cases. The relative combustion efficiency values for the fuels used were calculated. The results are presented relative to the base fuel (gasoline):
Gasoline: reference value;
Ethanol: 0.9% more than for combustion of the gasoline + ethanol mixture;
N-heptane: 2.1% less than for the combustion of the gasoline + n-heptane mixture;
N-butanol: 1.7% less than for the combustion of the gasoline + n-butanol mixture.
The combustion of the same fuels makes the high density of n-butanol even more prominent. It did not show such different properties when mixed with gasoline (point 3.3). The combustion of homonymous fuels also corresponds to the high initial heat release rates seen for n-hexane and ethanol. Such combustion process characteristics were also repeated for the analysis of heat release.
Based on the above research, it was found that alternative fuels supplied instead of gasoline into the combustion chamber by means of direct injection increase the combustion process efficiency. However, when using n-heptane and n-butanol, the combustion efficiency does not increase monotonically with the increase of their share in the fuel mixture. There is a certain non-zero ratio of gasoline content to the content of each one of these fuels in the mixture for which the highest combustion efficiency value is obtained.
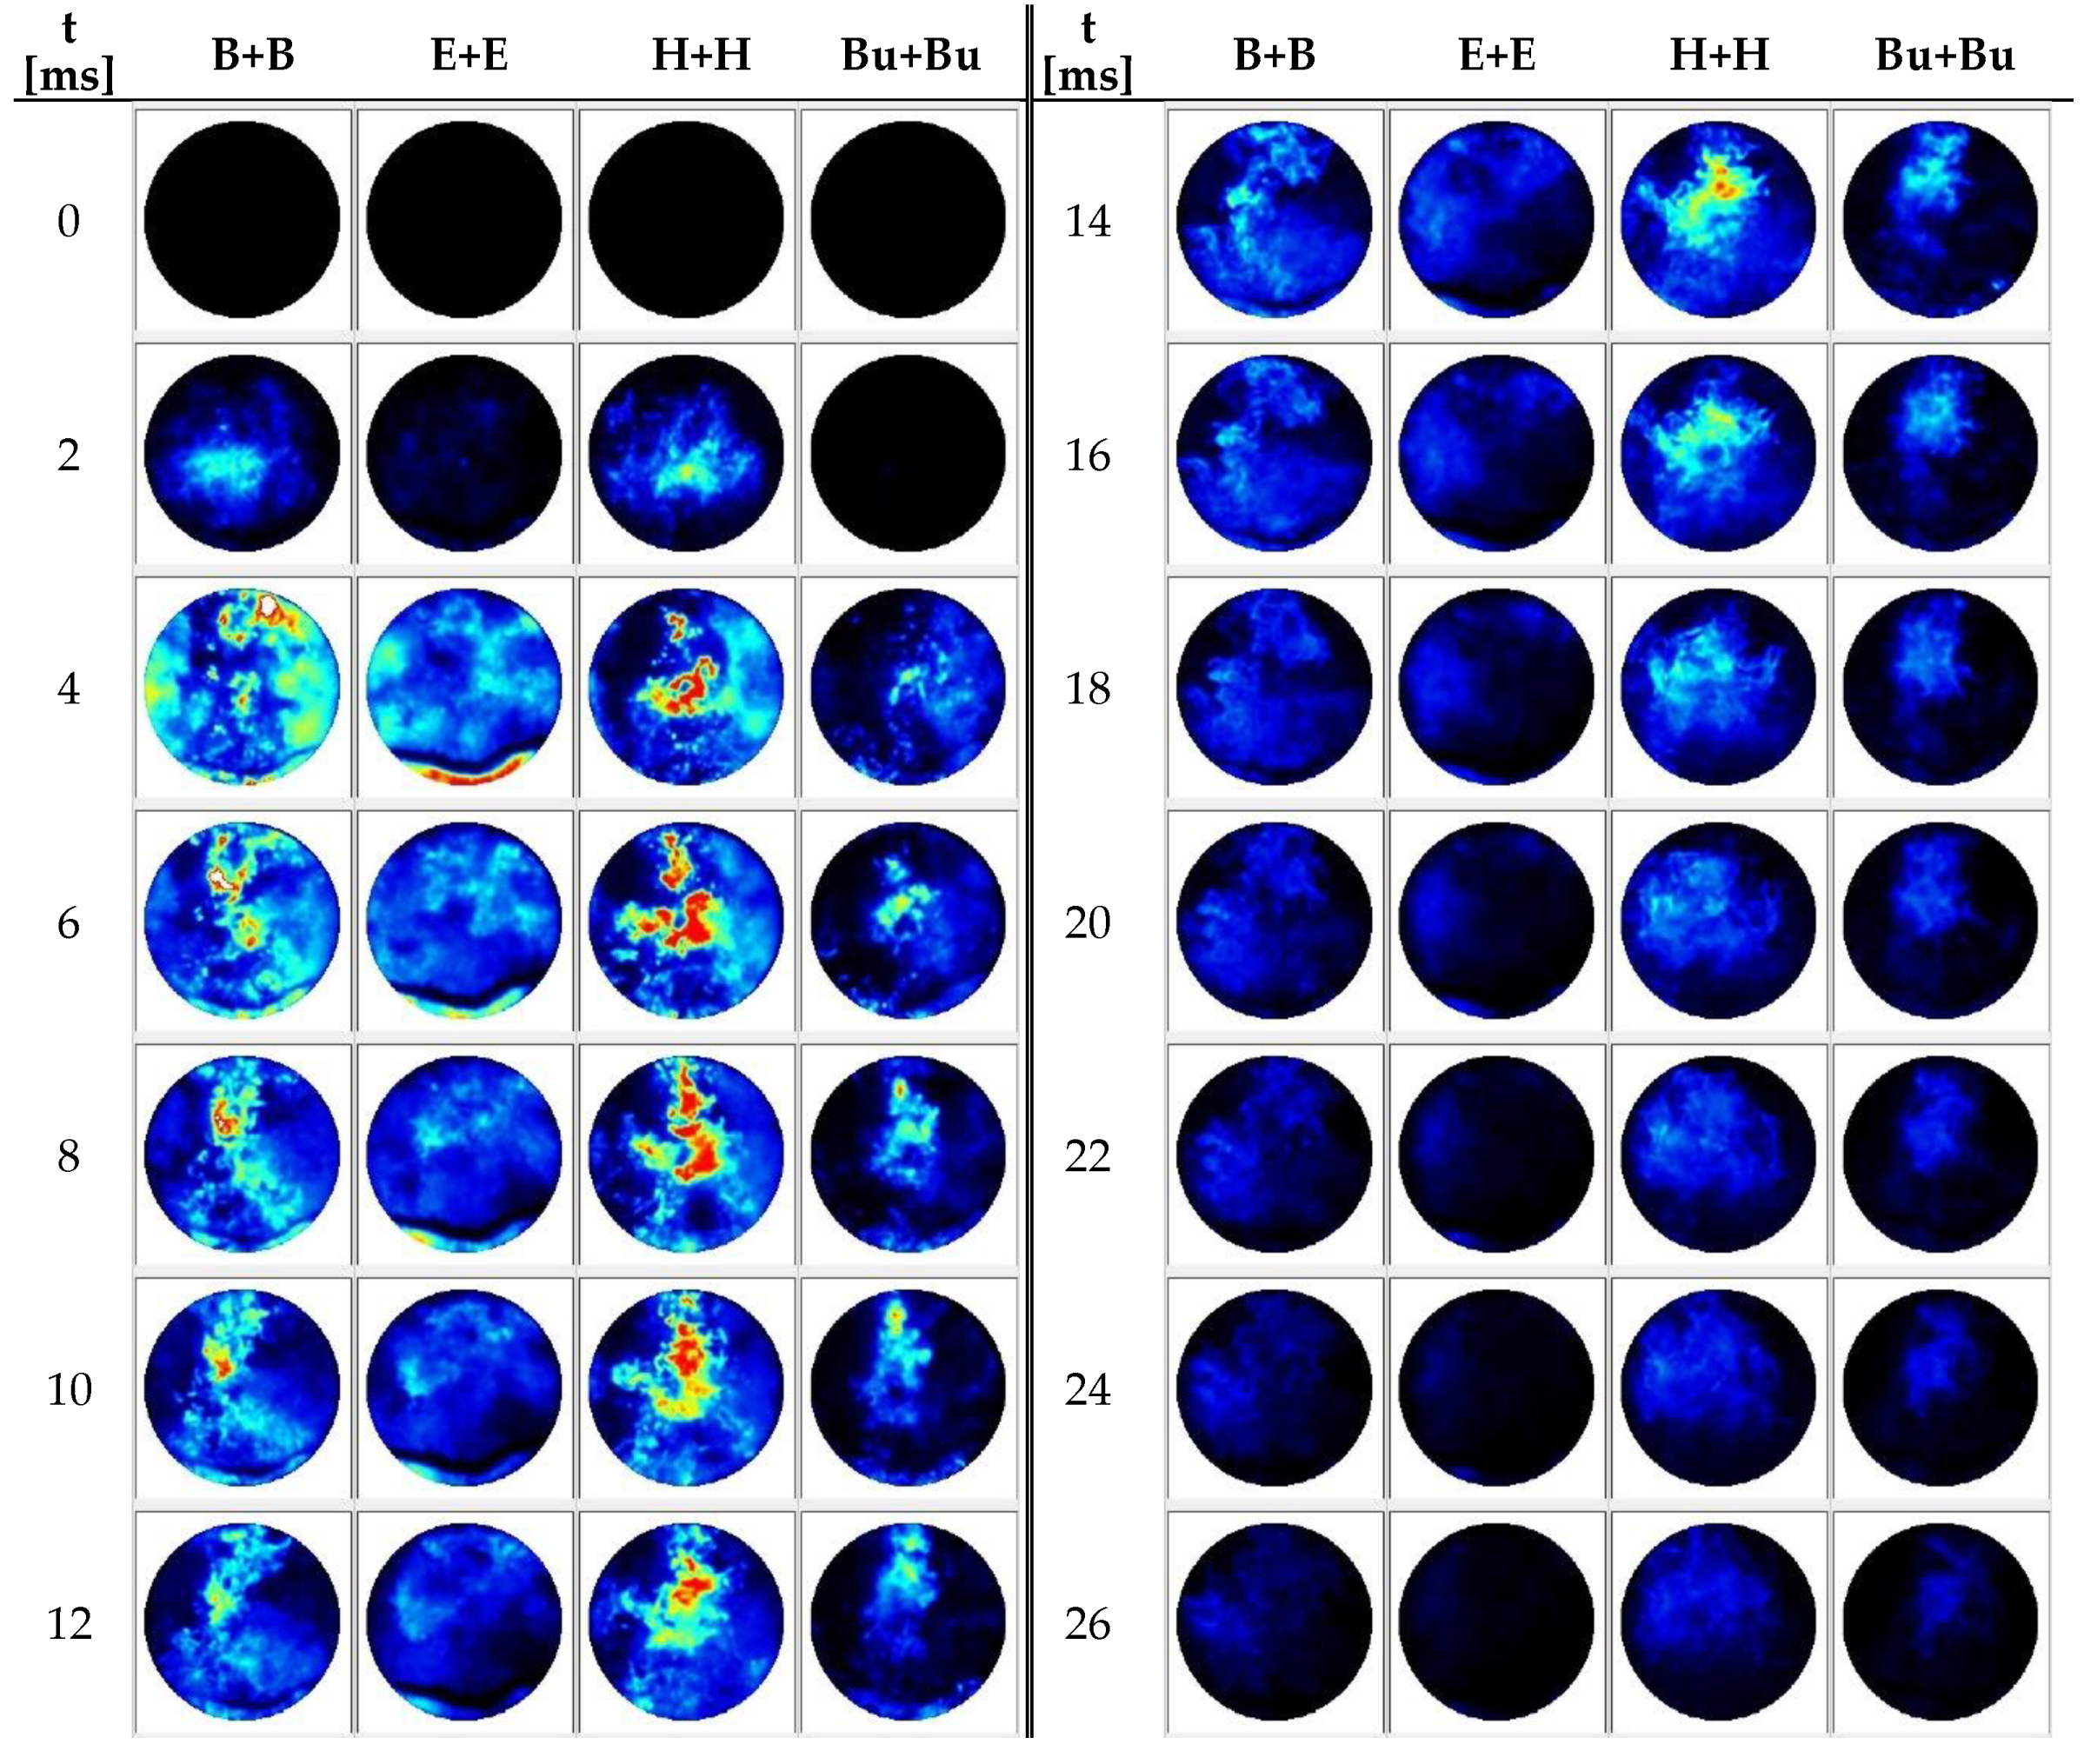
3.5. Optical Analysis of the Combustion Process of One Fuel Type Supplied with Two Injectors
Optical tests of the combustion process were carried out in parallel with the indicator tests. Images from optical tests of fuel combustion are shown in
Figure 12. These images indicate significant differences in the flame development depending on the fuel used. The quantitative analysis of the flame development was carried out in the cross-sectional view of the combustion chamber.
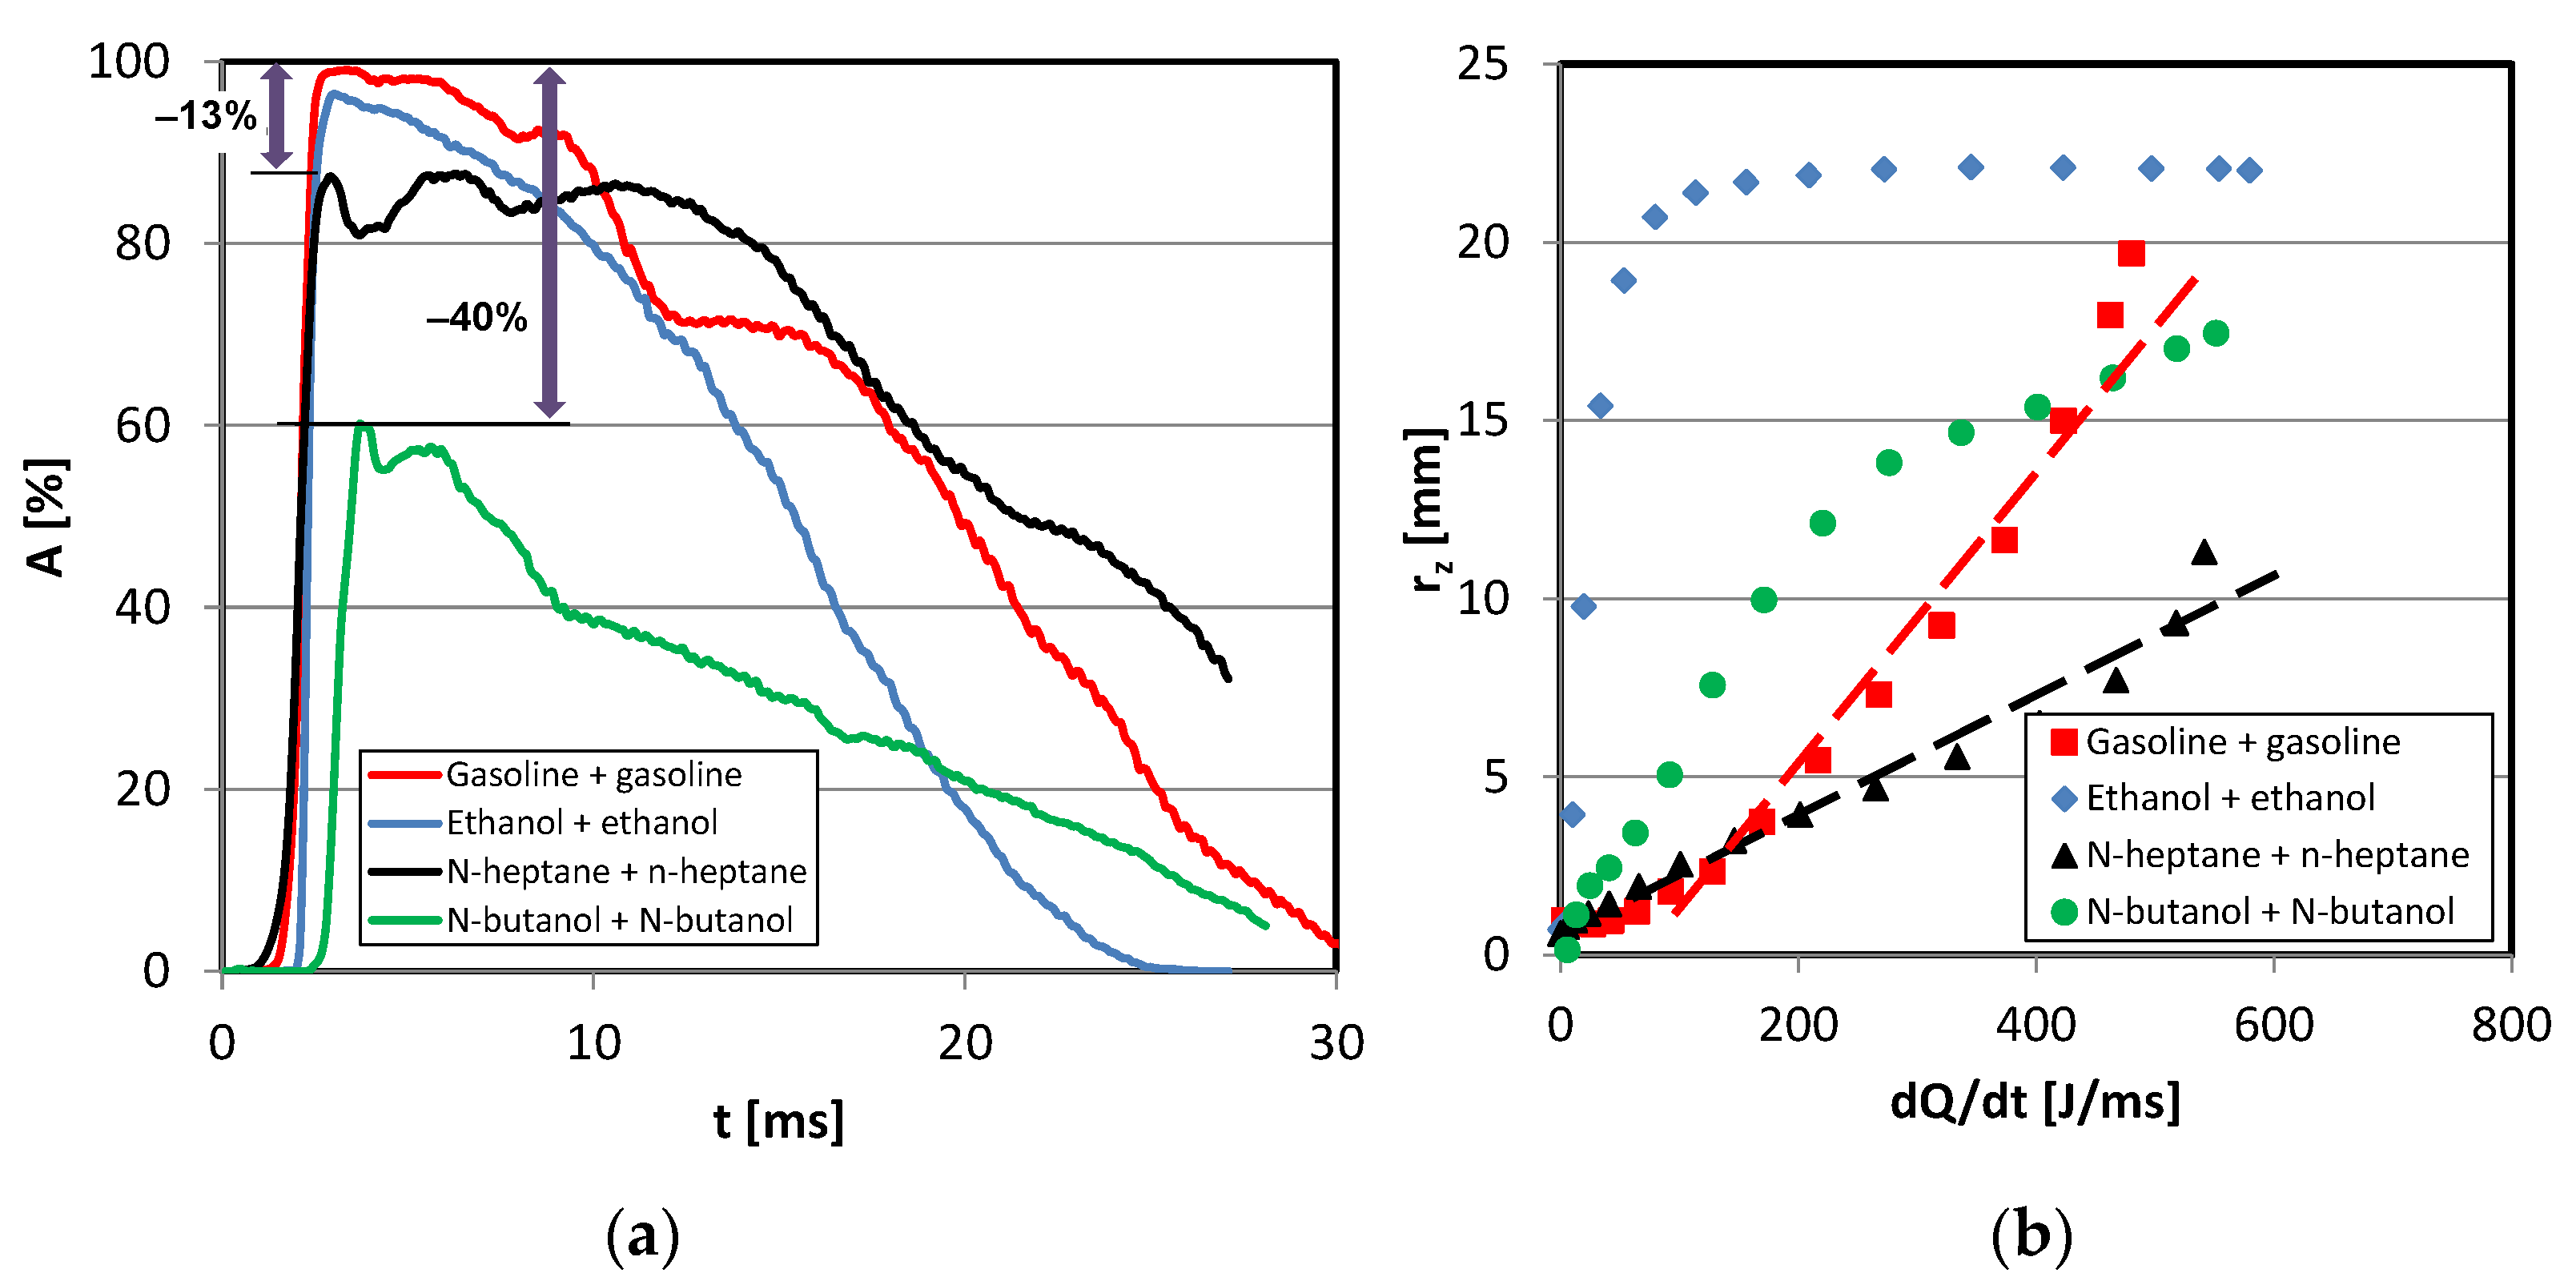
Figure 13a presents the change in time of the percentage share of the area occupied by the flame in the observed cross-section image of the combustion chamber.
The analysis of the presented characteristics of the flame surface area for the stratified, homonymous fuel mixtures showed that the nature of combustion was similar. This was due to the uniform reactivity of the fuel in the combustion chamber.
Another observation made was the significantly reduced flame proportion in the combustion of n-butanol compared to the other tested fuels. In order to better understand the combustion process in these cases, image analysis and the results of indicator tests were used. The relationship between the equivalent radius and the heat release rate was assessed. In most typical fuel mixtures, this relation is linear [
36]. The correlation results are shown in
Figure 13b.
According to the analysis of the relationship between the equivalent radius and the heat release rate for one type of fuel, a linear relationship was found for gasoline and n-heptane. For the remaining fuels, these values were not directly proportional to each other.


