Article

Potential Diffusion of Renewables-Based DH Assessment through Clustering and Mapping: A Case Study in Milano

1
Department of Energy, Politecnico di Milano, Via Lambruschini 4, 20156 Milano, Italy
2
School of Business, Innovation and Sustainability, Halmstad University, P.O. Box 823, S-301 18 Halmstad, Sweden
*
Author to whom correspondence should be addressed.
Energies 2021, 14(9), 2627; https://doi.org/10.3390/en14092627
Submission received: 15 March 2021 / Revised: 23 April 2021 / Accepted: 28 April 2021 / Published: 4 May 2021

Abstract

:
This work aims at developing a methodology for the assessment of district heating (DH) potential through the mapping of energy demand and waste heat sources. The presented method is then applied to the Metropolitan City of Milano as a case study in order to investigate the current and, especially, the future sustainability of DH with the foreseen building refurbishment and consequent heat demand reduction. The first step is the identification of the areas the most interesting from a heat density and an economic point of view through a clustering algorithm, in which lies the main novelty of the work. The potential is then assessed by investigating their synergy with the available heat sources, which are mapped and analyzed in terms of recoverable thermal energy and costs. In future scenarios with foreseen heat demand reduction, low-temperature networks and excess heat sources are considered, such as metro stations and datacenters, together with the conventional sources, such as thermoelectric plants. The outcomes prove that lower heat demand corresponds to higher network costs with consequently reduced district heating potential but also prove that the properties of low-temperature district heating can potentially compensate for the drop in its cost-effectiveness. Another interesting finding is that the renovation of buildings in an area should be not performed evenly but with criteria; for instance, in synergy with DH diffusion.

Graphical Abstract

1. Introduction

In recent years, within the challenge of reducing greenhouse gas emissions, thus reducing primary energy supplies while simultaneously meeting the energy demands of growing populations and a vibrant economy, district heating (DH) has gained increased interest and importance, especially in Europe. According to Ref. [1], the thermal sector in Europe accounts for about 50% of the final energy consumption and around 80% of total final energy use in buildings. Moreover, as it can be derived from the studies conducted within the Ecoheatcool project [2], initiated by Euroheat & Power in 2004–2006, the majority of European buildings are highly dependent on fossil fuels to provide energy for space heating and domestic hot water. With the European Directive 2004/8/EC [3], district heating has been recognized for the first time as a technology capable of extensive recycling, distribution and utilization of excess heat flows, but it is only with the 2016 EU “Strategy on heating and cooling” [4] that European Union really commits in energy efficiency assessing that “a smarter and more sustainable use of heating and cooling is within reach as the technology is available.” This technology is district heating.
Since it is a centralized heat supply, district heating is characterized by economy of size and optimized operational conditions in heat generation, allowing high conversion efficiency, hence improved utilization level of primary energy supply and lower combustion emissions [5]. Indeed, what is meant is that by replacing individual heating solutions with natural gas boilers with centralized DH, it is easier to control the environmental impact with respect to emissions of NOx, dust and noise: it is easier to act on reducing stack emissions from a single power production plant integrated to DH with respect to a multitude of NG or coal-fired boilers. CO2 emissions are also reduced when using DH since recycled heat or renewables can be used. In the same way, centralization allows to better exploit the primary energy, with higher conversion efficiencies also due to the fact that potential conversion losses can be easily detected and taken under control. Moreover, the fundamental characteristic of district heating is that local costumer demands can be met through the exploitation of several different heat sources, which can be not usable by any individual heating technology [6] and whose heat would otherwise be wasted.
Nevertheless, besides these notable features, the main limitation of district heating is that its domain and operation are bounded to the local dimension [5]: distribution networks are generally limited to a maximal cost-effective total length of 20–50 km, dependent on the amount of energy transported, as reported in [1]. The core issue at the basis of district heating systems economy is, therefore, that their suitability and competitiveness are strictly related to the local heat demand concentrations: since the investment costs for the construction of the network are very high and represent the additional cost with respect to any individual heating solution, the profitability of these systems is significant only if the local conditions allow them to be widely exploited [5]. It basically means that the important investment cost for the construction of the distribution network is repaid only if the heat demand is very high and concentrated. In future energy systems headed to sustainability and improved overall energy efficiency, the heat demand density is expected to significantly decrease as a consequence of the foreseen building refurbishment, and this translates into the need of analyzing the profitability of DH, which could be questioned.
In order to investigate the current and especially the future sustainability of DH with the foreseen building refurbishment and consequent heat demand reduction, this work presents a methodology for the evaluation of large-scale district heating potential, from a technical and economic point of view, in current and future heat markets. The developed methodology has been indeed applied to four scenarios, which represent four different energy configurations with increasing rates of building refurbishment, dictated by the European Long-Term Strategy for 2050 [7], and with different district heating technologies. In the first scenario, representing the current energy system in the area under study, and in the second one, 3rd generation district heating (3GDH) has been considered: it is characterized by steel distribution pipes in which the hot fluid is distributed at an average temperature we assumed equal to 90 °C. Instead, in the other two highly refurbished scenarios, 4th generation district heating (4GDH) systems have been simulated. The aim is to investigate how DH potential varies if a reduction in heat demand is considered together with a reduction in distribution average temperature, which can potentially lead to a reduction in distribution capital costs and in heat generation costs. Indeed, 4th generation district heating technology is characterized by cheaper construction materials (plastic pipes) and more performing systems, by lower distribution temperatures and distribution losses, by the possibility to exploit excess heat otherwise wasted and therefore not purposely generated. For such reasons, it is expected to be able to cope with the reduced heat demands while maintaining economic competitiveness (lower total cost with respect to the individual heating solutions) and while ensuring its environmental sustainability.

1.1. Aim of the Work

This work provides a methodology for the assessment of large-scale district heating potential, from a technical and economic point of view, through the mapping of energy demand and waste heat sources. The Metropolitan City of Milano is used as a case study, and the methodology is applied to simulate current and future scenarios. The method is composed of mapping-based steps for the estimation of the heat demand, the assessment of the recoverable heat from available sources and the estimation of costs through their matching in space. District heating feasibility is assessed starting with the identification, through a clustering algorithm, of the areas the most interesting from DH network development; thus, areas in which the heat demand density is high enough to ensure limited distribution costs. Afterwards, the quantification and the mapping of the available waste heat sources are performed in the area under study. Conventional heat sources, such as power plants, are considered in the case of 3GDH, and unconventional low-temperature excess heat sources, such as industries, wastewater treatment plants, metro stations, datacenters and groundwater wells, are added in the case of 4GDH. In the identified strategic areas in which there are suitable conditions for the implementation of district heating, its potential is then assessed from an economic point of view, by comparing the overall cost associated with this technology (thus, distribution costs, transmission costs, heat generation costs) to the individual heating solutions taken as reference, namely oil- and natural gas-fired boilers in the current case and air- and ground-source heat pumps for the future scenarios. By considering the overall cost associated with DH, we are not excluding a priori the areas with low heat demand density and consequent high distribution cost. Indeed, an area with these characteristics could still be attractive for DH development if cheap heat supply sources exist there: the high distribution costs in low heat demand density areas can be counteracted by the integration of cheap excess heat sources [8].

1.2. Previous Studies

This work is certainly not the first one in which the aim was to assess district heating potential at a large scale, but several innovative aspects have been introduced. First of all, since the existing district heating systems in Italy belongs to the 3rd (or even to previous) district heating technology, this work represents an innovation in the sense that the estimation of the potential of 4th generation district heating at a large scale has never been computed before in an Italian context. Regarding Europe, investigations of district heating potential at a large scale have been already performed, but they all deal with the current 3rd generation technology. Among them, Heat Roadmap Europe 4 (HRE4) [9] and Hotmaps [10] projects, both financed by means of the European Union’s Horizon 2020 research and innovation program established from 2016 to 2019, proved to be at the basis of the methodology presented in this work (HRE project especially). Indeed, even if their focus was the estimation of district heating potential at a large-scale level in the current configuration, i.e., 3rd generation district heating, they addressed all the key steps of DH potential analysis: analysis of the building stock and of the heat demand, analysis of heat resources and their potential, mapping and definition of suitable DH regions.
Concerning 4th generation district heating, several research studies can be found in literature, but they are mainly based on small and experimental networks. Much of the strategic research and development on low-temperature district heating in Europe has been mainly carried out in countries with high district heating penetration rates, such as Sweden, Denmark and Finland, where there is a strong tradition in heat planning and a mature district heating market. Among the most important research performed in these countries, there is an Annex X project [11], in which there are 7 existing applications of 4th generation district heating technology reported around the world, and the study in Ref. [1], published in 2019 by the Aalborg University (Denmark). Both contributed to demonstrate the potential of low-temperature district heating in future heat markets, highlighting the technologies needed to improve energy efficiency along the entire value chain of district heating from production over distribution to delivery. In parallel with them, many studies are investigating the use of heat pumps powered by ambient heat in DH networks: in [12], large heat pumps integrated into DH are studied as a solution to increase the flexibility of renewable energy overproduction and eight natural sources for the HP are analyzed. In [13], a mapping of low-temperature heat sources for DH is performed for Denmark. Similar studies have been performed also in Finland and Sweden [14,15]. The majority of these studies focuses on heat pumps using ambient heat, but several pieces of research are currently being developed in relation to their application to less conventional low-temperature heat sources such as wastewater treatment plants [10,16], datacenters [17,18], power transformers [19], metro stations [20] and industrial processes [21,22,23,24].
The common basis of all national and regional studies about DH potential development in synergy with excess heat recovery and renewables is the geographical characterization of heat demand and heat availability. Since the heat demand density is the driver of the infrastructure costs of a district heating network, the final extent of the district energy system is governed by the infrastructure costs, correlated to the heat demand distribution and concentration, but also to the availability of resources. That is for this reason that the energy system analysis must be combined with spatial planning. The concept of “heat synergy regions” where high heat demand and heat availability coexist have been defined for the first time in the first pre-study Heat Roadmap Europe 1 [6] through the definition of a simple excess heat ratio: a ratio equal or greater than one means that the excess heat supplied is equal or greater than the heat needed in the area. The method has been then improved in the following Heat Roadmap Europe 4 (HRE4) project [25] through the definition of a priority grouping, in order to exclude those areas in which the excess heat ratio ≥1 were given by simultaneity between very low supply and very low demand. The first priority group includes all the regions with high levels of both heat supplied and heat demanded, determining the most suitable regions for excess heat recovery projects such as district heating; the lowest priority group includes all the regions in which there is the possibility to exploit excess heat, however where both heat demand and excess heat availability are low.
Even if the approach has been perfected, a new method based on a clustering algorithm has been introduced in this work with the aim to perform a deeper exploration at the local level both in current and future energy frameworks. In particular, the introduction of clustering allowed defining heat synergy areas at a large-scale level (the Province of Milan in this specific case) by taking into account local aspects and giving more specific results, for example by assessing the convenience to connect an existing heat source to an identified DH network rather than another one. Even the number and the shapes of the clusters are determined by the input conditions, thus by the energy framework of the analyzed area. This means that the areas to be furtherly studied in order to assess the costs related to DH to be compared with the individual heating solutions are not established a priori and with a defined shape and size (e.g., the hectare). Clustering algorithms or other approaches for heat demand aggregation have been proposed and utilized in other studies that can be found in literature. In these cases, the aim was similar: to assess the integration of DH in urban energy systems [26] or to perform a spatial-approach heat planning in urban areas [27]. In the first-mentioned research study, the buildings of the city under study that are not connected to a DH network are grouped through the k-means clustering algorithm. This algorithm, anyway, requires that the number of clusters to be generated is defined a priori as input, avoiding the output variations according to the starting energy framework of the area. In [27], and in the most recent version of the study [28], a suitability map for DH is elaborated through a spatial smoothing method based on fuzzy algorithms, which consider the influence of nearby objects. In this way, an overview of the suitability areas in space and time is obtained, and in each of them, it is possible to find out the leading heat supply system. However, it presents several intrinsic limits: it is a grid-based approach, in which the areas to be grouped have a predefined shape that is the hectare; the approach can lead to the situation in which a raster cell is suitable to more than one supply category, requiring further local analysis and planning; the “weight” used to assign a category to each cell is the linear heat density estimated based on modelled pipelines. Again, this would require subsequent detailed planning, since networks could be topologically incorrect, and the choice of linear heat density as weight could lead to excluding a priori areas with low heat demand density and consequent high distribution cost, but with cheap heat supply sources, which will make these areas interesting from DH point of view.
The added value of this work is to have developed a schematic methodology, which is therefore simplified in certain aspects but clear, reproducible and explicit. The developed methodology allows recognizing all the steps that make possible a first recognition of the plausible potential of an area by combining technical and economic aspects. The main novelty of this work is the definition of the areas the most suitable for DH development, through a density-based clustering algorithm, in a way that makes DH potential analysis possible even for future scenarios. The methodology is therefore useful as planning support for policy makers but also for operators in the sector and local planners.

2. Methodology

The assessment of DH potential is a complex issue that requires the knowledge of the heat demand and characteristics of the building to be served on the one hand and the typology and amount of available heat supply sources on the other, together with their associated characteristics and costs. It ultimately requires the combination of these two elements both in space and in time in order to quantify the amount of recoverable heat through DH systems, the associated costs and, therefore, the affordability of this technology.
The concept of affordability can be evaluated from the perspective of the DH user, of the utility provider or from the viewpoint of the policy maker, whose aim is to ensure the community an effective heating service at reasonable prices. In the work here presented, the economic convenience of the analyzed technology can be placed in the last-mentioned option since the general aim is to define DH potential at a large-scale level, from the energy system point of view.
The basic idea behind the calculation of the economic sustainability of DH here assumed is the one elaborated in the Heat Roadmap Europe (HRE) project [9], according to which a district heating system is feasible and competitive in a certain area if the total cost of district heat is lower than the cost of the heat generated by any alternative individual heating solution.
A schematization of the general cost situation is illustrated in Figure 1, where the expenses required to supply the same amount of heat are reported for the case of the individual solution and for district heating. The cost components are always the investment cost and the operation and maintenance costs. In the case of individual heating solutions, they are solely referenced to heat generation; however, in the case of DH, they also need to be considered for the distribution and transportation network, which is, therefore, the marginal factor when comparing localized and centralized heating solutions. By observing the illustration of Figure 1, it can be understood that district heating competitiveness occurs if the total cost associated with the centralized heat generation is sufficiently low (with reference to the figure below, Δ < 0). This happens when the heat demand density is high enough to enable the construction and the operation of a heat distribution network at an affordable price, even when considering an expensive heat source; or when the high distribution cost to be paid in low heat density areas is counteracted by the possibility to exploit low-cost heat from an excess heat source located in the surroundings.
The potential of district heating is assessed in terms of costs and corresponding heat market shares in comparison with the individual heating solutions, but, as mentioned in [9], DH can be considered as a local issue: the assessment of its competitiveness necessarily requires extensive information, such as the spatial distribution of local heat demands and supply sources.
With the aim to assess DH potential at large scale without overlooking the fundamental local aspects of this technology, the work consists in the mapping-based steps reported in the following:
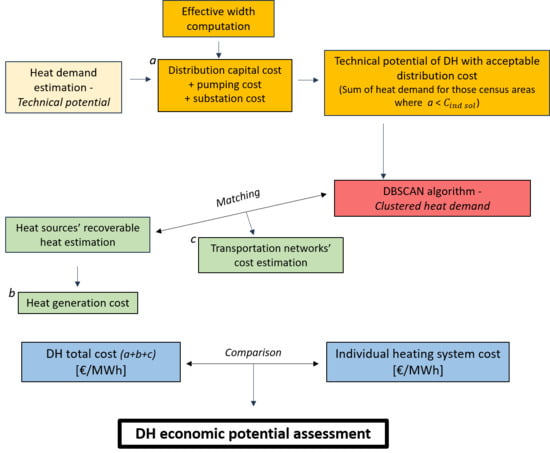
  • The first step relates to the heat demand and particularly to the share of heat demand that could be technically met by district heating, considering both residential and service sectors. Four scenarios are evaluated, and the total heat demand estimated in each of them is geographically distributed in the area under study, with a spatial resolution that is given by the census areas (Census areas are geographic regions defined to take population and housing censuses, and they generally represent the smallest territorial entity for which these types of data are available in most countries). In two scenarios, the overall estimated heat demand is supposed to be met by 3GDH networks. In the other two, only the fraction of heat demand that is foreseen to be refurbished is considered, and it is supposed to be satisfied by 4GDH networks.
  • The second phase of the work concerns the distribution cost. In each census area, the length of the potentially constructible distribution network is estimated, and the distribution costs can be calculated on its basis. The technical potential of DH in census areas with an acceptable distribution cost is assessed.
  • The following step is the aggregation of the census areas through a clustering algorithm, based on the technical potential filtered by considering the estimated distribution costs (the result of point 2). The most suitable regions (clusters) for DH development are therefore identified for the case of 3GDH and 4GDH. Taking Figure 1 as a reference, these clusters are composed of census areas for which Δ < 0. Therefore, the clustered heat demand is obtained.
  • In the fourth step, the existing renewable and excess heat supply sources are identified and mapped, and the amount of heat that could be recovered and potentially used in each cluster through district heating networks is estimated. The length and the costs of the transportation network are estimated.
  • At this point, the overall cost associated with DH technology (the sum of the total distribution cost in Figure 2-box a, heat generation cost in Figure 2-box b and transmission cost in Figure 2-box c) in each identified cluster can be compared with the cost that would be paid if the same amount energy were met by individual heating solutions. District heating economic potential in each cluster can be assessed.
  • Ultimately, DH potential can be assessed as the economic potential (obtained in point 5) over the technical potential (from point 2) or over the clustered heat demand (from point 3).
A graphical representation of the methodology developed and used in this work is reported in Figure 2.

2.1. Heat Demand Estimation—Technical Potential

The first distinction between the proposed scenarios stands in the heating needs to be met. The methods used to quantify the heat demand have been developed by Pozzi et al. in the framework of a wider project, funded by the Italian DH association AIRU, which has as main focus the estimation of renewable-based DH potential in Italy [30], starting from open data sources. In that context, the models used for the residential and the service sectors in Milan, presented at the 6th International Conference on Smart Energy Systems [31], have been extended to the Italian country and validated.
The main input data used for the quantification of the thermal energy consumption in residential and service sector buildings in Milan and for the subsequent distribution at census level have been retrieved from four main references: ISTAT [32], CENED [33], GSE [34] and the Hotmaps toolbox [35]. Please refer to [30] for further details. The overall heat demand in each census area for the current scenario is assessed, and it is then reduced to obtain the heating needs for the other three envisaged scenarios.

2.1.1. Heat Demand Estimation in Current Scenario

Regarding the current scenario, not all the estimated overall heat demand in each census area can be met by a DH system. A first technical criterion is defined: we consider that among the multi-family buildings, only the quota in which a centralized heating system is already installed can be technically connected to a DH network. This can be seen as a pretty strong hypothesis since the connection to DH of a non-centralized multi-family building is not impossible, but it would require additional important costs for the re-design of the distribution system and the installation of the substation. In view of this, the estimated overall heat demand technically connectable to DH (technical potential) in each census area is evaluated as in Equation (12), where c   %   is the ratio of buildings equipped with a centralized heating system to the total number of existing buildings. Another assumption is that only 25% of the buildings with a centralized heating system has also a centralized system for domestic hot water (DHW) preparation.
Q t o t _ C U R R i = ( Q S H i + Q D H W i · 0.25 + Q T E R i ) · c                       [ Wh year ]

2.1.2. Heat Demand Estimation in Scenario 2

In the second proposed scenario, the overall heating need in each census area is given partially by the current heat demand and partially by a reduced heat demand, as can be seen in Equation (2). The definition of the reduced heat demand has been done according to the EU 2050 Long-term Strategy [7], according to which 40% of the overall heating needs will be reduced by 60% in 2050 through building refurbishment. The remaining fraction of heating needs not involved in this reduction, which therefore accounts for 60% of the total, is considered as in the current case.
Q t o t _ C A S E 2 i = Q t o t _ C U R R i · 0.4   · 1 0.6 + Q t o t C U R R i ·   0.6         [ Wh year ]

2.1.3. Heat Demand Estimation in Scenarios 3 and 4

In the third and fourth scenarios, only the heat demand related to the foreseen refurbished buildings is considered, and it is assumed to be met by low-temperature district heating networks, thus by 4GDH.
Concerning scenario number three, the fraction of considered heat demand is the same used in scenario number two (thus, the one envisaged by the EU2050 LTS [7]); the only difference is that the remaining not-refurbished part is neglected.
Scenario number four, eventually, represents the case in which a 60% reduction is assumed for 100% of the existing buildings, meaning that a complete requalification is hypothesized.

2.2. Estimation of the Overall Distribution Network Cost

Once the heat demand technically satisfiable by DH is estimated, in order to assess the cost associated with this technology in each census area, it is necessary to estimate the investment and operating costs related to the heat distribution network, which generally accounts for more than half of DH total cost. Since the aim of the work is to assess DH potential in current areas in which this technology is not yet installed and in future scenarios with increased buildings refurbishment rate, the network that could be potentially built needs to be simulated. To this end, the effective width correlation developed in Sweden by Persson et al., within the Heat Roadmap Europe project [36,37], to estimate the length of the potential distribution network on a given territory based on demographic and urbanistic parameters has been adapted to the Italian framework and used. Starting from this estimated network length, the capital cost associated with the heat distribution network is then calculated by applying the distribution capital cost model [36]. The overall distribution network cost is finally assessed as the sum of the distribution capital cost, the operating and pumping cost, the substation cost.

2.2.1. Distribution Capital Cost, C d

The problem of distribution network simulation and associated cost estimation has been already treated at a large scale in previous works conducted by Persson and Werner since 2010 [29,37,38]. Based on existing networks in Sweden, the researchers managed to define a parametric curve that relates the effective width w , defined as the ratio of the area under study over the length of the network in this area, to the plot ratio e , which expresses the building density within a city area. The linear heat density, Q / L [MWh/m], which is the ratio between the total heat annually sold to the costumers connected to the network (i.e., the technical potential estimated in Section 2.1) and the length of the network itself, can be then computed as in Equation (3) and, eventually, the investment cost related to the network can be calculated as in Equation (4) by using the capital cost model defined by Persson et al. within the Heat Roadmap Europe project [36].
Q L = q · e · w e Wh m
              C d = a   *   C I L Q L =   a   * C 1   + C 2 * d a Q L           / Wh
C I L [€/m] represents the specific investment cost per metric unit of length; a is the annuity (exactly as it was done in the HRE project [29], the annuity factor a has been chosen equal to 0.051, based on a real interest rate of 3% and 30 years investment lifetime of the DH network, to reflect a long-term investment strategy to obtain the benefits of district heating in the future); d a is the average distribution pipe diameter computed as in Equation (5) as function of the linear heat density; C 1   indicates the size-independent construction cost constant / m ; C 2   is the construction cost coefficient / m 2 directly proportional to the pipe diameter d a , since it represents the cost of putting pipes into the ground. Please note that Equation (5) is valid only if considering the linear heat density Q L in [GJ/m].
d a = 0.0486 · ln Q L   +   0.0007   m
This exact methodology has been used in this work, but a different formulation of the parameter effective width has been formulated, validated in the Italian context [39] and applied according to data availability in input data. The result is the Equation (6), where the effective width has been formulated as a function of the building ratio n b , namely, the ratio of the number of total buildings, residential and tertiary, over the total land area, A L . The linear heat density formulation changed as well, as in Equation (7). For further details on the effective width formulation, please refer to the correlated Italian study of ref. [39].
w = 50.25   ·   n b 0.127             m
Q L = Q / A L · w n b           Wh / m  
In the case of the distribution capital cost C d , the difference between the 3rd and 4th district heating technologies can be mainly attributed to the disparity between the used construction cost coefficients C 1 and C 2 , which are representative of the different construction materials used for distribution pipes: steel in the case of the current 3rd generation district heating and plastic in the case of the future networks. Starting from empirical values of these coefficients, obtained through a collection of data among district heating utilities in Milan, C 1 and C 2 has been taken equal to 780 / m and 1878 / m 2 , respectively. Concerning the case of 4GDH, a reduction of 15% has been applied, again, based on the local utility know-how.

2.2.2. Pumping Cost

In addition to the costs associated to the network, we also considered the operating pumping cost (8). Based on district heating practical experiences in Italy, we assumed that the energy consumed for pumping is 5% of the energy injected into the network and that the electrical cost associated to pumping, c e l ,   p u m p , amounts to 107 €/MWh (as estimated by RSE [40] for a DH Italian utility in 2030) both in the current and in the future scenarios. Please refer to [30] for further details.
The equations used for the case of 3GDH for the current scenario and the second scenario are reported in the following. In the case of the future scenario, only the pumping cost value and the linear heat density vary.
      C p u m p = Q t o t _ C U R R i ·   q l % · 0.05   · c e l ,   p u m p = Q i n j e c t e d   · 0.05   · c e l ,   p u m p  
q l % = λ   2   π G Q L     %
G = i = 1 n T ¯ s , i + T ¯ r , i 2 T ¯ g r o u n d , i       with         n = 8760 · 3600     ° C · s  
Q i n j e c t e d   is the estimated overall heat demand technically connectable to DH, increased because of the distribution losses: losses along the network mean higher thermal energy generated at the supply sources with respect to the heat needed by the users. The percentage of losses to be considered is calculated as in Equation (9), where λ [W/m2K] is the average heat transfer coefficient of the network, and G   ° C · s represents the integral throughout the year of the differences between the ground temperature and the average DH distribution temperature.

2.2.3. Substation Cost

The last cost item to be defined is the investment cost required for the installation of the substations. Again, according to experimental data from existing networks retrieved from DH companies associated with AIRU, the annualized cost for the substation in single houses is assessed to 39.5 €/MWh and to 7.1 €/MWh in multi-family houses.
Once the total cost related to DH distribution networks (sum of pumping cost, costs for distribution network construction and operation and substation cost) has been estimated, the technical potential of DH in the census areas with an acceptable overall distribution cost is assessed. It is defined as the sum of the heat demand of all those census areas in which the required total distribution network cost per MWh supplied is lower than the cost to be paid if the same amount of heat is met by individual heating solutions specific to each census area.
This value of heat demand is required in the following step to perform the spatial heat demand aggregation.

2.3. Spatial Aggregation—Clustering

The core of the work stands in the third step of the methodology: the spatial aggregation of the census areas through a clustering algorithm, which brings to the assessment of the clustered heat demand. A density-based algorithm has been chosen, meaning that census areas are grouped according to not only the intensity of the heat demand but also their closeness. This step allows to identify the regions the most suitable for district heating development and/or installation in terms of heat demand and based on their geographical position. By considering the geographical distribution of the heat demand, the treated areas are labelled as interesting and therefore selected according to the urbanistic features of each of them and of all the adjacent areas. This represents the main novelty of the research.

2.3.1. DBSCAN Algorithm

There exist several different methods to perform clustering, i.e., the automatic grouping of similar objects into sets. Among them, DBSCAN (Density-based spatial clustering of applications with noise) has been chosen, and it has been here implemented on Python on the basis of a demo retrieved from Scikit-learn website [41] (Scikit-learn is a free software machine learning library for the Python programming language, which features various classification, regression and clustering algorithms). DBSCAN has been selected in this study mainly because it is a density-based and non-parametric clustering algorithm, which allows to handle very large databases and to obtain clusters dependent in number and shapes on the database itself, meaning that the number of clusters is not a parameter to be set a priori and meaning that clusters of arbitrary shapes are obtained, in contrast to many other methods. Similar to linkage-based clustering algorithms, it is based on connecting points within a certain distance threshold. However, it groups together only the points that satisfy a density criterion, defined as a minimum number of objects (MinPts, n) within this cut-off radius (Eps, ε).
Given a set of spatially distributed objects and the values of the two input parameters, the algorithm can differentiate the items to be grouped in three different ways:
  • A point is named core sample if the number given by itself plus the existing points in its neighborhood, which is determined by the radius of value ε, equals or exceeds the value of the MinPts parameter.
  • A point is identified as border sample if in its neighborhood there is a number of samples lower than the assumed n value.
  • A point is named noise or outlier if no samples are included within its radius of value eps.
As it can be seen in Figure 3, a point labeled as noise is not part of a cluster, by definition. Therefore, a cluster is a set of core and border samples.
It is evident that the number and the shape of the clusters are dependent on the spatial distribution of the items to be grouped, and it is strictly related to the chosen essential parameters. In this work, the centroids of the census areas represent the points to be clustered. In order to group them according to the estimated heat demand, the algorithm has been implemented by setting another optional parameter named sample_weight in addition to the two essential parameters described before. Its function is to associate a weight to each point, such that a point with a weight of at least MinPts is by itself a core sample and thus certainly included in a cluster. The weight used in this work is the potential energy demand of the census areas to be served by DH, namely the technical potential estimated for each census area once the heat demand and the total distribution costs have been defined (output of the second step of the methodology). In this way, the census areas characterized by a high heat demand, which also results to be potentially met by DH in a cost-effective way with respect to any individual heating solution specific to each area, are clustered and therefore chosen to be further analyzed. On the contrary, the census areas in which the total cost associated with the distribution network is higher than the cost of the individual heating solutions are excluded.

2.3.2. Definition of DBSCAN Parameters for the Application on the Case Study

According to the size and the characteristics of the treated dataset, the two essential parameters, ε and n, can assume very different values. “The parameter n essentially controls how tolerant the algorithm is towards noise” [41], and, therefore, it may be necessary to choose larger values when treating very large datasets, noisy data or data that contains many duplicates. The parameter ε controls the local neighborhood of the points, and its choice is crucial for the clusters to be meaningful since it has a major impact on the results. Indeed, when chosen too small, most data will not be clustered at all and labelled as noise; when chosen too large, clusters will merge, and the majority of objects will be in the same cluster. Their definition required a prior parametric analysis.
The analysis, carried out in the Metropolitan City of Milan, consisted of applying the clustering algorithm to varying the parameters within certain intervals and in comparing the obtained results of clustered heat demand and associated distribution network costs. The values the most appropriate for ε and n have been selected either analyzing through objective indicators the fluctuation in grouped thermal energy and costs, or by means of manual analysis and ocular observations of the output generated by the algorithm, avoiding the cases in which the points are grouped in few or too many clusters so that the identified areas can be effectively representative of real district heating systems to be potentially constructed.
For the municipality of Milan, taken as reference, the algorithm has been applied with a chosen parameter n = 1 and with different values of ε, ranging between 0.005–0.155. (Even if the parameter ε indicates a distance, since it represents the cut-off radius within which the algorithm counts the existing points and categorizes them based on the MinPts parameter, it is a dimensionless parameter. Indeed, so that the algorithm can run, the dataset needs to be standardized by removing the mean and scaling to unit variance). In Figure 4, the resulting trends of the clustered heat demand technically connectable to district heating and the overall cost of the potential networks are reported as a function of ε.
Since both the curves show a trend that is constant at first and decreasing then, the first derivative of the heat demand (see Figure 5) has been chosen as an objective indicator for the analysis. It means that the “optimal” value of ε is the one at which the curves present a significant change of the slope, thus, where there is an increase of the clustered heat demand in response to a decrease of the associated overall network (absolute) cost. In this specific case of Milan, ε = 0.09 has been chosen.
The same analysis has been then conducted for other Italian cities with different geographical and urbanistic characteristics (i.e., municipalities with different territorial extensions, different population densities, etc.) so that they can be representative of the entire broader sample. Therefore, an optimal value of ε has been defined for each of them, and then, with a further investigation, the diameter of the city has been chosen as the geographical/urbanistic parameter with which to correlate the eps parameter of each municipality with the one of the reference city of Milan. It means that, starting from the optimal value of 0.09 assumed for Milan, the optimal ε value can be assessed for all the other cities composing the Province of Milan as in Equation (11).
ε _ m u n i c i p a l i t y = 0.09 · d M i l a n d m u n i c i p a l i t y  
The diameter has been chosen among other parameters, as for instance, the total land area or the floor area of the city, since it appears to be the one with which the difference between the calculated value of ε and the one obtained with the analysis of the first derivative is lower. The diameter, d m u n i c i p a l i t y , of each city has been estimated as the averaged distance between the maximum and the minimum latitude and longitude belonging to the city.
The application of the DBSCAN algorithm in the Metropolitan City of Milan, with these parameters and with the distribution cost-limited technical potential as sample_weight, has brought to the definition of 412 clusters, which include 8053 census areas over the total 14,011 composing the province of Milan. In Figure 6, the map with all the census areas colored according to the estimated amount of the distribution cost-limited technical potential in scenario 1 is reported.
In Figure 7, the obtained clusters for scenario 1 are illustrated. The census areas composing the generated clusters represent the areas potentially the most appropriate and interesting for DH development: they are characterized by high heat demand; they are potentially connectable to a DH system from a technical and economic point of view; they are relatively close to each other. Consequently, the areas excluded by the algorithm are considered as zones in which DH is not reasonably convenient and where the heating needs can be met in a more cost-effective way by individual heating solutions. Therefore, they are excluded from the following steps of the entire methodology. In this sense, the clustering algorithm not only allows to identify the areas in which district heating potential is higher, but it also operates as a filter by reducing the scale of the problem and the computational complexity.

2.4. Heat Sources and Potential Transportation Network

In order to effectively compare, in each cluster, the cost of the individual heating solutions with the overall cost related to DH (i.e., the sum of the heat generation cost, the distribution cost and the transportation cost) to define its potential as the final result, the fourth step of the methodology is the analysis and the mapping of the existing heat sources. Their characteristics and their location will bring to the estimation of the heat potentially recovered, the heat source cost and the cost required to transport that heat. Since this work is mainly addressed to future district heating systems characterized by low distribution temperatures, the heat supply sources considered are renewable and excess heat sources, namely industrial facilities, thermoelectric and waste-to-energy plants, wastewater treatment plants, groundwater wells, datacenters and metro stations. The sources belonging to these categories that are already present in the province of Milan have been derived from different databases and analyzed in terms of thermal energy potentially recoverable through district heating systems. Lastly, they have been mapped so that the length and the cost of the transportation network needed to connect them to the clusters of heat demand previously generated can be estimated.
Regarding the high-temperature waste heat sources, namely industrial facilities and combustion plants, waste-to-energy plants and incinerators, the databases from which the input data have been retrieved are the AIA database, updated every year by the regional Agency for environmental protection ARPA, for the first two categories, and the national waste inventory of ISPRA [43] for the other ones. The input data related to the low-temperature excess heat sources, i.e., datacenters and metro stations, have been retrieved, respectively, from the free website called Data Center Map [44] and from PETA 4.3 web map application [45], accessible at the Heat Roadmap Europe project web site. Eventually, for what concerns the renewables heat sources, i.e., wastewater treatment plants and groundwater wells, the input data have been derived from the Hotmaps Toolbox [35] in the first case, and from the company in charge of managing the integrated water service in Milan (MM S.p.A.) in the second case.

2.4.1. Mapping of Heat Sources and Estimation of Excess Heat Recovery

Starting from these databases in which the values of energy, power and/or fuel consumed by the sources, or the amount of CO2 emitted annually are collected, the fraction of recoverable energy from each considered source has been estimated by applying recovery coefficients selected from the most referenced studies found in the literature [10,21,22,23], that are at the basis of the study of Dénarié et al. [46] in which those values have been further studied and finally applied to assess waste and renewable heat recovery in DH in Italy. Please refer to it for what concerns the analysis of heat supply sources and the estimation of the recoverable heat.
In a very concise way, the procedure used to calculate the available excess heat E h e a t   to be potentially recovered in a district heating system starting from the primary energy consumed by the heat source is reported in Figure 8.
Where E p r i m is the primary energy input consumed by the production site, E a b s represent the energy absorbed by the production process, so the process energy used for the realization of the final product, and E e x c e s s indicates all the waste heat which is not embedded in the final product and that is usually dissipated in the environment. Out of this final term, which is the one of interest for this work, additional discrimination can be done according to the temperature level at which this waste heat is produced. The level of temperature with which to distinguish between high-temperature and low-temperature sources is given by the average operational temperature of district heating so that this cut-off temperature is around approximately 90 °C for the current case and around 40 °C for the future 4GDH case. Effluents at temperatures equal to or higher than 200 °C are not considered in this study since it is assumed that this share of thermal energy is more suitable to be internally recovered [21,46].
At the end, the methodology allows two results to be obtained in terms of the thermal energy effectively recoverable in district heating systems, expressed as E r e c , H T (12) and E r e c , L T (13). In the case of excess heat at higher temperatures than the cut-off temperature, the recovery can be directly performed by means of a heat exchanger, while in the case of lower temperature excess heat, temperature upgrade through a heat pump is required.
E r e c _ H T = E h e a t , H T   ·   η X H   Wh
E r e c _ L T = E h e a t , L T   ·   η X H     · C O P C O P 1           Wh
η X H   identifies the recovery efficiency through the heat exchanger, essentially dependent on the construction materials and the configuration of the HX; the COP of a heat pump, which stands for Coefficient of Performance, expresses the ratio of provided useful heating to work required. On an empiric basis, based on the authors’ experience, an empirical value of 0.8 has been assumed as recovery efficiency through the heat exchanger, while the coefficient of the heat pump has been estimated by means of the Martynovsky empirical formulation reported in Equation (14) from ref. [47].
C O P = 0.74 T C T C T E 0.0032 T E + 0.765 T E T C + 0.9
Here, T E represents the heat pump evaporation temperature, i.e., the temperature of the hot fluid exiting the heat source, and T C represents the heat pump condensation temperature, i.e., the temperature of the fluid when entering the heat exchanger of the DH substation. In Figure 9, the curves representative of the 4th and 3rd generation district heating technologies, with supply average temperature of 40 °C and 90 °C, respectively, are reported. A supply average temperature of 40 °C has been used for scenarios #3 and #4, while 90 °C for the current and the second proposed scenario.
Higher values of COP and, therefore, lower operating costs are expected for the case of 4th generation district heating. This means that, in future scenarios, a higher number and variety of heat sources could be potentially exploited with respect to the current scenario since higher heat generation costs can be counteracted by lower operating costs.
The costs related to the heat generation and the heat recovery from each of the mapped sources have been estimated, and then, in each cluster, the average cost has been summed to the total distribution network cost estimated as explained in chapter 2. Eventually, for those cases in which a heat supply source is located in the vicinity of a cluster and not inside it, the remaining cost item to be considered is the one related to the required heat transportation network.

2.4.2. Estimation of Transportation Networks’ Length and Cost

Exactly as in the case of the distribution network, whose topology and length are not known a priori, the estimation of these two features for transportation network represents the fifth necessary step of the entire analysis here presented. Their length and especially their associated cost are needed so that the overall DH cost can be assessed in each cluster and compared to the individual heating solution. In this way, the cost-effectiveness of DH and, therefore, its potential at a large scale can be determined. The main cost database is given by [48,49] from the Danish Energy Agency (DEA), in combination with the cost data retrieved from existing experiences in Italy.
If an excess heat source results to be located outside any cluster, the length of the pipe needed to connect this heat supply unit to the main potentially constructible network within the cluster needs to be estimated. Therefore, the excess heat sources existing in the province of Milan are mapped, and the linear distance between each point identifying the source and each generated cluster in its neighborhood is obtained through a specific processing tool implemented in QGIS. The result is the map in Figure 10.
At this point, considering that the transportation cost is mainly dependent on the distance heat source-cluster and the amount of heat supplied that influences the dimension of the pipes, a viable transmission distance is defined according to Equation (15) from ref. [50], and only the heat supply sources characterized by an acceptable ratio E r e c / d i s t a n c e are effectively considered.
D i s t a n c e = E r e c 10 E r e c 300   GWh 60 E r e c > 300   GWh           km
The specific cost of the transportation network has been estimated equal to 5 × 10⁻³ €/MWh/m, which also includes a cost increase due to the transportation losses along the grid, according to the analysis of some of these connections. In those clusters that result to be connected to an existing heat supply source, the overall DH cost is therefore estimated as the sum of this transportation network cost to the distribution network and the heat generation costs.
At the end of this step, the economic potential is obtained; thus, the sum of the heat demand in all those clusters in which the DH total cost (i.e., the sum of the heat generation cost and the distribution and the transmission costs) is lower than the cost required to supply the same amount of energy with the individual heating systems specific to each area.

3. Results

At this point, the potential of district heating can be expressed in terms of DH economic potential over the technical potential estimated in the second step of the methodology or over the clustered heat demand obtained as the output of the clustering algorithm in step 3. As it should be now clear, this share of heat demand that can be met through district heating is assessed in terms of costs, according to the typology of the networks (high or low distribution temperatures), according to the geographical position of the heat demand assessed through the clustering algorithm and according to the location and the typology of the heat supply sources.
With the aim to enable the reader to better understand and appreciate the obtained findings for the Province of Milan, a sort of reference tool is given by applying the model proposed by Persson et al. in the HRE project. In this way, the added value of the model proposed in this work is highlighted (namely, the identification of synergy regions of demand and heat sources through a clustering algorithm), and the findings that have emerged by applying it could be appreciated not only in absolute terms but also in comparison with the outcomes derived from the methodology currently the most referenced and diffused. The results obtained on the census level through the application of the reference methodology are compared with the ones obtained per cluster by applying the methodology presented in this paper. They are presented in Section 3.1 for the current case (scenario 1) only.
Then, an overview of the intermediate and of the final results obtained by applying the developed methodology to all the four scenarios are reported in Section 3.2.

3.1. Results Compared with the Reference Approach

The primary result indicator generally chosen in literature to assess the feasible potential of district heating technology in the heat market comes from the analysis of the distribution capital cost curve depending on the heat market share. Essentially, the presented methodology has been applied for the computation of the specific distribution total cost per census area to represent the reference approach and per clusters to represent the innovative method, including the clustering algorithm. Then, so that the results can be compared, a threshold value of 50 €/MWh has been chosen, and the heat demand that can be met without exceeding this limit has been estimated. The market share, defined as the covered heat demand over the total heat demand in the area under study, is therefore estimated as well. These results can be seen in Figure 11 and Figure 12.
According to the figure above, which is representative of the reference approach, we can state that about 11,600 census areas over the total 14,000 can be served by DH with a specific distribution total cost lower than 50 €/MWh. They are responsible for a heat demand of 12.3 TWh, which represents 93% of the overall technical potential with acceptable cost, which is 13.3 TWh for scenario 1.
If the same analysis is done at cluster level, what is obtained is illustrated in the figure below. Here, 120 clusters over 412 can be met by DH without exceeding the cost value chosen as limit. They are responsible for a heat demand of 9.05 TWh, compared with the total 13.3 TWh, which gives a DH potential of 68%.
It is evident that the proposed method leads to a reduction of DH potential in scenario 1 of about 30%. Anyway, this disparity should not be seen as a problem but rather as proof that the presented methodology can exclude, in a unique step, those areas that maybe are characterized by high heat demand but that are far from each other. It means that the areas that would be included in defining DH potential with the reference approach will still be excluded if a spatial analysis is done a posteriori. Indeed, as it can be seen in Figure 13 and Figure 14, the clustering algorithm brings to a reduction of the census areas to be considered for the following steps of the methodology by excluding those areas that are too sparse. The DH potential appears to be lower with the proposed approach, but it is a more comprehensive result that takes into account the amount of heat required, with also the relative position of the heat demands and their location with respect to the available heat sources. Therefore, the overall required cost for DH expansion can be estimated too.

3.2. Results Obtained on the Modelled Scenarios by Applying the Developed Methodology

In Table 1, an overview of the intermediate and of the final results obtained by applying the developed methodology are reported.
As a reminder, scenario 1 represents the current case served by 3GDH; in scenario 2, in which again 3GDH is considered, is assumed that 40% of the overall heating needs are reduced by 60% through building refurbishment; in scenarios 3 and 4, only the heat demand related to the foreseen refurbished buildings is considered, and it is assumed to be met by low-temperature district heating networks, thus by 4GDH. In particular, in the third scenario, the fraction of considered heat demand is the same used in scenario number two, with the remaining part being neglected, and in the fourth scenario, 60% reduction is assumed for 100% of the existing buildings.
In order to give again a general insight on the results obtained, in Figure 15, the values of the specific distribution total cost obtained in each generated cluster are sorted from the lowest to the highest and reported for all four scenarios. Low values of cost indicate a dense building environment, well suited for district heating expansion, while higher values of cost basically indicate that the studied census areas are characterized by lower heat demand concentration, where the possibility to install DH infrastructure is not excluded a priori but requires that cheaper heat supply sources are exploited so that higher distribution investment costs could be counteracted by lower heat generation costs. When performing the subsequent step of the methodology with the matching of the clustered heat demand with the heat supply sources, these areas could become relevant as the ones that already present a low specific distribution total cost.
By analyzing Figure 15, it can be seen that the two curves identifying the case of 3GDH (scenario #1 and #2) present an interesting plateau which indicates that the expansion of this technology can occur with a reduced increment of costs. It basically means that a market share of about 75% (circa 300 clusters over the obtained 412) can be reached with specific costs that remain almost constant and below 100 €/MWh. These low values of cost indicate a dense building environment, well suited for district heating expansion, while the sharper increase of costs over 75% market share (over the plateau) basically represents the clusters with lower heat demand concentration.
For what concerns 4GDH, it can be noted that the distribution capital cost is generally higher than the cost related to 3GDH. This is an expected result because of the higher refurbishment degree that implies lower values of linear heat density. An overview of linear heat density is presented in Figure 16, where the first and the second scenarios show the highest values of linear heat density.
The second and more comprehensive result is given by the comparison, in each generated cluster, of the total cost of district heating (i.e., the sum of heat generation cost, distribution cost and transmission cost) with the average cost of the existing individual heating solution. In the following, this result is reported for each considered scenario.

3.2.1. Results for the Current Scenario

In scenario number one, DH potential is evaluated within the current heat market framework, thus by considering the current heating needs, to be served at high temperature (we assume an average distribution temperature of 90 °C). Therefore, its total cost is compared with the individual heating supply technologies that are installed nowadays to satisfy the heat demand.
As it can be seen in Table 1, the estimated annual heating needs that can be technically met by DH in all the census areas composing the province of Milan, from residential and service sector buildings, for space heating and domestic hot water, accounts to 23.6 TWh. Of this, the amount technically connectible to DH with an acceptable distribution cost is equal to 13.3 TWh, and the quota that is clustered is about 10 TWh.
Then, by considering also the heat generation cost and the transmission cost estimated in step #4 of the methodology, the average DH total cost in each cluster is assessed. The comparison of this cost with the average cost required to supply the same amount of heat demand in each cluster by means of individual heating solution allows, eventually, to obtain the economic potential. In this first scenario, it equals 3.4 TWh.
The two cost items compared to assess the economic potential of DH in the area under study are reported in Figure 17 for the first scenario.
Each generated cluster is composed of a certain number of census areas characterized by an individual heating system cost. The average value of this cost in each cluster has been computed and reported in the figure below in orange. The dotted line is the mean value of these values in orange.
At this point, the aim is to determine in which of the obtained clusters the DH total cost is lower than the average individual heating system cost so that the areas in which DH is cost-effective can be identified. Therefore, the DH total cost estimated in each cluster has been ordered from the lowest to the highest and reported in the figure in blue. In this way, the potential DH market share can be immediately assessed by comparing the blue and the orange curve: DH is cheaper than the existing individual heating solutions in 335 clusters over 412 (80% market share).
Eventually, the economic potential, defined as the sum of the heat demand in those clusters for which the DH total cost is lower than the individual heating system cost, can be assessed. In Figure 17, these clusters are the ones for which the orange line is above the blue line. Therefore, the area in blue indicates the clusters in which DH is competitive and therefore the clusters whose heat demand need to be summed to obtain the economic potential of 3.6 TWh. The blank areas below the curve represent the clusters to be excluded since the associated DH total cost is higher than the relative individual heating system cost.
To summarize, even if the total DH costs are not so low in this first scenario (148.5 €/MWh on average as reported in Table 1), district heating appears to be more convenient with respect to the individual heating solutions nowadays installed, i.e., natural gas and oil boilers mainly, in 80% circa of the obtained clusters: 335 over 412. These areas are responsible for 3.4 TWh of heat demand. Therefore, the economic potential of 3GDH in the current scenario is equal to 14% if computed with respect to the total heat demand (i.e., the technical potential estimated in point 1 of the methodology) or 33% if computed with respect to the clustered heat demand.

3.2.2. Results for Scenario 2

In scenario number two, the refurbishment of buildings and, therefore, the foreseen reduction of heat demand is considered but only partially. As said in chapter Section 2.1.2, 40% of the overall heating needs are assumed to be reduced by 60%, while the remaining fraction is considered as in the current case. Moreover, we considered that the total heat demand, thus both the reduced and the current share, is connected to DH networks belonging to the third generation: it means that entails a reduced heat demand with respect to scenario 1, but the same current configuration of DH is considered. This implies that the average distribution temperature is equal to 90 °C and that the heat supply sources at a lower temperature require an upgraded temperature through heat pumps. Besides, the high-temperature sources are directly connected.
In this case, the technical potential estimated for the metropolitan city of Milan is equal to 22.5 TWh, of which 12,7 TWh can be technically served by DH with acceptable distribution cost. The clustered quota accounts for 9.7 TWh, and only 2.8 TWh is also competitive with respect to the individual heating solutions. These results can be appreciated in Figure 18.
In this second scenario, we have that in about 260 clusters over 412 (63% market share), DH is cheaper than the existing individual heating solutions and these clusters are responsible for 2.8 TWh. Therefore, the economic potential of 3GDH in the second scenario is equal to 12% if computed with respect to the technical potential or 28% if computed with respect to the clustered heat demand.
The reduction in district heating potential was expected: lower heat demand reflects higher distribution network costs and, therefore, a higher DH total cost if the same distribution temperatures are considered.
These results prove that if the boundary conditions are unchanged, the reduction in heat demand reflects the reduction of district heating potential. In order to enhance DH potential with the foreseen future refurbishment of buildings and consequent heat demand reduction, 4th generation district heating technology needs to be considered. Its intrinsic characteristics are such that the amount of distribution capital cost is counteracted by lower heat losses along with the network and lower heat generation costs. Indeed, being the distribution temperature reduced with respect to the 3rd generation technology (in particular, we considered 40 °C instead of 90 °C), it is possible to exploit renewable and non-conventional sources whose low-temperature excess heat would be dissipated in the environment: since these sources are not built on purpose for DH, the generation cost will be certainly lower than the cost associated to conventional heat supply sources as cogeneration plants.
In light of these considerations, in the third and fourth simulated scenarios, only a fraction of refurbished buildings are considered, and the associated reduced heat demand is assumed to be satisfied through 4GDH.

3.2.3. Results for Scenarios 3 and 4

In the third scenario, 40% of the overall heating needs are reduced by 60% and are met by 4GDH. The remaining fraction is neglected. The resulting annual heat demand in the whole province of Milan is equal to 3.2 TWh, of which 1.3 TWh can be served by district heating from a technical point of view and with acceptable required distribution costs. 1.02 TWh is the quota included in the 412 clusters generated, and only 0.02 TWh is the fraction of thermal energy that can be generated and distributed in a cheaper way by means of DH with respect to the individual heating solutions, which in this case, are represented by air and/or water heat pumps.
In this third case, economic potential of only 0.5% is obtained if calculated with respect to the technical potential or 1.5% if computed with respect to the clustered heat demand.
These very low values may be disappointing. Anyway, if the analysis is performed in a scenario of complete refurbishment of buildings (scenario number four: 100% of the overall heating needs are reduced by 60%), it is possible to achieve much more satisfactory results. Indeed, as can be seen in Table 1, the estimated technical potential in scenario #4 is equal to 6.1 TWh, of which 2.9 TWh is the quota that can be technically met by DH with acceptable distribution costs. Moreover, 2.2 TWh is the clustered heat demand, and of this, 0.2 TWh is also competitive with respect to the individual heating solutions. This means that an economic potential of 4% can be reached if calculated with respect to the technical potential, or 10% if calculated with respect to the clustered heat demand. It is again a pretty low value, which however demonstrates how a four-fold and a ten-fold increase, respectively, in 4GDH potential, can be obtained if the refurbishment is applied to the whole building stock of an area and not only to a smaller part of it.
By looking at Figure 19 and Figure 20, it can be seen how a market share of about 10% in the third scenario, with the refurbishment of 40% of the entire building stock, can become a 25% market share with refurbishment applied to 100% of the building stock.
Eventually, an additional consideration that can be done is that the potential of 4th generation district heating could increase if the system charges in the electric bills are assumed to be lower in future energy systems. With the hypothesis that the electrical cost will be halved, DH potential in scenario #4 will be equal to 7% or 18%, based on the considered denominator. Indeed, 0.43 TWh is the estimated economic potential, over a technical potential of 6 TWh in the Province of Milan and a clustered heat demand of 2.3 TWh.

4. Conclusions

The aim of this work was to provide a methodology for the assessment of the technical and economic potential of DH at a large-scale level without overlooking the local features of this technology. To this end, a new mapping-based approach has been developed and applied to the Metropolitan City of Milan at census level.
In order to investigate the current and, especially, the future sustainability of DH with the foreseen building refurbishment and consequent heat demand reduction, the methodology has been applied to four different scenarios, and the obtained results have been compared. Moreover, to validate these results and to enhance the added value of the proposed approach, the methodology from the HRE project, which is currently the most referenced one, has also been applied. The results obtained through the application of both the methodologies have been then compared.
Besides the estimation and the mapping of the heat demand and of the available heat sources in the area under study, the main novelty of the work here presented stood in the clustering algorithm. It allowed grouping the census areas characterized by high heat demand and relatively close to each other. In this way, the geographical aspect of the problem is considered in a unique step: DH potential is assessed by excluding those areas that are considered with the reference approach, but that would be anyway neglected if the geographical aspect is considered a posteriori.
For what concerns the comparison of the analyzed scenarios, the outcomes proved that lower heat demand corresponds to higher network costs, with consequently reduced district heating potential, but also proved that the properties of low-temperature district heating could potentially compensate for the drop in its cost-effectiveness. Another interesting finding is that the renovation of buildings should not be performed evenly but in synergy with DH diffusion in order to obtain effective results in terms of the technical and economic potential of this technology. Given a specific area to be served, the refurbishment should be made on the whole existing buildings so that they can all be connected to a low-temperature network in which the heat distributed mainly comes from renewable and excess heat sources. The refurbishment of only a fraction of the entire building stock of the area would drop DH potential for the simple reason that the area could not be served competitively by networks at high temperature nor by networks at low temperature. For example, if among several refurbished buildings characterized by low-temperature heat demand, there are some not-renovated buildings with high-temperature demand, the intrinsic advantages that 4GDH can theoretically bring could not be enjoyed. Indeed, if the district heating installed in this case is taken as an example, a heat pump for temperature upgrade would be required in all the substations, increasing very rapidly the overall cost of the system.
Since it is practically impossible to instantly renovate a whole territory in which areas with different urbanistic parameters can coexist, one of the major conclusions of the work is that a method for the selection of the most appropriate areas to be refurbished is highly required. In those identified areas, 4th generation district heating could be installed, and its potential could be significant. In this sense, future correlated research could be aimed at developing approaches based on statistical tools and georeferenced data to identify areas whose renovation could lead to a higher DH potential.
Regarding the comparison of the proposed approach with the reference one, the main consideration that can be done is that DH potential appears to be lower with the first-mentioned approach, but it is a more comprehensive result. Indeed, it takes into account the amount of heat required with also the relative position of the heat demands and their location with respect to the available heat sources. Therefore, this disparity should be seen as proof that those areas that may be characterized by high heat demand but are far from each other can be excluded in a unique step since the spatial analysis is not done a posteriori as it would be required in the reference approach.
Besides paving the way towards other important research studies, the approach here presented can be seen as an effective mapping-based methodology. It can be replicated to other cities, according to their characteristics and heat market starting conditions, with the possibility to obtain interesting location-related results to be potentially used as a foundation for the definition and the implementation of roadmaps, policies or directives towards future integrated energy system.
One critical aspect of this methodology could be the fact that the clustering algorithm is strongly dependent on the choice of the input parameters, thus requiring a prior analysis, which will be necessarily dependent on the starting characteristics of the area under study. Slightly different input parameter values can lead to very different results, and, therefore, the choice of the most appropriate values is a very sensitive issue. Nevertheless, the clustering algorithm can also be seen as the strong point of the analysis and the main novelty presented in this work. Indeed, it allows defining district heating potential also on the basis of the geographical distribution of the heat demands, becoming very useful to assess DH potential at a large scale without overlooking the fundamental local aspects of this technology. In conclusion, this study provides a model for the assessment of the potential of 3rd and 4th generation district heating at a large-scale level, whose application could contribute to a deeper appreciation of the associated benefits and criticisms.

Author Contributions

Conceptualization, A.D. and F.F.; data curation, G.S. and S.M.; formal analysis, G.S., A.D. and F.F.; funding acquisition, M.M.; methodology, G.S., A.D., F.F. and U.P.; project administration, A.D., F.F. and M.M.; software, G.S.; validation, G.S. and A.D.; scientific supervision, A.D., F.F., M.M. and U.P.; visualization, S.M. and G.S.; writing—original draft, G.S.; writing—review and editing, G.S. and A.D. All authors have read and agreed to the published version of the manuscript.

Funding

This research was funded by the Italian district heating association, AIRU and by the Italian association of multiutilities, UTILITALIA, in the framework of the project “Valutazione del potenziale di diffusione del teleriscaldamento efficiente su territorio nazionale”; by the EIT Climate-KIC in the framework of the project “Deep Demonstration: Milan” (DDMI) and of the project “Analysis on new models for 4GDH in Italy: an innovative tool for the fast integration of RES sources?”.

Institutional Review Board Statement

Not applicable.

Informed Consent Statement

Not applicable.

Acknowledgments

The methodology presented in this work has been developed in the framework of the project “Valutazione del potenziale di diffusione del teleriscaldamento efficiente su territorio nazionale” which has been funded by AIRU, the Italian District Heating Association, Utilitalia, the Italian association of multiutilities. The application of the case study has been developed in the framework of the project “Analysis on new models for 4GDH in Italy: an innovative tool for the fast integration of RES sources?” funded by Climate-KIC. The authors gratefully acknowledge the above-mentioned involved parties, together with the Milano municipality and AMAT, that have provided the important inputs for the analysis.

Conflicts of Interest

The authors declare no conflict of interest.

References

  1. Mathiesen, B.V. Aalborg Universitet. Towards a Decarbonised Heating and Cooling Sector in Europe: Unlocking the Potential of Energy Efficiency and District Energy. 2019. Available online: https://vbn.aau.dk/ws/portalfiles/portal/316535596/Towards_a_decarbonised_H_C_sector_in_EU_Final_Report.pdf (accessed on 3 May 2021).
  2. Werner, S.; Constantinescu, N. EcoHeatCool WP1: The European Heat Market. Available online: http://www.euroheat.org/Files/Filer/ecoheatcool/documents/Ecoheatcool_WP1_Web.pdf (accessed on 2 March 2020).
  3. European Commission. DIRECTIVE 2004/8/ec of the european parliament and of the council of 11 February 2004 on the promotion of cogeneration based on a useful heat demand in the internal energy market and amending Directive 92/42/EEC. J. Eur. Union 2004, 66, 50–60. [Google Scholar]
  4. European Commission. EU Strategy on Heating and Cooling; European Commission: Bruxelles, Belgium, 2016. [Google Scholar]
  5. Werner, S.; Frederiksen, S. District Heating and Cooling; Studentlitteratur AB: Stockholm, Sweden, 2013. [Google Scholar]
  6. Connolly, D.B.V.; Mathiesen, B.; Möller, H.; Lund, U.P.; Werner, S. Heat Roadmap Europe 1-First Pre-Study for the EU27; Aalborg University: Aalborg, Denmark, 2012. [Google Scholar]
  7. European Commission. A Clean Planet for All. A European Long-Term Strategic Vision for a Prosperous, Modern, Competitive and Climate Neutral Economy. 2018. Available online: https://eur-lex.europa.eu/legal-content/EN/TXT/PDF/?uri=CELEX:52018DC0773&from=EN (accessed on 14 March 2021).
  8. Li, H.; Nord, N. Transition to the 4th generation district heating-possibilities, bottlenecks, and challenges. Energy Procedia 2018, 149, 483–498. [Google Scholar] [CrossRef]
  9. Paardekooper, S. Heat Roadmap Europe Quantifying the Impact of Low-Carbon; Aalborg University: Aalborg, Denmark, 2018. [Google Scholar]
  10. Pezzutto, S. Hotmaps_ D2 3 WP2 Report Open Data Set for the EU28. 2019. Available online: https://www.hotmaps-project.eu/wp-content/uploads/2018/03/D2.3-Hotmaps_for-upload_revised-final_.pdf (accessed on 25 November 2019).
  11. Rosa, D. IEA DHC Annex X Final Report: Toward 4th Generation District Heating. Experience and Potential of Low-Temperature District Heating. 2014. Available online: https://backend.orbit.dtu.dk/ws/portalfiles/portal/105525998/IEA_Annex_X_Toward_4th_Generation_District_Heating_Final_Report.pdf (accessed on 25 November 2019).
  12. Lund, R.; Persson, U. Mapping of potential heat sources for heat pumps for district heating in Denmark. Energy 2016, 110, 129–138. [Google Scholar] [CrossRef]
  13. Bühler, F.M.; Holm, B.; Huang, J.G.; Elmegad, B. Mapping of Low Temperature Heat Sources in Denmark, ECOS 2015. Available online: https://orbit.dtu.dk/en/publications/mapping-of-low-temperature-heat-sources-in-denmark (accessed on 14 March 2021).
  14. Kontu, K.; Rinne, S.; Junnila, S. Introducing modern heat pumps to existing district heating systems-Global lessons from viable decarbonizing of district heating in Finland. Energy 2019, 166, 862–870. [Google Scholar] [CrossRef]
  15. Averfalk, H.; Ingvarsson, P.; Persson, U.; Gong, M.; Werner, S. Large heat pumps in Swedish district heating systems. Renew. Sustain. Energy Rev. 2017, 79, 1275–1284. [Google Scholar] [CrossRef]
  16. Somogyi, V.; Sebestyén, V.; Domokos, E. Assessment of wastewater heat potential for district heating in Hungary. Energy 2018, 163, 712–721. [Google Scholar] [CrossRef]
  17. Wahlroos, M.; Pärssinen, M.; Manner, J.; Syri, S. Utilizing data center waste heat in district heating-Impacts on energy efficiency and prospects for low-temperature district heating networks. Energy 2017, 140, 1228–1238. [Google Scholar] [CrossRef]
  18. Huang, P.; Copertaro, B.; Zhang, X.; Shen, J.; Löfgren, I.; Rönnelid, M.; Fahlen, J.; Andersson, D.; Svanfeldt, M. A review of data centers as prosumers in district energy systems: Renewable energy integration and waste heat reuse for district heating. Appl. Energy 2020, 258, 114109. [Google Scholar] [CrossRef]
  19. Petrovic, S.; Bühler, F.; Radoman, U. Power transformers as excess heat sources. In Proceedings of the 32nd International Conference on Efficiency, Cost, Optimization, Simulation and Environmental Impact of Energy Systems, Wroclaw, Poland, 23–28 June 2019. [Google Scholar]
  20. Nielsen, S.; Hansen, K.; Lund, R.; Moreno, D. Unconventional Excess Heat Sources for District Heating in a National Energy System Context. Energies 2020, 13, 5068. [Google Scholar] [CrossRef]
  21. Berthou, M.; Bory, D. Overview of Waste Heat in the Industry in France; ECEE: Stockholm, Sweden, 2012; pp. 453–459. [Google Scholar]
  22. Werner, S. Ecoheatcool WP4: Possibilities with more district heating in Europe Work. Energy 2006, 137, 617–631. [Google Scholar] [CrossRef]
  23. Persson, U.; Werner, S. District heating in sequential energy supply. Appl. Energy 2012, 95, 123–131. [Google Scholar] [CrossRef]
  24. Dénarié, A.; Muscherà, M.; Calderoni, M.; Motta, M. Industrial excess heat recovery in district heating: Data assessment methodology and application to a real case study in Milano, Italy. Energy 2019, 166, 170–182. [Google Scholar] [CrossRef]
  25. Persson, U.; Möller, B.; Wiechers, E. Methodologies and Assumptions Used in the Mapping (D2.3). 2015, p. 114. Available online: https://heatroadmap.eu/wp-content/uploads/2018/11/D2.3_Revised-version_180928.pdf (accessed on 26 November 2020).
  26. Unternährer, J.; Moret, S.; Joost, S.; Maréchal, F. Spatial clustering for district heating integration in urban energy systems: Application to geothermal energy. Appl. Energy 2017, 190, 749–763. [Google Scholar] [CrossRef] [Green Version]
  27. Knies, J. Shaping Energetic Neighbourhoods: A Dynamic Approach for A Future Proof Urban Energy Planning. In Proceedings of the World Sustainable Built Environment, Hong Kong, 13 June 2017. [Google Scholar] [CrossRef]
  28. Knies, J. A spatial approach for future-oriented heat planning in urban areas. Int. J. Sustain. Energy Plan. Manag. 2018, 16, 3–30. [Google Scholar] [CrossRef]
  29. Persson, U.; Wiechers, E.; Möller, B.; Werner, S. Heat Roadmap Europe: Heat distribution costs. Energy 2019, 176, 604–622. [Google Scholar] [CrossRef]
  30. Politecnico di Milano; Politecnico di Torino. Valutazione del Potenziale di Diffusione del Teleriscaldamento Efficiente sul Territorio Nazionale; AIRU: Torino, Italy, 2020. [Google Scholar]
  31. Pozzi, M.; Denarie, A.; Fattori, F.; Macchi, S.; Cirillo, V.F.; Motta, M. A transparent assessment of retrofit potential in Italy based on open data. In Proceedings of the 6th International Conference on Smart Energy Systems, Aalborg, Denmark, 6–7 October 2020. [Google Scholar]
  32. Istat-Istituto Nazionale di Statistica. Available online: https://www.istat.it/it/archivio/104317 (accessed on 26 November 2020).
  33. CENED-Certificazione Energetica Degli EDifici. Available online: http://www.cened.it/opendata-cened-2.0 (accessed on 26 November 2020).
  34. GSE, Valutazione del Potenziale Nazionale e Regionale di Applicazione Della Cogenerazione ad Alto Rendimento e Del Teleriscaldamento Efficiente. 2016. Available online: https://ec.europa.eu/energy/sites/ener/files/documents/it_potenziale_car_tlr_nazionale_e_regionale_dic_2016.pdf (accessed on 25 November 2019).
  35. Hotmaps. The Open Source Mapping and Planning Tool for Heating and Cooling. Available online: https://www.hotmaps.hevs.ch/map (accessed on 3 March 2020).
  36. Persson, U.; Werner, S. Heat distribution and the future competitiveness of district heating. Appl. Energy 2011, 88, 568–576. [Google Scholar] [CrossRef]
  37. Persson, U.; Werner, S. Effective Width: The Relative Demand for District Heating Pipes Length in City Areas. In Proceedings of the 12th International Symposium on District Heating and Cooling, Tallinn, Estonia, 5–7 September 2010; pp. 129–131. [Google Scholar]
  38. Nielsen, S.; Möller, B. GIS based analysis of future district heating potential in Denmark. Energy 2013, 57, 458–468. [Google Scholar] [CrossRef] [Green Version]
  39. Dénarié, A.; Macchi, S.; Fattori, F.; Spirito, F.; Persson, U. A validated method to simulate district heating network topologies to enable assessing district heating costs. Int. J. Sustain. Energy Plan. Manag. 2021, 31, 59–78, submitted for publication. [Google Scholar] [CrossRef]
  40. RSE. Indagine Sulle Potenzialità del Teleriscaldamento a Livello Nazionale; Politecnico di Milano: Milano, Italy, 2005. [Google Scholar]
  41. Clustering—Scikit-Learn 0.23.1 Documentation. Available online: https://scikit-learn.org/stable/modules/clustering.html#clustering (accessed on 29 June 2020).
  42. Wikipedia The Free Encyclopedia. 2021. Available online: https://en.wikipedia.org/wiki/DBSCAN (accessed on 14 March 2021).
  43. ISPRA. Catasto Rifiuti Sezione Nazionale; ISPRA: Rome, Italy, 2018. [Google Scholar]
  44. Data Center Map. 2007. Available online: https://www.datacentermap.com/ (accessed on 3 March 2020).
  45. Heat Roadmap Europe. Pan-European Thermal Athlas (PETA 4.3). Available online: https://heatroadmap.eu/peta4/ (accessed on 3 March 2020).
  46. Dénarié, A.; Fattori, F.; Spirito, G.; Macchi, S.; Cirillo, V.F.; Motta, M.; Persson, U. Assessment of waste and renewable heat recovery in DH through GIS mapping: The national potential in Italy. Smart Energy 2021, 1, 100008. [Google Scholar] [CrossRef]
  47. Martynovsky, V.S. Cycles, diagrams and specifications for thermo transformers. Energy 1979, 21–29. [Google Scholar]
  48. The Danish Energy Agency and Energinet, Technology Data-Generation of Electricity and District Heating. 2016. Available online: https://ens.dk/sites/ens.dk/files/Statistik/technology_data_catalogue_for_el_and_dh_-_0009.pdf (accessed on 30 November 2020).
  49. Danish Energy Agency and Energinet; Technology Data for Heating Installations, Copenhagen, Denmark. 2016. Available online: https://ens.dk/sites/ens.dk/files/Analyser/technology_data_catalogue_for_individual_heating_installations.pdf (accessed on 30 November 2020).
  50. Persson, U.; Nilsson, D.; Möller, B.; Werner, S. Mapping Local European Heat Resources: A Spatial Approach to Identify Favourable Synergy Regions for District Heating. Proc. DHC13, 13th Int. Symp. Dist. Heat. Cool. 2012. Available online: https://www.diva-portal.org/smash/get/diva2:550932/FULLTEXT02.pdf (accessed on 8 May 2020).
Figure 1. Graphical representation of the possible terms of comparison between the individual heating solution and district heating. Adapted with permission from ref. [29]. Copyright 2021; Urban Persson, Eva Wiecher, Bernd Möller, Sven Werner.
Energies 14 02627 g001
Figure 2. Schematic representation of the methodology developed and used in this work for DH potential assessment. Step 1 in yellow, step 2 in orange, step 3 in red, step 4 in green, step 5 in blue and step 6 bolded in black. Boxes labelled a, b and c are summed in step 5 to obtain DH total cost.
Energies 14 02627 g002
Figure 3. Illustration of DBSCAN clustering algorithm. Source: [42].
Energies 14 02627 g003
Figure 4. Trend of the clustered heat demand (blue line) and the distribution cost (orange line) to varying of the ε parameter.
Energies 14 02627 g004
Figure 5. Absolute distribution total costs (blue line) and difference quotient of the clustered heat demand (orange line) over the interval ε = 0.005 ÷ 0.155.
Energies 14 02627 g005
Figure 6. Map of the province of Milan at the census level. The census areas are colored according to the estimated technical potential filtered by considering an acceptable distribution cost. Scenario 1.
Energies 14 02627 g006
Figure 7. Map of the province of Milan, with the generated heat demand clusters distinguished by color. Scenario 1.
Energies 14 02627 g007
Figure 8. Procedure used for the calculation of the excess heat recoverable through a DH system, from the primary energy consumption of the excess heat source.
Energies 14 02627 g008
Figure 9. Heat pump COP as function of evaporator temperature for different values of condensation temperature.
Energies 14 02627 g009
Figure 10. Heat map of a portion of the Province of Milan. Heat supply sources not belonging to any cluster are reported as black points and they are connected to the nearest cluster through the “distance to the nearest hub” QGIS processing tool.
Energies 14 02627 g010
Figure 11. Specific distribution total cost per census area for scenario 1. Results representative of the reference methodology.
Energies 14 02627 g011
Figure 12. Specific distribution total cost per cluster for scenario 1. Results representative of the developed methodology.
Energies 14 02627 g012
Figure 13. Map of the census areas with an associated specific distribution total cost lower or equal to 50 €/MWh. Scenario 1.
Energies 14 02627 g013
Figure 14. Map of the clusters with an associated specific distribution total cost lower or equal to 50 €/MWh. Scenario 1.
Energies 14 02627 g014
Figure 15. Average specific distribution total cost per cluster. Curves are constructed for each studied scenario by ordering the values in ascending order.
Energies 14 02627 g015
Figure 16. Average linear heat density obtained in each generated cluster. Values are reported in ascending order and for each studied scenario.
Energies 14 02627 g016
Figure 17. Representation of the total DH costs reported in ascending order and compared to relative individual heating system cost in each identified cluster for Scenario 1.
Energies 14 02627 g017
Figure 18. Representation of the total DH costs reported in ascending order and compared to relative individual heating system cost in each identified cluster for Scenario 2.
Energies 14 02627 g018
Figure 19. Representation of the total DH costs reported in ascending order and compared to relative individual heating system cost in each identified cluster for Scenario 3.
Energies 14 02627 g019
Figure 20. Representation of the total DH costs reported in ascending order and compared to relative individual heating system cost in each identified cluster for Scenario 4.
Energies 14 02627 g020
Table 1. Overview of the obtained DH potential (%) in each analyzed scenario, together with the results of each step of the methodology.
Scenarios
1234
DH technology ( T s )3GDH
(90 °C)
3GDH
(90 °C)
4GDH
(40 °C)
4GDH
(40 °C)
Heat demand [TWh]at census area levelTechnical potential23.622.53.26.1
Tech. pot. with acceptable distribution cost13.312.71.32.9
at cluster levelClustered heat demand10.19.71.022.2
Economic potential3.362.80.020.2
Average total cost [€/MWh]at cluster levelDH total cost148.5190.4973.4467.2
Individual heating system cost178.5178.5176.6176.6
DH potential [%] Over the total heat demand14%12%0.5%4%
Over the clustered heat demand33%28%1.5%10%
Publisher’s Note: MDPI stays neutral with regard to jurisdictional claims in published maps and institutional affiliations.

