
Design and Performance Evaluation of a Heat Pump System Utilizing a Permanent Dewatering System


Abstract
:1. Introduction
- How much energy can be transferred by PD modules under variable amounts of groundwater inflow?
- To what extent can the COP of the PDHP be improved compared with that of an ASHP under equivalent conditions?
2. Permanent Dewatering Heat Pump System
3. Simulation-Based PDHP System Analysis
4. Simulation Results and Discussions
4.1. Design Capacity of a Single PD Module
4.2. Design of Multiple PDHP System
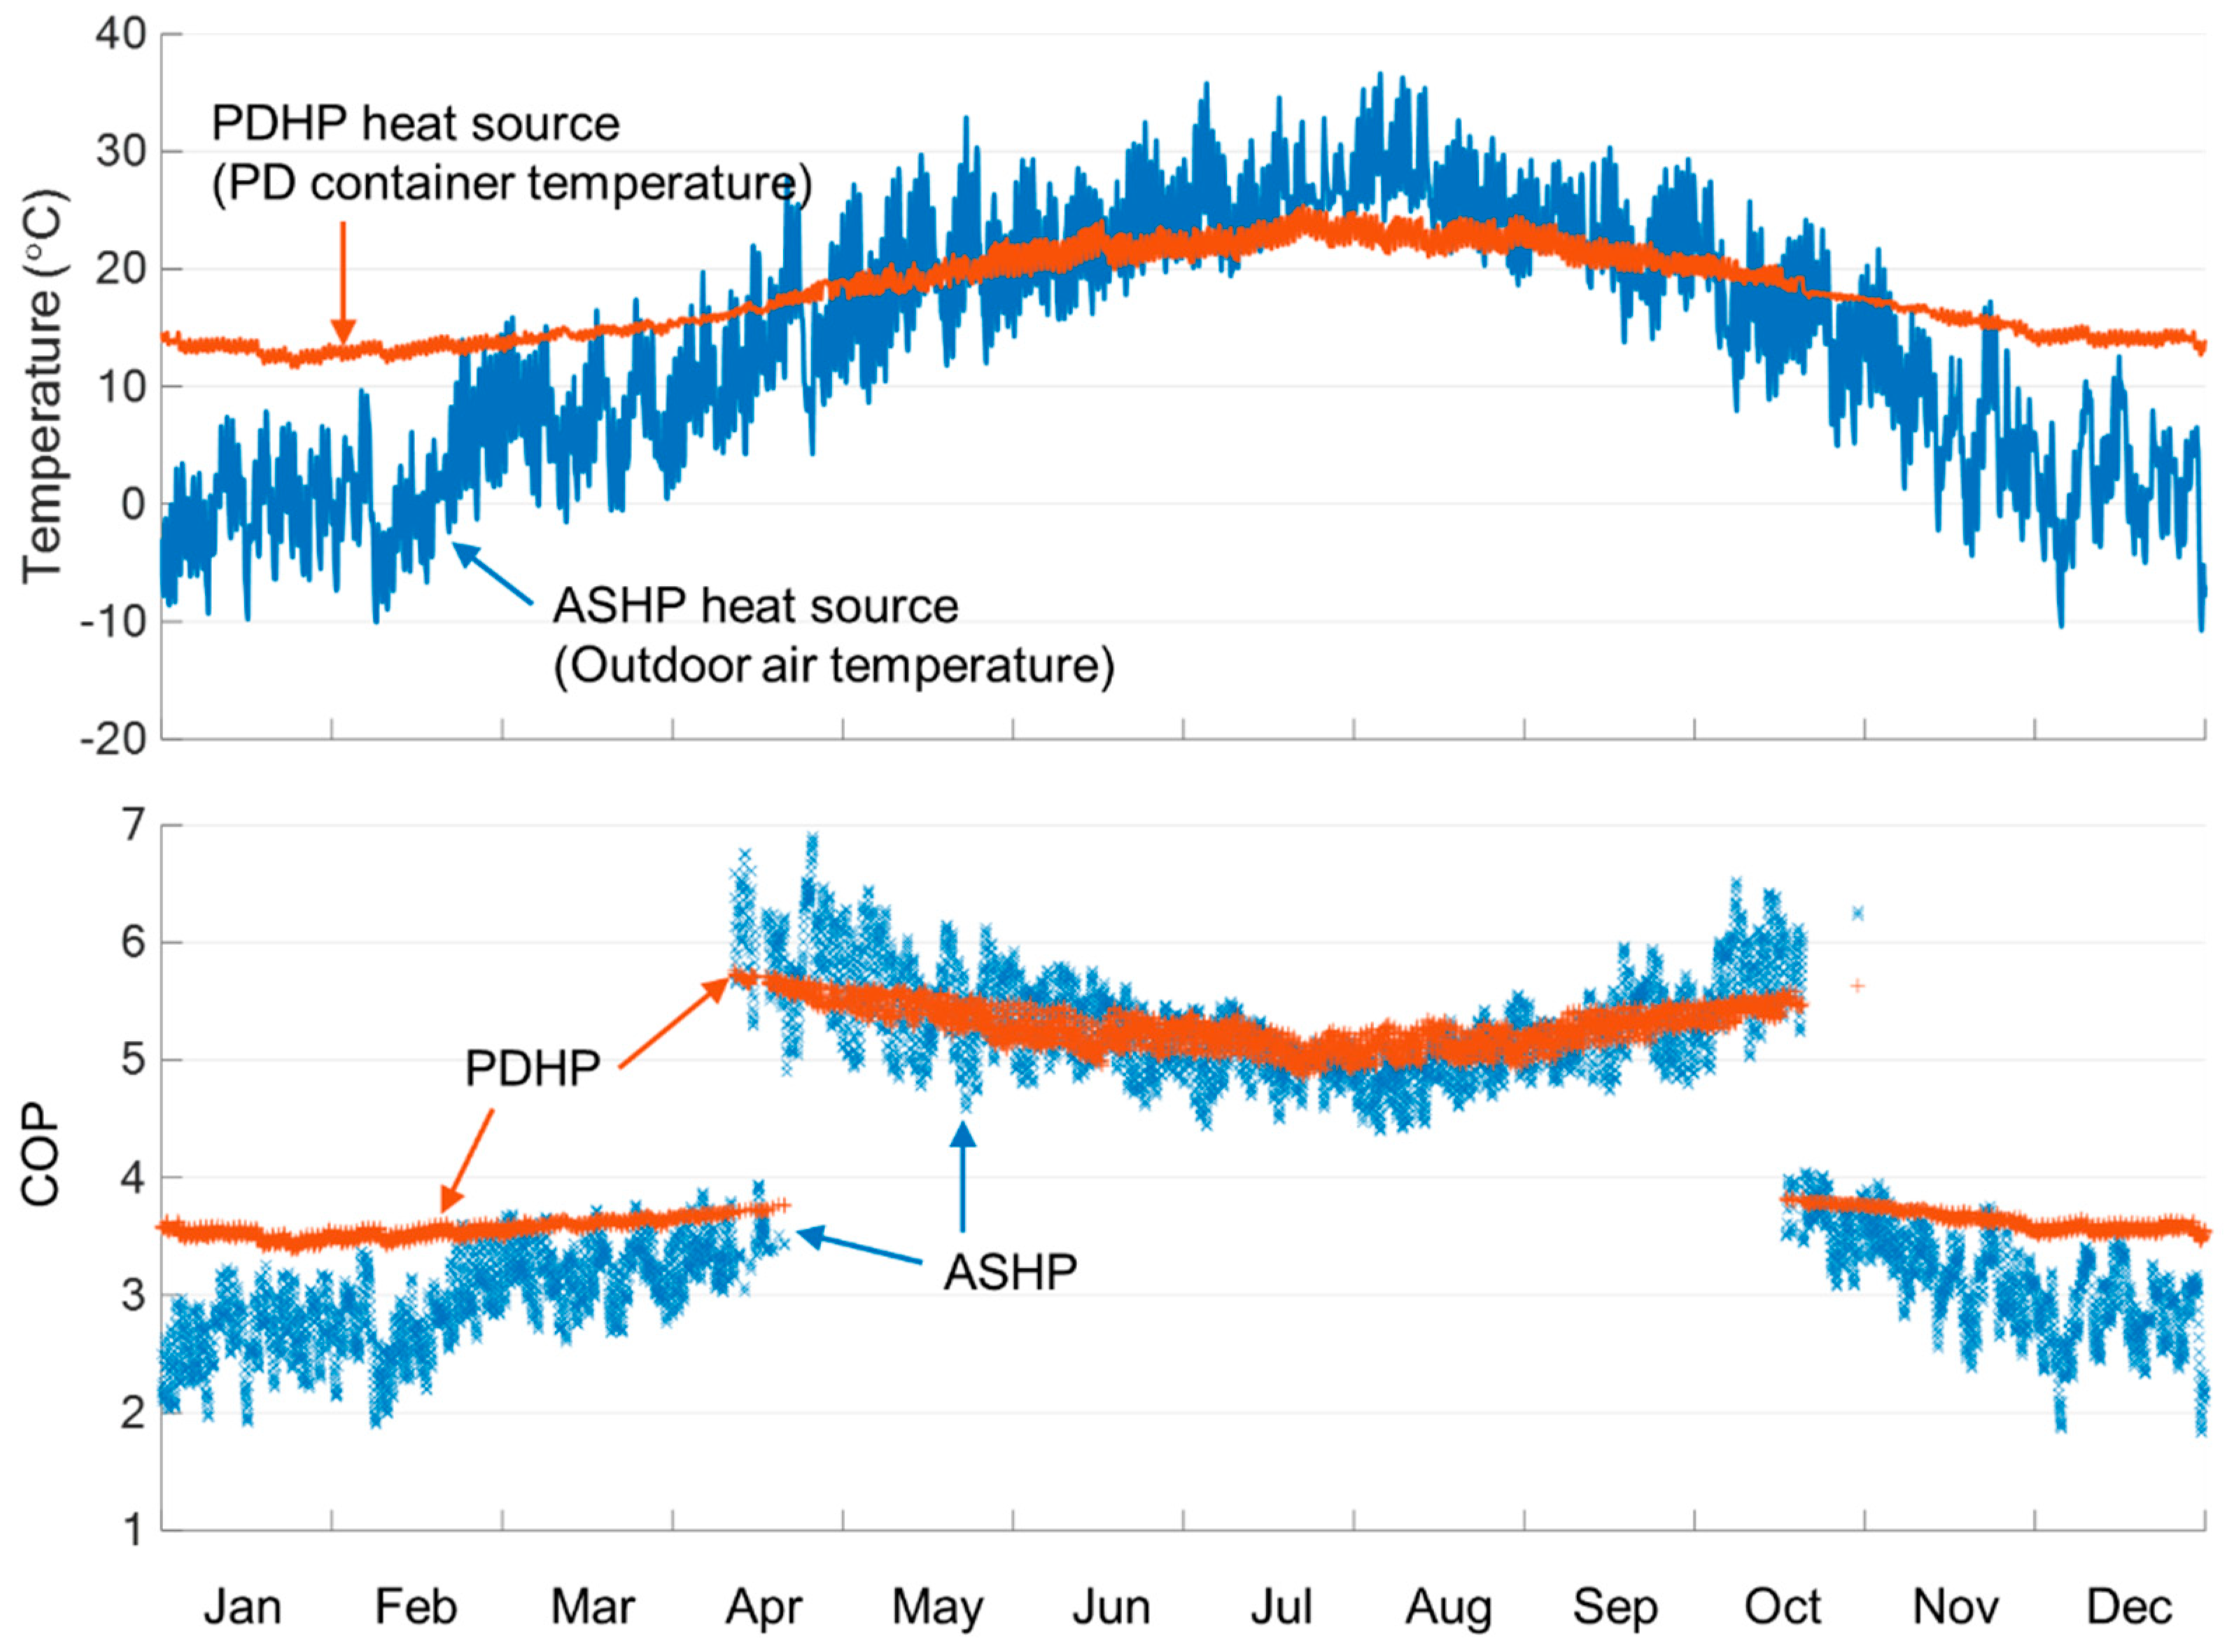
4.3. Comparison with an Air Source Heat Pump (ASHP) System
5. Conclusions
Author Contributions
Funding
Institutional Review Board Statement
Informed Consent Statement
Data Availability Statement
Acknowledgments
Conflicts of Interest
Abbreviations
| ASHP | Air-source heat pump |
| COP | Coefficient of performance |
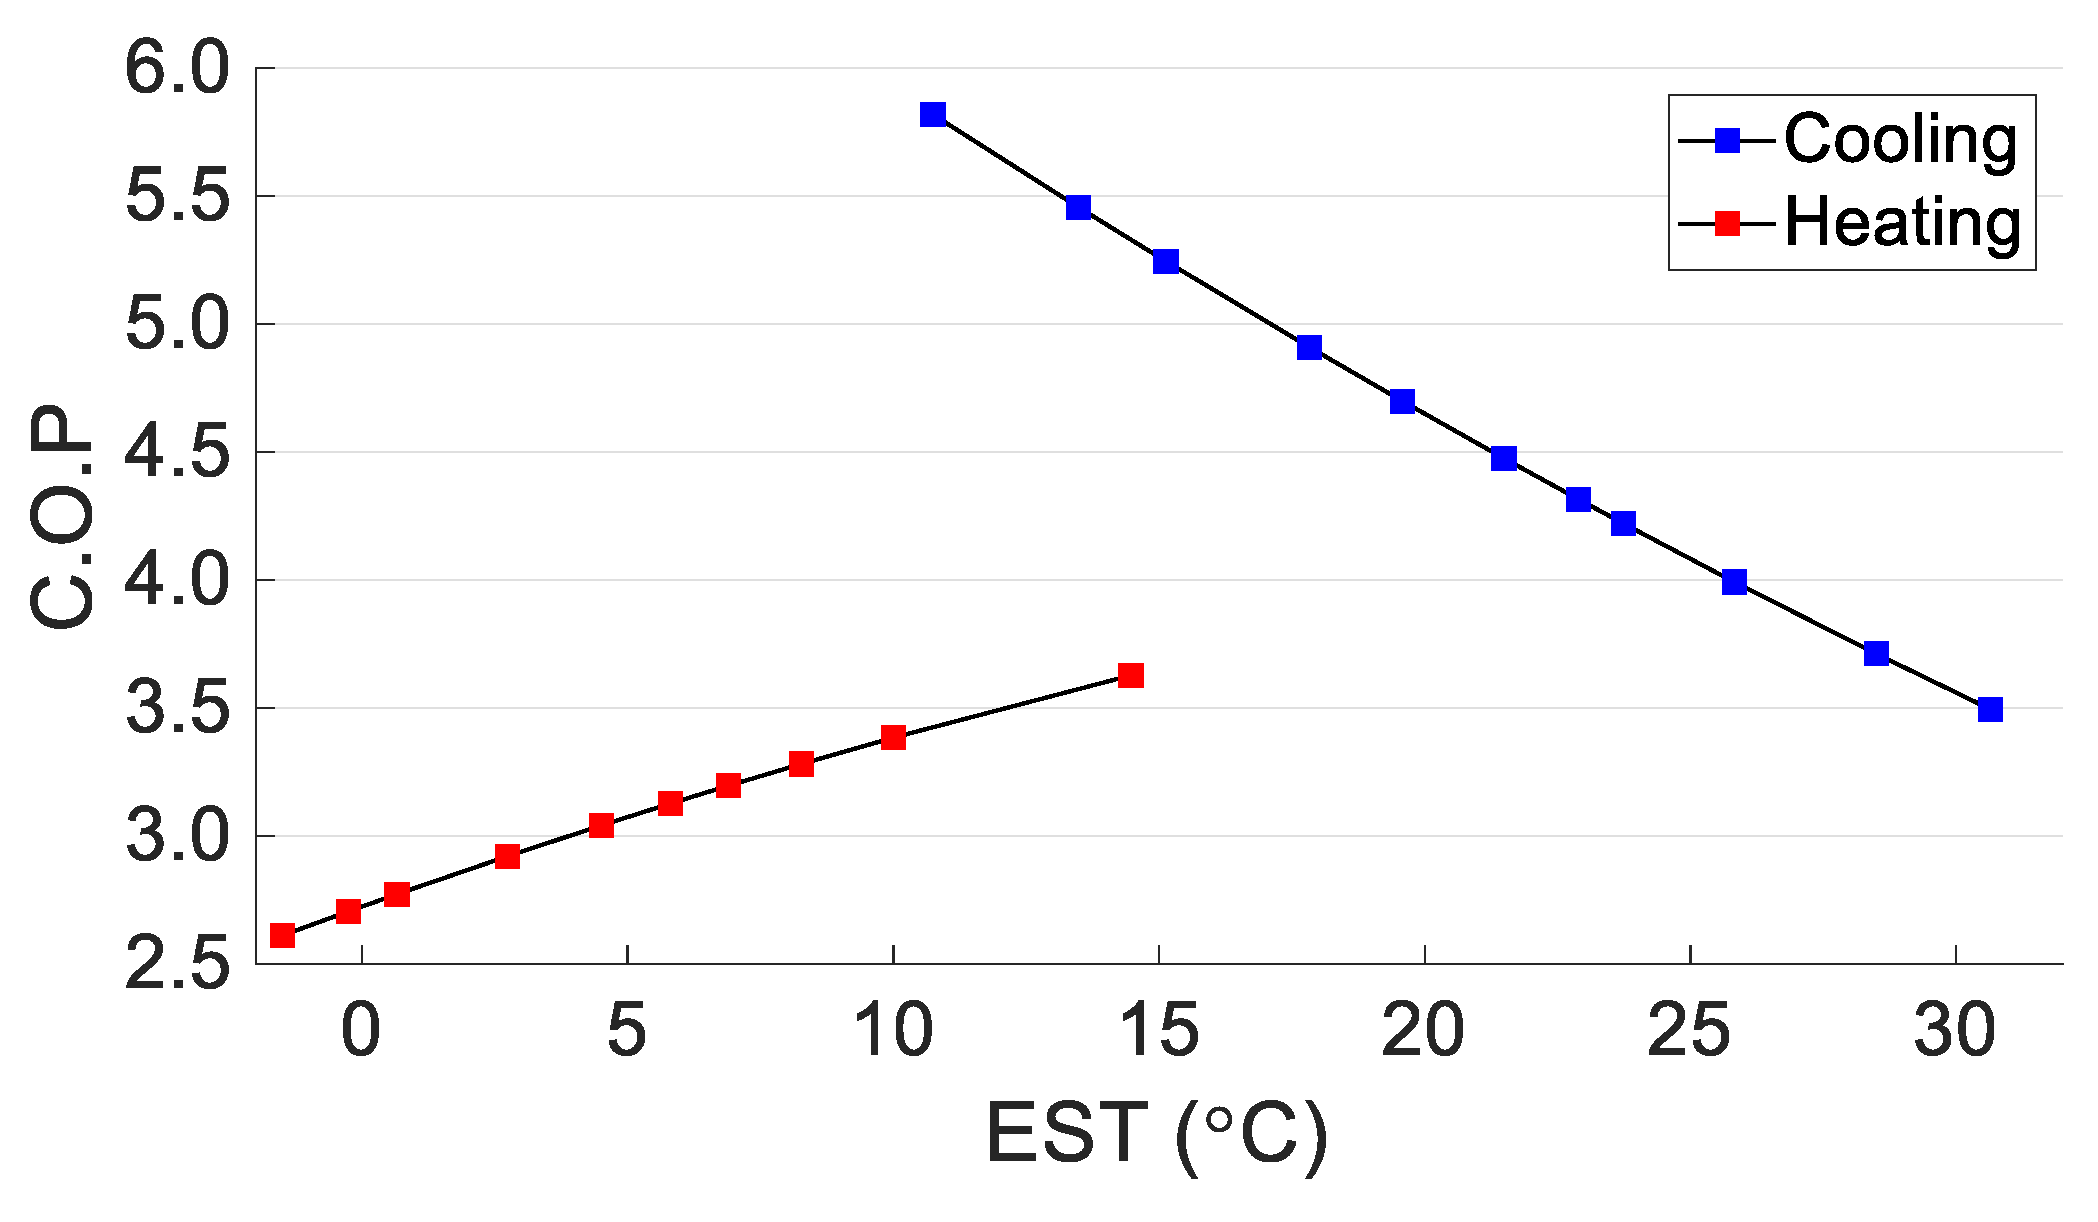
| EST | Entering source-side temperature to heat pump |
| GW | Ground water |
| GWHP | Ground water heat pump |
| HP | Heat pump |
| HX | Heat exchanger |
| LST | Leaving source-side temperature from heat pump |
| PD | Permanent dewatering |
| PDHP | Permanent dewatering heat pump |
| PDHX | Permanent dewatering heat exchanger |
| SWHP | Sewage water heat pump |
| WWHP | Wastewater heat pump |
Nomenclatures
| Cooling COP (-) | |
| Heating COP (-) | |
| Specific heat (kJ/kg°C) | |
| effective height (m) | |
| Mass flow rate of ground water inlet (Lpm) | |
| Mass flow rate of heat pump source side (Lpm) | |
| Mass flow rate of PDHX coil (Lpm) | |
| Number of PD modules (-) | |
| Peak building load (kW) | |
| Heat pump load (kW) | |
| Heat transfer rate of permanent dewatering heat pump (kW) | |
| Ground water inlet temperature (°C) | |
| Ground water outlet temperature (°C) | |
| Difference in mass flow rate of ground water inlet | |
| Difference in heat transfer rate of permanent dewatering heat pump | |
| Temperature difference of heat pump source side, LST-EST |
References
- 2019 Global Status Report for Buildings and Construction: Towards a Zero-Emissions, Efficient and Resilient Buildings and Construction Sector. 2019. Available online: https://wedocs.unep.org/handle/20.500.11822/30950?show=full (accessed on 18 April 2021).
- Langevin, J.; Harris, C.B.; Reyna, J.L. Assessing the Potential to Reduce U.S. Building CO2 Emissions 80% by 2050. Joule 2019, 3, 2403–2424. [Google Scholar] [CrossRef] [Green Version]
- Radhi, H. Evaluating the potential impact of global warming on the UAE residential buildings–A contribution to reduce the CO2 emissions. Build. Env. 2009, 44, 2451–2462. [Google Scholar] [CrossRef]
- Seoul Metropolitan Government. Green Building Design Standard; Seoul Metropolitan Government: Seoul, Korea, 2019.
- Notaro, V.; Puleo, V.; Fontanazza, C.M.; Sambito, M.; La Loggia, G. A Decision Support Tool for Water and Energy Saving in the Integrated Water System. Procedia Eng. 2015, 119, 1109–1118. [Google Scholar] [CrossRef] [Green Version]
- Freni, G.; Sambito, M. Energy Saving and Recovery Measures in Integrated Urban Water Systems. In AIP Conference Proceedings; AIP Publishing LLC: Melville, NY, USA, 2017; Volume 1, p. 190008. [Google Scholar] [CrossRef]
- Kastrinos, J.R.; Chiasson, A.; Ormond, P. Estimating groundwater heat exchange in a standing-column well by injection of a bromide tracer. Geothermics 2019, 82, 121–127. [Google Scholar] [CrossRef]
- Hervás-Blasco, E.; Navarro-Peris, E.; Corberán, J.M. Closing the residential energy loop: Grey-water heat recovery system for domestic hot water production based on heat pumps. Energy Build. 2020, 216. [Google Scholar] [CrossRef]
- Qin, N.; Hao, P.Z. The operation characteristics of sewage source heat pump system and the analysis of its thermal economic benefits. Appl. Therm. Eng. 2017, 124, 1083–1089. [Google Scholar] [CrossRef]
- Zhang, Y.; Akkurt, N.; Yuan, J.; Xiao, Z.; Wang, Q.; Gang, W. Study on model uncertainty of water source heat pump and impact on decision making. Energy Build. 2020, 216, 109950. [Google Scholar] [CrossRef]
- Cho, Y.; Yun, R. A raw water source heat pump air-conditioning system. Energy Build. 2011, 43, 3068–3073. [Google Scholar] [CrossRef]
- Luo, J.; Xue, W.; Shao, H. Thermo-economic comparison of coal-fired boiler-based and groundwater-heat-pump based heating and cooling solution–A case study on a greenhouse in Hubei, China. Energy Build. 2020, 223, 110214. [Google Scholar] [CrossRef]
- Song, W.; Ni, L.; Yao, Y. Experimental research on the characteristics of single-well groundwater heat pump systems. Energy Build. 2019, 191, 1–12. [Google Scholar] [CrossRef]
- Zhou, X.; Gao, Q.; Chen, X.; Yu, M.; Zhao, X. Numerically simulating the thermal behaviors in groundwater wells of groundwater heat pump. Energy 2013, 61, 240–247. [Google Scholar] [CrossRef]
- Shen, C.; Jiang, Y.; Yao, Y.; Wang, X. An experimental comparison of two heat exchangers used in wastewater source heat pump: A novel dry-expansion shell-and-tube evaporator versus a conventional immersed evaporator. Energy 2012, 47, 600–608. [Google Scholar] [CrossRef]
- Ferguson, G. Characterizing uncertainty in groundwater-source heating and cooling projects in Manitoba, Canada. Energy 2012, 37, 201–206. [Google Scholar] [CrossRef]
- Russo, S.L.; Taddia, G.; Baccino, G.; Verda, V. Different design scenarios related to an open loop groundwater heat pump in a large building: Impact on subsurface and primary energy consumption. Energy Build. 2011, 43, 347–357. [Google Scholar] [CrossRef]
- Nam, Y.; Ooka, R.; Shiba, Y. Development of dual-source hybrid heat pump system using groundwater and air. Energy Build. 2010, 42, 909–916. [Google Scholar] [CrossRef]
- Song, J.; Liu, Z.; Ma, Z.; Zhang, J. Experimental investigation of convective heat transfer from sewage in heat exchange pipes and the construction of a fouling resistance-based mathematical model. Energy Build. 2017, 150, 412–420. [Google Scholar] [CrossRef]
- Wang, G.; Wang, W.; Luo, J.; Zhang, Y. Assessment of three types of shallow geothermal resources and ground-source heat-pump applications in provincial capitals in the Yangtze River Basin, China. Renew. Sustain. Energy Rev. 2019, 111, 392–421. [Google Scholar] [CrossRef]
- Maddah, S.; Goodarzi, M.; Safaei, M.R. Comparative study of the performance of air and geothermal sources of heat pumps cycle operating with various refrigerants and vapor injection. Alex. Eng. J. 2020, 59, 4037–4047. [Google Scholar] [CrossRef]
- Yun, S.W.; Choi, H.; Lee, J. Comparison of groundwater levels and groundwater qualities in six megacities of Korea. J. Geol. Soc. Korea 2014, 4036, 517–528. [Google Scholar] [CrossRef]
- Klein, S.A. TRNSYS 17: A Transient System Simulation Program; Solar Energy Laboratory University: Madison, WI, USA, 2010. [Google Scholar]
- Seoul Metropolitan Government Seoul Water Circulation Information Disclosure System, Secondary Observation Network Data. Available online: http://swo.seoul.go.kr/ugrwtr/retrieveAsstnObsrList.do? (accessed on 25 June 2020).
- Seoul Metropolitan Government Seoul Water Circulation Information Disclosure System, Discharged Groundwater Data from Buildings. Available online: http://swo.seoul.go.kr/outflow/buildOutList.do?typeNo=02 (accessed on 25 June 2020).
- Park, S.H.; Kim, E.J. Optimal sizing of irregularly arranged boreholes using duct-storage model. Sustainability 2019, 11, 4338. [Google Scholar] [CrossRef] [Green Version]
- Keepaiboon, C.; Dalkilic, A.S.; Mahian, O.; Ahn, H.S.; Wongwises, S.; Mondal, P.K.; Shadloo, M.S. Two-phase flow boiling in a microfluidic channel at high mass flux. Phys. Fluids 2020, 32, 093309. [Google Scholar] [CrossRef]
- Deymi-Dashtebayaz, M.; Maddah, S.; Goodarzi, M.; Maddah, O. Investigation of the effect of using various HFC refrigerants in geothermal heat pump with residential heating applications. J. Therm. Anal. 2020, 1–12. [Google Scholar] [CrossRef]


| Authors | Heat Source | Source Side Loop Type |
|---|---|---|
| Luo et al., 2020 [12] | Groundwater | Injection and production well |
| Zhang et al., 2020 [10] | Lake water | Heat exchanger |
| Hervás-Blasco et al., 2020 [8] | Greywater | Greywater storage tank and heat exchanger |
| Song et al., 2019 [13] | Groundwater | Standing column well (SCW), injection and production well, forced external circulation SCW |
| Kastrinos et al., 2019 [7] | Groundwater | Standing column well |
| Qin & Hao, 2017 [9] | Sewage water | Free-flow-channel heat exchanger |
| Zhou et al., 2013 [14] | Groundwater | Injection and production well |
| Shen et al., 2012 [15] | Wastewater | Wastewater storage tank and heat exchanger |
| Ferguson, 2012 [16] | Groundwater | Injection and production well |
| Cho & Yun, 2011 [11] | Lake water | Brine water loop heat exchanger |
| Russo et al., 2011 [17] | Groundwater | Injection and production well |
| Nam & Ooka, 2010 [18] | Groundwater | Injection and production well |
| PD Module | 1.2 × 1.2 × 1.5 m | 1.4 × 1.4 × 1.5 m | Unit |
|---|---|---|---|
| Floor area | 1.44 | 1.96 | m2 |
| Coil length | 7.250 | 8.515 | m |
| Effective height | 1.2 | m | |
| Coil diameter (inner/outer) | 0.012/0.016 | m | |
| Coil pitch | 0.02 | m | |
| Number of coils | 60 | - | |
| Site | District | Number of Apartment Buildings | Total Groundwater Flow Rate | Groundwater Flow Rate per Dewatering Well | ||
|---|---|---|---|---|---|---|
| Ton/Day | Lpm | Ton/Day | Lpm | |||
| A | Mapo | 12 | 25 | 17 | 1.1 | 0.8 |
| B | Eunpyeong | 3 | 224 | 156 | 9.9 | 6.9 |
| C | Seongbuk | 17 | 346 | 240 | 15.4 | 10.7 |
| D | Seocho | 5 | 370 | 257 | 16.4 | 11.4 |
| E | Seocho | 7 | 728 | 506 | 32.3 | 22.4 |
| F | Jung | 14 | 764 | 531 | 33.9 | 23.5 |
| G | Jongno | 14 | 898 | 624 | 38.2 | 26.5 |
| H | Hanam | 12 | 1100 | 764 | 48.8 | 33.9 |
| Average | 557 | 387 | 24.5 | 17.0 | ||
| Phases | Design | Evaluation |
|---|---|---|
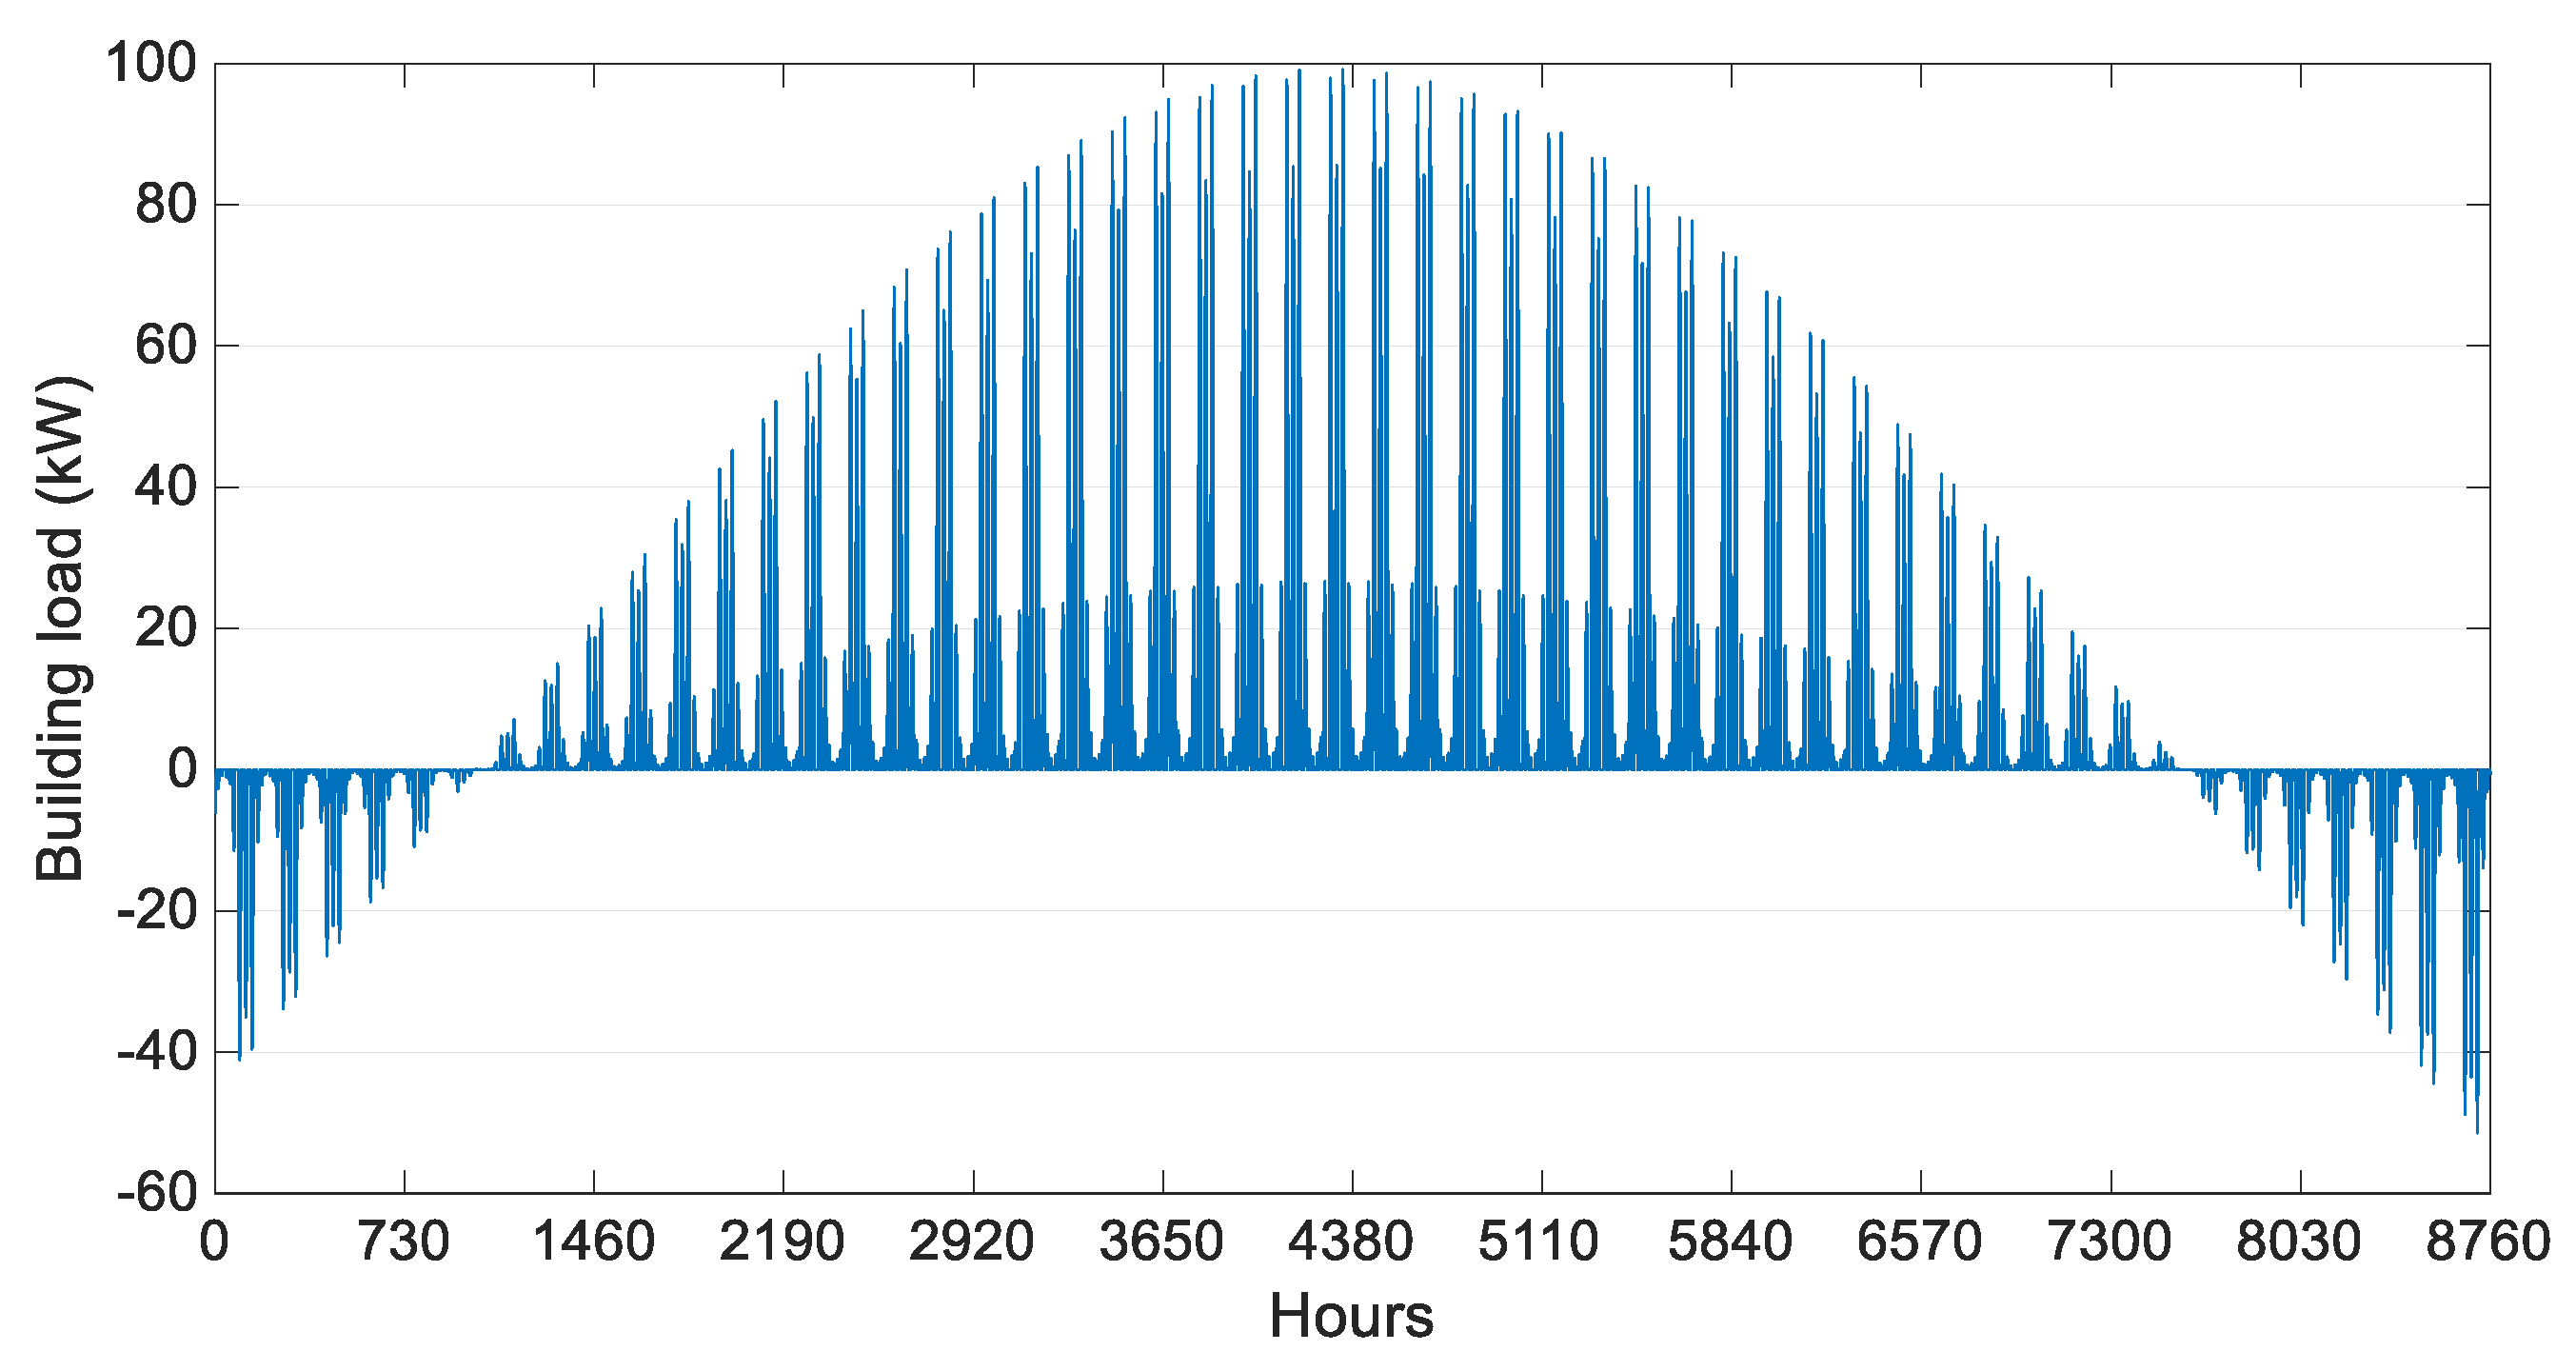
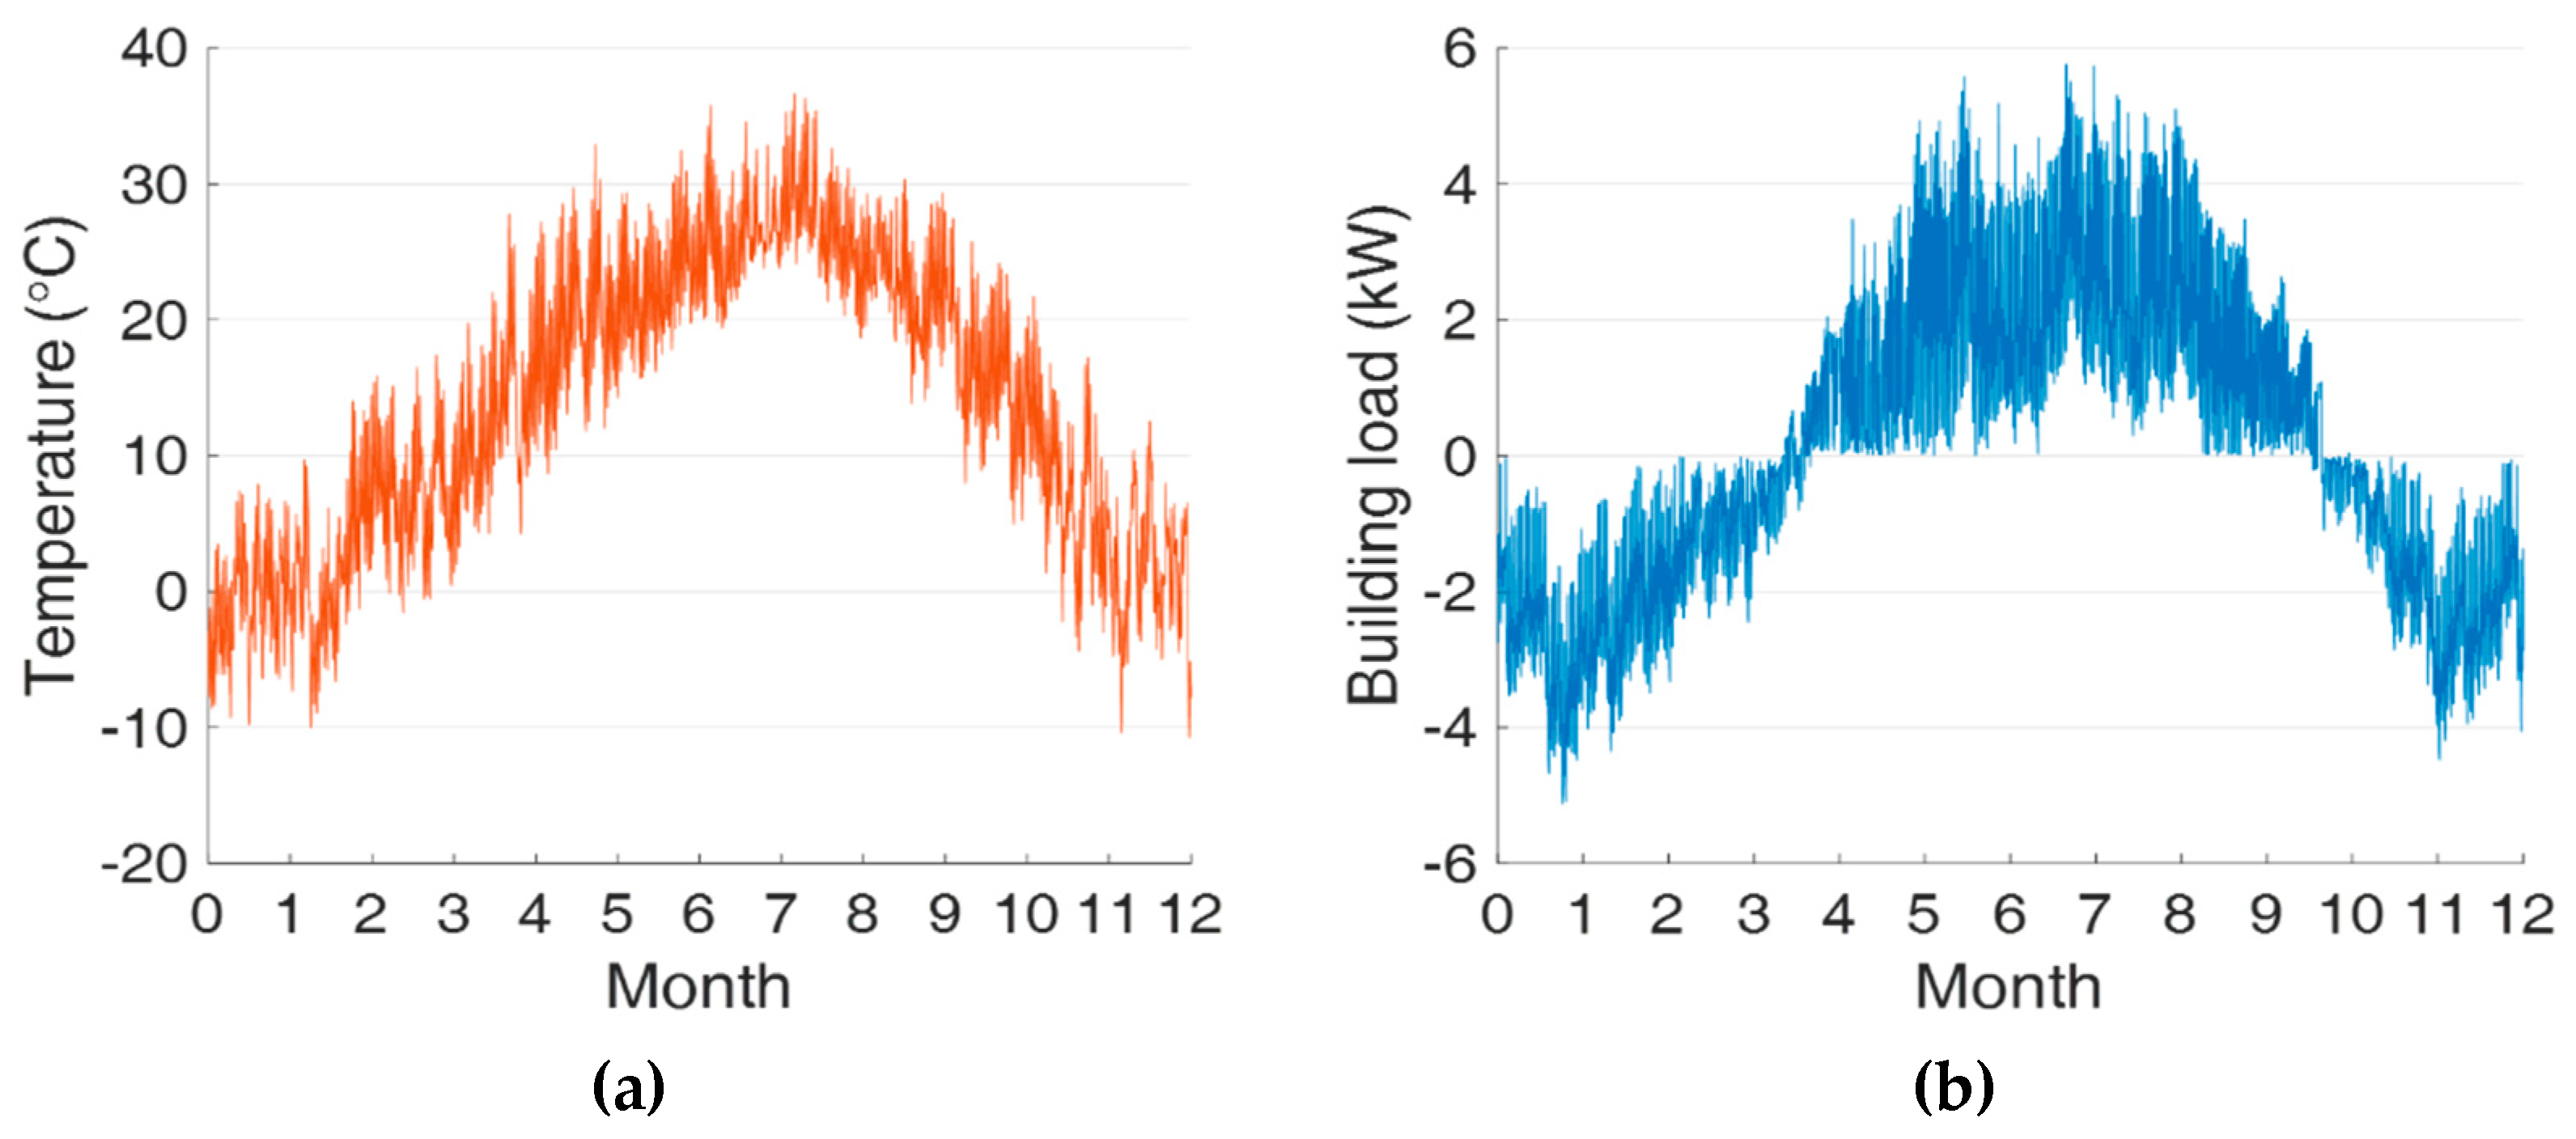
| Building load |  Cooling dominant profile |  Balanced profile |
| Groundwater inlet temperature |  Annually constant |  Sinusoidal profile |
| i | ||
|---|---|---|
| 0 | 7.369 | 2.724 |
| 1 | −0.114 | 0.074 |
| 2 | 0.0009 | −0.0008 |
| Module Size (m3) | ||||||
|---|---|---|---|---|---|---|
| (Lpm) | (°C) | (Lpm) | (°C) | (kW) | (kW/Lpm) | |
| 1.2 PD module (1.2 × 1.2 × 1.5) | 5 | 20–28.2 | 9.2 | 35.4–30 | 2.57 | – |
| 10 | 20–27.4 | 15.1 | 35.4–30 | 4.19 | 0.32 | |
| 15 | 20–26.7 | 20.0 | 35.4–30 | 5.55 | 0.27 | |
| 17 | 20–26.5 | 21.8 | 35.4–30 | 6.05 | 0.25 | |
| 20 | 20–26.2 | 24.3 | 35.4–30 | 6.75 | 0.23 | |
| 30 | 20–25.3 | 31.4 | 35.4–30 | 8.72 | 0.20 | |
| 40 | 20–24.7 | 36.9 | 35.4–30 | 10.25 | 0.15 | |
| 50 | 20–24.2 | 41.3 | 35.4–30 | 11.50 | 0.12 | |
| 1.4 PD module (1.4 × 1.4 × 1.5) | 5 | 20–28.3 | 10.1 | 35.4–30 | 2.82 | - |
| 10 | 20–27.6 | 16.2 | 35.4–30 | 4.51 | 0.34 | |
| 15 | 20–27.0 | 21.3 | 35.4–30 | 5.91 | 0.28 | |
| 17 | 20–26.8 | 23.2 | 35.4–30 | 6.44 | 0.26 | |
| 20 | 20–26.5 | 25.9 | 35.4–30 | 7.20 | 0.25 | |
| 30 | 20–25.7 | 33.7 | 35.4–30 | 9.38 | 0.22 | |
| 40 | 20–25.1 | 40.1 | 35.4–30 | 11.14 | 0.18 | |
| 50 | 20–24.6 | 45.3 | 35.4–30 | 12.58 | 0.14 |
| Module Size (m3) | ||||||
|---|---|---|---|---|---|---|
| (Lpm) | (°C) | (Lpm) | (°C) | (kW) | (kW/Lpm) | |
| 1.2 PD module (1.2 × 1.2 × 1.5) | 5 | 20–28.4 | 21.8 | 32.3–30 | 2.64 | - |
| 10 | 20–27.5 | 21.8 | 33.8–30 | 4.26 | 0.32 | |
| 15 | 20–26.7 | 21.8 | 34.9–30 | 5.58 | 0.26 | |
| 17 | 20–26.5 | 21.8 | 35.4–30 | 6.05 | 0.24 | |
| 20 | 20–26.1 | 21.8 | 36.0–30 | 6.70 | 0.22 | |
| 30 | 20–25.2 | 21.8 | 37.5–30 | 8.47 | 0.18 | |
| 40 | 20–24.5 | 21.8 | 38.8–30 | 9.80 | 0.13 | |
| 50 | 20–24.0 | 21.8 | 39.6–30 | 10.81 | 0.10 | |
| 1.4 PD module (1.4 × 1.4 × 1.5) | 5 | 20–28.5 | 23.2 | 32.4–30 | 2.89 | – |
| 10 | 20–27.7 | 23.2 | 33.8–30 | 4.58 | 0.34 | |
| 15 | 20–27.0 | 23.2 | 34.9–30 | 5.94 | 0.27 | |
| 17 | 20–26.8 | 23.2 | 35.4–30 | 6.44 | 0.25 | |
| 20 | 20–26.5 | 23.2 | 36.0–30 | 7.15 | 0.24 | |
| 30 | 20–25.6 | 23.2 | 37.6–30 | 9.14 | 0.20 | |
| 40 | 20–24.9 | 23.2 | 38.9–30 | 10.67 | 0.15 | |
| 50 | 20–24.4 | 23.2 | 39.9–30 | 11.88 | 0.12 |
Publisher’s Note: MDPI stays neutral with regard to jurisdictional claims in published maps and institutional affiliations. |
© 2021 by the authors. Licensee MDPI, Basel, Switzerland. This article is an open access article distributed under the terms and conditions of the Creative Commons Attribution (CC BY) license (https://creativecommons.org/licenses/by/4.0/).
Share and Cite
Park, S.-H.; Jang, Y.-S.; Kim, E.-J. Design and Performance Evaluation of a Heat Pump System Utilizing a Permanent Dewatering System. Energies 2021, 14, 2273. https://doi.org/10.3390/en14082273
Park S-H, Jang Y-S, Kim E-J. Design and Performance Evaluation of a Heat Pump System Utilizing a Permanent Dewatering System. Energies. 2021; 14(8):2273. https://doi.org/10.3390/en14082273
Chicago/Turabian StylePark, Seung-Hoon, Yong-Sung Jang, and Eui-Jong Kim. 2021. "Design and Performance Evaluation of a Heat Pump System Utilizing a Permanent Dewatering System" Energies 14, no. 8: 2273. https://doi.org/10.3390/en14082273