Article

Fast Pyrolysis of Cellulose by Infrared Heating

Graduate School of Energy Science, Yoshida-Honmachi, Sakyo-Ku, Kyoto 606-8501, Japan
*
Author to whom correspondence should be addressed.
Energies 2021, 14(7), 1842; https://doi.org/10.3390/en14071842
Submission received: 16 March 2021 / Revised: 23 March 2021 / Accepted: 23 March 2021 / Published: 26 March 2021
(This article belongs to the Collection Feature Papers in Bio-Energy)

Abstract

:
The fast pyrolysis of cellulose produces levoglucosan (LG), but secondary pyrolysis reactions tend to reduce the yield. The present study assessed the fast pyrolysis of cellulose by infrared (IR) heating under nitrogen flow. Because the nitrogen was not efficiently heated, gaseous LG was immediately cooled, resulting in a maximum yield of 52.7% under optimized conditions. Slow nitrogen flow and a high IR power level provided a greater gas yield by raising the temperature of the cellulose, and the formation of CO could be used as an indicator of the gasification of LG. Glycolaldehyde (GA) was the major byproduct, and the GA yield remained relatively constant under all conditions. Accordingly, GA was not a secondary product from the LG but was likely produced from the reducing ends of cellulose and other intermediate carbohydrates. The pyrolysis of cellulose proceeded within a narrow region of carbonized material that absorbed IR radiation more efficiently. The bulk of each cellulose sample could be decomposed in spite of this heterogeneous process by maintaining fast pyrolysis conditions for a sufficient length of time. This technique is a superior approach to LG production compared with other fast pyrolysis methods based on heat conduction.

1. Introduction

Owing to the depletion of fossil fuel resources and environmental concerns, there is currently significant interest in the use of renewable resources. Biomass has received much attention in this regard as the only renewable carbon source that can be converted into useful chemicals and fuels. Cellulosic biomass accounts for the majority of biomass resources on Earth, but the polymeric nature of these materials limits their widespread use. Accordingly, the development of efficient cellulose conversion technologies is very important. Pyrolysis conducted under oxygen-free conditions is a potentially viable approach to this goal because this technique is able to rapidly degrade stable cellulosic biomass [1,2].
Fast pyrolysis is a process characterized by rapid heating to yield a mixture of liquid products, known as bio-oil, instead of char (that is, solid products) from lignocellulosic biomass [3,4,5,6,7]. The bio-oil produced can be utilized as a source of liquid fuels (gasoline and diesel) and biochemicals. Levoglucosan (LG, 1,6-anhydro-β-d-glucopyranose) is one of the major components of bio-oil obtained from cellulose [8,9,10] and can be used as a source of various chemicals. As an example, the hydrolysis of LG gives glucose, which can be converted to ethanol, lactic acid and other products via fermentation.
It has been reported that the temperature of cellulose during fast pyrolysis is in the range of 400–450 °C, which is much higher than the value of approximately 350 °C associated with slow pyrolysis [11,12,13,14]. This overheating can promote the recovery of LG, which has a boiling point of 385 °C [14], by rapid evaporation. However, the efficient production of LG from the fast pyrolysis of cellulose requires information regarding the susceptibility of this compound to thermal degradation. Prior work has shown that LG undergoes thermal polymerization in the vicinity of 250 °C, which is much lower than the temperature required for the formation of LG during cellulose pyrolysis [15,16,17,18]. These seemingly contradictory temperature values can be explained by the difference in LG reactivity in the molten and gas phases. In the gas phase, LG is stable up to 500–600 °C and fragments into gaseous products at higher temperatures [16]. The greater reactivity of molten LG can be explained by hydrogen bonding between LG molecules, which act as acidic and basic catalysts [19,20]. The literature therefore indicates that the capture of gaseous LG produced by the fast pyrolysis of cellulose is very important to obtain a high yield of this compound.
To maintain such a high cellulose degradation temperature (400–450 °C), various types of furnaces have been developed and are classified into two types depending on the heating principle [3,6,11,12,21,22,23,24,25,26,27,28]; the entrained downflow, ablative reactor and fluid bed types are based on conductive heating, where biomass is heated by contact with a hot environment or hot metal surface [3,6,21,22,23,24,25]. The other type is based on radiation heating [11,12,26,27,28], and biomass is efficiently heated by adsorbing radiation such as infrared (IR) [11,12], condensed solar [26] and lasers [27,28]. This feature of selective heating favors the production of LG from cellulose.
The precise control of the pyrolysis temperature is vital during the production of LG because gaseous LG is quickly converted into other products such as CO and H2 above 600 °C [16]. For this reason, radiation heating, which can heat materials selectively, may be superior to conductive heating. Shoji et al. [14] reported that a furnace temperature in excess of 600 °C was necessary to obtain a cellulose degradation temperature above 400 °C so as to maintain fast pyrolysis conditions with a small amount of cellulose in a preheated furnace. Under such conditions, the secondary degradation of LG is inevitable even in the gas phase. In order to suppress the secondary decomposition of LG in the gas phase, IR heating was selected for the pyrolysis of cellulose. When using radiation heating, the LG produced is efficiently cooled using a stream of nitrogen that has not been effectively heated due to insufficient IR absorption of nitrogen.
The fast pyrolysis of cellulose using radiation heating has been previously reported [11,12,27,28,29,30,31,32], while most of the studies focus on the utilization of solar energy for pyrolysis [29,30] and the formation of melting substances during irradiation [11,12,27,28]. As for the production of LG, Suzuki et al. [21] reported the formation of LG and anhydro-oligocellosaccharides by irradiating a CO2 laser on cellulose, although the yields from cellulose were quite low. By using similar CO2 laser irradiation under nitrogen flow or vacuum conditions, Kwon et al. reported that the yield of LG reached a maximum at around 25% from Whatman CF11 cellulose powder. However, the efficient production of LG from cellulose by radiation heating has not been achieved, and the thermal degradation mechanisms under the irradiation conditions have not been fully clarified.
In the present study, the production of LG from cellulose by IR heating under a nitrogen flow was studied. After the investigation of the effects of the experimental parameters on the product yield, the thermal degradation mechanism at the surface where IR is absorbed was evaluated.

2. Materials and Methods

2.1. Cellulose Samples

Whatman No. 42 cotton filter paper (Whatman PLC, Maidstone, UK, pore size: 2.5 μm) and microcrystalline cellulose powder (Avicel PH-101, Asahi Kasei Corp., Tokyo, Japan) were used in the pyrolysis trials. These materials were employed as received without further purification. The Whatman filter paper was cut into 1.0 × 4.3 cm pieces weighing 30 mg (dry) before use.

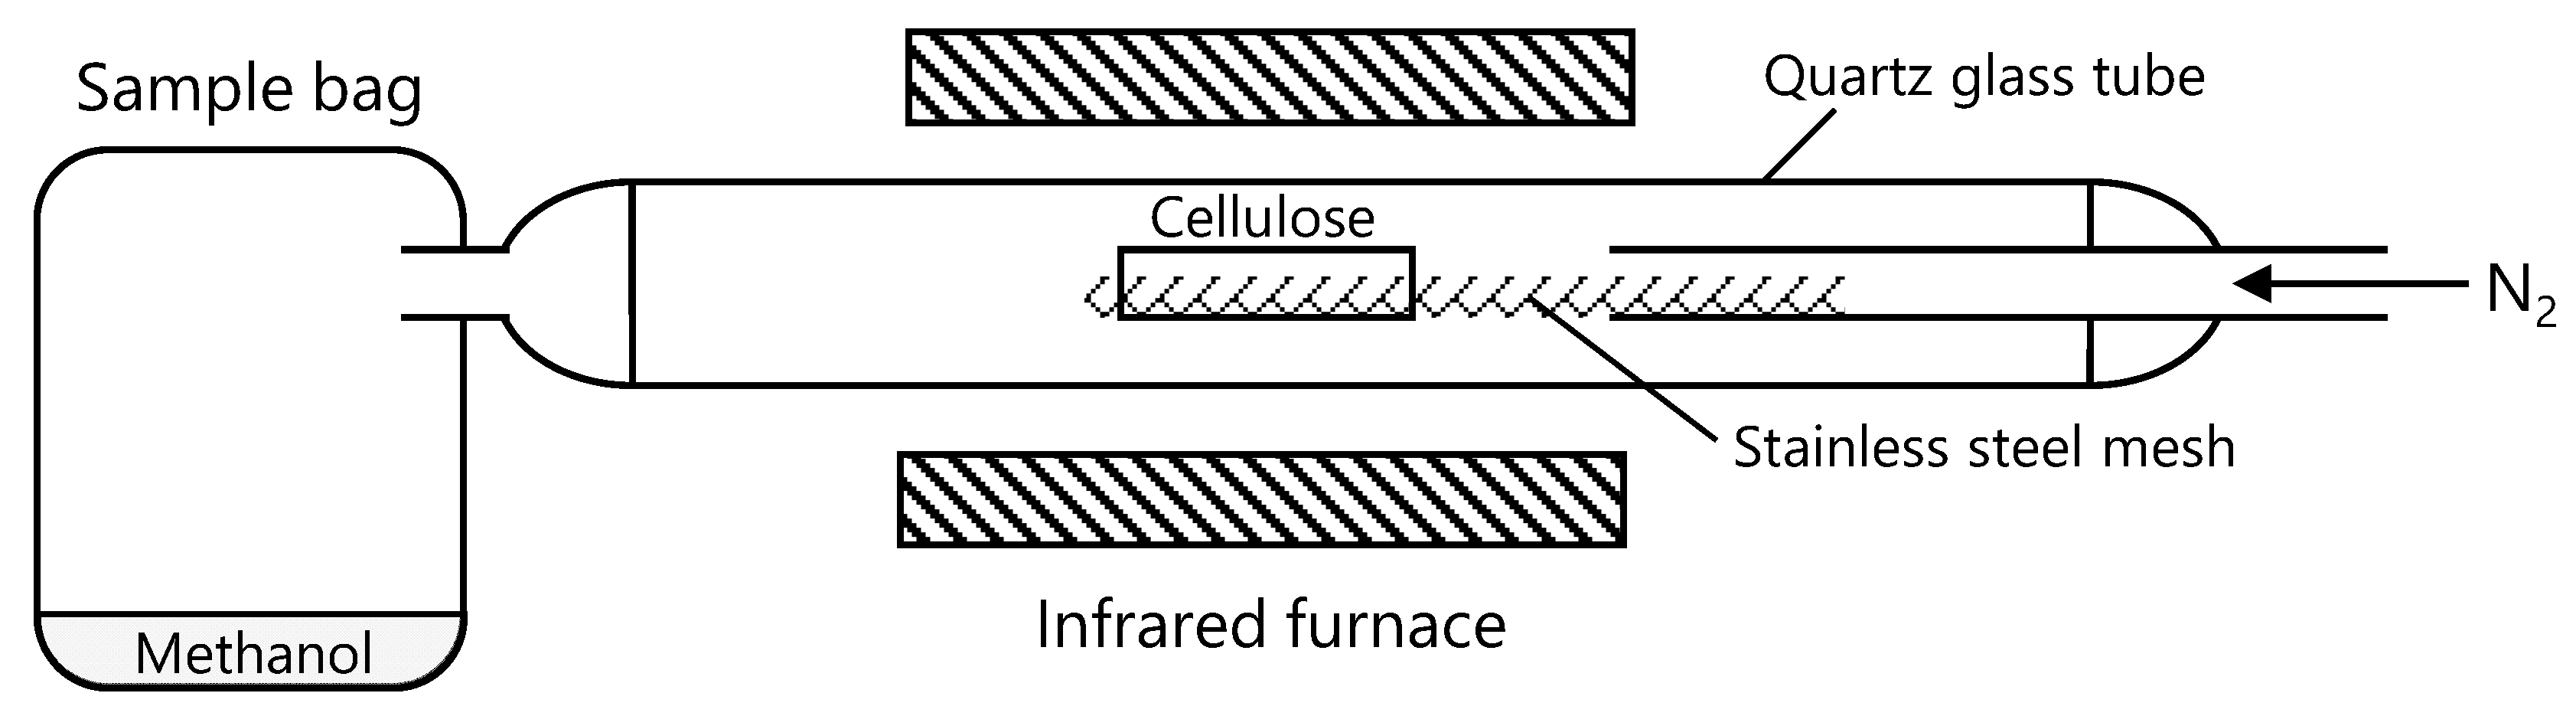
2.2. Pyrolysis and Product Analysis

Figure 1 shows a diagram of the experimental set-up, in which an IR image furnace (RHL-E45N, ADVANCE RIKO, Kanagawa, Japan) was used to heat the cellulose. A quartz tube (internal diameter: 30 mm, length: 495 mm) was set inside a cylindrical furnace, and the IR radiation was focused on the center of the furnace. During trials with the Whatman cellulose sheets, each sample was placed on a stainless steel mesh situated at the center of the reactor. In the case of the Avicel cellulose trials, a quartz boat (length: 35 mm, width: 10 mm, height: 6 mm, AS ONE Corporation, Osaka, Japan) containing the sample was placed on the mesh and then inserted into the reactor. A sampling bag made of Tedlar® (5 L) containing methanol (30 mL) was attached to the outlet of the reactor tube to collect the volatile products, and the air inside the reactor system was replaced with nitrogen before each trial by purging with a nitrogen flow (5 L/min) for 5 min. The nitrogen in the sample bag was released from the vent before the pyrolysis trial, and the process time was sufficiently short to accommodate the whole volume of injected nitrogen. After the nitrogen flow was adjusted to the designated value (from 1 to 10 L/min), the cellulose was heated using an IR output energy in the range of 0.5 to 4.0 kW.
During the pyrolysis, a colorless mist escaped from the reactor and was captured in the sampling bag, where it collected on the inner walls after standing for 30 min (Figure 2). A 5.0 mL quantity of neon gas was added to the sample bag as an internal standard, after which the contents were analyzed by micro gas chromatography (GC, CP-4900, Varian Inc., Palo Alto, CA, USA). The chromatographic conditions included a 10 m MS5 A column, Ar as the carrier gas, a column temperature of 100 °C, a column pressure of 170 kPa and a thermal conductivity detector (TCD). Using these conditions, the compounds analyzed (and their retention times) were Ne (25.7 s), H2 (27.0 s), O2 (35.8 s), CH4 (60.9 s) and CO (79.8 s) (Figure S1A). A second channel on the instrument included a 10 m PoraPLOT Q column with He as the carrier gas, a column temperature of 80 °C, a column pressure of 190 kPa and a TCD. The associated analytes (and retention times) were CO2 (19.3 s), C2H4 (22.6 s), C2H6 (25.3 s) and C3H6 (53.5 s) (Figure S1B).
After each trial, the condensates in the sample bag and on the walls of the reactor were extracted with methanol (200 mL), after which the methanol was evaporated under vacuum. A Bruker AC-400 (400 MHz) spectrometer was subsequently used to acquire a 1H nuclear magnetic resonance (NMR) spectrum of the resulting material in dimethylsulfoxide (DMSO)-d6 (0.7 mL), containing maleic acid as an internal standard and hydroxylamine hydrochloride (NH2OH•HCl, 10 mg) for the in situ derivatization of aldehydes and ketones in the product mixture to the corresponding oximes. The yields of the products, including LG and glycolaldehyde (GA), were determined by comparing the peak areas of the characteristic signals of these compounds with that of the internal standard (Figure S2). The methanol, DMSO-d6, maleic acid and hydroxylamine hydrochloride were purchased from Nacalai Tesque, Inc., Kyoto, Japan and used without purification.
The solid residue remaining on the stainless steel mesh was weighed and the result is referred to as the char mass herein. The mass of the solid carbonized materials adhering to the inner surface of the sample boat was obtained from the mass loss after heating the boat in air at 600 °C for 2 h.
The temperature in the interior of the Avicel cellulose in the sample boat was monitored using a fine thermocouple (0.25 mm in diameter, type K, Shinnetsu Co., Ltd., Ibaraki, Japan) connected to a thermologger (AM-8000, Anritsu Corporation, Kanagawa, Japan). The tip of the thermocouple was embedded in the center of the sample in the depth direction.
Most of the experiments were repeated three times and the results are shown as mean values along with standard deviations.

3. Results and Discussion

3.1. Effects of the Experimental Parameters on the Product Yield

The effects of the experimental parameters on the yields of LG and other products were evaluated using the Whatman cellulose to evaluate the capacity of this pyrolysis system to generate LG. The effects of modifying the position of the cellulose in the reactor (at Points A, B and C in Figure 3), the flow rate of nitrogen and the IR power on the product yield were evaluated. Figure 4 summarizes the yields of LG, gas and char obtained under various conditions. The yield is not 100% in total due to the presence of unquantified products such as water. In general, a large amount of water is produced during the pyrolysis of cellulose. However, the amount of water was not quantified in the present paper.
The position of the cellulose was expected to affect the LG yield because the residence time of the volatile products in the IR irradiation area varied depending on the position (C > B > A). We anticipated that the extent to which secondary pyrolysis reactions of the gaseous LG proceeded would be increased with increases in the residence time. However, the LG yield, which ranged from 32% to 42%, was not greatly changed when modifying the sample position (Figure 4) during the trial employing 4.0 kW radiation, 5 s irradiation and a 10 L/min nitrogen flow. These results indicate that the degree of secondary degradation of the gaseous LG in response to IR irradiation was very limited, possibly because of the minimal absorption of IR radiation by the gaseous LG and the nitrogen carrier gas. In this respect, IR heating is superior to other conductive heating methods for the production of LG via the fast pyrolysis of cellulose.
Unexpectedly, the gas yield was high (10.1 ± 5.6%) when the cellulose was set near the outlet of the furnace (Position A). The secondary degradation of gaseous LG to permanent gases such as CO and H2 is significant above 600 °C in conjunction with short residence times of 1–2 s similar to those in the present study [18], and such high temperatures could have occurred at Position A. This is also supported by the gas composition, as discussed later. To evaluate this possibility, the temperatures upstream and downstream of the IR furnace were measured in blank tests with and without the stainless steel mesh (Figure 3, 4.0 kW, 5 s irradiation, 10 L/min nitrogen flow). The temperature was found to increase by 4.7 and 25.1 °C without and with the mesh, respectively, when the nitrogen carrier gas passed through the IR irradiation zone. These increases were insufficient to promote secondary degradation of the LG but could possibly have raised the temperature of the cellulose to promote the secondary degradation of LG at Position A.
The nitrogen flow rate was expected to affect the reaction yield by carrying volatile products to a cooler region of the apparatus such that they did not condense on the hot reactor wall where secondary degradation may occur. The flow rate could also conceivably affect the cellulose degradation temperature during the pyrolysis because the nitrogen was not efficiently heated by the IR radiation. Four nitrogen flow rates (1.0, 3.0, 5.0 and 10.0 L/min) were assessed at a constant IR power of 4.0 kW and constant irradiation time of 5 s. The data show that the LG yield was increased with decreases in the flow rate from 10 to 3.0 L/min, which can be explained by the greater heating efficiency at lower flow rates of the cool nitrogen. The gas yields significantly increased when the flow rate was further decreased to 3.0 and 1.0 L/min, while the LG yield was decreased at 1.0 L/min as a result of secondary degradation.
The IR power directly affected the heating efficiency of the cellulose. Consequently, the LG yield decreased significantly when the IR power was reduced from 1.0 to 0.5 kW, while the char yield was greatly increased as a result of the large amount of unreacted cellulose. Experiments with a longer irradiation time of 10 s were also conducted at 0.5 and 1.0 kW (Table 1). Prolonging the irradiation time increased the LG yield while lowering the char yield, and the maximum LG yield of 52.7% was obtained after 10 s of irradiation at an IR power of 1.0 kW. The three-time average under the same conditions was 47.5 ± 3.8%. These yields were higher than those reported in other studies using radiation heating (10–30%) and fluidized bed (up to 40%) [29,30,31,32]. For example, the LG yields reported in the literature using a CO2 laser were less than 25% [31]. The greater sweep efficiency of the nitrogen flow system in the present study may increase the LG recovery at the expense of the occurrence of the secondary degradation of LG.
As shown by the numbers in parentheses, the yields of LG during the irradiation periods of 0–5 and 5–10 s were determined by assuming that the difference in the mass values of the char at 5 s and at 10 s equaled the amount of cellulose degraded during the irradiation time from 5 to 10 s. It should be noted that the estimated LG yields during the first and last 5 s intervals were not greatly different. This result illustrates a very important aspect of IR heating that is discussed in more detail below.
These data establish that the IR power, nitrogen flow rate and sample position all affected the actual cellulose degradation temperature. When this temperature was greater than 600 °C, the LG yield decreased because of the conversion of the LG to permanent gases. The IR irradiation time was also found to have an important effect in terms of obtaining complete cellulose pyrolysis.
The major byproducts obtained from the fast pyrolysis of cellulose under IR irradiation in this work were gaseous but the specific compounds changed depending on the pyrolysis conditions. In Figure 5, the molar percentages of H2, CO and CO2 are plotted against the gas yields from the various trials. At a gas yield less than 4%, H2 and CO2 were the main components, while at higher gas yields, CO was produced, and the molar ratios of CO to H2 became 1.3–2.5 along with lesser amounts of CO2. These results are reasonably explained with gas production from the secondary degradation of gaseous LG, based on prior reports that CO and H2 are selectively produced from LG in the gas phase above 600 °C [18]. Therefore, the formation of CO appears to be a useful indicator of the appearance of cellulose degradation temperatures greater than 600 °C. It should be noted that it was challenging to measure the actual sample temperature throughout the IR irradiation process because of the nonuniform progression of the thermal degradation of the cellulose, as discussed further on.
GA was the other major byproduct, and Figure 6 summarizes the yields of GA obtained under various fast pyrolysis conditions compared with the overall gas yields. It is apparent that there were no correlations between the yields of both products and that the GA yield remained relatively constant as the various parameters were changed while the gas yield varied greatly. Accordingly, the formation of GA cannot be explained by the secondary degradation of LG.
In the pyrolysis of cellulose, GA has been reported to form in a higher temperature range than LG, and a negative correlation has been reported between the yields of these products [33]. Therefore, there was controversy over the GA formation pathway, although the literature [33,34,35,36] shows a direct formation pathway from cellulose that competes with LG formation. The observations in the present study clearly show the direct pathway of GA formation. GA is believed to form during the primary cellulose pyrolysis stage, likely via retro-Aldol-type fragmentation reactions of the reducing ends of cellulose and carbohydrate intermediates. Such reactions are favorable because stable six-membered cyclic transition states are involved (Figure 7). A similar mechanism has been proposed for the pyrolysis of cellobiose based on prior work using pyrolysis-GC/MS spectrometry in conjunction with 13C-labeled cellobiose [37].

3.2. The Mechanism for Cellulose Pyrolysis by Infrared Irradiation

Figure 8 presents photographic images of the char residues recovered from Whatman cellulose after applying IR irradiation at either 0.5 or 1.0 kW. A colorless unreacted part clearly remained intact on the specimen after the trial at 0.5 kW, suggesting that the thermal degradation of cellulose occurred nonuniformly under such conditions. The pyrolysis in the upstream region of the nitrogen flow (the right side of the apparatus) was particularly slow, presumably due to the effect of the cool nitrogen. This tendency was also observed at the higher irradiation power of 1.0 kW after 5 s of irradiation, although the unreacted part was completely pyrolyzed by prolonging the irradiation time to 10 s. High selectivity for LG formation was also maintained under these conditions, as shown in Table 1.
Figure 9 provides an enlarged microscopic view of the char obtained at 1.0 kW after 5 s and demonstrates the formation of a very narrow (less than 0.5 mm) film-like carbonized zone. Cellulose generates film-like char when fast pyrolysis conditions are achieved because it rapidly converts to molten intermediates prior to the evaporation of LG and other products. On the basis of these images, it appears that the thermal degradation of the cellulose occurred within a very small area adjacent to the narrow carbonized zone, which was heated quickly owing to the efficient absorption of IR radiation (Figure 10). This process spread over the cellulose sheet as the irradiation time span increased. Gas formation would also occur in this small area in conjunction with the evaporation of LG as temperatures greater than 600 °C were achieved. Boutin et al. [11] reported the formation of short-lived liquid species while irradiating the surface of a cellulose pellet with a concentrated xenon lamp. However, they did not analyze LG and did not report the progression of the pyrolysis zone to the stage where cellulose was completely degraded.
The above data obtained using the Whatman cellulose sheets provide useful insights into the pyrolysis in the planar direction. To complement this information, pyrolysis behavior in the thickness direction was also examined using the Avicel cellulose powder. In these trials, a 300 mg portion of this powder was transferred to a quartz boat and irradiated at 2.5 kW for 30 s under a 5 L/min nitrogen flow. Similar experiments using only 100 mg samples were also conducted to understand the effect of sample loading. Under these conditions, LG was obtained in 44.3% (with 100 mg samples) and 48.5% (300 mg) yields, which were comparable to those obtained from the Whatman cellulose sheets. The film-like chars seen in the images in Figure 11 indicate that fast pyrolysis was achieved during these experiments. It should also be noted that a high LG yield was observed when using either 100 or 300 mg samples, indicating that the sample amount did not affect the ability to perform fast pyrolysis.
The temperature in the middle of the cellulose sample in the boat was monitored using a fine thermocouple in trials with a power level of 1.0 kW, a 20 s irradiation time and a 5 L/min nitrogen flow. The irradiation time of 20 s was insufficient to completely pyrolyze the cellulose, meaning that the sample temperature during cellulose degradation could be assessed. During these trials, the bottom of the sample boat was covered with aluminum foil so that the sample only received radiation from the top. Figure 12 provides photographic images of the boat after the trial, along with a plot of the internal sample temperature over time. It is evident that the surface of the sample was darkened to a greater extent than the interior, based on the left half of the sample where the surface has been removed. The temperature plot demonstrates a relatively slow rate of temperature rise inside the cellulose layer. The final temperature of 250 °C at 20 s was lower than the minimum value of 350 °C required for the efficient thermal degradation of cellulose. The brief pause in the temperature increase observed in the range of 100–150 °C is attributed to the volatilization of water. When the IR irradiation time was extended to 30 s, only a small amount of film-like char remained in the boat, as can be seen in Figure 11, and LG was obtained in a 50.0% yield. These results indicate that the thermal degradation of cellulose proceeded non-uniformly from the surface that received the IR radiation, as illustrated in Figure 13.
Figure 14 illustrates the heat and mass transfer processes and related events in the thin surface layer in which fast pyrolysis occurred during the IR irradiation of the Avicel cellulose. Cellulose tends to reflect IR, so the absorption of IR radiation by the cellulose was not sufficient to raise the sample temperature rapidly to above 400 °C. However, once solid carbonized materials were produced at the surface, this region underwent fast heating as it became more efficient at absorbing the radiation.
The resulting heat energy was transferred to the adjacent cellulose to promote rapid thermal degradation. The temperature of the degrading cellulose was rapidly raised to above 400 °C and liquid intermediates were generated. The evaporation of LG and other products is an endothermic process, while the formation of char is exothermic [38,39,40]. As a result of the greater contribution of the former endothermic process, the fast pyrolysis was overall endothermic and so required continued heat input from the carbonized layer. The heat transfer to the interior of the cellulose was relatively slow, based on the low thermal conductivity of cellulose (0.04 W/mK) [41,42], and so only a narrow region experienced high temperatures.

4. Conclusions

The pyrolysis of cellulose using IR irradiation was studied, resulting in the following conclusions.
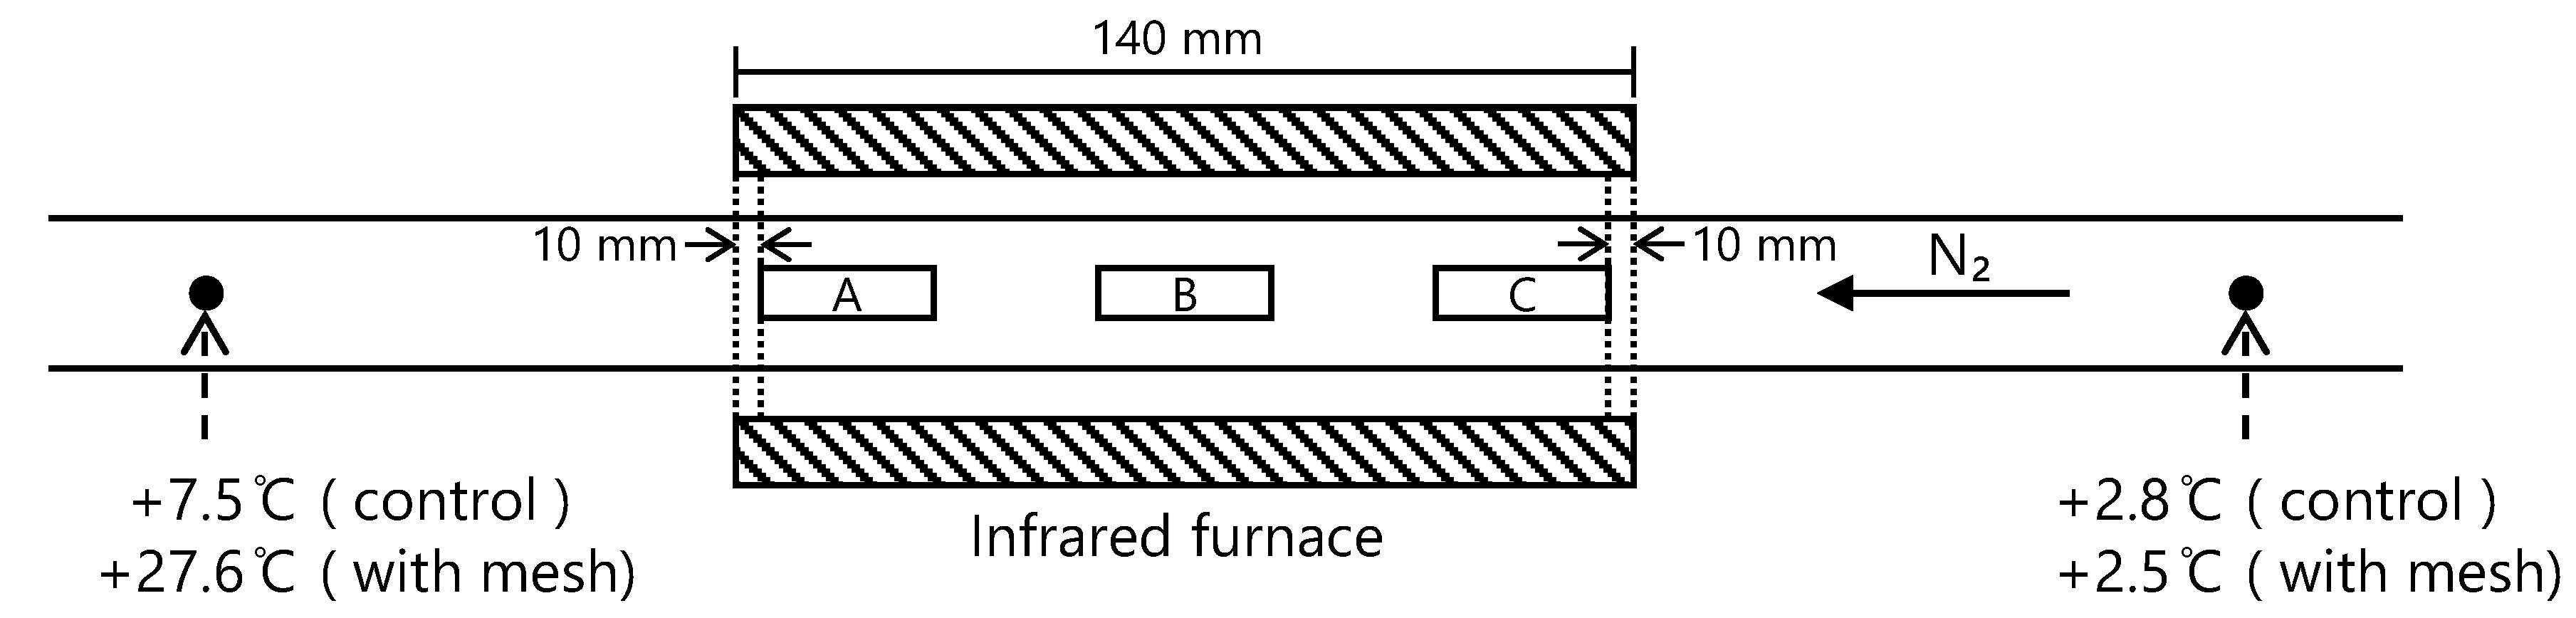
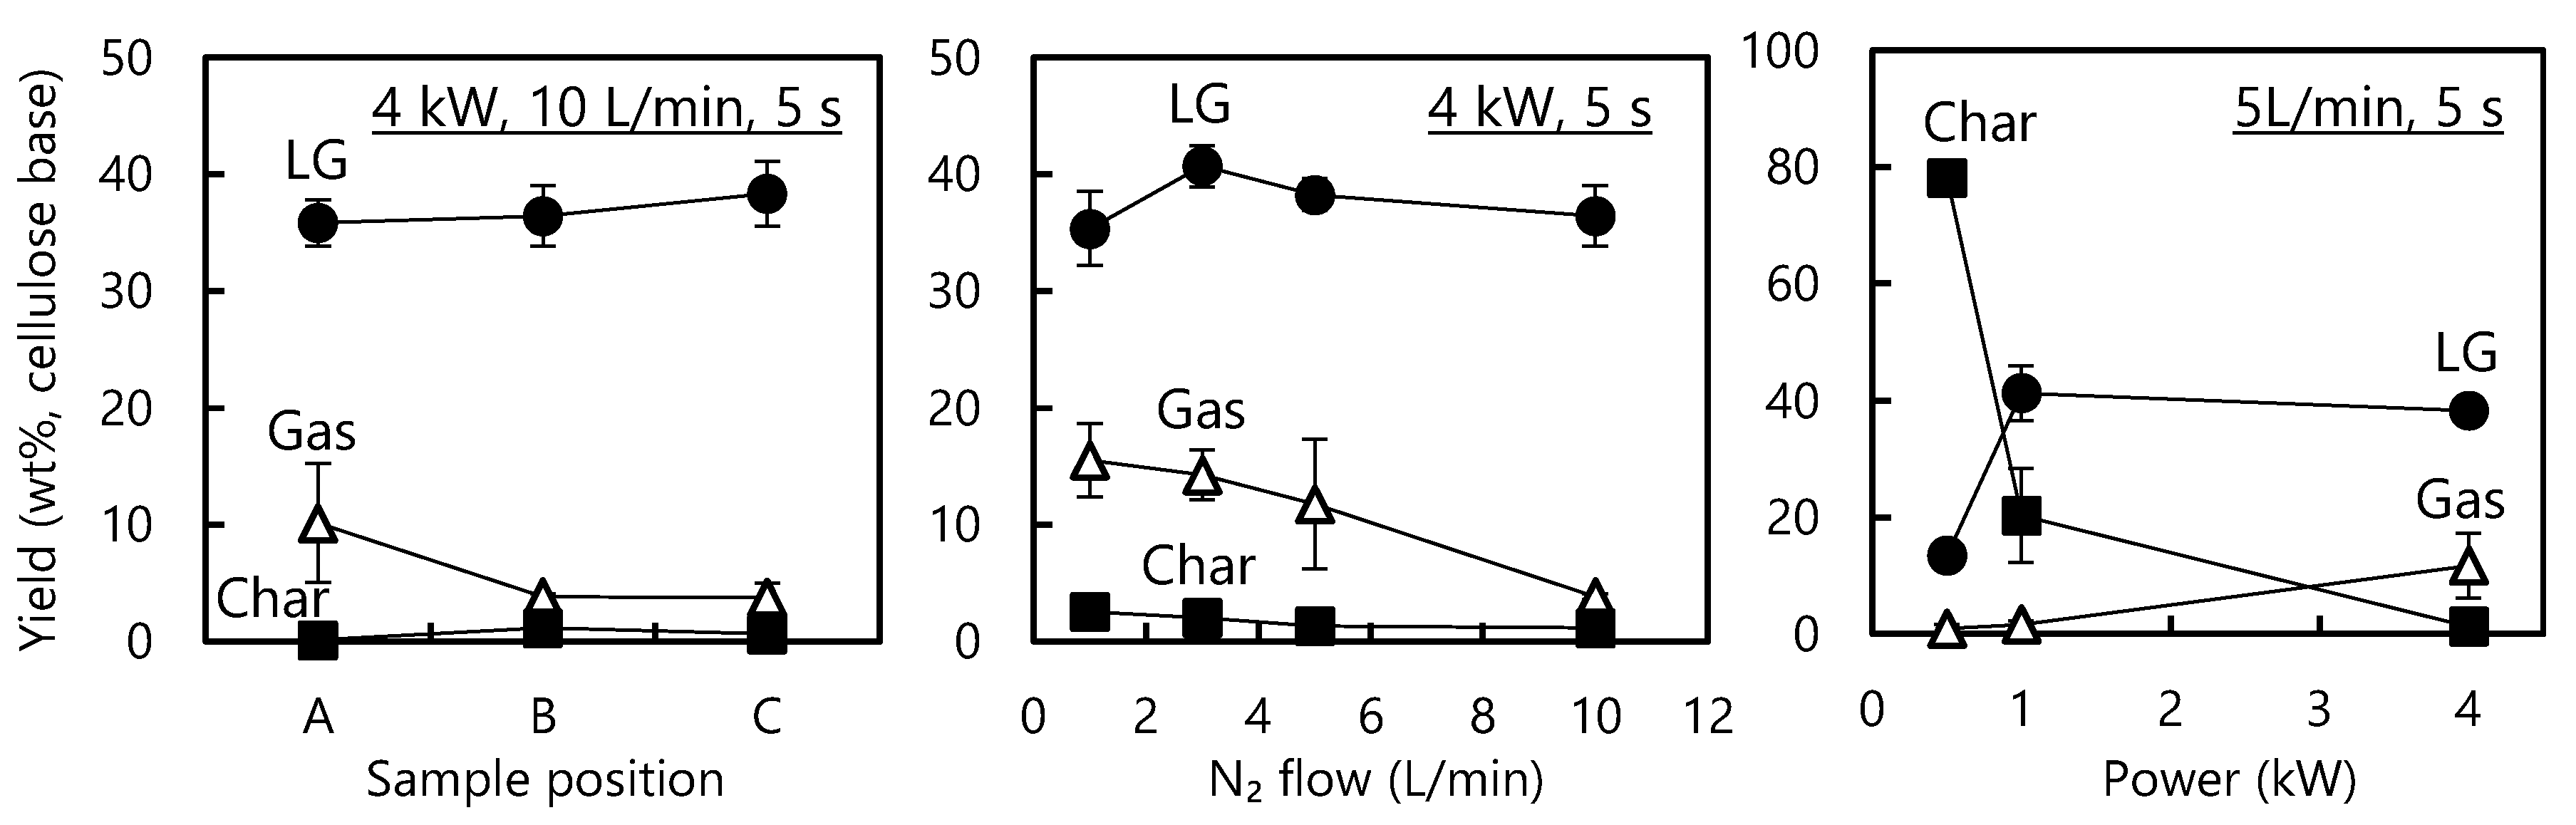
  • The sample position in the IR furnace, the IR power level and the nitrogen flow rate all affected the thermal degradation of cellulose by modifying the cellulose degradation temperature.
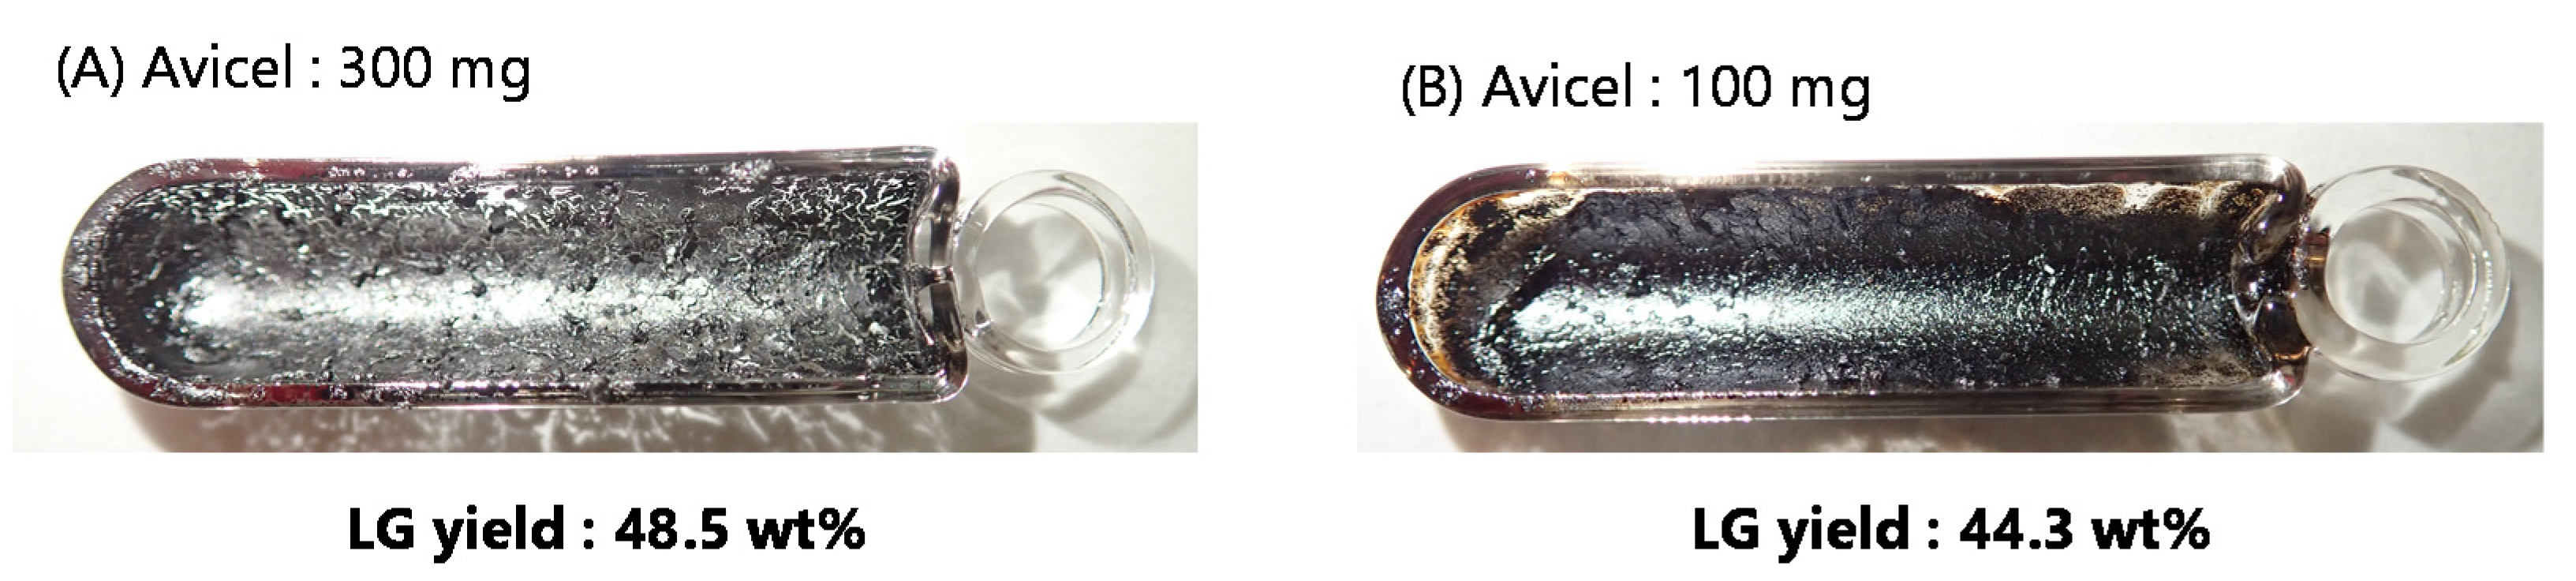
  • Under the optimum conditions, LG was obtained in a 52.7 wt % yield from Whatman cellulose sheets (infrared power: 1.0 kW, nitrogen flow: 5 L/min, irradiation time: 10 s).
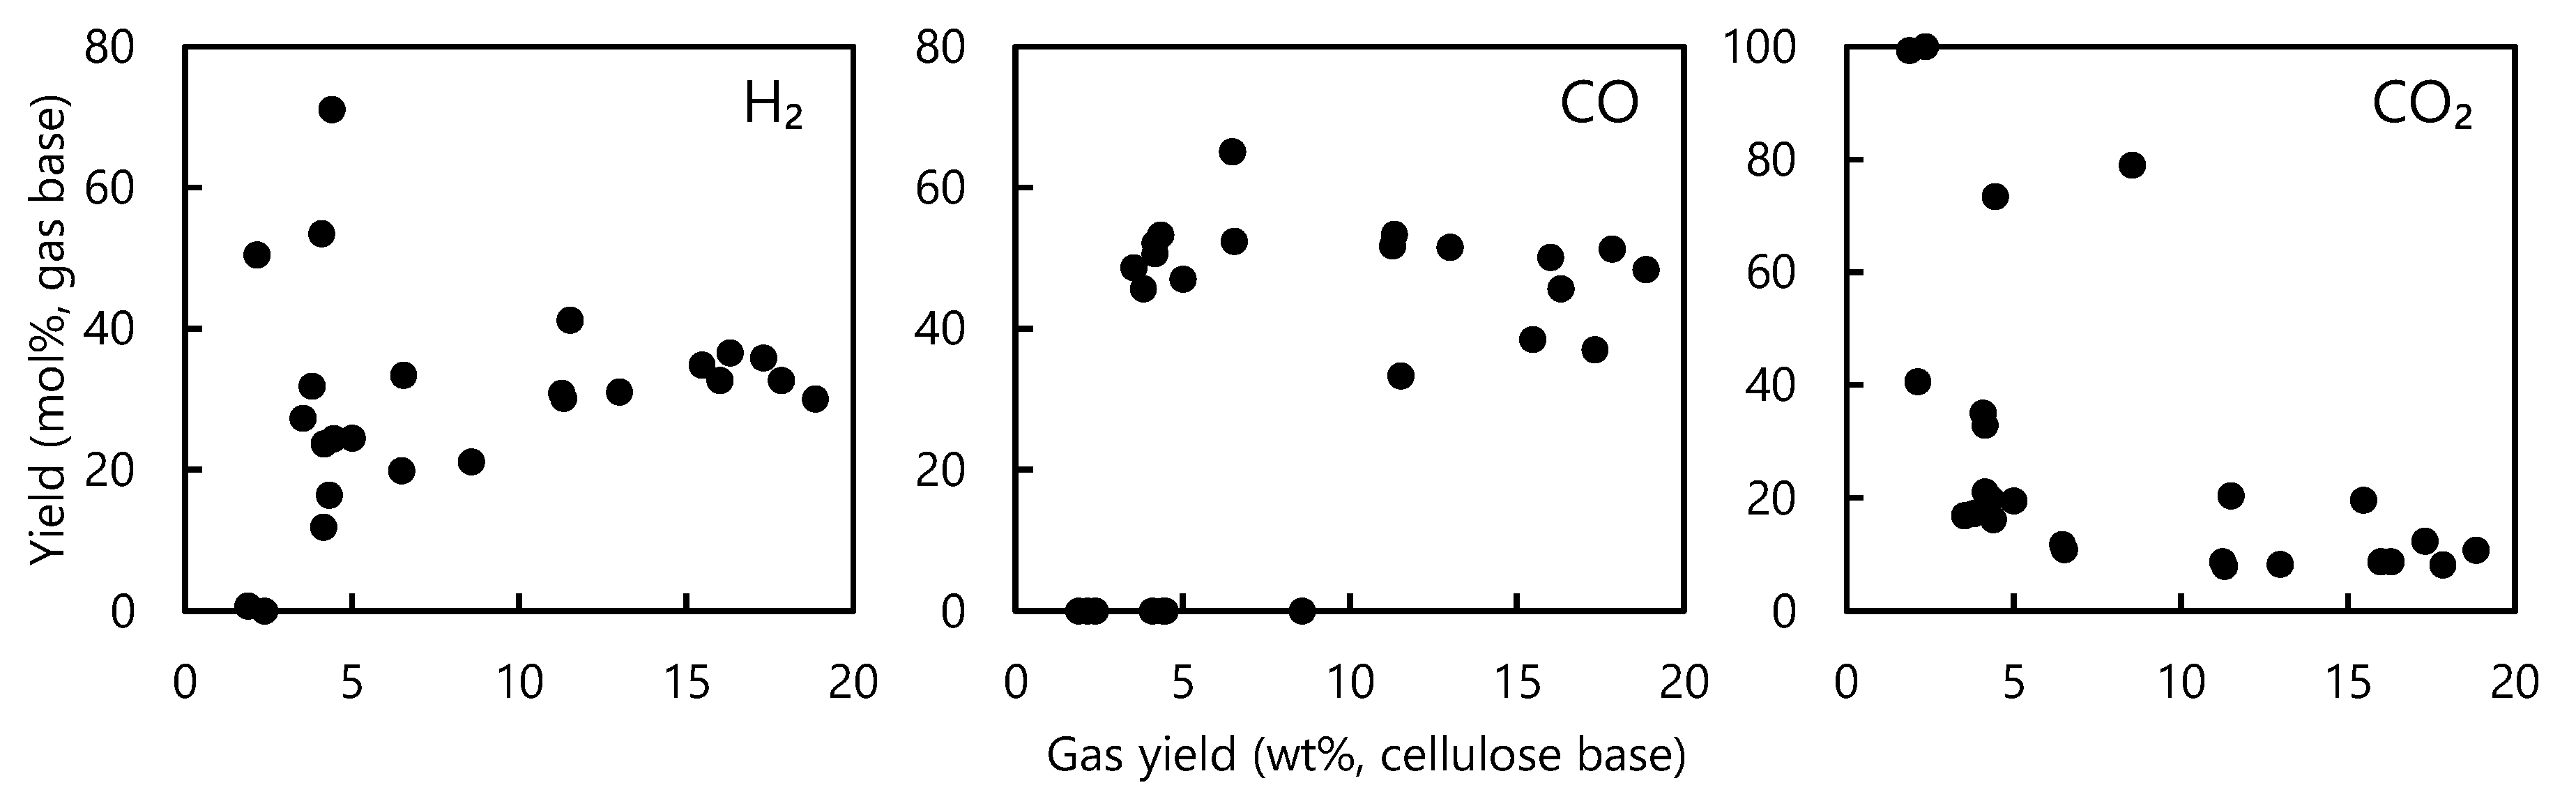
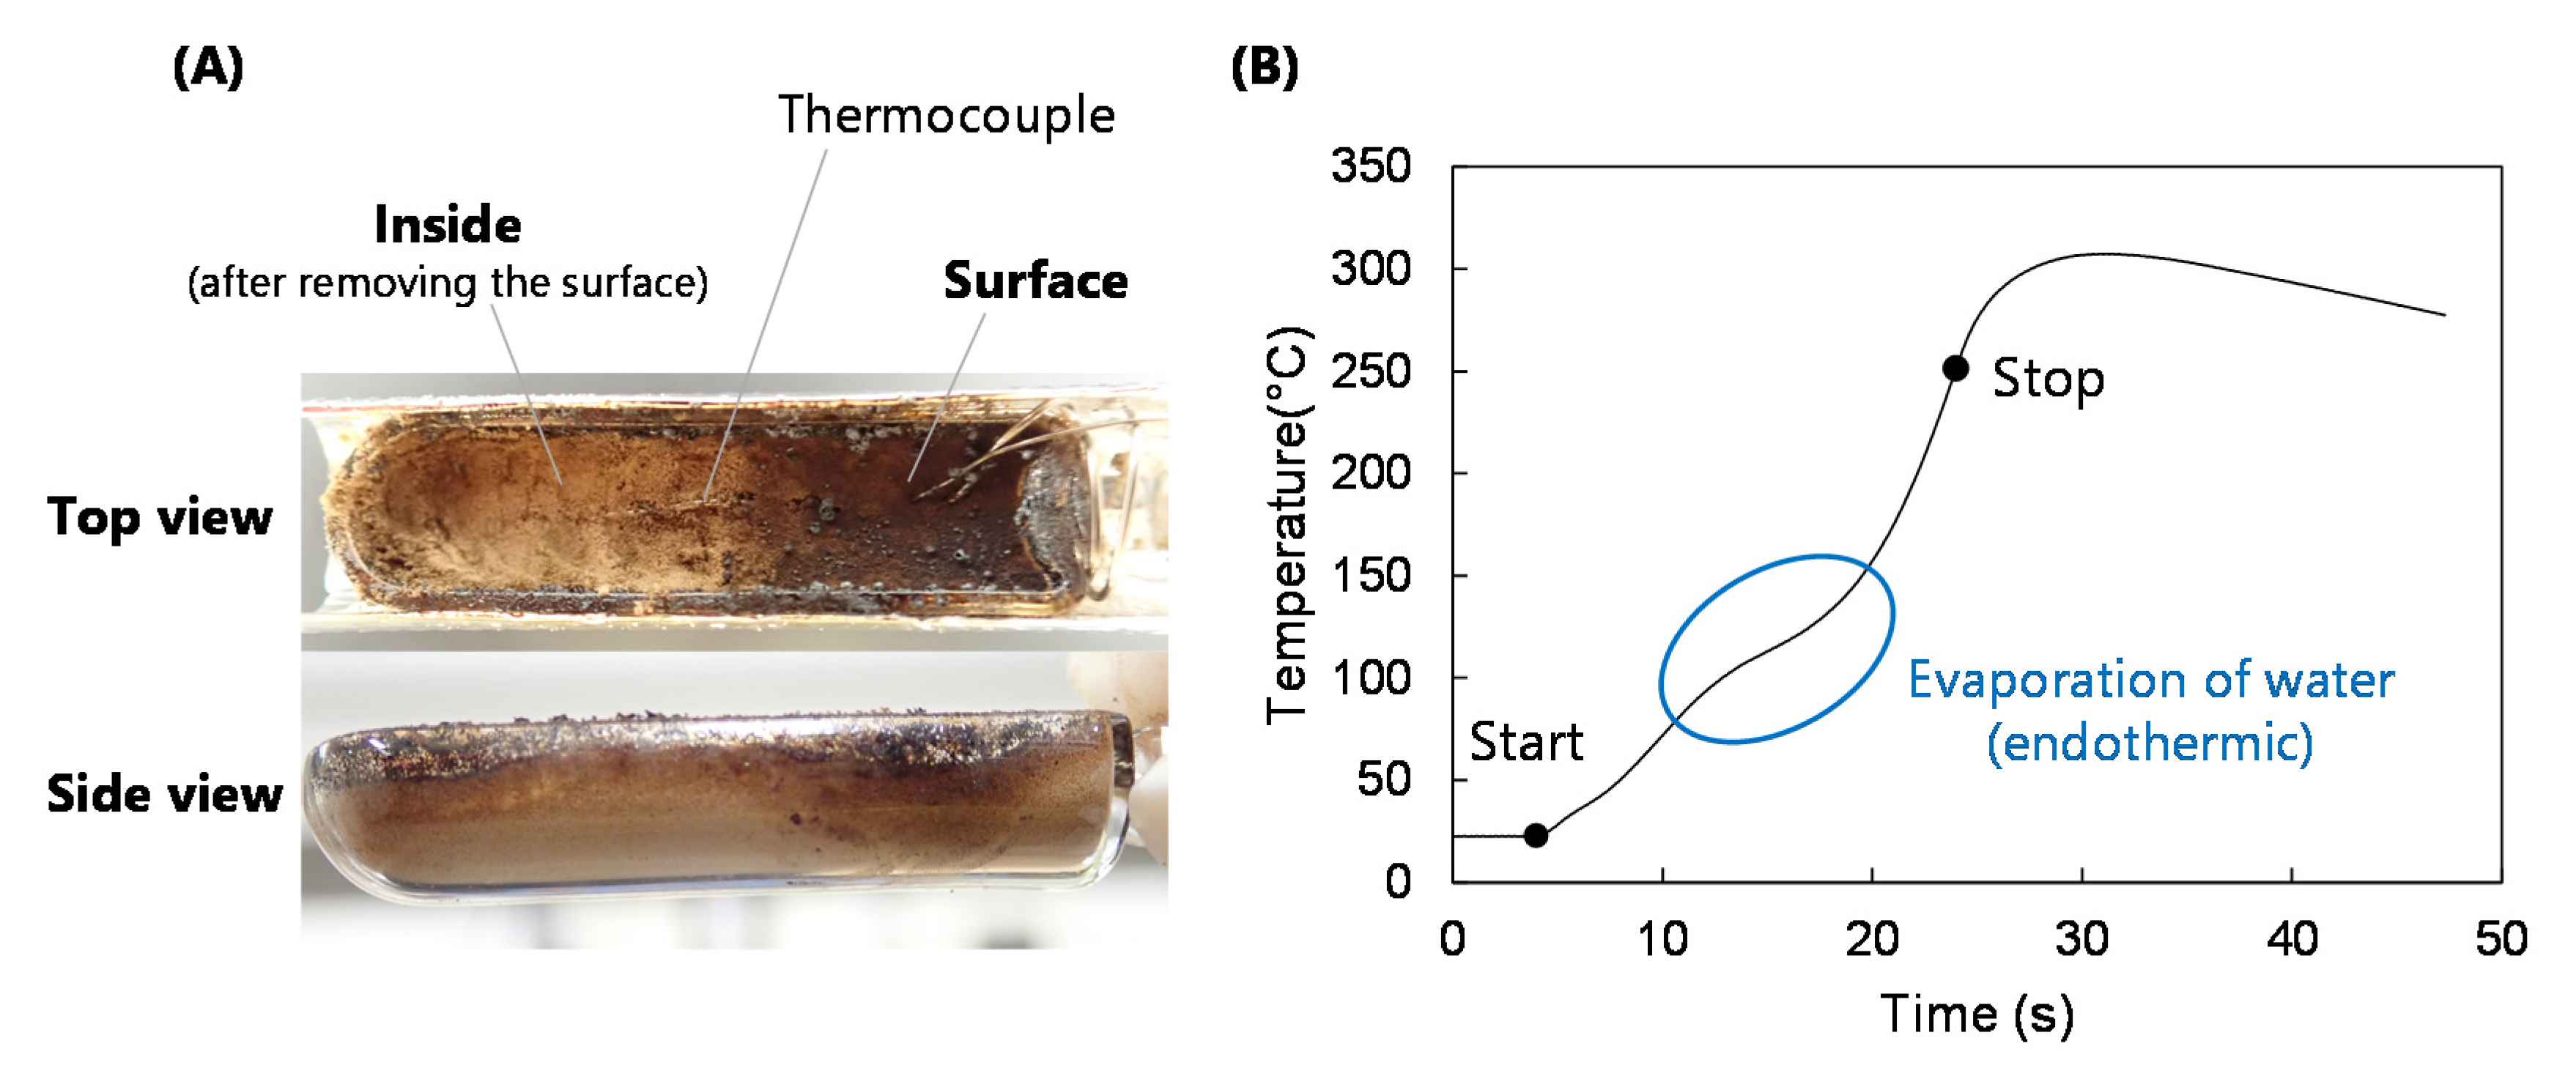
  • The gas yield increased when the cellulose was overheated to above 600 °C as a result of the secondary degradation of LG. This effect could be monitored by tracking the formation of CO, although in situ temperature measurements were difficult due to the nonuniform progression of the cellulose thermal degradation.
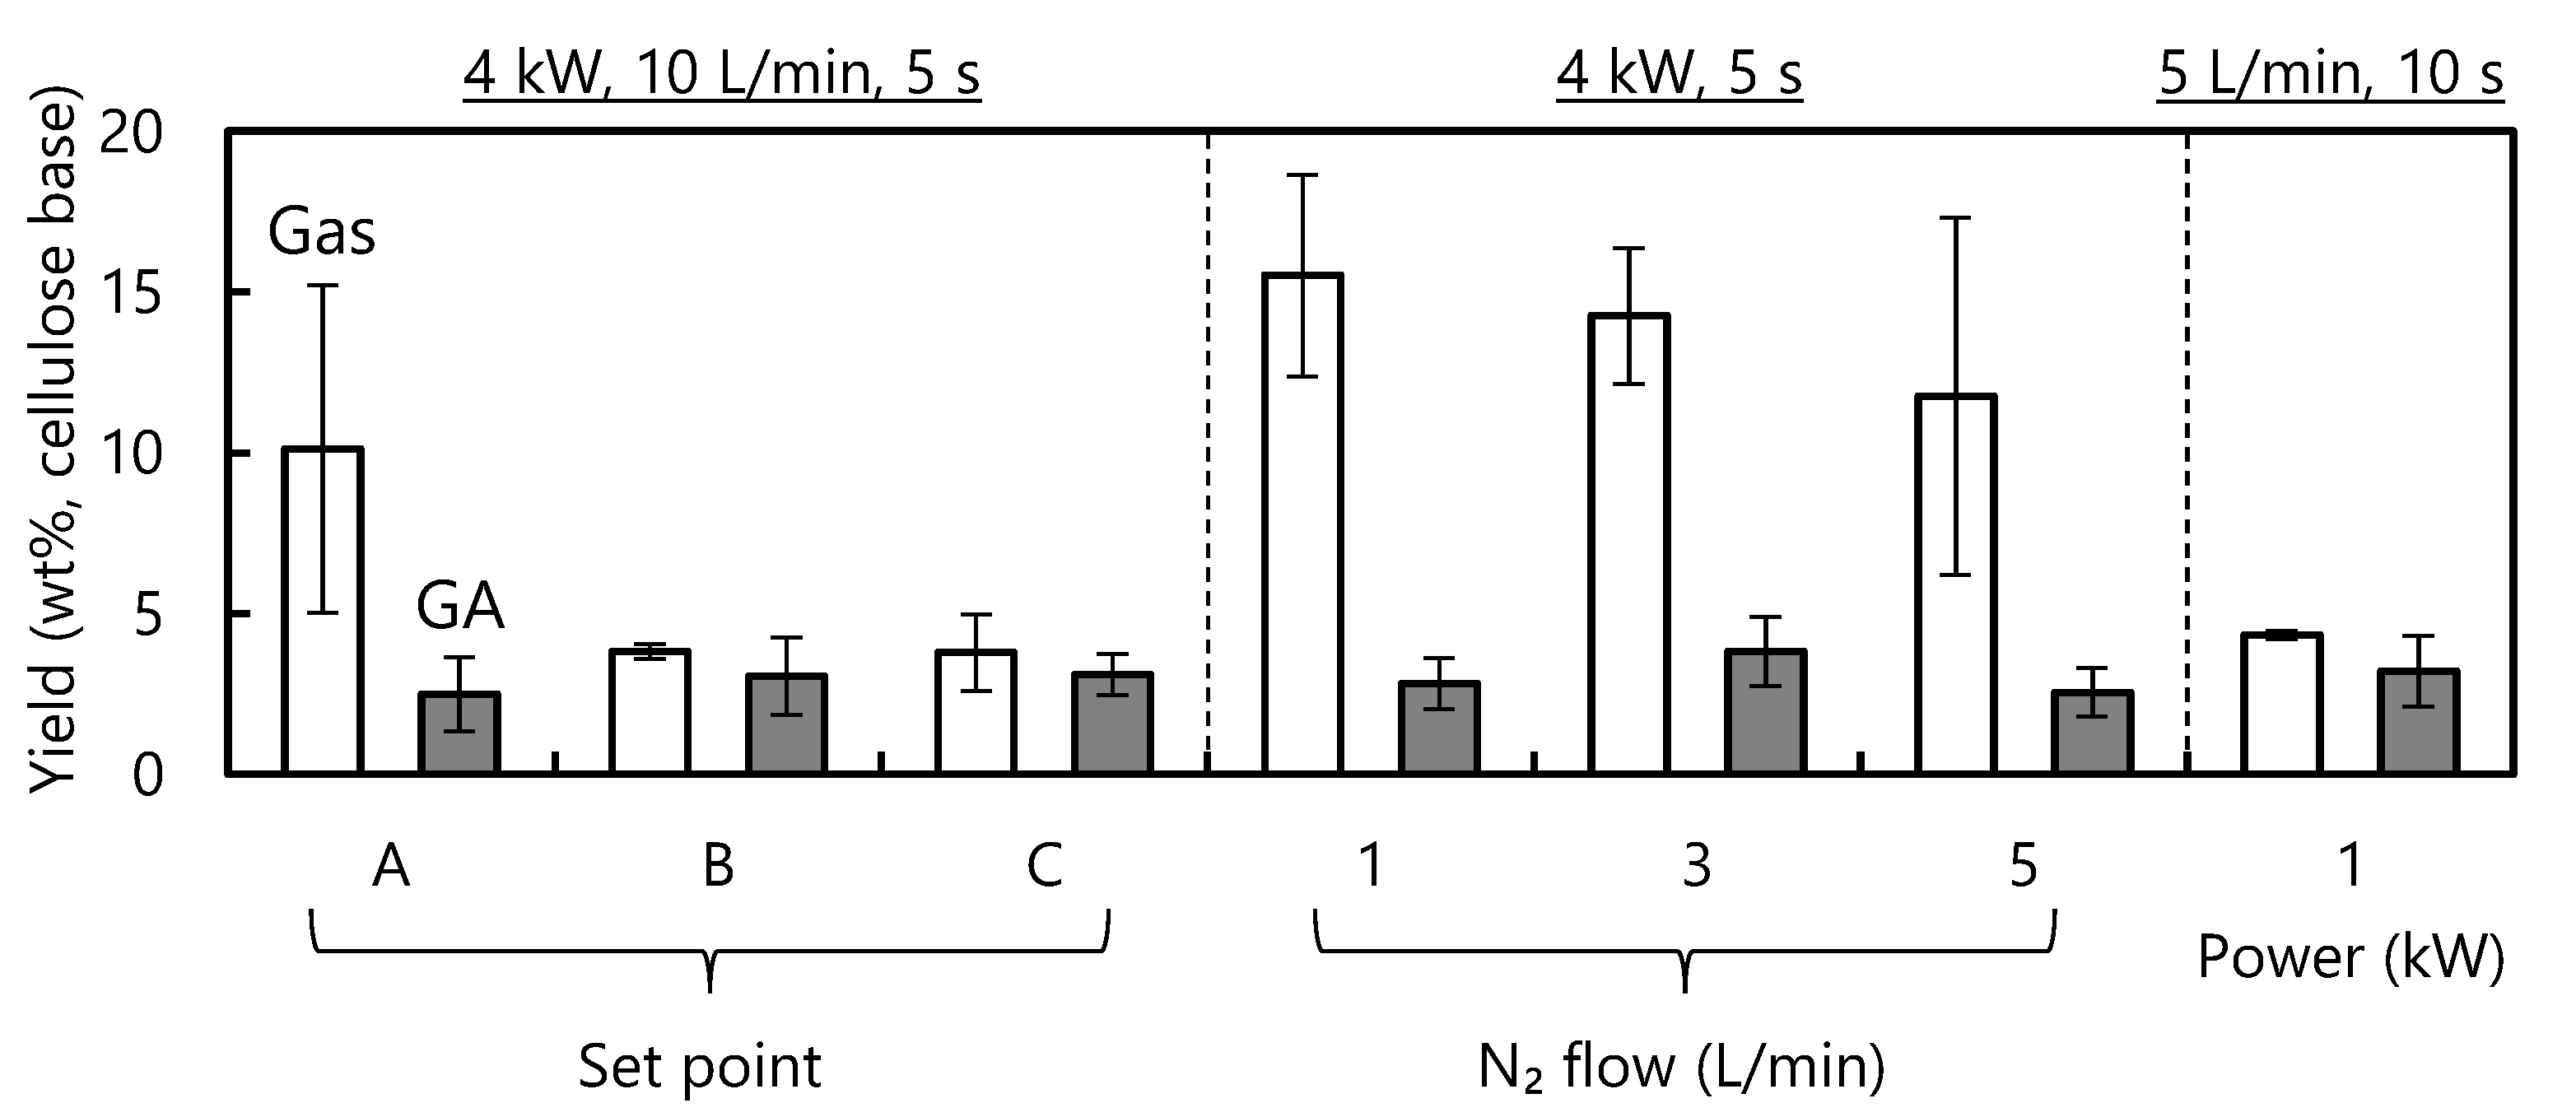
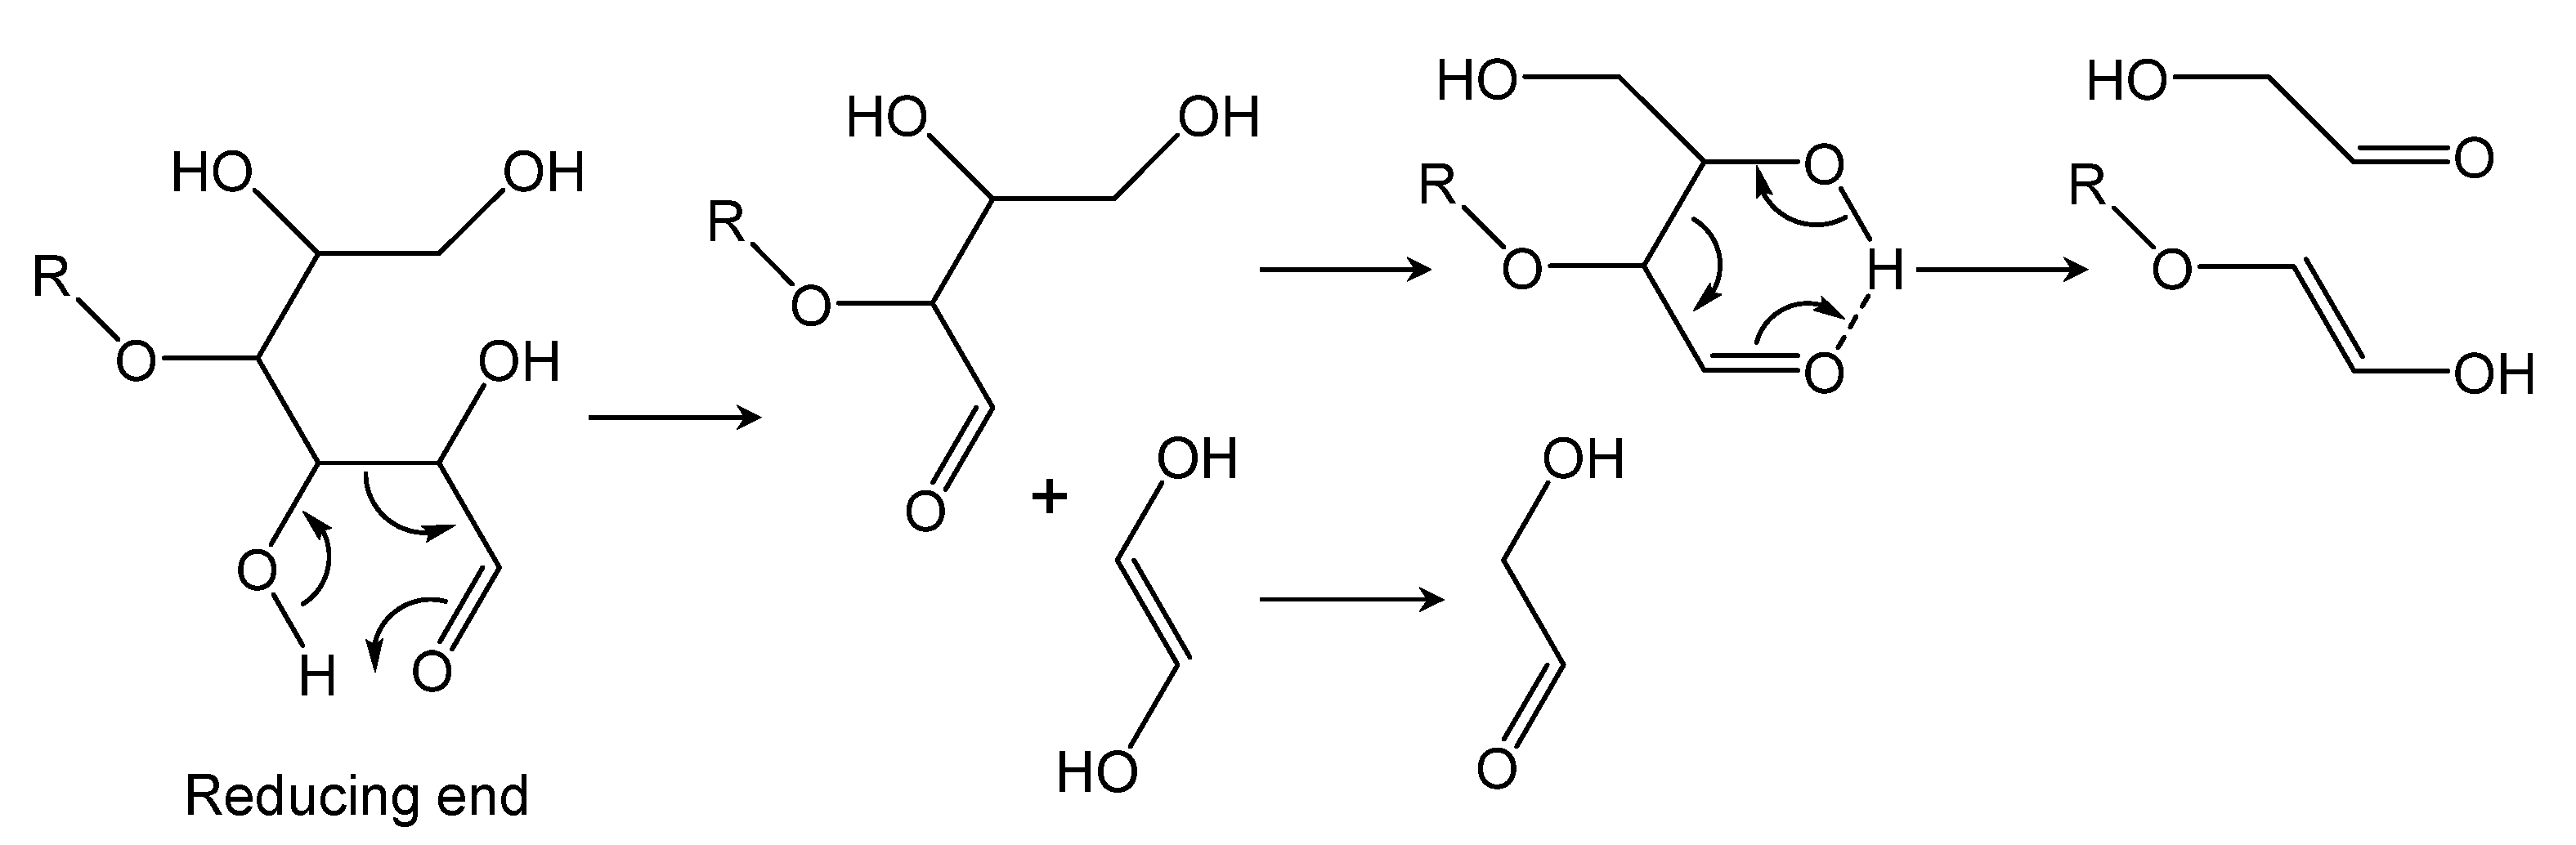
  • GA was the other major product of cellulose degradation, and the yield of this compound was not correlated with the gas output, suggesting that it was not a secondary LG degradation product. GA was evidently produced during the primary cellulose pyrolysis stage via the retro-Aldol fragmentation of the reducing ends of cellulose and other intermediate carbohydrates.
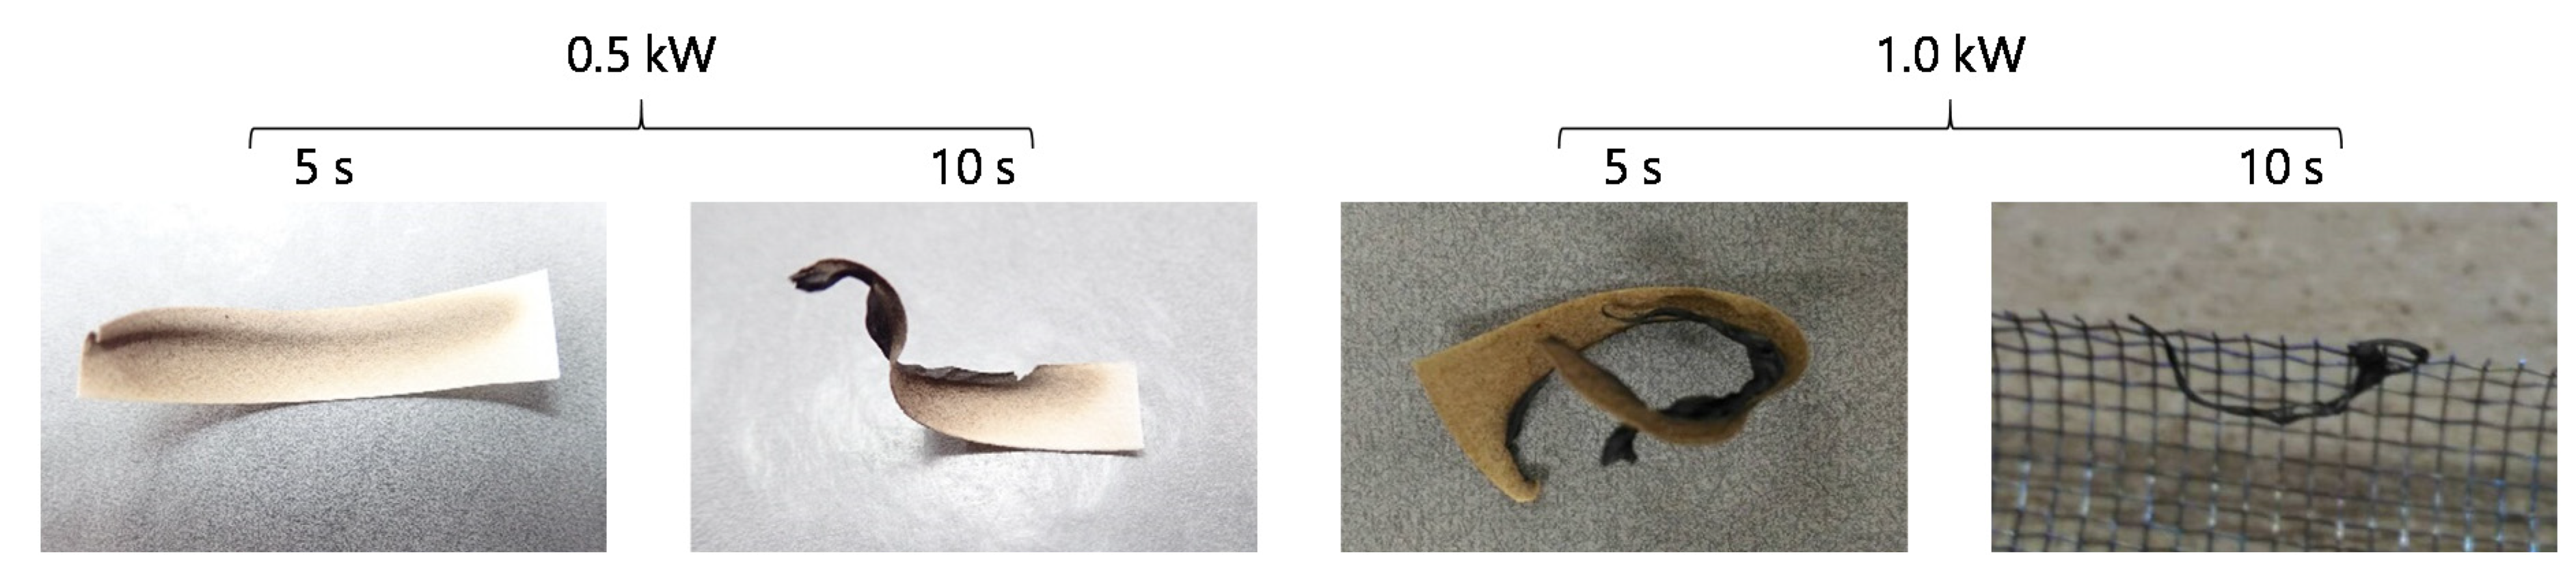
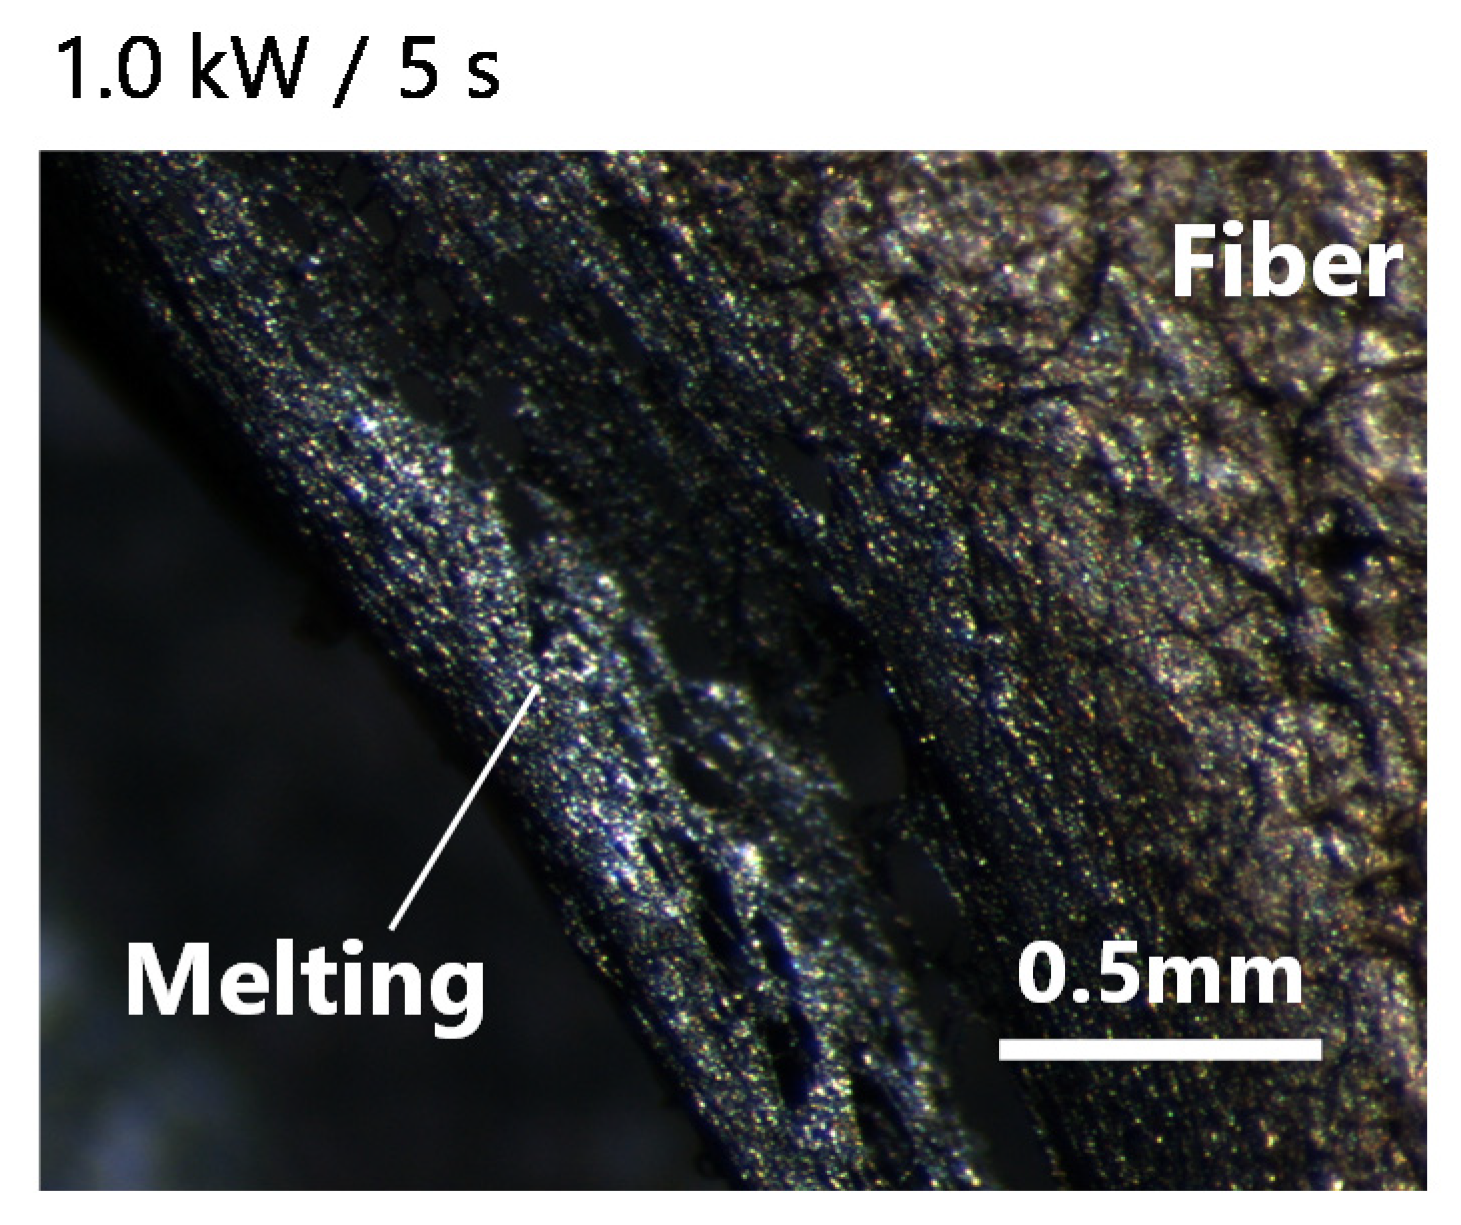
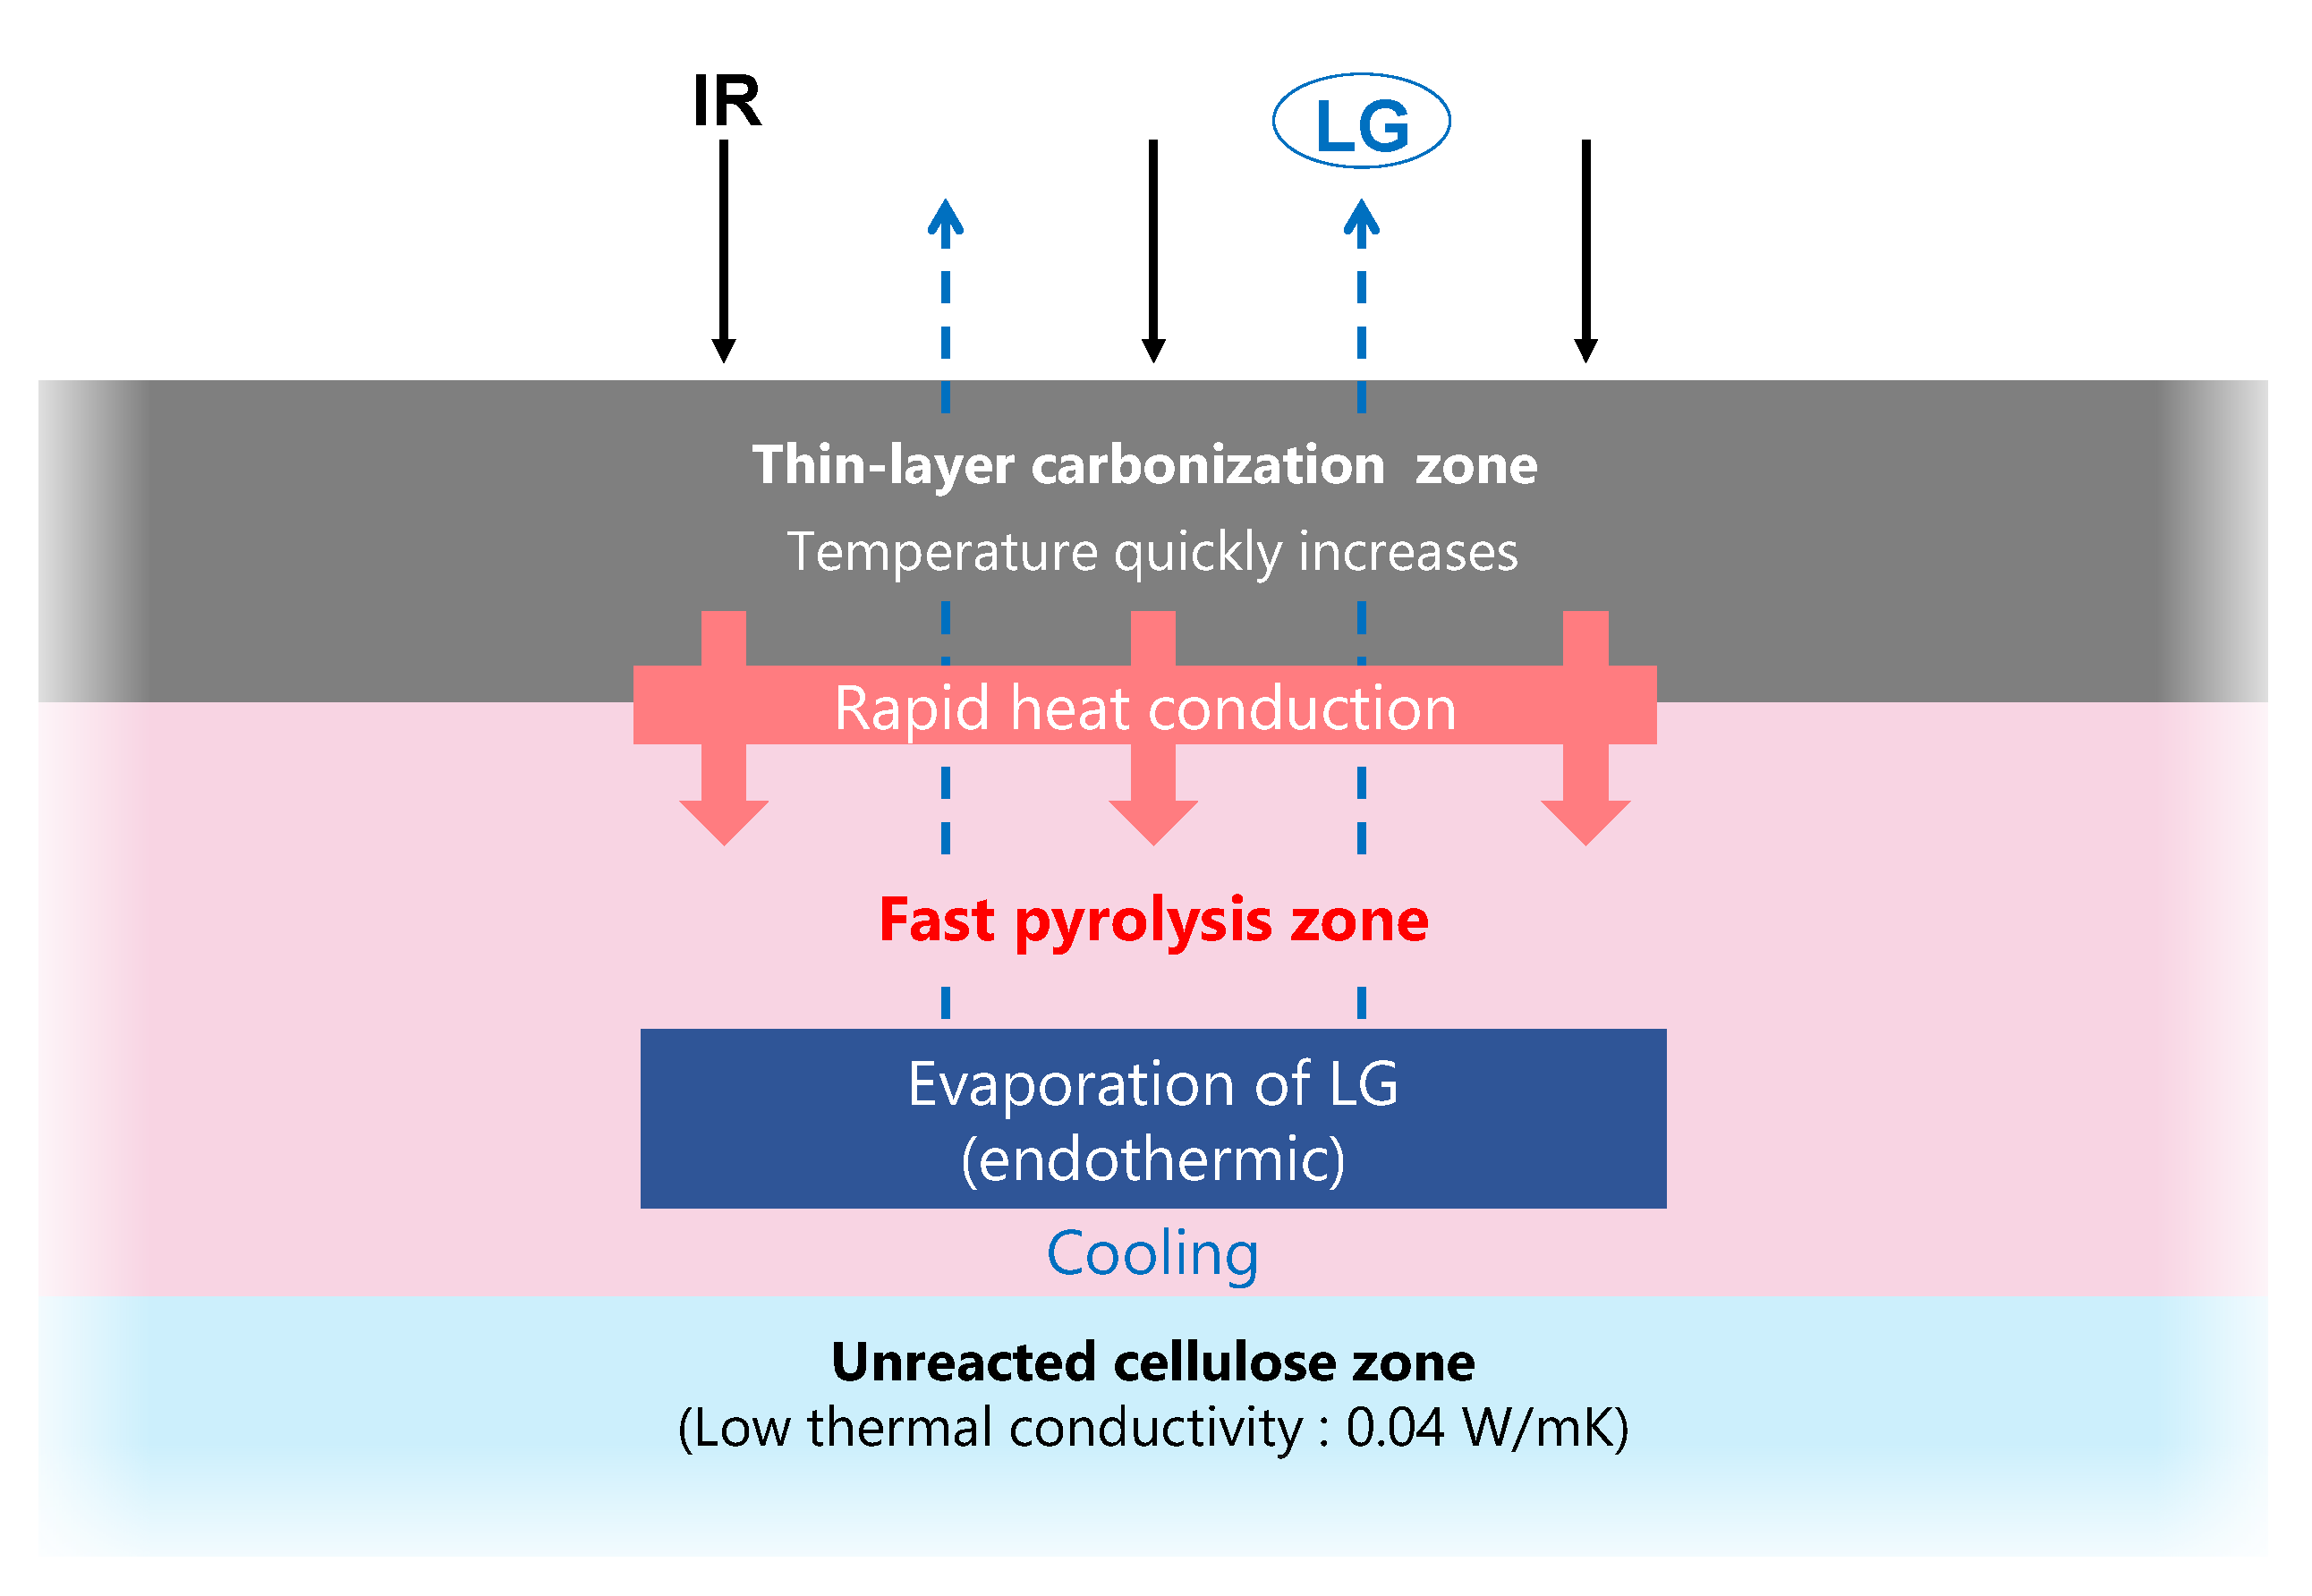
  • The thermal degradation of cellulose occurred in a nonuniform manner in response to IR irradiation, with the formation of a narrow carbonization layer. This layer was rapidly heated by efficiently absorbing IR and, in turn, heated the adjacent cellulose. This process then propagated throughout the cellulose to maintain a high LG output rate.
  • The use of IR heating during the production of LG from cellulose offers several advantages compared with other fast pyrolysis methods based on heat conduction. The latter methods require the cellulose to be ground and heated quickly to maintain a high sample temperature, while the IR heating methods allow the use of any cellulose, regardless of size. Infrared power can also be easily controlled by changing the electric power.
  • These results give insights into the production of biochemicals and biofuels via LG and pyrolysis-based saccharification.

Supplementary Materials

The following are available online at https://www.mdpi.com/article/10.3390/en14071842/s1, Figure S1: GC chromatogram of gaseous products from Whatman cellulose after pyrolysis by infrared heating (4kW, nitrogen flow: 1 L/min, 5 s). (A) column: MS5A, carrier gas: Ar, column temperature: 100 °C. (B) column: PoraPLOT Q, carrier gas: He, column temperature: 80 °C., Figure S2: 1H-NMR spectrum of soluble products in methanol from Whatman cellulose after pyrolysis by infrared heating (4kW, nitrogen flow: 1 L/min, 5 s)

Author Contributions

Conceptualization, T.N. and H.K.; methodology, T.N. and H.K.; formal analysis, T.N. and H.M.; investigation, T.N. and H.M.; resources, H.K.; writing—original draft preparation, T.N.; writing—review and editing, E.M. and H.K.; visualization, T.N. and E.M.; supervision, H.K.; project administration, T.N. and H.K.; funding acquisition, T.N. and H.K. All authors have read and agreed to the published version of the manuscript.

Funding

This work was supported by the JST Mirai Program, Japan (Grant no. JPMJMI20E3) and by the Japan Society for the Promotion of Science (JSPS) KAKENHI program (Grant nos. JP19H03019 and JP20J12367).

Institutional Review Board Statement

Not applicable.

Informed Consent Statement

Not applicable.

Data Availability Statement

Data is contained within the article or Supplementary Material.

Acknowledgments

The authors would like to express their sincere gratitude for the support of the Shin-Etsu Chemical Co., Ltd. We thank Michael D. Judge for editing a draft of this manuscript.

Conflicts of Interest

The authors declare no conflict of interest.

Abbreviations

LGlevoglucosan
GAglycolaldehyde

References

  1. Jahirul, M.I.; Rasul, M.G.; Chowdhury, A.A.; Ashwath, N. Biofuels production through biomass pyrolysis-A technological review. Energies 2012, 5, 4952–5001. [Google Scholar] [CrossRef]
  2. Uddin, M.N.; Techato, K.; Taweekun, J.; Rahman, M.M.; Rasul, M.G.; Mahlia, T.M.I.; Ashrafur, S.M. An overview of recent developments in biomass pyrolysis technologies. Energies 2018, 11, 3115. [Google Scholar] [CrossRef] [Green Version]
  3. Bridgwater, A.V. Review of fast pyrolysis of biomass and product upgrading. Biomass Bioenergy 2012, 38, 68–94. [Google Scholar] [CrossRef]
  4. Kersten, S.; Garcia-Perez, M. Recent developments in fast pyrolysis of ligno-cellulosic materials. Curr. Opin. Biotechnol. 2013, 24, 414–420. [Google Scholar] [CrossRef]
  5. Sharifzadeh, M.; Sadeqzadeh, M.; Guo, M.; Borhani, T.N.; Murthy Konda, N.V.S.N.; Garcia, M.C.; Wang, L.; Hallett, J.; Shah, N. The multi-scale challenges of biomass fast pyrolysis and bio-oil upgrading: Review of the state of art and future research directions. Prog. Energy Combust. Sci. 2019, 71, 1–80. [Google Scholar] [CrossRef]
  6. Venderbosch, R.; Prins, W. Fast pyrolysis technology development. Biofuels Bioprod. Biorefin. 2010, 4, 178–208. [Google Scholar] [CrossRef]
  7. Perkins, G.; Bhaskar, T.; Konarova, M. Process development status of fast pyrolysis technologies for the manufacture of renewable transport fuels from biomass. Renew Sustain. Energy Rev. 2018, 90, 292–315. [Google Scholar] [CrossRef]
  8. Shafizadeh, F.; Furneaux, R.H.; Cochran, T.G.; Scholl, J.P.; Sakai, Y. Production of levoglucosan and glucose from pyrolysis of cellulosic materials. J. Appl. Polym. Sci. 1979, 23, 3525–3539. [Google Scholar] [CrossRef]
  9. Kwon, G.J.; Kim, D.-Y.; Kimura, S.; Kuga, S. Rapid-cooling, continuous-feed pyrolyzer for biomass processing: Preparation of levoglucosan from cellulose and starch. J. Anal. Appl. Pyrolysis 2007, 80, 1–5. [Google Scholar] [CrossRef]
  10. Itabaiana Junior, I.; Avelar Do Nascimento, M.; De Souza, R.O.M.A.; Dufour, A.; Wojcieszak, R. Levoglucosan: A promising platform molecule? Green Chem. 2020, 22, 5859–5880. [Google Scholar] [CrossRef]
  11. Boutin, O.; Ferrer, M.; Lédé, J. Flash pyrolysis of cellulose pellets submitted to a concentrated radiation: Experiments and modelling. Chem. Eng. Sci. 2002, 57, 15–25. [Google Scholar] [CrossRef]
  12. Boutin, O.; Ferrer, M.; Lédé, J. Radiant flash pyrolysis of cellulose—Evidence for the formation of short life time intermediate liquid species. J. Anal. Appl. Pyrolysis 1998, 47, 13–31. [Google Scholar] [CrossRef]
  13. Lédé, J.; Blanchard, F.; Boutin, O. Radiant flash pyrolysis of cellulose pellets: Products and mechanisms involved in transient and steady state conditions. Fuel 2002, 81, 1269–1279. [Google Scholar] [CrossRef]
  14. Shoji, T.; Kawamoto, H.; Saka, S. Boiling point of levoglucosan and devolatilization temperatures in cellulose pyrolysis measured at different heating area temperatures. J. Anal. Appl. Pyrolysis 2014, 109, 185–195. [Google Scholar] [CrossRef]
  15. Pictet, A. Sur la transformation de la lévoglucosane en dextrine. Helv. Chim. Acta 1918, 1, 226–230. [Google Scholar] [CrossRef]
  16. Fukutome, A.; Kawamoto, H.; Saka, S. Processes forming gas, tar, and coke in cellulose gasification from gas-phase reactions of levoglucosan as intermediate. ChemSusChem 2015, 8, 2240–2249. [Google Scholar] [CrossRef] [Green Version]
  17. Hosoya, T.; Kawamoto, H.; Saka, S. Different pyrolytic pathways of levoglucosan in vapor- and liquid/solid-phases. J. Anal. Appl. Pyrolysis 2008, 83, 64–70. [Google Scholar] [CrossRef]
  18. Kawamoto, H.; Murayama, M.; Saka, S. Pyrolysis behavior of levoglucosan as an intermediate in cellulose pyrolysis: Polymerization into polysaccharide as a key reaction to carbonized product formation. J. Wood Sci. 2003, 49, 469–473. [Google Scholar] [CrossRef] [Green Version]
  19. Kawamoto, H.; Hosoya, T.; Ueno, Y.; Shoji, T.; Saka, S. Thermal stabilization and decomposition of simple glycosides in the presence of aromatic substances in closed ampoules: The role of OH π hydrogen bonding. J. Anal. Appl. Pyrolysis 2014, 109, 41–46. [Google Scholar] [CrossRef]
  20. Kawamoto, H.; Ueno, Y.; Saka, S. Thermal reactivities of non-reducing sugars in polyether—Role of intermolecular hydrogen bonding in pyrolysis. J. Anal. Appl. Pyrolysis 2013, 103, 287–292. [Google Scholar] [CrossRef]
  21. Suzuki, J.; Azuma, J.; Koshijima, T.; Okamura, K.; Okamoto, H. Characterization of mono- and oligosaccharides produed by CO2 laser irradiation on cellulose. Chem. Lett. 1983, 12, 481–484. [Google Scholar] [CrossRef] [Green Version]
  22. Dauenhauer, P.J.; Colby, J.L.; Balonek, C.M.; Suszynski, W.J.; Schmidt, L.D. Reactive boiling of cellulose for integrated catalysis through an intermediate liquid. Green Chem. 2009, 11, 1555–1561. [Google Scholar] [CrossRef]
  23. Teixeira, A.R.; Mooney, K.G.; Kruger, J.S.; Williams, C.L.; Suszynski, W.J.; Schmidt, L.D.; Schmidt, D.P.; Dauenhauer, P.J. Aerosol generation by reactive boiling ejection of molten cellulose. Energy Environ. Sci. 2011, 4, 4306–4321. [Google Scholar] [CrossRef] [Green Version]
  24. Lédé, J.; Li, H.Z.; Villermaux, J.; Martin, H. Fusion-like behaviour of wood pyrolysis. J. Anal. Appl. Pyrolysis 1987, 10, 291–308. [Google Scholar] [CrossRef]
  25. Luo, G.; Chandler, D.S.; Anjos, L.C.A.; Eng, R.J.; Jia, P.; Resende, F.L.P. Pyrolysis of whole wood chips and rods in a novel ablative reactor. Fuel 2017, 194, 229–238. [Google Scholar] [CrossRef] [Green Version]
  26. Weldekidan, H.; Strezov, V.; Town, G. Review of solar energy for biofuel extraction. Renew Sustain. Energy Rev. 2018, 88, 184–192. [Google Scholar] [CrossRef]
  27. Nordin, S.B.; Nyren, J.O.; Back, E.L. An indication of molten cellulose produced in a laser beam. Text. Res. J. 1974, 44, 152–154. [Google Scholar] [CrossRef]
  28. Schroeter, J.; Felix, F. Melting cellulose. Cellulose 2005, 12, 159–165. [Google Scholar] [CrossRef]
  29. Zeng, K.; Gauthier, D.; Soria, J.; Mazza, G.; Flamant, G. Solar pyrolysis of carbonaceous feedstocks: A review. Sol. Energy 2017, 156, 73–92. [Google Scholar] [CrossRef]
  30. Hopkins, M.W.; DeJenga, C.; Antal, M.J. The flash pyrolysis of cellulosic materials using concentrated visible light. Sol. Energy 1984, 32, 547–551. [Google Scholar] [CrossRef]
  31. Kwon, G.J.; Kuga, S.; Hori, K.; Yatagai, M.; Ando, K.; Hattori, N. Saccharification of cellulose by dry pyrolysis. J. Wood Sci. 2006, 52, 461–465. [Google Scholar] [CrossRef]
  32. Westerhof, R.J.M.; Oudenhoven, S.R.G.; Marathe, P.S.; Engelen, M.; Garcia-Perez, M.; Wang, Z.; Kersten, S.R.A. The interplay between chemistry and heat/mass transfer during the fast pyrolysis of cellulose. React. Chem. Eng. 2016, 1, 555–566. [Google Scholar] [CrossRef]
  33. Piskorz, J.; Radlein, D.S.A.G.; Scott, D.S.; Czernik, S. Pretreatment of wood and cellulose for production of sugars by fast pyrolysis. J. Anal. Appl. Pyrolysis 1989, 16, 127–142. [Google Scholar] [CrossRef]
  34. Piskorz, J.; Radlein, D.; Scott, D.S. On the mechanism of the rapid pyrolysis of cellulose. J. Anal. Appl. Pyrolysis 1986, 9, 121–137. [Google Scholar] [CrossRef]
  35. Richards, G.N. Glycolaldehyde from pyrolysis of cellulose. J. Anal. Appl. Pyrolysis 1987, 10, 251–255. [Google Scholar] [CrossRef]
  36. Banyasz, J.L.; Li, S.; Lyons-Hart, J.L.; Shafer, K.H. Cellulose pyrolysis: The kinetics of hydroxyacetaldehyde evolution. J. Anal. Appl. Pyrolysis 2001, 57, 223–248. [Google Scholar] [CrossRef]
  37. Degenstein, J.C.; Murria, P.; Easton, M.; Sheng, H.; Hurt, M.; Dow, A.R.; Gao, J.; Nash, J.J.; Agrawal, R.; Delgass, W.N.; et al. Fast pyrolysis of 13C-labeled cellobioses: Gaining insights into the mechanisms of fast pyrolysis of carbohydrates. J. Org. Chem. 2015, 80, 1909–1914. [Google Scholar] [CrossRef] [PubMed]
  38. Milosavljevic, I.; Oja, V.; Suuberg, E.M. Thermal effects in cellulose pyrolysis:  Relationship to char formation processes. Ind. Eng. Chem. Res. 1996, 35, 653–662. [Google Scholar] [CrossRef]
  39. Mok, W.S.L.; Antal, M.J. Effects of pressure on biomass pyrolysis. II. Heats of reaction of cellulose pyrolysis. Thermochim. Acta 1983, 68, 165–186. [Google Scholar] [CrossRef]
  40. Cho, J.; Davis, J.M.; Huber, G.W. The intrinsic kinetics and heats of reactions for cellulose pyrolysis and char formation. ChemSusChem 2010, 3, 1162–1165. [Google Scholar] [CrossRef]
  41. Di Blasi, C. Numerical simulation of cellulose pyrolysis. Biomass Bioenergy 1994, 7, 87–98. [Google Scholar] [CrossRef]
  42. Majumdar, A.; Mukhopadhyay, S.; Yadav, R. Thermal properties of knitted fabrics made from cotton and regenerated bamboo cellulosic fibres. Int. J. Therm. Sci. 2010, 49, 2042–2048. [Google Scholar] [CrossRef]
Figure 1. The fast pyrolysis system incorporating an infrared image furnace used in this study.
Energies 14 01842 g001
Figure 2. Photographic images of sample bags immediately after pyrolysis and 30 min later.
Energies 14 01842 g002
Figure 3. Positions (AC) of Whatman cellulose samples in the reactor and changes in temperature at the upstream and downstream positions of the furnace during blank heating trials with and without a stainless steel mesh (4.0 kW/5 s irradiation/10 L/min nitrogen flow). The values shown here are the increases relative to room temperature.
Energies 14 01842 g003
Figure 4. Effects of experimental parameters on the yields of levoglucosan (LG), gas and char from the pyrolysis of Whatman cellulose.
Energies 14 01842 g004
Figure 5. Proportions of H2, CO and CO2 in the gaseous products as functions of the overall gas yield from the fast pyrolysis of Whatman cellulose.
Energies 14 01842 g005
Figure 6. Yields of glycolaldehyde (GA) and overall gas yields (wt % based on amount of cellulose) from the pyrolysis of Whatman cellulose under various conditions.
Energies 14 01842 g006
Figure 7. Mechanism for the formation of GA from the reducing ends of cellulose and other intermediate carbohydrates during the fast pyrolysis of cellulose.
Energies 14 01842 g007
Figure 8. Photographic images of cellulose chars obtained under various fast pyrolysis conditions.
Energies 14 01842 g008
Figure 9. Micrographic image of the dark carbonized area of the cellulose char obtained at 1.0 kW after 5 s.
Energies 14 01842 g009
Figure 10. A diagram showing the process occurring during the fast pyrolysis of a Whatman cellulose sheet under IR irradiation.
Energies 14 01842 g010
Figure 11. Photographic images of quartz boats after applying IR radiation to (A) 300 mg and (B) 100 mg Avicel cellulose samples (1 kW, 5 L/min nitrogen flow, 30 s).
Energies 14 01842 g011
Figure 12. (A) Photographic images of a quartz sample boat after IR irradiation for 20 s (less than the 30 s required for complete pyrolysis of Avicel cellulose) and (B) the temperature inside the cellulose over time (1 kW, 5 L/min nitrogen flow).
Energies 14 01842 g012
Figure 13. A diagram showing the progression of the fast pyrolysis of Avicel cellulose powder in a quartz boat in response to IR irradiation.
Energies 14 01842 g013
Figure 14. Physicochemical processes occurring in the pyrolysis zone, in which the thermal degradation of cellulose proceeds in a very narrow area near the carbonized layer.
Energies 14 01842 g014
Table 1. Yields of LG, gas and char from the pyrolysis of Whatman cellulose while varying the IR power and irradiation time with a 5 L/min nitrogen flow.
Yield (wt%, Cellulose Base)
Infrared Power (kW)Irradiation Time (s)LGGasChar
0.554.9 ± 5.6 (48.1 ± 1.8) *0.9 ± 0.789.8 ± 7.9
1035.0 ± 2.7 (51.3 ± 1.3)4.0 ± 3.331.7 ± 5.6
1.0541.3 ± 4.6 (51.9 ± 4.1)1.6 ± 0.620.4 ± 8.1
1047.5 ± 3.8 (48.3 ± 3.7)4.3 ± 0.11.7 ± 0.8
* Figures in parentheses are estimated yields based on the amounts of cellulose that were degraded over 0–5 s and 5–10 s. The latter amount was calculated from the difference in mass between the char portions obtained at 5 s and at 10 s.
Publisher’s Note: MDPI stays neutral with regard to jurisdictional claims in published maps and institutional affiliations.

