Article

Thermodynamic Analysis of Biomass Gasification Using Aspen Plus: Comparison of Stoichiometric and Non-Stoichiometric Models

by
María Pilar González-Vázquez
1,
Fernando Rubiera
1,
Covadonga Pevida
1,*,
Daniel T. Pio
2 and
Luís A.C. Tarelho
2
1
Instituto de Ciencia y Tecnología del Carbono, INCAR-CSIC, Francisco Pintado Fe 26, 33011 Oviedo, Spain
2
Department of Environment and Planning & Centre for Environmental and Marine Studies (CESAM), Campus Universitário de Santiago, University of Aveiro, 3810-193 Aveiro, Portugal
*
Author to whom correspondence should be addressed.
Energies 2021, 14(1), 189; https://doi.org/10.3390/en14010189
Submission received: 27 November 2020 / Revised: 24 December 2020 / Accepted: 28 December 2020 / Published: 1 January 2021
(This article belongs to the Collection Feature Papers in Bio-Energy)

Abstract

:
The gasification process involves several reactions that occur simultaneously and are interrelated by several independent variables. Simulation tools can help us to understand the process behaviour and predict the efficiency and final composition of the products. In this work, two thermodynamic equilibrium models developed in Aspen Plus® software were assessed: a non-stoichiometric model based on the feedstock composition and on the most probable compounds expected from the results of the gasification process using minimisation of Gibbs free energy and a stoichiometric model based on a set of chemical reactions considered as the most relevant to describe the gasification process. Both models were validated with experimental data from a bubbling fluidised bed semi-pilot scale gasifier using pine kernel shells (PKS) as feedstock. The influence of temperature, stoichiometric ratio (SR) and steam to biomass ratio (SBR) were analysed. Overall, predictions of the gas composition and gasification efficiency parameters by the stoichiometric model showed better agreement to the experimental results. Our results point out the significance of an accurate description of the equilibrium composition of producer gas with the stoichiometric model for the gasification of biomass.

1. Introduction

The requirements to reduce greenhouse gas emissions entail the need to search for new eco-friendly alternatives [1]. Biomass is a renewable energy source and a carbon-neutral fuel; it also brings benefits in terms of reduced NOx and SOx emissions and, thus, it is considered one of the main alternatives to replace fossil fuels [2]. Two paths, biological and thermochemical, can be followed for the conversion of biomass into useful products [3]. In recent decades, thermochemical routes have received more attention, particularly the gasification technology [4].
Gasification consists of partial oxidation of carbonaceous materials in a restricted oxygen atmosphere to produce a gaseous fuel, conventionally denoted as synthesis gas. The syngas is composed of carbon monoxide (CO) and hydrogen (H2) with small quantities of carbon dioxide (CO2), nitrogen (N2), methane (CH4) and other light hydrocarbons [5]. The final composition depends on several factors such as biomass type, gasification technology or gasifying agent used (e.g., air. steam) [6]. The syngas is used to generate electricity, hydrogen, liquid fuels or chemical products.
A number of studies have been performed on the quality of the syngas produced from biomass gasification. E. Monteiro et al. [7] studied the influence of different parameters in the composition of produced gas, during gasification of peach stones in an autothermal bubbling fluidised bed gasifier using steam as a gasifying agent. They observed a higher syngas quality when the gasification temperature increased from 750 to 850 °C. However, a negative effect on the lower heating value (LHV) was detected as a consequence of the decrease in CO concentration in the final product due to moisture content. A similar effect was observed with the biomass moisture content by A. Shehzad et al. [8], during the gasification of municipal solid waste (MSW) in a circulating fluidised bed gasifier.
D.T. Pio et al. [9] integrated experimental data obtained in a pilot-scale bubbling fluidised bed gasifier with experimental data reported in the literature regarding biomass gasification. They observed that the quality and composition of the produced gas and the process performance parameters are deeply dependent on the fuel type, operating conditions and reactor design. For example, in the analysed results, authors observed that the stoichiometric ratio had a major impact on the composition of the produced gas and on the process performance.
A comparison of the effect of the gasification of Miscanthus with mixtures of air with O2 (enriched air), steam and CO2 on the composition and possible applications of the syngas produced was conducted by N.D. Couto et al. [10]. They recommended the use of air–O2 mixtures for power generation and Fisher–Tropsch synthesis, whereas air–steam and air–CO2 mixtures increased the H2 and CO contents in the syngas, respectively. A parametric study during gasification of rice straw with air–steam and steam–CO2 mixtures using Aspen Plus was performed by K. Im-orb et al. [11]. These authors concluded that syngas yield was higher with the steam–CO2 mixture; however, with this gasifying mixture it was not possible to attain an autothermal process, and it consumed more energy than the air–steam mixture.
The complexity of the gasification process has prompted the need to develop mathematical models to better explain and provide a better understanding of the process performance [12]. In general, mathematical models can be sorted into kinetic and thermodynamic equilibrium models. In this study, the focus is on equilibrium models that predict the thermodynamic limits of the gasification reaction system independently of the gasifier design. Although equilibrium is not reached under normal operation, these models predict the main components to be obtained in the process and set the yield limit [13]. The development of equilibrium models relies on general assumptions that may not fit the results of all types of gasifiers. Likewise, the product gas of fluidised bed gasifiers generally contains tar, which is not considered in equilibrium models, and more hydrocarbons than predicted [14], although these discrepancies might not drastically affect the overall efficiency.
Stoichiometric thermodynamic models use a set of main chemical reactions to describe the gasification process, while in non-stoichiometric models the equilibrium condition is set to minimising the Gibbs free energy of the system [15]. J. George et al. [16] formulated the numerical approach associated with a stoichiometric model for biomass gasification, while X. Li et al. [17] proposed a non-stoichiometric equilibrium model to predict the performance of a pilot circulating fluidised bed (CFB) coal gasifier. Other authors have developed stoichiometric models to evaluate the influence of equivalence ratio, moisture content and reaction temperature in a downdraft gasifier, using different biomasses such as wood chips, paper, paddy husk and municipal wastes [18] and cashew nut shells [19].
The number and complexity of the chemical reactions that take place in a biomass gasifier have promoted the development of process simulators. Aspen Plus is a commercial software which includes an extensive properties library and operation blocks to simulate specific process operations [15]. Each step of the gasification process can be described and tested in a block before being integrated into the global process. This software shows the capability of using non-conventional components, such as biomass or ash [20]. Several authors have made use of this tool to simulate processes involving the gasification of biomass. Pala et al. [21] developed a thermodynamic model in Aspen Plus based on Gibbs free energy minimisation. The thermodynamic properties were calculated according to the Peng–Robinson equation of state with Boston–Mathias modification. The model was validated with experimental data for wood residues obtained in a 0.3 m diameter fluidised bed gasifier. Monir et al. [22] described a simulation model to study the effect of pressure and temperature on syngas production. The gasification process was divided into four stages represented by four different blocks in the Aspen Plus model. Experimental data were obtained in a pilot-scale downdraft reactor using a mixture of empty fruit brunch and charcoal. Dhanavath et al. [23] used karanja press seed cake as biomass feedstock to study the effect of oxygen–steam as gasifying agents in a fixed bed gasifier, and the experimental data were simulated with an equilibrium model developed with Aspen Plus. Other works performed sensitivity analyses to evaluate the changes in syngas quality using various biomasses as a function of process conditions, i.e., steam to biomass ratio, air equivalence ratio and temperature [2,24,25]. The production of methanol from syngas obtained by pine gasification in a double chamber gasifier was studied using Aspen Plus simulation by Puig-Gamero et al. [26]. The influence of steam and temperature on gas quality was evaluated. The equilibrium model considered the separation of gas and char before the gasification step. The energy needed in the process was attained by burning part of the produced char. Biomass nature was also considered in various studies, e.g., 23 types of biomass were investigated and analysed through modelling and simulation of the biomass gasification process, where the proposed model was based on the Gibbs free energy minimisation [27]. Three conventional biomasses, rice husk, wood chips and larch wood, were selected to assess energy and exergy performance of the process with the purpose of maximising the hydrogen yield [27]. Thermodynamic efficiencies were also evaluated using oil palm shell [28] and rice straw [29].
From a literature review, it can be concluded that non-stoichiometric methods based on the minimisation of Gibbs free energy have been often used in equilibrium modelling using the Aspen Plus process simulator. On the other hand, the use of stoichiometric equilibrium models is scarce in the literature, where only numerical models with a reduced number of reactions are reported [18,19]. Therefore, the objective of the present work is to compare a non-stoichiometric model and a stoichiometric one, both built with Aspen Plus, to ascertain their suitability to predict the steady-state performance of biomass gasification. Simulation results have been validated with the experimental data previously obtained in an atmospheric pressure bubbling fluidised bed semi-pilot gasification unit described elsewhere [30].

2. Materials and Methods

2.1. Aspen Plus Software

Aspen Plus V.8.6 was used to model biomass gasification and to predict the syngas composition resulting from different feedstocks under a wide range of operating conditions. Each process operation is represented in the flow-diagram by operation blocks, specifying material and energy streams. This software includes a large property database for chemical components which is used in the calculations; it also has the capability to incorporate custom-built Fortran or Excel subroutines when required. A flow chart of the simulation procedure using by Aspen Plus® software is described in Figure S1 in the Supplementary Materials.

2.2. Process Assumptions

The following assumptions were considered in the development of the equilibrium models:
  • The process occurs under steady-state conditions.
  • Ash is inert without catalytic activity and does not participate in the gasification process.
  • Char is composed solely by carbon and its conversion efficiency is 100%.
  • Heat and pressure losses are neglected.
  • All reactions reach equilibrium conditions and kinetics are not considered.
  • Drying and pyrolysis happen simultaneously and volatile products consist of H2, CO, CO2, CH4 and H2O.
  • Tar formation is not considered.
These assumptions are in good agreement with those of Prins et al. [14] that realized the importance of identifying a suitable departing hypothesis to preserve the predictive capacity of the thermodynamic model.

2.3. Physical Properties

The Peng–Robinson equation of state with Boston–Mathias modifications (PR–BM) was selected as the property package to estimate the physical properties of the conventional components. PR–BM is suggested for gas-processing, petrochemical and refinery applications [21]. Biomass and ash are considered non-conventional components. They are defined as component attributes in Aspen Plus called PROXANAL, ULTANAL and SULFANAL using the proximate and ultimate analyses. Only physical properties, enthalpy and density were calculated, using DCOALIGT and HCOALGEN models.

2.4. Chemical Reactions

Biomass gasification involves several reactions between biomass char and the gasifying agent. In this work, a mixture of air and steam was introduced into the reactor as a gasifying agent, and the main reactions considered in the gasification process are summarised in Table 1. These reactions were selected following the knowledge of the most relevant chemical species that are present in the largest amounts (i.e., >10−4 vol.%) in the gasification process, and the respective reactive mechanisms, based on literature data [13,31], and experimental information [30] which in turn at the conditions of the gasification process are those which have the lowest value of free Gibbs energy of formation.
Combustion reactions (R-1 and R-2) are favoured when O2 is used as a gasifying agent, due to the high reactivity of the carbonaceous char particles towards O2. When steam (H2O) is present in the gasification process, oxidation reactions are followed by char–steam reactions because carbon reactivity with steam is between three to five times lower than with O2. At the same time, the char that has not been consumed during combustion reacts with steam to be converted into gaseous products (R-4, R-5). The Boudouard reaction (R-3) could also take place, although it is much slower than char–O2 and char–steam reactions [6]. Simultaneously, gas-phase reactions occur: the produced CO and CH4 can react with steam (R-7 and R-8) to increase H2 production.

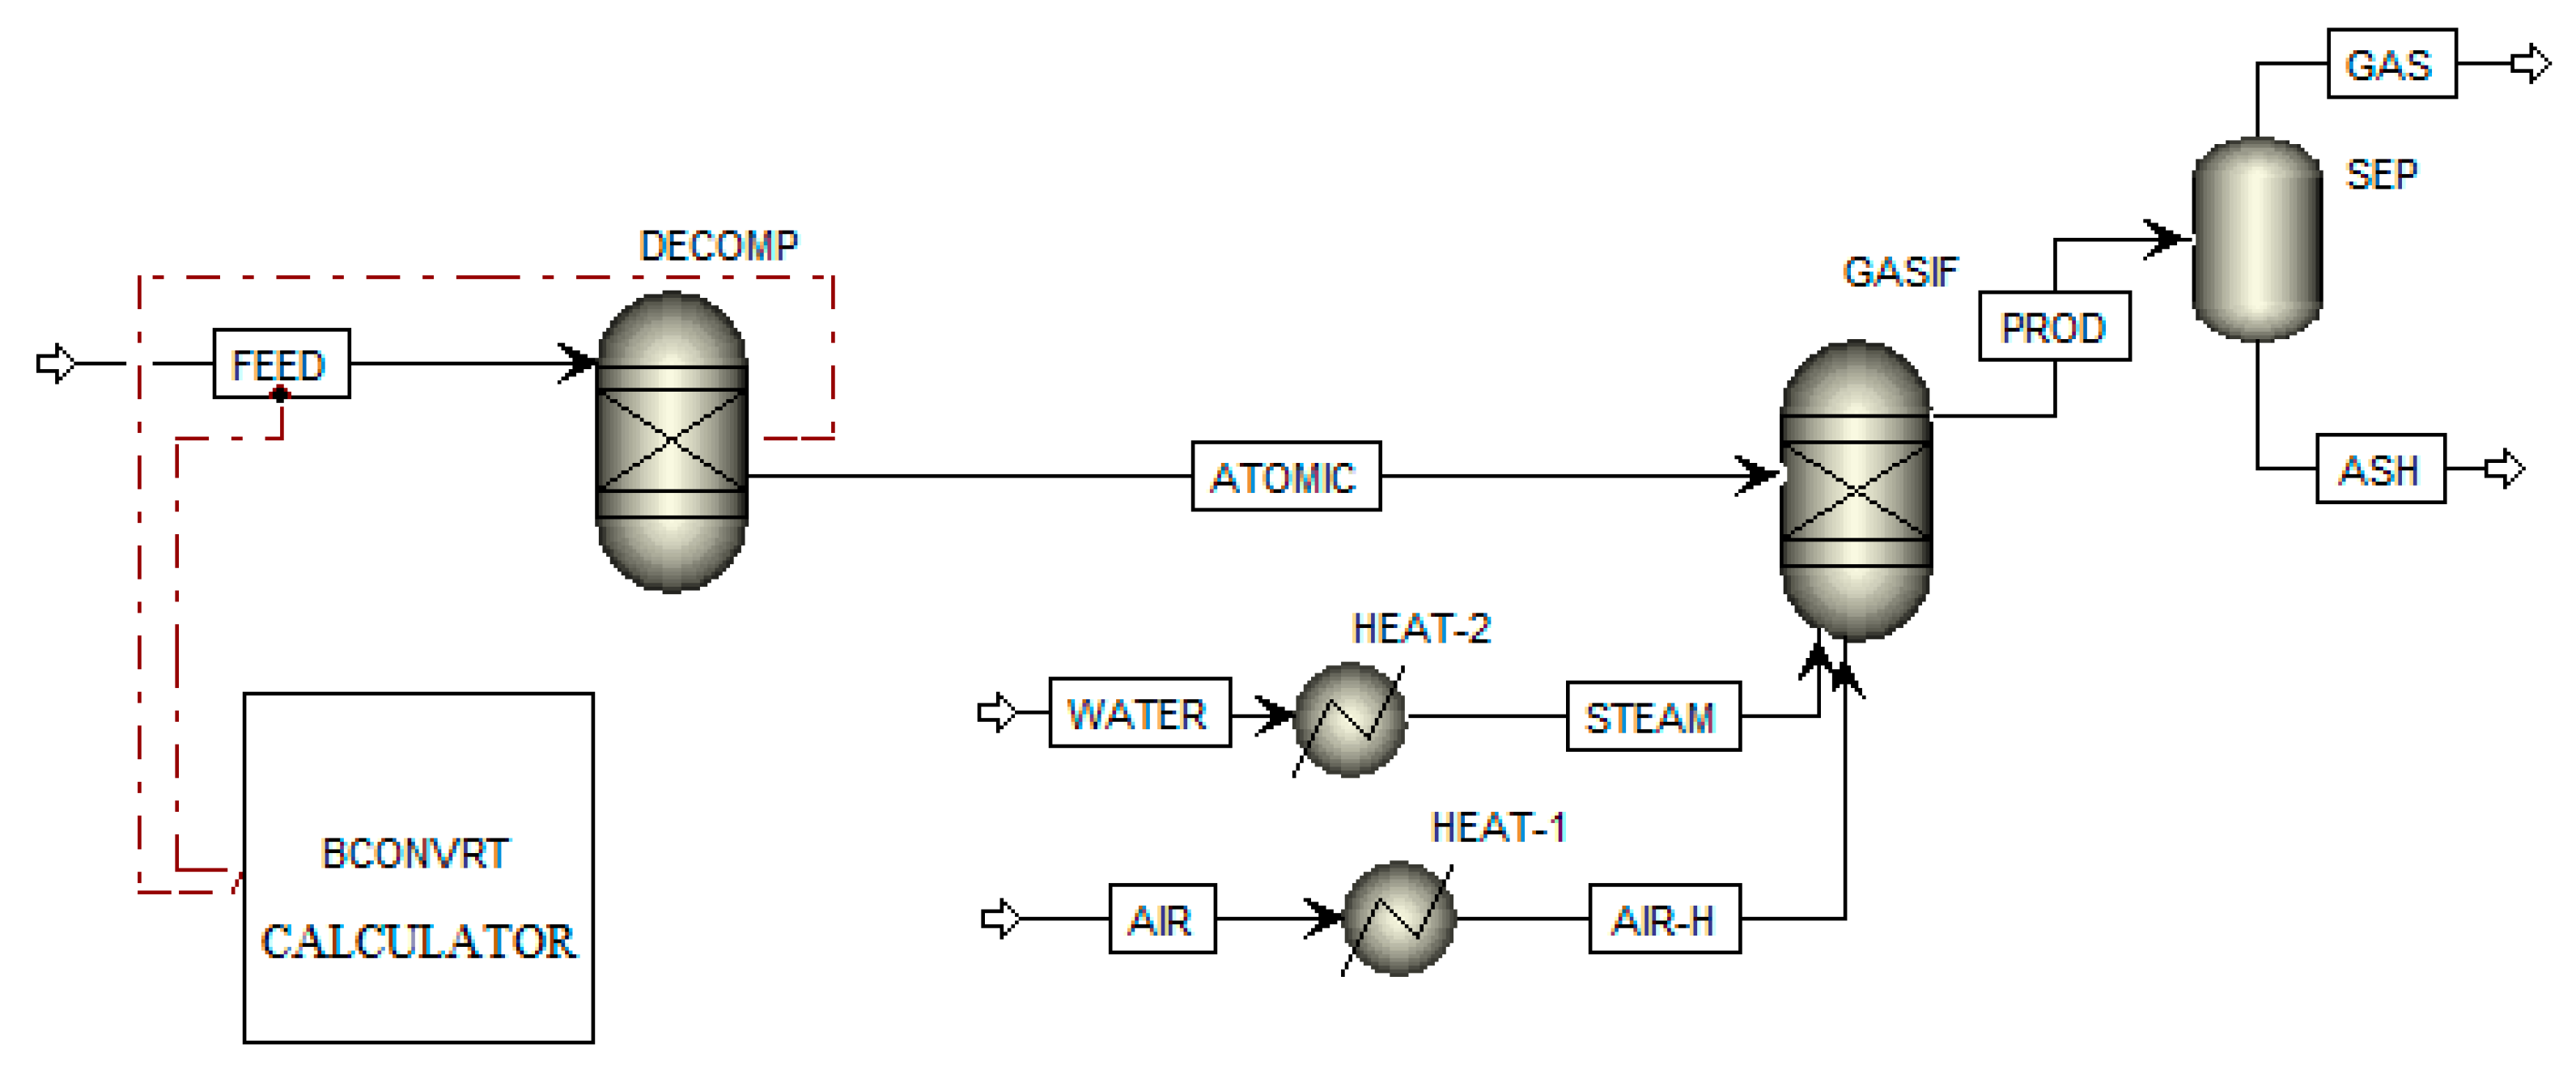
2.5. Non-Stoichiometric Flow-Diagram Description

In the non-stoichiometric model developed, the gasification product gas composition was adjusted using a restricted equilibrium model in the RGIBBS block with the aid of a temperature approach for the reactions. This empirical approach was proposed by Gumz [32], where the gas composition can be adjusted to match the experimental data obtained in the pilot plant using the Aspen tool “Data Fit” to modify reaction equilibrium. To apply this approach, the reactions involved in the system should be independent. When a mixture of air and steam is used as a gasifying agent, R-3, R-4, R-7, and R-8 are the main independent reactions involved in the gasification process so they have been specified in the RGIBBS reactor as a reaction set.
Other researchers also introduced modifications in the basic equilibrium model to match up with the experimental data [25,33].
The flow diagram and the different blocks used in the non-stoichiometric gasification model are depicted in Figure 1. The FEED stream, defined as non-conventional components, is fed to the RYIELD (DECOMP) where pyrolysis takes place and biomass is decomposed into its main components on a mass balance basis. A calculator block (BCONVRT) with a FORTRAN subroutine is required to calculate the yields based on the component attributes of the biomass feedstock. The outlet stream (ATOMIC) from the DECOMP block is composed of C, H, O, N, S and ash, and it is fed to the RGIBBS (GASIF) where chemical equilibrium takes place. Gasifying agents (air and steam) are added into the gasifier as streams AIR-H and STEAM after passing through two heaters (HEAT-1 and HEAT-2). Product stream (PROD) contains H2, CO, CO2, N2, H2O and CH4, and it goes to a separator block (SEP) where the solid fraction is separated from the gaseous product. More details of each block are described in Table S1 in the Supplementary Materials.

2.6. Stoichiometric Flow-Diagram Description

Stoichiometric models incorporate the chemical reactions and the species involved in the process. Although several researchers have used these models to explain the gasification process, biomass gasification is highly complex and a limited number of reactions are usually considered. The Aspen Plus model described in this section was created with the gasification reactions summarised in Table 1. Several stoichiometric configurations were evaluated against the experimental data obtained in the bubbling fluidized bed reactor. Figure 2 illustrates the stoichiometric model flow-diagram that best suits the results obtained in the pilot plant. The process was split up into 6 steps: feed, pyrolysis, combustion, homogeneous and heterogeneous gasification reactions and gas–liquid separation. Feed and devolatilisation steps follow the same pattern as the non-stoichiometric model described in Section 2.5. Combustion occurs into a stoichiometric reactor (COMB) when conventional components of biomass (ATOMIC) react with O2 from the air stream (AIR-H). The combustion products stream (TO-EQUIL), coupled with the steam gasifying agent (STEAM), then move to the gasification zone. Two stages were considered to simulate the gasification step. Firstly, homogeneous reactions take place into an equilibrium reactor (REQUIL). Secondly, the carbonaceous char unburnt during the combustion step reacts with steam, thus increasing the synthesis gas production (GASIF). O2 is depleted during the combustion reactions forming CO2 that reacts with carbon to produce CO according to the Boudouard reaction (R-3). The char–hydrogen or methanation reaction can also participate to form CH4 (R-6), although char–CO2 and char–H2 reactions are two to five times slower than water–gas reactions [6]. Finally, gaseous and solid products from the outlet stream (TO-SEP) are split up in a separator block (SEP).

2.7. Experimental Data Used for Model Validation

Experimental data were obtained in an atmospheric pressure bubbling fluidised bed gasifier. Full details of the reactor configuration and the experimental data are reported by González-Vázquez et al. [30]. In brief, the gasification reactor is a SS310 cylinder with a height of 1 m and an inner diameter of 77 mm, which ends in a 52 mm long and 133 mm diameter freeboard. The air required for fluidisation and partial oxidation reaction is supplied directly to the reactor by a Bronkhorst High-Tech mass flow controller that can supply up to 200 NL/min of gas. A Wilson 307 piston pump feeds in the selected mass flow of liquid water which is subsequently heated up to 400 °C to ensure a continuous condensate-free flow of steam into the reactor. The outgoing gas flow crosses a cyclone system, a heat exchanger and a cold trap to eliminate particulate matter, condensed water and tars. The cleaned gases are sent to four Rosemount Binos® 100 gas analysers where the main gases (CO, CO2, H2, CH4 and excess O2) are measured in terms of volume percentage, while N2 is estimated by difference.
Gasification experiments were carried out using pine kernel shells (PKS) to evaluate the effect of different variables on the gasification process: temperature (700, 800, 900 °C), steam to air ratio (S/A = 70/30, 50/50, 25/75, 10/90) and stoichiometric ratio (SR from 0.1 to 0.4). From the gas composition results, the gas yield (ηgas) [34], the higher heating value (HHV) of the gas [30] and the energy yield (ηenergy) were determined as follows:
η gas = Q . outlet-gas biomass     ( Nm 3 gas kg biomass )
HHV gas = ( 11.76 · y CO + 11.82 · y H 2 + 37.024 · y CH 4 ) / 100       ( MJ Nm 3 )
η energy = η gas · HHV gas       ( MJ kg biomass )
where Q . outlet-gas is the volumetric flow rate of the gas produced (Nm3/h), ṁbiomass is the biomass inlet mass flow rate in dry basis (kg/h), yi (vol.%) represents the volumetric percentage of each component in the dry product gas and HHVgas is the higher heating value of the gas product (MJ/kg).

3. Results and Discussion

3.1. Modelling Results

Gasification experimental data obtained with pine kernel shells (PKS) in the bubbling fluidised bed reactor under different air–steam atmospheres were compared with simulation results to validate both models, stoichiometric and non-stoichiometric. Ultimate and proximate analyses of PKS are summarised in Table 2.
Equilibrium models are developed considering different assumptions, for instance, the whole set of gasification reactions reach equilibrium, and char is composed solely of carbon. For these reasons, simulation models differ from experimental results. To check the models’ accuracy, the same conditions used in the pilot plant experiments were considered in the thermodynamic models: SR range 0.1–0.3, SBR from 0.09 to 1.85 and temperatures in the range 700–900 °C.
The error was quantified by using the root-mean-square (RMS) for each set of data as follows:
R M S = j N ( E x p e r i m e n t j M o d e l j ) 2 N
where N is the number of species in the gas stream.
Tables S2–S4 (Supplementary Materials) compare the gas composition obtained in the pilot plant and those predicted by the stoichiometric and non-stoichiometric models, including the RMS values estimated from Equation (4) [35]. The comparison was made for different sets of SR, SBR and temperature values. Although there is a divergence between the model predictions of the experimental results due to the equilibrium condition and the assumptions used in the models, overall, the agreement between the predictions and the experimental data is fair. The stoichiometric model shows lower RMS values for the whole set of conditions compared with the non-stoichiometric model. In both cases, the best prediction is observed for high SR values where RMS is only 2.10 for the RSTOIC model while for RGIBBS it reaches a value of 7.3.

3.2. Effect of Stoichiometric Ratio (SR)

The effect of SR was evaluated in the range of 0.1 to 0.4 for temperatures from 700 to 900 °C and steam percentages from 10 to 70% (vol.%) in the gasifying agent. Figure 3 summarises the effect of SR on the product gas composition, and a comparison between the experimental data, obtained at 900 °C and 70% steam in the gasifying agent, and the simulation results from the stoichiometric (RSTOIC) and non-stoichiometric equilibrium models (RGIBBS) is also presented. When SR increases, more O2 is available and oxidation reactions, particularly the oxidation of carbon to CO2 (R-1), prevail and CO2 production increases. Consequently, the concentration of the main syngas components, H2 and CO, decreases and the production of CH4 is slightly reduced. The equilibrium models display similar trends to the experimental data and are in good agreement with the results reported in the literature [19,23].
Both simulations overpredict the H2 content compared to the experimental values obtained for pine kernel shells. This difference could be ascribed to the absence of tar formation in the predictions of these models. The deviation is more pronounced when less air is available in the gasifier at low SR values, and this can be explained by the higher tar formation at the lower SR under the experimental conditions. Nonetheless, a much better prediction was obtained with the stoichiometric model, with differences between experimental and predicted results spanning from 5 to 9% (absolute concentration values) in the whole SR range. The differences observed between the stoichiometric and non-stoichiometric models are due to the particularities of each approach. In the non-stoichiometric model, the reaction mechanism does not make part of the simulation, whereas in the stoichiometric model the reaction pathways are defined with the definition of the reactions considered as the most relevant in the gasification of biomass. Therefore, the proper selection of these reactions can be responsible for a better approach to the experimental results in comparison to the non-stoichiometric model where the product gas composition is determined based on feedstock composition and on the most probable compounds in the products as determined by minimizing the free Gibbs energy.
Conversely, both models underpredict the CO concentration with slightly lower values given by the non-stoichiometric model. This could be ascribed to the fact that at higher SR values the simulation models predict lower char–steam gasification reactions in comparison with the experimental results in the gasification plant. An opposite trend was observed by Ramanan et al. [36], who predicted higher concentration values for CO when compared to experimental results. This difference is a consequence of the independent set of reactions considered in that process, where the equilibrium condition for Boudouard and water–gas reactions was established at temperatures above 1000 °C, therefore favouring CO production.
It can also be observed in Figure 3 that both thermodynamic equilibrium models present fairly good CO2 predictions. At low SR values, there is a slight underestimation given by both models, but this trend changes for the higher SR values (e.g., higher than 0.20). At this point, combustion reactions can be significant because the more oxidising agent is available in the reactor, the more it favours the formation of CO2.
CH4 is underestimated in both models since thermodynamic equilibrium is not reached in a real gasification system, because of short residence times of the products of process. However, while CH4 concentration in the non-stoichiometric model is negligible, the CH4 concentration shows a decreasing trend with SR in the stoichiometric model (Figure 3d). The latter is connected to the lower H2 concentration predicted in the stoichiometric model relative to the non-stoichiometric model (Figure 3a). A negligible CH4 concentration was observed by Ali et al. [37] when simulating coal gasification in an entrained flow reactor. These differences could be a consequence of the gasification temperature used in that work, with values higher than 1200 °C.
Figure 4 summarises the experimental and theoretical (non-stoichiometric and stoichiometric models) results of the produced syngas composition (CO + H2), for different stoichiometric ratios (SR). The coupled concentration of CO + H2 (syngas) decreases with the increase in SR, similarly to the individual evolution of the concentration of H2 and CO with SR shown in Figure 3a,b. At low values of SR, the experimental values of CO + H2 concentration are under the simulation results, and this is mainly due to the overestimation of the simulated H2 (Figure 3a). However, for SR values of 0.2 or 0.3, the model predictions for the CO + H2 concentration are in relatively good agreement with the results obtained in the fluidised bed gasification experiments, with relative errors lower than 8% and 5% for the stoichiometric and non-stoichiometric models, respectively.
When the concentration of the overall combustible gas (H2 + CO + CH4) is considered, the gap between the experimental and the simulation results is reduced (see Figure S2 in Supplementary Materials). The experimental overall combustible gas concentration values are closer to those predicted by the equilibrium models. Negligible CH4 is predicted in the non-stoichiometric model, and a low concentration of CH4 is predicted in the stoichiometric model when compared to the experimental results obtained in the gasification plant where the CH4 concentration varied between 4.6 and 7.3 vol.% (Figure 3d). However, this effect is compensated by the overestimation of the simulated H2 (Figure 3a).

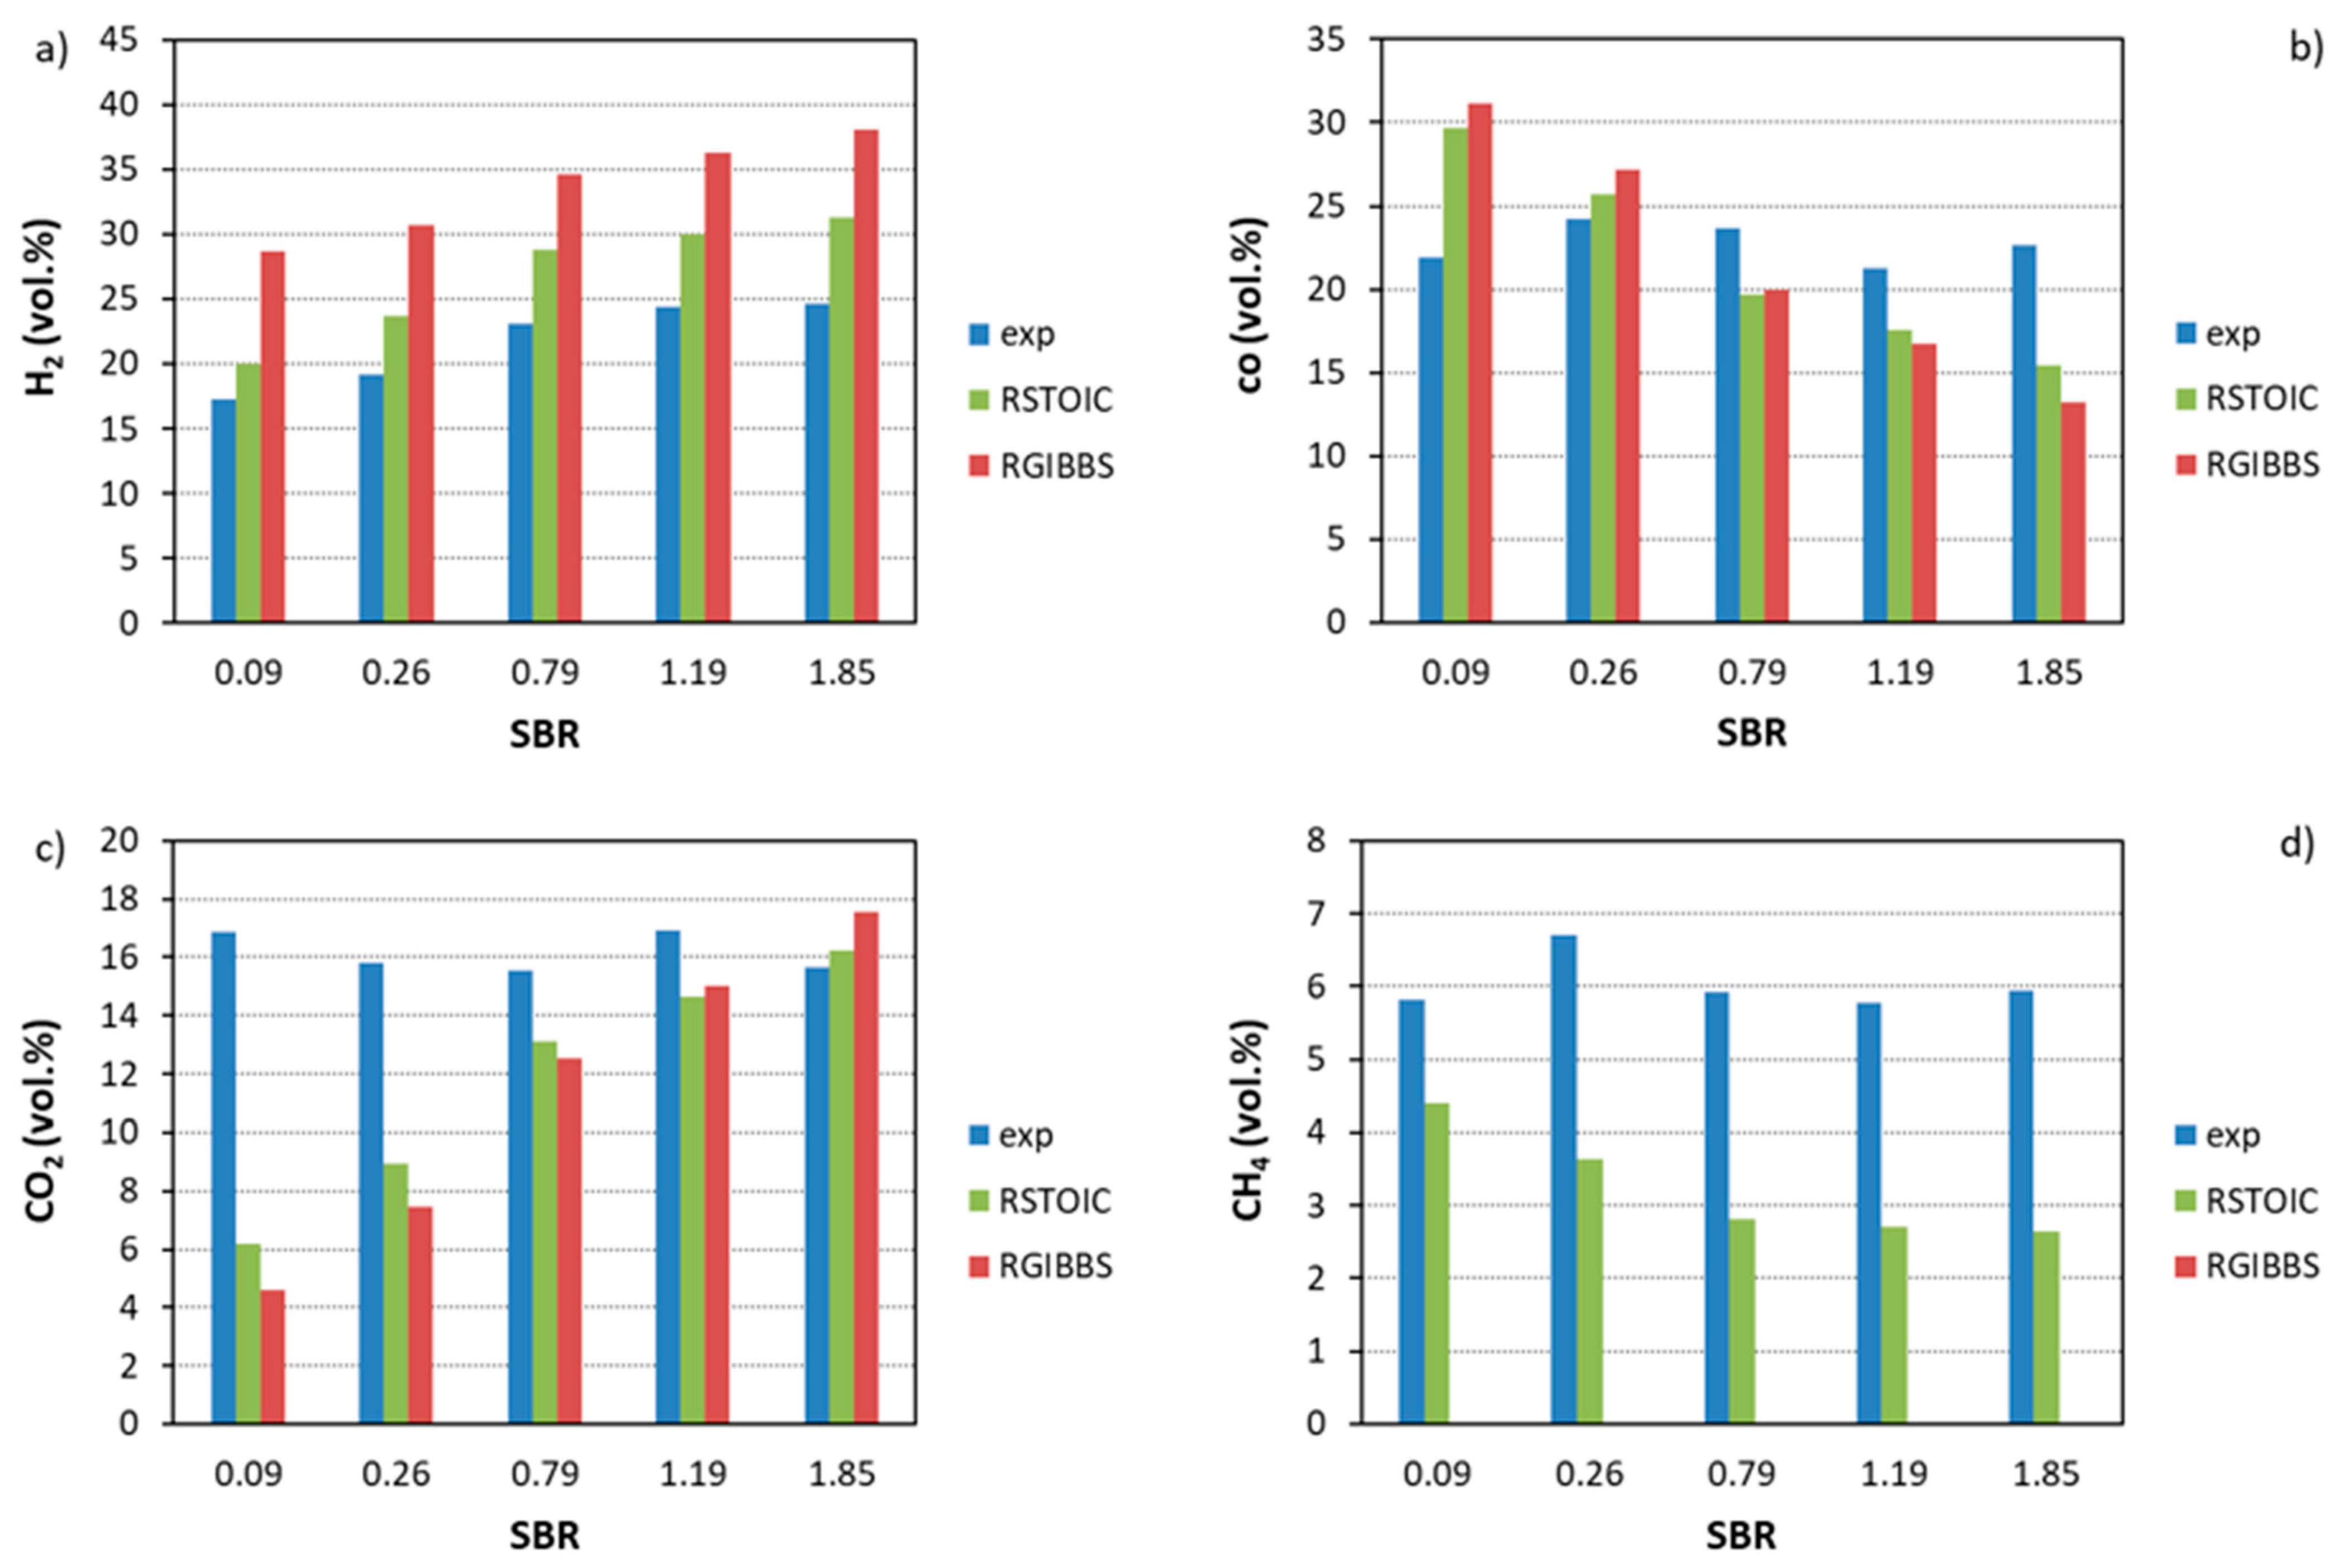
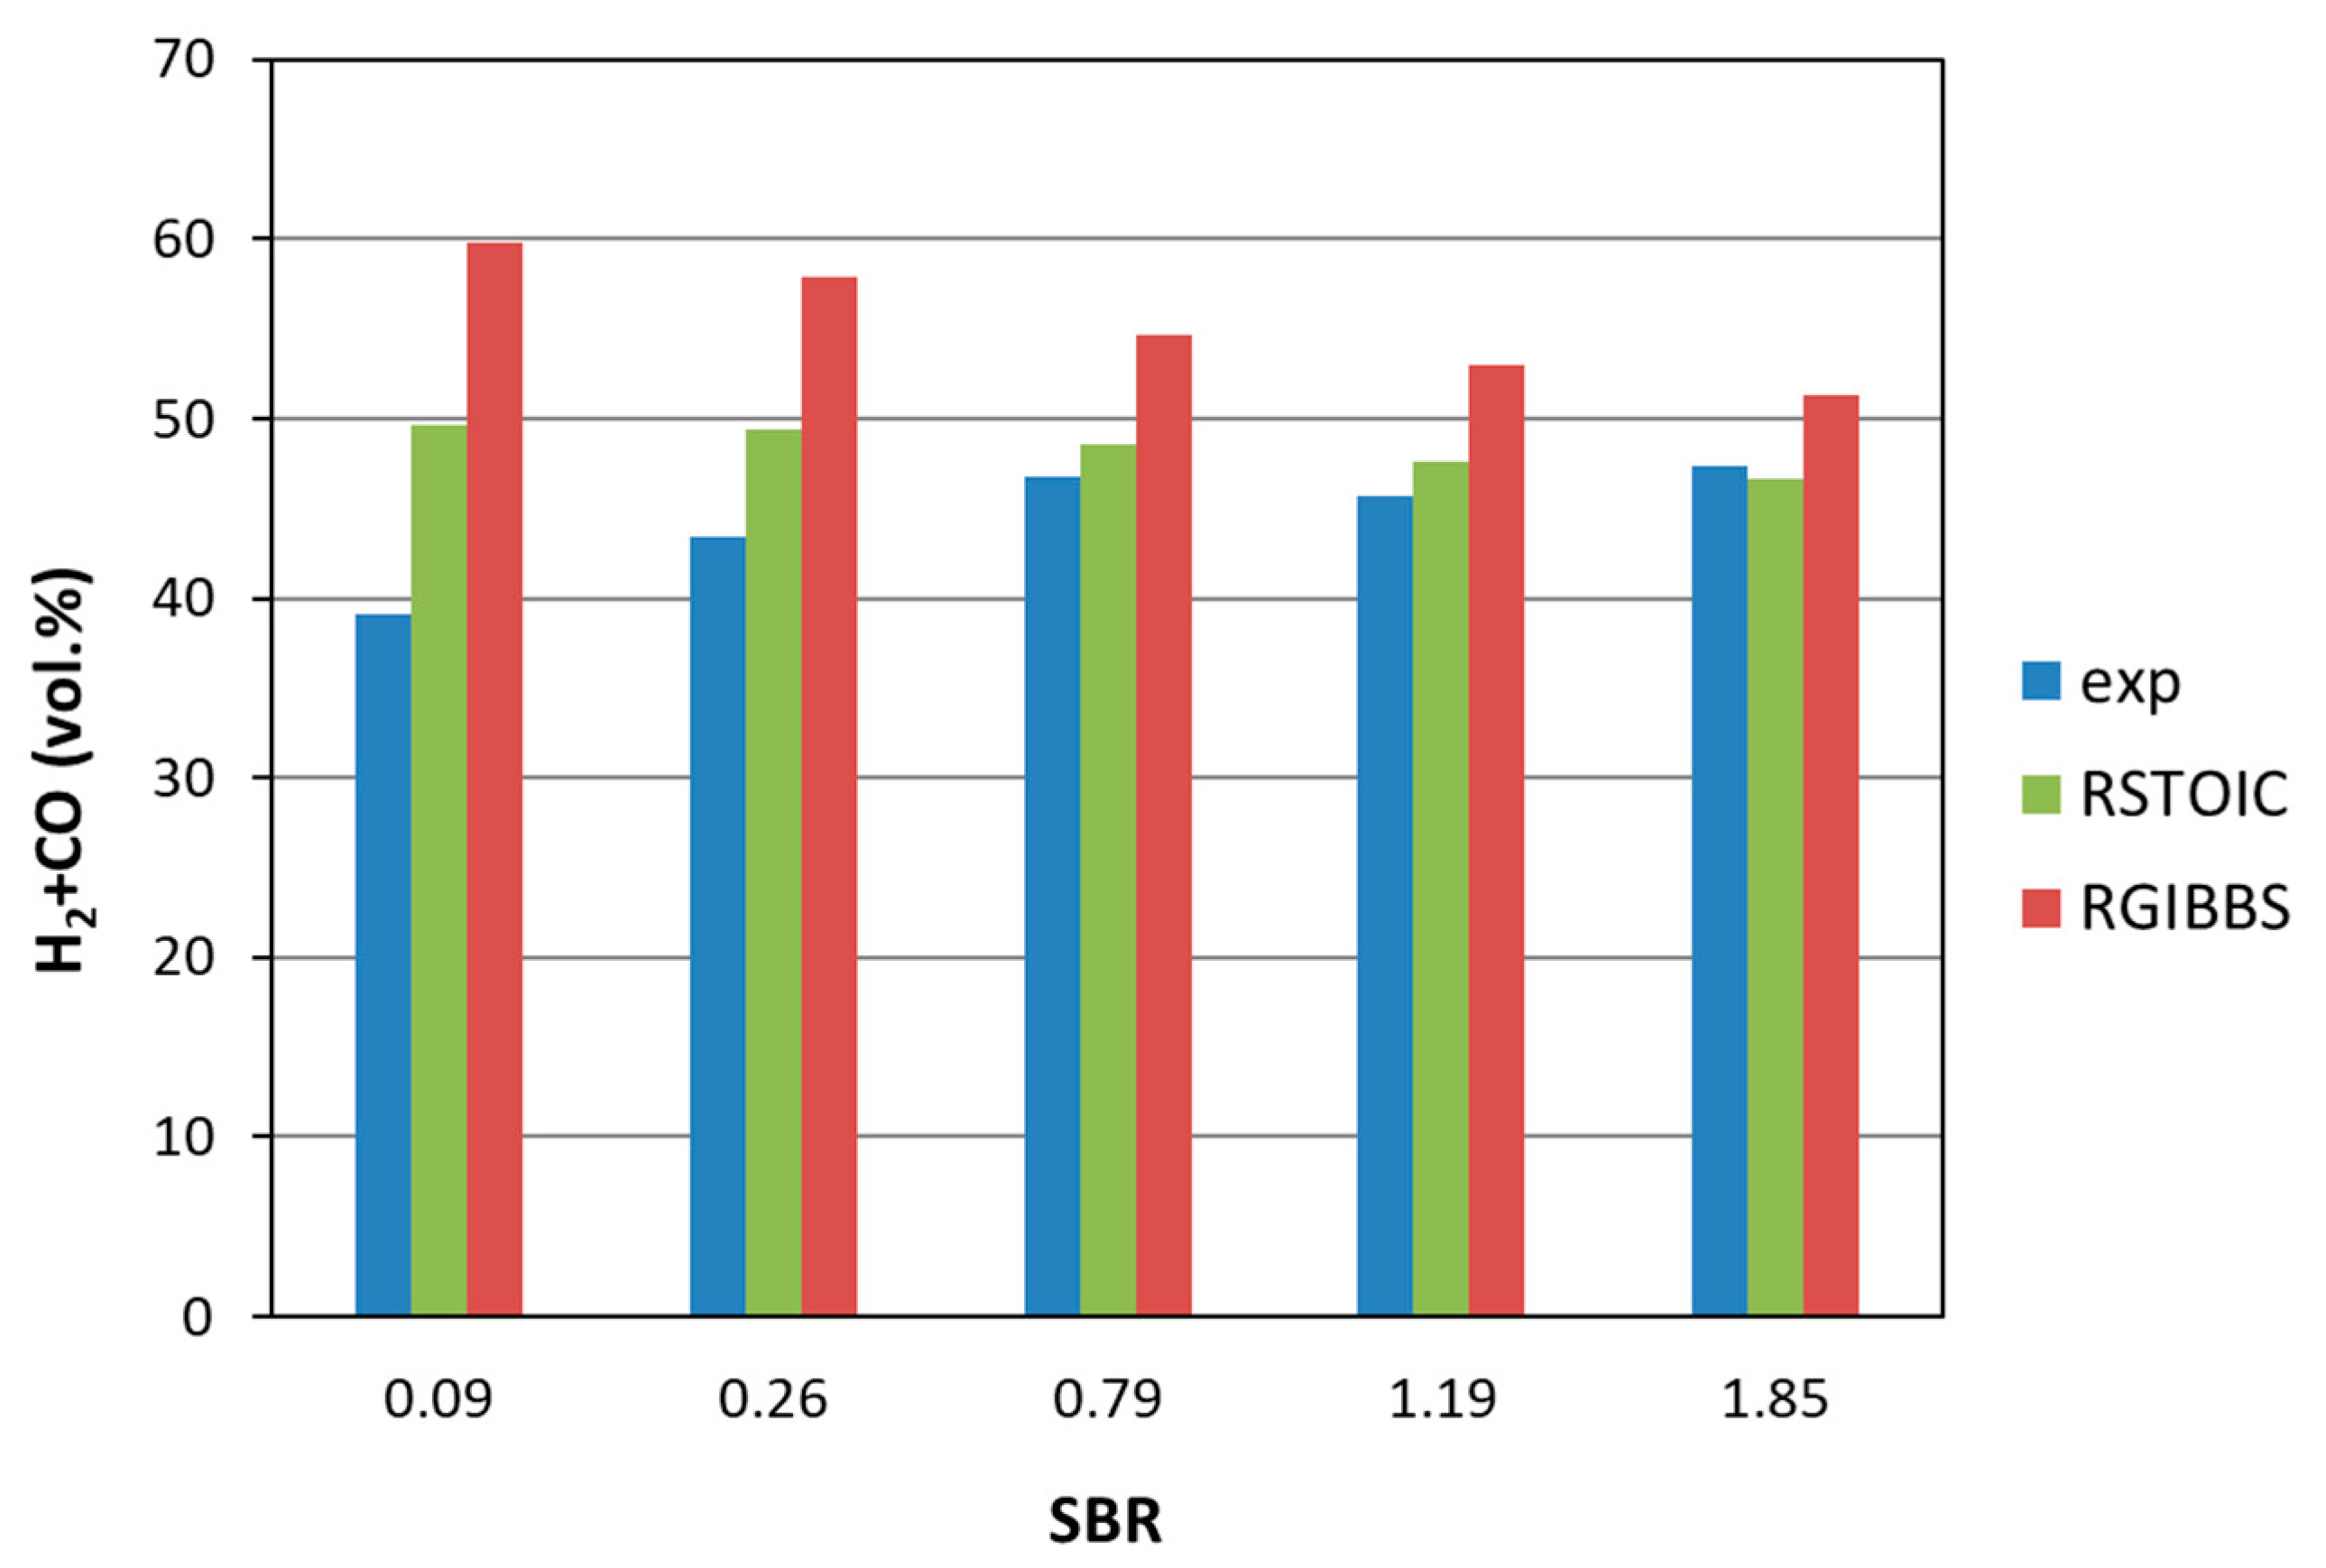
3.3. Effect of Steam Concentration

The effect of steam concentration in the gasifying agent during the gasification of PKS at various steam to biomass ratios (SBR) was evaluated for a SR of 0.2 and a gasification temperature of 900 °C. The results are presented in Figure 5.
The use of steam as a gasification agent could promote the increase in the concentration of H2 and CO2 a priori because of the water-gas shift reaction (R-7). At the same time, water–gas (R-4) and steam–methane reforming (R-8) reactions are also favoured during steam gasification. Thus, an increase in the amount of CO could also be expected.
Model predictions show a positive effect in the H2 and CO2 concentrations of the produced gas with increasing steam concentration (Figure 5a,c) but, at the same time, a decrease in the concentration of CO with the increase in SBR is observed (Figure 5b); this behaviour is in agreement with other studies [21,24,38]. An increase in the concentration of H2 and CO2 and a decrease in CO with the amount of steam was also observed when modelling the gasification of municipal solid wastes in a bubbling fluidised bed [39].
During the gasification experiments in the fluidised bed, it was observed that the CO concentration in the produced gas increases slightly with SBR in the range 0.04 to 0.3, but beyond those values, the CO concentration decreases. At these conditions, the CO2 concentration reaches high values due to the role of the water–gas shift reaction (R-7) under higher steam content in the oxidising agent. At the same time, steam methane reforming (R-8) is also favoured and it reduces the CH4 concentration. Accordingly, there is an increase in the concentration of H2 with SBR, more pronounced up to SBR of 1.2. A similar trend for CO during the gasification of karanja press seed cake and sunflower husk at 1000 °C and SR = 0.23 was reported by Dhanavath et al. [23].
The stoichiometric and non-stoichiometric models overestimate the production of H2 (Figure 5a); the difference between experiment and simulation results is greater at lower SBR. Other authors obtained similar results, and they have reported that at SBR ratios higher than 1, too much energy is required to heat the feeding steam which in turn results in a reduction in temperature that the simulation tools cannot predict [40,41]. Regarding the production of CO, the simulation models predict a continuous decrease over the whole range of SBR (cf. Figure 5b). CO and H2 are produced during the water–gas reaction (R-4) that, combined with the water–gas shift reaction (R-7), result in a decrease in CO concentration and an increase in H2 and CO2 concentrations with the steam percentage. At low SBR values (e.g., SBR below 0.3), the simulations overestimate CO. Under these conditions, the reactions with O2 prevail and the models consider that the Boudouard reaction reaches equilibrium; therefore, the CO2 formed in the combustion step reacts with the char (R-3) to increase the amount of CO in the product gas. At SBR values above 0.3, steam reactions are favoured, and more CO is consumed according to the water–gas shift reaction (R-7); this, in turn, explains the increase in the concentration of CO2 in the product gas. At this point, the char–CO2 reaction is less relevant than the reaction between the char particles and steam, and this results in lower consumption of CO2 and enrichment of CO2 in the produced gas composition.
The experiment and simulation data of syngas concentration for the range of evaluated SBR are presented in Figure 6. A remarkable increase in the experimental CO + H2 concentration is observed up to SBR = 0.79: from 39.2 up to 47.3 vol.%. At steam percentages higher than 50 vol.% (SBR = 0.79), the syngas composition remains unchanged. In agreement with the model predictions of the CO and H2 concentrations in the produced gas, both equilibrium models tend to overpredict the CO + H2 concentration at SBR below 0.79. However, the stoichiometric model delivers more accurate estimations of CO + H2 concentration in the produced gas (and consequently in the CO + H2+CH4 concentration observed in Figure S3 in Supplementary Materials), particularly at the higher SBR (0.79 and 1.85) analysed.

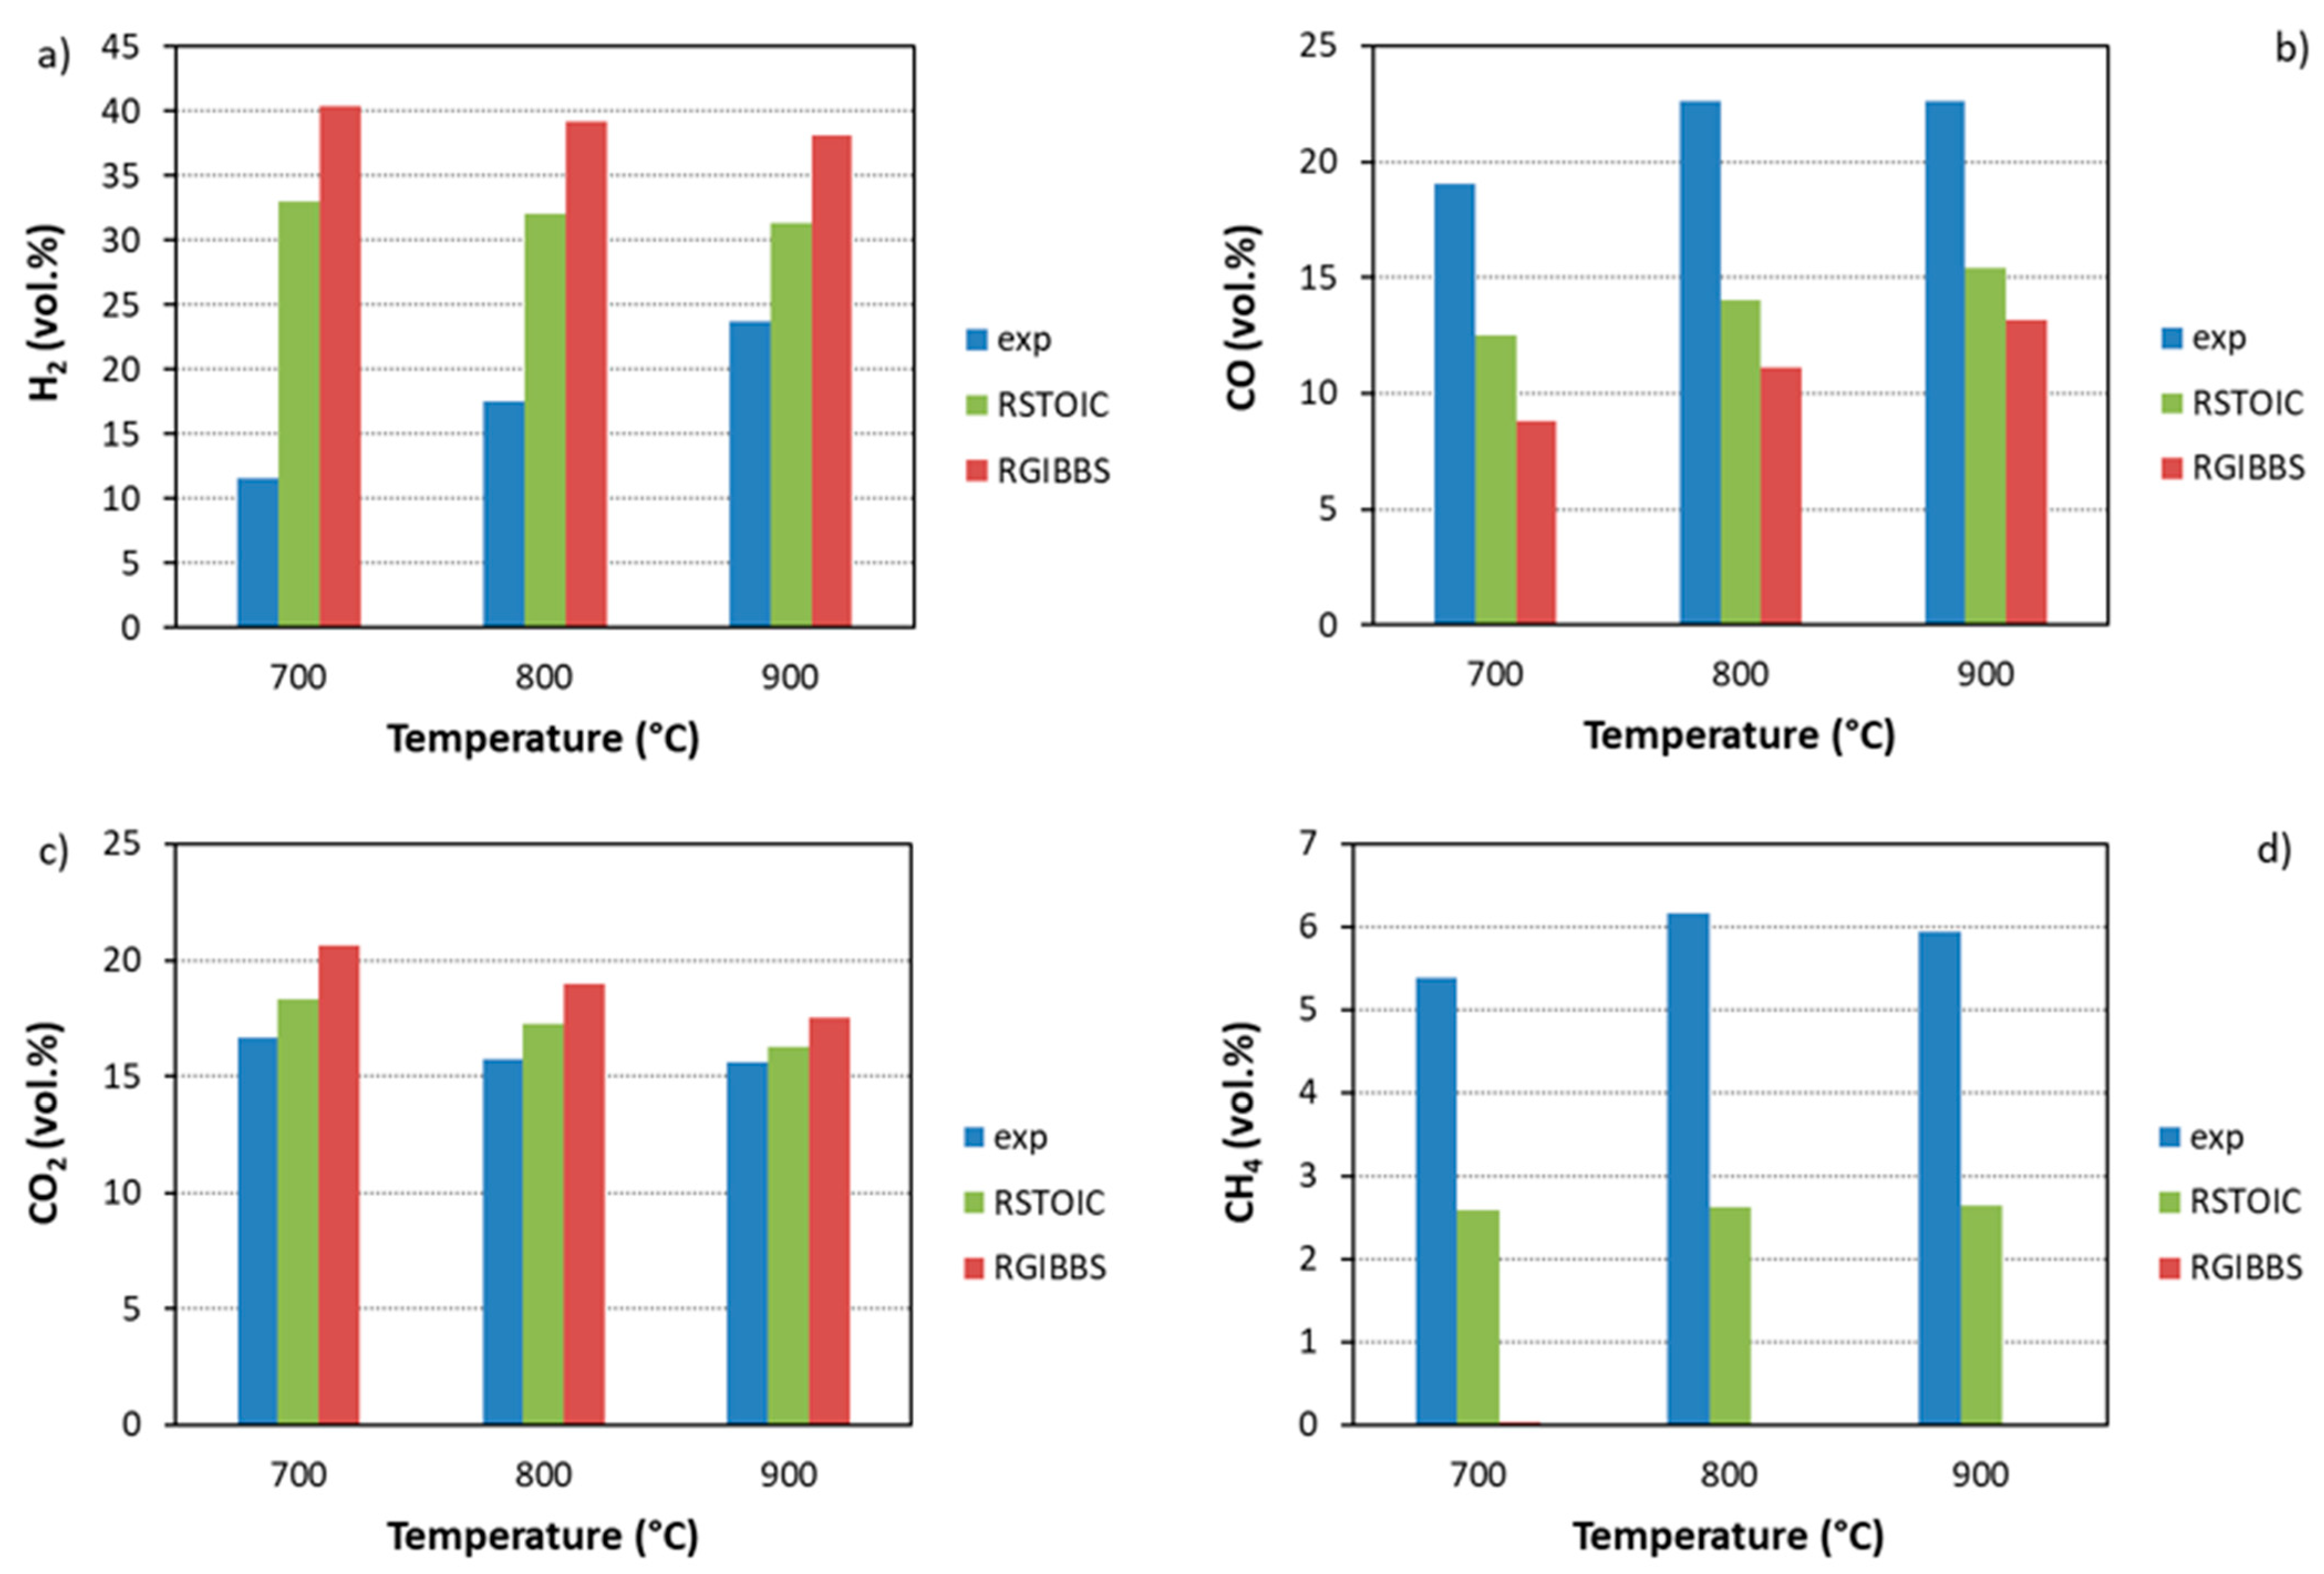
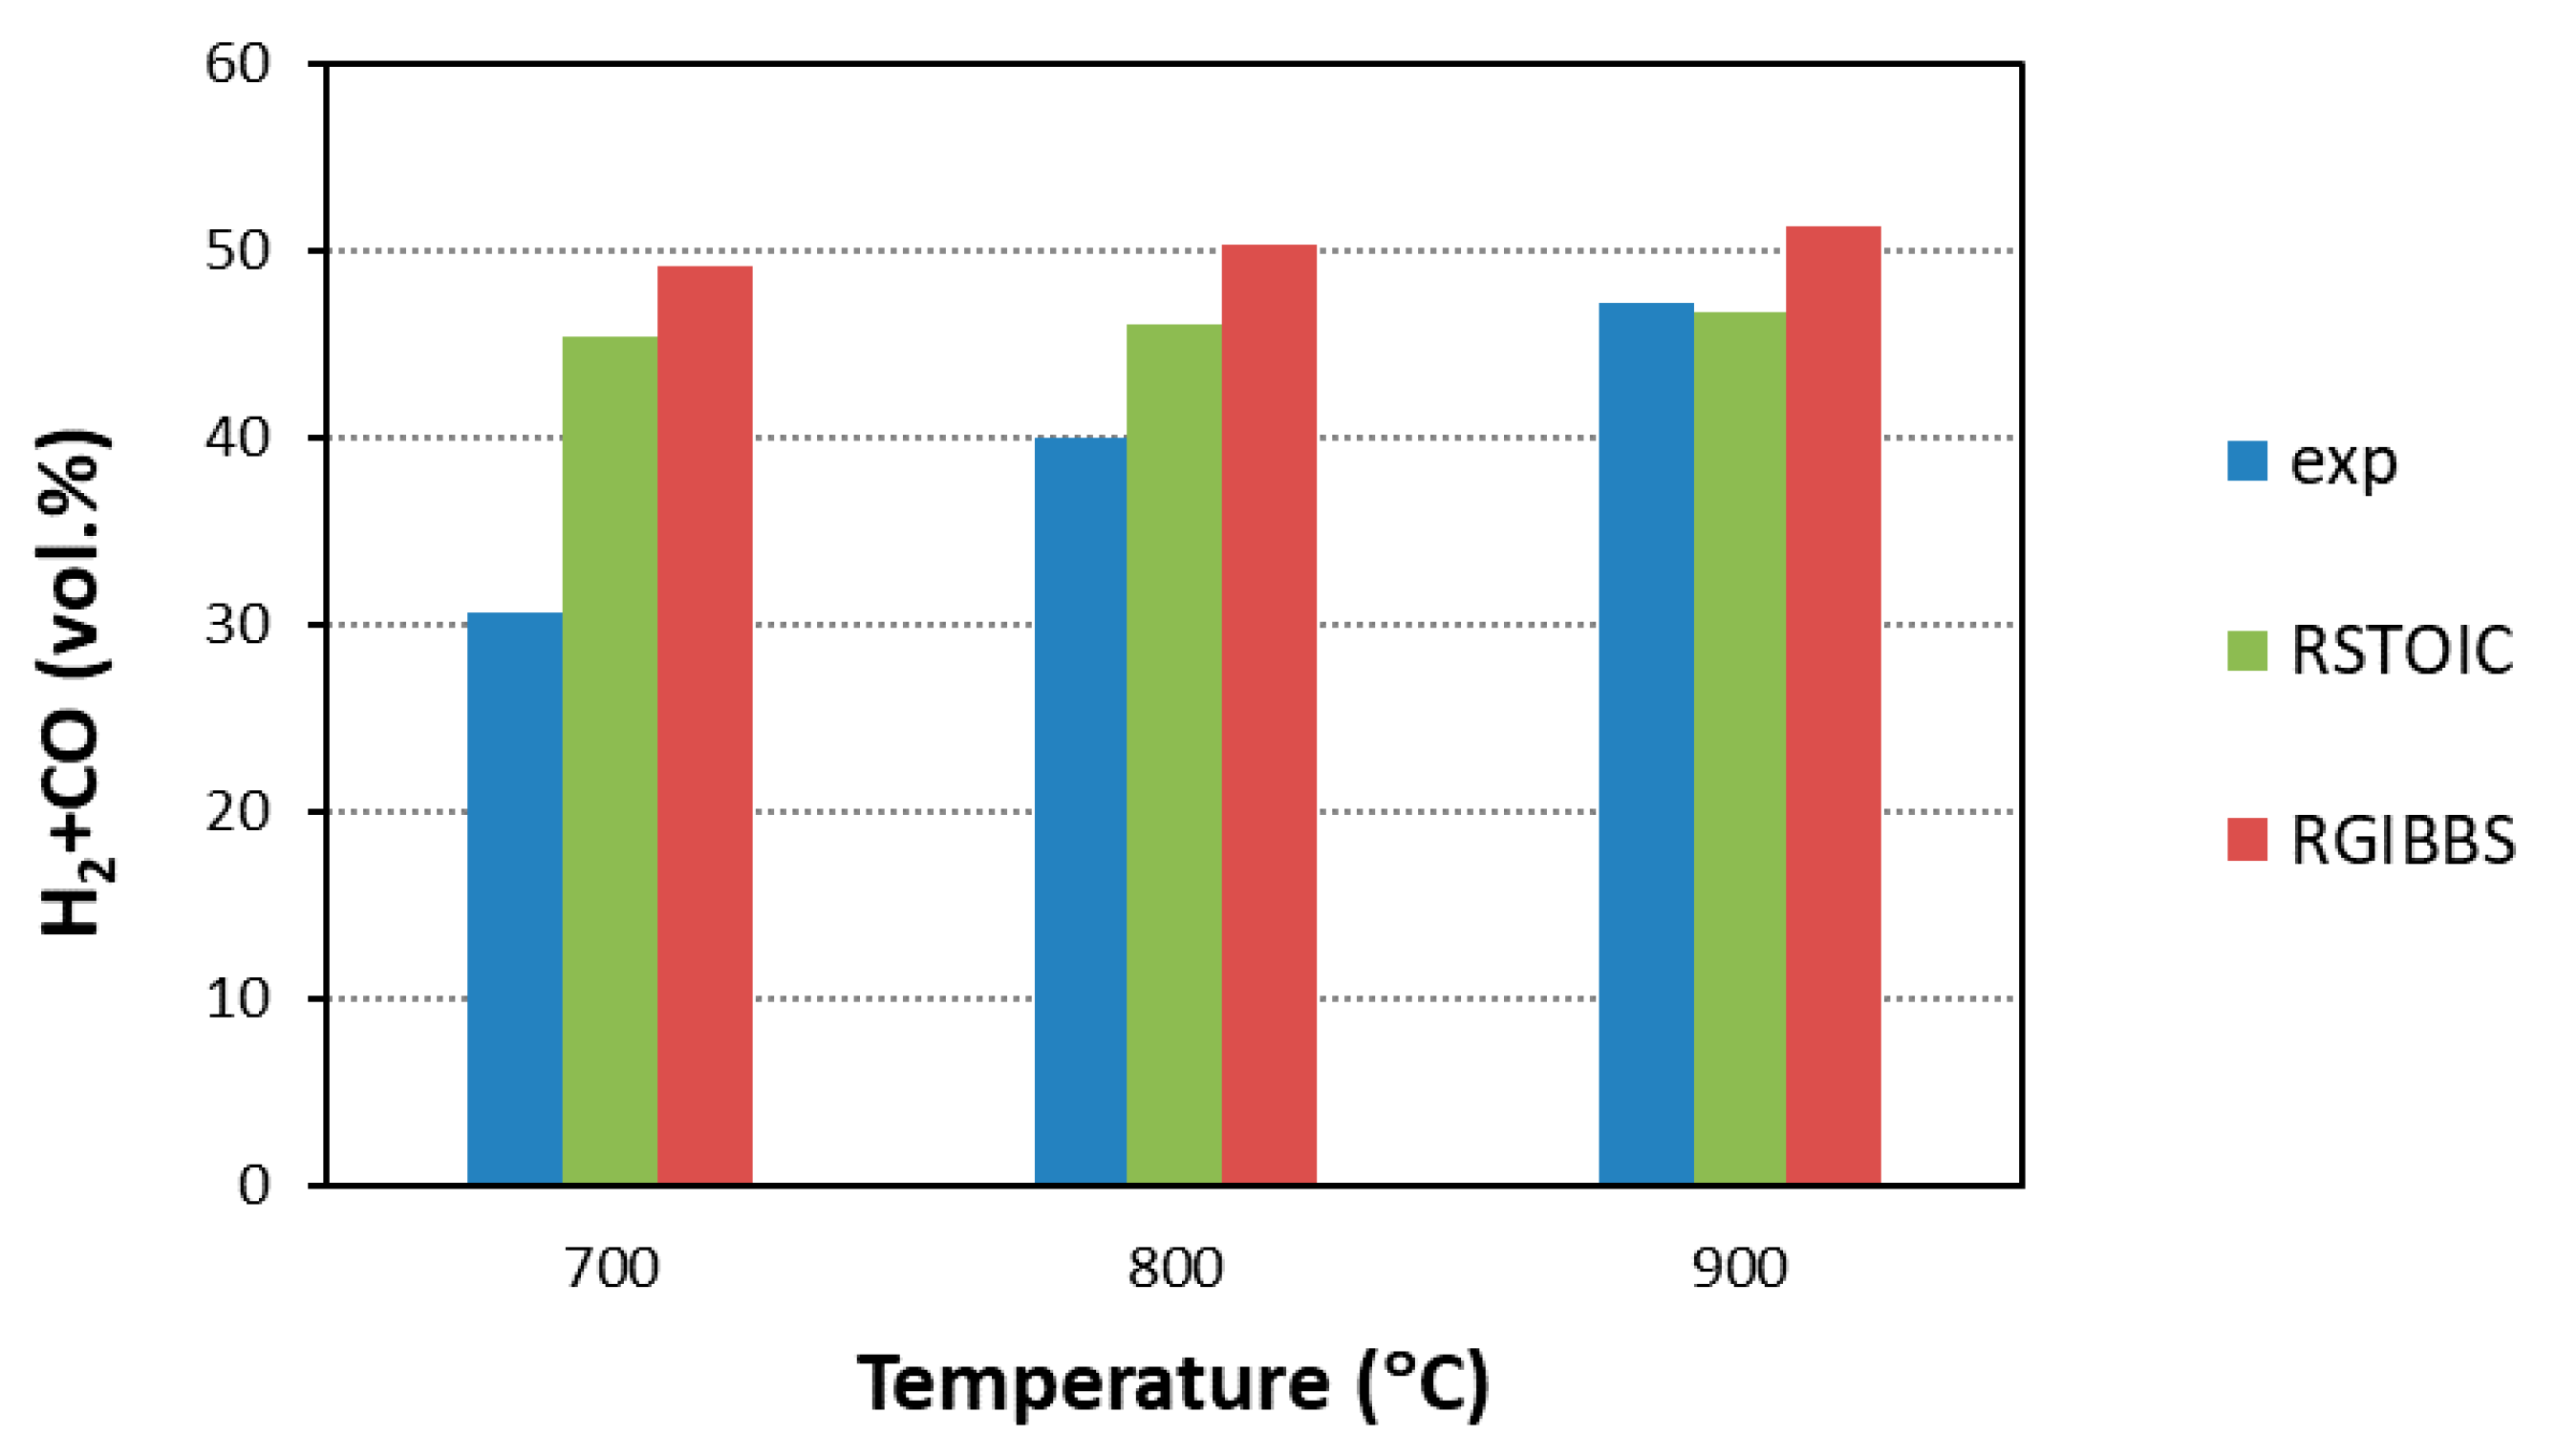
3.4. Effect of Temperature

The effect of the gasification temperature on the gas composition was studied in the 700 to 900 °C temperature range for different SR and steam percentages. The results are displayed in Figure 7 for SR = 0.2 and 70 vol.% steam. Likewise, Figure 8 compares the experimental and simulation data of syngas concentration for the three temperatures evaluated in the fluidised bed gasifier.
The experimental values of H2 concentration increase with temperature, whereas both models predictions show a slight decrease in H2 concentration with increasing temperature (Figure 7a). The water–gas reaction (R-4) and steam reforming (R-8) reactions are endothermic so, according to Le Chatelier’s principle, when the gasification temperature increases, the reactions tend to shift to the right and favour the production of H2 and CO and, at the same time, the concentrations of CH4 and CO2 reduce [25]. According to the water–gas reaction (R-5), CO2 should increase with temperature; however, the Boudouard reaction (R-3) is highly endothermic, and a rise in temperature increases the consumption of CO2. This is reflected in a decrease in the CO2 concentration (Figure 7c) in the product gas and a consequent increase in CO production (Figure 7b). When the gasification temperature increases from 700 to 900 °C, the Boudouard reaction is controlling the process.
In sum, the temperature increase has a positive effect on the production of combustible gas (see Figure S4 in Supplementary Materials).
The experimental CO + H2 (syngas) concentration increases with temperature. At low temperatures, the deviation between the experimental CO + H2 concentration and the predicted value is significant, but both values tend to converge as the gasification temperature increases (Figure 8). The stoichiometric model generates better predictions than the non-stoichiometric model. In the simulations, it is assumed that biomass is completely devolatilised at any temperature, so this contributes to the deviation between the experimental and model results. This is particularly relevant at low temperatures, where the conversion of biomass is incomplete. In addition, other assumptions also contribute to enlarge the gap, e.g., the formation of tar in not considered in the models, and char is assumed a 100% carbon composition. At the highest temperature tested, 900 °C, higher biomass conversion is attained which in turn reduces the gap between experiment and simulation results.
Figure 7a shows that model predictions of H2 concentration are largely overestimated in the whole range of temperatures. According to the water–gas reactions (R-4 and R-5), the increase in H2 concentration shifts both reactions to the left, and this results in an underestimation of CO and CO2 in the simulations. Hence, the produced syngas lies below the results predicted with the models as can be seen in Figure 8. On the other hand, H2 concentration is higher in the non-stoichiometric prediction and the CO values are approximately half those of H2 in the whole temperature range. Altafini et al. [42] concluded that the equilibrium model is only efficient to simulate gasification processes at high temperatures.

3.5. Effect of Different Parameters on the Gas Efficiency

The effect of SR and SBR on gas yield (ηgas), higher heating value (HHV) and energy yield (ηenergy) is summarised in Figure 9. There is an increase in gas yield (ηgas) with the increase in SR or SBR (i.e., the increase in the concentration of the gasifying agent, air or steam), as shown in Figure 9. The introduction of more air in the gasifier (i.e., higher SR) favours the combustion reactions, but the product gas gets diluted in N2. Conversely, lower concentrations of H2, CO and CH4 are obtained in the product gas stream with increasing SR, which in turn results in a poor calorific value gas (Figure 9c). The increase in the percentage of steam in the gasifying agent (SBR) contributes to reducing tars and light hydrocarbons due to the steam reforming and cracking reactions and, consequently, a higher gas flow is obtained in the product stream.
Comparing the data in Figure 9c,d, it becomes apparent that HHV of the product gas is largely more influenced by SR than by SBR, and predictions of HHV are globally under the experimental values, except for low SR and SBR values.
The HHV relies on the proportion of combustible gases, CO, H2 and CH4, in the product gas. According to Equation (2), the contribution of CH4 to HHV is three times higher than that of H2. As has been previously discussed, the concentration of CH4 is underestimated by the models because chemical equilibrium is not reached during the gasification experiments, and this results in higher experimental HHV values. Likewise, the stoichiometric model delivers more accurate predictions of HHV as a consequence of the better predictions of the gas composition. A good correspondence between experimental data and stoichiometric model predictions has also been described by Zainal et al. [18]. However, Ramanan et al. [36] observed in their predictions an overestimation of HHV as a consequence of the high CO concentration predicted by the stoichiometric model used to explain cashew nut shells gasification.
In this work, a positive effect of temperature on gas yield and HHV was observed when increasing the process temperature from 700 to 900 °C. In addition, the reliability of the predictions delivered by the equilibrium models improves at high temperatures (see Figures S5–S7 in Supplementary Materials).
The experimental results depicted in Figure 9e for the energy yield (ηenergy) show an increasing trend with SR, and that behaviour was not observed in the numerical model simulations. The experimental results depicted in Figure 9f also show an increase in the energy yield with SBR and negligible effect of SBR in the predicted energy yields of the models. These results are in agreement with the pattern observed for the gas yield (ηgas) with SR and SBR at low oxidising-agent concentrations (air or steam) when higher amounts of char and tar are produced. From SR = 0.2 or SBR = 0.79, the experimental results for the energy yield remain constant, in accordance with the evolution observed for the gas composition (Figure 4 and Figure 6).
Predicted and experimental energy yield data are largely imbalanced, in particular at low SR (≤0.15) and SBR (≤0.26) values. The equilibrium models overestimate the energy yield at low SR and SBR values, similarly to the gas yield (ηgas), and there is a direct dependence of ηenergy with ηgas and HHVgas, as expressed in Equation (3). Conversely, at high SR and SBR values, the models underestimate HHV because the predicted CH4 concentration by the chemical equilibrium is lower than the experimental result. Thus, a small change in the CH4 fraction in the product gas has a significant impact on the HHV of the produced combustible gas.

4. Conclusions

A non-stoichiometric thermodynamic equilibrium model, based on the minimisation of Gibbs free energy, and a stoichiometric model were developed in Aspen Plus®. Their predictions on the gas composition during biomass gasification were compared with experimental results obtained for the gasification of pine kernel shells in a bubbling fluidised bed reactor. Different operating conditions were evaluated: temperature, stoichiometric ratio and steam to biomass ratio. Both models’ predictions for the product gas composition overestimated the production of H2 and, consequently, underestimate the production of CO. The non-stoichiometric model yielded a significant overestimation of H2 and underestimation of CO, along with a negligible estimation of CH4 in comparison with the experimental results. Individual gas composition simulations deviated from the experiments for both the stoichiometric and non-stoichiometric models. However, both models gained accuracy in their predictions of the syngas (H2+CO) and combustible gas (H2 + CO + CH4) compositions, confirming that the overall gasification process is suitably represented with the thermodynamic models.
The stoichiometric model was more reliable and, under selected experimental conditions (e.g., steam concentration in the gasifying agent between 25 and 50 vol.%, temperatures above 800 °C and stoichiometric ratios above 0.2), delivered accurate predictions of the producer gas characteristic parameters: higher heating value, gas yield and energy yield.
When more oxidising agent is introduced into the gasifier to favour combustion and gasification reactions and at higher temperatures, the predictions of the models showed lesser deviation from the experimental results. Likewise, the stoichiometric model was able to predict the production of CH4 and to limit the overestimation of H2 concentration, which in turn has a strong influence on the characteristic parameters of the gasification process.
From the results obtained, one can conclude that the thermodynamic equilibrium stoichiometric model is more suitable to predict the producer gas composition during biomass gasification than the non-stoichiometric model.

Supplementary Materials

The following are available online at https://www.mdpi.com/1996-1073/14/1/189/s1, Figure S1: Flow chart of the simulation procedure of the steam gasification process, Figure S2: Comparison between experiment and simulation data of combustible gas concentration at different stoichiometric ratios, for the gasification of PKS with 70 vol.% steam at 900 °C, Figure S3: Comparison between experiment and simulation data of combustible gas concentration at different steam to biomass ratios, for the gasification of PKS at 900 °C with SR = 0.2, Figure S4: Comparison between experiment and simulation data of combustible gas concentration at different temperatures, for the gasification of PKS at SR = 0.2 and 70 vol.%, Figure S5: Effect of the variation of ηgas with temperature for the gasification of PKS with SR = 0.2 and 70 vol.% steam, Figure S6: Effect of the variation of HHV with temperature for the gasification of PKS with SR = 0.2 and 70 vol.% steam, Figure S7: Effect of the variation of temperature on ηenergy for the gasification of PKS with SR = 0.2 and 70 vol.% steam, Table S1: Block description used in the simulation model, Table S2: Comparison of experimental and model predictions and error values for the product gas compositions (vol.%) at different stoichiometric ratios during gasification of PKS using 70 vol.% steam at 900 °C, Table S3: Comparison of experimental and model predictions and error values for the product gas compositions (vol.%) at different steam to biomass ratios during gasification of PKS at 900 °C with SR = 0.2, Table S4: Comparison of experimental and model predictions and error values for the product gas compositions (vol.%) at different temperatures during gasification of PKS using 70 vol.% steam with SR = 0.2.

Author Contributions

Conceptualisation, C.P.; methodology, M.P.G.-V.; investigation, M.P.G.-V.; writing—original draft preparation, M.P.G.-V.; writing—review and editing, L.A.C.T., D.T.P., F.R. and M.P.G.-V.; supervision, C.P.; funding acquisition, C.P. All authors have read and agreed to the published version of the manuscript.

Funding

This work has received financial support from the Spanish MINECO (ENE2017-83530-R) and from the Gobierno del Principado de Asturias (PCTI, Ref. IDI/2018/000115), both with co-funding from the European Regional Development Fund (ERDF). Thanks are due to the Portuguese Foundation for Science and Technology (FCT)/Ministry of Science, Technology and Higher Education (MCTES) for the financial support to CESAM (UIDP/50017/2020+UIDB/50017/2020) through national funds.

Informed Consent Statement

Not applicable.

Data Availability Statement

Data is contained within the article or supplementary material.

Acknowledgments

M.P. González-Vázquez acknowledges a fellowship awarded by the Spanish MINECO (FPI program), co-financed by the European Social Fund.

Conflicts of Interest

The authors declare no conflict of interest.

References

  1. Motta, I.L.; Miranda, N.T.; Filho, R.M.; Regina, M.; Maciel, W. Biomass gasification in fluidized beds: A review of biomass moisture content and operating pressure effects. Renew. Sustain. Energy Rev. 2018, 94, 998–1023. [Google Scholar] [CrossRef]
  2. Mathieu, P.; Dubuisson, R. Performance analysis of a biomass gasifier. Energy Convers. Manag. 2002, 43, 1291–1299. [Google Scholar] [CrossRef]
  3. Sansaniwal, S.K.; Pal, K.; Rosen, M.A.; Tyagi, S.K. Recent advances in the development of biomass gasification technology: A comprehensive review. Renew. Sustain. Energy Rev. 2017, 72, 363–384. [Google Scholar] [CrossRef]
  4. Widjaya, E.R.; Chen, G.; Bowtell, L.; Hills, C. Gasification of non-woody biomass: A literature review. Renew. Sustain. Energy Rev. 2018, 89, 184–193. [Google Scholar] [CrossRef] [Green Version]
  5. Shayan, E.; Zare, V.; Mirzaee, I. Hydrogen production from biomass gasification; a theoretical comparison of using different gasification agents. Energy Convers. Manag. 2018, 159, 30–41. [Google Scholar] [CrossRef]
  6. Basu, P. Biomass Gasification, Pyrolysis and Torrefaction, 2nd ed.; Academic Press: Cambridge, MA, USA, 2013; ISBN 9780123964885. [Google Scholar]
  7. Monteiro, E.; Ismail, T.M.; Ramos, A.; Abd El-Salam, M.; Brito, P.; Rouboa, A. Experimental and modeling studies of Portuguese peach stone gasification on an autothermal bubbling fluidized bed pilot plant. Energy 2018, 142, 862–877. [Google Scholar] [CrossRef]
  8. Shehzad, A.; Bashir, M.J.K.; Sethupathi, S. System analysis for synthesis gas (syngas) production in Pakistan from municipal solid waste gasification using a circulating fluidized bed gasifier. Renew. Sustain. Energy Rev. 2016, 60, 1302–1311. [Google Scholar] [CrossRef]
  9. Pio, D.T.; Tarelho, L.A.C.; Matos, M.A.A. Characteristics of the gas produced during biomass direct gasification in an autothermal pilot-scale bubbling fluidized bed reactor. Energy 2017, 120, 915–928. [Google Scholar] [CrossRef]
  10. Couto, N.D.; Silva, V.B.; Monteiro, E.; Rouboa, A.; Brito, P. An experimental and numerical study on the Miscanthus gasification by using a pilot scale gasifier. Renew. Energy 2017, 109, 248–261. [Google Scholar] [CrossRef]
  11. Im-Orb, K.; Simasatitkul, L.; Arpornwichanop, A. Analysis of synthesis gas production with a flexible H₂/CO ratio from rice straw gasification. Fuel 2016, 164, 361–373. [Google Scholar] [CrossRef]
  12. Marcantonio, V.; Bocci, E.; Monarca, D. Development of a Chemical Quasi-Equilibrium Model of Biomass Waste Gasification in a Fluidized-Bed Reactor by Using Aspen Plus. Energies 2019, 13, 53. [Google Scholar] [CrossRef] [Green Version]
  13. Suwatthikul, A.; Limprachaya, S.; Kittisupakorn, P.; Mujtaba, I.M. Simulation of steam gasification in a fluidized bed reactor with energy self-sufficient condition. Energies 2017, 10, 314. [Google Scholar] [CrossRef]
  14. Prins, M.J.; Ptasinski, K.J.; Janssen, F.J.J.G. From coal to biomass gasification: Comparison of thermodynamic efficiency. Energy 2007, 32, 1248–1259. [Google Scholar] [CrossRef]
  15. Puig-Arnavat, M.; Bruno, J.C.; Coronas, A. Review and analysis of biomass gasification models. Renew. Sustain. Energy Rev. 2010, 14, 2841–2851. [Google Scholar] [CrossRef]
  16. George, J.; Arun, P.; Muraleedharan, C. Stoichiometric Equilibrium Model Based Assessment of Hydrogen Generation through Biomass Gasification. Procedia Technol. 2016, 25, 982–989. [Google Scholar] [CrossRef] [Green Version]
  17. Li, X.; Grace, J.R.; Watkinson, A.P.; Lim, C.J.; Ergüdenler, A. Equilibrium modeling of gasification: A free energy minimization approach and its application to a circulating fluidized bed coal gasifier. Fuel 2001, 80, 195–207. [Google Scholar] [CrossRef]
  18. Zainal, Z.A.; Ali, R.; Lean, C.H.; Seetharamu, K.N. Prediction of performance of a downdraft gasifier using equilibrium modeling for different biomass materials. Energy Convers. Manag. 2001, 42, 1499–1515. [Google Scholar] [CrossRef]
  19. Ramanan, M.V.; Lakshmanan, E.; Sethumadhavan, R.; Renganarayanan, S. Modeling and experimental validation of cashew nut shell char gasification adopting chemical equilibrium approach. Energy Fuels 2008, 22, 2070–2078. [Google Scholar] [CrossRef]
  20. Mitta, N.R.; Ferrer-Nadal, S.; Lazovic, A.M.; Parales, J.F.; Velo, E.; Puigjaner, L. Modelling and simulation of a tyre gasification plant for synthesis gas production. Comput. Aided Chem. Eng. 2006, 21, 1771–1776. [Google Scholar] [CrossRef]
  21. Pala, L.P.R.; Wang, Q.; Kolb, G.; Hessel, V. Steam gasification of biomass with subsequent syngas adjustment using shift reaction for syngas production: An Aspen Plus model. Renew. Energy 2017, 101, 484–492. [Google Scholar] [CrossRef]
  22. Monir, M.U.; Abd Aziz, A.; Kristanti, R.A.; Yousuf, A. Co-gasification of empty fruit bunch in a downdraft reactor: A pilot scale approach. Bioresour. Technol. Rep. 2018, 1, 39–49. [Google Scholar] [CrossRef]
  23. Dhanavath, K.N.; Shah, K.; Bhargava, S.K.; Bankupalli, S. Oxygen—Steam gasification of karanja press seed cake: Fixed bed experiments, Aspen Plus process model development and benchmarking with saw dust, rice husk and sun flower husk. J. Environ. Chem. Eng. 2018, 6, 3061–3069. [Google Scholar] [CrossRef]
  24. Haugen, H.H.; Halvorsen, B.M.; Eikeland, M.S. Simulation of Gasification of Livestock Manure with Aspen Plus. Linköping Electron. Conf. Proc. 2015, 119, 271–277. [Google Scholar] [CrossRef] [Green Version]
  25. Villarini, M.; Marcantonio, V.; Colantoni, A.; Bocci, E. Sensitivity Analysis of Different Parameters on the Performance of a CHP Internal Combustion Engine System Fed by a Biomass Waste Gasifier. Energies 2019, 12, 688. [Google Scholar] [CrossRef] [Green Version]
  26. Puig-Gamero, M.; Argudo-Santamaria, J.; Valverde, J.L.; Sánchez, P.; Sanchez-Silva, L. Three integrated process simulation using aspen plus®: Pine gasification, syngas cleaning and methanol synthesis. Energy Convers. Manag. 2018, 177, 416–427. [Google Scholar] [CrossRef]
  27. Mehrpooya, M.; Khalili, M.; Sharifzadeh, M.M.M. Model development and energy and exergy analysis of the biomass gasification process (Based on the various biomass sources). Renew. Sustain. Energy Rev. 2018, 91, 869–887. [Google Scholar] [CrossRef]
  28. Cohce, M.K.; Dincer, I.; Rosen, M.A. Thermodynamic analysis of hydrogen production from biomass gasification. Int. J. Hydrogen Energy 2010, 35, 4970–4980. [Google Scholar] [CrossRef]
  29. Parvez, A.M.; Mujtaba, I.M.; Wu, T. Energy, exergy and environmental analyses of conventional, steam and CO₂-enhanced rice straw gasification. Energy 2016, 94, 579–588. [Google Scholar] [CrossRef] [Green Version]
  30. González-Vázquez, M.P.; García, R.; Gil, M.V.; Pevida, C.; Rubiera, F. Comparison of the gasification performance of multiple biomass types in a bubbling fluidized bed. Energy Convers. Manag. 2018, 176, 309–323. [Google Scholar] [CrossRef]
  31. Rudra Paul, T.; Nath, H.; Chauhan, V.; Sahoo, A. Gasification studies of high ash Indian coals using Aspen plus simulation. Mater. Today Proc. 2020. [Google Scholar] [CrossRef]
  32. Gumz, W. Gas Producers and Blast Furnaces: Theory and Methods of Calculation; John Wiley & Sons: New York, NY, USA, 1950. [Google Scholar]
  33. De Andrés, J.M.; Vedrenne, M.; Brambilla, M.; Rodríguez, E. Modeling and model performance evaluation of sewage sludge gasification in fluidized-bed gasifiers using Aspen Plus. J. Air Waste Manag. Assoc. 2018, 1–11. [Google Scholar] [CrossRef] [PubMed] [Green Version]
  34. Barisano, D.; Canneto, G.; Nanna, F.; Alvino, E.; Pinto, G.; Villone, A.; Carnevale, M.; Valerio, V.; Battafarano, A.; Braccio, G. Steam/oxygen biomass gasification at pilot scale in an internally circulating bubbling fluidized bed reactor. Fuel Process. Technol. 2016, 141, 74–81. [Google Scholar] [CrossRef]
  35. Ayub, H.M.U.; Park, S.J.; Binns, M. Biomass to Syngas: Modified Non-Stoichiometric Thermodynamic Models for the Downdraft Biomass Gasification. Energies 2020, 13, 5668. [Google Scholar] [CrossRef]
  36. Venkata Ramanan, M.; Lakshmanan, E.; Sethumadhavan, R.; Renganarayanan, S. Performance prediction and validation of equilibrium modeling for gasification of cashew nut shell char. Braz. J. Chem. Eng. 2008, 25, 585–601. [Google Scholar] [CrossRef]
  37. Ali, D.A.; Gadalla, M.A.; Abdelaziz, O.Y.; Hulteberg, C.P.; Ashour, F.H. Co-gasification of coal and biomass wastes in an entrained flow gasifier: Modelling, simulation and integration opportunities. J. Nat. Gas Sci. Eng. 2017, 37, 126–137. [Google Scholar] [CrossRef]
  38. Rupesh, S.; Muraleedharan, C.; Arun, P. ASPEN plus modelling of air—Steam gasification of biomass with sorbent enabled CO₂ capture. Resour. Technol. 2016, 2, 94–103. [Google Scholar] [CrossRef] [Green Version]
  39. Niu, M.; Huang, Y.; Jin, B.; Wang, X. Simulation of Syngas Production from Municipal Solid Waste Gasification in a Bubbling Fluidized Bed Using Aspen Plus. Ind. Eng. Chem. Res. 2013, 52, 14769–14775. [Google Scholar] [CrossRef]
  40. Kaushal, P.; Tyagi, R. Advanced simulation of biomass gasification in a fluidized bed reactor using ASPEN PLUS. Renew. Energy 2017, 101, 629–636. [Google Scholar] [CrossRef]
  41. Nikoo, M.B.; Mahinpey, N. Simulation of biomass gasification in fluidized bed reactor using ASPEN PLUS. Biomass Bioenergy 2008, 32, 1245–1254. [Google Scholar] [CrossRef]
  42. Altafini, C.R.; Wander, P.R.; Barreto, R.M. Prediction of the working parameters of a wood waste gasifier through an equilibrium model. Energy Convers. Manag. 2003, 44, 2763–2777. [Google Scholar] [CrossRef]
Figure 1. Flow-diagram for the non-stoichiometric biomass gasification model.
Energies 14 00189 g001
Figure 2. Flow-diagram for the stoichiometric biomass gasification model.
Energies 14 00189 g002
Figure 3. Comparison between the experimental results for the produced gas composition at different stoichiometric ratios during gasification of PKS using 70 vol.% steam at 900 °C, and the predictions obtained with stoichiometric and non-stoichiometric models: (a) H2, (b) CO, (c) CO2 and (d) CH4 (CH4 values of RGIBBS model are negligible, typically below 10−3).
Energies 14 00189 g003
Figure 4. Comparison between experimental and simulation results for the produced syngas composition at different stoichiometric ratios, for the gasification of PKS with 70 vol.% steam at 900 °C.
Energies 14 00189 g004
Figure 5. Comparison between the gas concentrations at different steam to biomass ratios during the gasification of PKS at 900 °C with stoichiometric ratio (SR) = 0.2, and the predictions obtained with stoichiometric and non-stoichiometric models: (a) H2, (b) CO, (c) CO2 and (d) CH4 (CH4 values of RGIBBS model are negligible).
Energies 14 00189 g005
Figure 6. Comparison between experimental and simulation results for the produced gas composition at different steam to biomass mass ratios, for the gasification of PKS at 900 °C with SR = 0.2.
Energies 14 00189 g006
Figure 7. Comparison between the gas concentrations at different temperatures during the gasification of PKS using 70 vol.% steam with SR = 0.2 and the predictions obtained with stoichiometric and non-stoichiometric models: (a) H2, (b) CO, (c) CO2 and (d) CH4 (CH4 values of RGIBBS model are negligible).
Energies 14 00189 g007
Figure 8. Comparison between the experimental and simulation results for the produced syngas composition at different temperatures, for the gasification of PKS with SR = 0.2 and 70 vol.% steam.
Energies 14 00189 g008
Figure 9. Effect of SR and SBR on ηgas (a,b), HHV (c,d) and ηenergy (e,f) for the gasification of PKS at 900 °C. Comparison of experimental results and predictions obtained with the non-stoichiometric and stoichiometric models.
Energies 14 00189 g009
Table 1. Chemical reactions involved in the gasification process [13,30,31].
Reaction NumberReactionNameHeat of Reaction ΔH0298K (kJ/mol)
R-1C(s) + O2 = CO2Carbon combustion reaction−394
R-2C(s) + ½O2 = COCarbon partial oxidation reaction−123
R-3C(s) + CO2 = 2COBoudouard reaction172
R-4C(s) + H2O = CO + H2Water–gas reaction131
R-5C(s) + 2H2O = CO2 + 2H2Water–gas reaction77
R-6C(s) + 2H2 = CH4Methanation reaction−75
R-7CO + H2O = CO2 + H2Water–gas shift reaction−41
R-8CH4 + H2O = CO + 3H2Steam reforming reaction206
Table 2. Ultimate, proximate and higher heating value (HHV) analyses for pine kernel shells (PKS).
Ultimate Analysis
(wt.%, db)
Proximate Analysis
(wt.%, db)
HHV
(MJ/kg, db)
CNHSO *AshVMFC *
52.320.626.210.0538.991.8178.4119.7820.77
db: dry basis; VM: volatile matter; FC: fixed carbon; HHV: higher heating value; * determined by difference.
Publisher’s Note: MDPI stays neutral with regard to jurisdictional claims in published maps and institutional affiliations.

