
Voltage Optimization in MV Network with Distributed Generation Using Power Consumption Control in Electrolysis Installations


Abstract
:1. Introduction
2. Literature Review
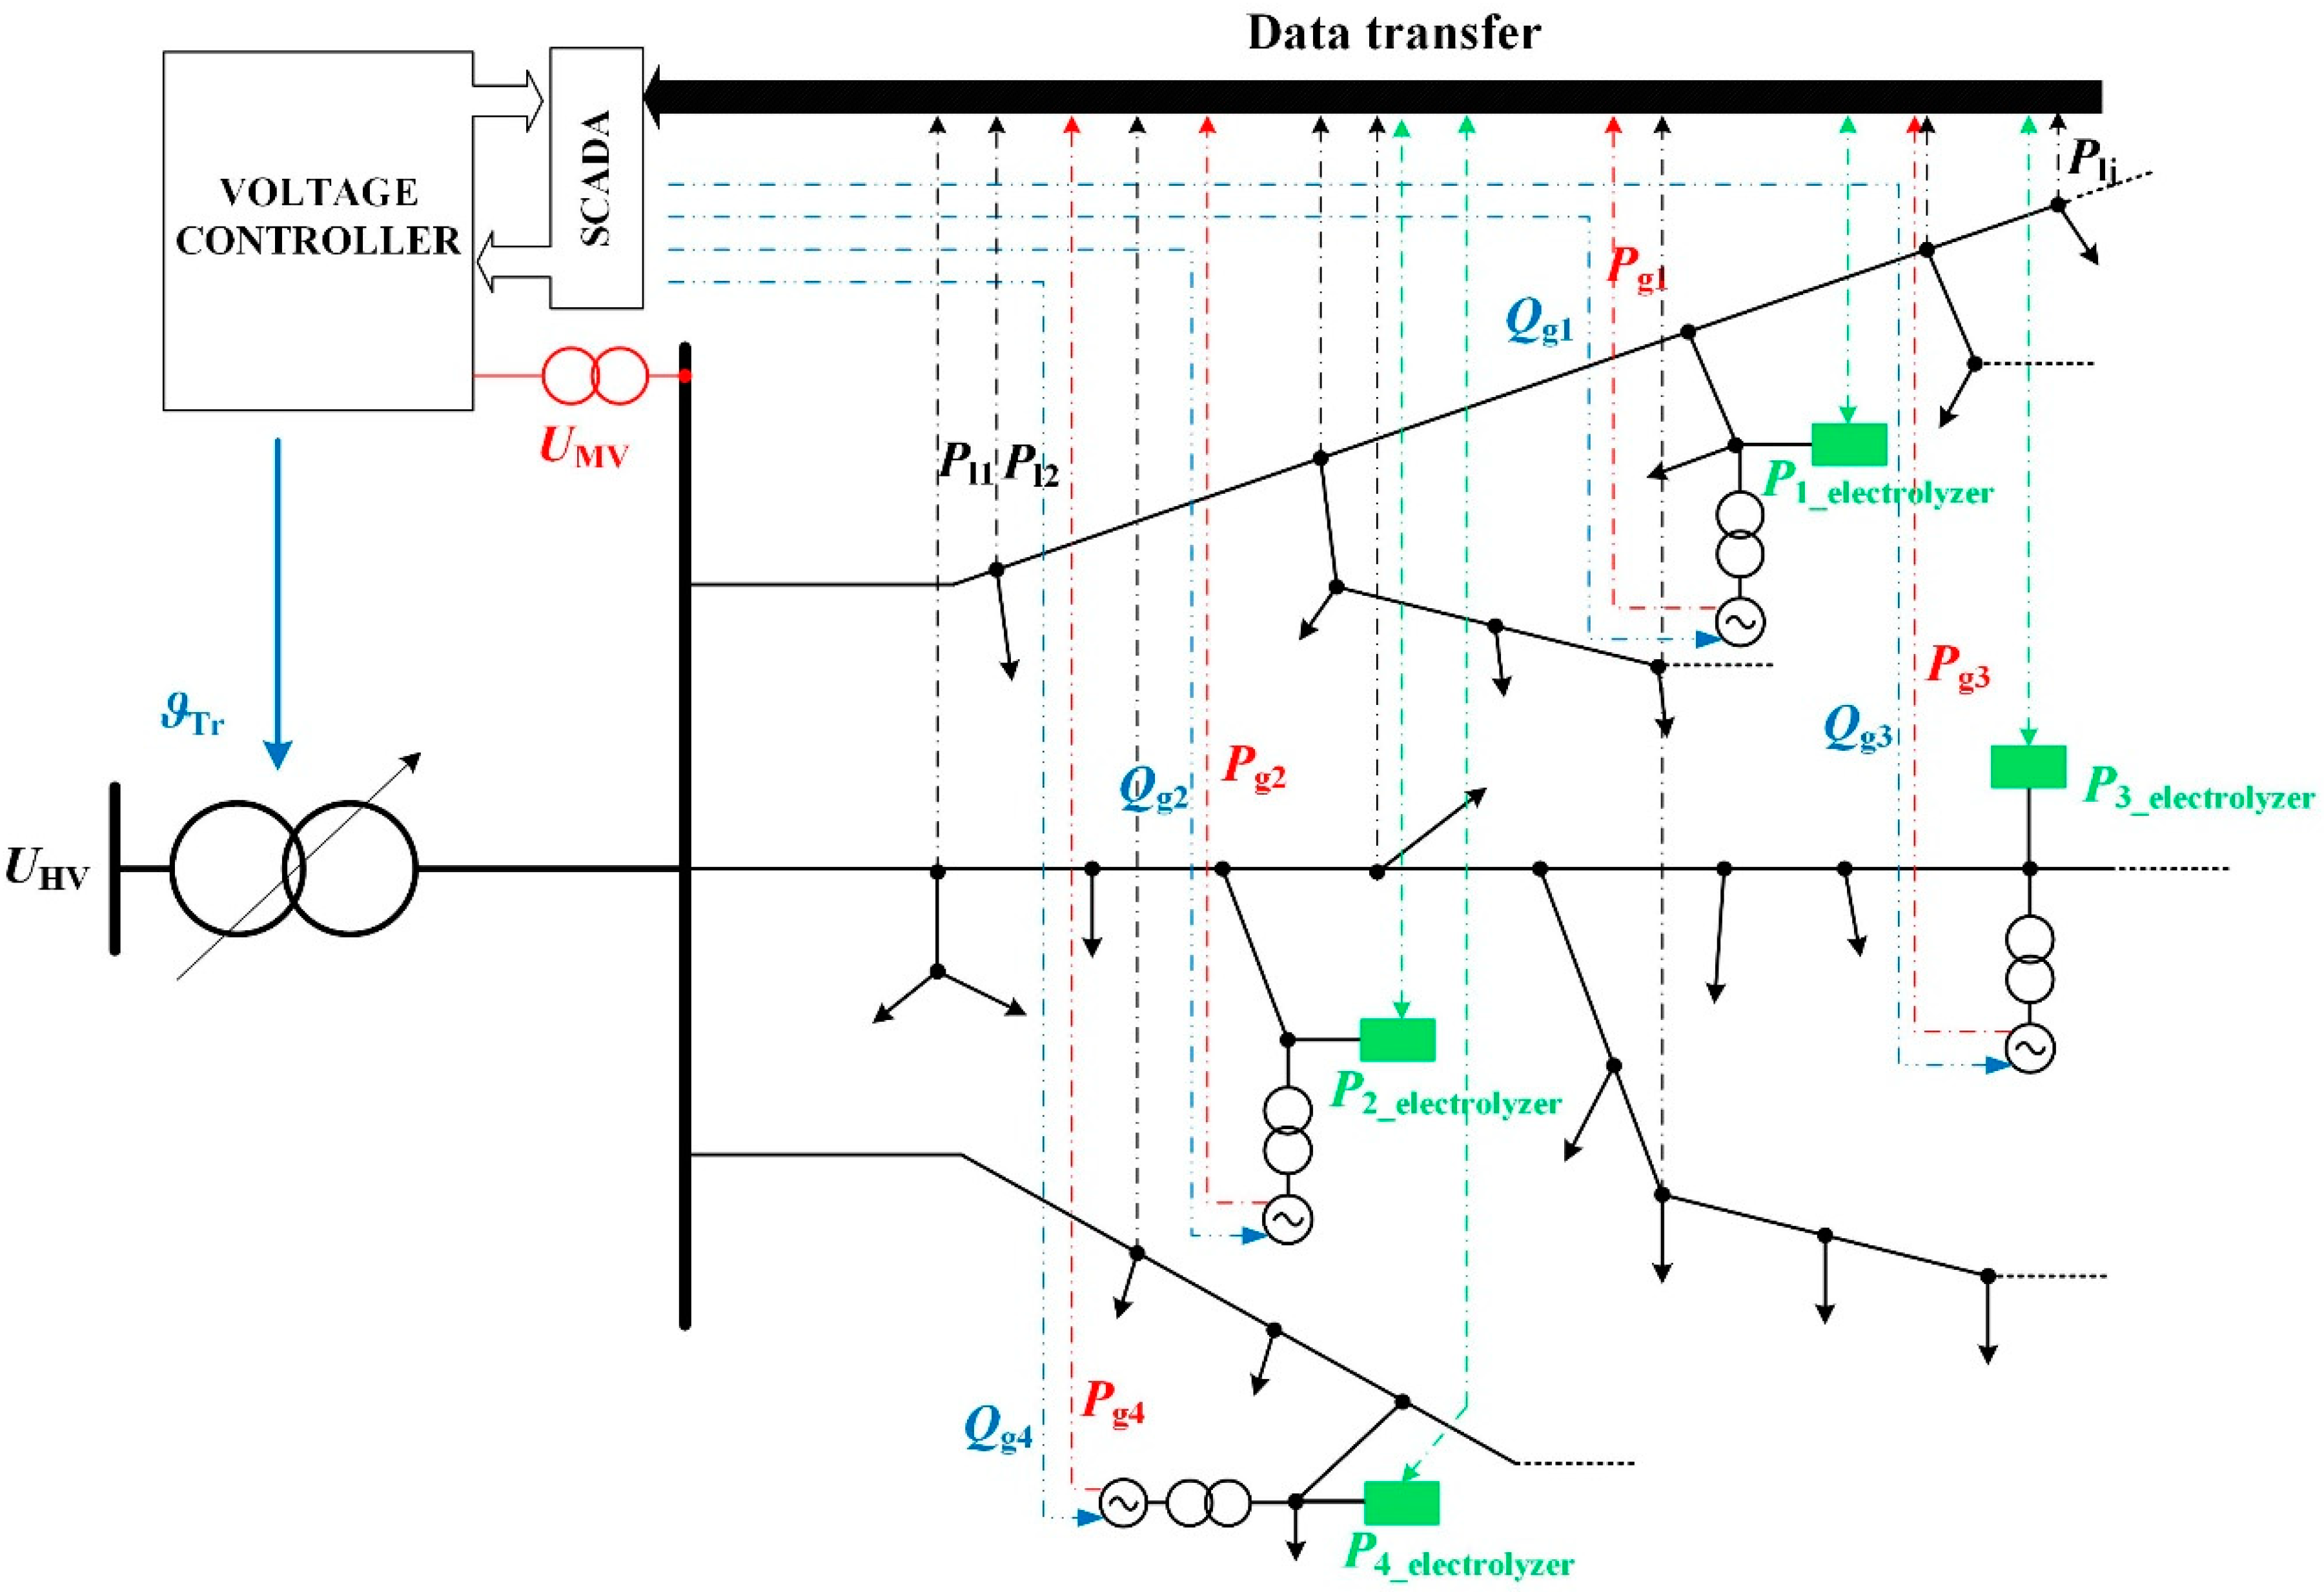
3. Voltage Control in the MV Network with the Participation of Electrolyzers as an Optimization Task
3.1. Formulation of the Objective Function and Its Constrains
- →
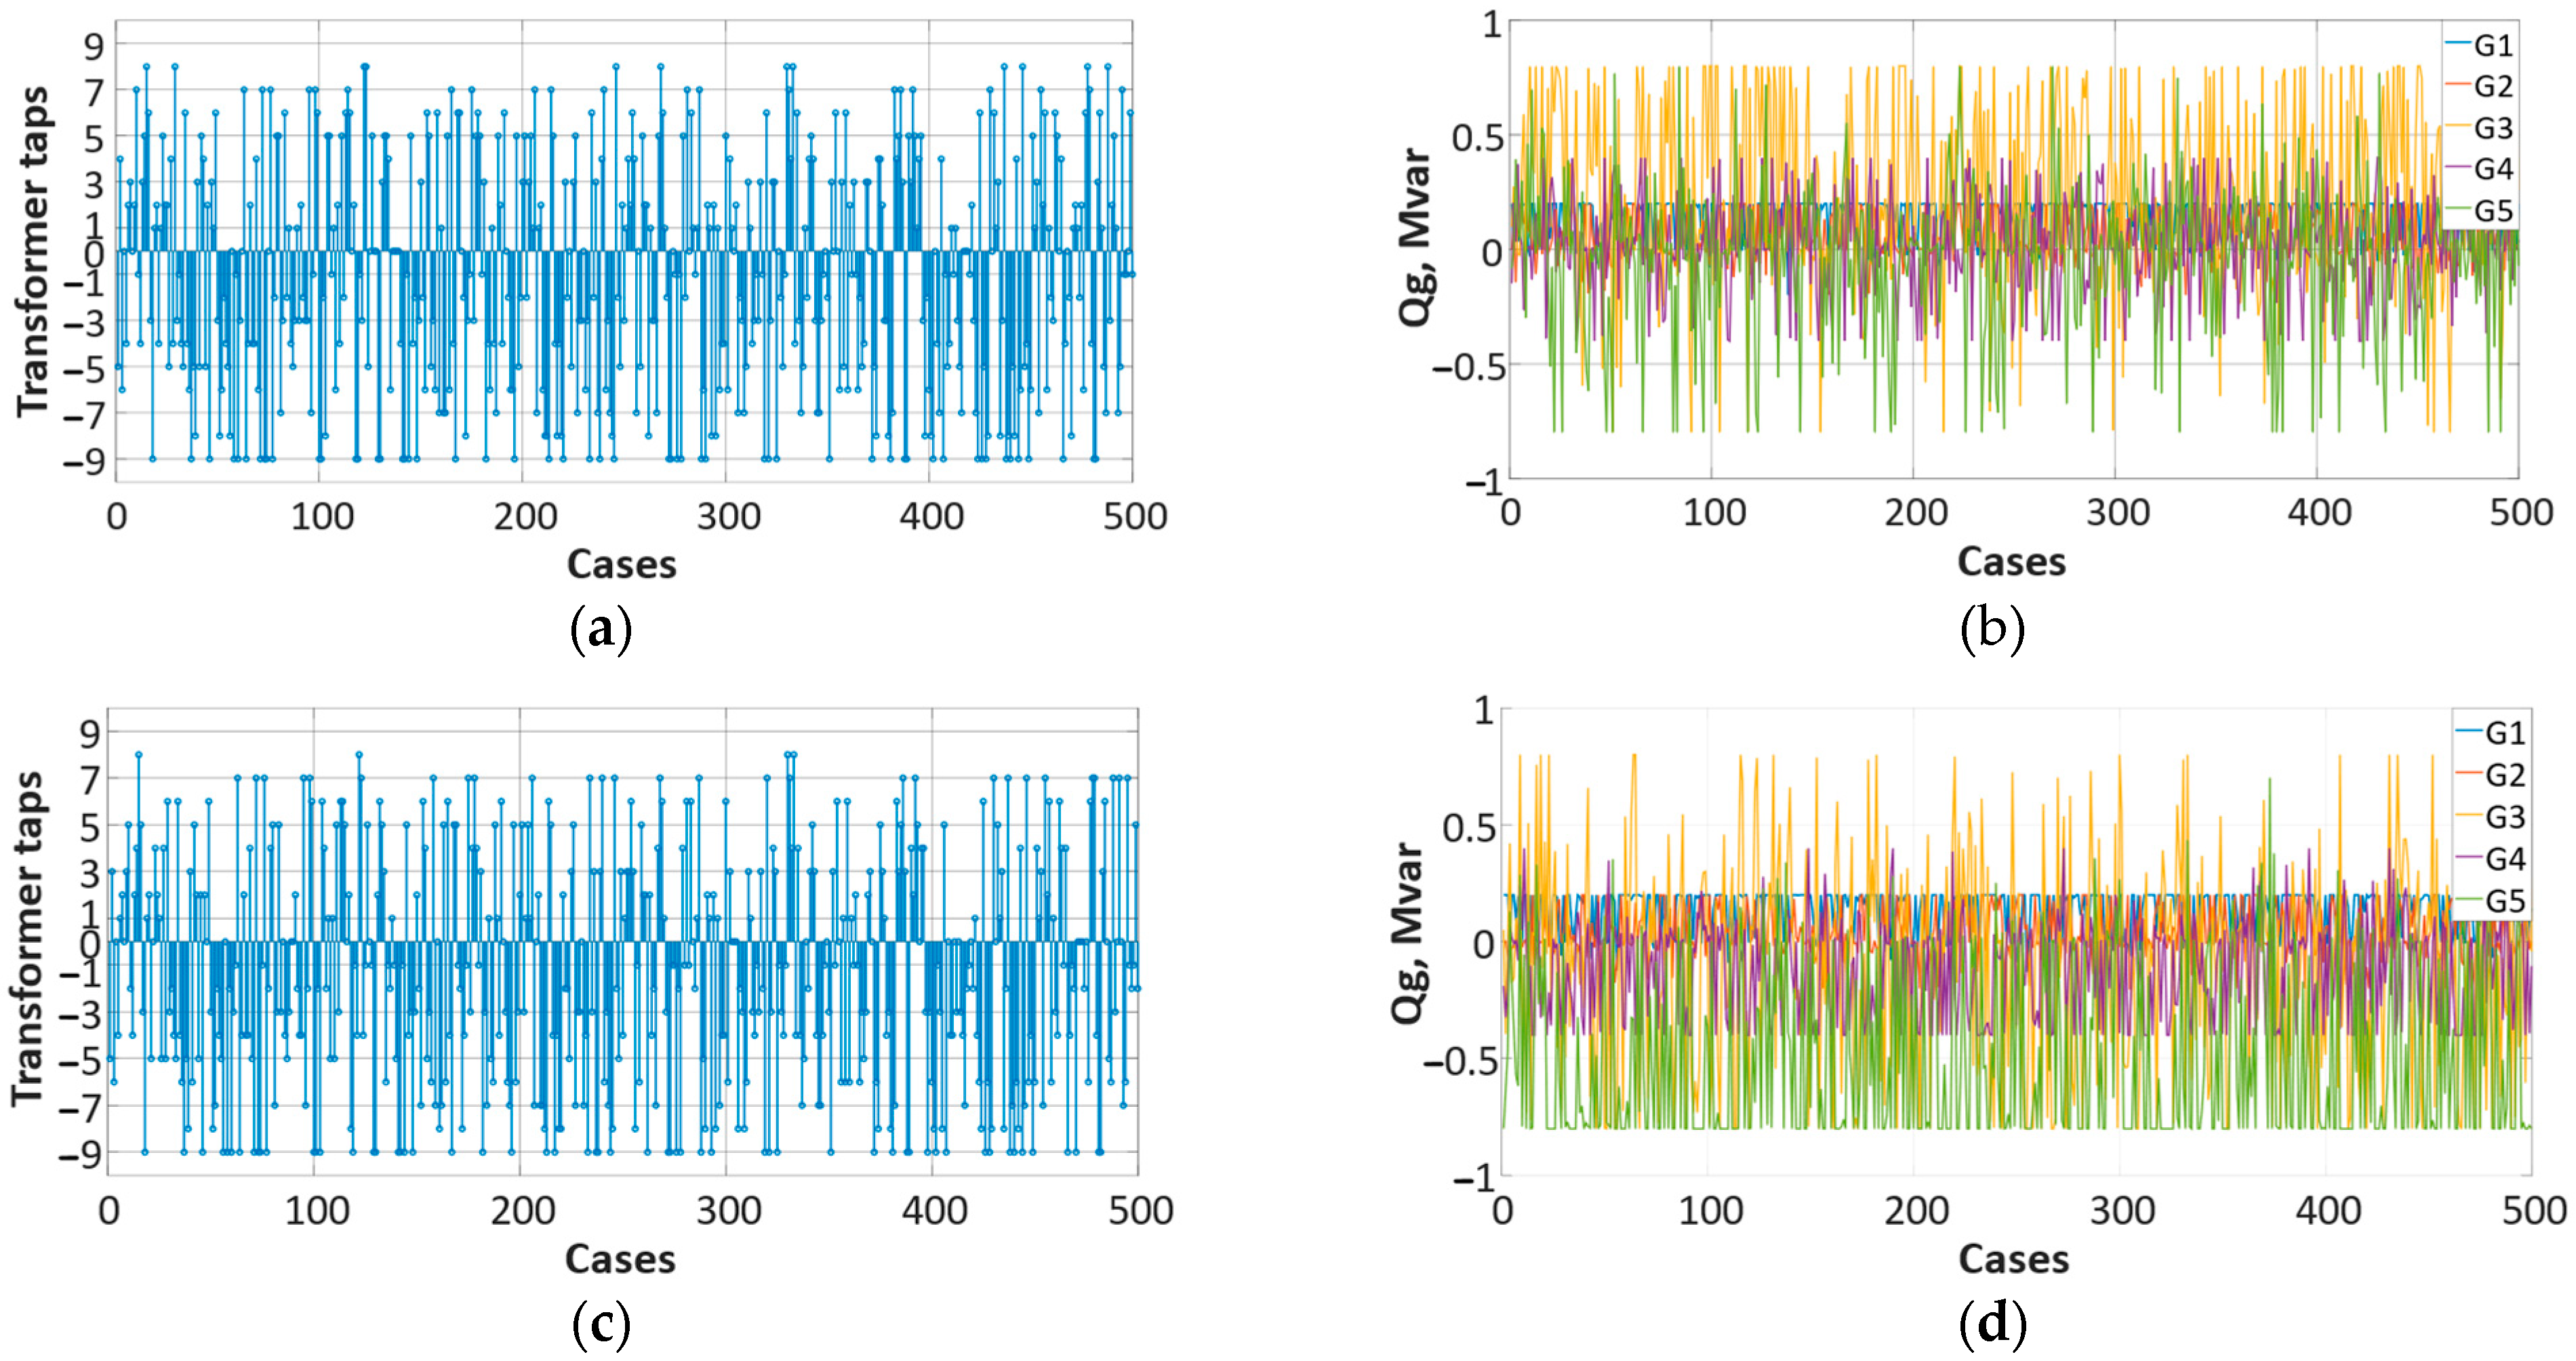
- x = [ϑ, QG1, … QGk, … QGp, PGE1…PGEp]—a vector of decision (control) variables, which is formed by: The HV/MV transformer ratio (ϑ—discrete variable), reactive power p of sources connected to the MV grid and active power p of electrolyzers,
- →
- y = [UHV, PL1, … PLm, QL1, … QLm, PG1, …PGp]—a vector of independent variables formed by: HV network setpoint voltage, active and reactive power received in m nodes and power generated in p sources, not subject to change during optimization process,
- →
- z = [U1, … Uj, δ1, … δj]—the dependent variable vector (also known as the state variable vector) formed by the nodal voltages and their arguments (total number of network nodes j = p + m).
- the vector of decision variables x providing the minimum function described by the relation (1) is sought:
- the vector of inequality limits h, ensuring that the value of the vector elements of dependent variables and the vector of decision variables is maintained within the limits set by technical requirements:
- minimum and maximum values for transformer ratio (ϑ). The transformer adopted for the calculation has 19 operating positions of the on-load tap changer, within ±9 (including the tap in the neutral position).
- minimum and maximum reactive power values of each renewable source (QGK). It is assumed that each RES source has the ability to generate/absorb maximum reactive power equal to 0, 4, PnG,
- minimum and maximum voltage values for all network nodes (Ui). The voltage was maintained in the range from 0.9 UnMV to 1.1 UnMV, which translates into voltage values from 13.5 kV to 16.5 kV,
- the permissible current-carrying capacity values for sections of power lines (Ilmax). The value assumed in the calculations was Ilmax = 290 A,
- the permissible load of the transformer (SnT). The calculations assume the transformer power SnT = 10 MVA.
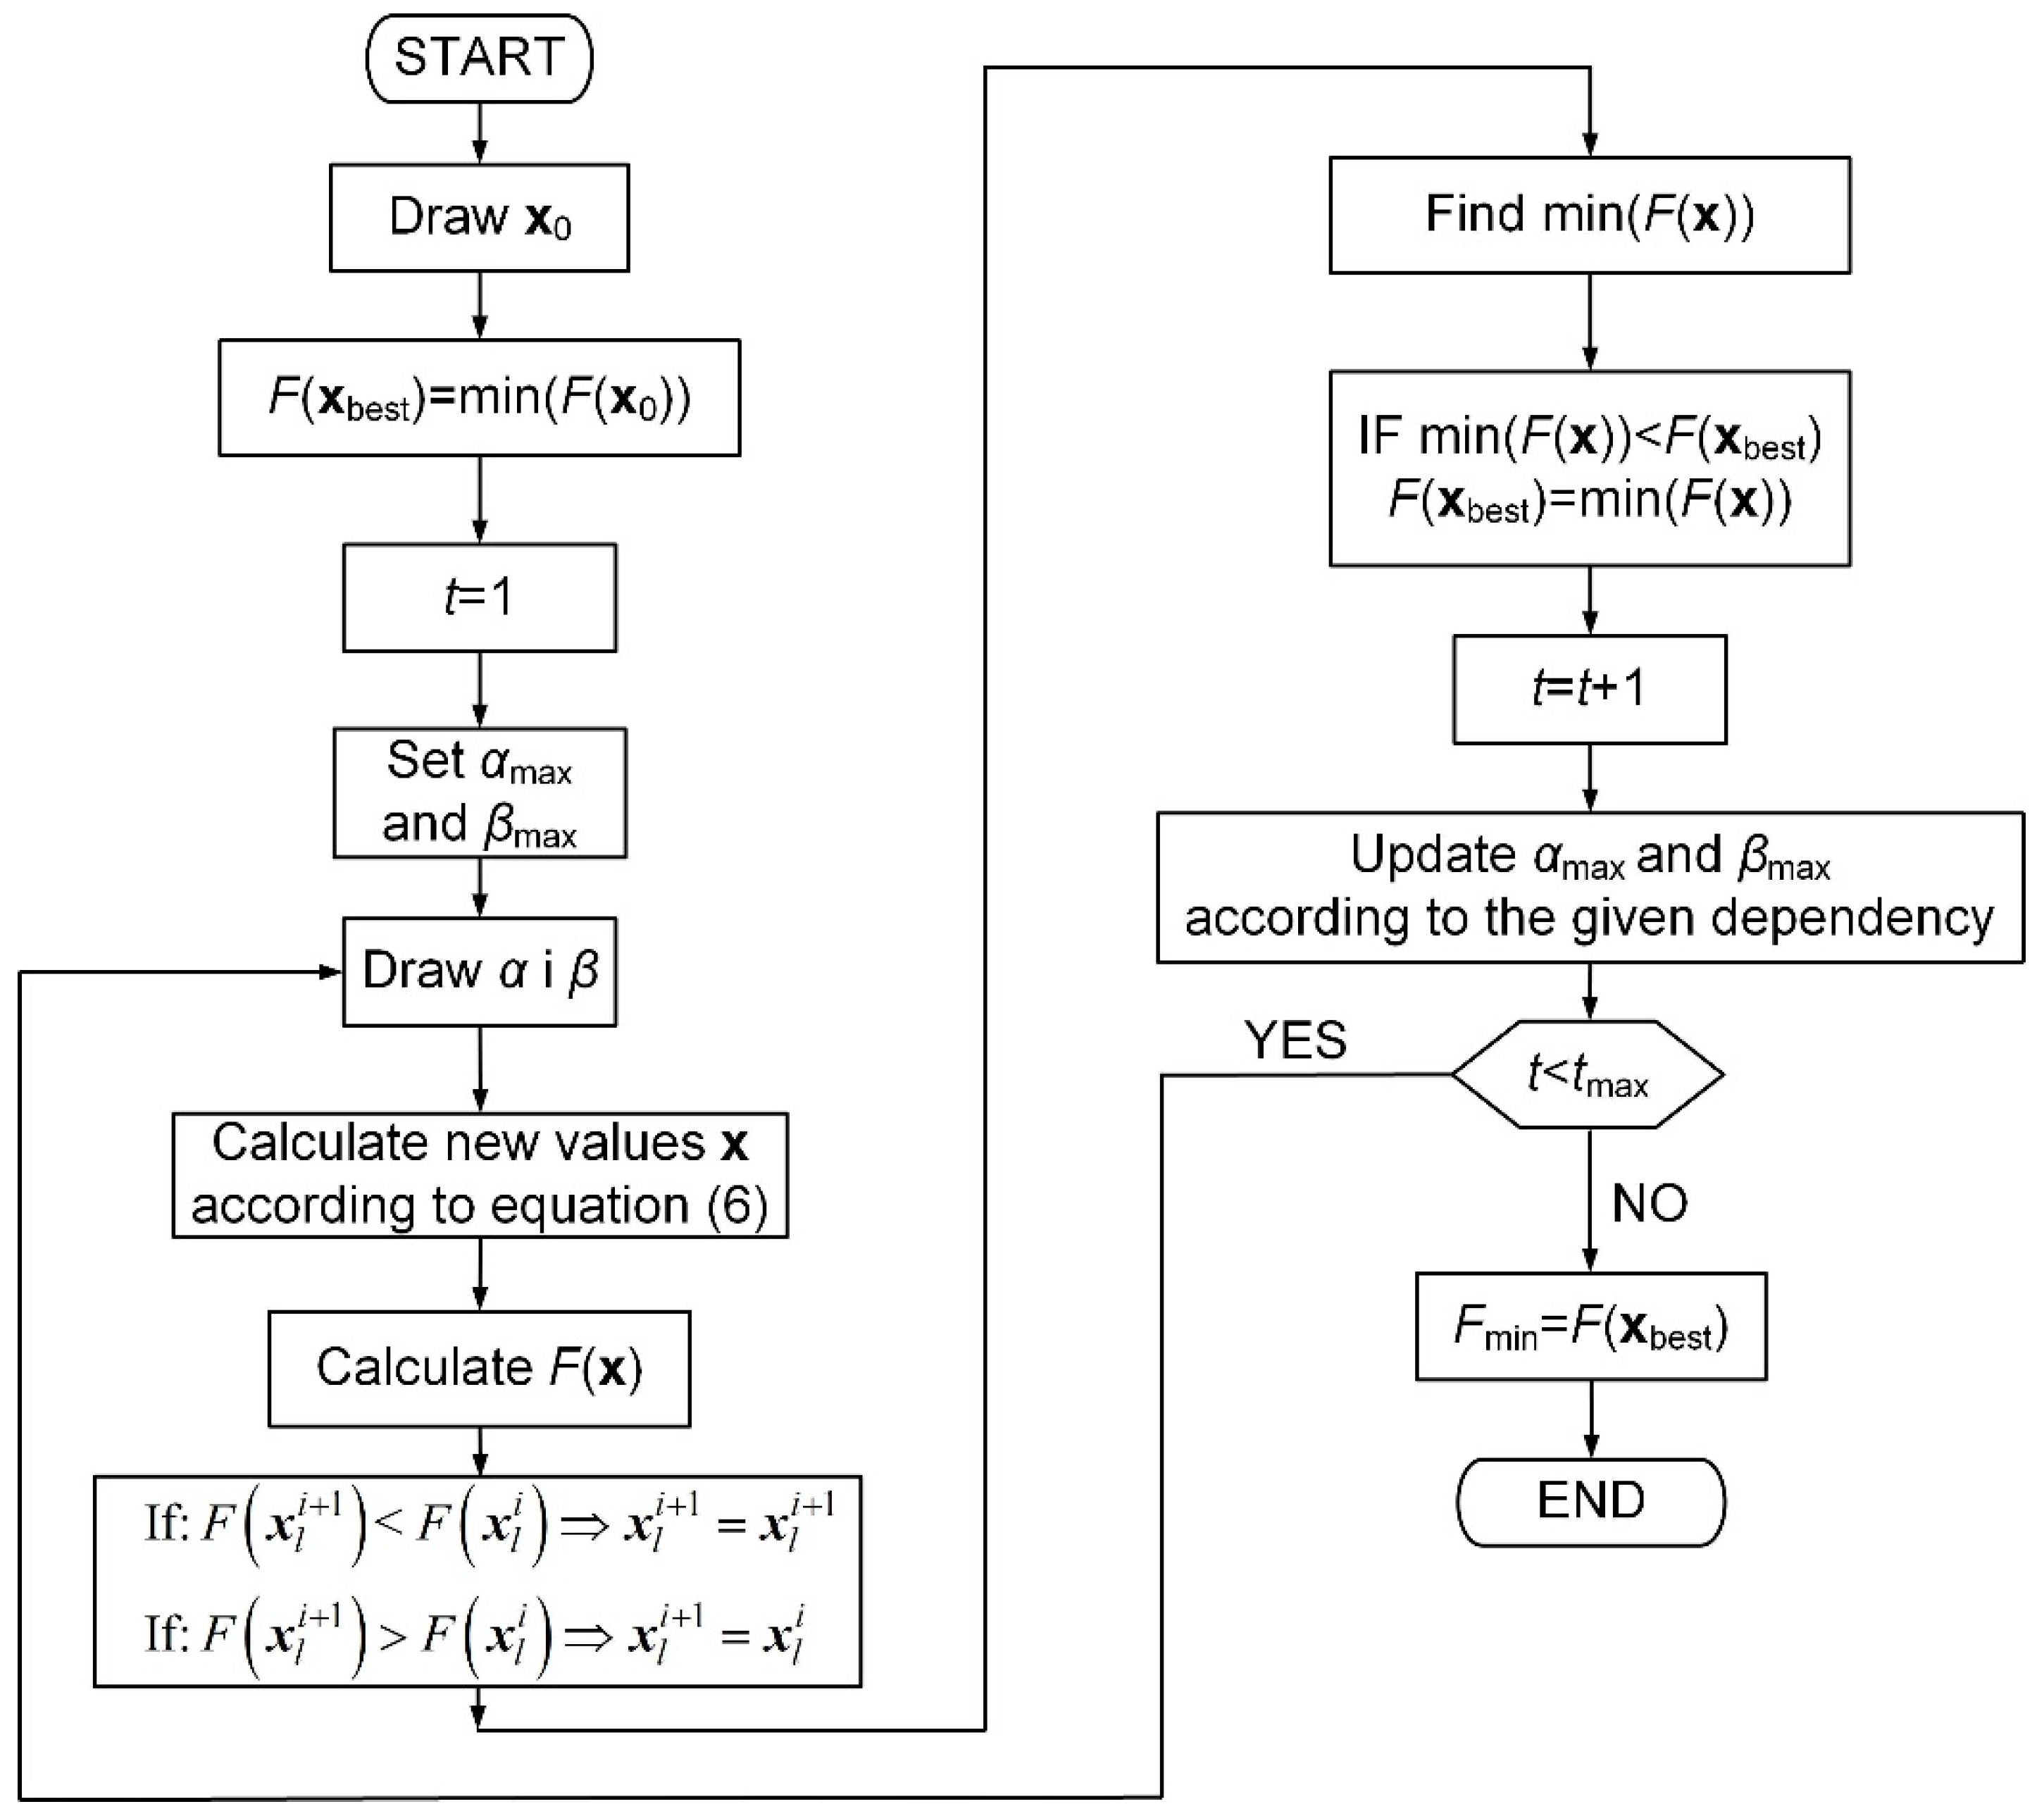
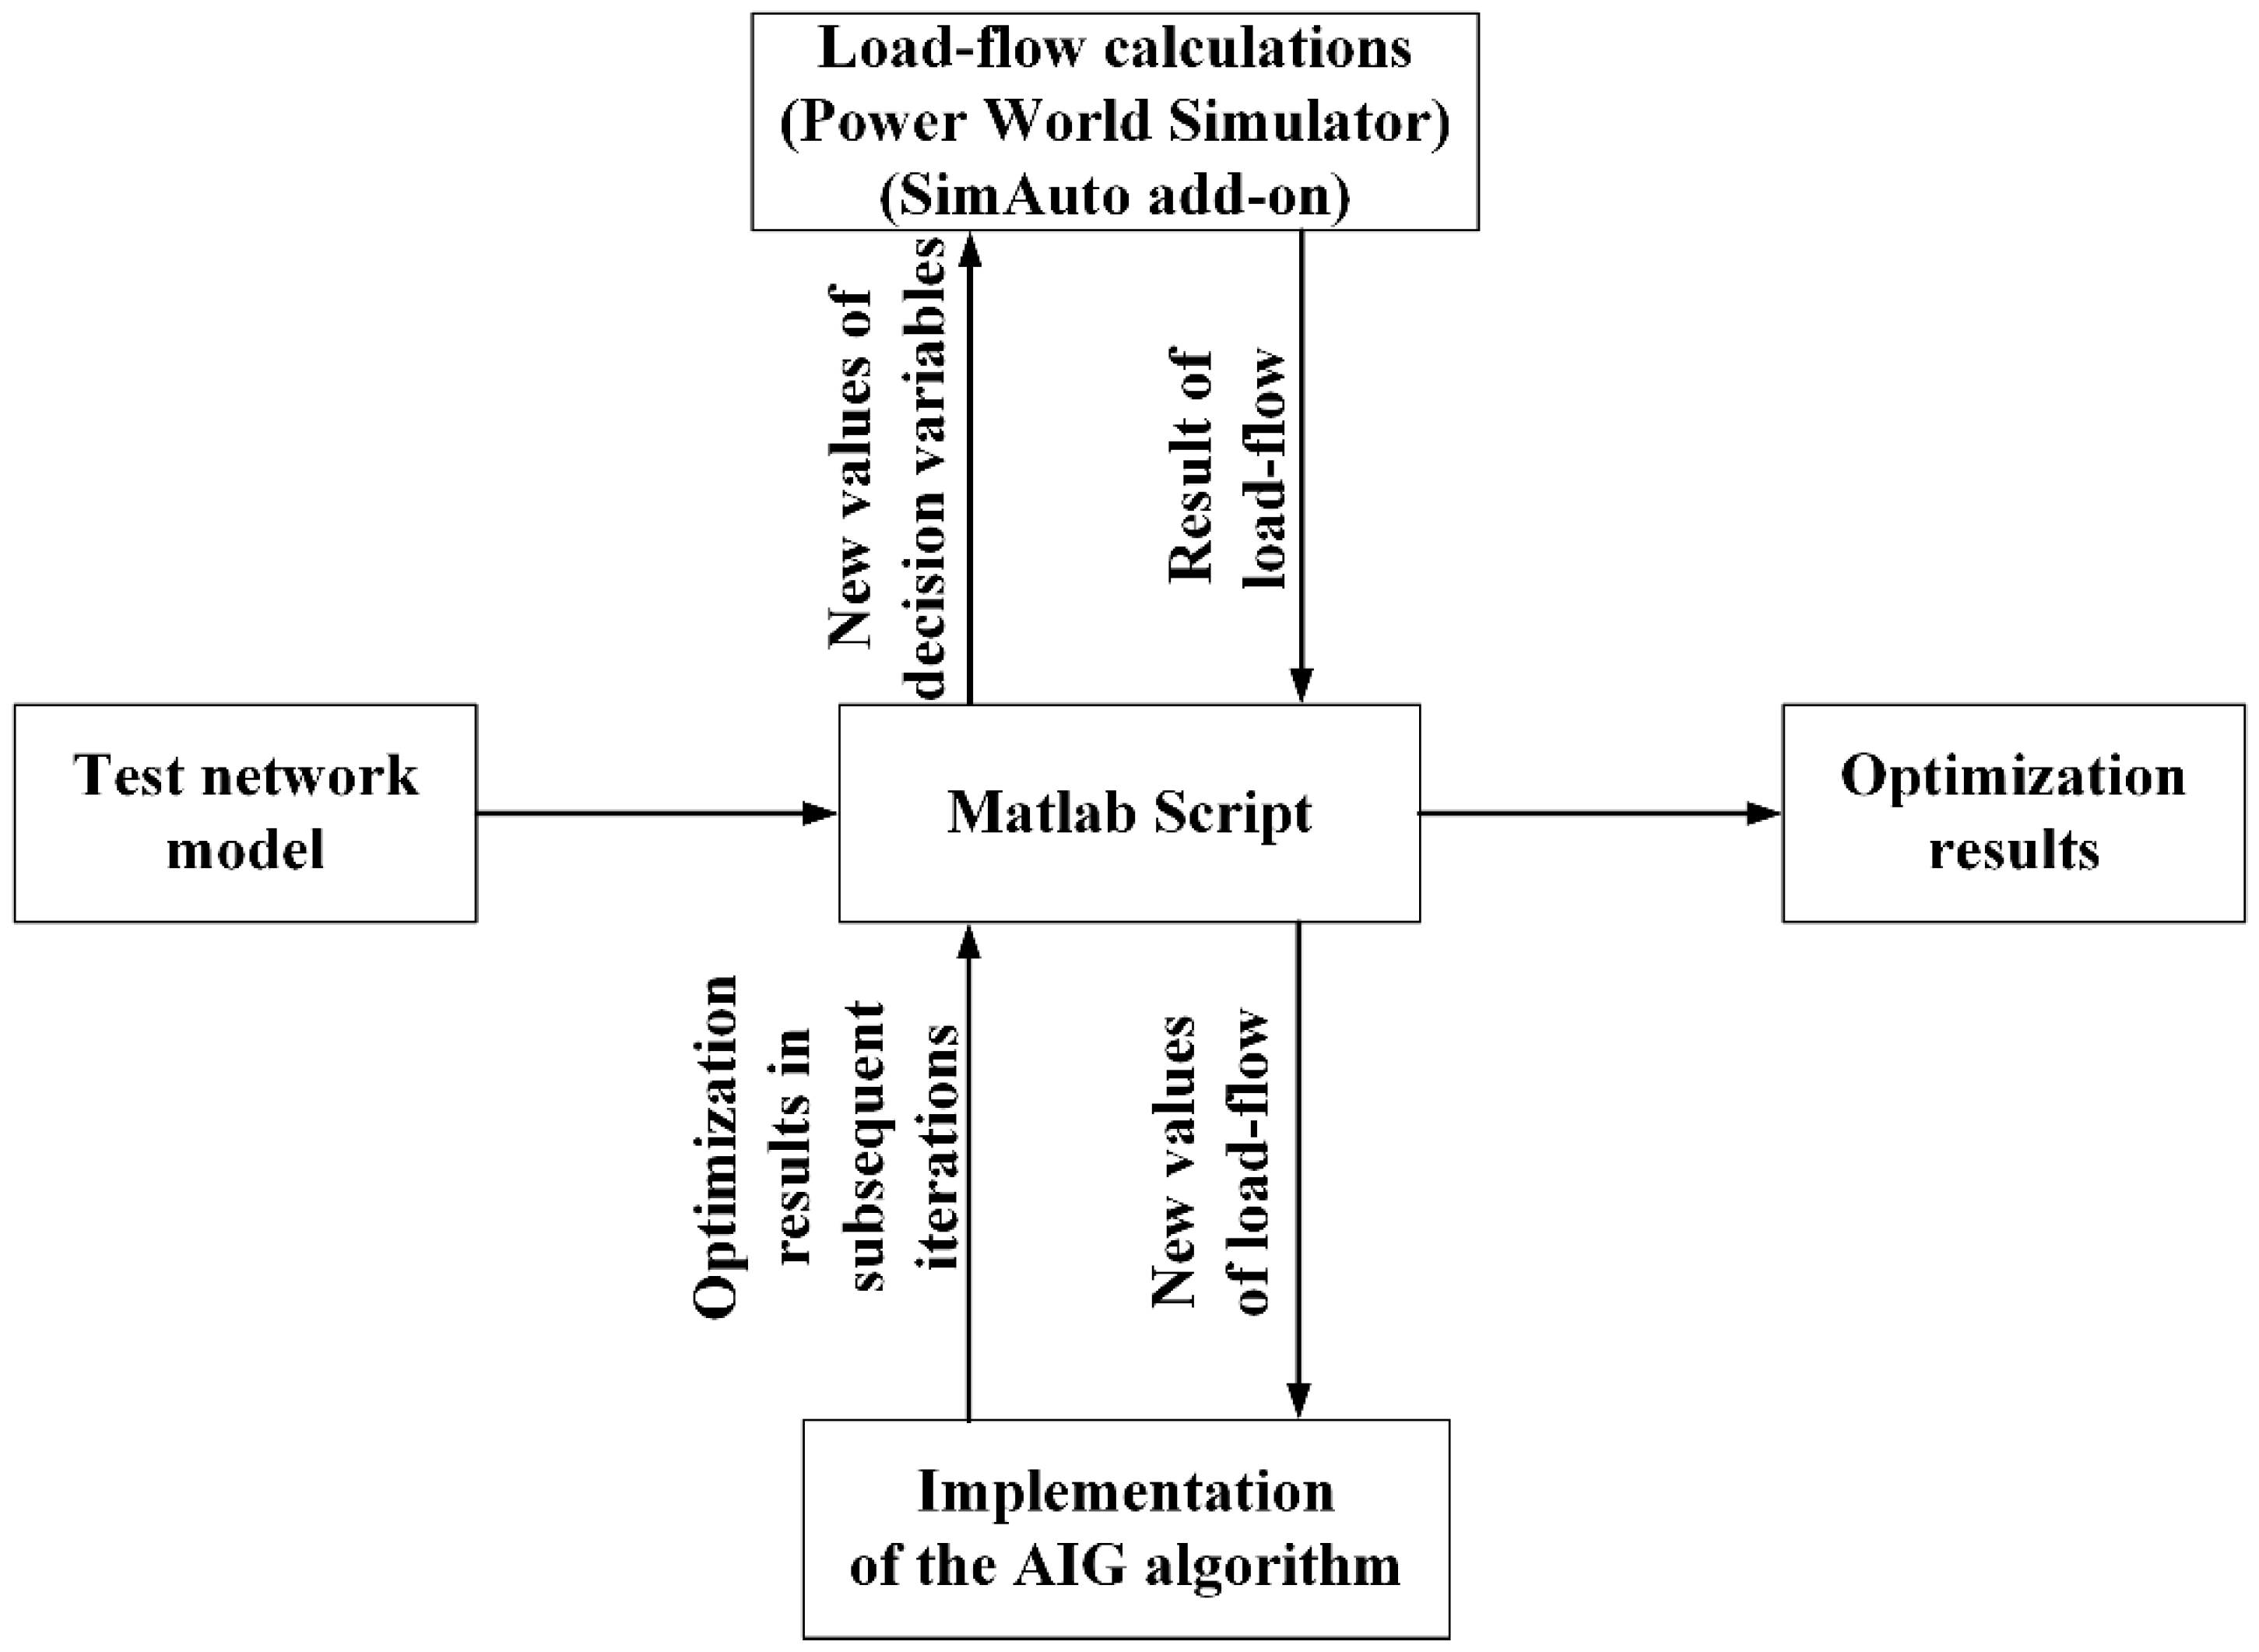
3.2. Description of the Optimisation Algorithm
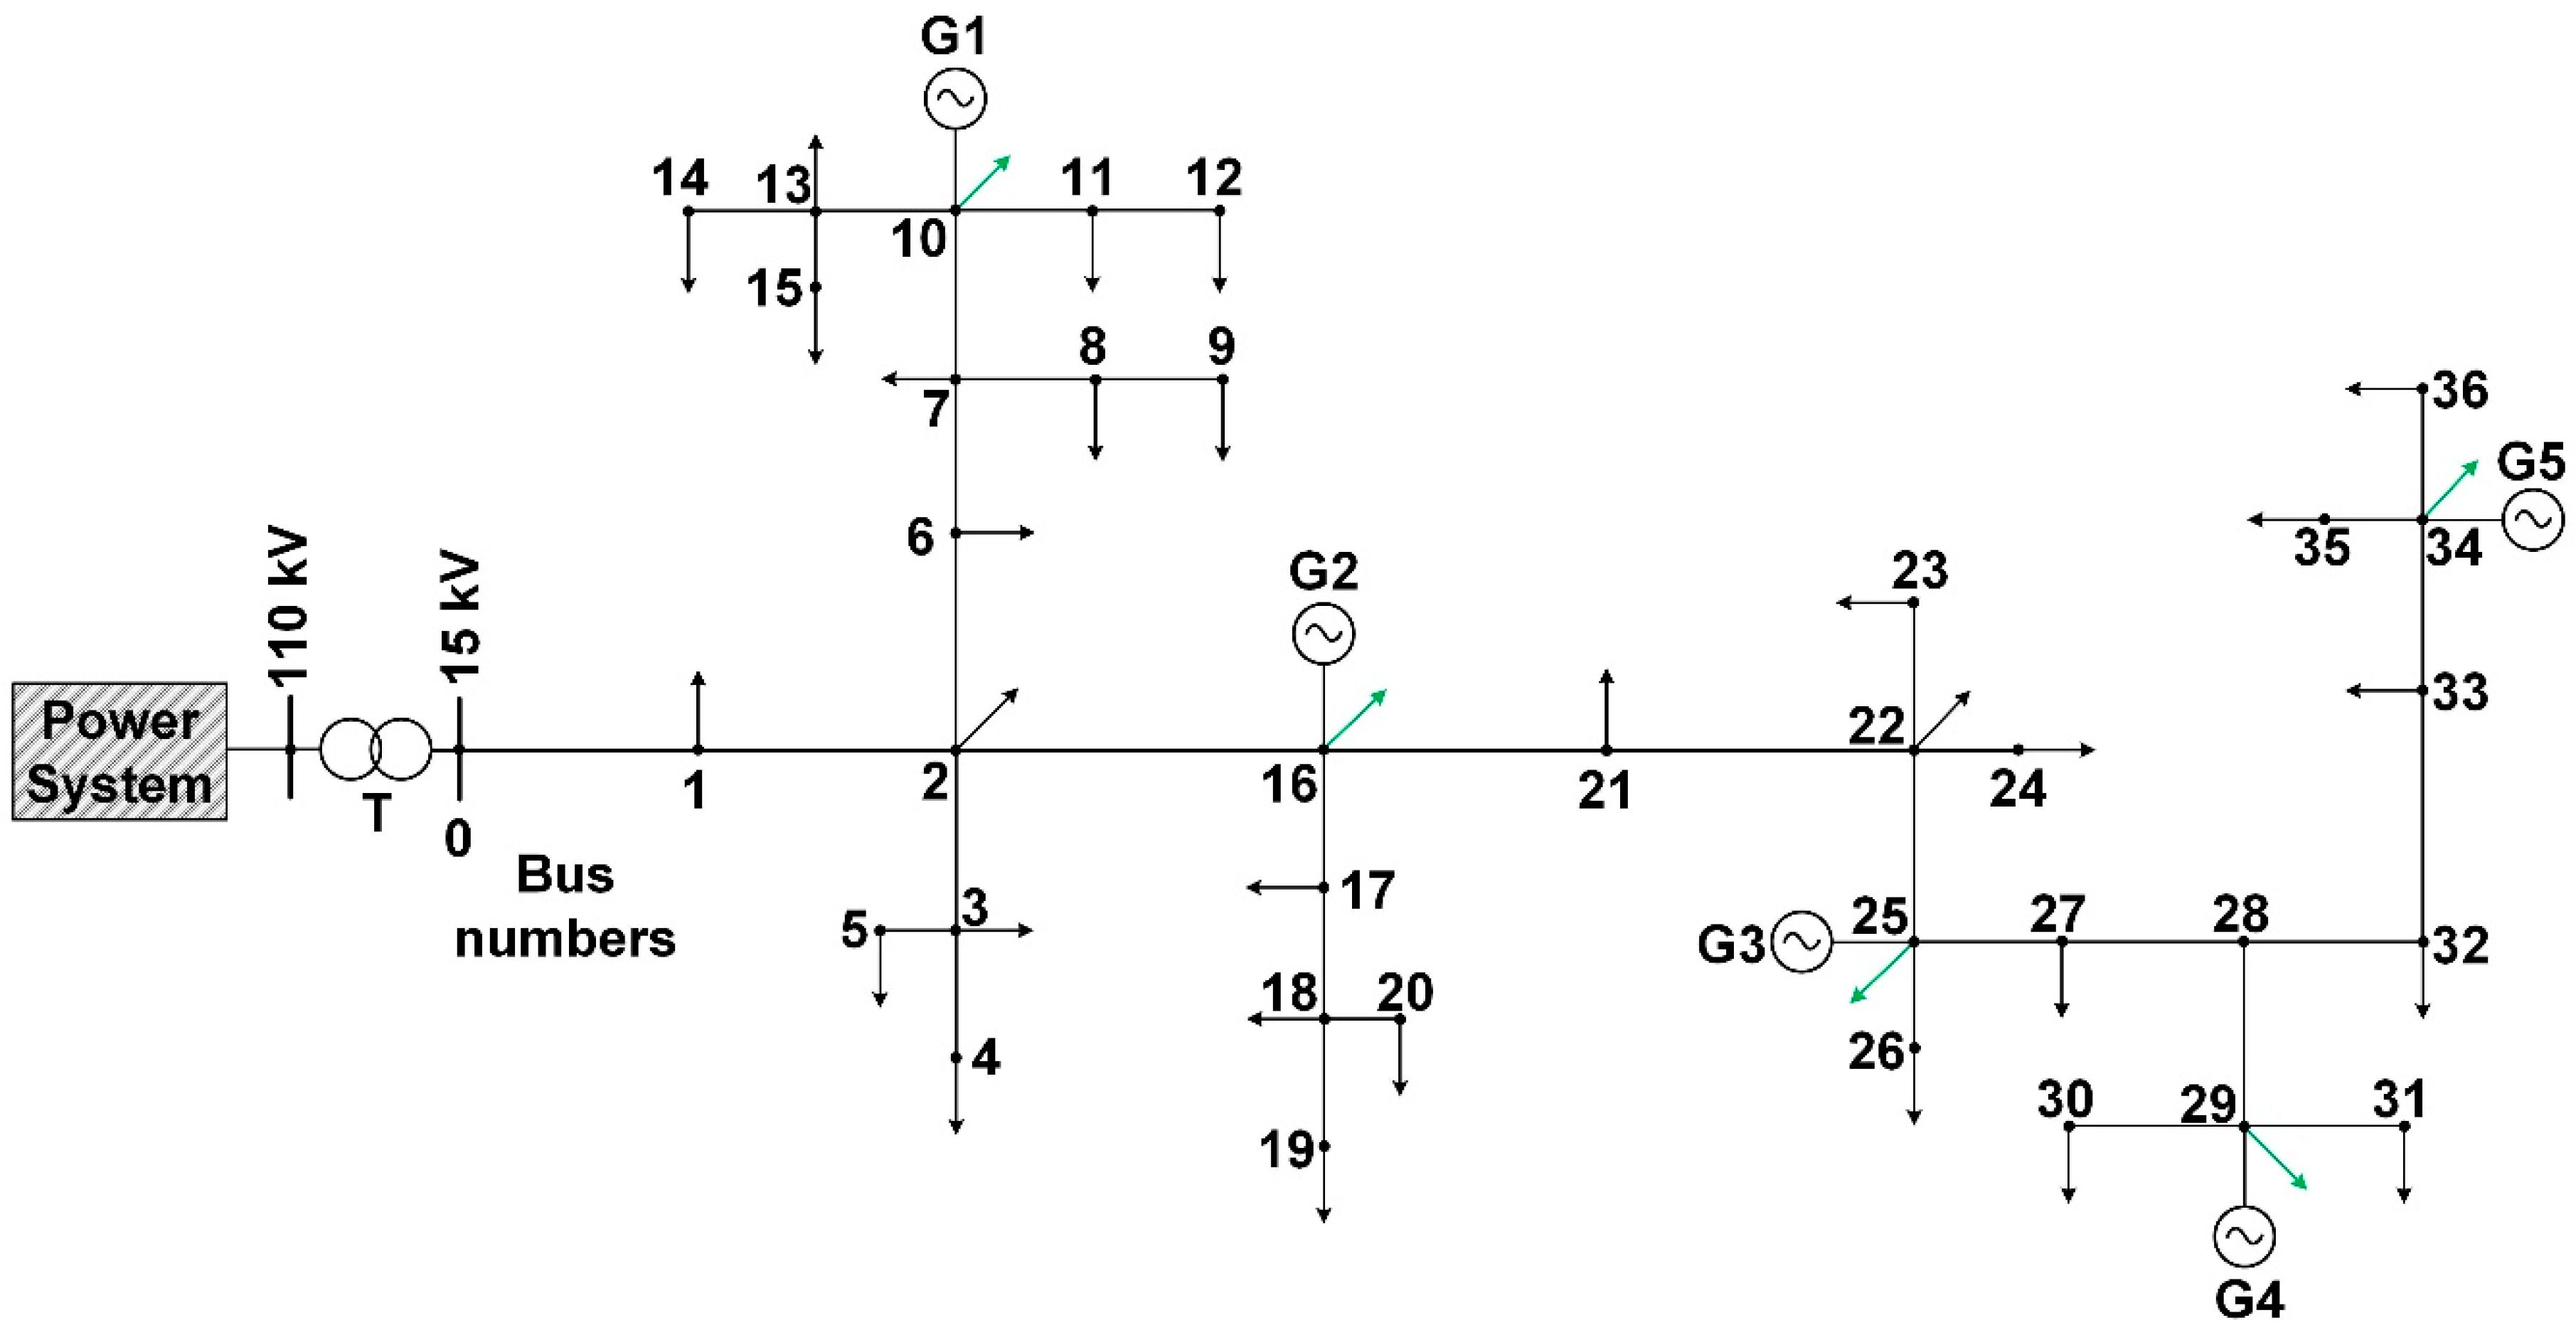
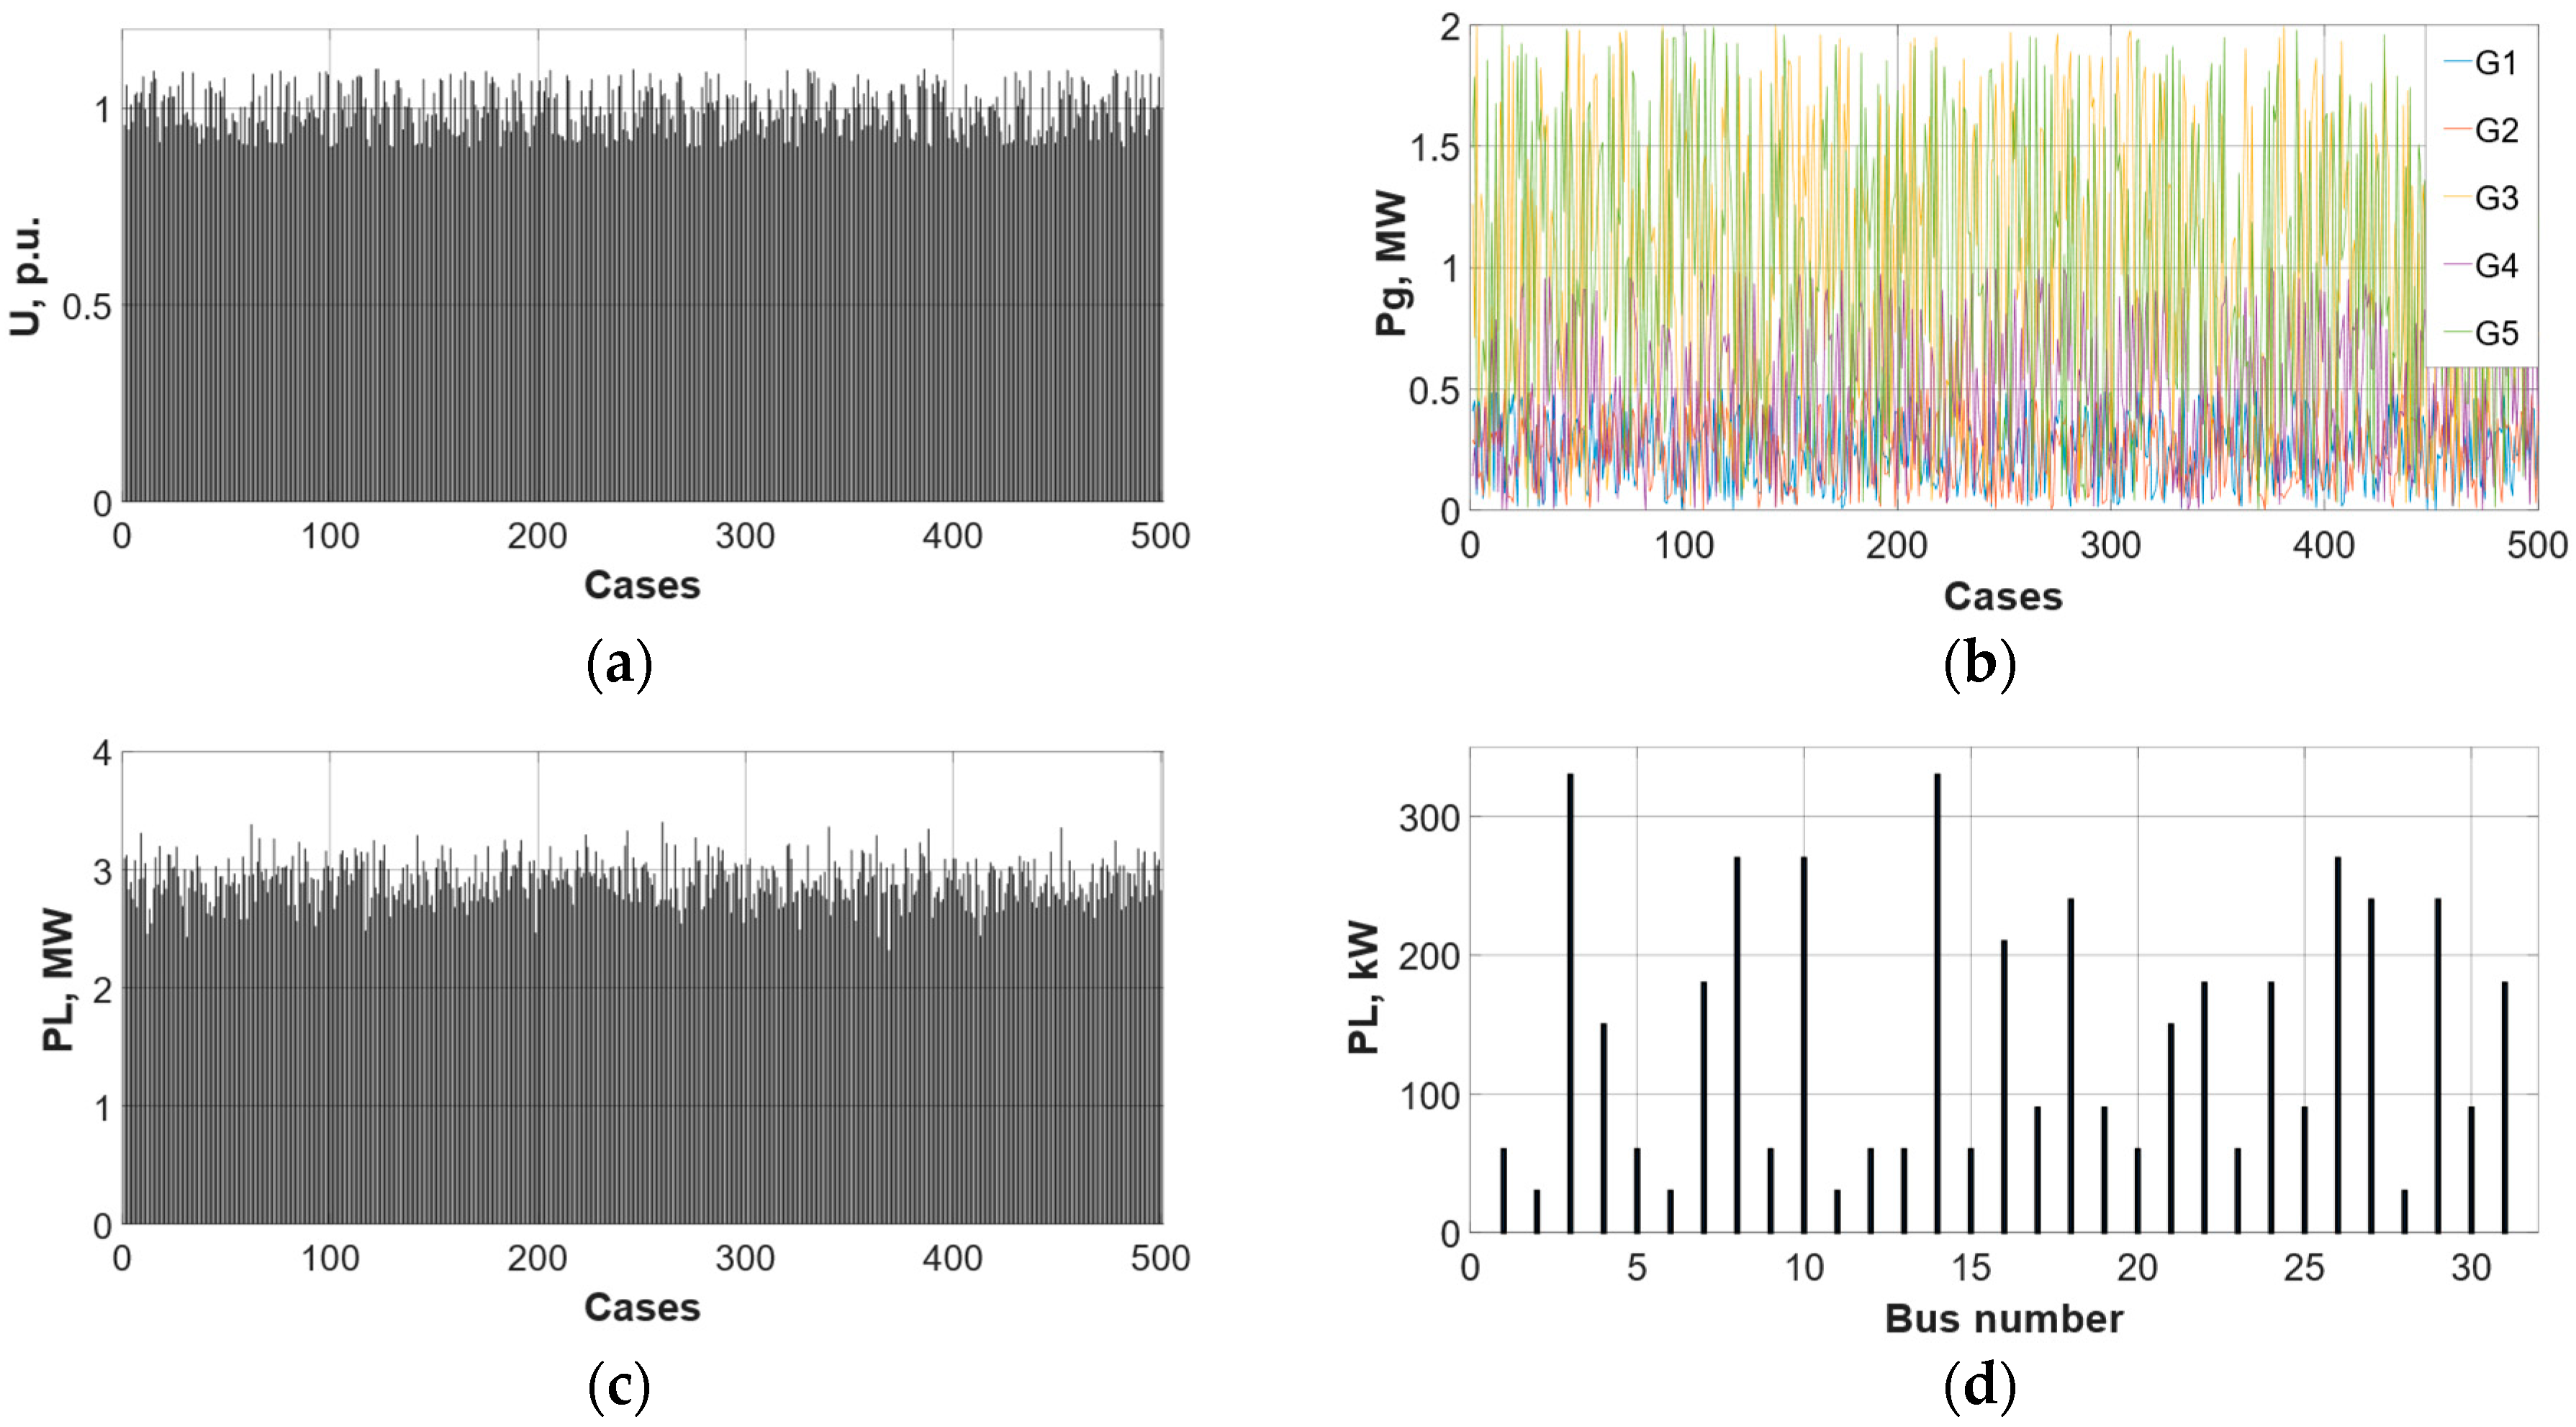
4. Description of the Test Network
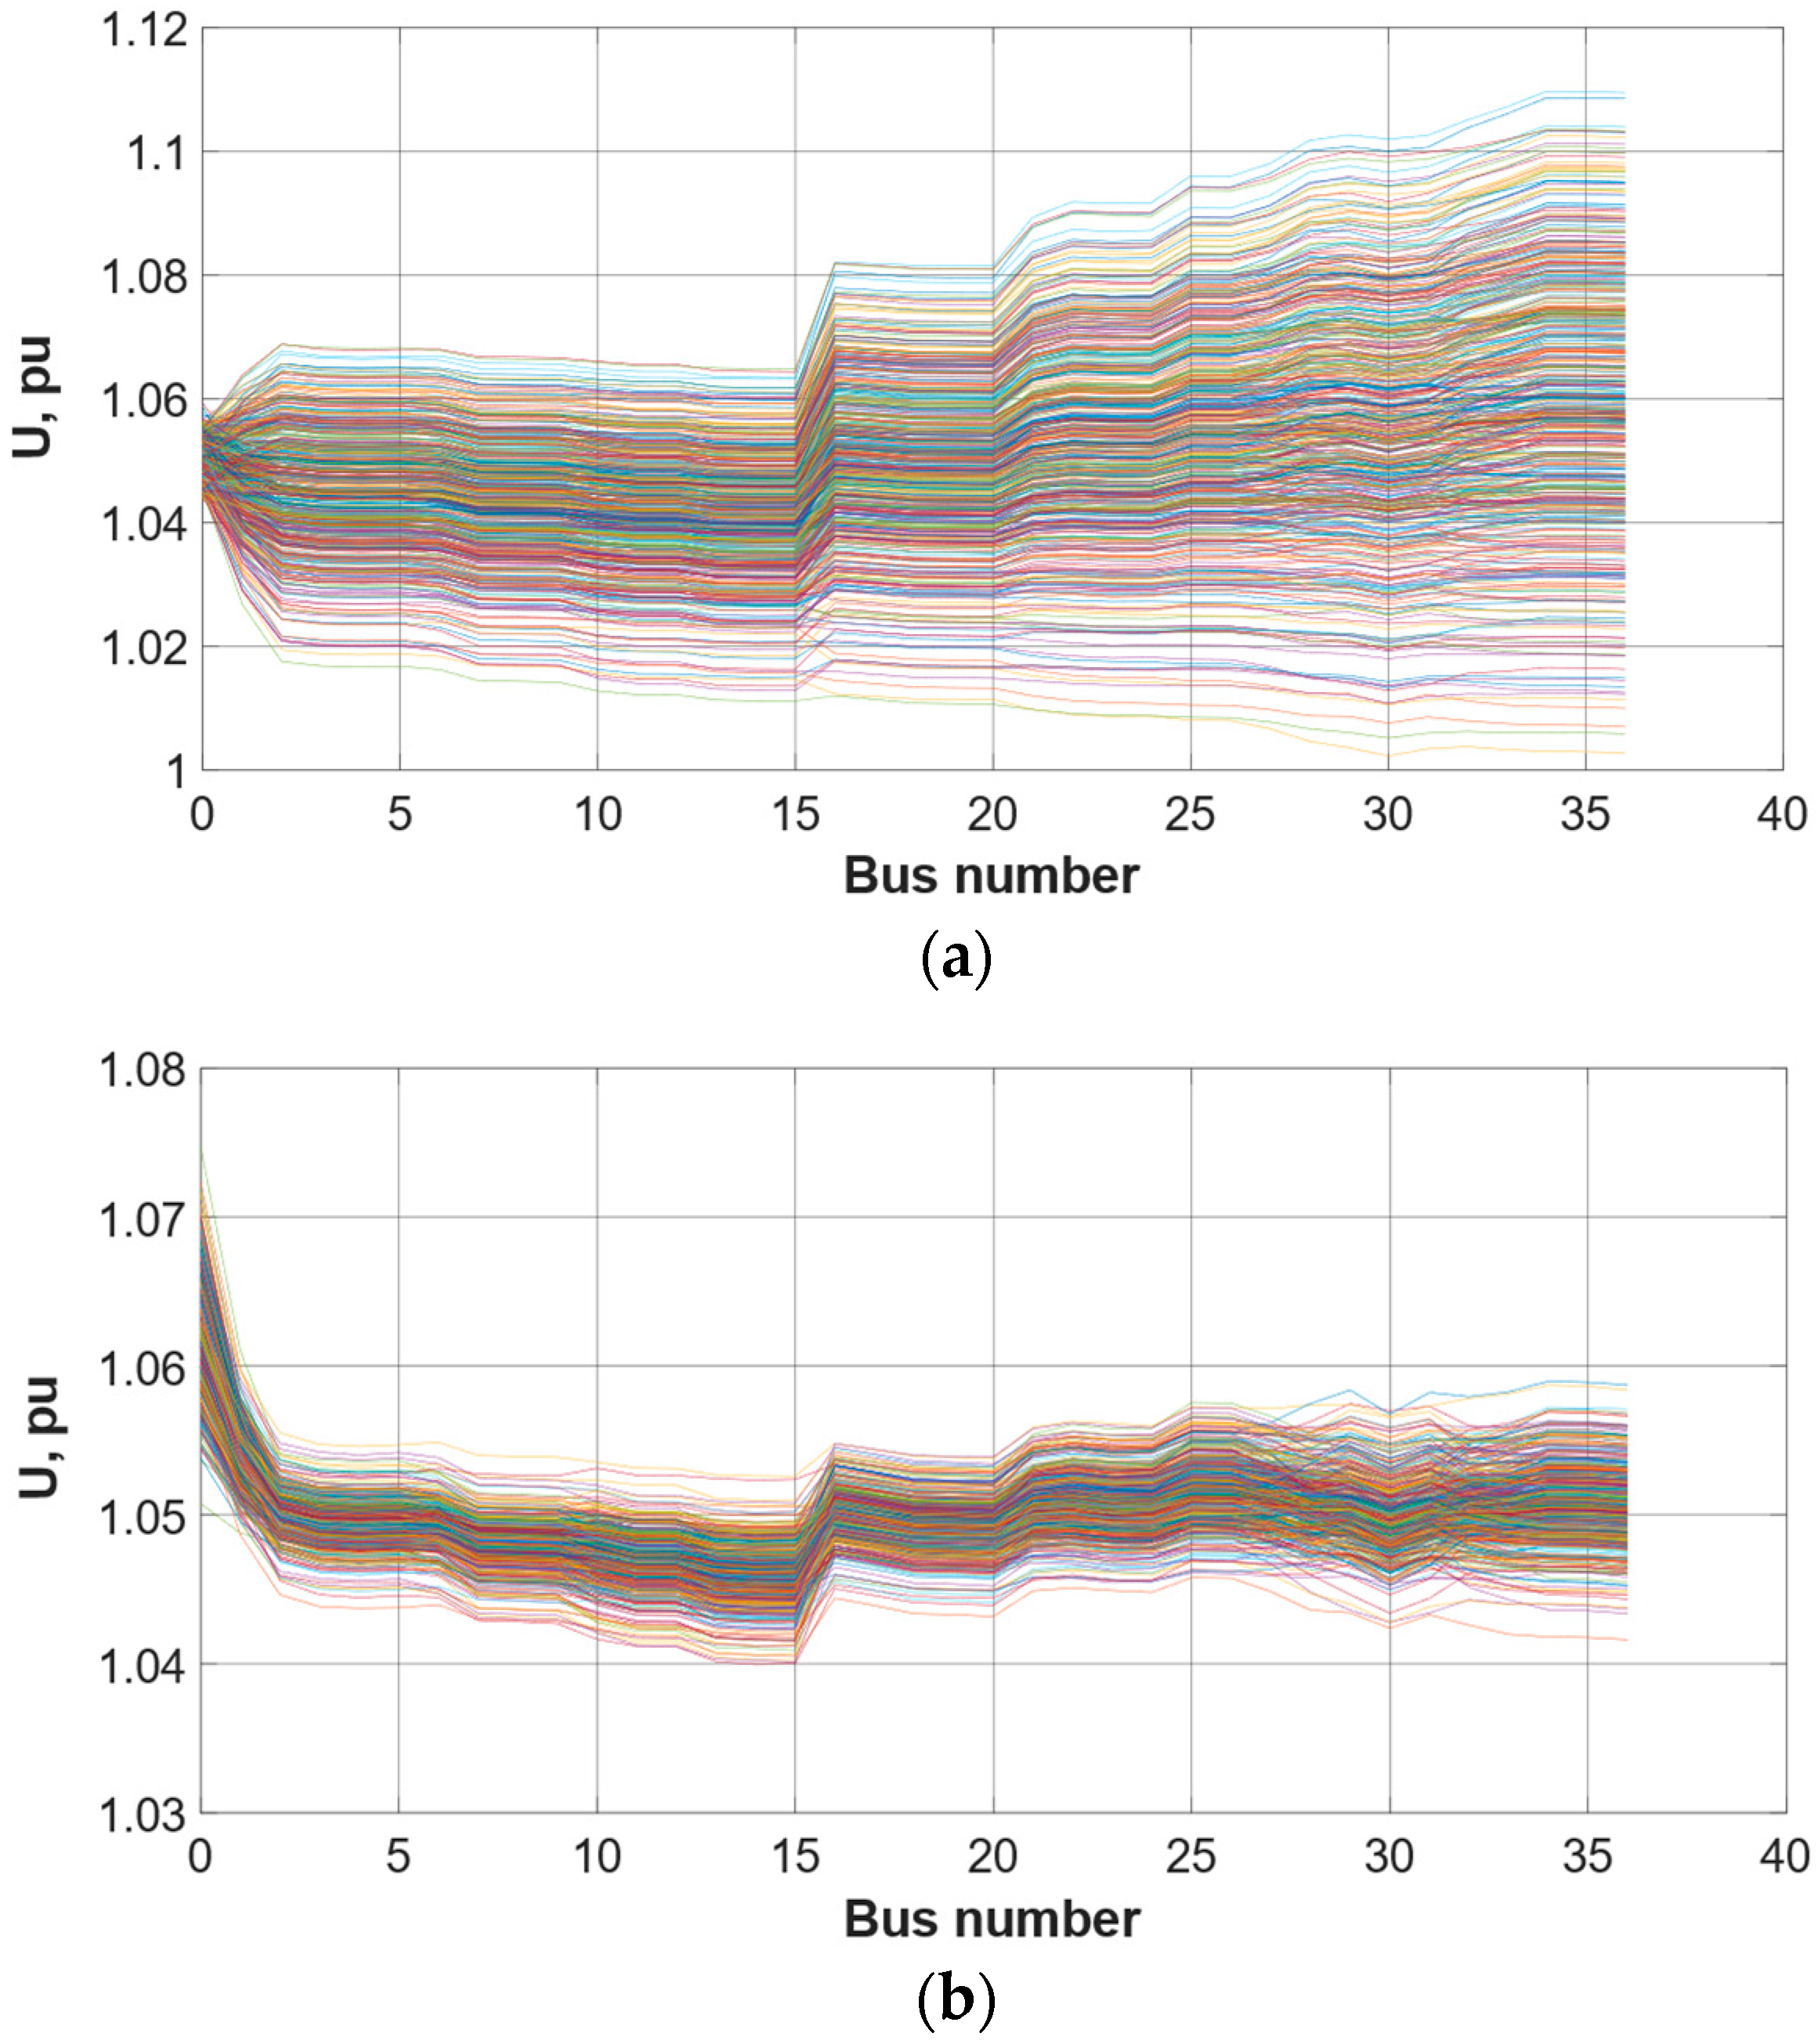
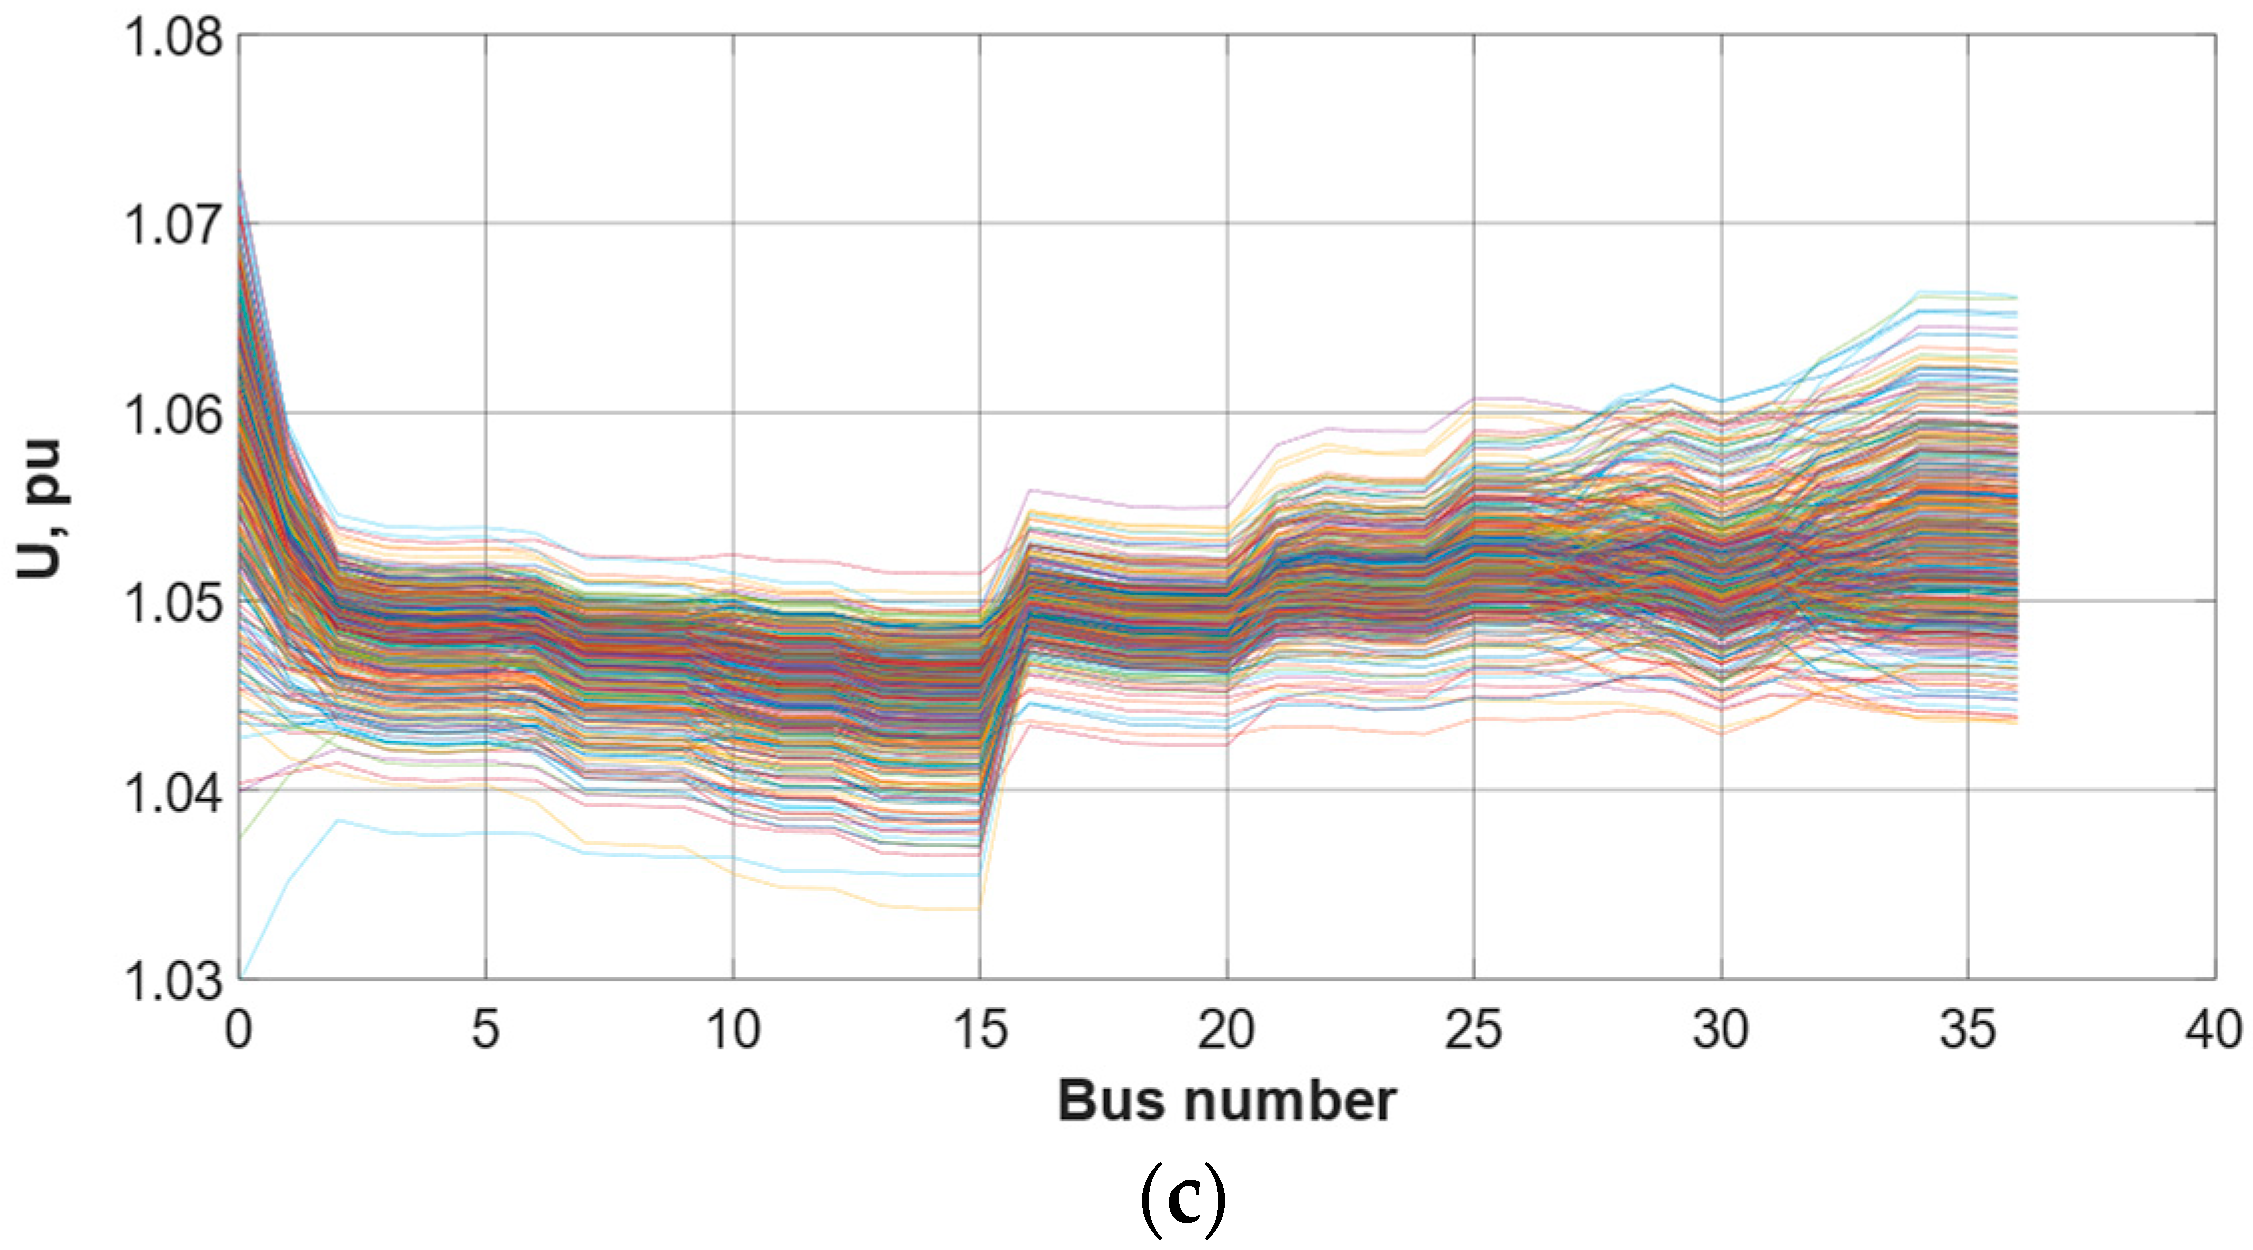
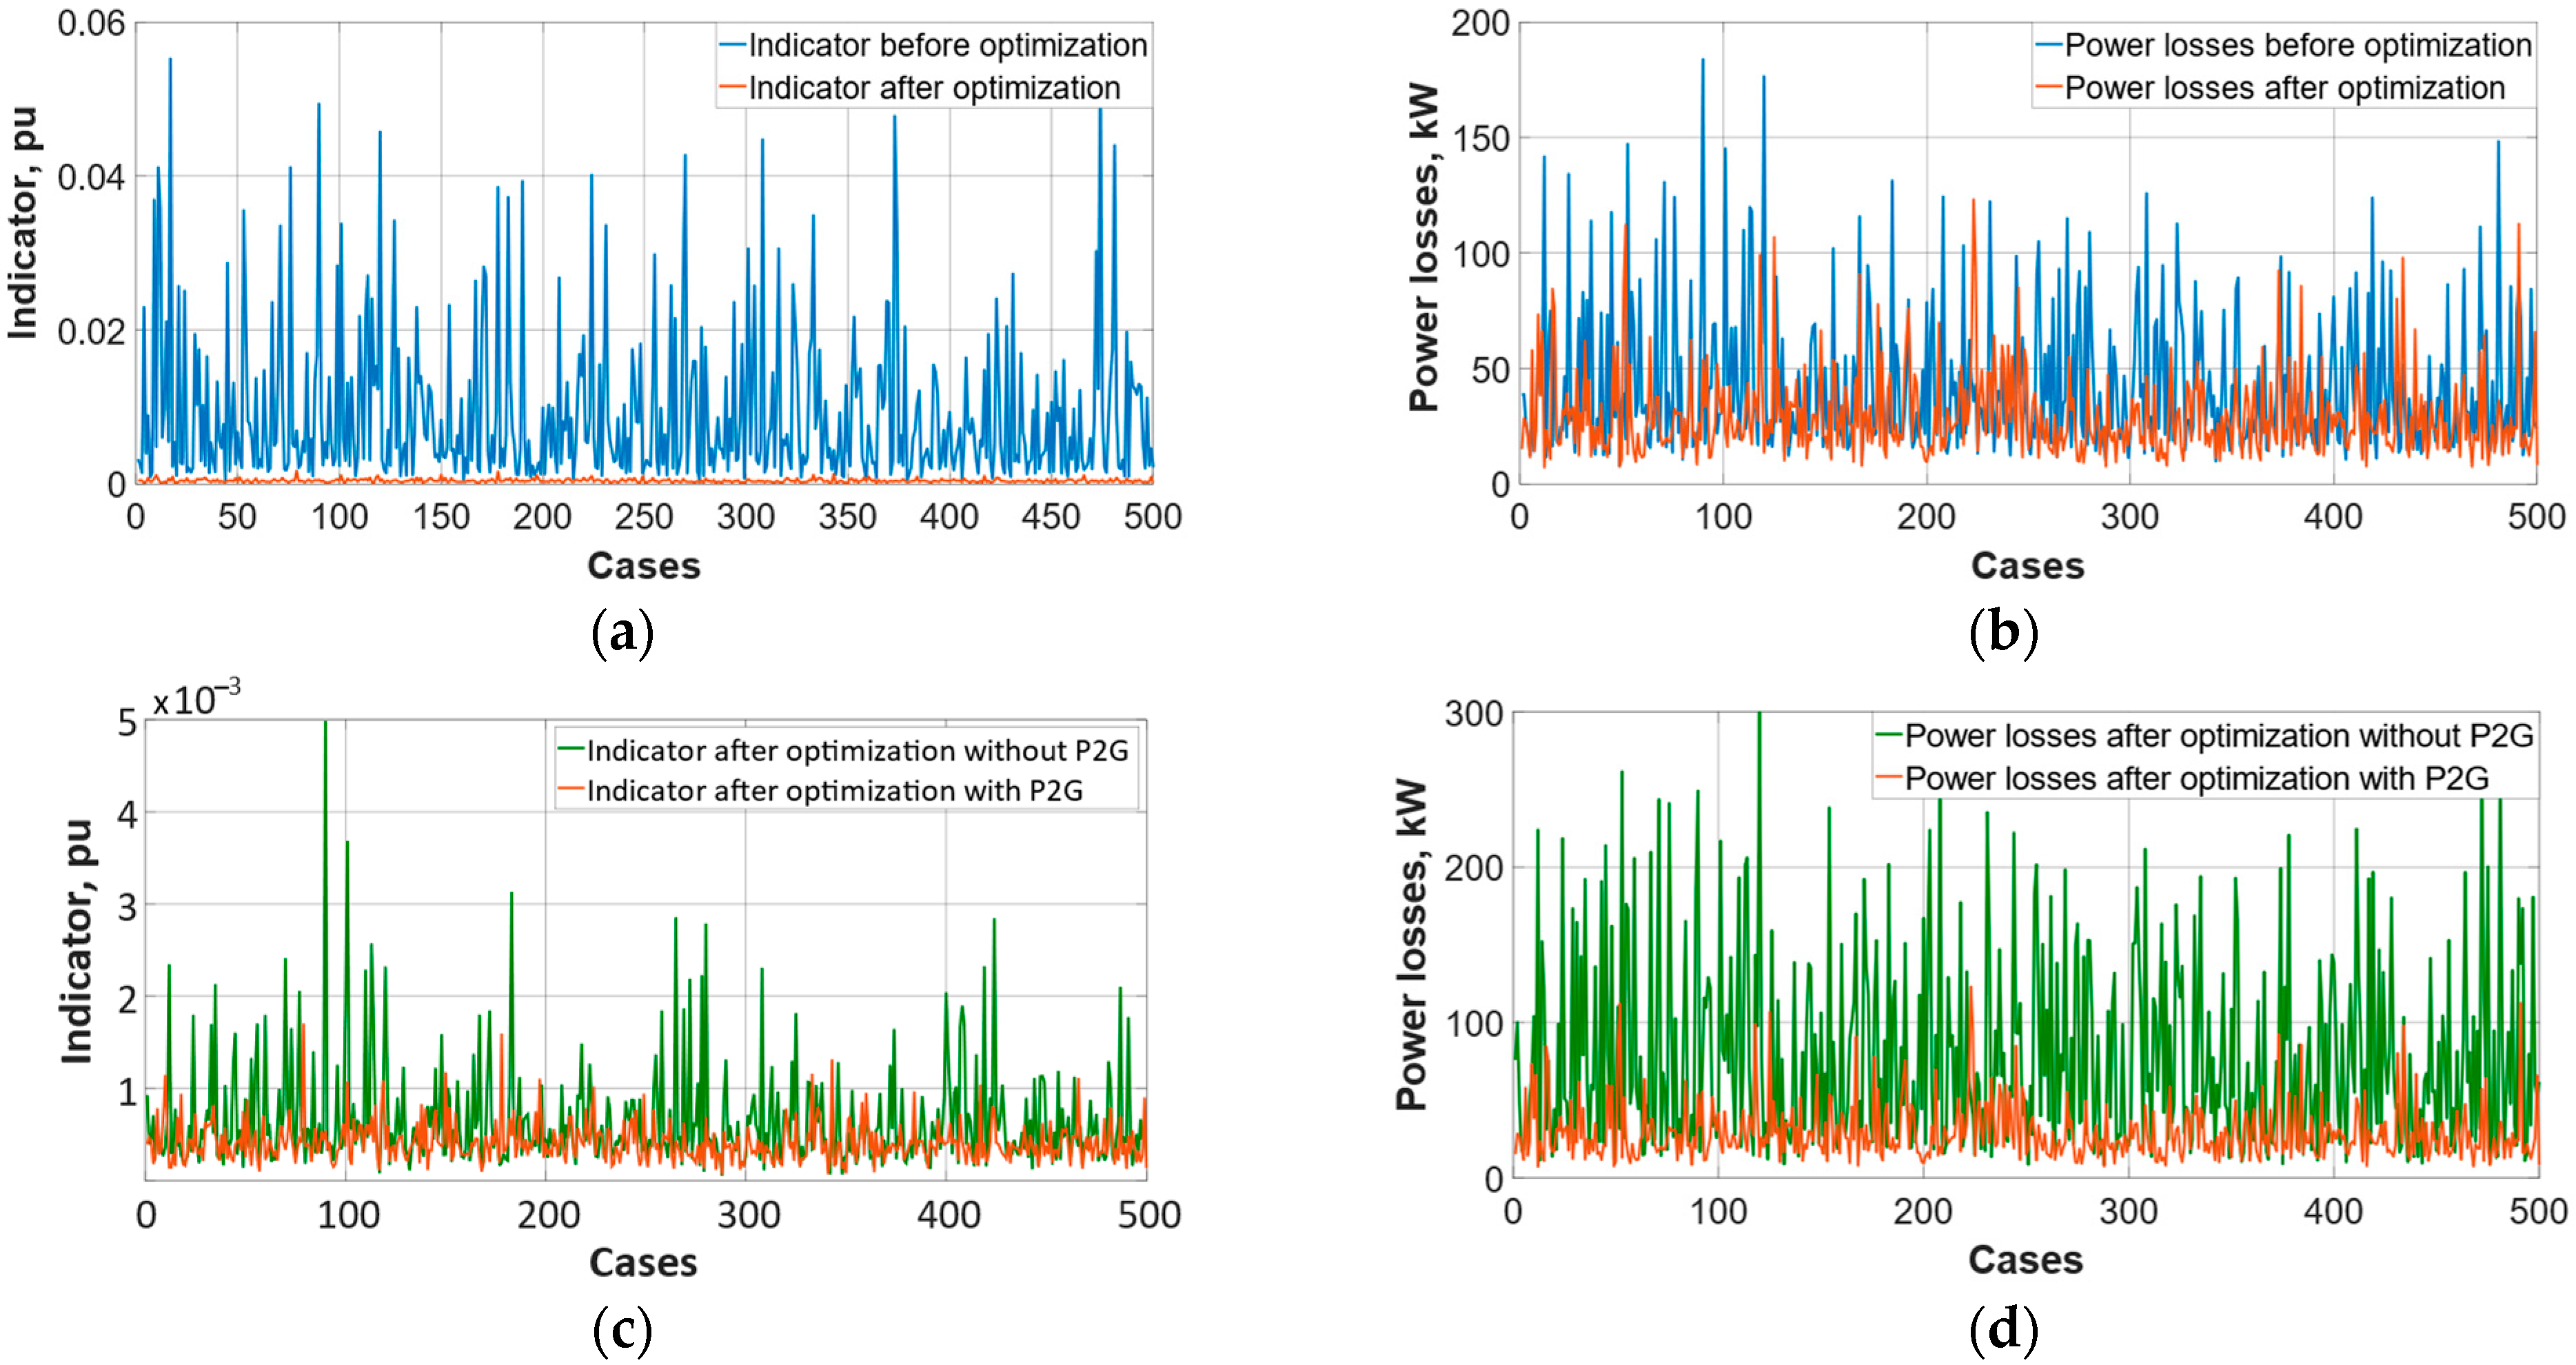
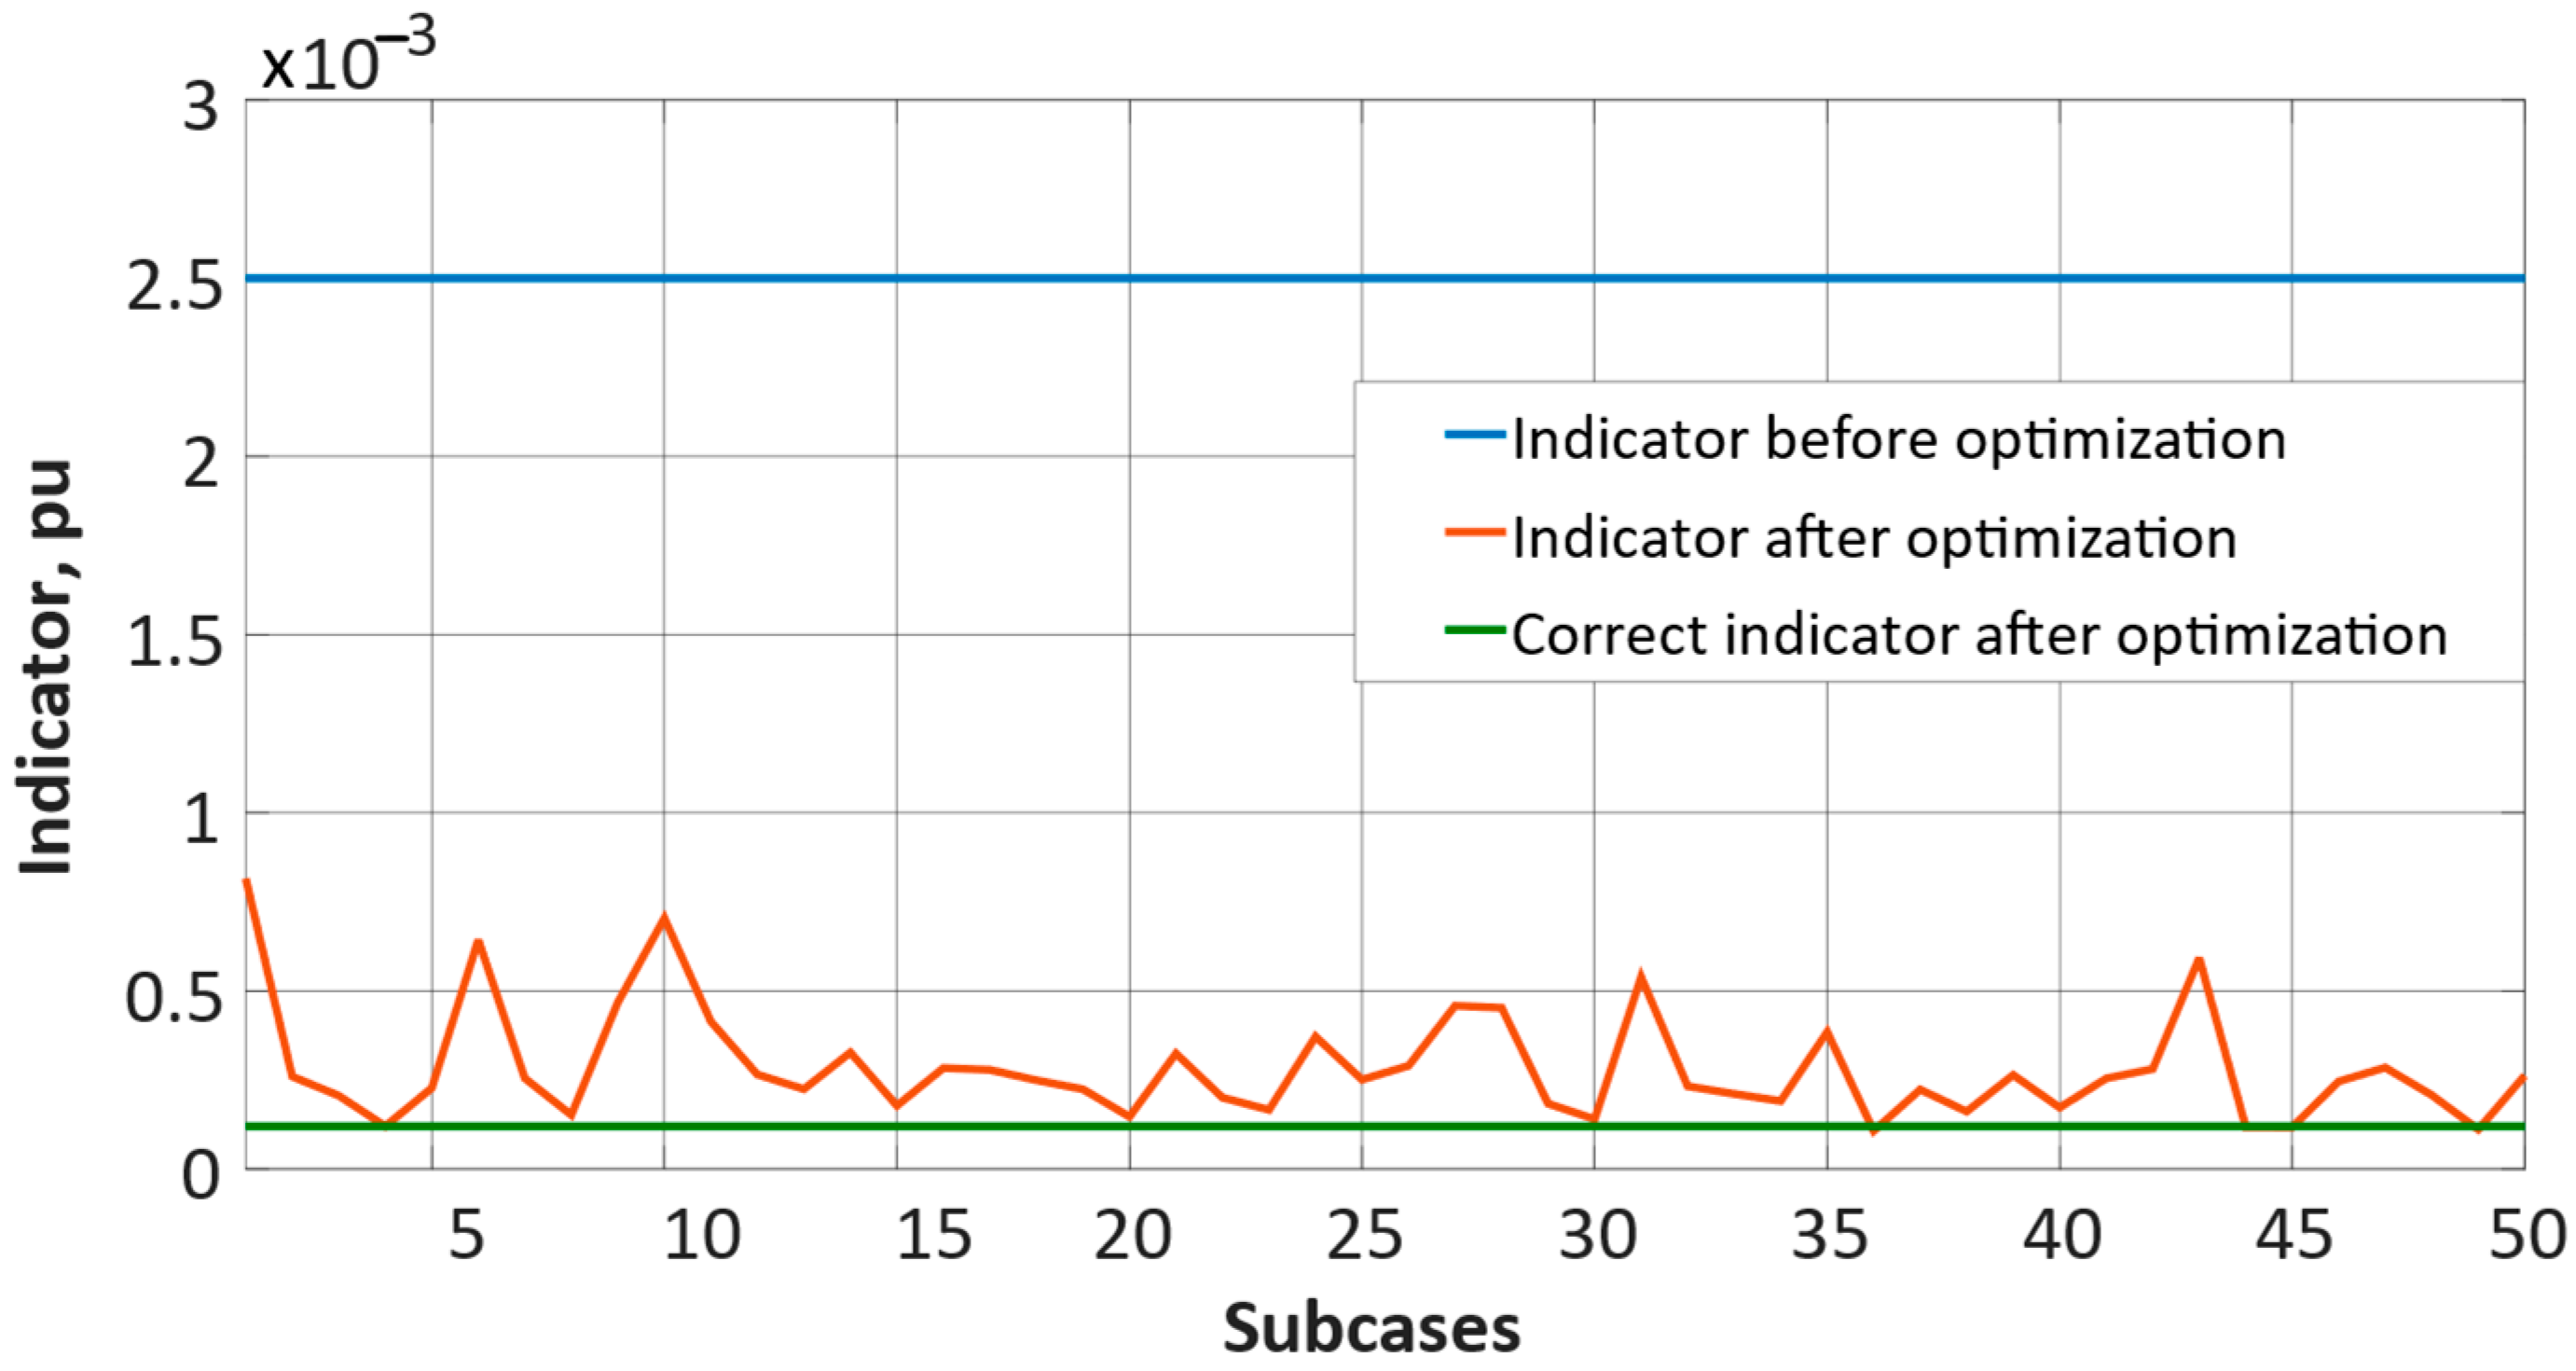
5. Results of Voltage Optimization in MV Networks
- without optimization, for a reference case (straight line, blue color);
- after optimization, for the reference case, assuming an exact mapping of independent variables in the calculations (straight line, green color);
- after optimization, for fifty subcases of inaccurate transmission of the values of the independent variables, with respect to the reference case.
6. Discussion and Conclusions
Author Contributions
Funding
Institutional Review Board Statement
Informed Consent Statement
Data Availability Statement
Conflicts of Interest
References
- Farkas, C.; Tóth, A.; Orlay, I. Voltage Control Methods in the MV Grid with a Large Share of PV. Int. J. Emerg. Electr. Power Syst. 2019, 20. [Google Scholar] [CrossRef]
- Sigalo, M.B.; Eze, O.K.; Usman, R. Analysis of medium and low voltage distribution network with high level penetration of distributed generators using eracs. Eur. J. Eng. Technol. 2016, 4, 9–23. [Google Scholar]
- Kacejko, P.; Adamek, S.; Wydra, M. Optimal voltage control in distribution networks with dispersed generation. In Proceedings of the 2010 IEEE PES Innovative Smart Grid Technologies Conference Europe (ISGT Europe), Gothenburg, Sweden, 11–13 October 2010; IEEE: Piscataway, NJ, USA, 2010; pp. 1–4, ISBN 978-1-4244-8508-6. [Google Scholar]
- Kacejko, P.; Pijarski, P. Zarządzanie mikroinstalacjami OZE—Realne wyzwanie techniczne, czy tylko impuls marketingowy? [Mangement of microgenerations of renewable energy sources—Technical chalange or the marketing impuls?]. Rynek Energii 2016, 2016, 41–45. [Google Scholar]
- Zhang, D.; Li, J.; Hui, D. Coordinated control for voltage regulation of distribution network voltage regulation by distributed energy storage systems. Prot. Control Mod. Power Syst. 2018, 3, 3. [Google Scholar] [CrossRef]
- Adamek, S. Optimal Voltage Control in Distributed Power Grid with Dispersed Generation. Ph.D. Dissertation, Lublin University of Technology, Lublin, Poland, 2010. [Google Scholar]
- Kot, A. Optimal Voltage Control in Medium Voltage Distribution Networks with Dispersed Generation. Ph.D. Dissertation, AGH University of Science and Technology, Cracow, Poland, 2005. [Google Scholar]
- European Commission. Communication from the Commission to the European Parliament, the Council, the European Economic and Social Committee and the Committee of the Regions: A Hydrogen Strategy for a Climate-Neutral Europe. COM(2020) 301; European Commission: Brussels, Belgium, 2020. [Google Scholar]
- Brauns, J.; Turek, T. Alkaline Water Electrolysis Powered by Renewable Energy: A Review. Processes 2020, 8, 248. [Google Scholar] [CrossRef] [Green Version]
- Gutiérrez-Martín, F.; Ochoa-Mendoza, A.; Rodríguez-Antón, L.M. Pre-investigation of water electrolysis for flexible energy storage at large scales: The case of the Spanish power system. Int. J. Hydrogen Energy 2015, 40, 5544–5551. [Google Scholar] [CrossRef] [Green Version]
- Hashimoto, K.; Yamasaki, M.; Fujimura, K.; Matsui, T.; Izumiya, K.; Komori, M.; El-Moneim, A.A.; Akiyama, E.; Habazaki, H.; Kumagai, N.; et al. Global CO2 recycling—novel materials and prospect for prevention of global warming and abundant energy supply. Mater. Sci. Eng. A 1999, 267, 200–206. [Google Scholar] [CrossRef]
- Hashimoto, K.; Kumagai, N.; Izumiya, K.; Takano, H.; Kato, Z. The production of renewable energy in the form of methane using electrolytic hydrogen generation. Energy Sustain. Soc. 2014, 4, 17. [Google Scholar] [CrossRef] [Green Version]
- Götz, M.; Lefebvre, J.; Mörs, F.; McDaniel Koch, A.; Graf, F.; Bajohr, S.; Reimert, R.; Kolb, T. Renewable Power-to-Gas: A technological and economic review. Renew. Energy 2016, 85, 1371–1390. [Google Scholar] [CrossRef] [Green Version]
- Eveloy, V.; Gebreegziabher, T. A Review of Projected Power-to-Gas Deployment Scenarios. Energies 2018, 11, 1824. [Google Scholar] [CrossRef] [Green Version]
- Akinyele, D.O.; Rayudu, R.K. Review of energy storage technologies for sustainable power networks. Sustain. Energy Technol. Assess. 2014, 8, 74–91. [Google Scholar] [CrossRef]
- Sarrias-Mena, R.; Fernández-Ramírez, L.M.; García-Vázquez, C.A.; Jurado, F. Electrolyzer models for hydrogen production from wind energy systems. Int. J. Hydrogen Energy 2015, 40, 2927–2938. [Google Scholar] [CrossRef]
- Belderbos, A.; Delarue, E.; D’haeseleer, W. Possible role of power-to-gas in future energy systems. In Proceedings of the 2015 12th International Conference on the European Energy Market (EEM), Lisbon, Portugal, 19–22 May 2015; IEEE: Piscataway, NJ, USA, 2015; pp. 1–5, ISBN 978-1-4673-6692-2. [Google Scholar]
- Mazza, A.; Bompard, E.; Chicco, G. Applications of power to gas technologies in emerging electrical systems. Renew. Sustain. Energy Rev. 2018, 92, 794–806. [Google Scholar] [CrossRef]
- Jentsch, M.; Trost, T.; Sterner, M. Optimal Use of Power-to-Gas Energy Storage Systems in an 85% Renewable Energy Scenario. Energy Procedia 2014, 46, 254–261. [Google Scholar] [CrossRef]
- Park, C.; Bigler, F.; Korba, P. Power-to-Gas Concept for Integration of Increased Photovoltaic Generation into the Distribution. Energy Procedia 2016, 99, 411–417. [Google Scholar] [CrossRef] [Green Version]
- Pleßmann, G.; Erdmann, M.; Hlusiak, M.; Breyer, C. Global Energy Storage Demand for a 100% Renewable Electricity Supply. Energy Procedia 2014, 46, 22–31. [Google Scholar] [CrossRef] [Green Version]
- Johnson, J.X.; de Kleine, R.; Keoleian, G.A. Assessment of energy storage for transmission-constrained wind. Appl. Energy 2014, 124, 377–388. [Google Scholar] [CrossRef]
- Bailera, M.; Lisbona, P.; Romeo, L.M.; Espatolero, S. Power to Gas projects review: Lab, pilot and demo plants for storing renewable energy and CO2. Renew. Sustain. Energy Rev. 2017, 69, 292–312. [Google Scholar] [CrossRef]
- Gahleitner, G. Hydrogen from renewable electricity: An international review of power-to-gas pilot plants for stationary applications. Int. J. Hydrogen Energy 2013, 38, 2039–2061. [Google Scholar] [CrossRef]
- Mazza, A.; Salomone, F.; Arrigo, F.; Bensaid, S.; Bompard, E.; Chicco, G. Impact of Power-to-Gas on distribution systems with large renewable energy penetration. Energy Convers. Manag. X 2020, 7, 100053. [Google Scholar] [CrossRef]
- Grueger, F.; Möhrke, F.; Robinius, M.; Stolten, D. Early power to gas applications: Reducing wind farm forecast errors and providing secondary control reserve. Appl. Energy 2017, 192, 551–562. [Google Scholar] [CrossRef]
- Simonis, B.; Newborough, M. Sizing and operating power-to-gas systems to absorb excess renewable electricity. Int. J. Hydrogen Energy 2017, 42, 21635–21647. [Google Scholar] [CrossRef]
- Beccali, M.; Brunone, S.; Finocchiaro, P.; Galletto, J.M. Method for size optimisation of large wind–hydrogen systems with high penetration on power grids. Appl. Energy 2013, 102, 534–544. [Google Scholar] [CrossRef] [Green Version]
- Sawas, A.; Farag, H.E.Z. Optimal Sizing of Power–to–Gas Units toward Elevated Renewable Power Penetration. In Proceedings of the 2019 IEEE Canadian Conference of Electrical and Computer Engineering (CCECE), Edmonton, AB, Canada, 5–8 May 2019; IEEE: Piscataway, NJ, USA, 2019; pp. 1–4, ISBN 978-1-7281-0319-8. [Google Scholar]
- Diaz de Cerio Mendaza, I.; Bhattarai, B.P.; Kouzelis, K.; Pillai, J.R.; Bak-Jensen, B.; Jensen, A. Optimal sizing and placement of power-to-gas systems in future active distribution networks. In Proceedings of the 2015 IEEE Innovative Smart Grid Technologies—Asia (ISGT ASIA), Bangkok, Thailand, 3–6 November 2015; IEEE: Piscataway, NJ, USA, 2015; pp. 1–6, ISBN 978-1-5090-1238-1. [Google Scholar]
- Robinius, M.; Raje, T.; Nykamp, S.; Rott, T.; Müller, M.; Grube, T.; Katzenbach, B.; Küppers, S.; Stolten, D. Power-to-Gas: Electrolyzers as an alternative to network expansion—An example from a distribution system operator. Appl. Energy 2018, 210, 182–197. [Google Scholar] [CrossRef]
- Buttler, A.; Spliethoff, H. Current status of water electrolysis for energy storage, grid balancing and sector coupling via power-to-gas and power-to-liquids: A review. Renew. Sustain. Energy Rev. 2018, 82, 2440–2454. [Google Scholar] [CrossRef]
- Liu, X.; Aichhorn, A.; Liu, L.; Li, H. Coordinated Control of Distributed Energy Storage System With Tap Changer Transformers for Voltage Rise Mitigation Under High Photovoltaic Penetration. IEEE Trans. Smart Grid 2012, 3, 897–906. [Google Scholar] [CrossRef]
- Reihani, E.; Sepasi, S.; Roose, L.R.; Matsuura, M. Energy management at the distribution grid using a Battery Energy Storage System (BESS). Int. J. Electr. Power Energy Syst. 2016, 77, 337–344. [Google Scholar] [CrossRef]
- Teng, J.-H.; Luan, S.-W.; Lee, D.-J.; Huang, Y.-Q. Optimal Charging/Discharging Scheduling of Battery Storage Systems for Distribution Systems Interconnected With Sizeable PV Generation Systems. IEEE Trans. Power Syst. 2013, 28, 1425–1433. [Google Scholar] [CrossRef]
- El-Taweel, N.A.; Khani, H.; Farag, H.E.Z. Voltage regulation in active power distribution systems integrated with natural gas grids using distributed electric and gas energy resources. Int. J. Electr. Power Energy Syst. 2019, 106, 561–571. [Google Scholar] [CrossRef]
- Dalmau, A.R.; Perez, D.M.; Diaz de Cerio Mendaza, I.; Pillai, J.R. Decentralized voltage control coordination of on-load tap changer transformers, distributed generation units and flexible loads. In Proceedings of the 2015 IEEE Innovative Smart Grid Technologies—Asia (ISGT ASIA), Bangkok, Thailand, 3–6 November 2015; IEEE: Piscataway, NJ, USA, 2015; pp. 1–6, ISBN 978-1-5090-1238-1. [Google Scholar]
- Han, X.; Kosek, A.M.; Morales Bondy, D.E.; Bindner, H.W.; You, S.; Tackie, D.V.; Mehmedalic, J.; Thordarson, F. Assessment of distribution grid voltage control strategies in view of deployment. In Proceedings of the 2014 IEEE International Workshop on Intelligent Energy Systems (IWIES), San Diego, CA, USA, 8 October 2014; IEEE: Piscataway, NJ, USA, 2014; pp. 46–51, ISBN 978-1-4799-5857-3. [Google Scholar]
- Estermann, T.; Newborough, M.; Sterner, M. Power-to-gas systems for absorbing excess solar power in electricity distribution networks. Int. J. Hydrogen Energy 2016, 41, 13950–13959. [Google Scholar] [CrossRef]
- Artale, G.; Caravello, G.; Cataliotti, A.; Cosentino, V.; Di Cara, D.; Guaiana, S.; Nguyen Quang, N.; Palmeri, M.; Panzavecchia, N.; Tinè, G. A Virtual Tool for Load Flow Analysis in a Micro-Grid. Energies 2020, 13, 3173. [Google Scholar] [CrossRef]
- Coletta, G.; Laso, A.; Jonsdottir, G.M.; Manana, M.; Villacci, D.; Vaccaro, A.; Milano, F. On-Line Control of DERs to Enhance the Dynamic Thermal Rating of Transmission Lines. IEEE Trans. Sustain. Energy 2020, 11, 2836–2844. [Google Scholar] [CrossRef]
- Jean Philippe, W.P.; Eftekharnejad, S.; Ghosh, P.K. Development of a new voltage stability index and its implementation considering voltage measurement uncertainty. IET Gener. Transm. Distrib. 2019, 13, 4011–4020. [Google Scholar] [CrossRef]
- IEC 60038: IEC Standard Voltages; International Electrotechnical Commission (IEC): Geneva, Switzerland, 2009.
- EN 50160: Voltage Characteristics of Electricity Supplied by Public Distribution Network; PKN: Warsaw, Poland, 2019.
- Dib, M.; Ramzi, M.; Nejmi, A. Voltage regulation in the medium voltage distribution grid in the presence of renewable energy sources. Mater. Today Proc. 2019, 13, 739–745. [Google Scholar] [CrossRef]
- Guo, Y.; Wu, Q.; Gao, H.; Shen, F. Distributed voltage regulation of smart distribution networks: Consensus-based information synchronization and distributed model predictive control scheme. Int. J. Electr. Power Energy Syst. 2019, 111, 58–65. [Google Scholar] [CrossRef]
- Małkowski, R.; Izdebski, M.; Miller, P. Adaptive Algorithm of a Tap-Changer Controller of the Power Transformer Supplying the Radial Network Reducing the Risk of Voltage Collapse. Energies 2020, 13, 5403. [Google Scholar] [CrossRef]
- Murty, P.S.R. Power Systems Analysis; Elsevier Science: Saint Louis, MO, USA, 2017; ISBN 9780081011119. [Google Scholar]
- Salam, M.A. Fundamentals of Electrical Power Systems Analysis; Springer: Singapore, 2020; ISBN 978-981-15-3211-5. [Google Scholar]
- Zhu, J. Optimization of Power System Operation, 2nd ed.; Wiley: Hoboken, NJ, USA; IEEE Press: Piscataway, NJ, USA, 2015; ISBN 9781118887004. [Google Scholar]
- Ebeed, M.; Kamel, S.; Jurado, F. Optimal Power Flow Using Recent Optimization Techniques. In Classical and Recent Aspects of Power System Optimization; Elsevier: Amsterdam, The Netherlands, 2018; pp. 157–183. ISBN 9780128124413. [Google Scholar]
- Glavitsch, H.; Bacher, R. Optimal Power Flow Algorithms. In Analysis and Control System Techniques for Electric Power Systems, Part 1 of 4; Elsevier: Amsterdam, The Netherlands, 1991; pp. 135–205. ISBN 9780120127412. [Google Scholar]
- Pijarski, P.D. Optymalizacja Heurystyczna w Ocenie Warunków Pracy i Planowaniu Rozwoju Systemu Elektroenergetycznego [Heuristic Optimization in the Assessment of Operating Conditions and Development Planning of the Power System]; Wydawnictwo Politechniki Lubelskiej [Lublin University of Technology Publishers]: Lublin, Poland, 2019; ISBN 978-83-7947-349-6. [Google Scholar]
- Kumar, K.; Zindani, D.; Davim, J.P. Optimizing Engineering Problems through Heuristic Techniques; CRC Press: Boca Raton, FL, USA, 2020; ISBN 9781138485365. [Google Scholar]
- Pesaran Hajiabbas, M.; Mohammadi-Ivatloo, B. Optimization of Power System Problems. Methods, Algorithms and MATLAB Codes; Springer Nature: Berlin/Heidelberg, Germany, 2020; ISBN 978-3-030-34049-0. [Google Scholar]
- Radosavljević, J. Metaheuristic Optimization in Power Engineering; The Institution of Engineering and Technology: London, UK, 2018; ISBN 9781785615467. [Google Scholar]
- Swamy, M.N.S. Search and Optimization by Metaheuristics—Techniques and Algorithms Inspired by Nature; Birkhauser Verlag Ag: Basel, Switzerland, 2016; ISBN 978-3-319-41191-0. [Google Scholar]
- Bozorg-Haddad, O.; Solgi, M.; Loaiciga, H.A. Meta-Heuristic and Evolutionary Algorithms for Engineering Optimization; Wiley Blackwell: Chichester, UK, 2017; ISBN 978-1-119-38699-5. [Google Scholar]
- Pijarski, P.; Kacejko, P. A new metaheuristic optimization method: The algorithm of the innovative gunner (AIG). Eng. Optim. 2019, 51, 2049–2068. [Google Scholar] [CrossRef]
- Mirjalili, S.; Mirjalili, S.M.; Lewis, A. Grey Wolf Optimizer. Adv. Eng. Softw. 2014, 69, 46–61. [Google Scholar] [CrossRef] [Green Version]
- Pham, D.T.; Ghanbarzadeh, A.; Koç, E.; Otri, S.; Rahim, S.; Zaidi, M. The Bees Algorithm—A Novel Tool for Complex Optimisation Problems. In Intelligent Production Machines and Systems; Elsevier: Amsterdam, The Netherlands, 2006; pp. 454–459. ISBN 9780080451572. [Google Scholar]
- Kennedy, J.; Eberhart, R. Particle swarm optimization. In Proceedings of the ICNN’95—International Conference on Neural Networks, Perth, WA, Australia, 27 November–1 December 1995; IEEE: Piscataway, NJ, USA, 1995; pp. 1942–1948, ISBN 0-7803-2768-3. [Google Scholar]
- Mirjalili, S. Moth-flame optimization algorithm: A novel nature-inspired heuristic paradigm. Knowl. Based Syst. 2015, 89, 228–249. [Google Scholar] [CrossRef]
- Valsera-Naranjo, E.; Sumper, A.; Villafafila-Robles, R.; Martínez-Vicente, D. Probabilistic Method to Assess the Impact of Charging of Electric Vehicles on Distribution Grids. Energies 2012, 5, 1503–1531. [Google Scholar] [CrossRef] [Green Version]
- Yang, X.-S.; Deb, S. Cuckoo Search via Lévy flights. In Proceedings of the 2009 World Congress on Nature & Biologically Inspired Computing (NaBIC), Coimbatore, India, 9–11 December 2009; IEEE: Piscataway, NJ, USA, 2009; pp. 210–214, ISBN 978-1-4244-5053-4. [Google Scholar]


| Bus No. | Load PL, kW | Voltage before Optimization, U p.u. | Voltage after Optimization, U p.u. | ||
|---|---|---|---|---|---|
| AIG | CS | MFO | |||
| 0 | 0.0 | 1.0503 | 1.0623 | 1.0607 | 1.0601 |
| 1 | 37.9 | 1.0479 | 1.0547 | 1.0518 | 1.0526 |
| 2 | 20.2 | 1.0468 | 1.0509 | 1.0497 | 1.0489 |
| 3 | 289.9 | 1.0460 | 1.0500 | 1.0487 | 1.0480 |
| 4 | 114.4 | 1.0458 | 1.0498 | 1.0483 | 1.0478 |
| 5 | 52.5 | 1.0459 | 1.0499 | 1.0484 | 1.0479 |
| 6 | 17.0 | 1.0455 | 1.0498 | 1.0482 | 1.0478 |
| 7 | 165.1 | 1.0436 | 1.0482 | 1.0466 | 1.0462 |
| 8 | 202.0 | 1.0435 | 1.0481 | 1.0466 | 1.0461 |
| 9 | 28.3 | 1.0434 | 1.0478 | 1.0465 | 1.0461 |
| 10 | 0.0 | 1.0421 | 1.0470 | 1.0457 | 1.0453 |
| 11 | 174.8 | 1.0416 | 1.0465 | 1.0452 | 1.0448 |
| 12 | 26.9 | 1.0416 | 1.0468 | 1.0452 | 1.0448 |
| 13 | 29.0 | 1.0410 | 1.0463 | 1.0447 | 1.0442 |
| 14 | 29.1 | 1.0409 | 1.0462 | 1.0446 | 1.0441 |
| 15 | 178.4 | 1.0409 | 1.0462 | 1.0446 | 1.0441 |
| 16 | 0.0 | 1.0534 | 1.0527 | 1.0500 | 1.0508 |
| 17 | 37.2 | 1.0529 | 1.0522 | 1.0495 | 1.0503 |
| 18 | 196.7 | 1.0524 | 1.0517 | 1.0490 | 1.0498 |
| 19 | 56.3 | 1.0524 | 1.0516 | 1.0490 | 1.0498 |
| 20 | 121.3 | 1.0523 | 1.0516 | 1.0489 | 1.0497 |
| 21 | 65.7 | 1.0565 | 1.0531 | 1.0500 | 1.0514 |
| 22 | 44.1 | 1.0576 | 1.0533 | 1.0501 | 1.0517 |
| 23 | 72.2 | 1.0574 | 1.0532 | 1.0499 | 1.0515 |
| 24 | 95.6 | 1.0574 | 1.0531 | 1.0499 | 1.0515 |
| 25 | 0.0 | 1.0597 | 1.0540 | 1.0505 | 1.0524 |
| 26 | 37.0 | 1.0596 | 1.0539 | 1.0504 | 1.0523 |
| 27 | 70.3 | 1.0599 | 1.0532 | 1.0497 | 1.0515 |
| 28 | 78.1 | 1.0604 | 1.0519 | 1.0484 | 1.0502 |
| 29 | 0.0 | 1.0604 | 1.0513 | 1.0479 | 1.0496 |
| 30 | 257.2 | 1.0588 | 1.0497 | 1.0463 | 1.0480 |
| 31 | 158.2 | 1.0602 | 1.0511 | 1.0478 | 1.0495 |
| 32 | 14.7 | 1.0613 | 1.0515 | 1.0478 | 1.0497 |
| 33 | 234.1 | 1.0619 | 1.0512 | 1.0475 | 1.0494 |
| 34 | 0.0 | 1.0629 | 1.0514 | 1.0475 | 1.0495 |
| 35 | 61.3 | 1.0628 | 1.0514 | 1.0475 | 1.0495 |
| 36 | 118.7 | 1.0626 | 1.0512 | 1.0473 | 1.0493 |
| Gen No. | Power Generation, PG, MW | Reactive Power after Optimization, Mvar | Power Consumed by Electrolyzers MW | ||||
|---|---|---|---|---|---|---|---|
| AIG | CS | MFO | AIG | CS | MFO | ||
| G1 | 0.041 | 0.200 | 0.200 | 0.200 | 0.003 | 0.000 | 0.000 |
| G2 | 0.465 | 0.200 | 0.200 | 0.200 | 0.000 | 0.000 | 0.008 |
| G3 | 1.551 | 0.068 | 0.194 | 0.041 | 0.406 | 0.722 | 0.285 |
| G4 | 0.487 | −0.012 | −0.128 | −0.012 | 0.314 | 0.105 | 0.239 |
| G4 | 0.872 | −0.383 | −0.333 | −0.614 | 0.206 | 0.295 | 0.000 |
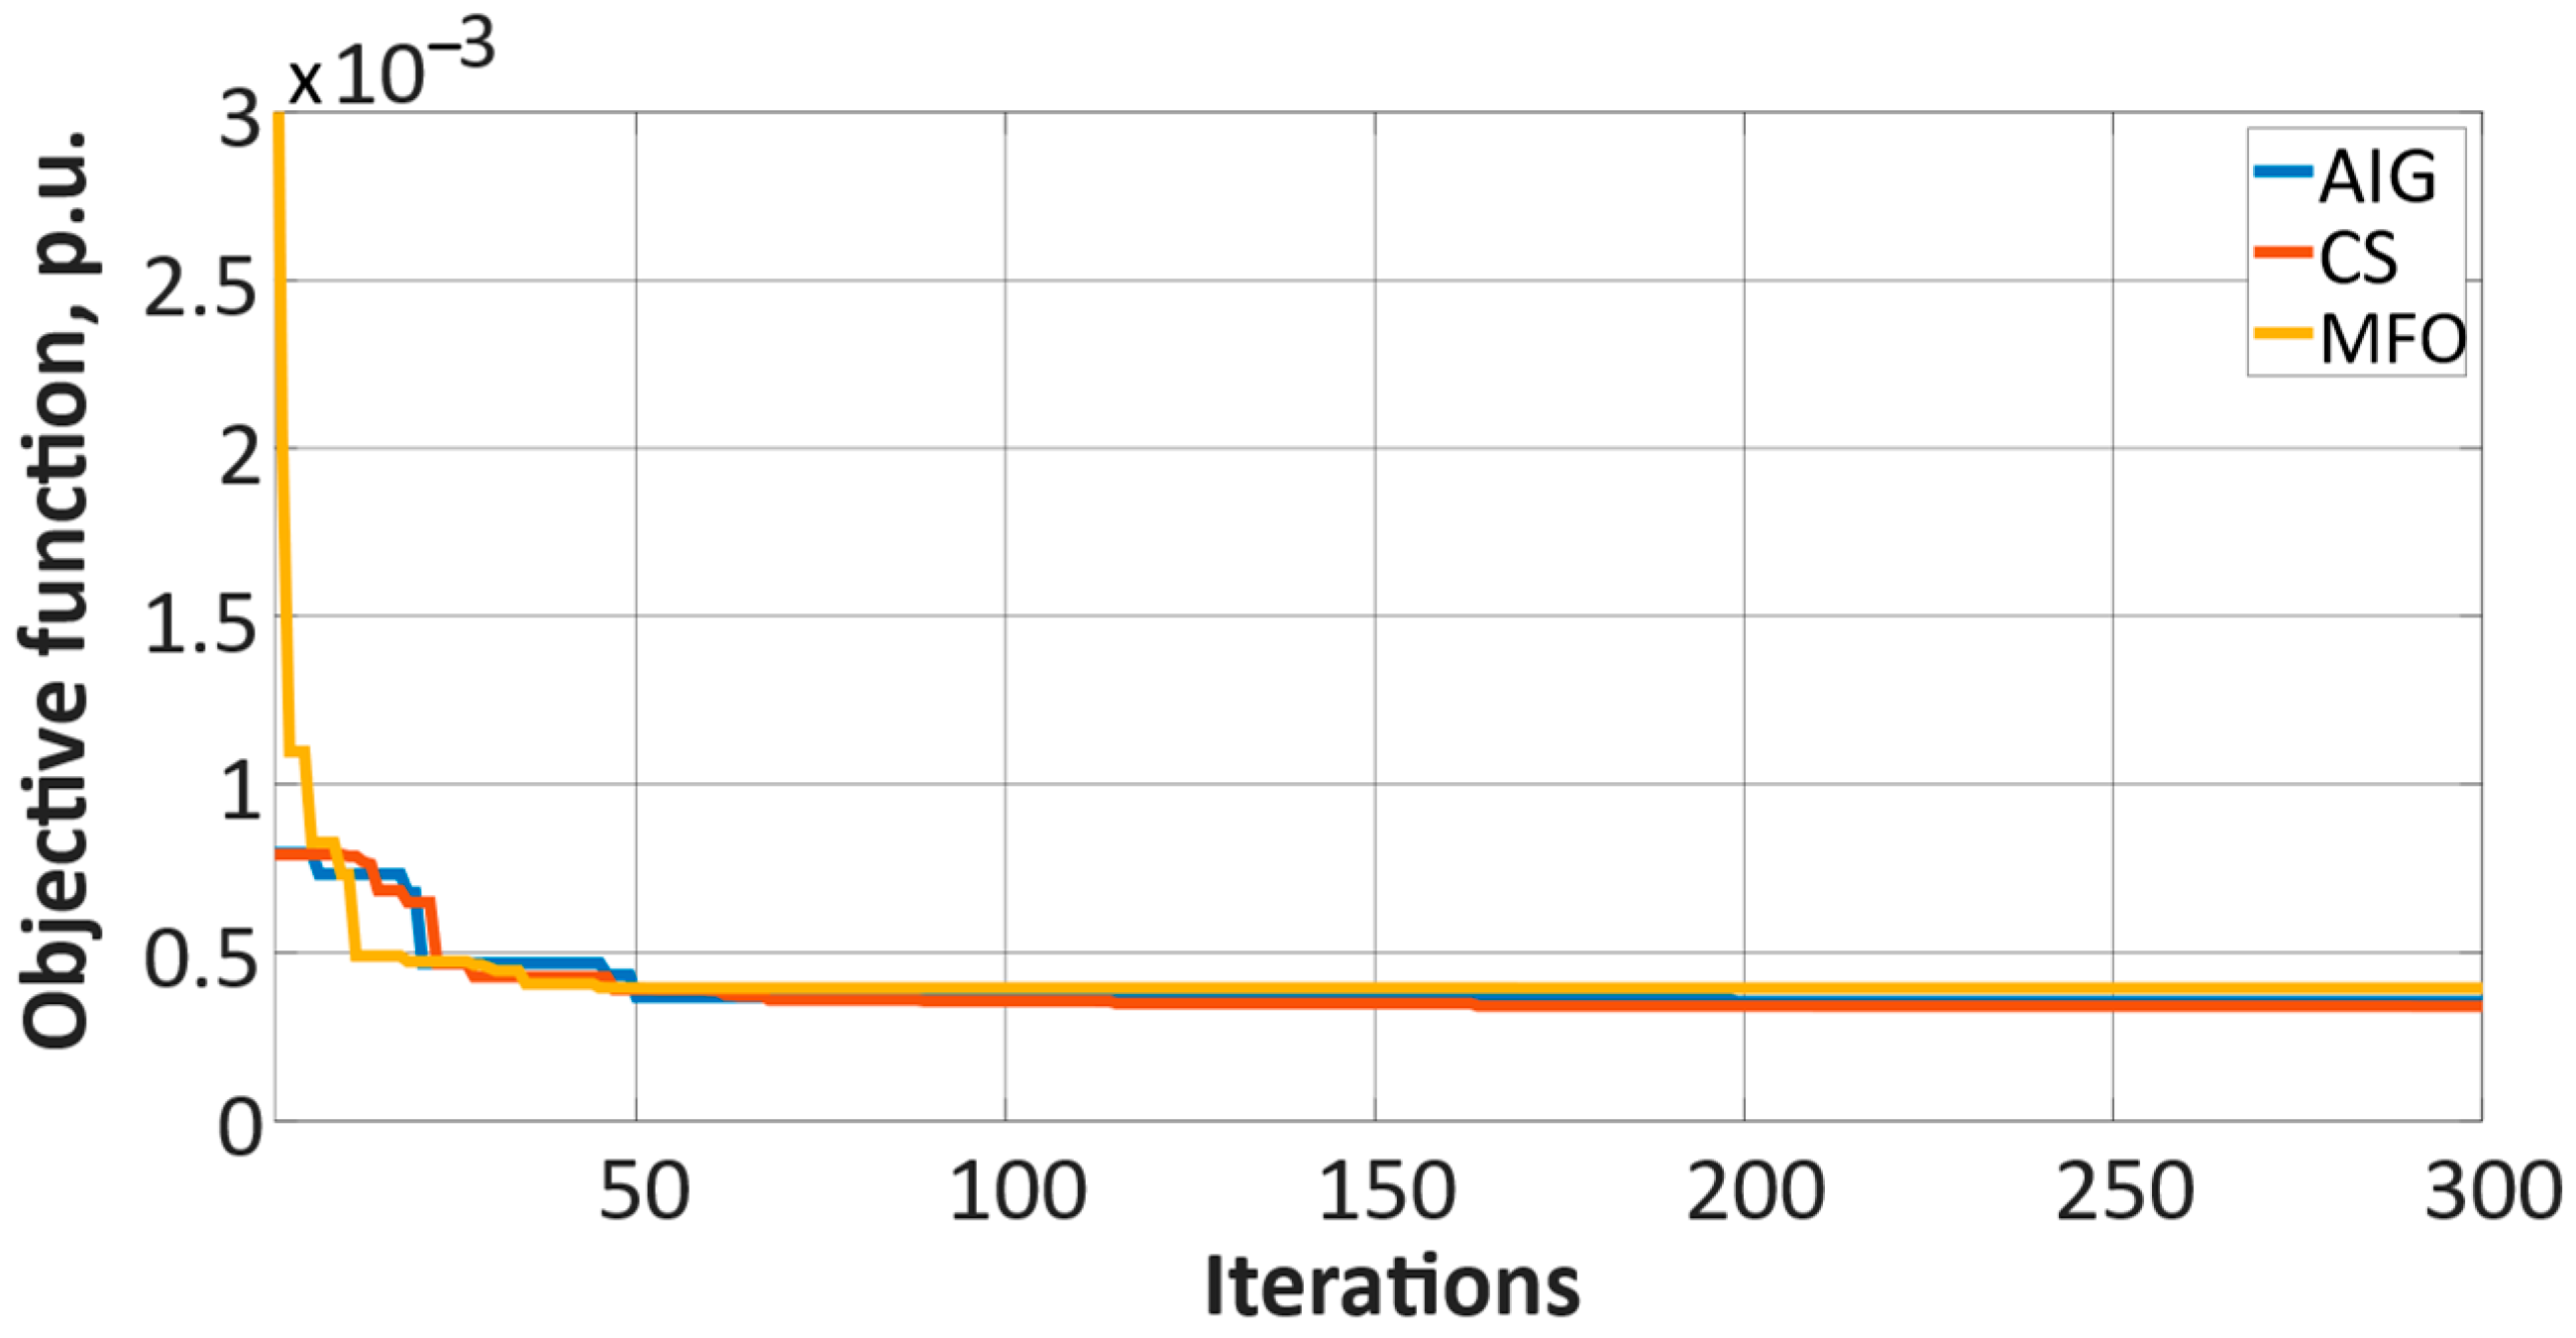
| Heuristic Algorithm | Tap Changer Position | Value of the Objective Function |
|---|---|---|
| AIG | 2 | 0.000378 |
| CS | 2 | 0.000375 |
| MFO | 2 | 0.000380 |
Publisher’s Note: MDPI stays neutral with regard to jurisdictional claims in published maps and institutional affiliations. |
© 2021 by the authors. Licensee MDPI, Basel, Switzerland. This article is an open access article distributed under the terms and conditions of the Creative Commons Attribution (CC BY) license (http://creativecommons.org/licenses/by/4.0/).
Share and Cite
Pijarski, P.; Kacejko, P. Voltage Optimization in MV Network with Distributed Generation Using Power Consumption Control in Electrolysis Installations. Energies 2021, 14, 993. https://doi.org/10.3390/en14040993
Pijarski P, Kacejko P. Voltage Optimization in MV Network with Distributed Generation Using Power Consumption Control in Electrolysis Installations. Energies. 2021; 14(4):993. https://doi.org/10.3390/en14040993
Chicago/Turabian StylePijarski, Paweł, and Piotr Kacejko. 2021. "Voltage Optimization in MV Network with Distributed Generation Using Power Consumption Control in Electrolysis Installations" Energies 14, no. 4: 993. https://doi.org/10.3390/en14040993