
Home Energy Management for Community Microgrids Using Optimal Power Sharing Algorithm


 ,
, 
 ,
,
Abstract
:1. Introduction
- The proposed model and OPSA allow an energy distribution scheme in a locality to be evaluated sharply.
- A model for smart home users with CBSS is established to bypass peak load condition.
- The remote monitoring and real-time energy pricing are enabled with the integration of a state-of-the-art smart metering device into the planned architecture.
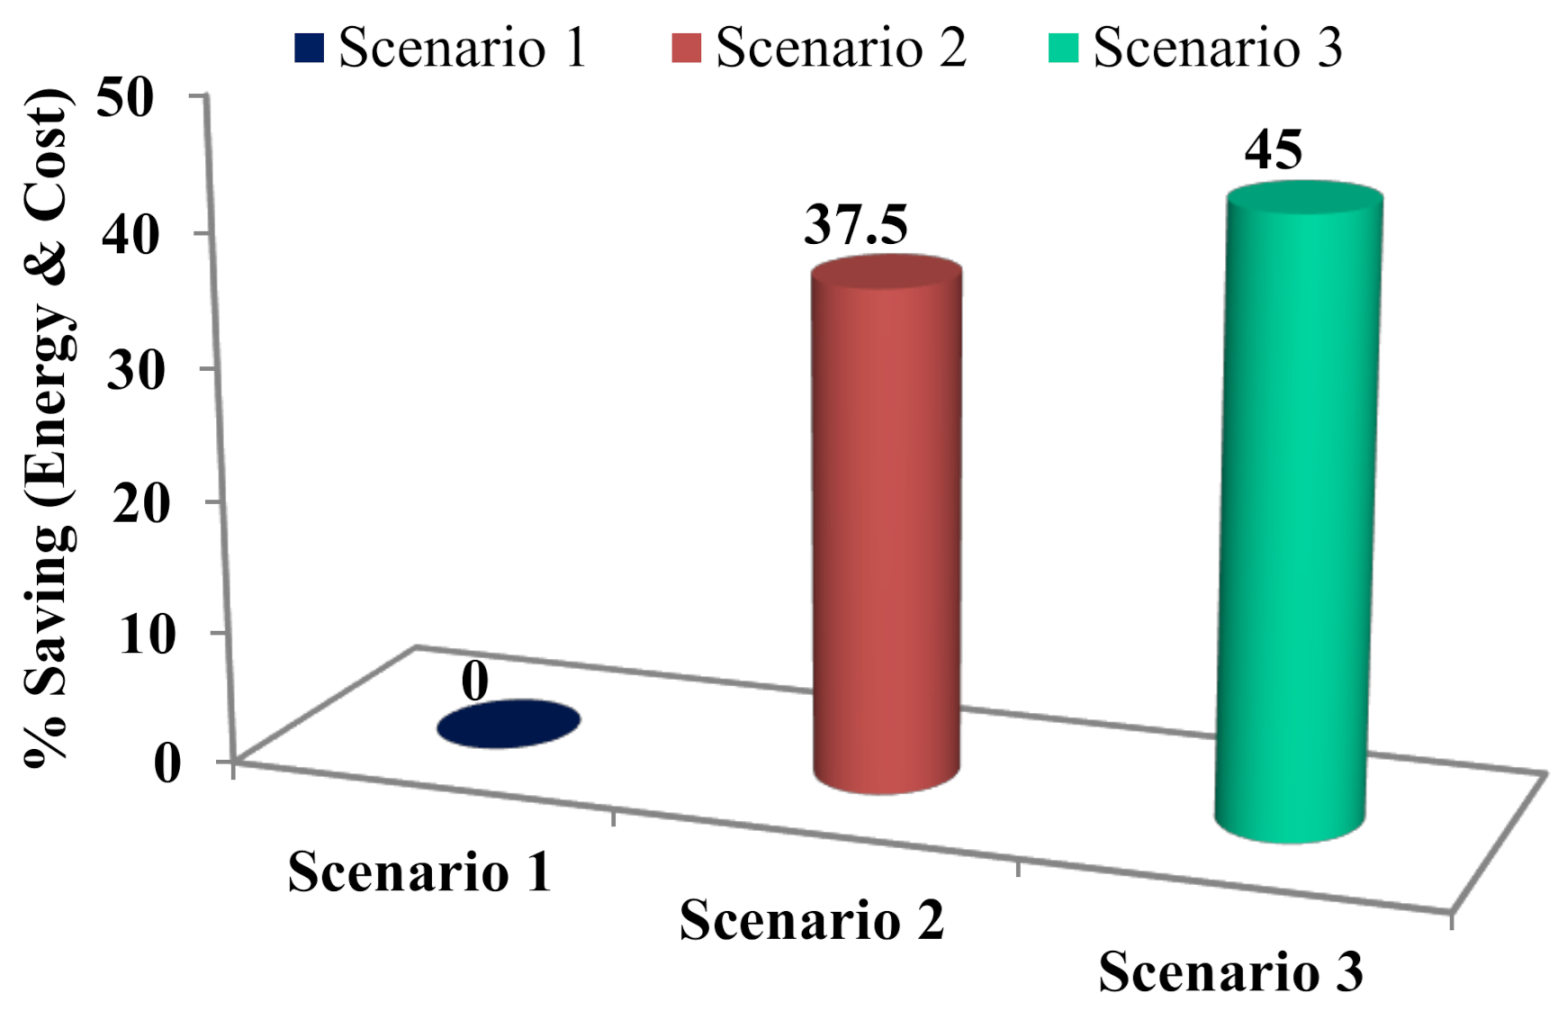
- The proposed approach saves up to 45% in energy costs, as observed from the analysis.
2. Problem Description
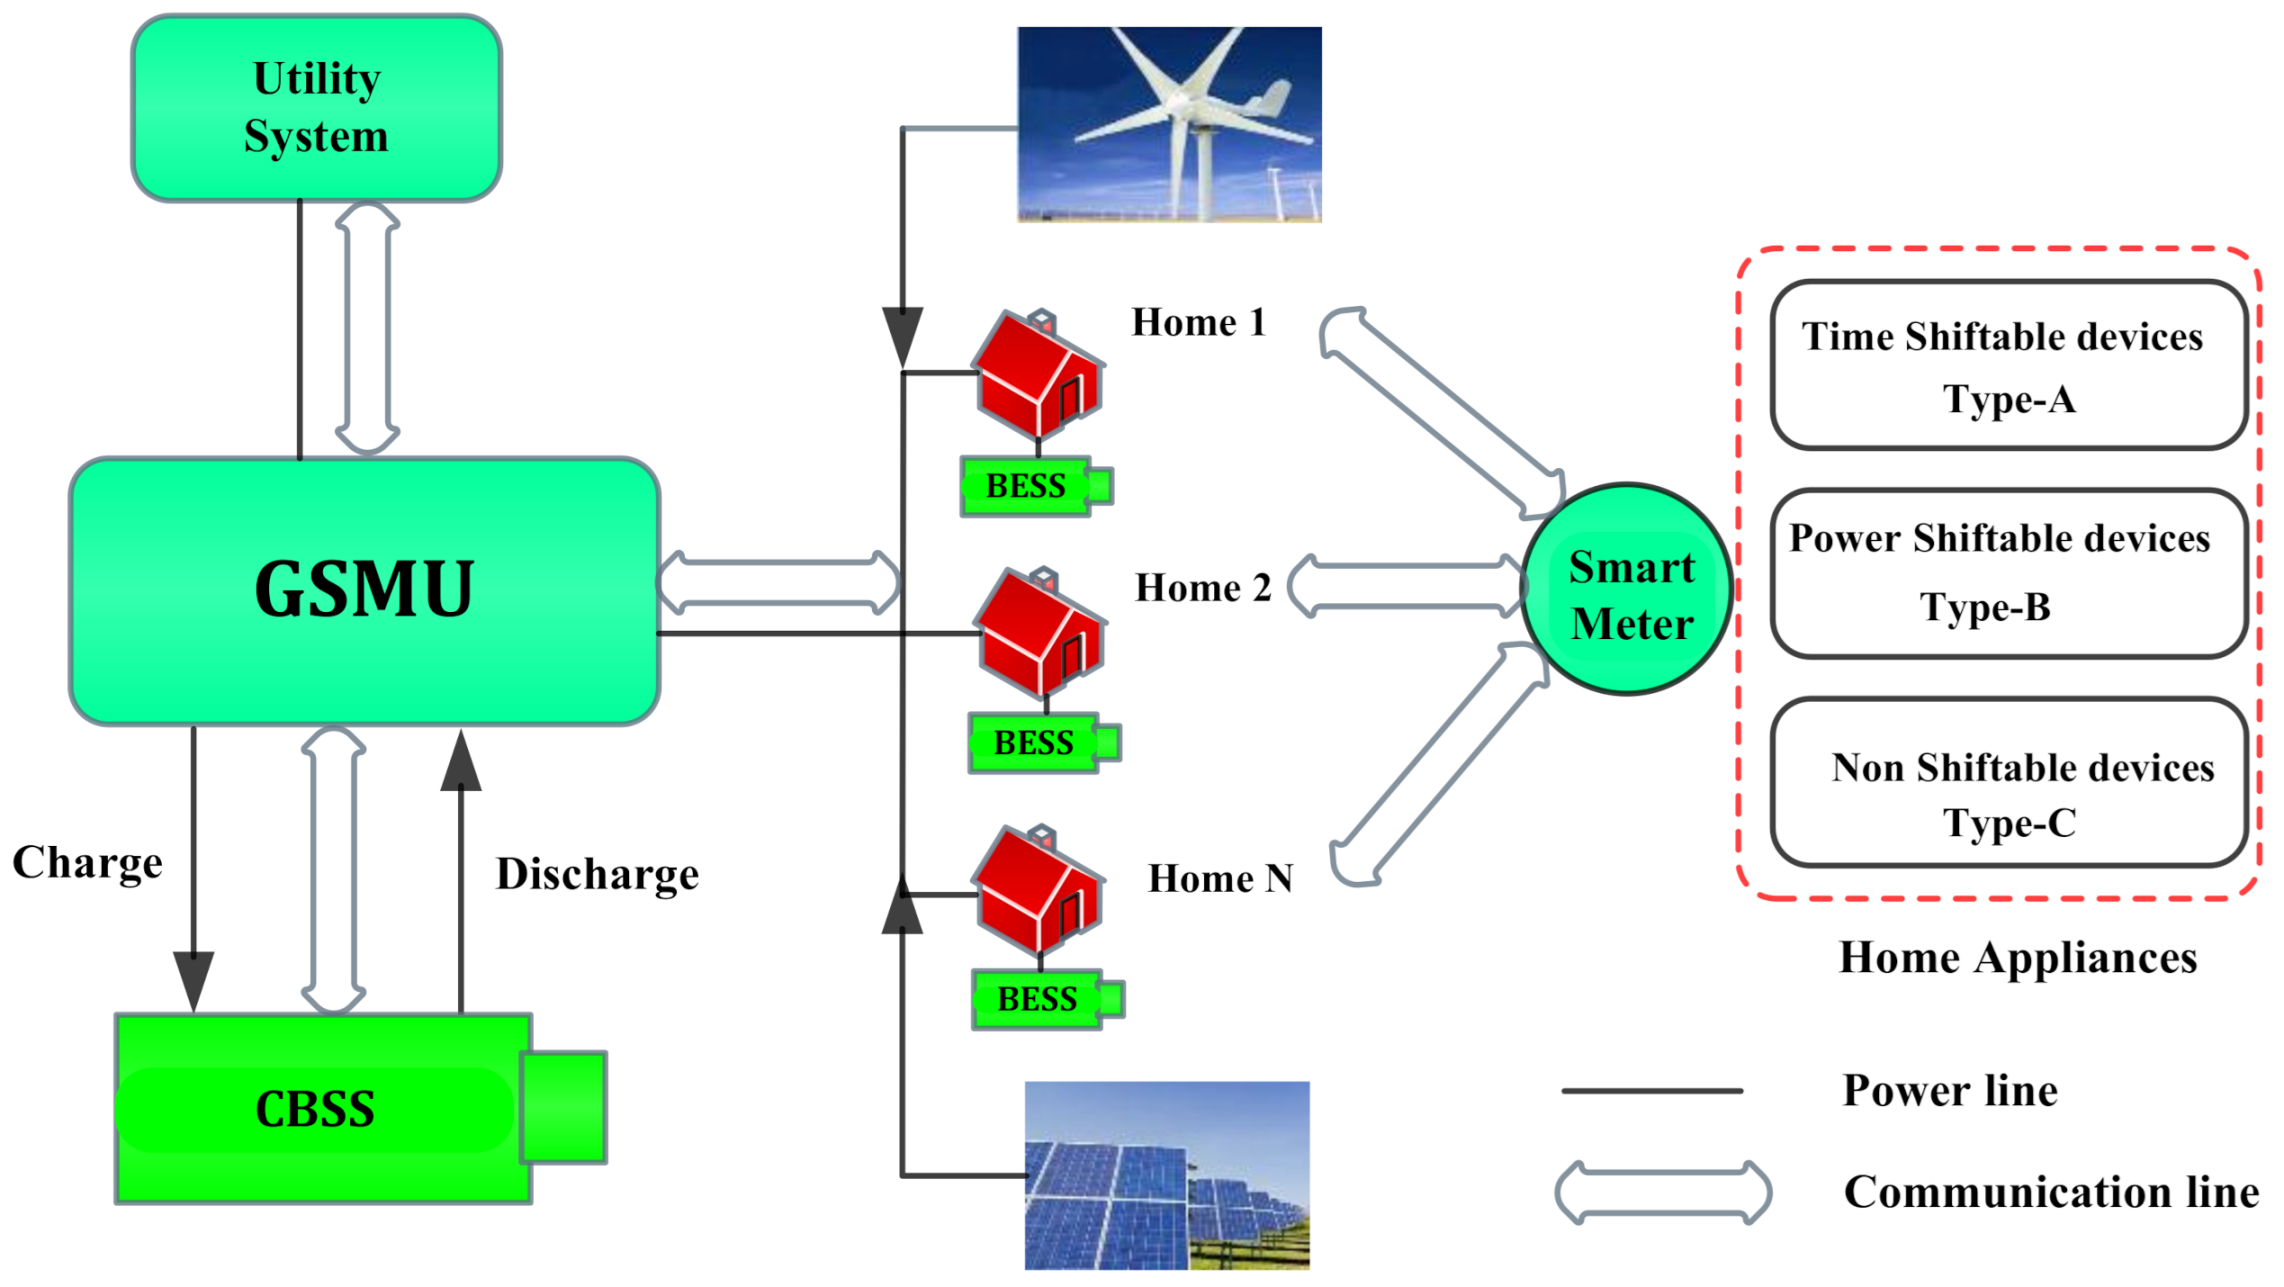
3. System Model
3.1. Design Components
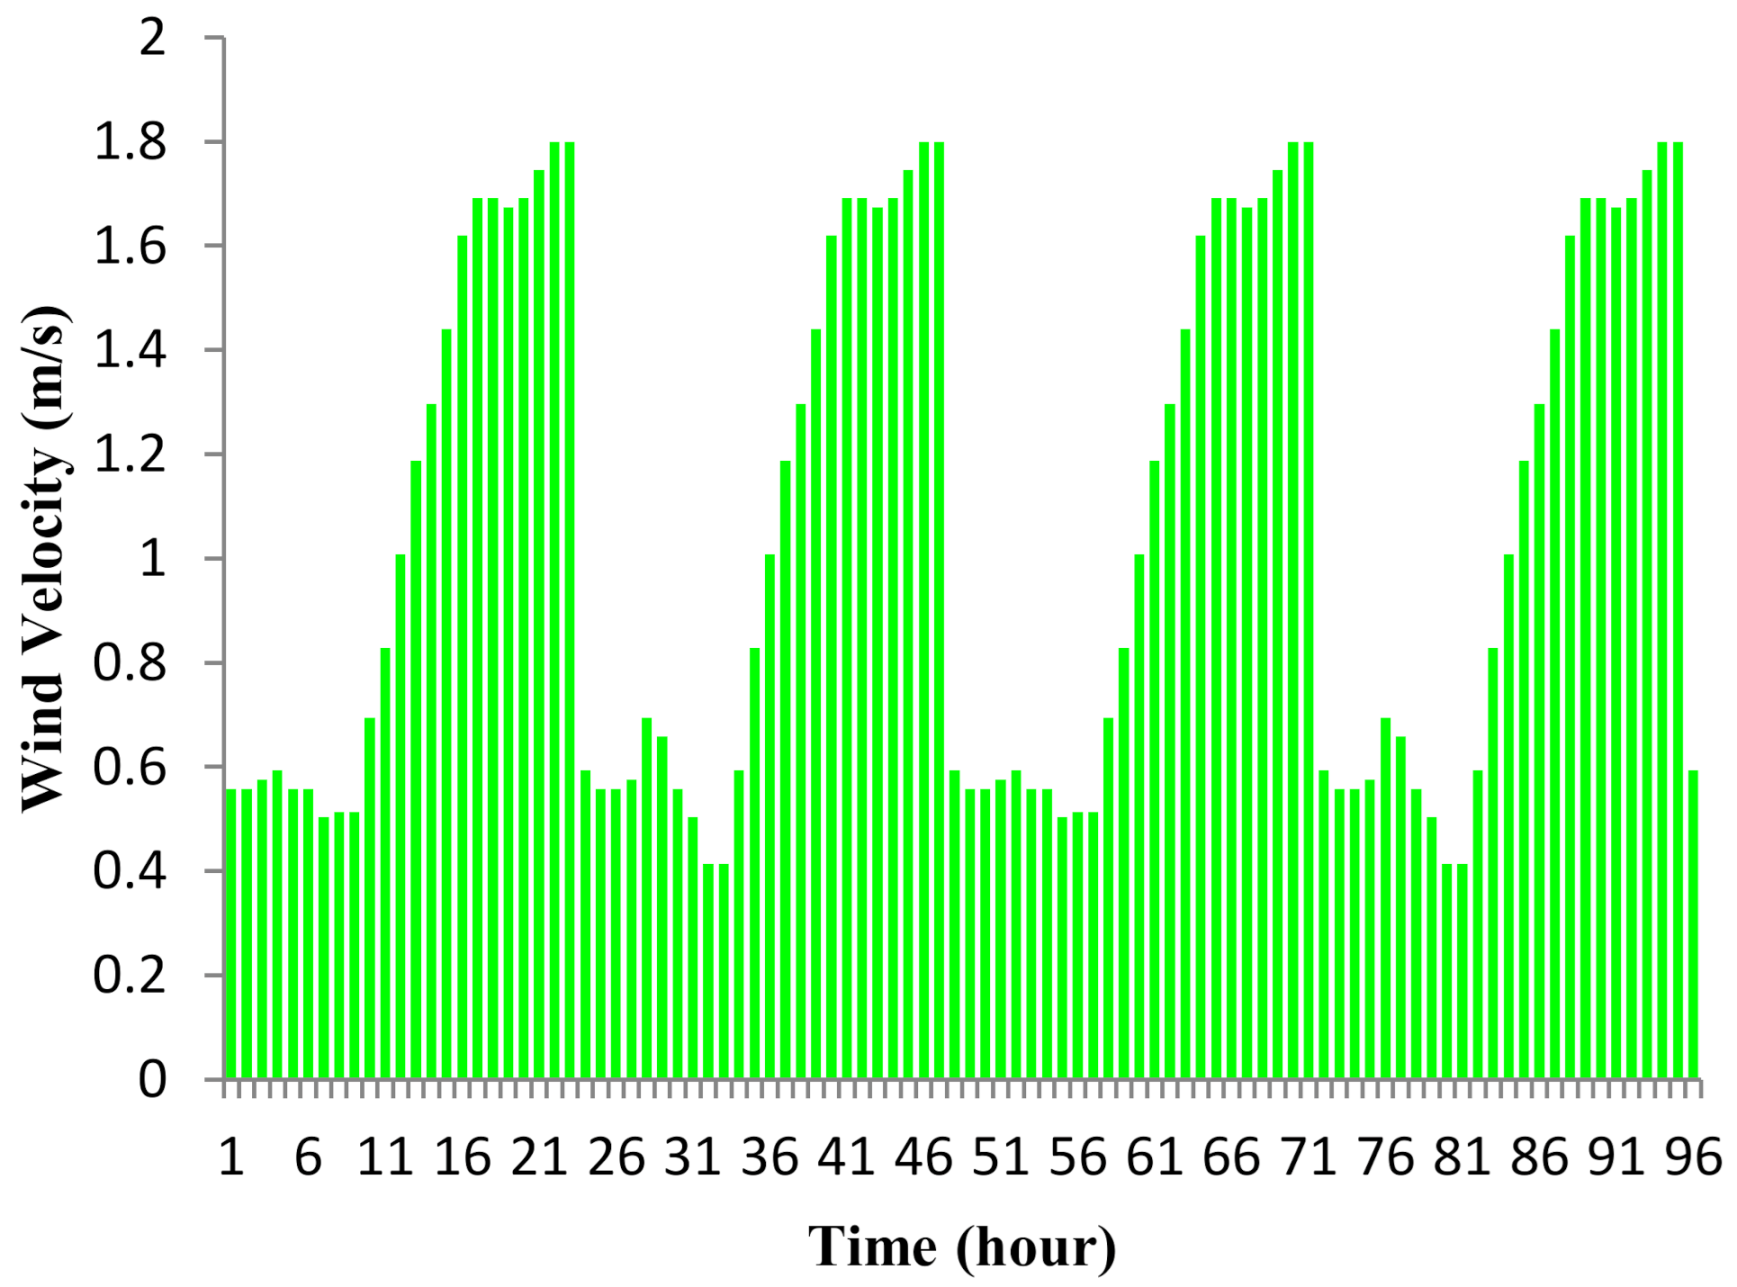
3.1.1. Wind Turbines
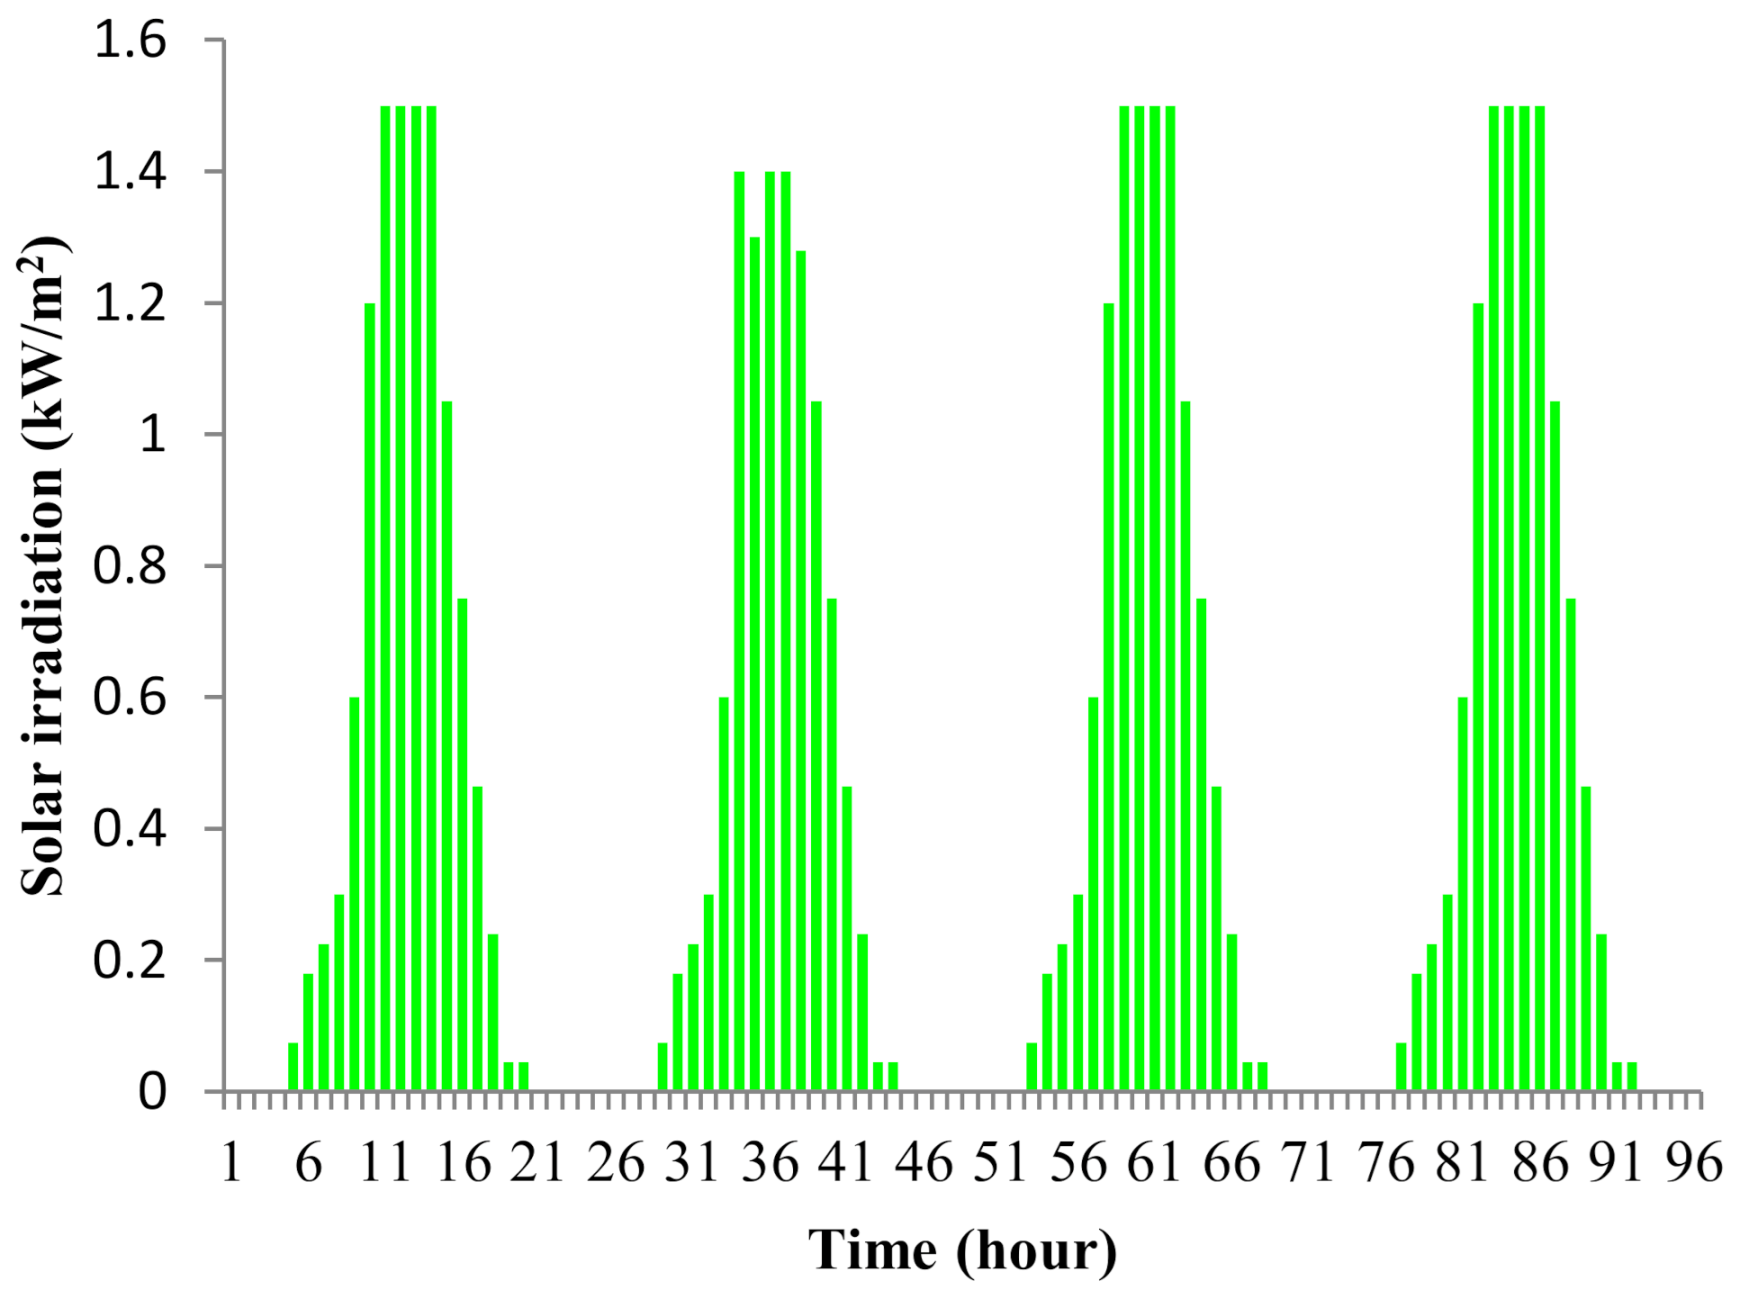
3.1.2. Solar PV
3.1.3. Battery Energy Storage System (BESS)
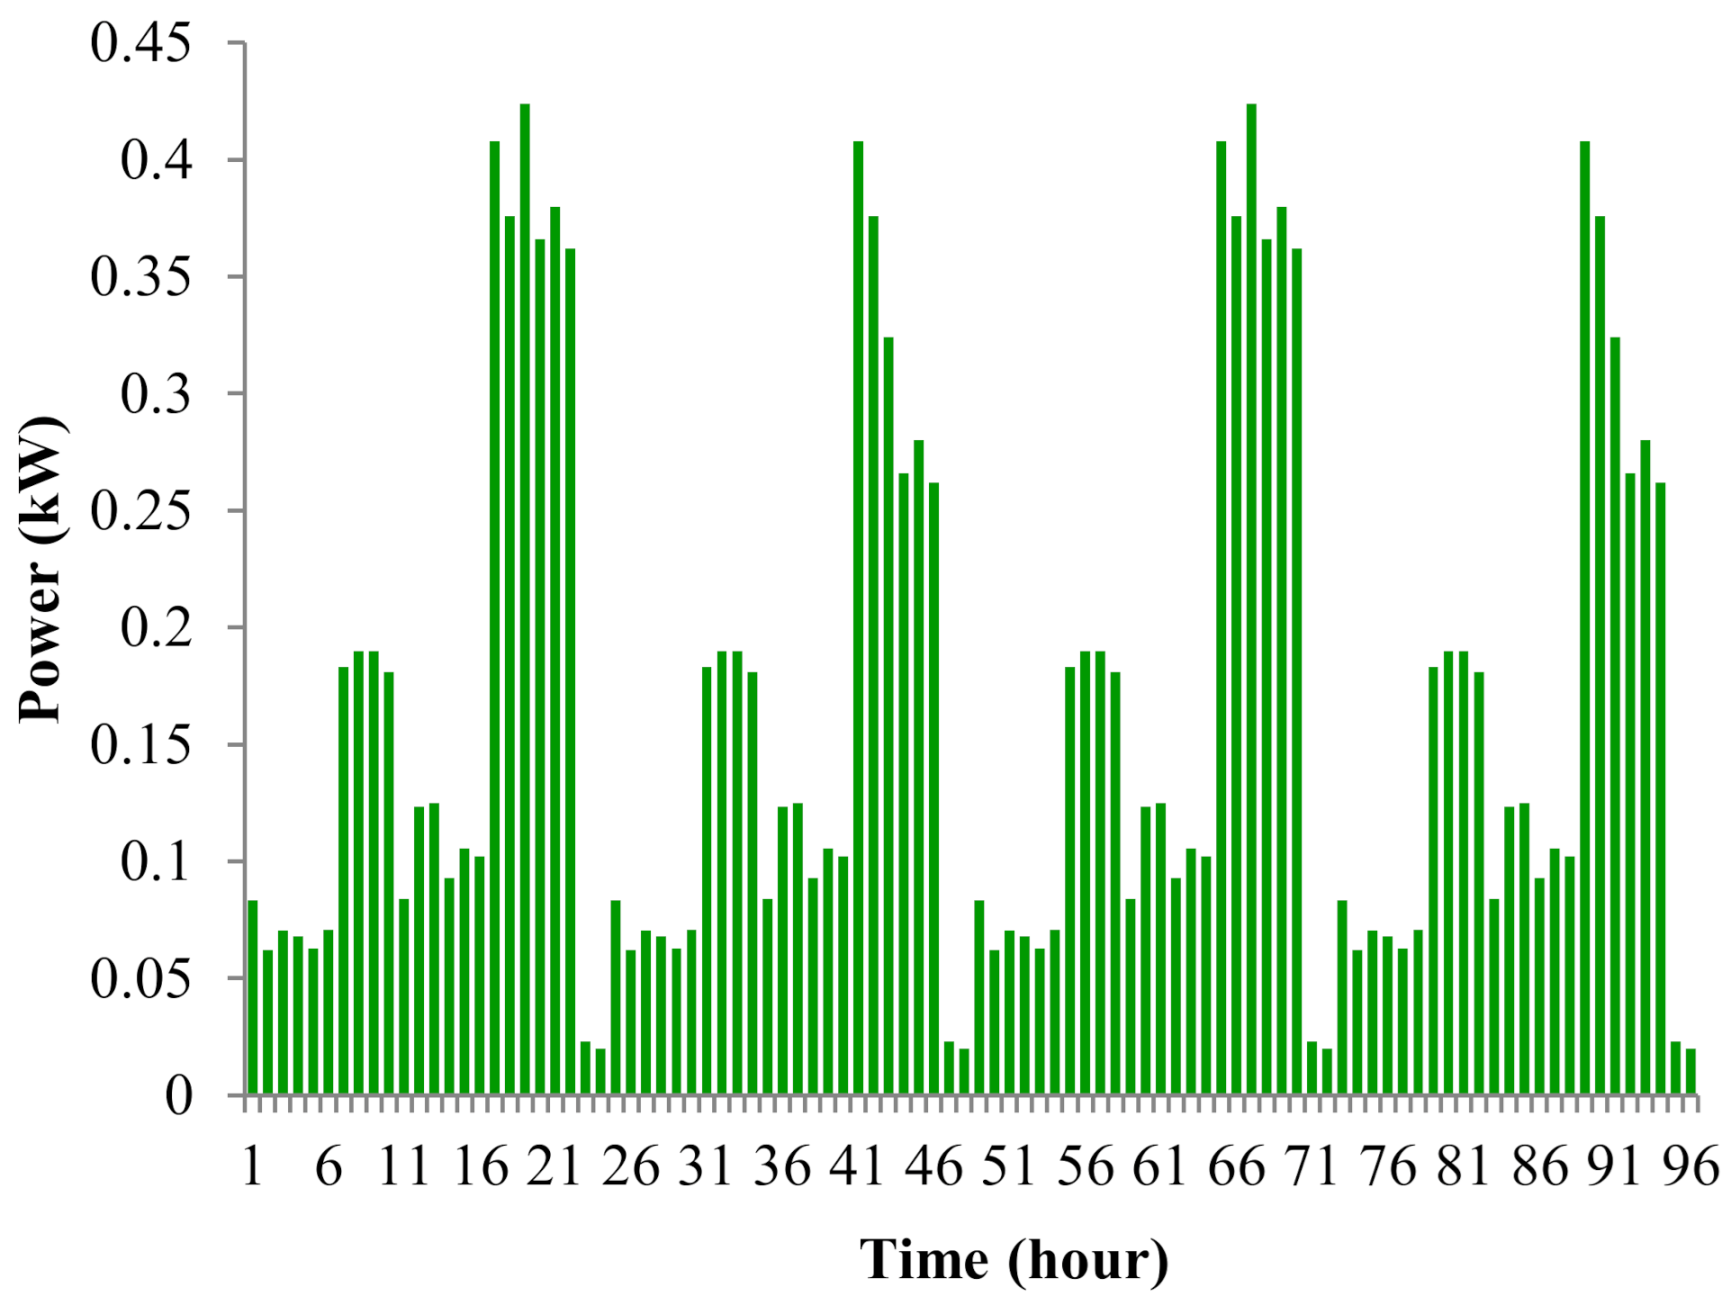
3.1.4. Load Profile and Utility Grid
3.2. Mathematical Modeling of RESs, BESS and Smart Home Appliances
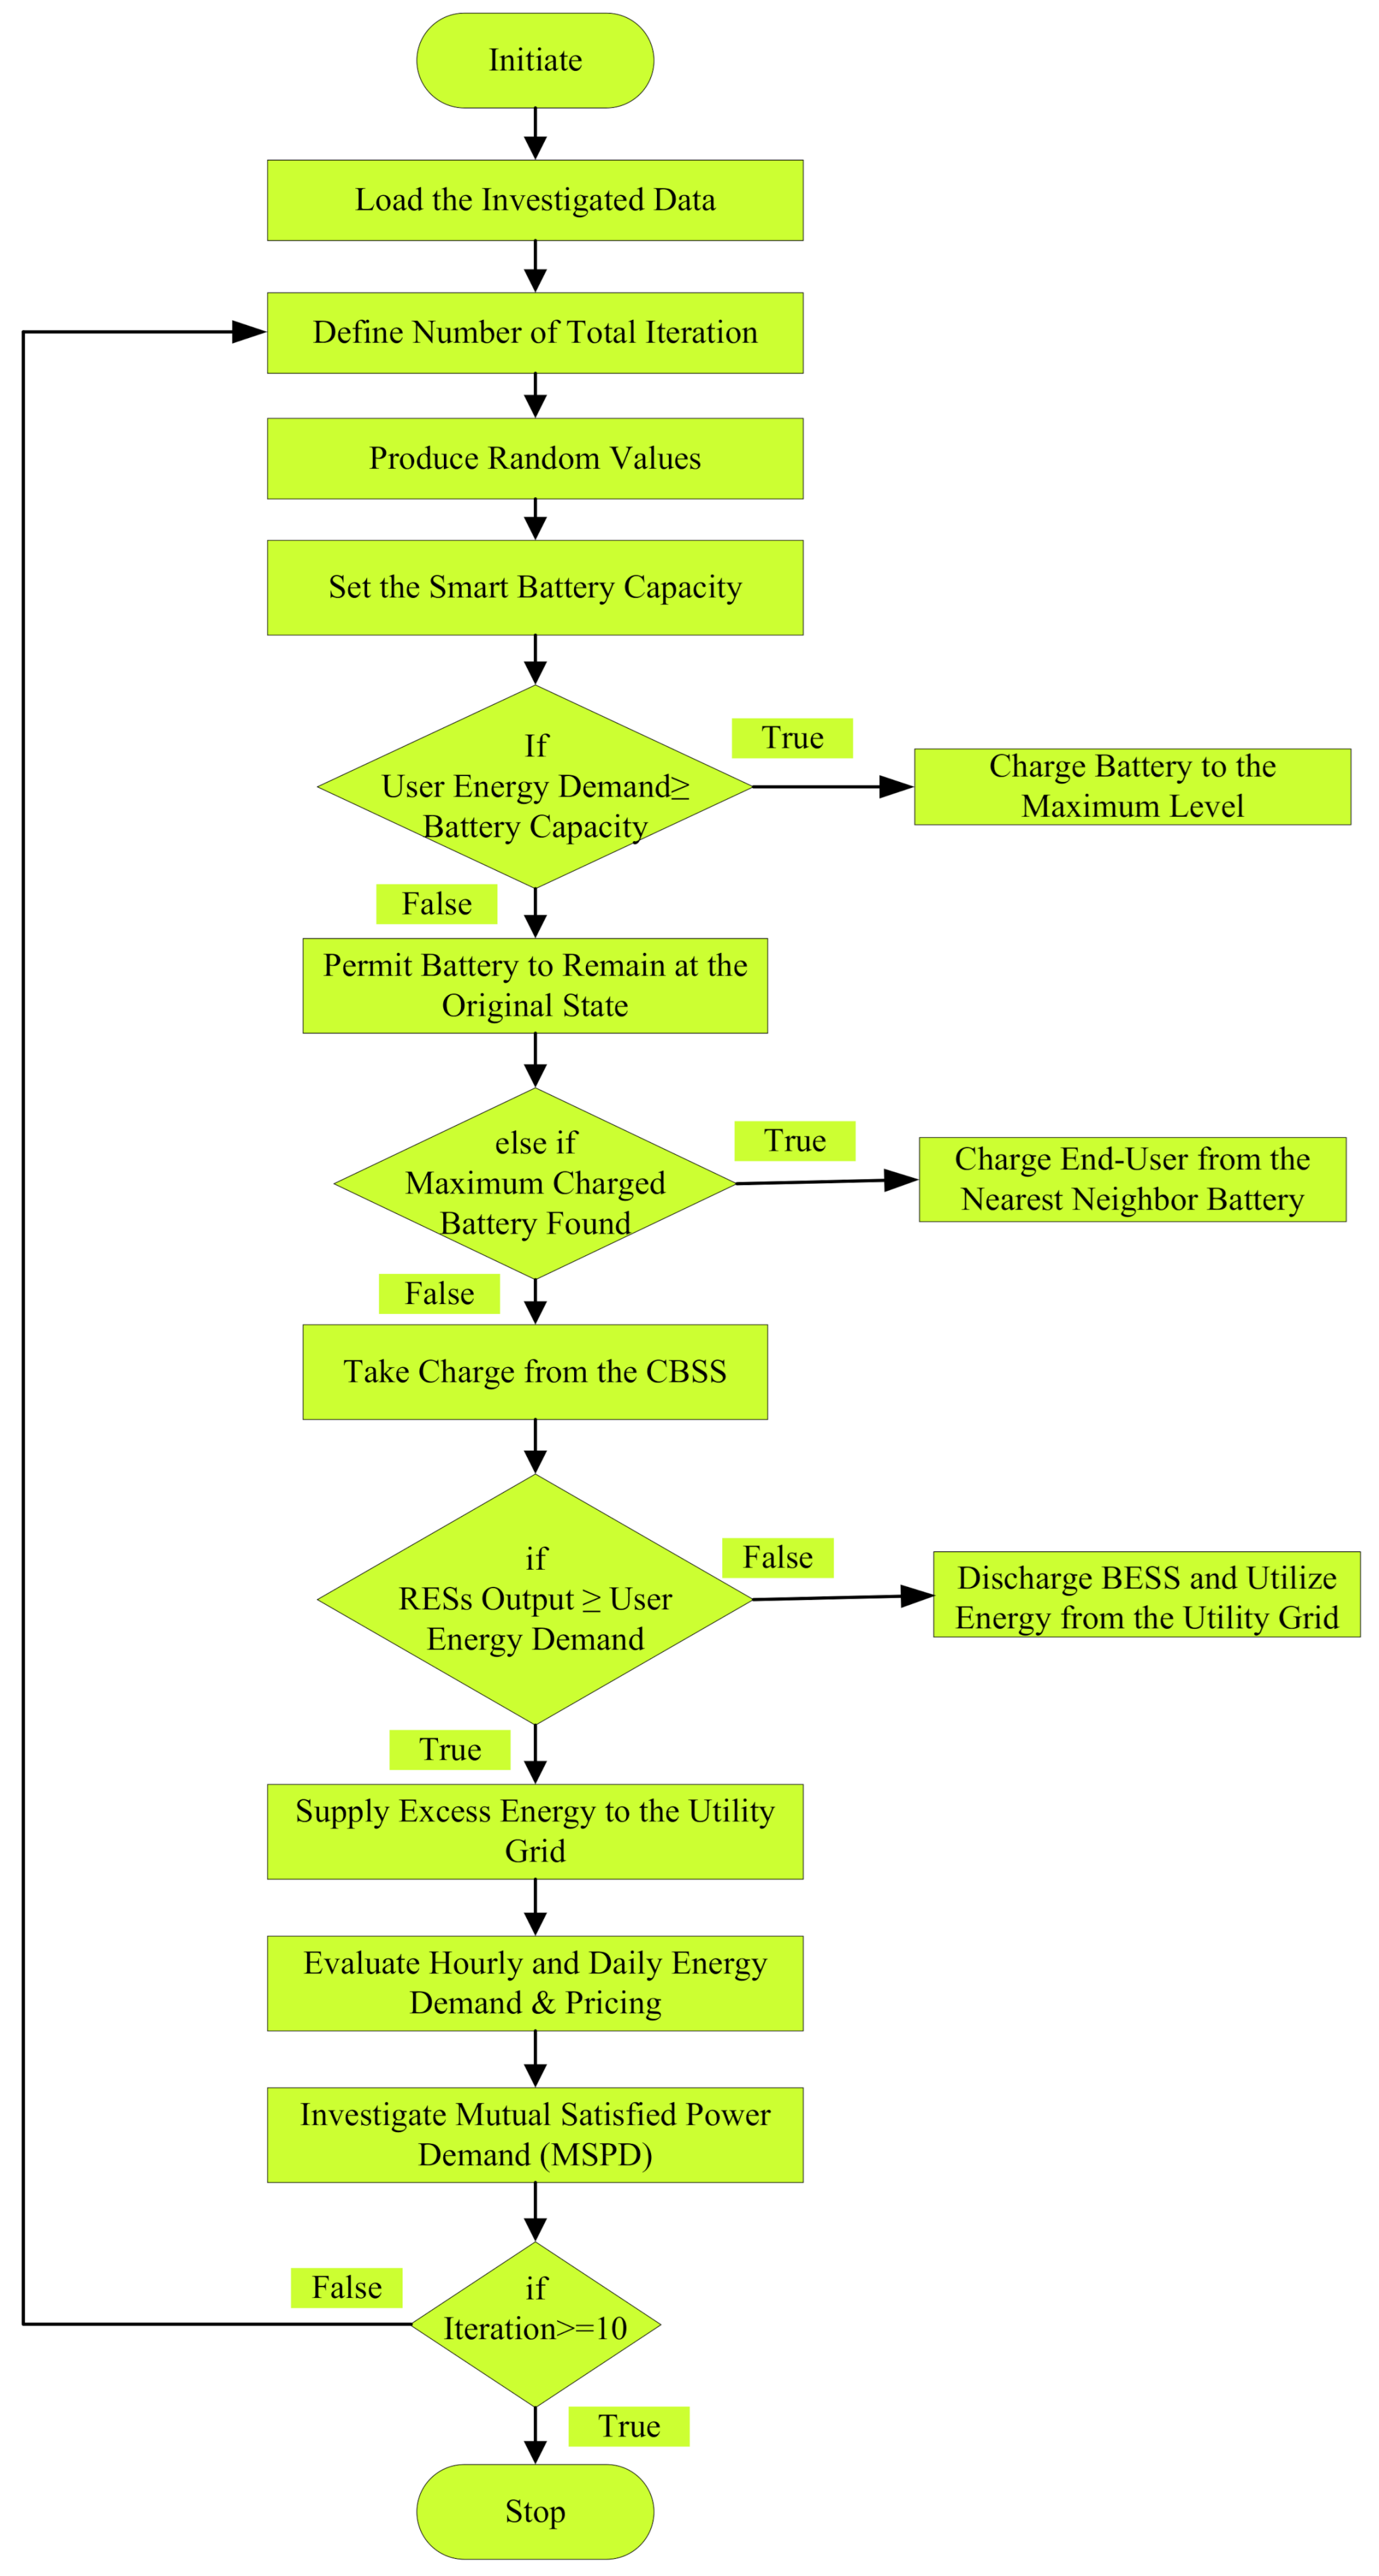
3.3. The Proposed Algorithm
Optimal Power Sharing Algorithm (OPSA)
4. Simulation Results
4.1. Case Study
4.1.1. Case I
4.1.2. Case II
4.1.3. Case III
4.1.4. Discussions
4.1.5. Mutually Satisfied User
4.1.6. Case Comparison
5. Conclusions
- A large community
- Hybrid energy storage devices with degradation cost
- Integration of renewable sources with uncertain modeling to measure the effectiveness of the proposed algorithm
- Techno-economic analysis of the proposed model.
Author Contributions
Funding
Institutional Review Board Statement
Informed Consent Statement
Data Availability Statement
Conflicts of Interest
Nomenclature
| GSMU | grid supervisory management unit |
| HEM | home energy management |
| OPSA | optimal power sharing algorithm |
| CBSS | central battery storage system |
| RESs | renewable energy sources |
| BESS | battery energy storage system |
| SI | solar irradiance |
| PV | photovoltaic |
| PW | overall wind power |
| PS | overall solar power |
| BLo | battery initial state of charge |
| BLmax | battery capacity (maximum) |
| BLmin | battery energy (minimum) |
| PB | battery power |
| PS | power from solar PV |
| pW | power generated by wind turbine |
| ETHA | overall power from home appliances |
| EL | power for lighting equipment |
| EWM | power consumed by washing machine |
| ER | power consumed by refrigerator |
| EC | power absorbed by computer |
| EDW | power consumption by dishwasher |
| EH | power taken by heater unit |
| EBESS | battery energy storage system |
| EEE | extra energy used |
| EEEC | extra energy cost for user |
| pUO | utility operator |
| pUP | utility pricing |
| CTNC | total number of community |
| UTNU | total number of users |
| ETUE | total user energy |
| ETUEC | total user energy cost |
| HTNH | total hours of operation |
| DTND | total days of operation |
| pTMSPD | total mutual satisfied power demand |
| ITNI | total number of iteration |
| ECE | cost of energy |
| BCSB | capacity of smart battery |
Appendix A
| Algorithm A1 Optimal Power Sharing Algorithm (OPSA) | |
| 1: | Initiation. |
| 2: | Load relevant data. |
| 3: | Start simulation. |
| 4: | Define iteration. |
| 5: | Produce random values. |
| 6: | if end-user energy demand ≥ battery capacity then |
| 7: | end-user battery charge up to the maximum limit. |
| 8: | else end-user battery is permitted to remain at the maximum limit. |
| 9: | end if |
| 10: | else if found a maximum charged battery then |
| 11: | Charge end-user battery from the nearest neighbor. |
| 12: | Otherwise, take charge from the CBSS. |
| 13: | end else if |
| 14: | if adequate RESs output and off-peak condition assure then |
| 15: | Supply excess energy to the grid. |
| 16: | Otherwise, operate residential load through energy community. |
| 17: | end if |
| 18 | if insufficient RESs generation and grid outage then |
| 19 | Utilize BESS till limit. |
| 20 | Otherwise, utilize CBSS. |
| 21 | end if |
| 22: | Evaluate hourly and daily energy and prices. |
| 23 | Investigate mutual-satisfied power demand. |
| 24: | Repeat step 4. |
| 25: | until iteration ≥10 |
| 26: | Stop simulation. |
References
- Chu, X.; Ge, Y.; Zhou, X.; Li, L.; Yang, D. Modeling and Analysis of Electric Vehicle-Power Grid-Manufacturing Facility (EPM) Energy Sharing System under Time-of-Use Electricity Tariff. Sustainability 2020, 12, 4836. [Google Scholar] [CrossRef]
- Nejad, R.R.; Moghaddas-Tafreshi, S.-M. Operation Planning of a Smart Microgrid Including Controllable Loads and Intermittent Energy Resources by Considering Uncertainties. Arab. J. Sci. Eng. 2014, 39, 6297–6315. [Google Scholar] [CrossRef]
- Emiroglu, S. Distributed Reactive Power Control based Conservation Voltage Reduction in Active Distribution Systems. Adv. Electr. Comput. Eng. 2017, 17, 99–106. [Google Scholar] [CrossRef]
- Hassan, H.A.H.; Renga, D.; Meo, M.; Nuaymi, L. A Novel Energy Model for Renewable Energy-Enabled Cellular Networks Providing Ancillary Services to the Smart Grid. IEEE Trans. Green Commun. Netw. 2019, 3, 381–396. [Google Scholar] [CrossRef]
- Alam, S.; Abido, M.A.; Hussein, A.E.; El-Amin, I. Fault Ride through Capability Augmentation of a DFIG-Based Wind Integrated VSC-HVDC System with Non-Superconducting Fault Current Limiter. Sustainability 2019, 11, 1232. [Google Scholar] [CrossRef] [Green Version]
- Shakeri, M.; Pasupuleti, J.; Amin, N.; Rokonuzzaman, M.; Low, F.W.; Yaw, C.T.; Asim, N.; Samsudin, N.A.; Tiong, S.K.; Hen, C.K.; et al. An Overview of the Building Energy Management System Considering the Demand Response Programs, Smart Strategies and Smart Grid. Energies 2020, 13, 3299. [Google Scholar] [CrossRef]
- Shakouri, G.H.; Kazemi, A. Multi-objective cost-load optimization for demand side management of a residential area in smart grids. Sustain. Cities Soc. 2017, 32, 171–180. [Google Scholar] [CrossRef]
- Lokeshgupta, B.; Sivasubramani, S. Multi-objective dynamic economic and emission dispatch with demand side management. Int. J. Electr. Power Energy Syst. 2018, 97, 334–343. [Google Scholar] [CrossRef]
- Rehman, U.U. A Decentralized Dynamic Marketing-Based Demand Response Using Electric Vehicles in Smart Grid. Arab. J. Sci. Eng. 2020, 45, 6475–6488. [Google Scholar] [CrossRef]
- Alam, M.S.; Shafiullah, M.; Rana, J.; Javaid, M.S.; Irshad, U.B.; Uddin, M.A. Switching signal reduction of load aggregator with optimal dispatch of electric vehicle performing V2G regulation service. Int. Conf. Innov. Sci. Eng. Technol. 2016, 1–4. [Google Scholar] [CrossRef]
- Squartini, S.; Pota, H.R.; Squartini, S.; Guerrero, J.M.; Guerrero, J.M. Energy scheduling of community microgrid with battery cost using particle swarm optimisation. Appl. Energy 2019, 254, 113723. [Google Scholar] [CrossRef]
- Kong, X.; Zhang, S.; Sun, B.; Yang, Q.; Li, S.; Zhu, S. Research on Home Energy Management Method for Demand Response Based on Chance-Constrained Programming. Energies 2020, 13, 2790. [Google Scholar] [CrossRef]
- Hemmati, R. Technical and economic analysis of home energy management system incorporating small-scale wind turbine and battery energy storage system. J. Clean. Prod. 2017, 159, 106–118. [Google Scholar] [CrossRef]
- Hemmati, R.; Saboori, H. Stochastic optimal battery storage sizing and scheduling in home energy management systems equipped with solar photovoltaic panels. Energy Build. 2017, 152, 290–300. [Google Scholar] [CrossRef]
- Arun, S.L.; Selvan, M.P. Intelligent Residential Energy Management System for Dynamic Demand Response in Smart Buildings. IEEE Syst. J. 2018, 12, 1329–1340. [Google Scholar] [CrossRef]
- Setlhaolo, D.; Xia, X. Optimal scheduling of household appliances with a battery storage system and coordination. Energy Build. 2015, 94, 61–70. [Google Scholar] [CrossRef]
- Lobaccaro, G.; Carlucci, S.; Löfström, E. A Review of Systems and Technologies for Smart Homes and Smart Grids. Energies 2016, 9, 348. [Google Scholar] [CrossRef] [Green Version]
- Rashid, M.U.; Granelli, F.; Hossain, A.; Alam, S.; Al-Ismail, F.S.; Karmaker, A.K.; Rahman, M. Development of Home Energy Management Scheme for a Smart Grid Community. Energies 2020, 13, 4288. [Google Scholar] [CrossRef]
- Rashid, M.U.; Granelli, F.; Hossain, A.; Alam, S.; Al-Ismail, F.S.; Shah, R. Development of Cluster-Based Energy Management Scheme for Residential Usages in the Smart Grid Community. Electronics 2020, 9, 1462. [Google Scholar] [CrossRef]
- Rashid, M.U.; Hossain, A.; Shah, R.; Alam, S.; Karmaker, A.K.; Rahman, M. An Improved Energy and Cost Minimization Scheme for Home Energy Management (HEM) in the Smart Grid Framework. In Proceedings of the 2020 IEEE International Conference on Applied Superconductivity and Electromagnetic Devices (ASEMD), Shanghai, China, 16–18 October 2020; pp. 1–2. [Google Scholar]
- European Union. From Economic to Energy Transition; Palgrave Macmillan: London, UK, 2021. [Google Scholar]
- Oh, S.; Haberl, J.S.; Baltazar, J.-C. Analysis methods for characterizing energy saving opportunities from home automation devices using smart meter data. Energy Build. 2020, 216, 109955. [Google Scholar] [CrossRef]
- Golmohamadi, H.; Larsen, K.G.; Jensen, P.G.; Hasrat, I.R. Optimization of power-to-heat flexibility for residential buildings in response to day-ahead electricity price. Energy Build. 2021, 232, 110665. [Google Scholar] [CrossRef]
- Tushar, W.; Saha, T.K.; Yuen, C.; Smith, D.; Poor, H.V. Peer-to-Peer Trading in Electricity Networks: An Overview. IEEE Trans. Smart Grid 2020, 11, 3185–3200. [Google Scholar] [CrossRef] [Green Version]
- Boynuegri, A.R.; Yagcitekin, B.; Baysal, M.; Karakas, A.; Uzunoglu, M. Energy management algorithm for smart home with renewable energy sources. In Proceedings of the 4th International Conference on Power Engineering, Energy and Electrical Drives, Istanbul, Turkey, 13–17 May 2013; pp. 1753–1758. [Google Scholar]
- Al Essa, M.J.M. Home energy management of thermostatically controlled loads and photovoltaic-battery systems. Energy 2019, 176, 742–752. [Google Scholar] [CrossRef]
- Godina, R.; Rodrigues, E.M.G.; Pouresmaeil, E.; Matias, J.C.O.; Catalão, J.P. Model Predictive Control Home Energy Management and Optimization Strategy with Demand Response. Appl. Sci. 2018, 8, 408. [Google Scholar] [CrossRef] [Green Version]
- Liberati, F.; Di Giorgio, A.; Giuseppi, A.; Pietrabissa, A.; Habib, E.; Martirano, L. Joint Model Predictive Control of Electric and Heating Resources in a Smart Building. IEEE Trans. Ind. Appl. 2019, 55, 7015–7027. [Google Scholar] [CrossRef]
- Koutitas, G. Control of Flexible Smart Devices in the Smart Grid. IEEE Trans. Smart Grid 2012, 3, 1333–1343. [Google Scholar] [CrossRef]
- Karmaker, A.K.; Ahmed, R.; Hossain, A.; Sikder, M. Feasibility assessment & design of hybrid renewable energy based electric vehicle charging station in Bangladesh. Sustain. Cities Soc. 2018, 39, 189–202. [Google Scholar] [CrossRef]
- Justus, C. Wind energy statistics for large arrays of wind turbines (New England and Central, U.S. Regions). Sol. Energy 1978, 20, 379–386. [Google Scholar] [CrossRef]
- Rehman, S.; Al-Abbadi, N.M. Wind shear coefficients and energy yield for Dhahran, Saudi Arabia. Renew. Energy 2007, 32, 738–749. [Google Scholar] [CrossRef]
- Borowy, B.; Salameh, Z. Optimum photovoltaic array size for a hybrid wind/PV system. IEEE Trans. Energy Convers. 1994, 9, 482–488. [Google Scholar] [CrossRef]
- Farrugia, R. The wind shear exponent in a Mediterranean island climate. Renew. Energy 2003, 28, 647–653. [Google Scholar] [CrossRef]
- Xiao, W.; Lind, M.G.J.; Dunford, W.G.; Capel, A. Real-Time Identification of Optimal Operating Points in Photovoltaic Power Systems. IEEE Trans. Ind. Electron. 2006, 53, 1017–1026. [Google Scholar] [CrossRef]
- Alam, S.; Al-Ismail, F.S.; Salem, A.; Abido, M.A. High-Level Penetration of Renewable Energy Sources into Grid Utility: Challenges and Solutions. IEEE Access 2020, 8, 190277–190299. [Google Scholar] [CrossRef]
- Kaabeche, A.; Belhamel, M.; Ibtiouen, R. Sizing optimization of grid-independent hybrid photovoltaic/wind power generation system. Energy 2011, 36, 1214–1222. [Google Scholar] [CrossRef]
- Mohsenian-Rad, A.; Wong, V.W.S.; Jatskevich, J.; Schober, R. Optimal and autonomous incentive-based energy consumption scheduling algorithm for smart grid. In Proceedings of the IEEE PES conference on Innovative Smart Grid Technologies, Gothenburg, Sweden, 19–21 January 2010; pp. 1–6. [Google Scholar]
- Hossain, A.; Pota, H.R.; Squartini, S.; Abdou, A.F. Modified PSO algorithm for real-time energy management in grid-connected microgrids. Renew. Energy 2019, 136, 746–757. [Google Scholar] [CrossRef]


| Specifications | Output | Unit |
|---|---|---|
| Area secured by PV system, A | 125 | m2 |
| System efficiency, ղs | 16 | % |
| Max. power | 20 | kW |
| Cut-in wind speed (wind turbine) | 3 | m/s |
| Cut-out wind speed (wind turbine) | 25 | m/s |
| Rated speed of wind turbine | 10 | m/s |
| Output power (max.) | 20 | kW |
| Initial state of charge of battery, BLo | 10 | kWh |
| Battery storage capacity (max.), BLmax | 30 | kWh |
| Battery storage capacity (min.), BLmin | 5 | kWh |
| Total energy storage capacity | 30 | kWh |
| Maximum allowable charging rate | 3.5 | kWh |
| Maximum discharging rate | 3.5 | kWh |
| Hours of operation | 96 | h |
| Number of days | 7 | d |
| Number of residential households | 20 | |
| Number of iterations | 10 | |
| Utility tariff | 0.079 | €/kWh |
| Scenarios | Energy (kWh) | Cost (EUR) | Percentage Saving |
|---|---|---|---|
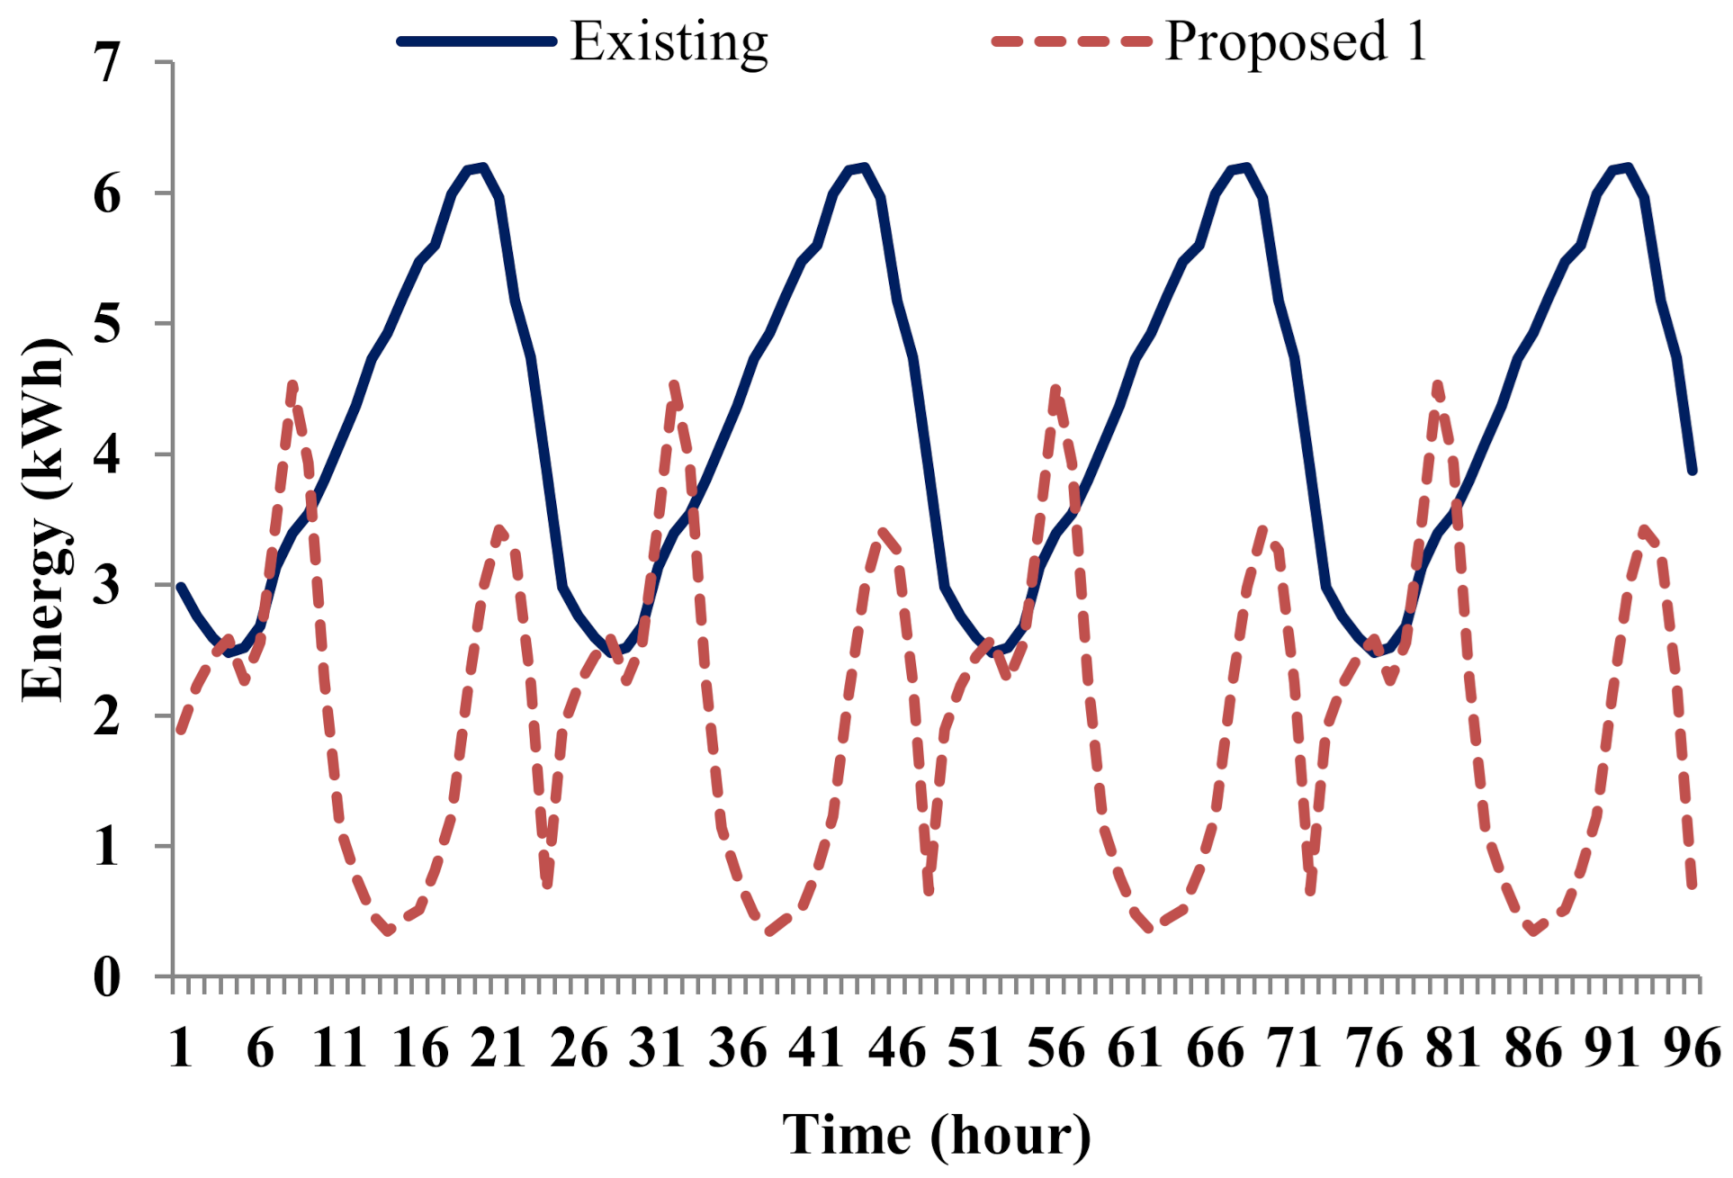
| Existing (scenario 1) | 80 | 6.32 | 0 |
| Proposed 1 (scenario 2) | 50 | 3.95 | 37.5 |
| Scenarios | Energy (kWh) | Cost (EUR) | Percentage Saving |
|---|---|---|---|
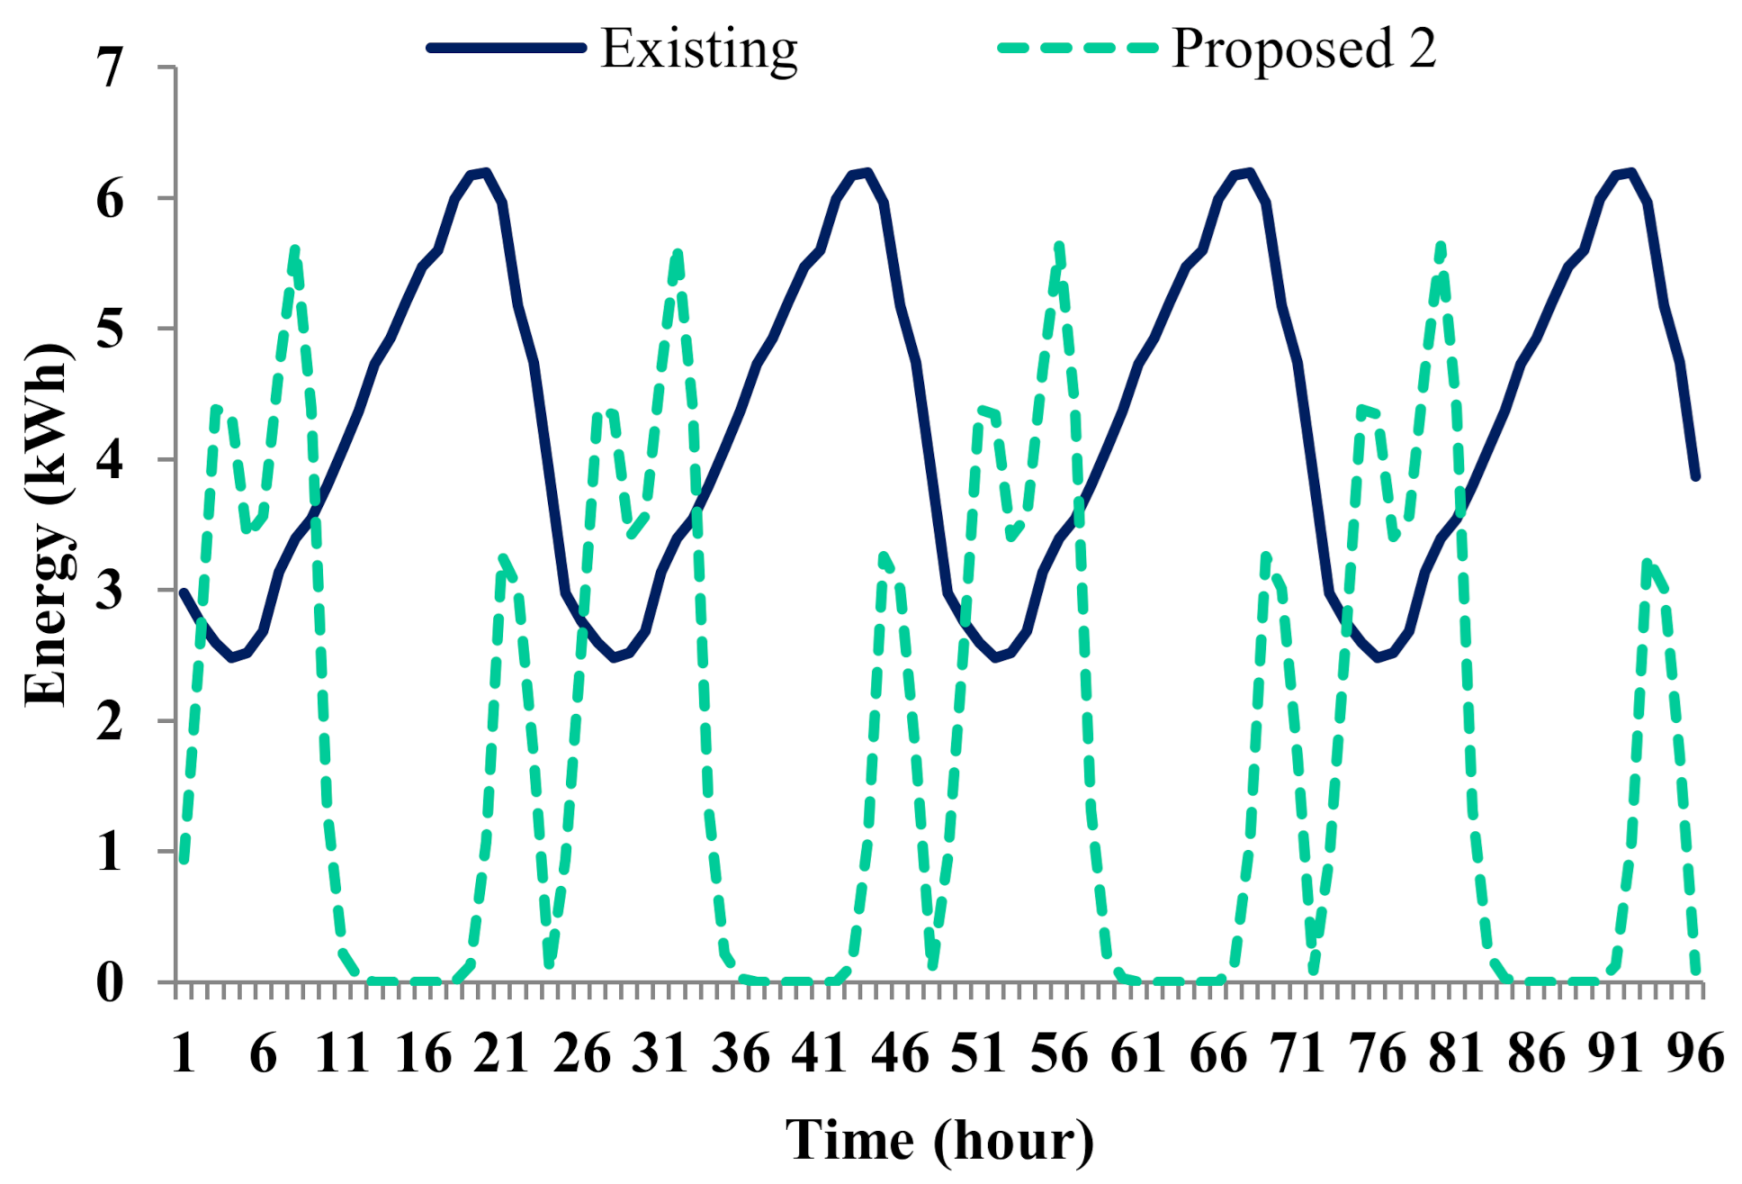
| Existing | 90 | 6.32 | 0 |
| Proposed 2 (scenario 3) | 44 | 3.47 | 45 |
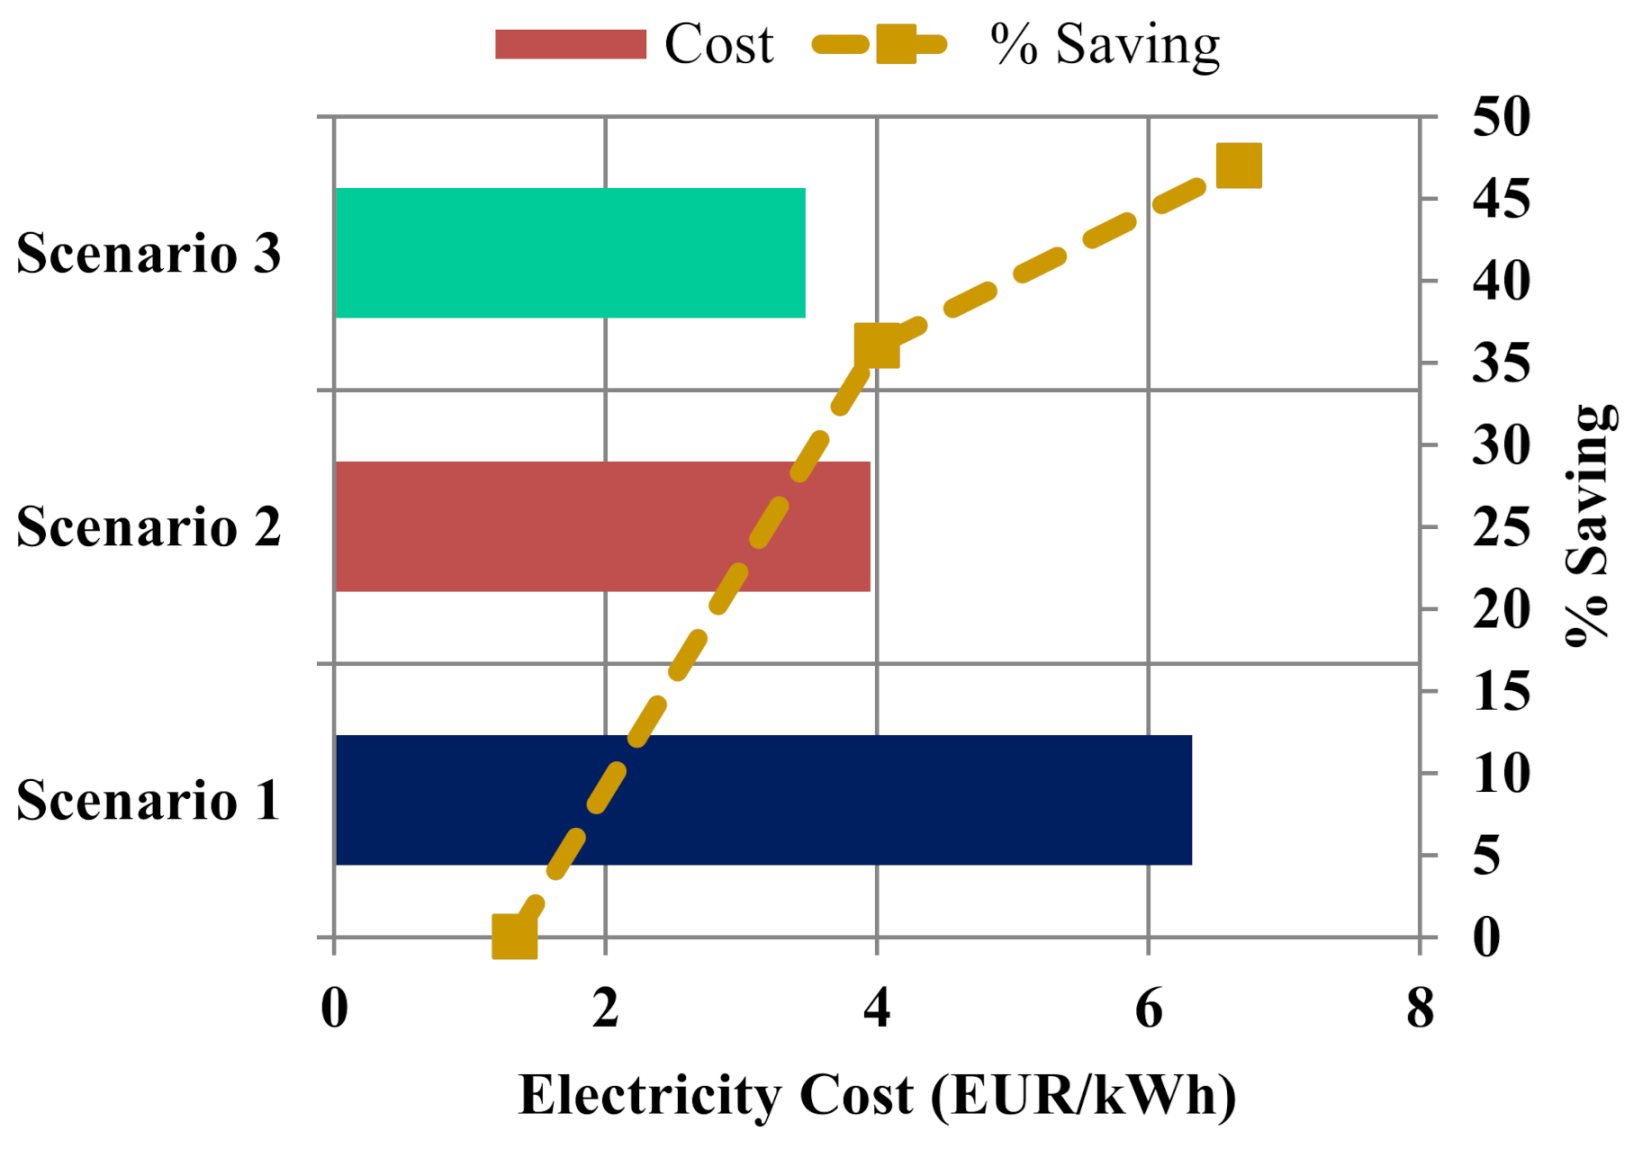
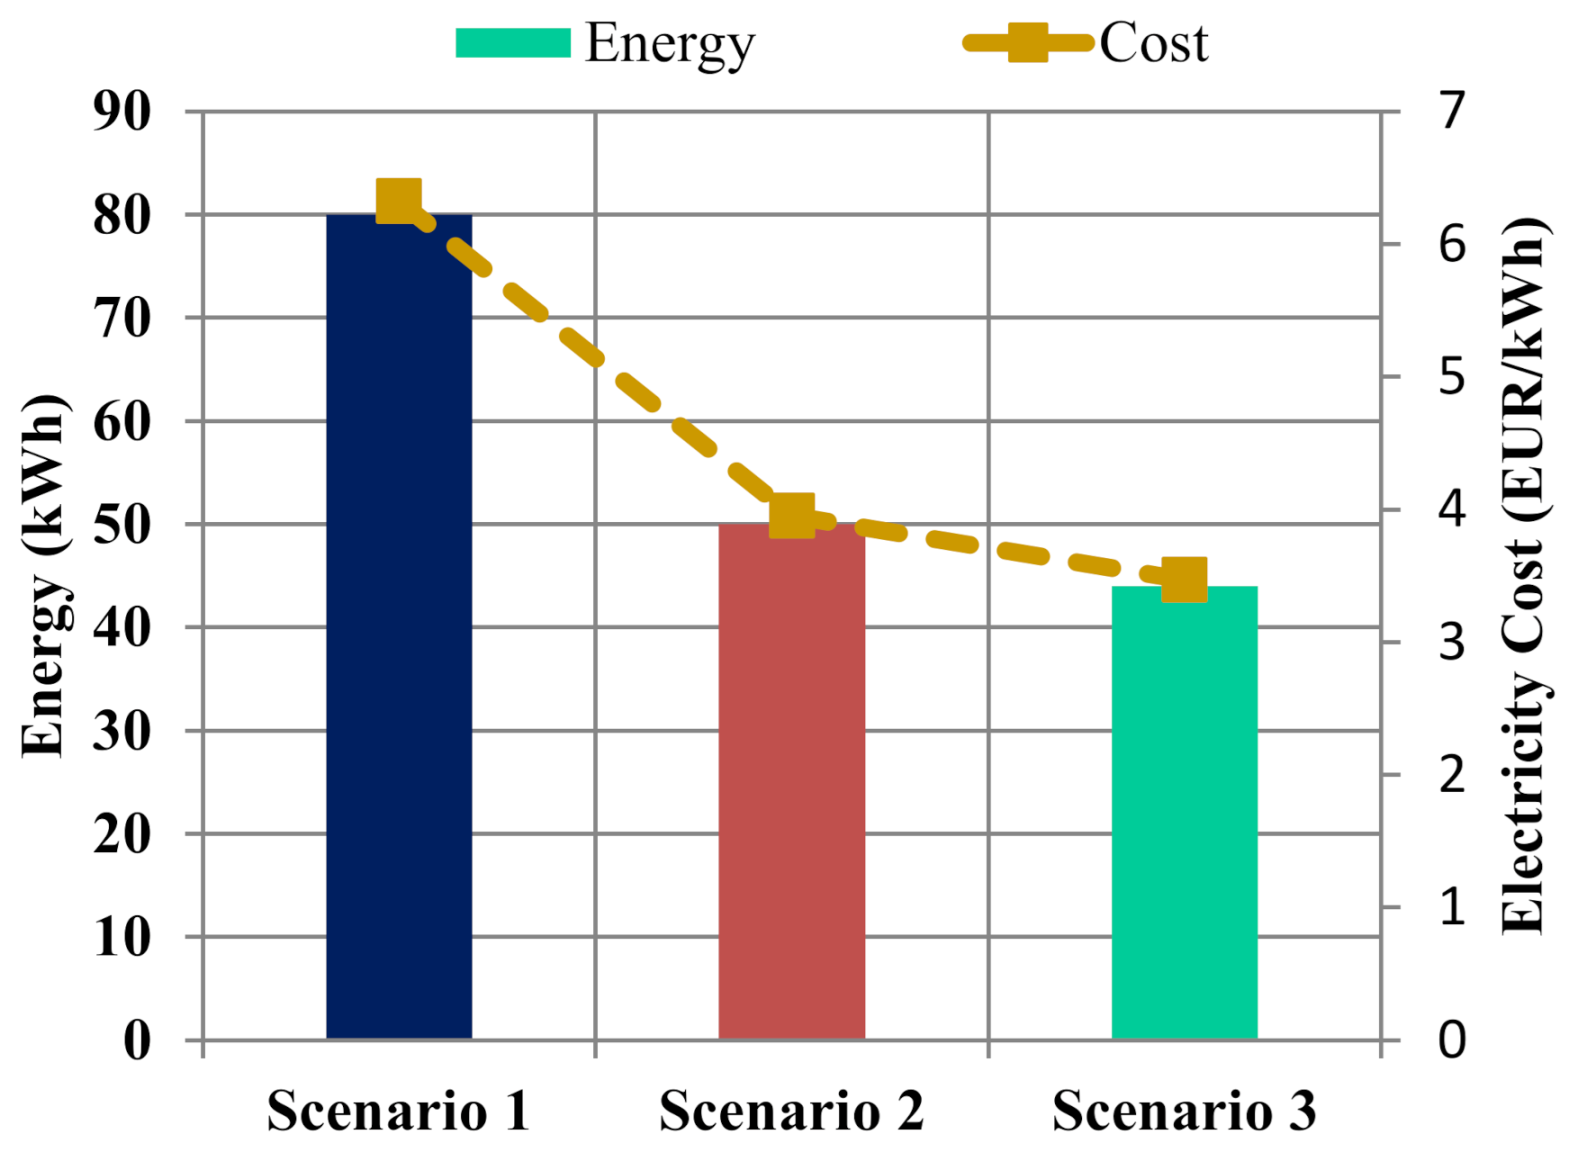
| Scenarios | Energy (kWh) | Cost (EUR) | Percentage Saving |
|---|---|---|---|
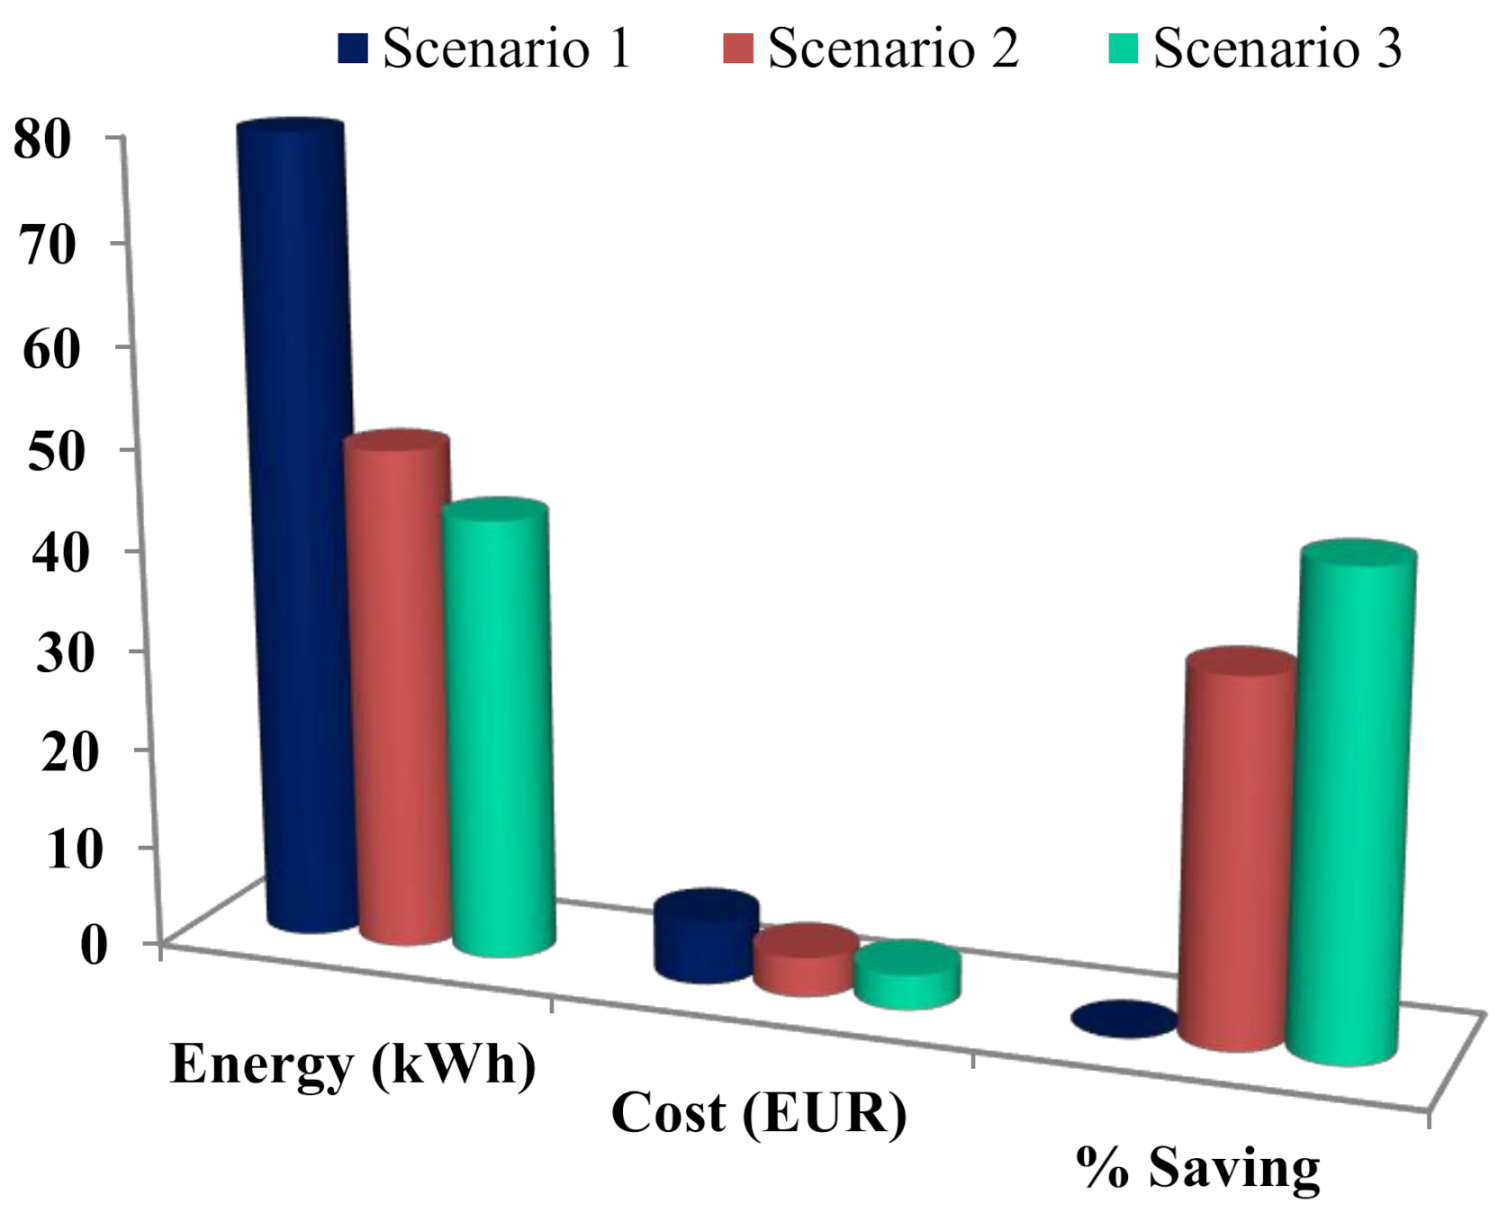
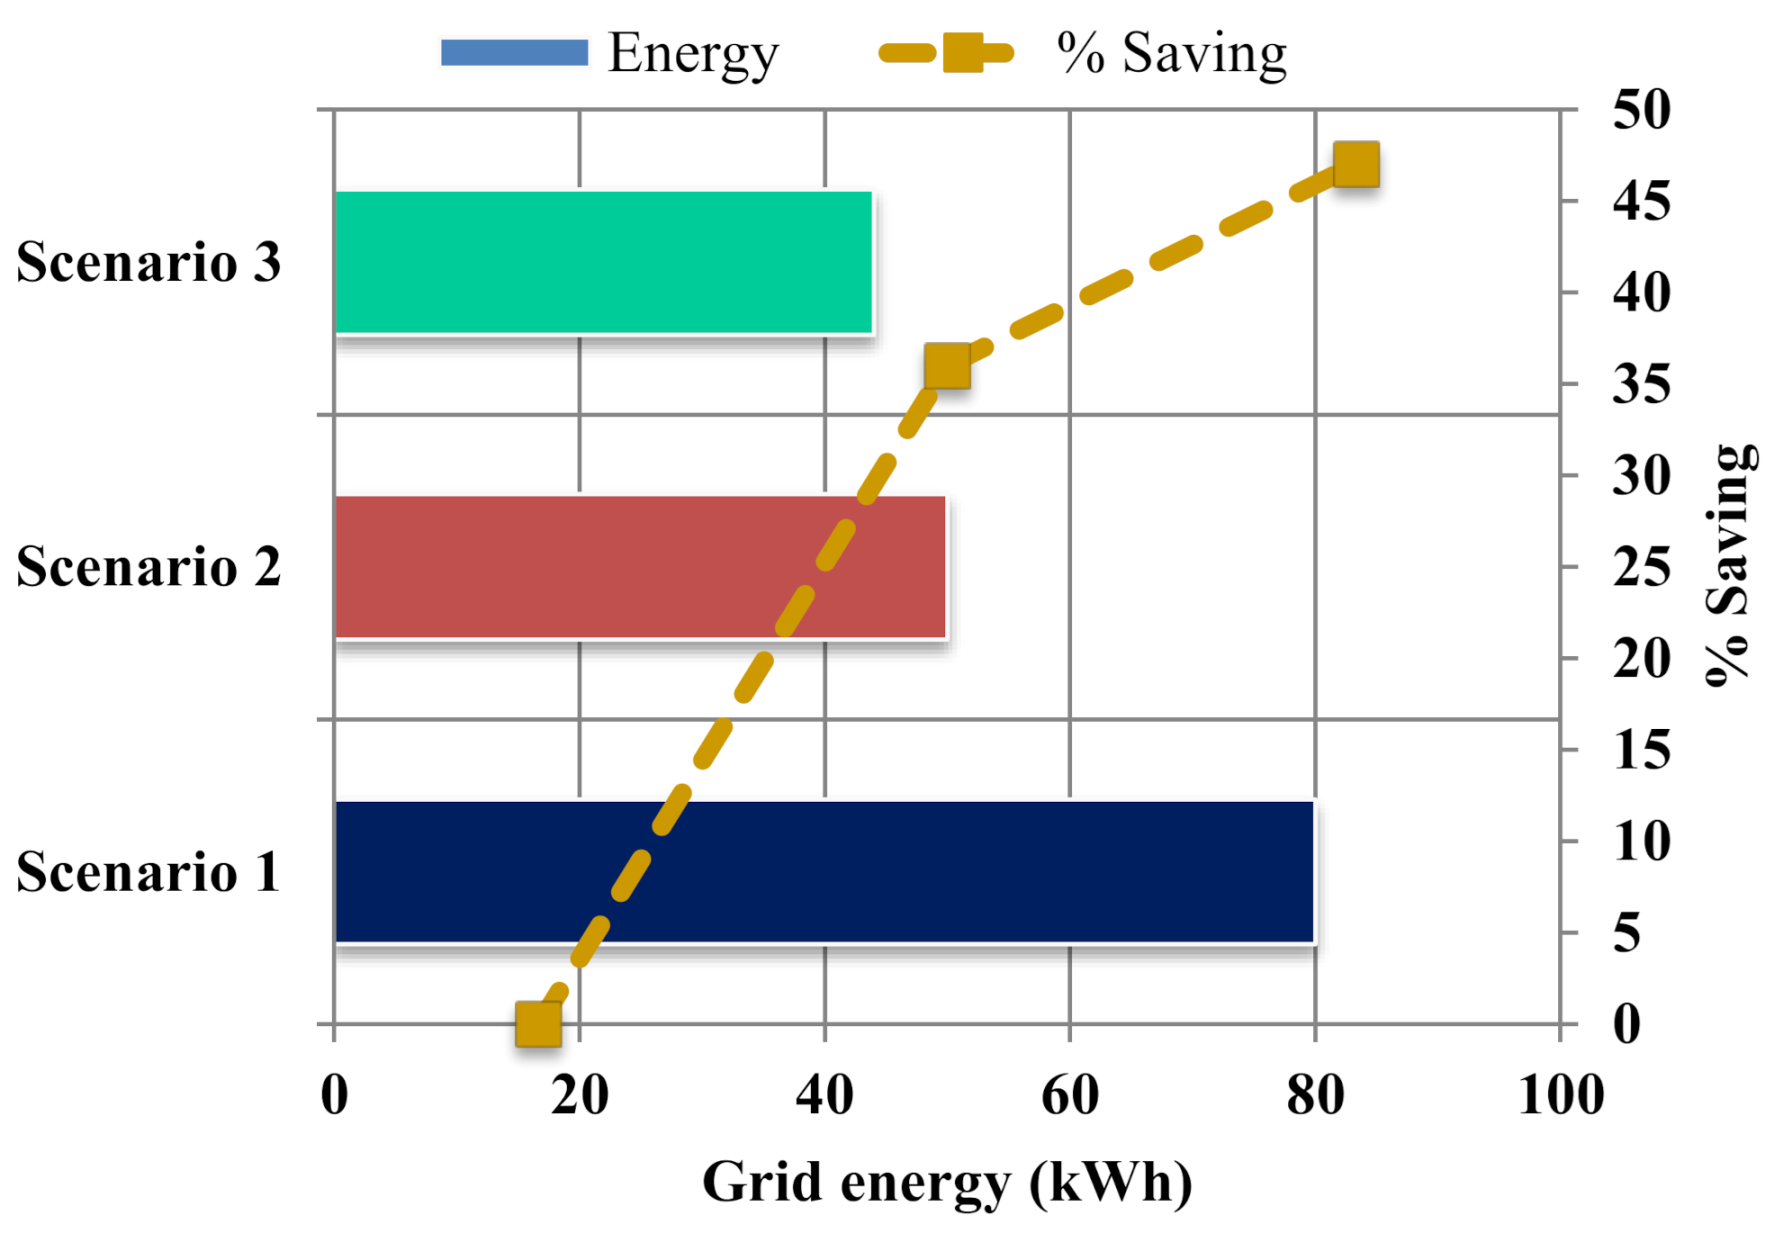
| Scenario 1 | 80 | 6.32 | 0 |
| Scenario 2 | 50 | 3.95 | 37.5 |
| Scenario 3 | 44 | 3.47 | 45 |
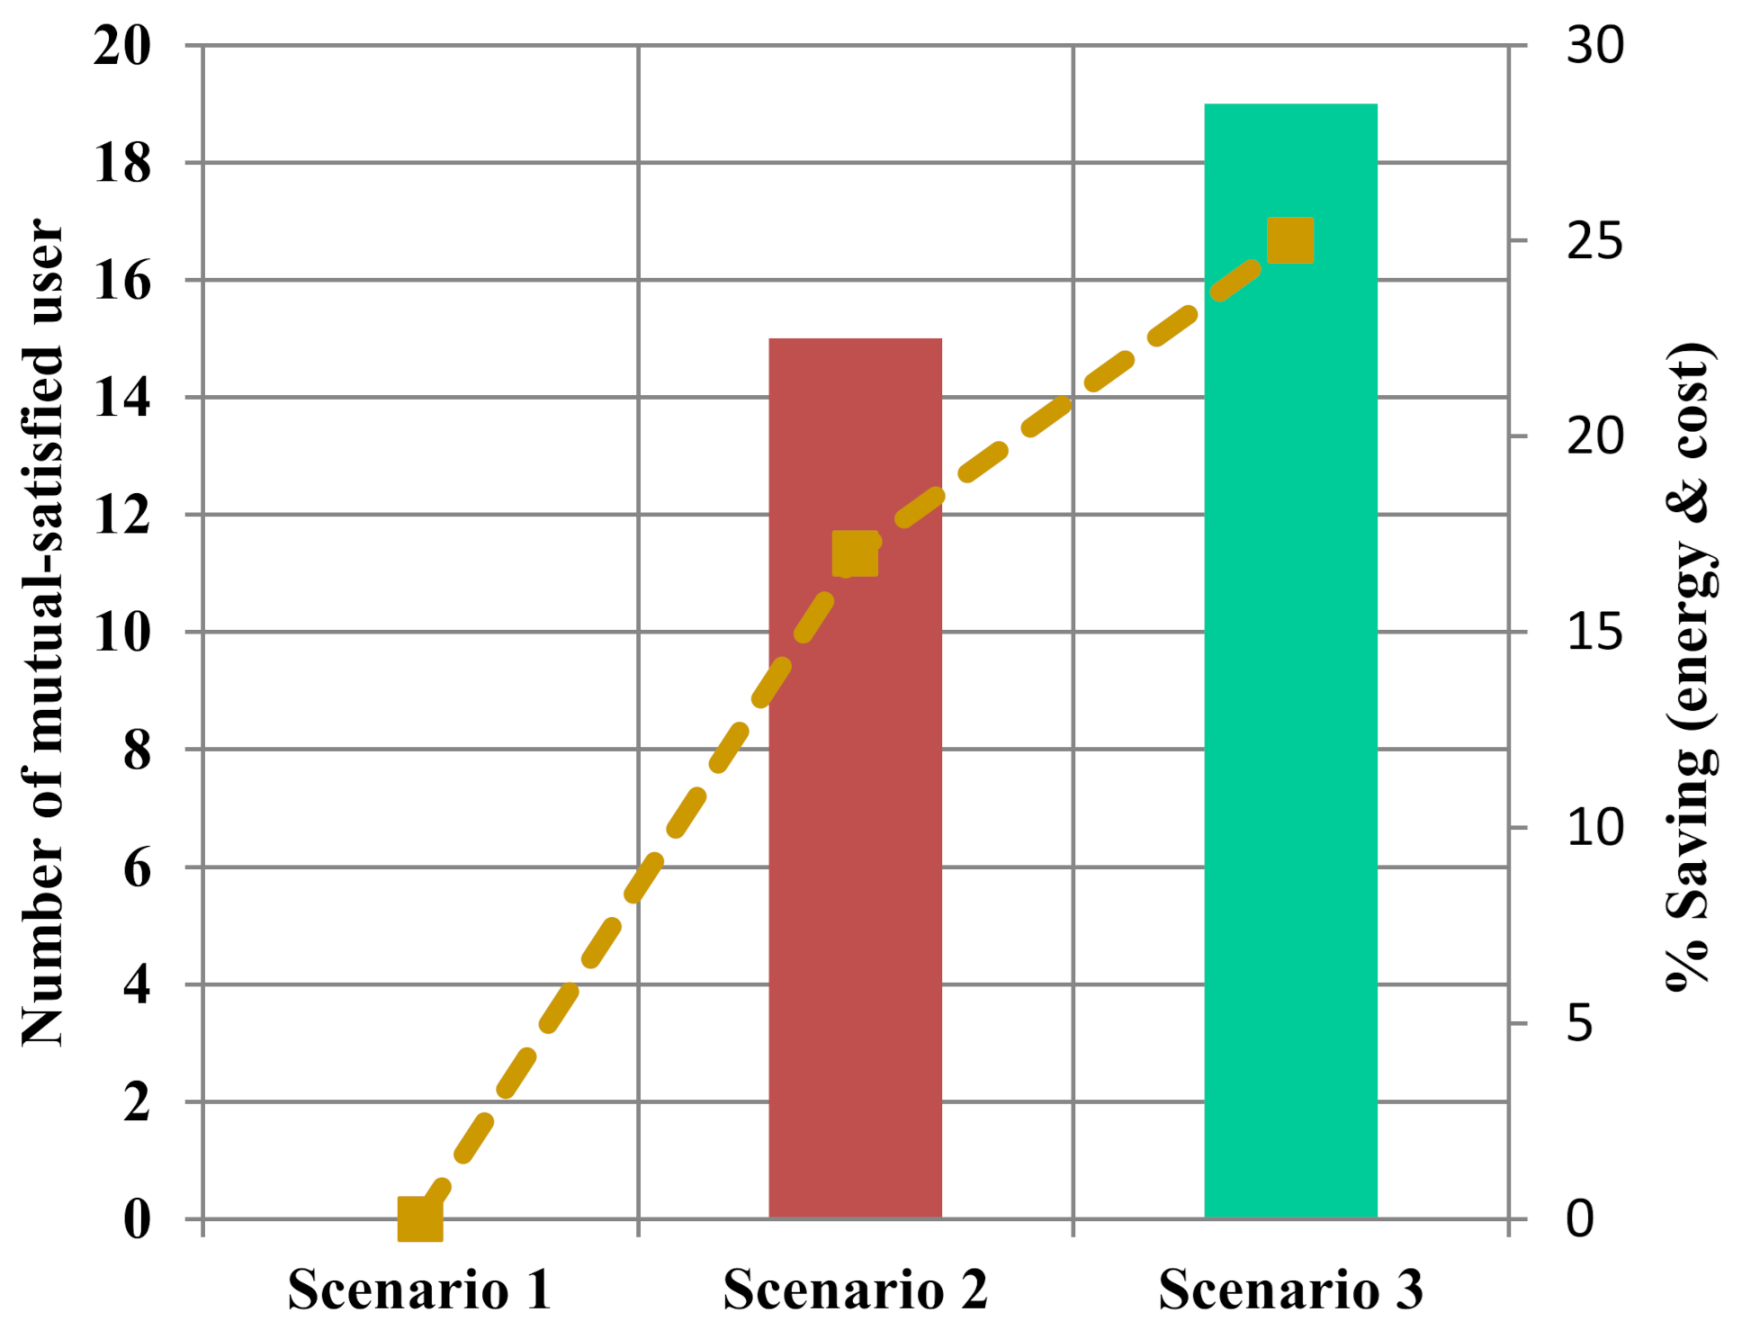
| Scenarios | Mutually Satisfied User | Percentage Saving |
|---|---|---|
| Scenario 1 | 0 | 0 |
| Scenario 2 | 15 | 22 |
| Scenario 3 | 19 | 28 |
Publisher’s Note: MDPI stays neutral with regard to jurisdictional claims in published maps and institutional affiliations. |
© 2021 by the authors. Licensee MDPI, Basel, Switzerland. This article is an open access article distributed under the terms and conditions of the Creative Commons Attribution (CC BY) license (http://creativecommons.org/licenses/by/4.0/).
Share and Cite
Rashid, M.M.U.; Alotaibi, M.A.; Chowdhury, A.H.; Rahman, M.; Alam, M.S.; Hossain, M.A.; Abido, M.A. Home Energy Management for Community Microgrids Using Optimal Power Sharing Algorithm. Energies 2021, 14, 1060. https://doi.org/10.3390/en14041060
Rashid MMU, Alotaibi MA, Chowdhury AH, Rahman M, Alam MS, Hossain MA, Abido MA. Home Energy Management for Community Microgrids Using Optimal Power Sharing Algorithm. Energies. 2021; 14(4):1060. https://doi.org/10.3390/en14041060
Chicago/Turabian StyleRashid, Md Mamun Ur, Majed A. Alotaibi, Abdul Hasib Chowdhury, Muaz Rahman, Md. Shafiul Alam, Md. Alamgir Hossain, and Mohammad A. Abido. 2021. "Home Energy Management for Community Microgrids Using Optimal Power Sharing Algorithm" Energies 14, no. 4: 1060. https://doi.org/10.3390/en14041060